Article

Effect of Performance of Water Stashes Irrigation Approaches on Selected Species of Plant’s Water Productivity in Urban Rooftop Agriculture with Respect to Climate Change

by
Musammat Shahinara Begum
1,2,*,
Sujit Kumar Bala
1 and
A. K. M. Saiful Islam
1
1
Institute of Water and Flood Management (IWFM), Bangladesh University of Engineering and Technology (BUET), Dhaka 1000, Bangladesh
2
Survey and Investigation Division, Minor Irrigation Wing, Bangladesh Agricultural Development Corporation (BADC), Dhaka 1000, Bangladesh
*
Author to whom correspondence should be addressed.
Water 2022, 14(1), 7; https://doi.org/10.3390/w14010007
Submission received: 6 November 2021 / Revised: 8 December 2021 / Accepted: 14 December 2021 / Published: 21 December 2021
(This article belongs to the Section Water, Agriculture and Aquaculture)

Abstract

:
Urbanization and population growth have led to urban areas with a substantial concrete surface compared to adjacent rural areas, creating challenges regarding fresh food, water security, and the need for agricultural land. Climate change affects the rainfall pattern and ground water in urban areas, so the gradual growth of urban rooftop agriculture (URTA) is an increasing trend for the owners of residential buildings. URTA is increasing in the form of private initiatives, but without consideration of efficient water management techniques and application of other related inputs. URTA differs substantially from traditional agriculture in terms of sunshine, thermal regime, the moisture dynamics of a concrete roof top, etc. Considering these aspects of URTA, an effective, efficient, science-based and economically viable irrigation method is necessary to popularize this approach and consequently increase the productivity of crops. With this in mind, the drip irrigation method is considered for the cultivation and determination of water productivity for selected species of plants such as the Bottle Gourd, Tomato, Chili, and Brinjal in the URTA, which was also compared to the traditional irrigation approach. This is why groundwater and green (grey and rain) water were considered as the source of irrigation during the dry season, based on the daily crop evapotranspiration and moisture content of the plant growing medium. For this reason, ET0 of the selected crops was measured using the CROPWAT 8.0 model. The results of this study revealed that the optimum irrigation water requirement of any crop in URTA is around 54% access (ETc), and 46–64% of access irrigation water is used by the traditional method compared to the drip irrigation method. The study reported that with drip irrigation with potable water, the yield was increased by 21.43–22.40% and rain and grey-water also increased yield by 31.87–33.33% compared to container and traditional pipe irrigation. It was also found that the water qualities of mixed water (grey and rainwater) are in an acceptable range limit for irrigation. As a result, urban planners, city dwellers, and researchers can formulate appropriate plans to cultivate different species of plants through this water saving irrigation method using green water, and should explore the concept of water-smart URTA technologies as organic inventions embedded in these results.

1. Introduction

Climate change in urban areas is likely to have a substantial impact on the water cycle, fluctuating rainfall forms affecting the availability and quality of both surface and groundwater, agricultural production, and related ecosystems [1,2]. Extreme weather conditions such as powerful rainstorms, high wind pressures, and high temperatures have a great deal of influence on agricultural activities [3,4]. Climate change is a threat to agriculture creating high levels of food uncertainty and limited means of coping with opposing weather, and thus climate and agriculture are strongly interrelated universal processes, and climate influences agricultural activities due to the rise in temperature (global warming) [5]. On the other hand, urban rooftop agriculture (URTA) or ‘green roof’ reduces temperature by 1.2–5.5 °C and urban excess heat by 15–75% by applying irrigation compared to bare roofs, with the aim of increasing the urban area devoted to food production, thereby contributing to urban food safety and flexibility [6,7]. URTA is accompanied by many other complementary activities such as processing and distributing food, collecting and reusing grey and rainwater, and educating, organizing, and employing local residents [8]. The vegetation layer and soil layer in URTA increases the runoff and thermal capacity of a building and absorbs 60% of solar radiation through photosynthesis [9,10]. URTA increased social obligation (85%) and reduced the cooling load requirement in the city center of Bangladesh, and increased economic performance and financial benefits [11,12].
Water is a key element in any greening action and activity and is the most vital factor for promoting URTA [13]. The scarcity of water in urban cities is rapidly increasing and is to be further increased by 55% by 2050 [14]. Dhaka has been suffering from water shortages and lack of water resources while water demand continues to grow. In Dhaka, potable water delivers only 75% of the total water demand of urban dwellers, and 87% water is collected from ground water [15]. In this context, rainwater harvesting from both residential and commercial buildings and greywater from existing buildings could be a very good alternative irrigation water source for URTA during dry seasons to reduce the pressure on groundwater [16,17]. Effective, sustainable, efficient water use and management of crop water requirements in URTA are today’s major concern in the proper management of water resources through the reduction of usage volume by applying modern techniques [18]. Irrigation is an important component of URTA when greater production of food and fiber is required despite severe constraints on water resources [19,20]. Thereby, efficient application of irrigation water is the crucial issue for the development of agricultural activities in URTA where water is a limiting factor for crop production [21,22]. A significant aspect of irrigation water under urban agriculture and rooftop agriculture is the safeguarding of food production and security [23]. Green water and blue water increase crop productivity [24]. Proper management of irrigation water improves food production, reduces poverty and increases global food security [25]. Crop yield using less water increases productivity and reduces the load on ground water [21]. Crop water productivity improves production systems and saves 20% and 35% of water at local and international scales [26,27].
With increasing water demand from other sectors, agricultural water use in cities will face stiff competition, due to scarce water resources, in the future [28]. Urban city dwellers face this issue by using URTA. In URTA, more than 90% of rooftop gardeners applied traditional irrigation using local traditional tools such as mugs, hose pipes, etc. from their own groundwater source [29,30,31,32]. In the dry season water functions as a key element for URTA. That is why a suitable scarcity irrigation approach is a crucial mission for URTA which improves yield and crop quality, saving irrigation water and ultimately improving water use efficiency [33,34,35]. The drip irrigation (DI) approach optimizes water use for crop production and increases water use efficiency by 60–200%, saves water by 20–60%, reduces fertilization requirements by 20–33%, and increases yield by 7–25% compared with conventional irrigation [36,37,38,39,40,41].
However, there is a research gap regarding crop water productivity using different irrigation approaches and soil-moisture dynamics in URTA and in the food production effect of different sources (greywater and groundwater) of irrigation. Thus, crop water productivity is a central factor in sustaining URTA, and thus an efficient and economically viable method using green water is highly significant for rooftop agricultural production. No previous study has appeared based on the crop water productivity of selected species (Tomato, Brinjal, Chili) in URTA with respect to climate change and different irrigation methods, either green or groundwater. For this reason, the purpose of this study was (1) to assess the irrigation water requirements of selected species of plants in URTA; (2) to quantify the role of drip irrigation in URTA compared to the traditional irrigation method via different sources of irrigation water, and (3) to review the soil moisture dynamics of the growing medium in URTA. For the above purposes this research is divided into four sections: Section 1: assessment of the total crop water requirement of the selected crops with the drip irrigation system based on the CROPWAT model using current weather parameters of URTA. In this section the total crop water requirement of the selected crops was also assessed by the traditional method and the crop water requirement (CWR) compared in these two methods. Section 2: assessment of the daily soil moisture and temperature dynamics before and after irrigation. In this section irrigation performance in URTA was analyzed along with water quality parameters of rain and greywater. Section 3: In this section total yield of the selected crops were assessed to find their crop water using drip irrigation technology and the traditional method in the experimental periods November 2018 to May 2019 and November 2019 to March 2020. Section 4: The importance and function of the drip irrigation system in URTA was assessed by calculating the field emission uniformity (EUf), design emission uniformity (EUd), application efficiency (EUa), and co-efficient of the variance of the emitter’s discharge and the moisture content of the growing medium. This study aims to achieve an extensive prospect assessment of the irrigation water productivity of selected crops using URTA in an urban area such as the Dhaka Metropolitan Area (DMA).

2. Materials and Methods

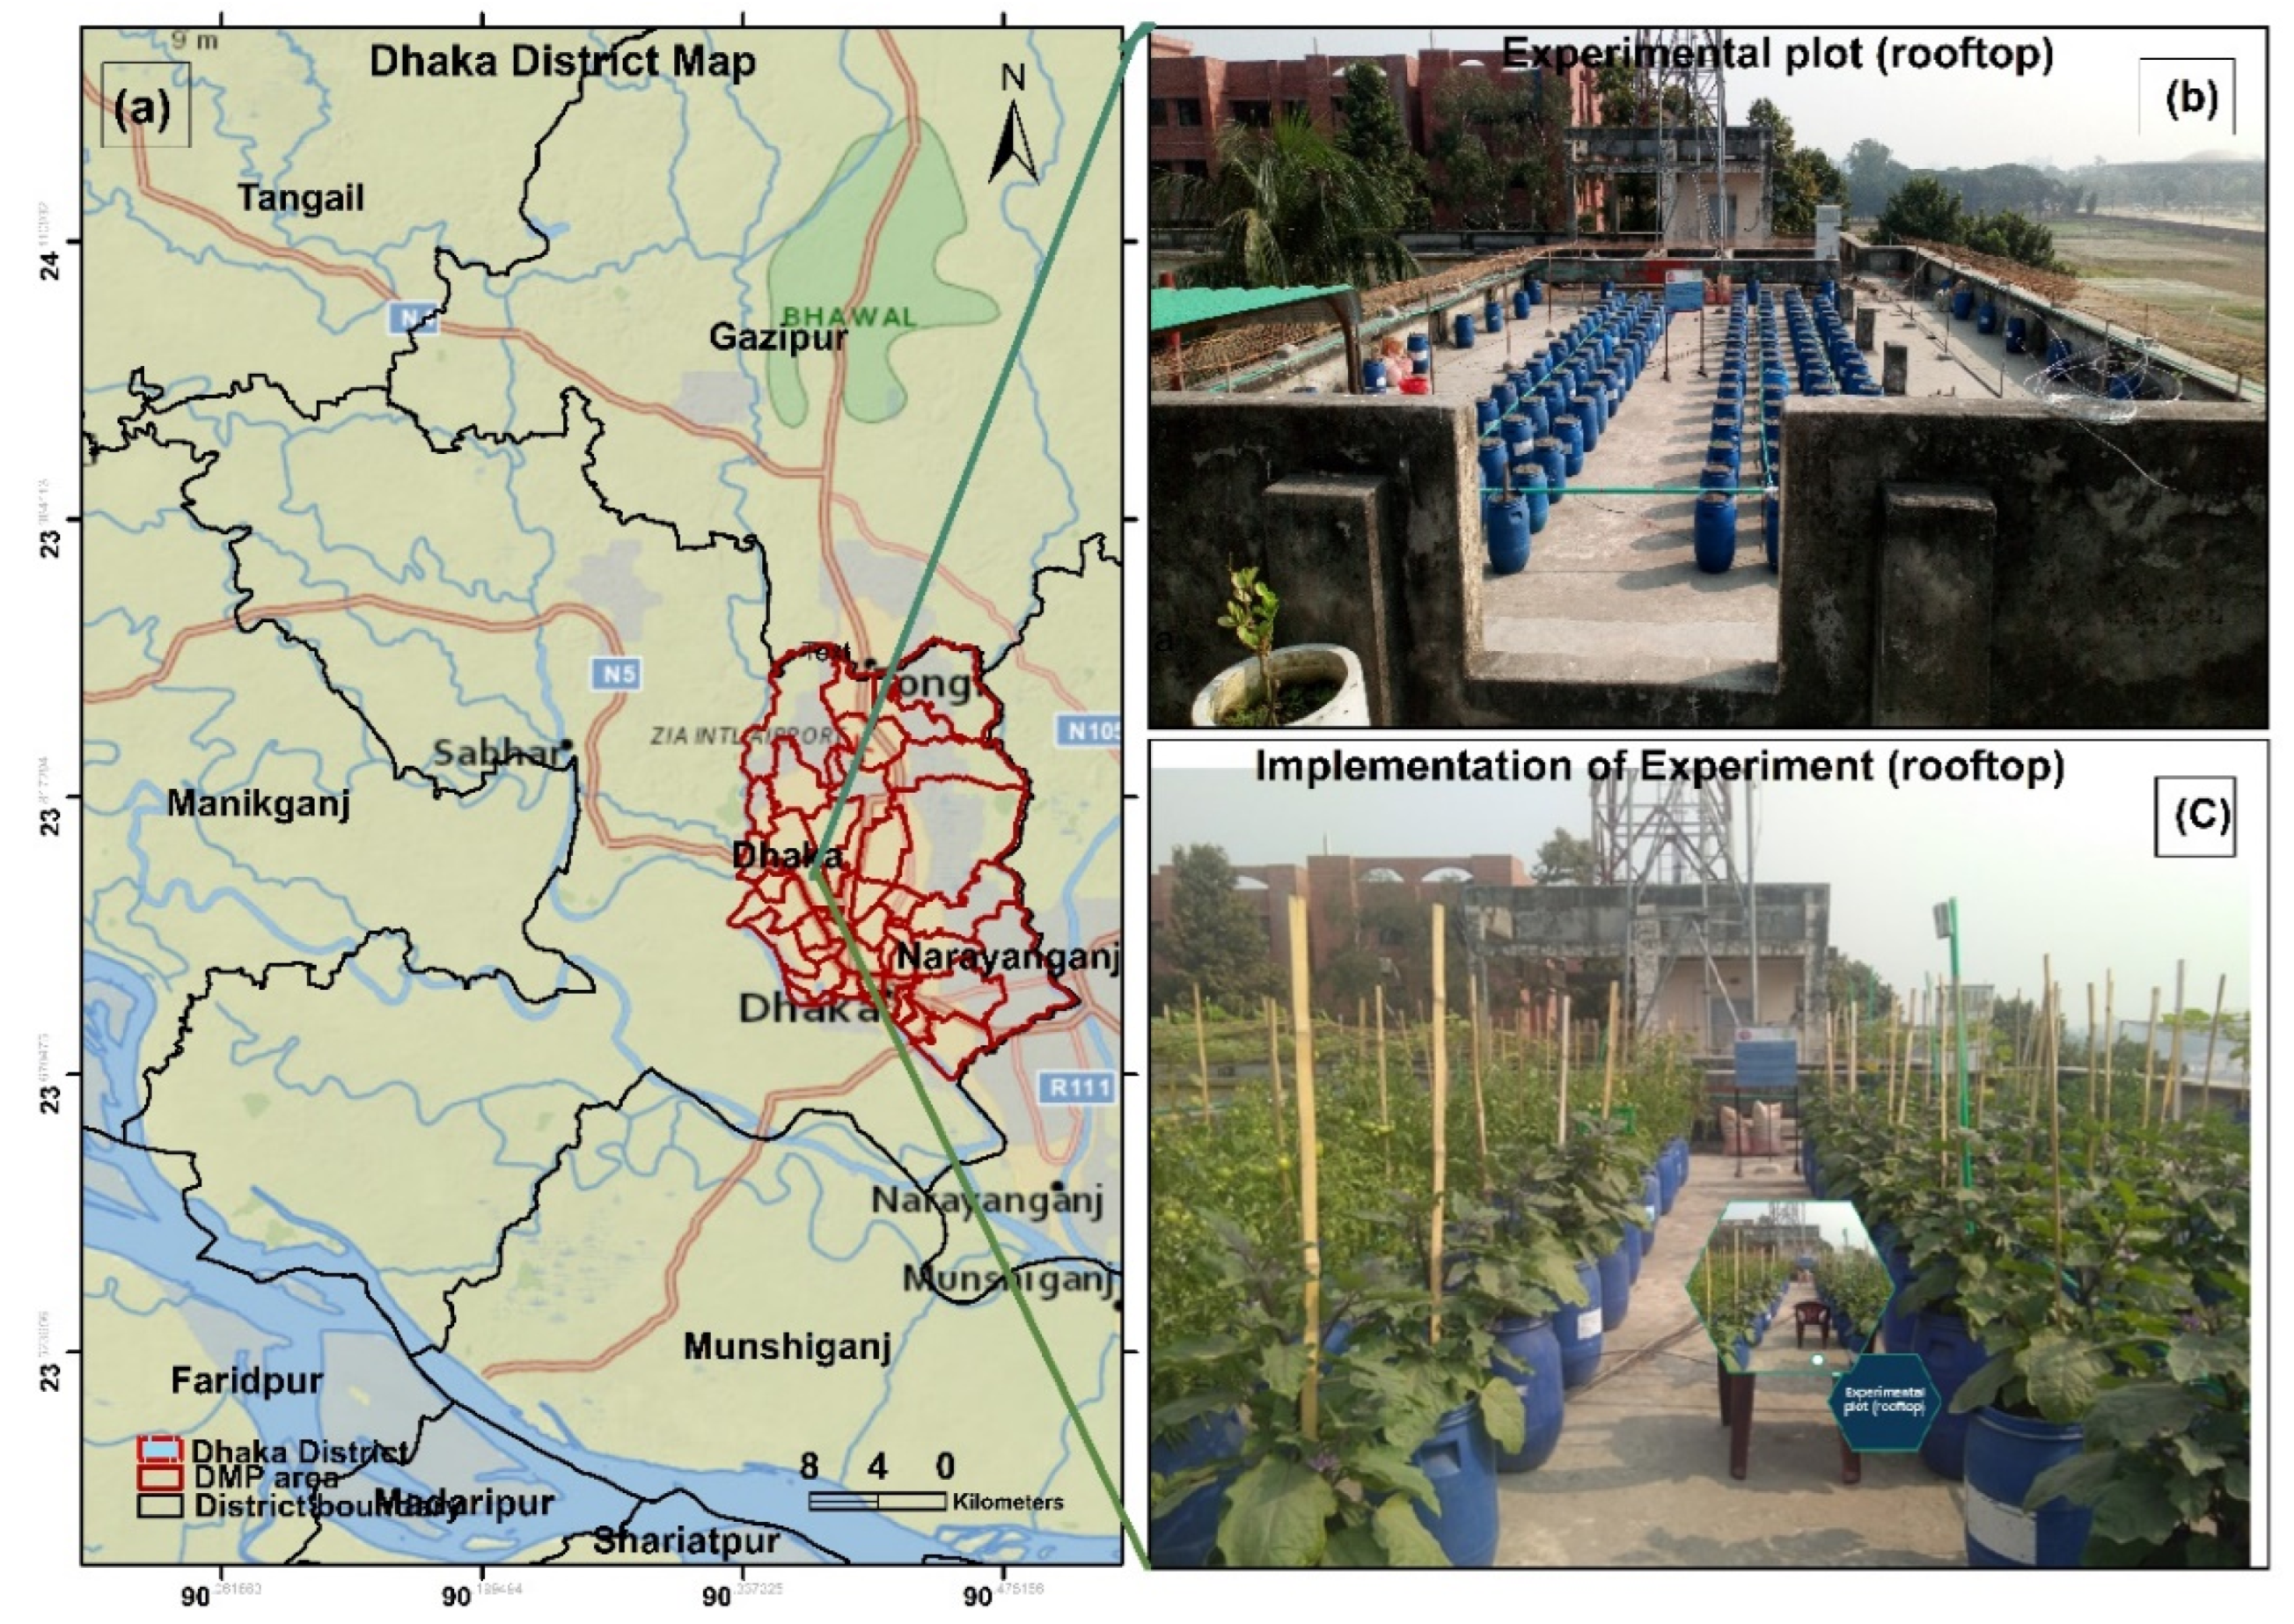
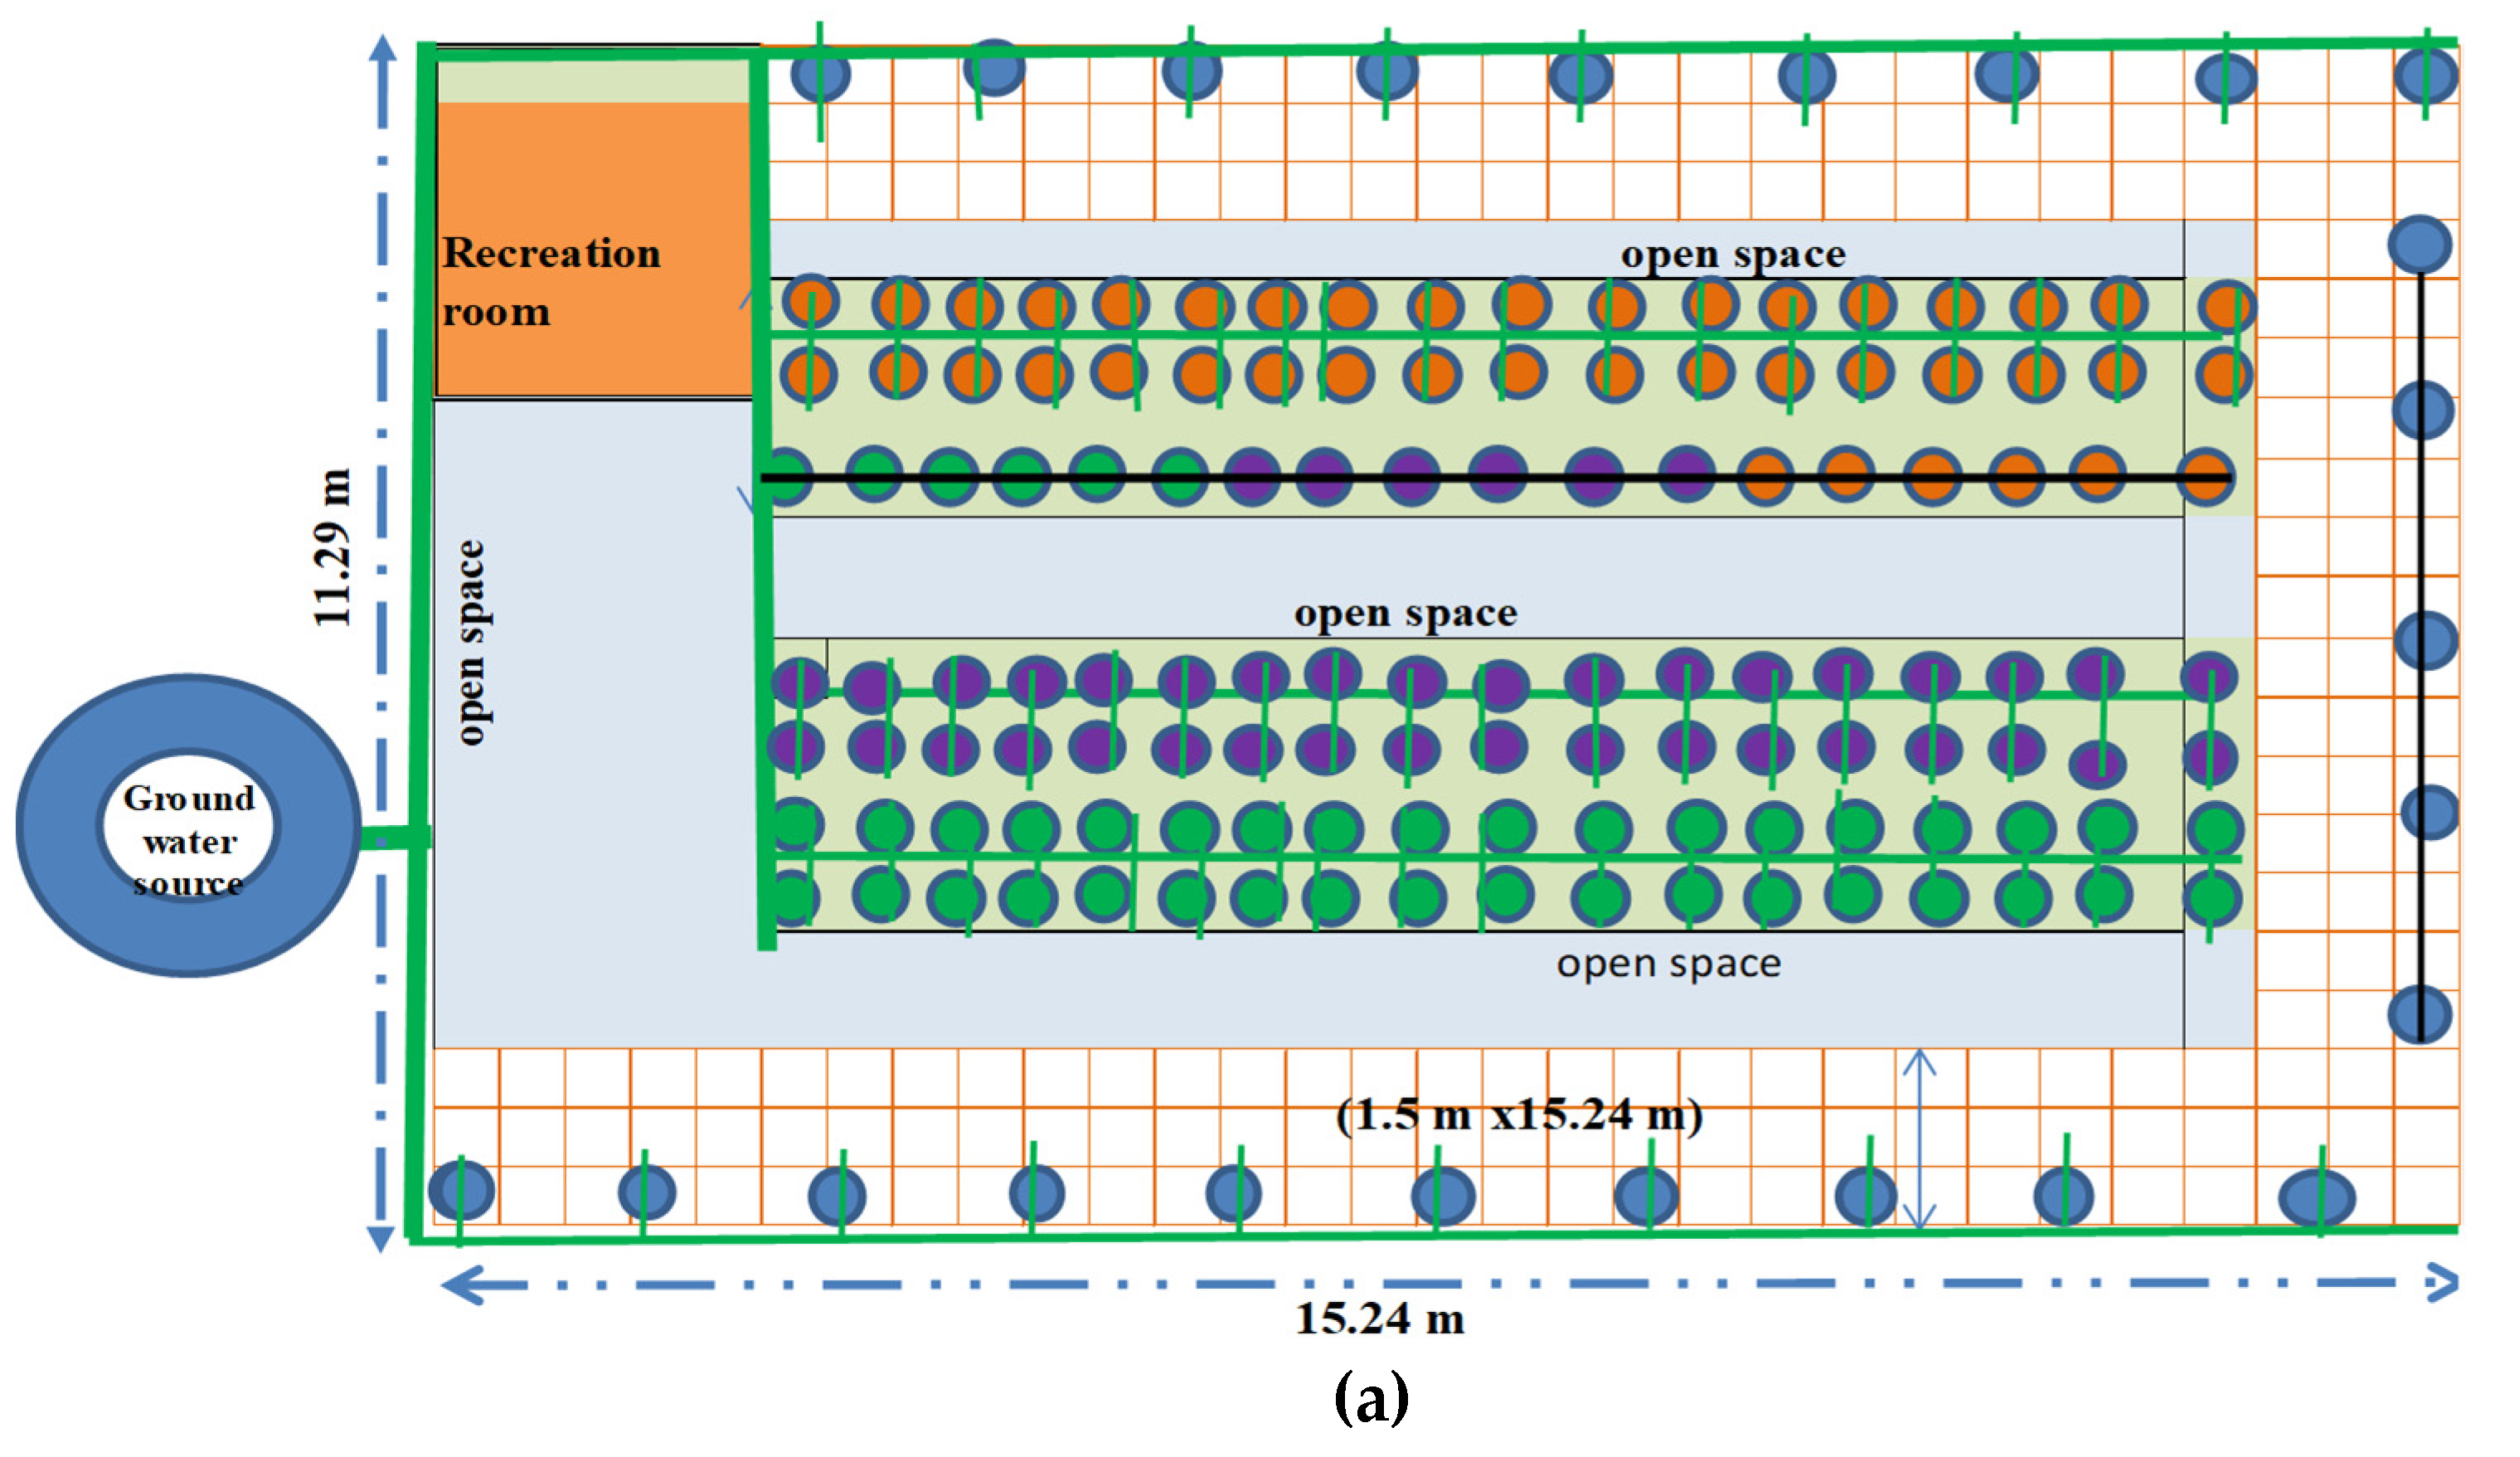
2.1. Study Area and Experimental Plot Setup

The experimental plot was established for the first-year of the experiment on the roof of an institution (Sher-e-Bangla Agricultural University, Sher-e- Bangla Nagar Dhaka, Bangladesh), and for the second-year experiment on the roof of a government residential quarter, (Bangladesh Agricultural Development Corporation (BADC) officers’ quarter) Dhaka, Bangladesh, 22, Manik Mia Avenue, Sech Bhaban, Dhaka) [Figure 1]. The experimental plot was 18 m in length and 12 m in width [42]. The study was designed to evaluate crop water productivity in URTA with different irrigation systems using green water (grey water and rainwater) and groundwater during the dry season of 2019–2020. The dry season was considered as lasting from November to May, because in this period supplementary irrigation is required for cultivation of different crops and vegetables under URTA. A completely randomized design (CRD) was used for designing the experimental plots, with selected crops such as BARI Tomato-3, BARI Tomato-4, BARI Brinjal-8, Bogra Local Chili, BARI Bottle Gourd-3, and BARI Bottle Gourd-4, etc., in blue plastic drums (shown in Figure 2). Bottle Gourd was cultivated all around the experimental plot with the support of fencing panels to help it climb and grow. The soil was specially prepared with other organic matter such as cocoa-dust and vermi-compost (2:1:1), and the spacing between plants center to center was maintained as per the Bangladesh Agricultural Research Institute (BARI) recommendation guidelines [42]. The BARI Tomato-3, BARI Brinjal-8, Bogra Red Chili and BARI Bottle Gourd-3 varieties were transplanted on 12 November 2018 (first season), the BARI Tomato-4 and BARI Bottle Gourd-4 varieties were transplanted on 3 March 2019 (second season) and the BARI Tomato-3 and BARI Brinjal-8 were transplanted on 12 November 2019 (third season). All plants were transplanted 20 days after seeding.
A demonstrative drip irrigation (DI) system was used to deliver the irrigation water to the plants from the portable water storage source with a manual operating valve system and from the green water storage source with a 1 hp Single Phase, Self-Priming Monoblock pumping system (Figure 2). Five lateral pipes (12.7 mm diameter) were designed from the sub-main pipe (25.4 mm diameter) of the groundwater source (Figure 1a,b) and two lateral pipes were utilized with a sub-main pipe connected to the rain and grey water storage source (1500 L), lifting this with a 1Hp motor from the main grey water storage on the roof. Emitter pipes (6 mm diameter) were connected with a 4 mm diameter connecting pipe to the lateral pipe with a T-joint and the tiny plastic nubs or emitters were set at the end of the emitter pipe to allow water to drip out at a regulated pace without clogging, into the soil at the plants’ roots. The traditional irrigation approach was also applied for cultivation of these crops to compare the water productivity with the drip irrigation system. In the case of potable water source for irrigation, a total 8 rows of drip irrigation containing 128 container, and 2 rows (24 containers) using the traditional irrigation method (mug and pipe) were used with 3 replications in 152 plastic drums. Two rows for Tomato, two rows for Brinjal, two rows for Chilies, and two rows for Bottle gourd were used for cultivation, where each row contained 18 containers except for Bottle Gourd with 10 containers. At the middle of the experimental plot, 1.5 m was used as free space for easy movement and for carrying the plants. Thus, the vegetative area of each plant could cover the roof area to reduce the roof surface temperature. On the other hand, in the green water source (rainwater and greywater) experiment, a similar common setup was designed, and Tomatoes, and Brinjals were cultivated and irrigation were maintained based on the first experimental result, considered only for yield comparison of these crops. In this experiment, the water quality of harvested green water was tested in the BADC chemical laboratory, 22, Manik Mia Avenue, Sech Bhaban, Dhaka, every month from November 2019 to March 2020.

2.2. Green Water Harvesting

In this study, a rainwater collection system or rainwater catchment system was achieved by a 4-inch UPVc pipe with 1.78 m3 concrete structure, pumps, tanks, and filtration systems (Figure 2b). The simplest rainwater harvesting systems were used in these studies, which are non-pressurized wet systems. In this system, the storage structure or tanks are located underground and under the building. On the other hand, sinks, hand basins, washing machines, showers, and recyclable bath water were used as greywater which provides a constant source of irrigation in residential buildings. Greywater was collected from these selected sources via a separate dedicated 4-inch UPVC pipe. The outlet of the collecting pipe was connected to the underground concrete structure storage tank which is also used as a storage container for rainwater [Figure 2b]. The water passes into the tank into the pre-filtering double-layer plastic net in such a way that any hitches were left in the net. The pre-filter removes any mop and large particulates from the greywater preventing it from entering the tank chamber. The overflow ball valve was also set into the storage structure, and automatically topped up the system, providing full continuity of water supply, and water and particulates passed to the drainage line via the overflow pipe’s outlet. The tank contains a pump that is used to pump water to the roof header tank. Prior to entering the header tank, the water passes through an activated carbon filter, which removes discolorations, particulates, and excess bromine. Subsequently, the source of water for drip irrigation is pumped from the underground green water storage tanks to roof tanks to serve the irrigation system, using a 1 hp pump. Lateral pipes ware connected to the riser tank and a sub lateral pipe was also used with the main pipe which contained an emitter to deliver water to the plants (Figure 2b).

2.3. Analysis of Irrigation Water Quality of Harvesting Green Water

The irrigation water quality of harvesting green water (grey and rainwater) was tested in the laboratory of the Bangladesh Agricultural Development Corporation (BADC) during the whole period of the second-year winter experiment (November 2019 to March 2020) every 15 days alternately. A total of 13 parameters (pH, Electric Conductivity (µs/cm), Total Dissolved Solids (mg/L), Arsenic (ppb), Iron (mg/L), Chloride (mg/L), Sodium (meq/L), Total Alkalinity (mg/L), Total Hardness (mg/L), Nitrate-Nitrogen (mg/L), Phosphate (mg/L) and Sulfate, (mg/L)) were measured in the laboratory (Table 1).

2.4. Soil Preparation and Measurement of Soil Moisture and Temperature in the Experimental Plot

In this research the soil was prepared with organic matter such as cocoa dust and vermicompost at a proportion of soil: cocoa dust: vermicompost of 2:1:1. Furadan, dye-ammonium phosphate (DAP), calcium carbonate, and powder from eggshell membrane were also added during the soil preparation. Conversely, physical and chemical properties of soil such as soil texture, bulk density (weight basis), field capacity (weight basis), pH, micro and macronutrients were also tested in the Soil Research and Development Institute (SRDI), Dhaka, before preparation of soil (Table 2). On the other hand, the moisture and temperature measurement data logger (HUATO-SS00) were used to measure the soil moisture [Table 3] before and after irrigation and this was carried out for 2 days/week within the experimental period (December 2019 to May 2019). Similarly temperature- measuring data loggers (HUATO, S653) were used to measure the air temperature at a 1.5 m height from roof surface and a digital compact infrared thermometer was also used for the measurement of roof surface temperature with a 4-h interval (9.30 a.m., 1.30 p.m., and 5.30 p.m.) on the experimental agricultural roof and a nearby bare roof from December 2018 to May 2019. Soil moisture and temperature were measured in the container at a depth range of 45 cm 30 cm and 15 cm, respectively, from the surface of the soil container so that the right amount of irrigation was applied to maintain the soil’s available moisture [43]. The average root depths of the selected crops were measured after the ripening stage to select the third season’s container size.

2.5. Irrigation Forecast

The irrigation water requirements were calculated from actual daily climatic data taken from the experimental plot using a temperature-humidity measurement data logger (HUATO, S653, Huato, Shenzhen, China). The crop water requirement of the selected crops was determined by using the CROPWAT 8 model and the soil available moisture content. One day earlier, micro-climatic parameters were used to determine the daily crop water requirement. Daily temperature, humidity, and sunshine hours were considered as primary data and wind speed was considered as a 10 years average value taken from the Bangladesh Meteorological Department (BMD). Evapotranspiration (ETo) using the CROPWAT 8.0 model was calculated (ETc) for the selected crops by the following formula [44,45]:
ET c = ET 0 × K c  
where Kc = crop coefficient of selected crops. K ct ,   K cb ,   K cb ,   and   K cc are the crop efficient values of Tomato, Bottle gourd, Brinjal, and Chili, respectively (Table 4) proposed by the Bangladesh Agricultural Research Institute (BARI). ET 0 = reference evapotranspiration (mm day−1), The reference evapotranspiration ( ET 0 ) was calculated using the following Penman-Monteith equation through the CROPWAT 8.0 model (Table 4) [46].
ET o = 0.408 Δ ( R n G ) + γ 900 T + 273 U 2 ( e s e a ) Δ + γ ( 1 + 0.34 U 2 )
where R n , G, T, U2, e s ,   and   e a represent the net radiation of the surface (MJ m−2 day−1), the soil heat flux density (MJ m−2 day−1), air temperature at 2 m height (°C), the wind speed at 2 m height (m s−1), the saturation vapor pressure (kPa) and the actual vapor pressure (kPa), respectively; D, and γ represent the slope vapor pressure curve (kPa °C−1), and psychrometric constant (kPa °C−1), respectively. The daily volume of applied water was estimated from the crop water requirement which was measured by total daily rainfall subtracted from daily crop evapotranspiration (ETc) before the day of irrigation (Table 5). When rainfall exceeded the ETc value, irrigation was postponed and the surpassing amount of water was considered in the calculation of the succeeding irrigation volumes (Table 6).
However, excess irrigation was also estimated by the moisture content variation of soil in the container. According to available soil moisture content, 70% moisture absorbs at 50% rootzone depth and the remaining 30% absorbs at the remaining 50% rootzone depth. However, in URTA total depth of container is the total rootzone depth and root is counted along with the soil in the container. This is why irrigation was not enough when regarding crop water requirement (ETc calculated by CROPWAT model). The change in the moisture at root zone was determined from the measurement of soil moisture in the container with a soil moisture measurement data logger. Total seasonal irrigation water use was determined by adding excess water to remaining available soil moisture in the soil up to 50% rootzone depth at each stage. That is why irrigation was carried out at the initial and vegetative stage every 10 days after and at the stage of flowering and ripening, irrigation was carried out every alternate 5 days and total depth of irrigation was maintained by the following formula:
d = R A × D × ( M fc M b 100 )  
where d, R,   M fc indicate the net amount of applied irrigation (mm), rainfall (mm), and the field capacity of the soil, respectively. M b is the moisture content of soil before adding water, D is the depth of the soil in the container (mm) and A is the bulk density of the soil (g/cm3) in the container. The rainfall was also collected in the rain gauge and was measured in mm. The total supplied irrigation of the selected crops calculated for the traditional irrigation method is shown in Table 6.
Finally, after the cropping season the rootzone depth of each type of crop was measured to find the maximum rootzone depth and total length of the selected crops in the container. The CROPWAT 8.0 model was again run with changes to the temperature and sunshine hour values until the crop water requirement was found to be near to the total applied irrigation water requirement of the selected crops in URTA, so that irrigation could be applied according to the model and no additional irrigation would be required.

2.6. Performance Measurement of Irrigation in URTA

Irrigation performance depends on various segments of the total irrigation water applied, how much water gets to the crop and how it is distributed among the plants by each emitter over the entire experimental roof. However, the irrigation performance was measured based on the applied water in the respective container or plant per unit time. Conversely, in this research a uniformly distributed irrigation strategy was carried out on a CRD with 2 replications for both drip and traditional irrigation approach as follows.

2.6.1. Distribution Efficiency

The distribution efficiency for URTA represents how uniformly irrigation water can be distributed through a drip irrigation system into the field or container as well AS how uniformly moisture content was found to be in the soil. Distribution efficiency was measured through the average soil moisture content of each emitter. This was done by measurement of discharge of each emitter which by daily crop water requirement. In this study, the following statistical approach was used for obtaining irrigation uniformity [47]:
E d = 1 Δ M a M m × 100
where Ed = distribution efficiency (%) or uniformity coefficient, M m = mean moisture content (%) and Δ M a = average absolute soil moisture deviance of each emitter in the container from the mean moisture content.

2.6.2. Application Efficiency

The application efficiency was measured through the required available moisture content of soil and average soil moisture content of emitter after applied irrigation and expressed as [48],
E a = M rsm M asm × 100
where E a = application efficiency, %, M rms = minimum required soil moisture content of crops (%), and M asm = average soil moisture after irrigation (%).

2.6.3. Field Emission Uniformity (EUf)

The EU f is the ratio of the average emitter discharge from the lowest 1/4th of the emitter to the average discharge of all the emitters in the drip system. The EUf was calculated through measuring the percentage of the average emitter discharge from the lowest 1/4th of the emitter and the average discharge of all the emitters. EUf is expressed by the following equation [49].
EU f = q n q a × 100
where EU f = the field test emission uniformity, percent, q n = average of the lowest 1/4th of the field data emitter discharge, l/h q a = average or design emitter discharge rate l/h, and q a = average or design emitter. The field evaluation of uniformity is useful for improving the operation and management of the existing system. The discharge of the emitter was measured by selecting the first point, 1/3rd, 2/3rd point and last emitter on the corresponding laterals in the experimental plot setup (URTA).

2.6.4. Absolute Emission Uniformity

The absolute emission uniformity was calculated by the following equation [50]:
EU a = 100 * [ Q min Q avg + Q avg Q x ] × 1 2
where EU a , Q x , Q min , Q avg represent the absolute emission uniformity, average of the highest 1/8th of emitter discharge (l/h), minimum emitter discharge rate (l/h), and average or design emitter discharge rate (l/h), respectively. Data was collected from the six lateral lines and four emitters on each lateral were selected and then emitters’ discharge and soil moisture of each plant were measured along with the emitter flow rate at two adjacent emitters at each collection container, by collecting the discharge for one minute in a move up cylindrical container; then the average emitter discharge for each of the sixteenth locations were calculated.

2.6.5. Co-Efficient of Variance (CV)

The coefficient of variation represents the ratio of the standard deviation of emitter discharge to the mean discharge of the emitter, and is a useful statistic for comparing the degree of variation from one data series to another. The coefficient of variation was calculated by the following equation [51]:
CV = 100 * [ SD Q avg ]
where CV, SD and Q avg represent the coefficient of variation of emitter discharges, standard deviation of selected emitter discharges and average discharge in the same emitters (L/h), respectively.

2.6.6. Irrigation Water Productivity

Water is an increasingly scarce resource in many urban areas and so it is important to assess the productivity of urban rooftop irrigation in terms of this scarce resource. That is why such an assessment is made from a variety of viewpoints regarding the sustainable and efficient use of water. Improving water productivity through water-efficient technologies is an important step towards putting water to more economically and environmentally beneficial uses. Water productivity in terms of actual evapotranspiration (ETc) and the volume of water applied is most common during the cropping period. In this study the water productivity of the selected crops was determined by the following formula [52,53]:
Crop   Water   productivity [ Kg mm ] = Yield   of   harvested   crop ( kg ) ETc ( mm )
Irrigation   Water   productivity   [ Kg m 3 ] Yield   of   harvested   crop ( kg ) Total   volume   of   water   applied ( m 3 )
The total harvested yield of the selected crops was converted to the unit yield (kg/plants) and total supplied water was also measured to analyze the irrigation water productivity (Table 7). Actually, the values of ETc and the volume of irrigation water are heavily influenced by the microclimate of the experimental field. The crop water productivity and irrigation water productivity in URTA considered all losses. The greatest potential for water savings is also tied to the specific crops requiring the most irrigation within URTA. The yield scenario of the selected crops using the experimental rooftop agriculture is shown in Figure 3.

3. Results and Discussion

3.1. Soil Physical Characteristics in URTA

According to the laboratory test and USDA soil textural classification, it was found that soil was silt loam and highly acidic (pH range is 5.5). The average sand, silt, and clay contents of the soil were found to be sand 9%, silt 78%, and clay 13%. It was also found that only 0.07% organic matter was obtainable in the soil, which amount was very low. From the laboratory results, it was observed that the primary nutrients’ (such as N, P, and K) available values were 1.40%, 78.93 µg/g (ppm), and 1.32 meq/100 g, respectively. The test result characterizes a lower amount of nitrogen presented in the soil, phosphorous values as very high and potassium values as also very high. The secondary nutrients such as Calcium (Ca), Magnesium (Mg), Sulphur (S), Boron (B), Copper (C), Iron (I), Manganese (Mn), Zink, etc., values were adequate in the soil and all of this range was very high (BARI, Fertilizer recommendation guide). The values of secondary nutrients were found to be 7.32 meq/100 g, 7.00 meq/100 g, 143.89 µg/g (ppm), 0.77 µg/g (ppm), 2.28 µg/g (ppm), 45.16 µg/g (ppm), 13.29 µg/g (ppm) and 4.47 µg/g (ppm), respectively. From the above result, the study found that the soil’s physical properties depend on soil preparation as well as soil texture for rooftop agriculture and on the micro-climatic conditions of the roof [54]. Initial soil properties that were collected from the field for cultivation had a very low organic matter (0.07%) and the field capacity and permanent wilting point of the soil were only 25.2% and 19%, respectively. After mixing cocoa dust, compost, and dye ammonium phosphate and calcium carbonate (soil: cocoa dust: vermicompost = 2:1:1) the field capacity and permanent wilting point were found to be 33.58% and 19.80% on a volume basis, and were suitable for agriculture. Furthermore, it was also found that the prepared soil’s bulk density was 1.04 gm/cm3.

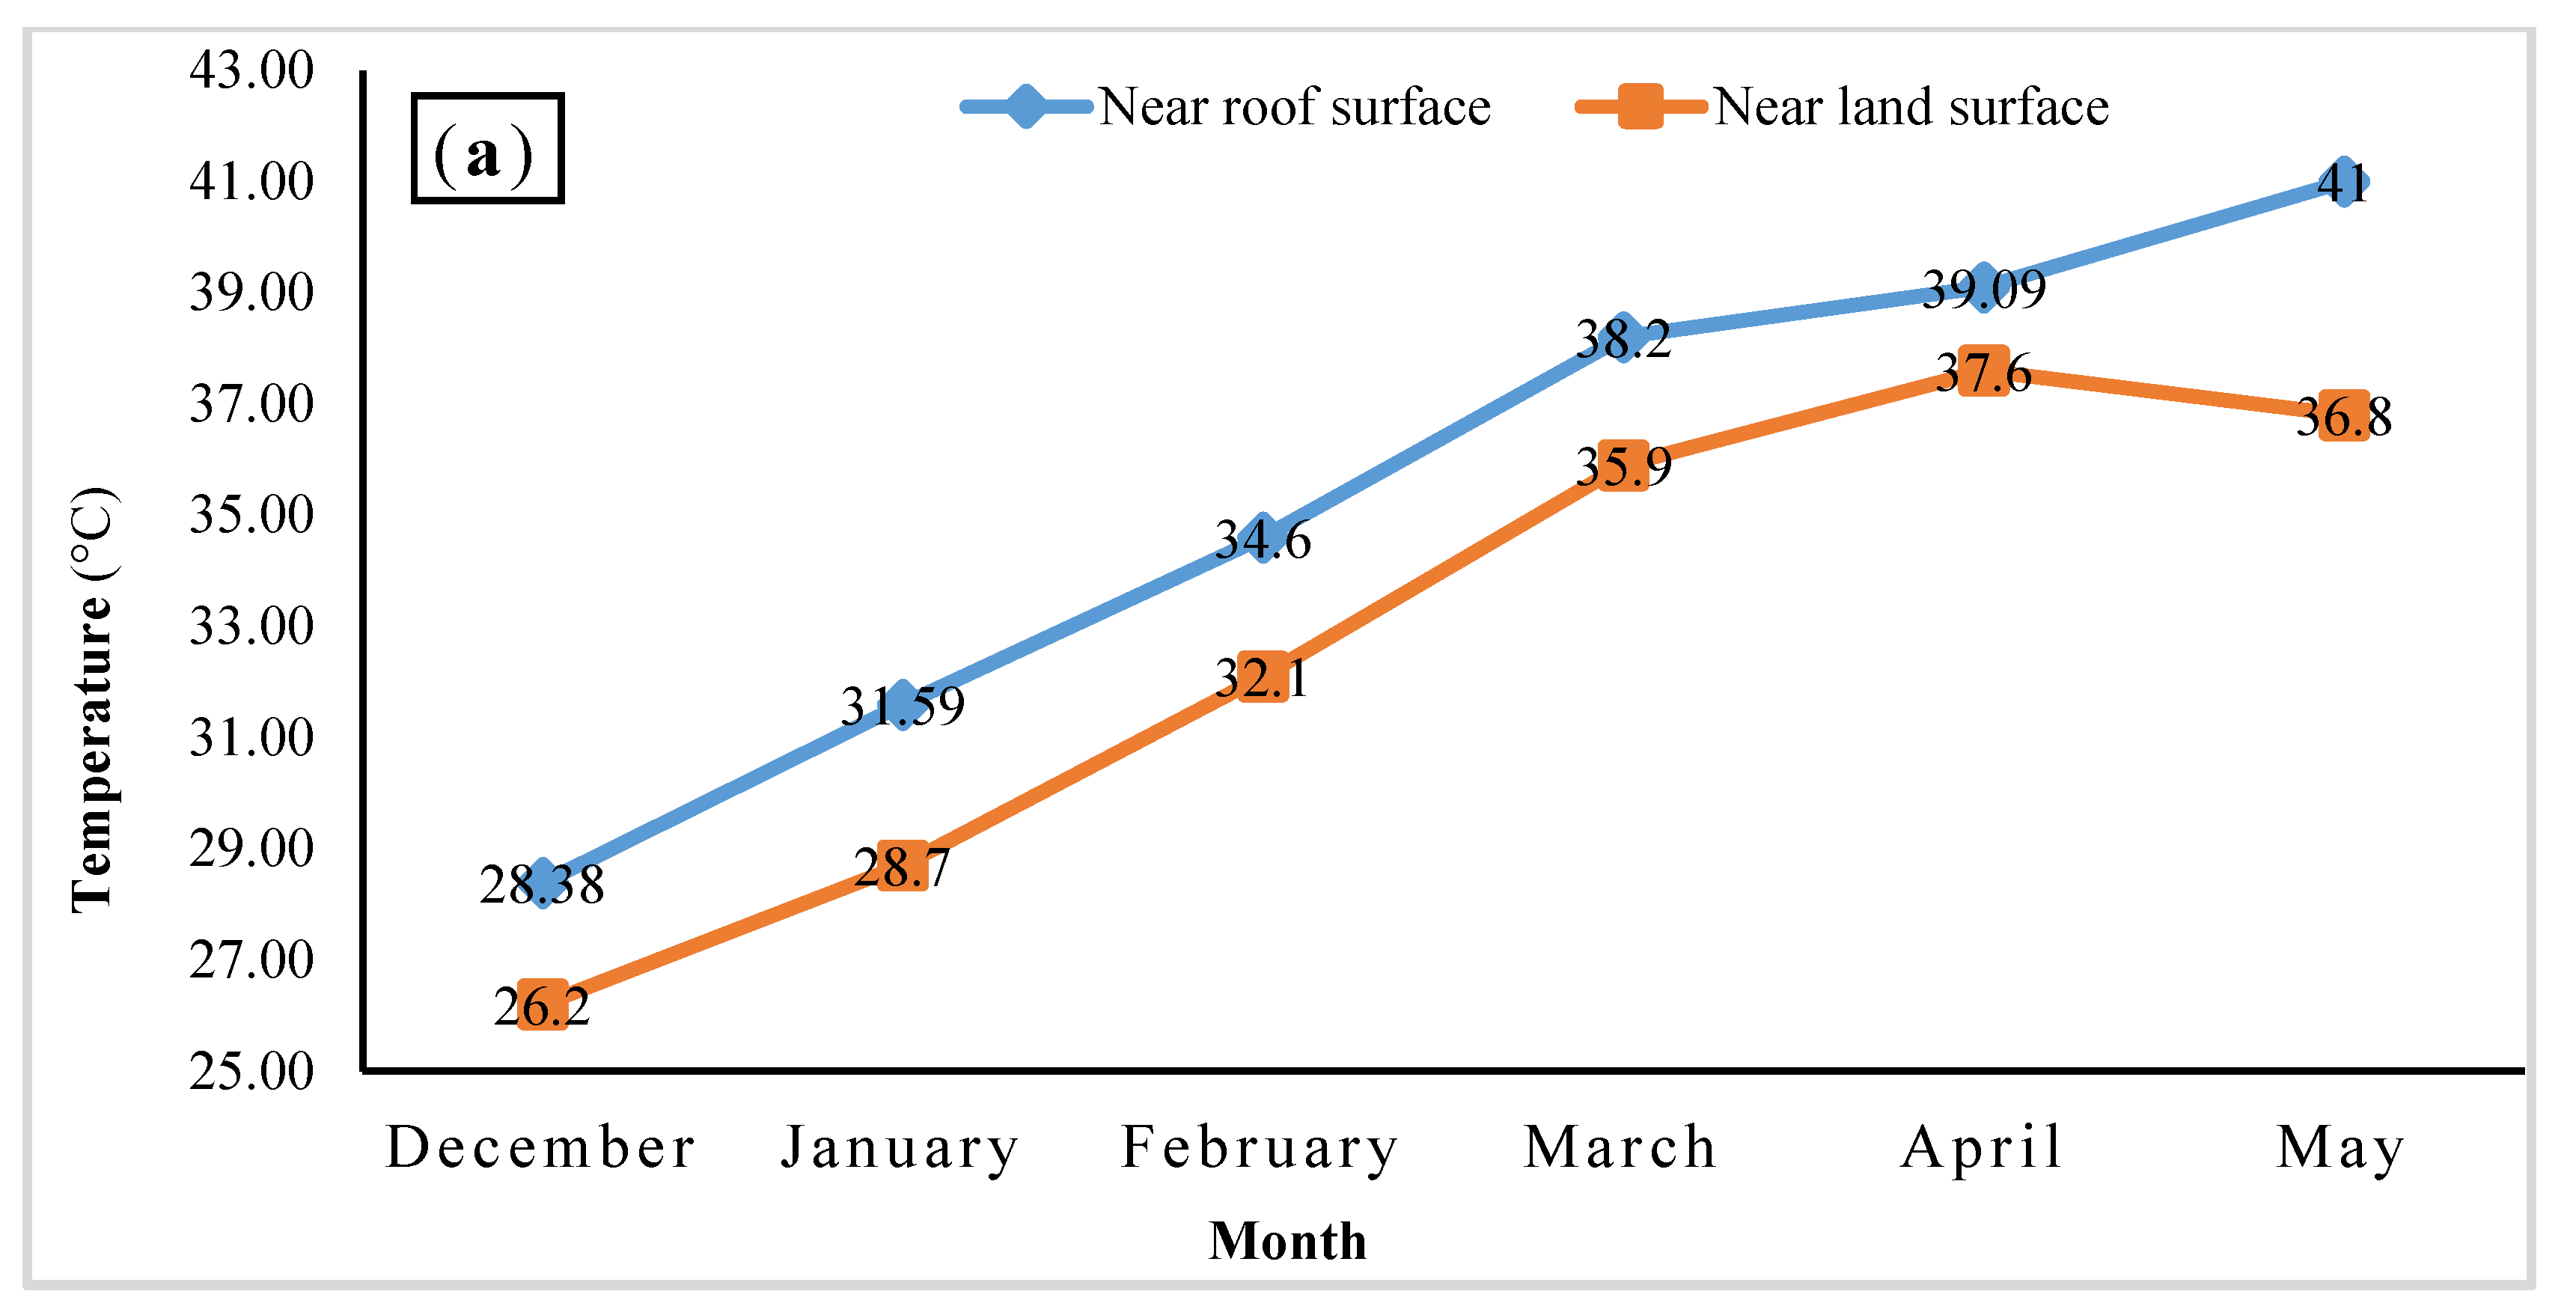
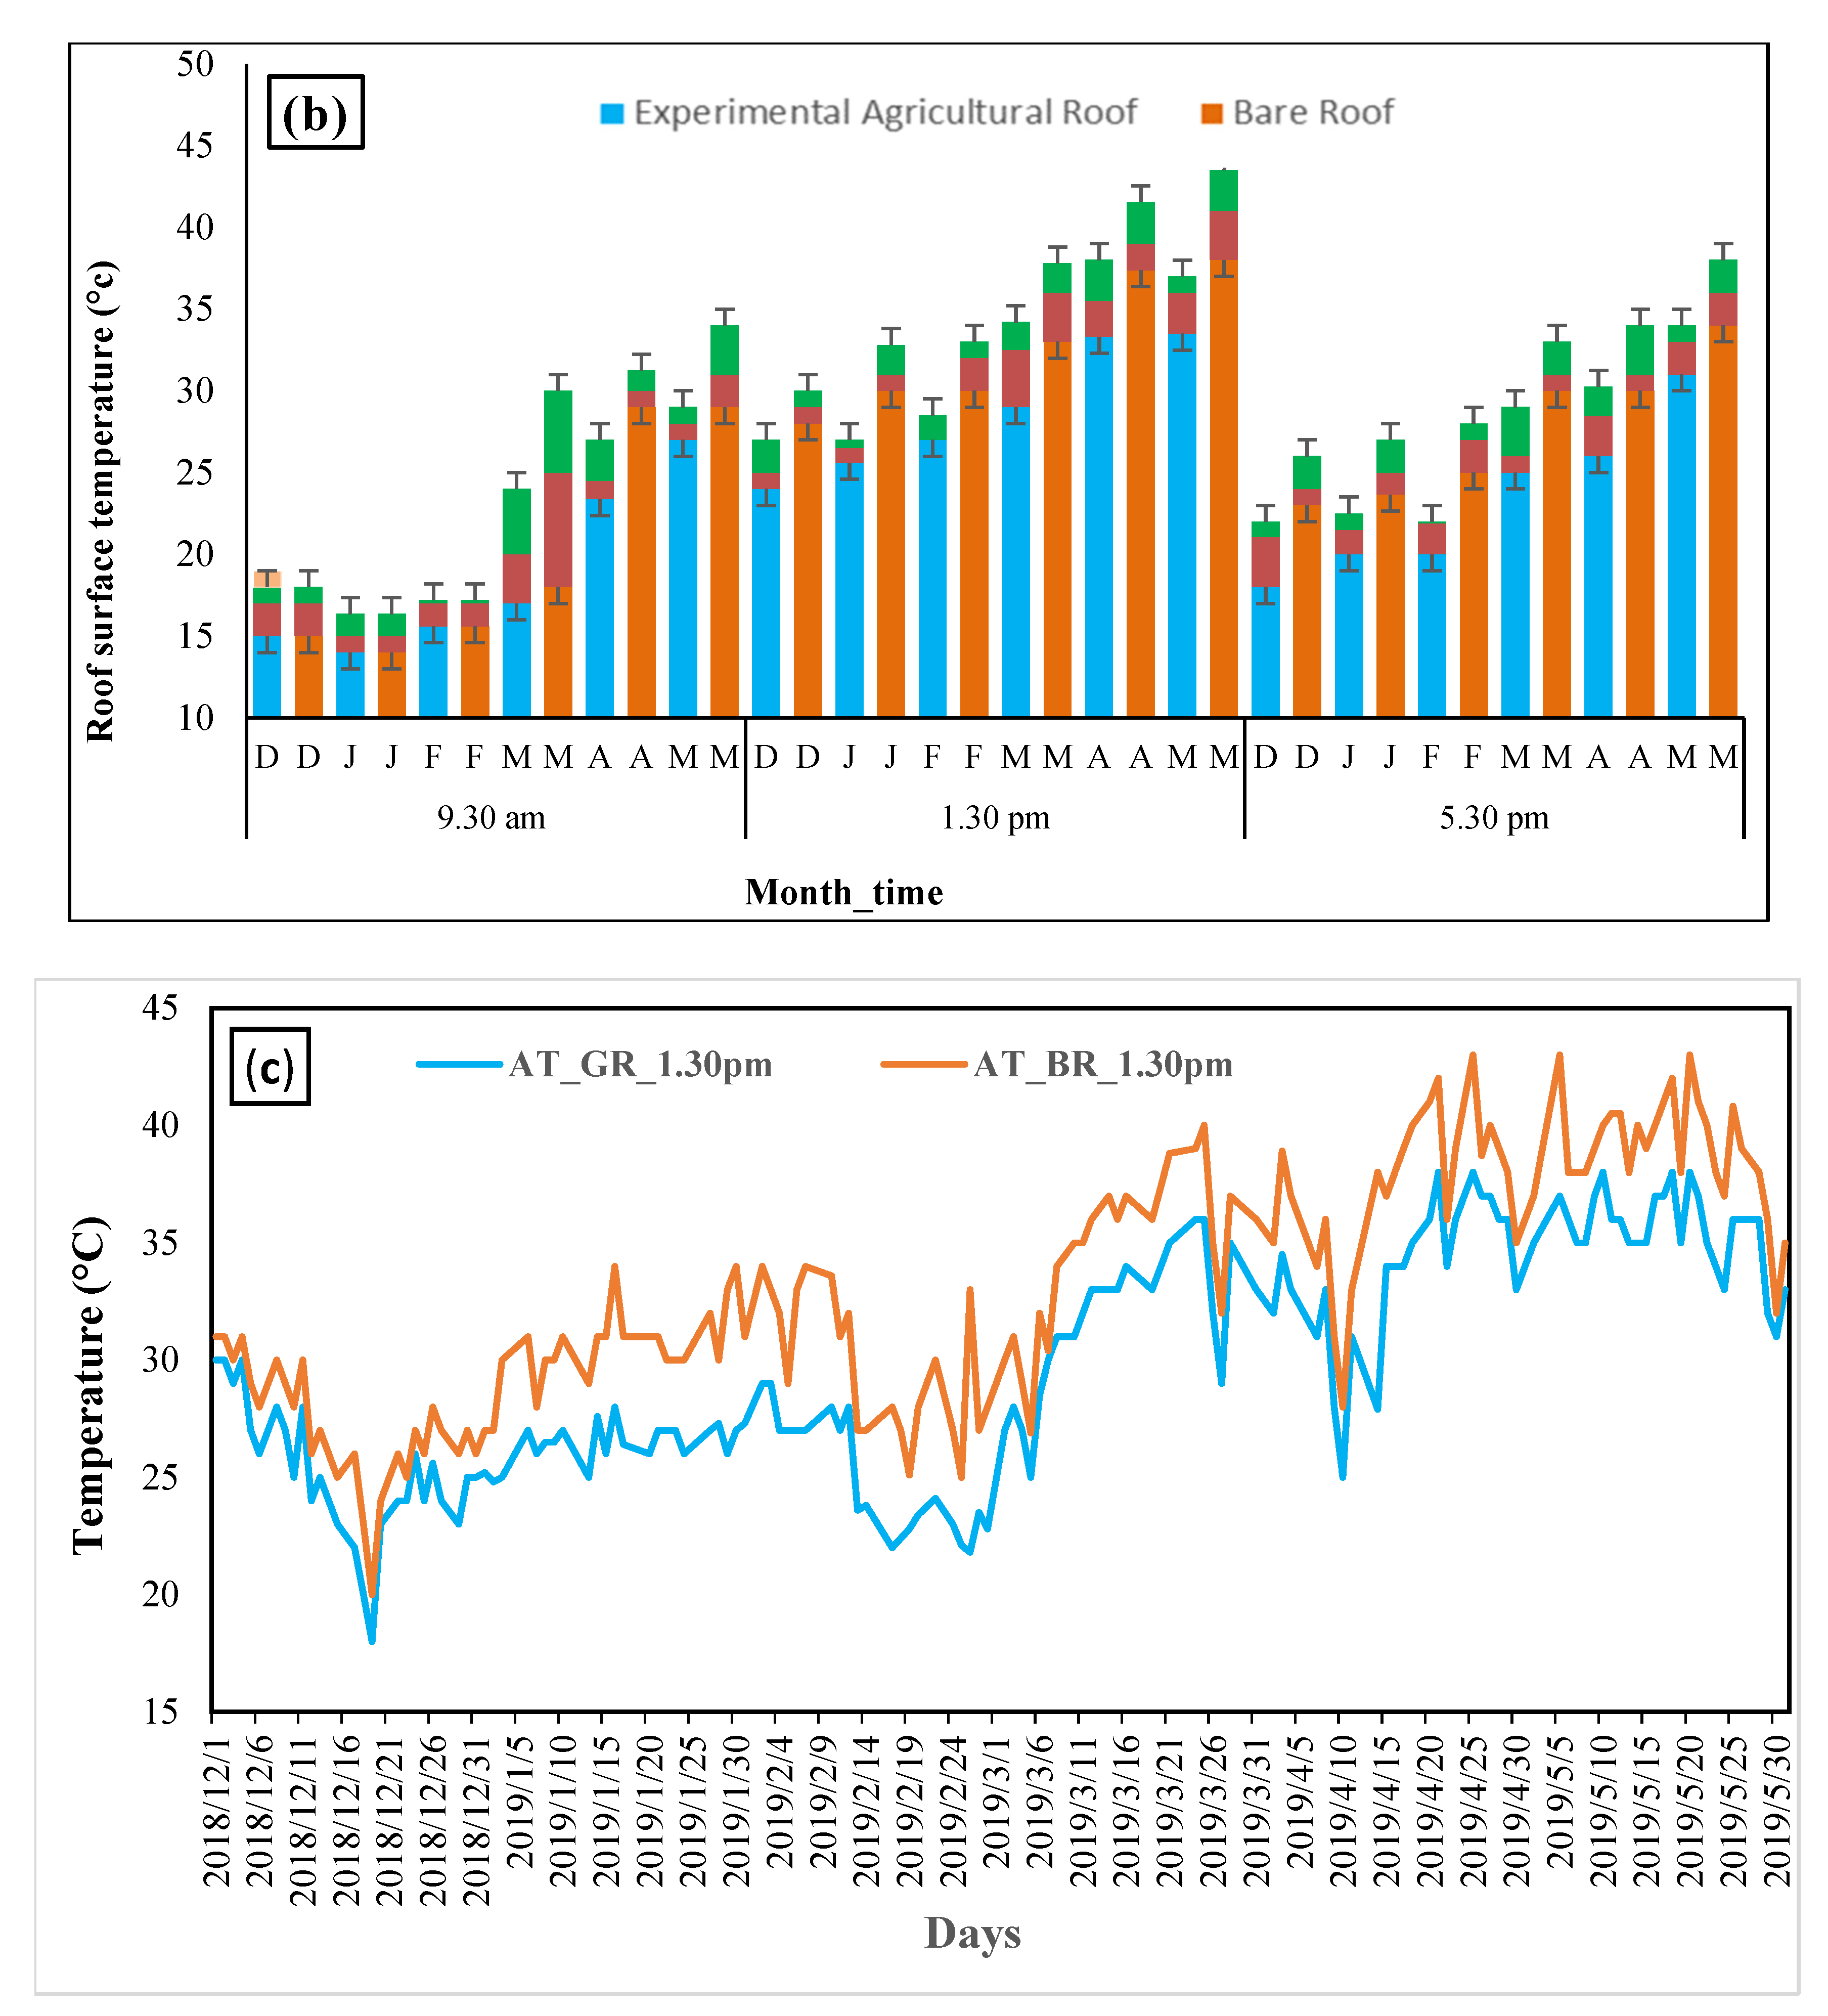
3.2. Temperature in URTA under Drip Irrigation and Bare Roof without Irrigation Approach

Due to a higher near roof surface temperature (Figure 4a,b) and sunshine hours on the roof compared land, access irrigation was required in URTA. The study found that URTA reduced air temperature and roof surface temperature by 1.2 °C to 5.21 °C and 3 °C to 12 °C, respectively, compared to the nearby bare roof (Figure 4b,c). From Figure 4, it is clearly observed that the variability of the air and roof surface temperature was lower on the agricultural roof than on bare rooves and also higher than on land during the period December 2018 to May 2019. It is clear that temperature (roof and air) on rooves significantly varied at 1:30 pm compared with 9:30 am due to irrigation, shadow-shading effect or the higher leaf density of plants on the agricultural roof.

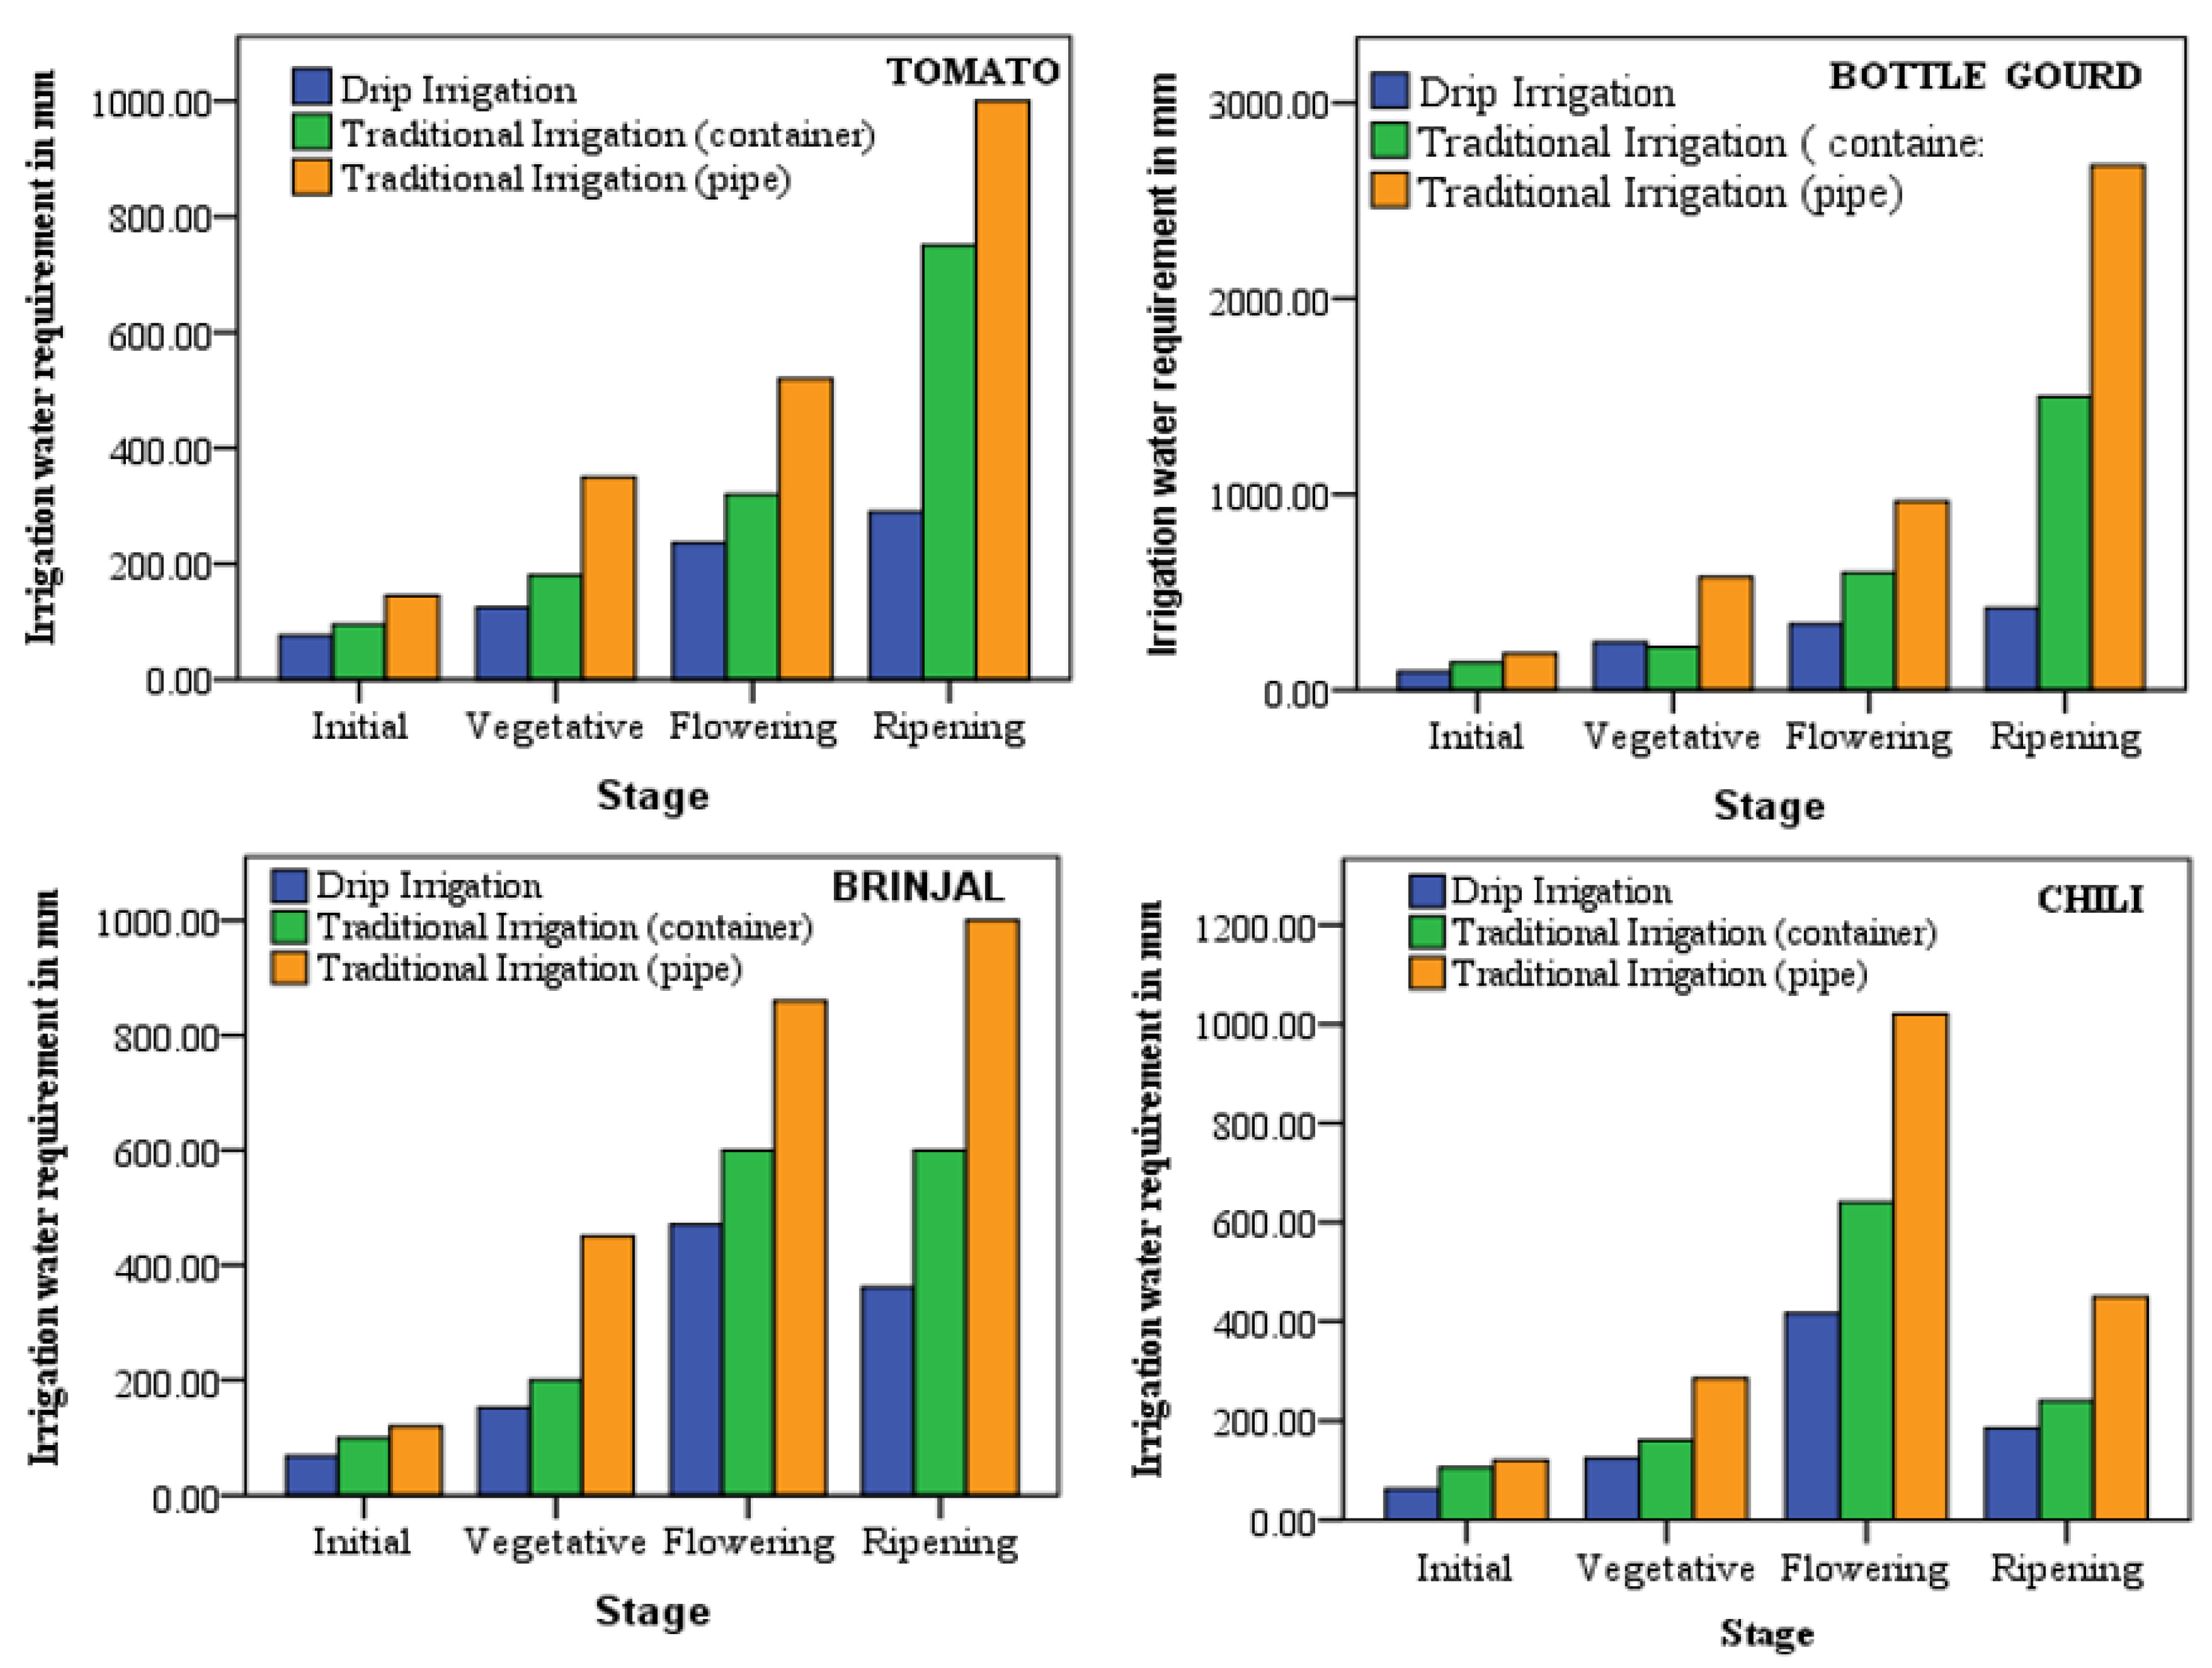
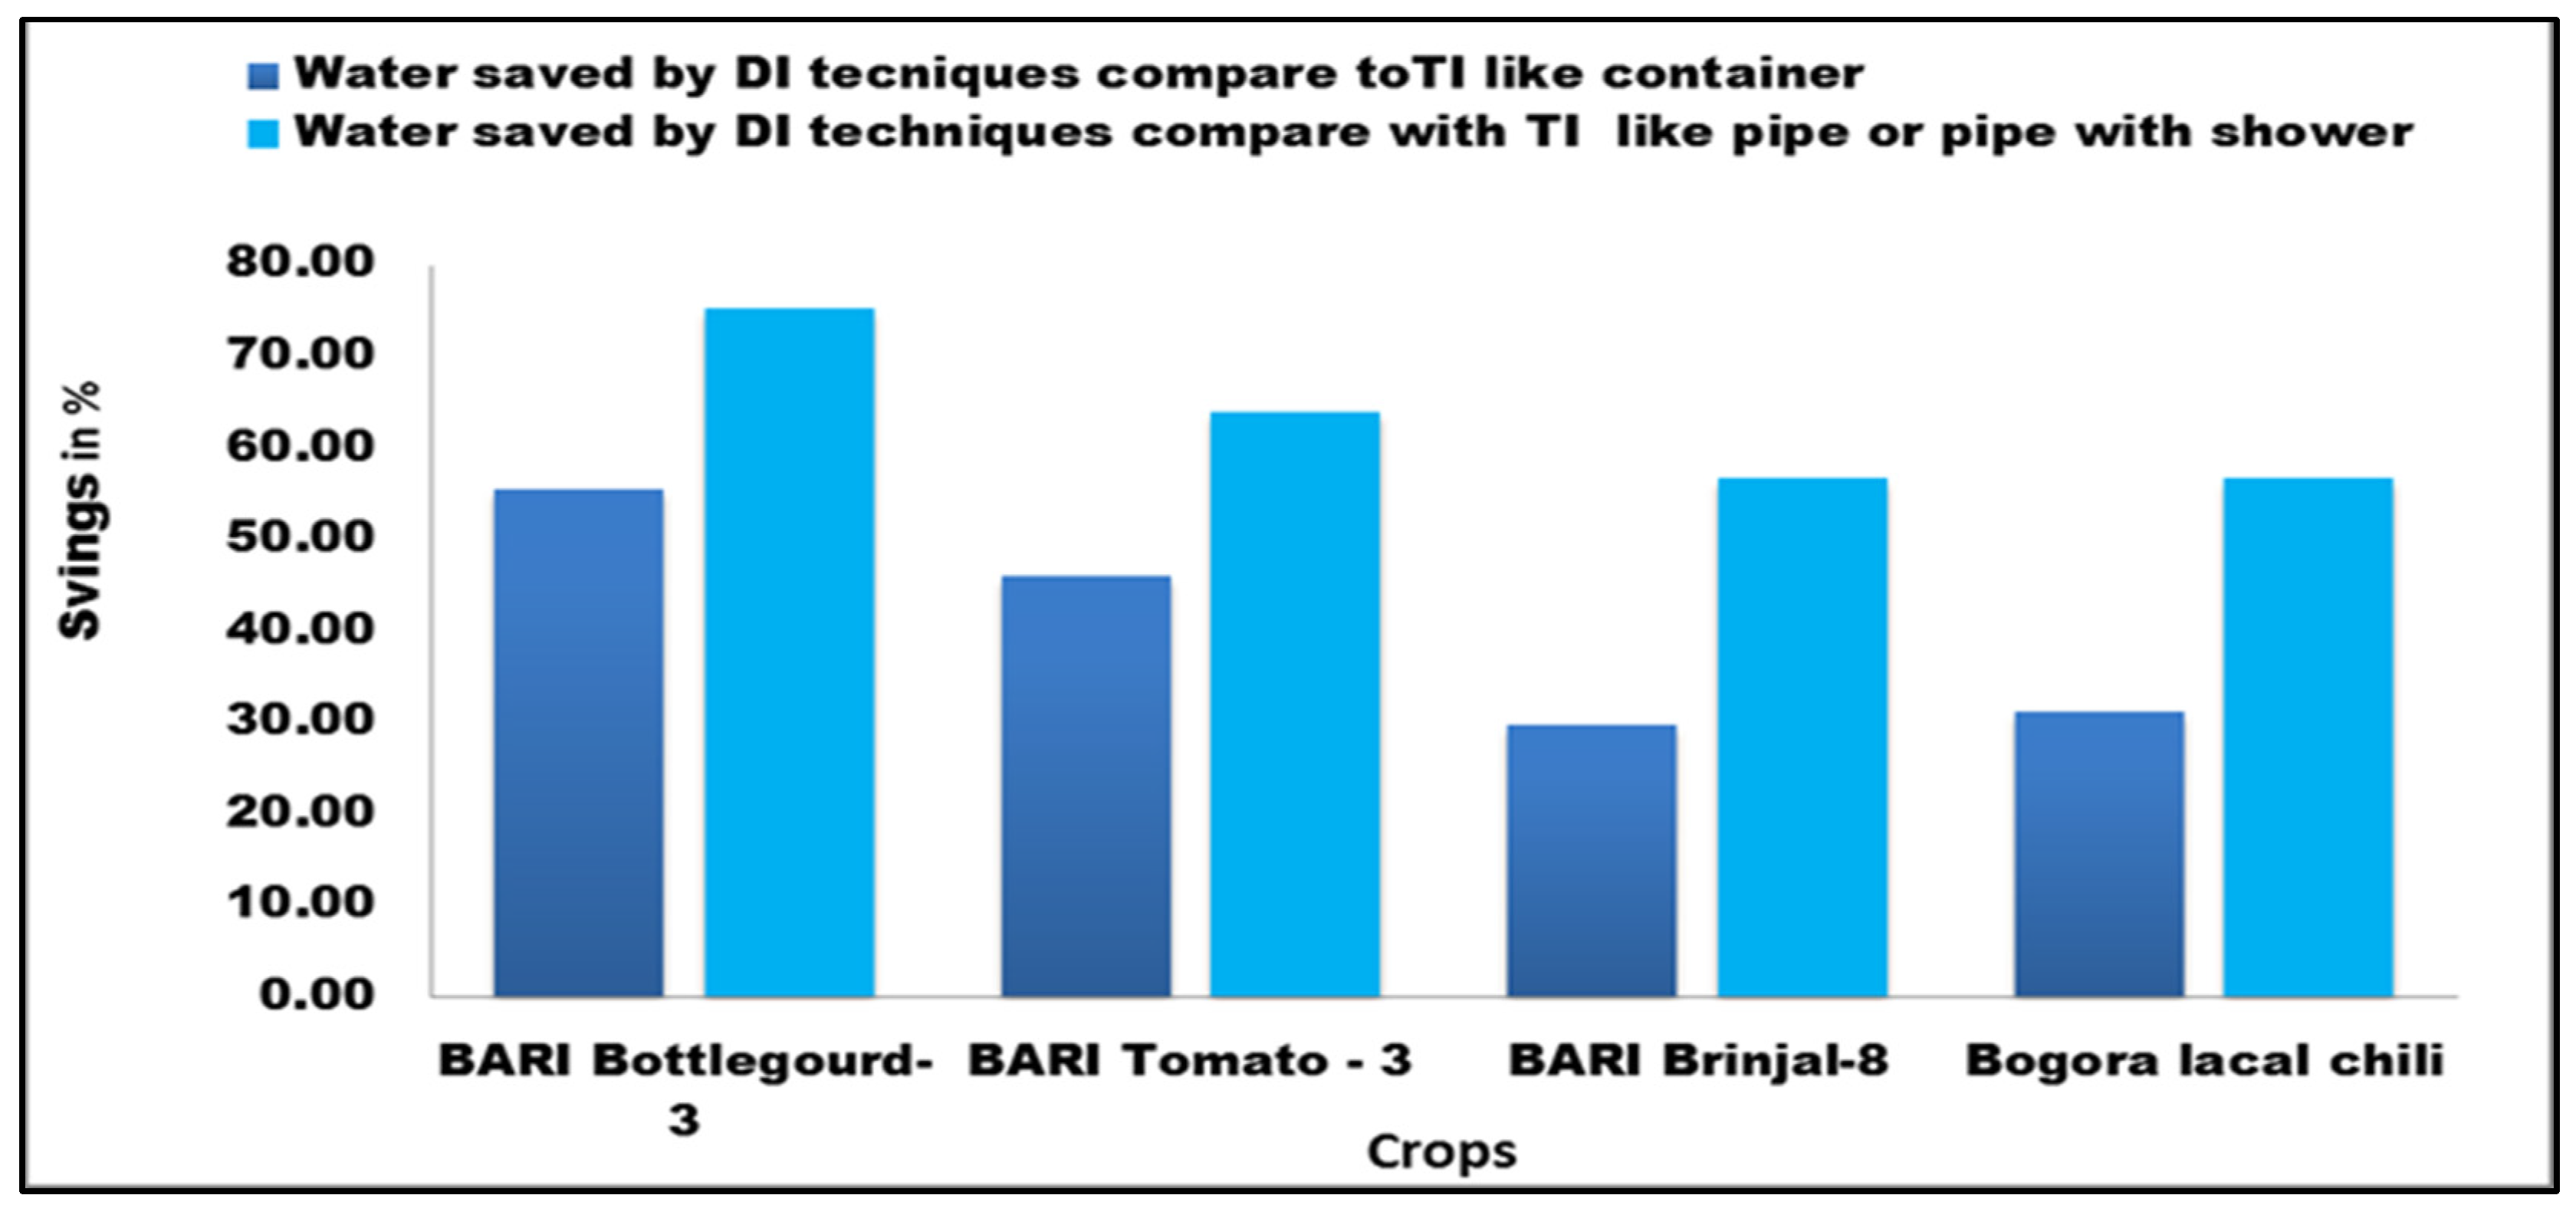
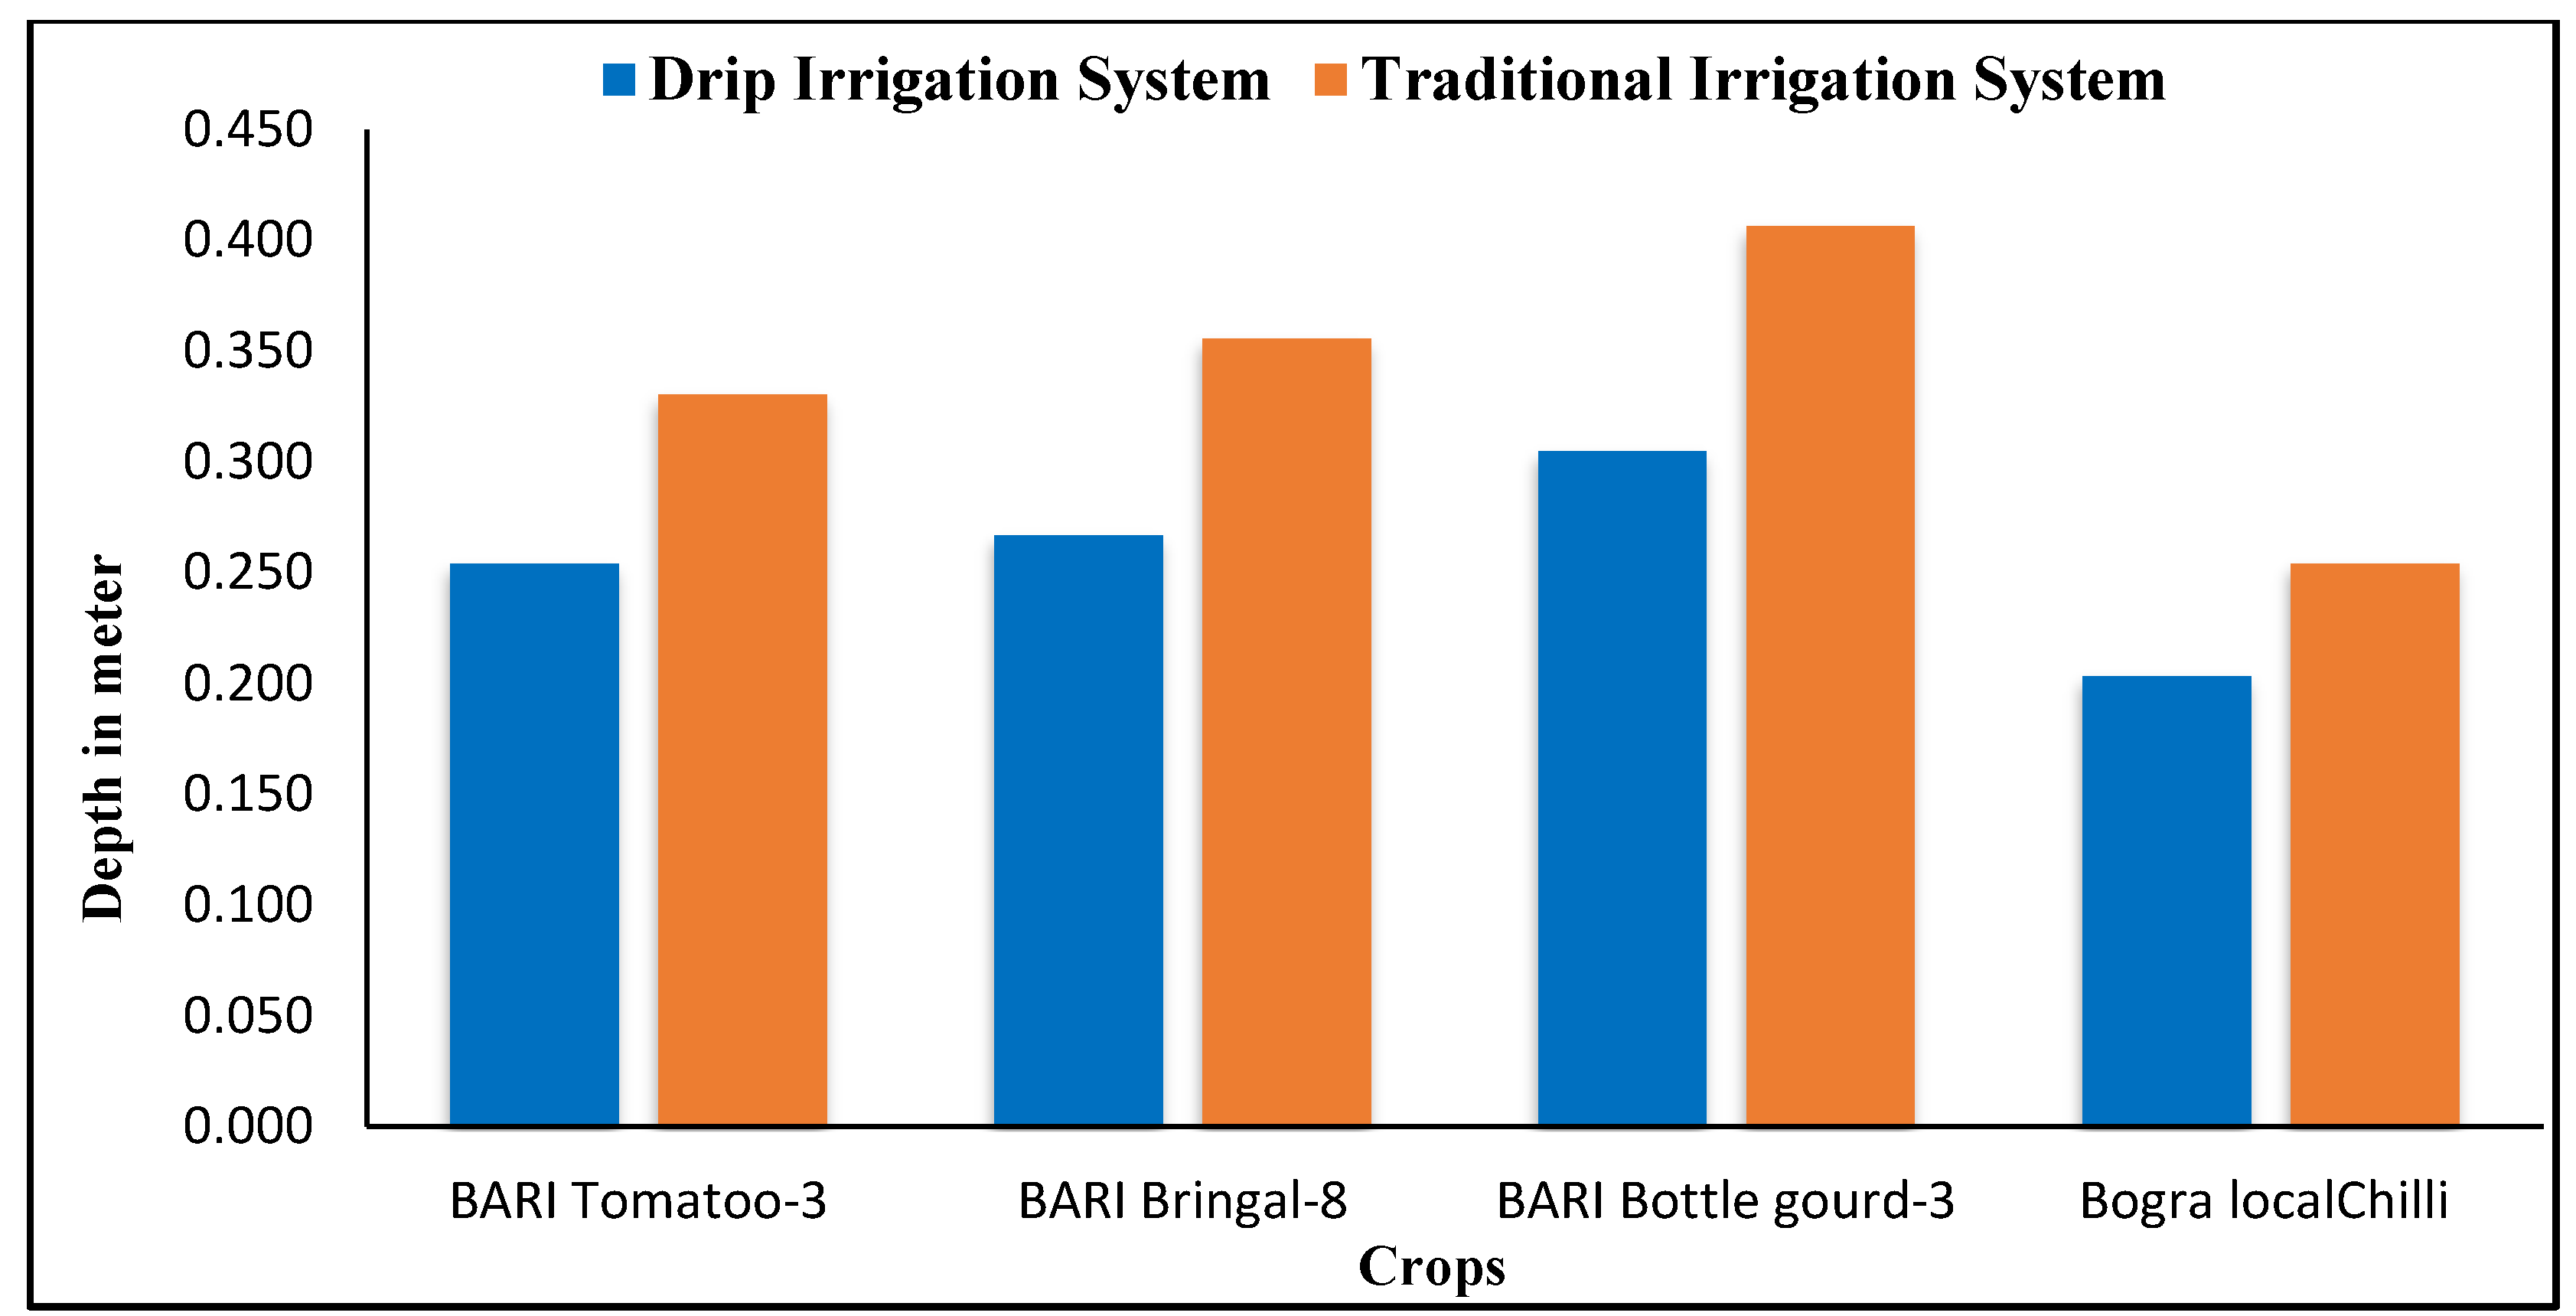
3.3. Irrigation Water Requirement of Tomato, Bringal, Chili and Bottle Gourd in URTA under Drip Irrigation and Traditional Irrigation Approach

The study found that due to high temperature, BARI Tomato-3 needed a total of 727 mm, 1345 mm, and 2016 mm of water for irrigation in URTA with the drip irrigation technique, traditional irrigation with container and pipe, respectively (Table 6). In this research, it was found that the root zone depth of Tomato varied from 16 cm to 20 cm. The results revealed that the optimum irrigation water requirement for Tomato was around 54% access of ETc. Based on this, the actual irrigation water for the Tomato crop in URTA could be recommended as between 76 mm to 290 mm/stage. It was also found that BARI Tomato-3 needs 76 mm, 125 mm, 236 mm, and 290 mm irrigation water at the initial stage, vegetation stage, flowering stage, and ripening stage, respectively, in URTA. Figure 5 shows that applied water was high during the flowering stage and ripening stage of the development of plant parts and for flowers and fruits [54]. However, due to continuous irrigation with mug, bottle or bucket, pipe or pipe with shower, a total of 46–64% excess irrigation water was used by the traditional method. The traditional irrigation prerequisite for BARI Tomato-3 is 95 mm to145 mm, 180 mm to 350 mm, 320 mm to 520 mm and 750 mm to 1000 mm at the initial stage, vegetation stage, flowering stage, and ripening stage, respectively, in URTA. However, it was exposed that for Tomato production in URTA, drip irrigation techniques save 46% and 64% of irrigation water compared to containers, and pipe and pipe with shower irrigation. On the other hand, it was also observed that the maximum reference evapotranspiration for BARI Tomato-3, BARI Bottle gourd-3, BARI Brinjal-8, and Bogra Local Chili over the crop growth period in the winter season with URTA were 6.41 mm day−1, while the minimum value was 2.58 mm day−1. A higher value of ETo during the latter crop growth period was due to a higher temperature, low relative humidity, higher sunshine hours, and greater wind speed. Similarly, BARI Bottle Gourd-3, BARI Brinjal-8 and Bogra Local Chili also need a total of 1093.45 mm, 1053 mm and 790 mm irrigation water for cultivation in URTA with the drip irrigation technique. It has also been found that total days for the growth stages of these crops were 120, 192 and 202 days, respectively. However, Figure 5 also reveals that in the case of the traditional irrigation system, BARI Bottle Gourd-3, BARI Brinjal-8 and Bogra Local Chili need 2460 mm (with container) to 4408 mm (with pipe), 1500 mm (with container) to 2430 mm (with pipe) and 1148 mm (with container) to 1875 mm (with pipe) depth of water for cultivation in URTA. From Figure 5, it can also be seen that the traditional irrigation water requirement for the BARI Bottle gourd-3, BARI Brinjal-8 and Local Chili is around 56% to 75%, 30% to 57% and 31% to 57% more than that for the drip irrigation technique. The effect of depth of water application with excess water was that the crop growth suffered, leading to decrease in yield and irrigation water productivity. The study was also conducted for the summer season for BARI Bottle Gourd-4 and BARI Tomato-4 and observed that these crops needed a total 511 mm, 721 mm, 945 mm and 1013 mm, 1246 mm, 1579 mm with drip irrigation, traditional container irrigation and traditional pipe irrigation, respectively. It has been found that the summer season needs 42.11% less irrigation for Tomato and 8% less irrigation for Bottle gourd compared to the total irrigation water requirement in the winter season. However, the study also found that Bottle Gourd required more irrigation than other crops such as Tomato, Brinjal and Chili in URTA for both traditional and drip irrigation methods. Furthermore, it was also found that Bottle Gourd cultivation was more temperature sensitive and irrigation water productivity of Bottle Gourd was more responsive to regular irrigation at the flowering stage than at other stages. Therefore, all the crops need frequent and regular irrigation at field capacity in URTA to increase crop water productivity [55]. Conversely, Figure 6 demonstrated water savings by drip irrigation compared to traditional irrigation and it was clearly observed that, as a replacement for traditional irrigation, the drip irrigation technique saves 30–75% in URTA. So, drip irrigation saved 26–79% conveyance loss of irrigation water compared to traditional irrigation. However, the study demonstrated that roof surface, air temperature, and duration of sunshine hours are the predominant factors controlling the response of soil properties to rooftop agriculture. This study observed that when minimum and maximum temperature is 1.5 times that of land surface temperature (in February, March, and April it is two times that of land surface temperature), and sunshine hours are minimum 10 h then crop water requirement from the CROPWAT model is sufficient for production on the rooftop, and surplus irrigation is not necessary for cultivation.
The study also found in the second year experiment that 18.78% irrigation water was saved through using a growing medium or container according to maximum root zone depth and soil texture, especially organic matter of the soil. The size and shape of BARI Tomato-3 and BARI Brinjal-8 were also similar during application of both groundwater and green water through drip irrigation techniques. The study also observed that irrigation water quality of grey and rainwater mixture were within the range of the acceptable limit for irrigation The value of pH, EC (µs/cm), TDS (mg/L), Arsenic (ppb), Iron (mg/L), Chloride (mg/L), Sodium (meq/L), Total Alkalinity (mg/L), Total Hardness (mg/L), Nitrate-Nitrogen (mg/L), Phosphate (mg/L) and Sulfate, (mg/L) were 6.5–8.5, 2250 µs/cm, 2000 mg/L, 100 ppb, 5.0 mg/L, 600 mg/L 1000 mg/L, 120 mg/L, 23, 10 mg/L), 10 (mg/L), 6.0 (mg/L) and 1000 (mg/L), respectively [56], which was suitable for irrigation. Therefore, the study observed that green water was suitable for URTA to cultivate different crops, in order to reduce the pressure on groundwater.

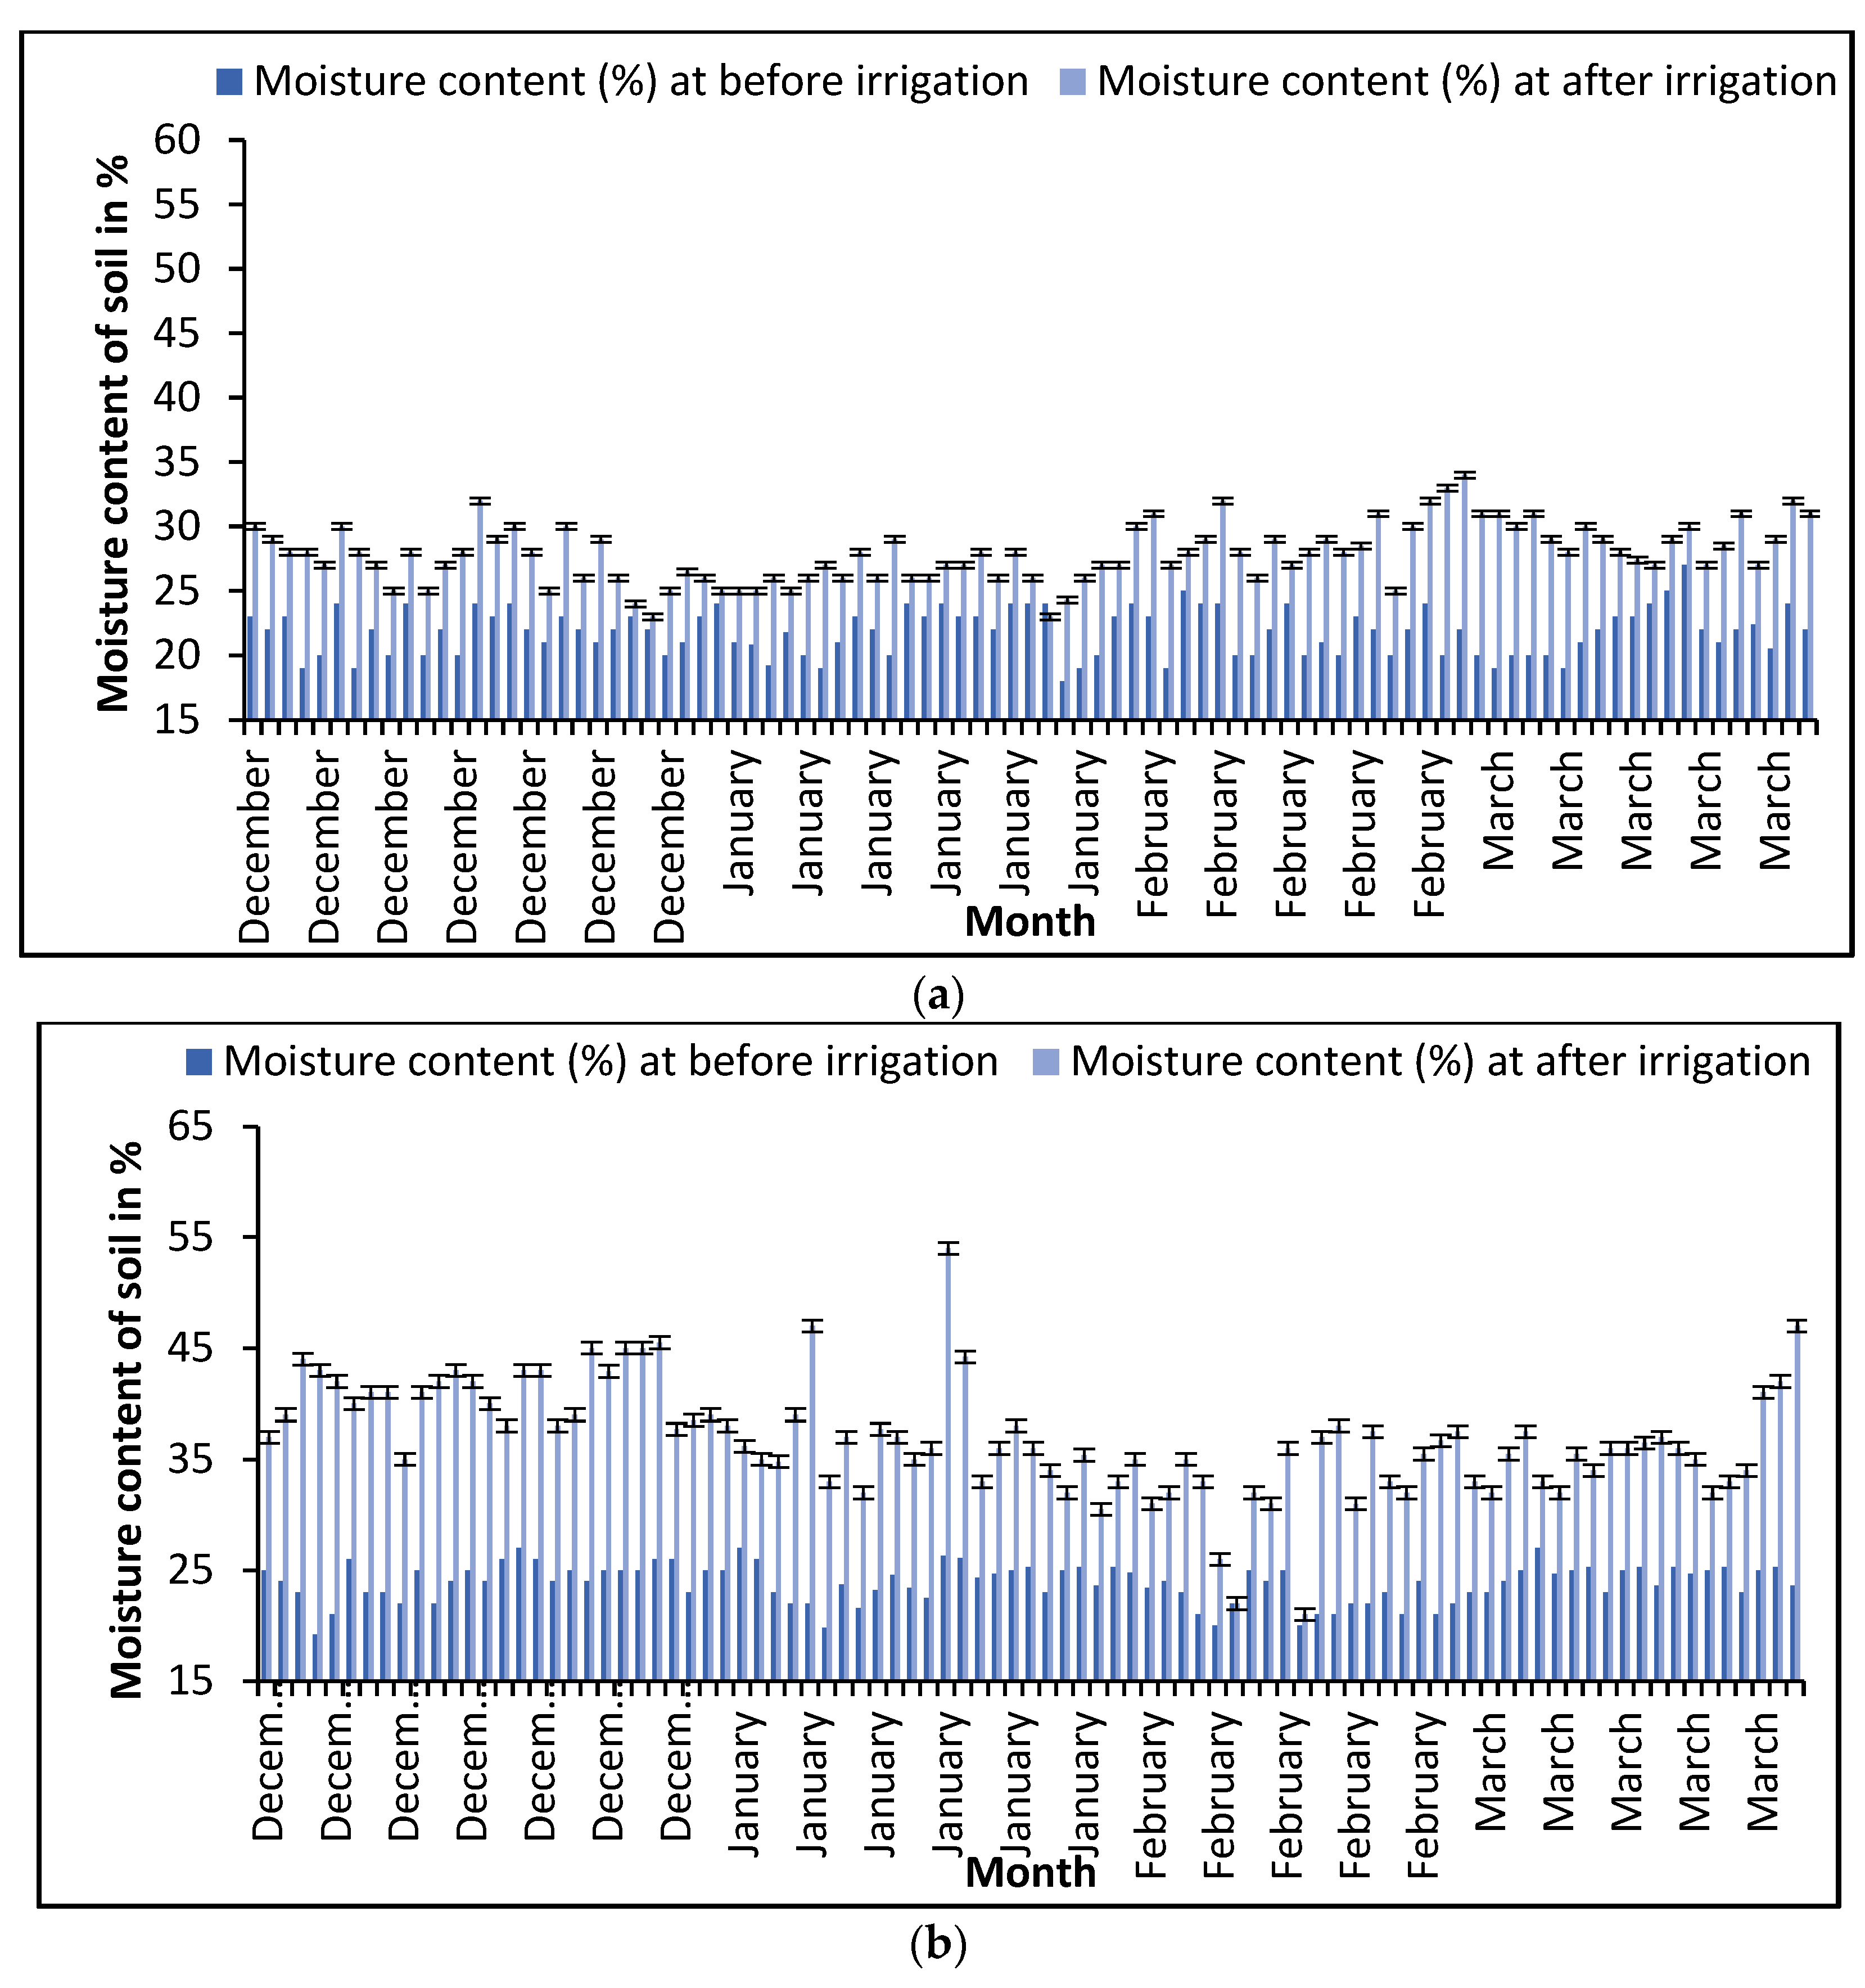
3.4. Moisture Content Dynamics in URTA under Drip Irrigation and Traditional Irrigation Approach

Figure 7 shows the assessment of soil moisture (SM) under URTA during the first-year winter irrigation research season measured by soil moisture data logger before and after, (a) in the DI system and (b) in the TI approach. The results showed that soil moisture increased after completion of irrigation. The soil moisture after irrigation in the DI system was less than TI due to the direct water application in the soil as a result of closer proximity to the water emission point. Soil moisture increased immediately after irrigation by up to 29% in the DI system and up to 50% for the TI system of volumetric water content. Figure 7a,b also denotes that in the TI system on average soil moisture was higher by 10% and 23% in comparison to the DI system before and after irrigation [56]. Average soil water content was a relatively low (29%) in the DI system. This indicated that water lost in the TI system is significantly much higher than in the DI system. For this reason, in the DI system, soil moisture is readily available and plants can uptake it easily [57].
It can be concluded that in the DI system soil moisture distribution occurs around the active root zone of crops and evaporation loss is minimum during irrigation with the DI system [58]. The maximum root zone depths of the selected crops were also observed during the entire experimental period for both DI and TI systems. The maximum root zone system is a very small response to the irrigation system. It was assessed for two irrigation systems (DI and TI) for the entire period of the study for the selected crops. The maximum root-length intensity of the plants was influenced by the irrigation system. It was found that for all crops most of the root system was concentrated at a soil depth of 40 cm of the container, and the maximum rootzone depth was found within 25 cm of the container (Figure 8) for drip irrigation and 35 cm for the traditional irrigation approach (container and hose pipe). On the other hand, the maximum root-length range was also found from 0.5 m to1.55 m, remaining in the soil inside the container

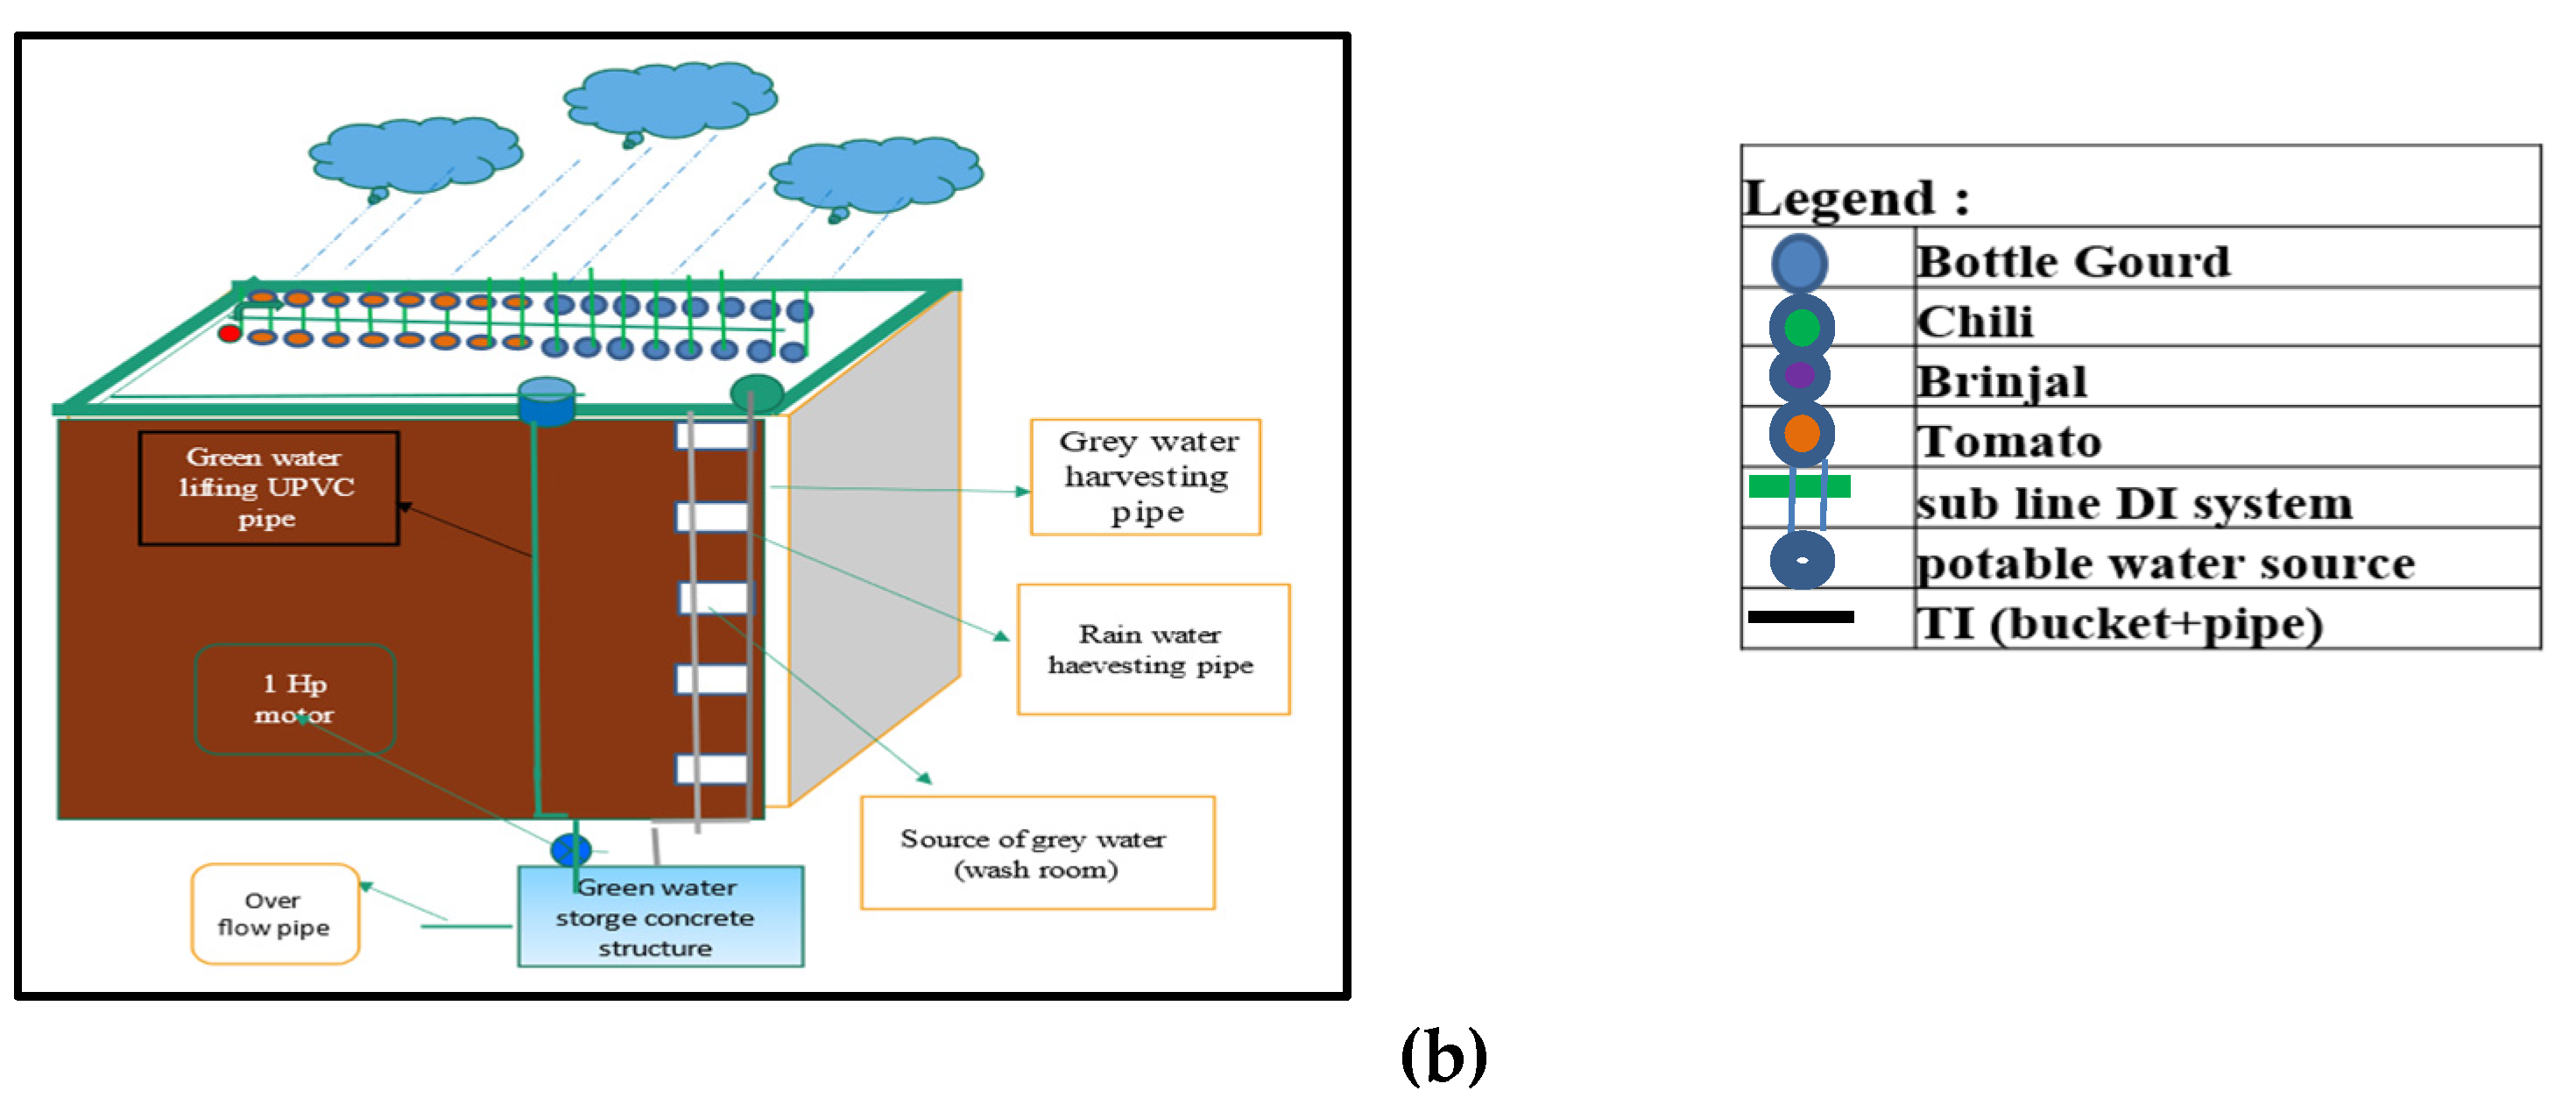
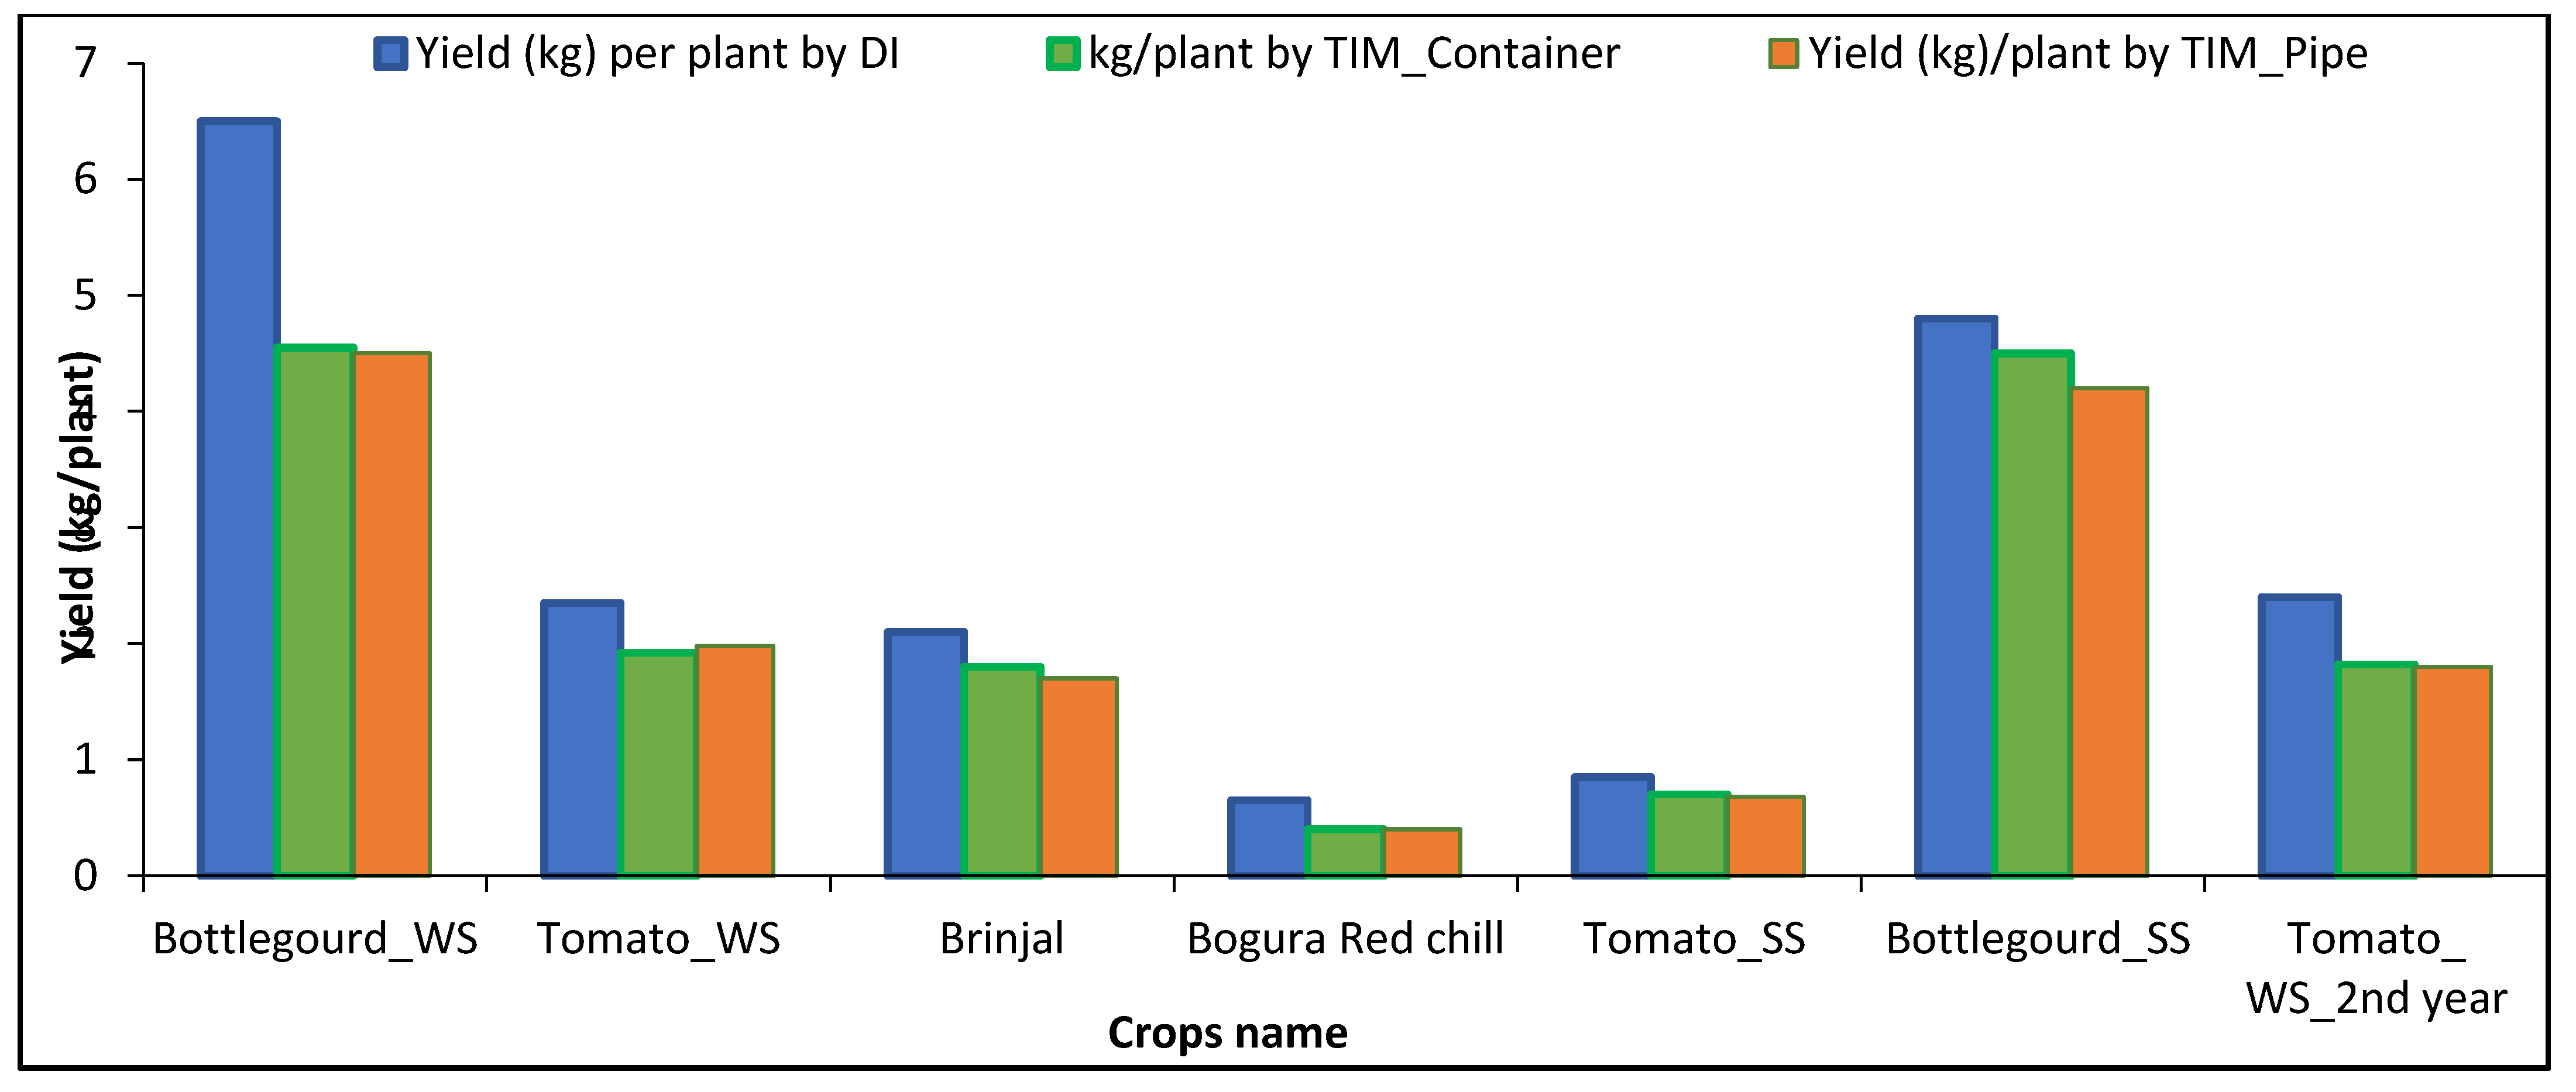
3.5. Yield of Different Crops in URTA

Influences of the irrigation method, i.e., DI and TI, were analyzed considering the amount of irrigation water for the selected crops and their yields. From Figure 9, it is clearly visible that DI is successful in increasing yields for the crops. The drip-irrigated average seasonal yield for BARI Tomato-3, BARI Bottle Gourd-3, BARI Brinjal-8, and Bogra Red Chilies was found to be 2.35, 6.5, 2.1, and 0.65 kg/plant, respectively, for the winter season, whereas the BARI recommended marketable yield range per plant varies from 2–3 kg, 19–24 kg, 1.4–2.00 kg, and 0.7–0.75 kg, respectively. On the other hand, when irrigation was carried out in the traditional way the yields of these crops was found to be 1.92 kg, 1.8 kg, 3.5 kg, and 0.4 kg per plant, respectively. Similarly, in the summer season, the yields of BARI Tomato-4 and BARI Bottle Gourd-4 were found to be 0.85, 4.8, and 0.70, 4.5 kg/plant in drip irrigation and traditional irrigation method, respectively. The mean seasonal yield of BARI Tomato-3 and BARI Bottle Gourd-4 was found to be 0.85 kg/plant, 4.8 kg/plant, and 0.7 kg/plant, 4.5 kg/plant for the summer season experiment with drip and traditional irrigation method, respectively (Figure 9).
Therefore, it was experimentally found that the yields of these crops were always higher with the DI system than with the traditional irrigation system for any season of the year (Figure 9). It was found that in URTA, the yield of BARI Bottle Gourd-3, BARI Tomato-3, BARI Brinjal-8, Bogra Red Chili, BARI Tomato-4, and BARI Bottle Gourd-4 was increased through drip irrigation by 42.86%, 22.40%, 16.67% 62.50%, 21.43%, and 6.67%, respectively, compared to the container traditional irrigation. Similarly, the yield of these crops was increased by 44.44%, 18.69%, 23.53%, 62.50%, 25%, and 14.29%, respectively, compared to the pipe irrigation method. Pipe irrigation was carried out by applying groundwater. On the other hand, when rain and grey water were used in the irrigation, the yield of BARI Tomato-3 was very similar. Drip irrigation with rain and grey water also led to increased yield of BARI Tomato-3 by 31.87% and 33.33% compared to the container and traditional pipe irrigation. The differences in water use showed that the DI system improved the irrigation water use efficiency in comparison with a traditional irrigation system. The DI system has led to yield increase with the same irrigation water volume. This might be due to the efficient application of water according to crop water requirements. However, from Figure 9, it is also seen that yield of these crops is higher in the winter season than in the summer season.

3.6. Irrigation Water Productivity (IWP) in URTA

The study revealed that the average IWP of BARI Bottle Gourd-3 in the winter season (WS) in URTA is 0.59 kg plant−1 mm−1 for drip irrigation, 0.12 kg plant−1 mm−1 for traditional container irrigation and 0.14 to kg plant−1 mm−1 for traditional pipe irrigation. IWP of BARI Bottle gourd-4 for the same treatments in the summer season (SS) was found to be 0.47 kg plant−1 mm−1, 0.36 kg plant−1 mm−1, 0.27 kg plant−1 mm−1. Similarly, IWP of BARI Tomato-3 for winter season with the same irrigation methods was 0.32 kg plant−1 mm−1, 0.12 kg plant−1 mm−1, and BARI Tomato-4 for the summer season was 0.17 kg plant−1 mm−1,0.1 kg plant−1 mm−1, 0.1 kg plant−1 mm−1, respectively. It has also been found that IWP for BARI Brinjal-8 and Bogra Red Chili is 0.2 kg plant−1 mm−1, 0.09 kg plant−1 mm−1, 0.08 kg plant−1 mm−1, 0.03 kg plant−1 mm−1, 0.02 kg plant−1 mm−1, respectively, for the drip irrigation method, traditional container, and pipe method. The IWP of a second-year experiment for BARI Tomato-3 was 0.39 kg plant−1 mm−1, 0.18 kg plant−1 mm−1 0.13 kg plant−1 mm−1 when grey and rainwater were used for irrigation. Therefore, the study exposed that the highest IWP in the first season was found for BARI Tomato-3 considering the area coverage and market price even though BARI Bottle Gourd was 0.59 kg. It has also been found from this research that grey and rainwater are more suitable for Tomato production and yield is increased by 21.88% compared to portable water. Figure 10 suggests that drip irrigation can achieve the maximum IWP for all selected crops compared to the traditional method. The results obtained in this study show that the IWP of BARI Tomato-3 can be increased with drip irrigation. The result indicates that watering is limited in conditions of drip irrigation, and reducing over-irrigation of crops could increase IWP by 305–391% for BARI Bottle Gourd, 116–166% BARI Tomato-3, 112% for BARI Brinjal-8, and 166% for Bogra Red Chili. However, drip irrigation will greatly increase the IWP and also increase the yield of these selected crops. For this reason, the actual irrigation is smaller than that traditionally planned. Furthermore, the Tomato, Bottle Gourd, Brinjal and Chili yields in that year were especially high due to applying drip irrigation according to the CWR and soil moisture on the basis of field capacity of the soil.

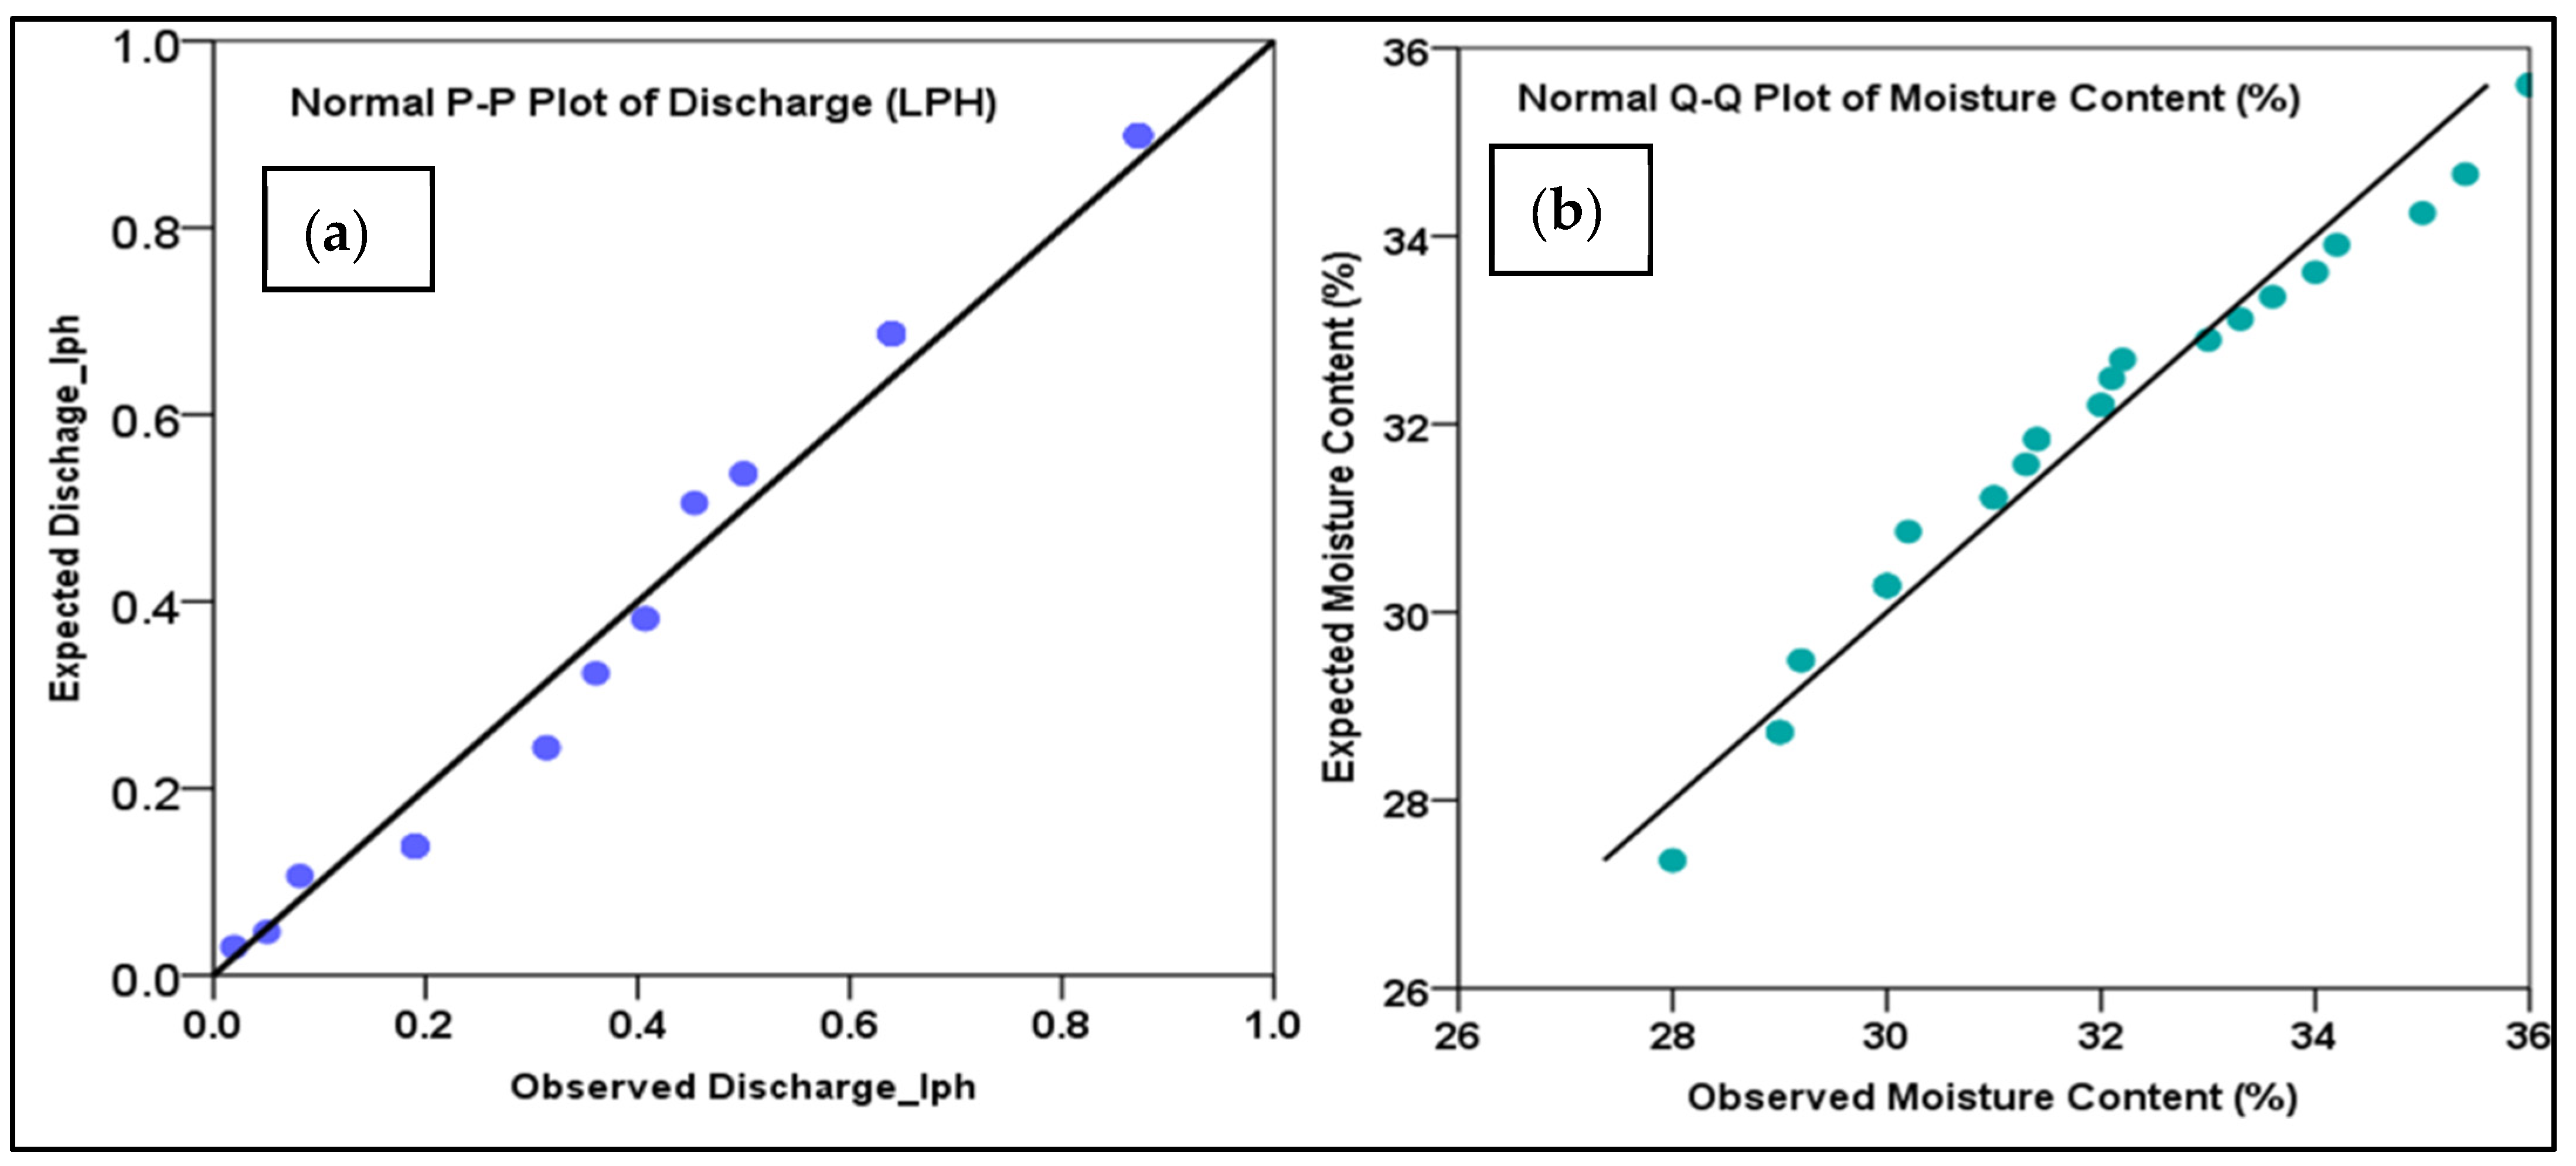
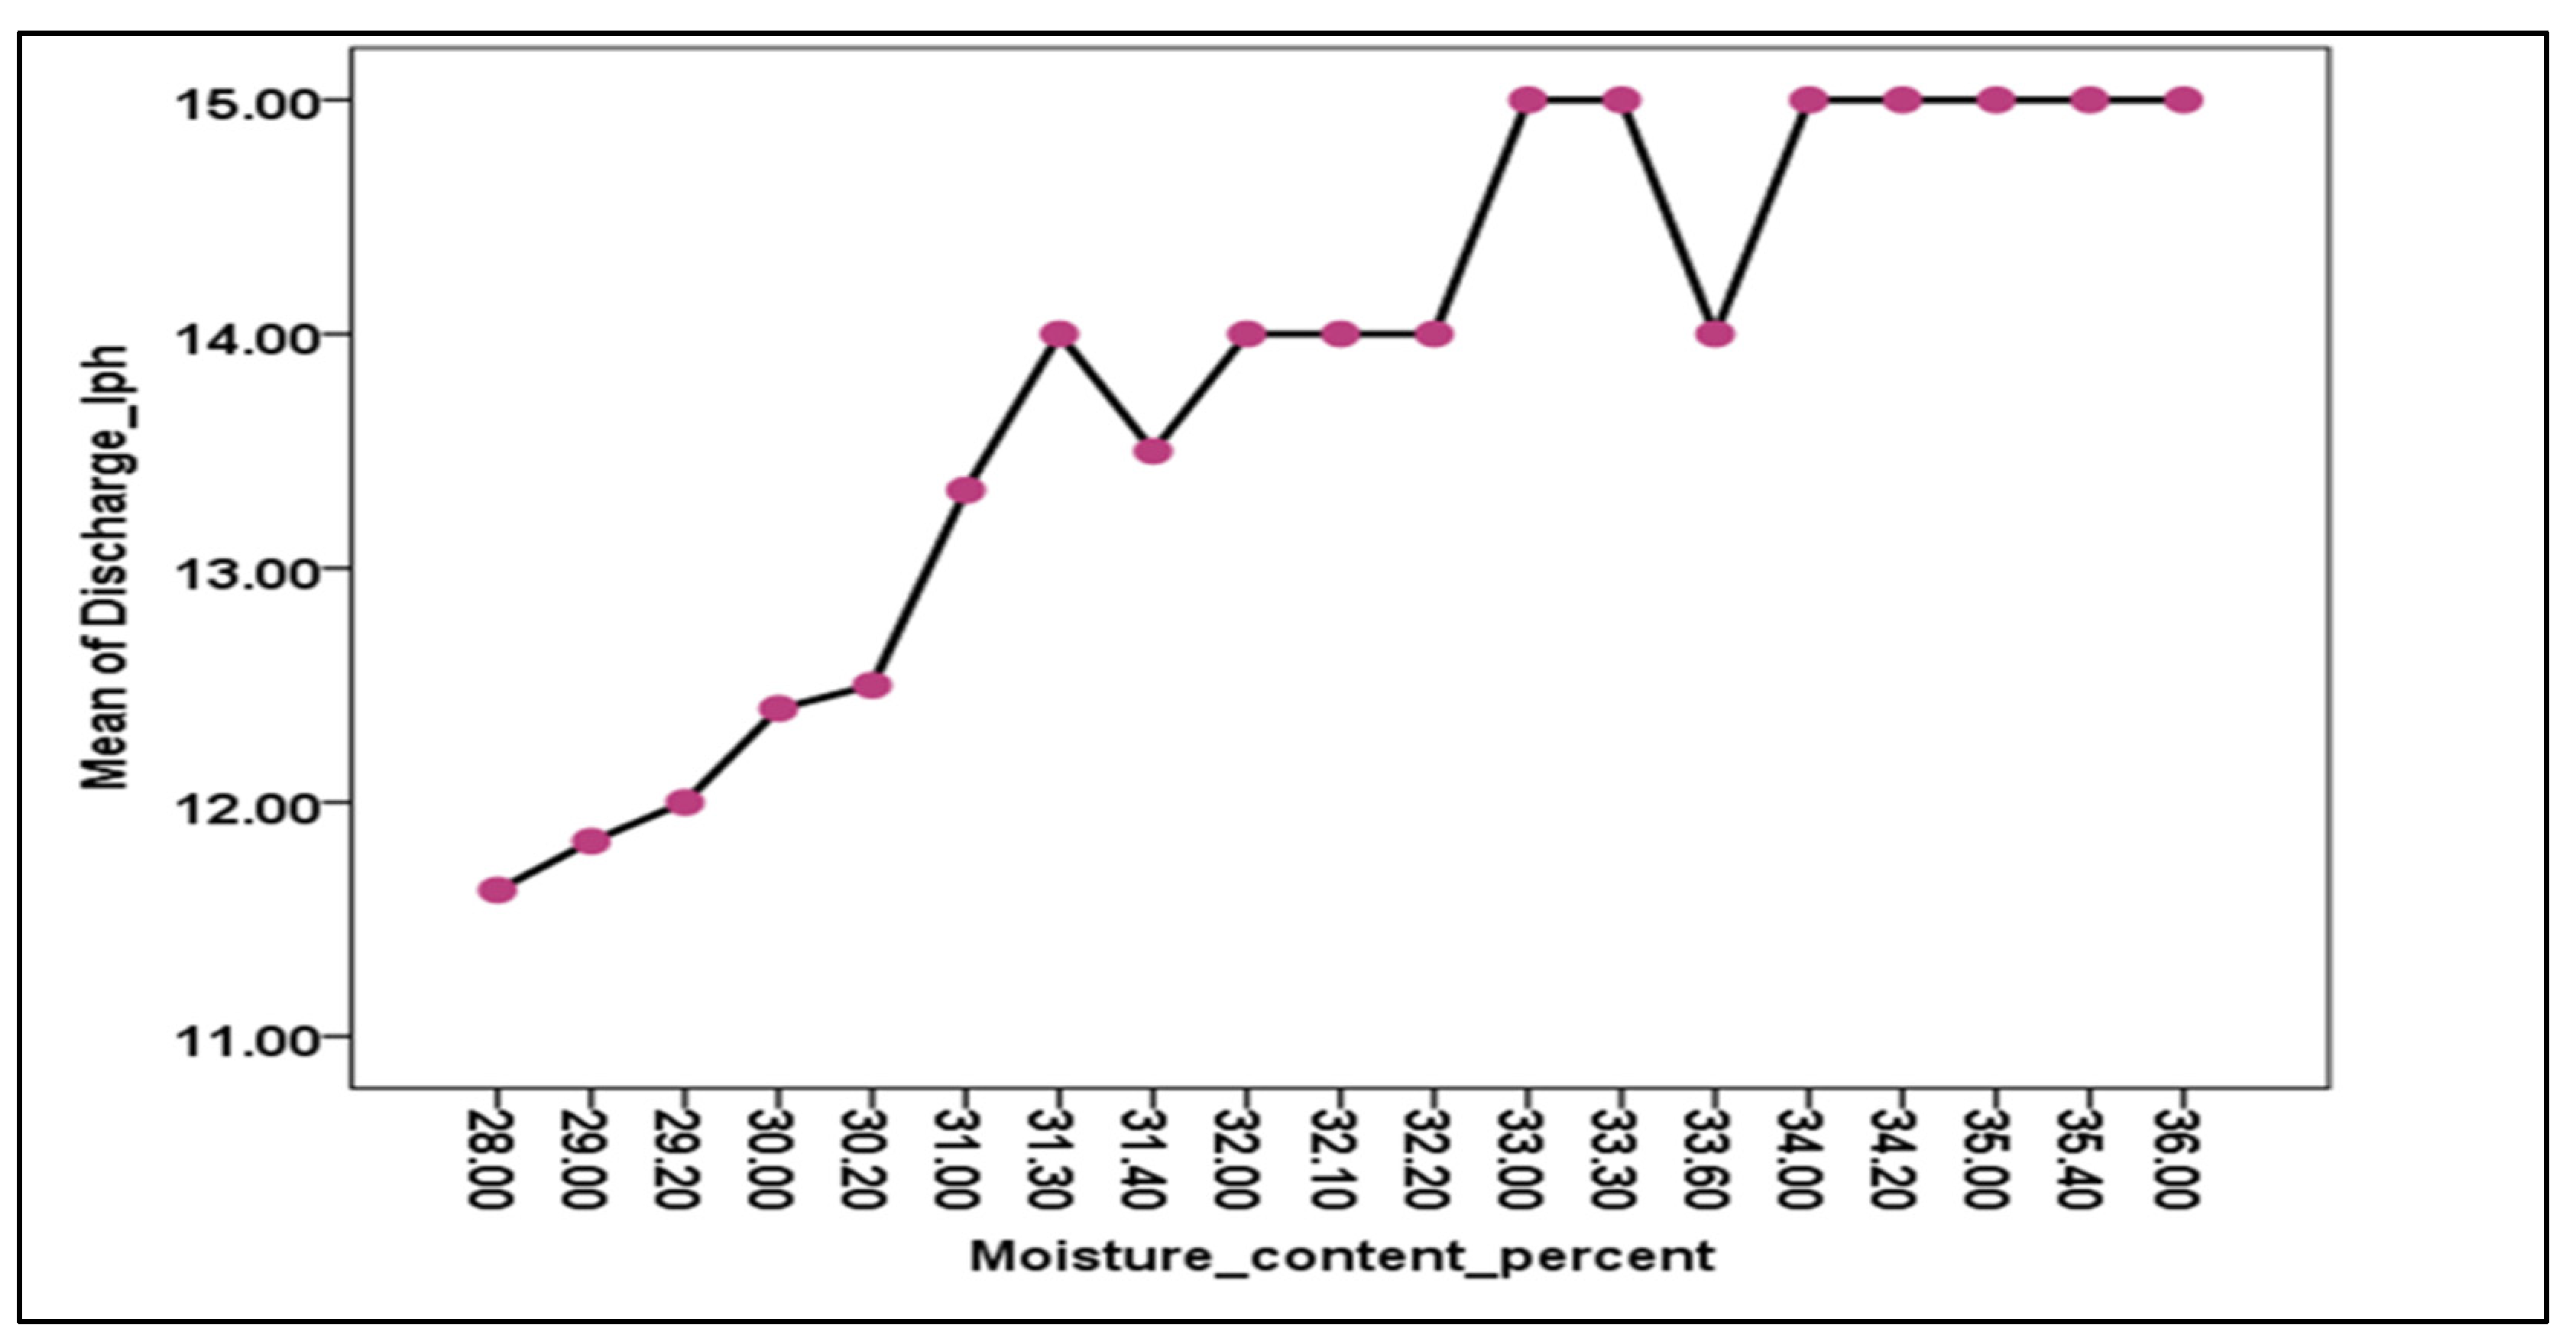
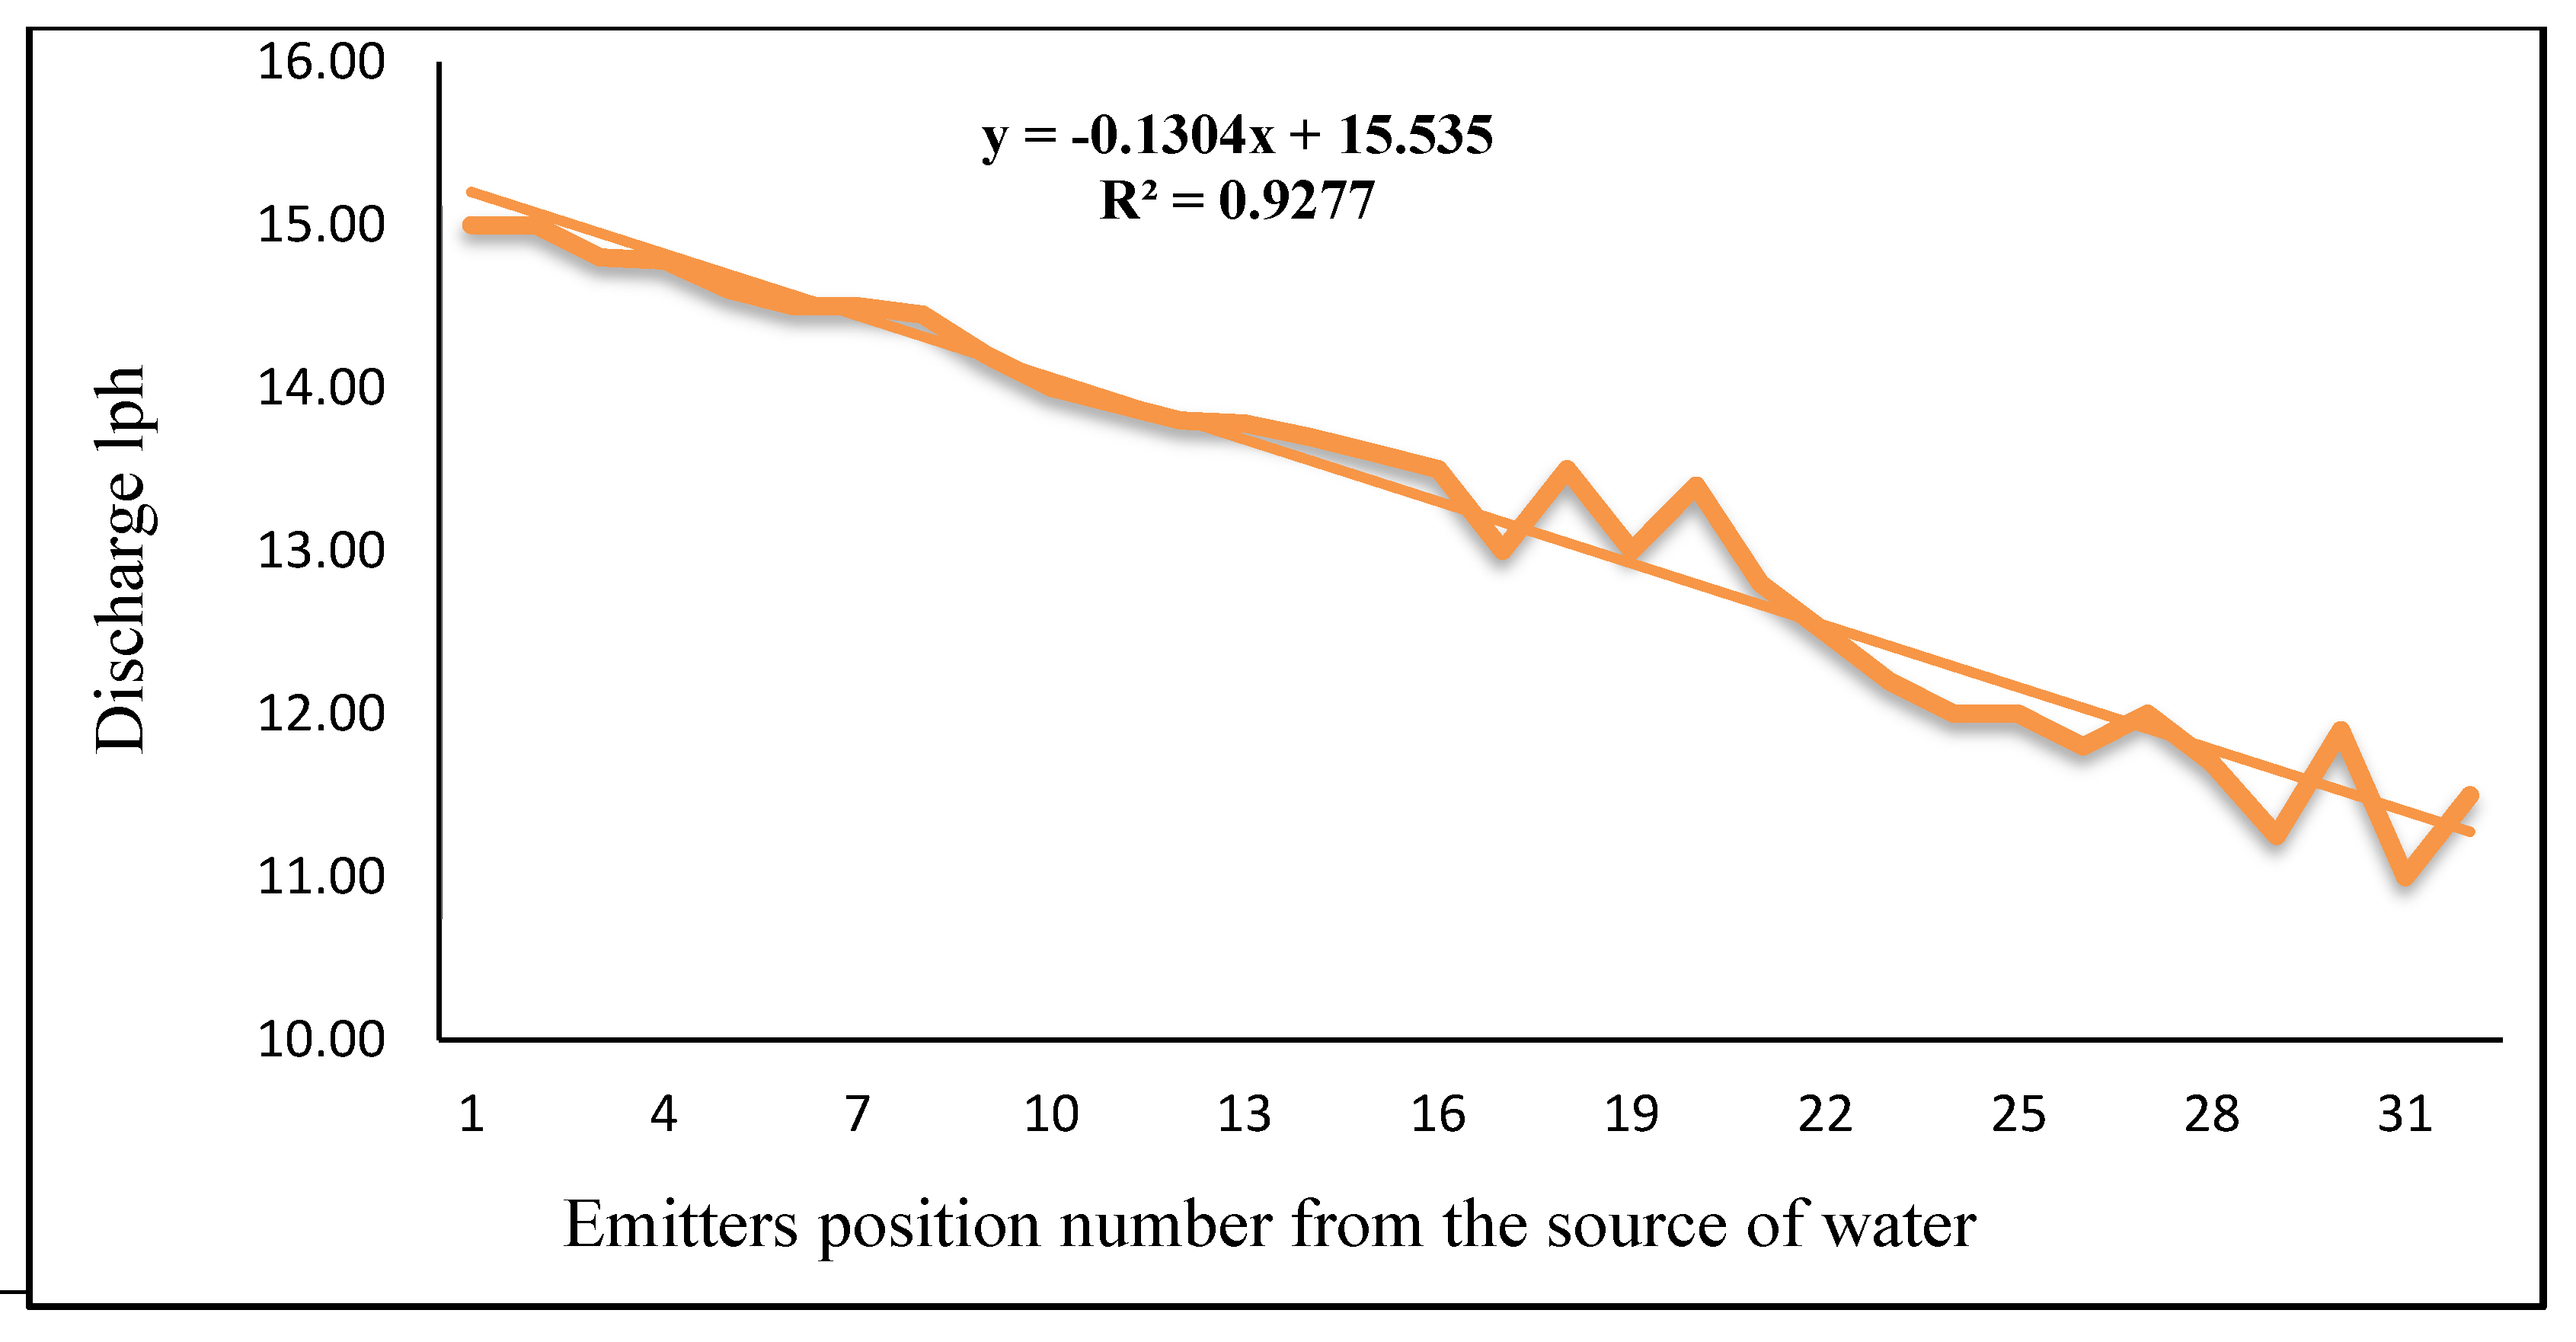
3.7. Irrigation Performance of Drip Irrigation System in URTA

In this study, a number of parameters are used to assess the performance of the drip irrigation system in URTA. The discharge, moisture content, distribution efficiency, application efficiency, field emission uniformity, emission uniformity, and absolute emission uniformity were considered to assess the performance of the drip irrigation system.
Figure 11a represents a P–P plot (probability–probability plot) of discharge of first, 1/3, 2/3, and the last number of an emitter of each line. The figure also displays that the emitters’ observed discharges are closely related to the expected discharge values which are statistically significant [55]. However, it has been found that the expected discharge is the same or near to the observed value. On the other hand, Figure 11b also represents the Q–Q plot of the moisture content probability plot, in which the resulting goodness of fit of the 45° line represents the difference between an observed and expected moisture content of soil and plant for the selected emitters in the URTA.
Figure 12 denotes that moisture content is dependent on discharge and the line patterns in the points indicate that a higher discharge from the emitters contains a higher moisture content, but some container emitters did not maintain these patterns due to soil texture or sunshine direction. The study also found that the average moisture content of the first, 1/3, 2/3, and last emitter of each of the wight rows was 34.62%, 31.95%, 30.35%, and 25.535%, respectively, for the 1st year experimental setup and 34.84%, 32.56%, 32.20% and 31.78% for the 2nd year experimental setup. On the other hand, the average discharge of the first, 1/3, 2/3, and last number emitter of each of the 8 rows were 15 lph, 13.94 lph, 12.78 lph, and 12.32 lph for the 1st-year experimental setup. Figure 13 indicates the discharge histogram of emitters with a standard deviation of emitter discharge of 1.27 lph, and mean discharge of 13.38 lph.
Figure 14 shows that the application efficiency of the drip irrigation system was 95.41% and 96% in the 1st and 2nd-year experimental setup. Distribution efficiency was 94.82% and 96% in the 1st year experiment and in the 2nd year experiment during the years 2018–2019 and 2019–2020, respectively. Similarly, the field emission uniformity values were 92.19% and 94% for the 1st year experiment and the 2nd year experiment during a similar year. Figure 14 also denotes that the absolute emission uniformity values of the emitter of the drip irrigation system in URTA were 89.94% and 91% for the1st year experiment and the 2nd year experiment during the years 2018–2019 and 2019–2020, respectively. Therefore, there are different parameters for field emission uniformity (EU), design emission uniformity (EUd), and application efficiency (EUa and Ea) of drip irrigation systems installed in all water sources, groundwater, rain, and greywater. So, the performance of the drip irrigation system in URTA is standard [59,60]. As per the above result, it is shown that the drip irrigation system operated excellently in URTA as the values of the EU were nearly equal or more than 90% in each case. A higher percentage indicates good performance of the drip irrigation system or acceptability for URTA. For the CV, the value was 0.094. This value indicates that the drip irrigation system showed average acceptance in URTA.

4. Conclusions

This study aimed to assess the performance of efficient irrigation techniques via irrigation water productivity of selected species in URTA, compared to the existing traditional irrigation method. The outcome of this study shows high efficiency in saving green water through increase of water productivity, as well as when using grey and rainwater for URTA. URTA in combination with a drip system, rainwater harvesting and use of grey water, in the end, would lead to savings in the valuable existing water supply, reducing the cooling effect of the urban heat island, enhancing ecological activity and environmental conditions on a roof top and promoting socio-economic activities including healthy recreation and improving nutritional enrichment of the urban population with a fresh food supply, etc. All the above mentioned activities might be considered as green adaptations towards achieving a green city in managing climate risk.
The research showed that the irrigation water requirement of different species of plants was different for URTA and was around 54% in excess of ETc, especially during the flowering and ripening stage. This study also found that a drip irrigation technique saved 46% to 64%, 56% to 75%, 30% to 57%, and 31% to 57% of the irrigation water requirement for production of BARI Tomato-3, BARI Bottle Gourd-3, BARI Brinjal-8, and Bogra Local Chili compared to the traditional irrigation water requirement. The study also found that 18.78% of irrigation water was saved by using a growing medium or container according to maximum root zone depth.
The results of this study revealed that the drip irrigation technique decreased the maximum rootzone depth of plants in the URTA by 25–33% compared to the traditional irrigation increases and applying more water than the DI system. However, the average seasonal yield for BARI Tomato-3, BARI Bottle Gourd-3, BARI Brinjal-8, and Bogra Red Chilies were increased by 42.86%, 22.40%, 16.67%, 62.50%, 21.43%, and 6.67%, respectively, by drip irrigation compared to the traditional container irrigation. Drip irrigation with rain and grey water was also found to increase the yield of BARI Tomato-3 by 31.87% and 33.33% compared to container and traditional pipe irrigation. The study also found that the average IWP in the winter season of the selected crops was 25.56% higher than in the summer season for URTA. The study also found that the yield was increased by 21.88% when applying grey and rainwater in comparison to potable water. The result indicated that the application efficiency, distribution efficiency, field emission uniformity, absolute emission uniformity, and co-efficient of variance were 95.41%, 94.82% 92.19%, 89.94%, and 0.094 for the drip system. Therefore, the performance of the drip irrigation system for URTA might be considered as standard and operational performance was excellent.
Green water use with drip irrigation technique opens the potential for unused open rooftop space to become creative useable spaces leading to many positive impacts upon many sectors, such as increase of irrigation water productivity, easy use and operation of URTA, decrease in the pressure of potable water supply in the city, increase of green activities, greener and cooler city rooftops, increase of supply of fresh agricultural products leading to a healthy environment, and huge climate dividends by reducing urban heat islands, if URTA is applied and encouraged by city corporations providing incentives such as tax rebates. It is expected that urban planners and decision-makers would recognize the importance of the use of both grey and rainwater in URTA and take necessary actions through city corporations to promote URTA in order to turn our city into a sustainable place in terms of environmental and socio-economic perspectives for city dwellers and the community.

Author Contributions

Conceptualization, M.S.B. and S.K.B.; methodology, M.S.B.; software, M.S.B.; validation, M.S.B. and S.K.B.; formal analysis, M.S.B.; investigation, resources, M.S.B.; S.K.B. and A.K.M.S.I.; data creation, M.S.B.; and writing original draft preparation, M.S.B.; writing review and editing, S.K.B., A.K.M.S.I., M.S.B.; visualization, M.S.B.; supervision, S.K.B.; project administration, M.S.B.; funding acquisition, M.S.B. All authors have read and agreed to the published version of the manuscript.

Funding

This research was partly funded by the research grant from Bangladesh University of Engineering and Technology (BUET).

Institutional Review Board Statement

Not applicable.

Informed Consent Statement

Not applicable.

Data Availability Statement

The data presented in this study are available on request from the corresponding author. The data are not publicly available due to privacy or ethical restrictions.

Acknowledgments

The authors thankfully acknowledge the support from the National Science and Technology (NST) fellowship from the Ministry of Science and Technology (MoST) of the Government of the People’s Republic of Bangladesh. The authors would also like to express special thanks to the authority of the Bangladesh Agricultural Development Corporation (BADC) and Institute of Water and Flood Management (IWFM), Bangladesh University of Engineering and Technology (BUET). The authors would also like to thank the anonymous reviewers for their constructive comments on improving this paper.

Conflicts of Interest

The authors declare no conflict of interest.

References

  1. Rashid, M.A.H.; Manzoor, M.M.; Mukter, S. Urbanization and Its Effects on Water Resources: An Exploratory Analysis. Asian J. Water Environ. Pollut. 2018, 15, 67–74. [Google Scholar] [CrossRef]
  2. Adeboye, O.B.; Schultz, B.; Adekalu, K.O.; Prasad, K. Crop Water Productivity and Economic Evaluation of Drip-Irrigated Soybeans (Glyxine max L. Merr.). Agric Food Secur. 2015, 4, 10. [Google Scholar] [CrossRef] [Green Version]
  3. Arfanuzzaman, M.; Rahman, A.A. Sustainable Water Demand Management in the Face of Rapid Urbanization and Ground Water Depletion for Social-Ecological Resilience Building. Int. J. Glob. Ecol. Conserv. 2017, 10, 9–22. [Google Scholar] [CrossRef]
  4. Ishtiaque, A.T.; Tasin, T.Z.; Akter, K.S. Urban Heat Island Intensity Assessment through Comparative Study on Land Surface Temperature and Normalized Difference Vegetation Index: A Case Study of Chittagong. Int. J. Urban Civ. Eng. 2017, 11, 37–42. [Google Scholar]
  5. Gohil, K.; Jin, M.S. Validation and Improvement of the WRF Building Environment Parametrization (BEP) Urban Scheme. Climate 2019, 7, 109. [Google Scholar] [CrossRef] [Green Version]
  6. Heusinger, J.; Sailor, D.J.; Weber, S. Modeling the Reducti on of Urban Excess Heat by Green Roofs with Respect to Different Irrigation Scenarios. Build Environ. 2018, 131, 174–183. [Google Scholar] [CrossRef]
  7. Begum, M.S.; Bala, S.K.; Islam, A.K.M.S.; Roy, D. Environmental and Social Dynamics of Urban Rooftop Agriculture (URTA) and Their Impacts on Microclimate Change. Sustainability 2021, 13, 9053. [Google Scholar] [CrossRef]
  8. Corburn, J. Cities, Climate Change, and Urban Heat Island Mitigation: Localizing Global Environmental Science. Urban Stud. 2009, 46, 413–427. [Google Scholar] [CrossRef]
  9. Mainuddin, M.; Kirby, M. National Food Security in Bangladesh to 2050. Food Sec. 2015, 7, 633–646. [Google Scholar] [CrossRef]
  10. United Nations. World Urbanization Prospects; The 2014 Revisions; Department of Economic and Social Affairs: Population Division, NY, USA, 2014; p. 27. [Google Scholar]
  11. Wang, H.; Liu, Y.; Zhang, G.; Wang, Y.; Zhao, J. Multi-Scenario Simulation of Urban Growth Under Integrated Urban Spatial Planning: A Case Study of Wuhan, China. Sustainability 2021, 13, 11279. [Google Scholar] [CrossRef]
  12. Zezza, A.; Tasciotti, L. Urban Agriculture, Poverty, and Food Security: Empirical Evidence from a Sample of Developing Countries. Food Policy 2010, 35, 265–273. [Google Scholar] [CrossRef]
  13. Gilliom, R.L.; Bell, C.D.; Hogue, T.S.; McCray, J.E. A Rainwater Harvesting Accounting Tool for Water Supply Availability in Colorado. Baseline Study on Rooftop Gardening in Dhaka and Chittagong city of Bangladesh, Final report, Food and Agriculture Organization, Bangladesh (2016). Water 2019, 11, 2205. [Google Scholar] [CrossRef]
  14. Zhang, S.; Rasool, G.; Guo, X.; Sen, L.; Cao, K. Effects of Different Irrigation Methods on Environmental Factors, Rice Production, and Water Use Efficiency. Water 2020, 12, 2239. [Google Scholar] [CrossRef]
  15. Rahman, M.M.; Quayum, S. Sustainable Water Supply in Dhaka City: Present and Future; Research Gate, Conference Paper; The Japan Science and Technology Agency: Bangkok, Thailand, 2008. [Google Scholar]
  16. Loux, J.; Skonovd, R.W.; Gellerman, E. Evaluation of Combined Rainwater and Greywater Systems for Multiple Development Types in Mediterranean climates. J. Water Sustain. 2012, 2, 55–77. [Google Scholar]
  17. Lupia, F.; Baiocchi, V.; Lelo, K.; Pulighe, G. Exploring Rooftop Rainwater Harvesting Potential for Food Production in Urban Areas. Agriculture 2017, 7, 1–17. [Google Scholar] [CrossRef] [Green Version]
  18. Chukalla, A.D.; Krol, M.S.; Hoekstra, A.Y. Green and Blue Water Footprint Reduction in Irrigated Agriculture: Effect of Irrigation Techniques, Irrigation Strategies and Mulching. Hydrol. Earth Syst. Sci. 2015, 19, 4877–4891. [Google Scholar] [CrossRef] [Green Version]
  19. FAO. Rooftop Water Collection, Drip Irrigation and Plastic Mulching in Home Garden Conditions in Drought Prone Areas of Cambodia; Food and Agriculture Organization of the United Nations: Rome, Italy, 2017; pp. 1–14. [Google Scholar]
  20. Uddin, M.J.; Khondaker, N.A.; Das, A.K.; Hossain, M.E.; Masud, A.D.H.; Chakma, A.S.; Nabila, N.A.; Saikat, M.I.; Chowdhury, A.A. Baseline Study On Roof Top Gardening in Dhaka and Chittagong City Of Bangladesh Enhancing Urban Horticulture Production to Improve Baseline Study on Roof Top Gardening in Dhaka Enhancing Urban Horticulture Production to Improve Food and Nutrition Security; FAO Representation: DHAKA, Bangladesh, 2016. [Google Scholar]
  21. Lupia, F.; Pulighe, G. Water Use and Urban Agriculture: Estimation and Water Saving Scenarios for Residential Kitchen Gardens. Agric. Agric. Sci. Procedia 2015, 4, 50–58. [Google Scholar] [CrossRef] [Green Version]
  22. Kanamu, J.K. The Effect of Irrigation Management on Crop Water Requirement and Crop Water Productivity of Tomato and Sweet Corn in Kibwezi, Kenya. Ph.D. Thesis, University of Nairobi, Nairobi, Kenya, 2009. [Google Scholar]
  23. Nasir, J.; Ashfaq, M.; Baig, I.A.; Punthakey, J.F.; Culas, R.; Ali, A.; Hassan, F.U. Socioeconomic Impact Assessment of Water Resources Conservation and Management to Protect Groundwater in Punjab, Pakistan. Water 2021, 13, 2672. [Google Scholar] [CrossRef]
  24. Russo, T.; Alfredo, K.; Fisher, J. Sustainable Water Management in Urban, Agricultural, and Natural Systems. Water 2014, 6, 3934–3956. [Google Scholar] [CrossRef] [Green Version]
  25. Salama, M.A.A. Estimating Water Consumptive Use for Some Crops under Stress Conditions Using Neutron Scattering in Agricultural Science (Soil Science) Estimating Water Consumptive Use for Some Crops under Stress Conditions Using Neutron Scattering; International Atomic Energy Agency (IAEA): Vienna, Austria, 2011. [Google Scholar]
  26. Birol, E.; Karousakis, K.; Koundouri, P. Using Economic Valuation Techniques to Inform Water Resources Management: A Survey and Critical Appraisal of Available Techniques and an Application. Sci. Total Environ. 2006, 365, 105–122, 2006. [Google Scholar] [CrossRef] [PubMed]
  27. Döll, P.; Hoffmann-Dobrev, H.; Portmann, F.T.; Siebert, S.; Eicker, A.; Rodell, M.; Strassberg, G.; Scanlon, B.R. Impact of Water Withdrawals from Groundwater and Surface Water on Continental Water Storage Variations. J. Geodyn. 2012, 59, 143–156. [Google Scholar] [CrossRef]
  28. FAO. Baseline Study on Rooftop Gardening in Dhaka and Chittagong City of Bangladesh; Final Report; Food and Agriculture Organization: Dhaka, Bangladesh, 2016. [Google Scholar]
  29. Aiello, R.; Cirelli, G.L.; Consoli, S. Effects of Reclaimed Waste Water Irrigation on Soil and Tomato Fruits: A Case Study in Sicily (Italy). Agric. Water Manag. 2007, 93, 65–72. [Google Scholar] [CrossRef]
  30. Martin, G.; Clift, R.; Christie, I. Urban Cultivation and Its Contributions to Sustainability: Nibbles of Food But Oodles of Social Capital. Int. J. Sustain. 2016, 8, 409. [Google Scholar] [CrossRef] [Green Version]
  31. Molden, D.; Oweis, T.; Steduto, P.; Bindraban, P.; Hanjra, M.A.; Kijne, J. Improving Agricultural Water Productivity: Between Optimism and Caution. Agric. Water Manag. 2010, 97, 528–535. [Google Scholar] [CrossRef]
  32. Wang, F.X.; Wu, X.X.; Shock, C.C.; Chu, L.Y.; Gu, X.X.; Xue, X. Effects of Drip Irrigation Regimes on Potato Tuber Yield and Quality under Plastic Mulch in Arid Northwestern China. Field Crop. Res. 2011, 122, 78–84. [Google Scholar] [CrossRef]
  33. Arya1, C.K.; Purohit, R.C.; Dashora, L.K.; Singh, P.K.; Kothari, M. Performance Evaluation of Drip Irrigation Systems. Int. J. Curr. Microbiol. Appl. Sci. 2017, 6, 2287–2292. [Google Scholar]
  34. Venot, J.P. A Success of Some Sort: Social Enterprises and Drip Irrigation in the Developing World. World Dev. 2016, 79, 69–81. [Google Scholar] [CrossRef]
  35. Payero, J.O.; Tarkalson, D.D.; Irmak, S.; Davison, D.; Petersen, J.L. Effect of Irrigation Amounts Applied with Subsurface Drip Irrigation on Corn Evapotranspiration, Yield, Water Use Efficiency, and Dry Matter Production in a Semiarid Climate. Agric. Water Manag. 2008, 95, 895–908. [Google Scholar] [CrossRef] [Green Version]
  36. Merriam, J.L. Irrigation Performance Measures: Efficiency and Uniformity. J. Irrig. Drain. Eng. 1999, 125, 100–103. [Google Scholar] [CrossRef]
  37. Martínez, J.; Reca, J. Water Use Efficiency of Surface Drip Irrigation Versus an Alternative Subsurface Drip Irrigation Method. J. Irrig. Drain. Eng. 2014, 140, 1–9. [Google Scholar] [CrossRef]
  38. Yang, L.I.U.; YANG, H.S.; LI, J.S.; LI, Y.F.; YAN, H.J. Estimation of irrigation requirements for drip-irrigated maize in a sub-humid climate. J. Integr. Agric. 2018, 17, 677–692. [Google Scholar] [CrossRef]
  39. Al-Mhmdy, S.M.; Al-Dulaimy, S.E.H. Performance Evaluation of Drip Irrigation System According To The Suggested Standards. Iraqi J. Agric. Sci. 2018, 49, 1099–1109. [Google Scholar]
  40. Parameshwarareddy, R.; Angadi, S.S.; Biradar, M.S.; Patil, R.H. Water Productivity of Tomato as Influenced by Drip Irrigation Levels and Substrates. J. Pharmacogn. Phytochem. 2018, 7, 1343–1346. [Google Scholar]
  41. Soulis, K.X.; Elmaloglou, S.; Dercas, N. Investigating the Effects of Soil Moisture Sensors Positioning and Accuracy on Soil Moisture-Based Drip Irrigation Scheduling Systems. Agric. Water Manag. 2015, 148, 258–268. [Google Scholar] [CrossRef]
  42. BARI. Krishi Projukti Hat Boi (Handbook on Argo-Technology), 7th ed.; Bangladesh Agricultural Research Institute: Gazipur, Bangladesh, 2017. [Google Scholar]
  43. Compton, M.E. Statistical Methods Suitable for the Analysis of Plant Tissue Culture Data. Plant Cell Tiss Organ Cult 1994, 37, 217–242. [Google Scholar] [CrossRef]
  44. Kargas, G.; Soulis, K.X. Performance Evaluation of a Recently Developed Soil Water Content, Dielectric Permittivity, and Bulk Electrical Conductivity Electromagnetic Sensor. Agric. Water Manag. 2019, 213, 568–579. [Google Scholar] [CrossRef]
  45. Elbeltagi, A.; Deng, J.; Wang, K.; Malik, A.; Maroufpoor, S. Modeling Long-Term Dynamics of Crop Evapotranspiration Using Deep Learning in a Semi-Arid Environment. Agric. Water Manag. 2020, 241, 106334. [Google Scholar] [CrossRef]
  46. Cai, J.; Liu, Y.; Lei, T.; Pereira, L.S. Estimating Reference Evapotranspiration with the FAO Penman–Monteith Equation Using Daily Weather Forecast Messages. Agric. For. Meteorol. 2007, 145, 22–35. [Google Scholar] [CrossRef]
  47. Heermann, D.F.; Wallender, W.W.; Bos, M.G. Irrigation Efficiency and Uniformity. In Management of Farm Irrigation Systems; Hoffman, G.J., Howell, T.A., Solomon, K.H., Eds.; American Society of Agricultural Engineers: St. Joseph, MI, USA, 1990. [Google Scholar]
  48. Grun, P.; Hefty, S.; Sur, S.; Goodell, D.; Russel, R.D.; Pritchard, H. A Brief Introduction to the Open Fabrics Interfaces-A New Network API for Maximizing High Performance Application Efficiency. In Proceedings of the 2015 IEEE 23rd Annual Symposium on High-Performance Interconnects, Santa Clara, CA, USA, 26–28 August 2015; pp. 34–39. [Google Scholar] [CrossRef]
  49. Koech, R.; Langat, P. Improving Irrigation Water Use Efficiency: A Review of Advances, Challenges and Opportunities in the Australian Context. Water 2018, 10, 1771. [Google Scholar] [CrossRef]
  50. Li, Y.; Li, Z.; Cui, S.; Zhang, Q. Trade-Off between Soil pH, Bulk Density and Other Soil Physical Properties under Global No-tillage Agriculture. Geoderma 2020, 361, 114099. [Google Scholar] [CrossRef]
  51. Chimonyo, V.G.P.; Modi, A.T. Seed Performance of Selected Bottle Gourd (Lagenaria siceraria (Molina) Standl.). J. Exp. Agric. Int. 2013, 3, 740–766. [Google Scholar] [CrossRef] [Green Version]
  52. Begum, S.; Akhand, A.A.; Roy, D. Contamination of Agricultural Land by Arsenic from Irrugated Water. In Proceedings of the 4th International Conference on Water and Flood Management (ICWFM 2013), Dhaka, Bangladesh, 9–11 March 2013. [Google Scholar]
  53. Reyes-Cabrera, J.; Zotarelli, L.; Dukes, M.D.; Rowland, D.L.; Sargent, S.A. Soil Moisture Distribution under Drip Irrigation and Seepage for Potato Production. Agric. Water Manag. 2016, 169, 183–192. [Google Scholar] [CrossRef] [Green Version]
  54. Theivasigammi, P.; Kothan, V.; Mohandas, S.; Vered, E. Evaluation of Drip Irrigation System for Water Productivity and Yield of Rice. Agron. J. 2018, 110, 2378–2389. [Google Scholar]
  55. Maris, S.C.; Teira-Esmatges, M.R.; Arbonés, A.; Rufat, J. Effect of Irrigation, Nitrogen Application, and a Nitrification Inhibitor on Nitrous Oxide, Carbon Dioxide and Methane Emissions from an Olive (Olea europaea L.) Orchard. Sci. Total Environ. 2015, 538, 966–978. [Google Scholar] [CrossRef] [PubMed]
  56. Levidow, L.; Zaccaria, D.; Maia, R.; Vivas, E.; Todovic, M.; Mladen, T.M.; Scardigno, A. Improving Water-Efficient Irrigation: Prospects and Difficulties of Innovative Practices. Agric. Water Manag. 2014, 146, 84–94. [Google Scholar] [CrossRef] [Green Version]
  57. Yaghi, T.; Arslan, A.; Naoum, F. Cucumber (Cucumis sativus, L.) Water Use Efficiency (WUE) under Plastic Mulch and Drip Irrigation. Agric. Water Manag. 2013, 128, 149–157. [Google Scholar] [CrossRef] [Green Version]
  58. Danso, E.O.; Abenney-Mickson, S.; Sabi, E.B.; Plauborg, F.; Abekoe, M.; Kugblenu, Y.O.; Jensen, C.R.; Andersen, M.N. Effect of Different Fertilization and Irrigation Methods on Nitrogen Uptake, Intercepted Radiation and Yield of Okra (Abelmoschus Esculentum L.) Grown in the Keta Sand Spit of Southeast Ghana. Agric. Water Manag. 2015, 147, 34–42. [Google Scholar] [CrossRef]
  59. Ortega-Reig, M.; SanchisIbor, C.; Palau-Salvador, G.; García-Mollá, M.; Avellá-Reus, L. Institutional and Management Implications of Drip Irrigation Introduction in Collective Irrigation Systems in Spain. Agric. Water Manag. 2017, 187, 164–172. [Google Scholar] [CrossRef]
  60. Wu, Y.; Yan, S.; Fan, J.; Zhang, F.; Xiang, Y.; Zheng, J.; Guo, J. Responses of growth, fruit yield, quality and water productivity of greenhouse tomato to deficit drip irrigation. Sci. Hortic. 2021, 275, 109710. [Google Scholar] [CrossRef]
Figure 1. (a) Dhaka district map with base map; (b) Experimental plot (rooftop); (c) Implementation scenario of Experiment (URTA).
Water 14 00007 g001
Figure 2. Drip irrigation setup n the experimental plots: (a) ground water source; (b) rainwater and grey water source.
Water 14 00007 g002aWater 14 00007 g002b
Figure 3. The yield scenario of (a) BARI Tomato-3, (b) BARI Brinjal-8, (c) Bogra Local Chili, and (d) BARI Bottlegourd-3 in the experimental URTA.
Water 14 00007 g003
Figure 4. (a) Average near roof surface temperature and near land temperature variation; (b) Roof surface temperature variation in experimental agricultural roof and bare roof; (c) Air temperature variation at 1.5 m height in agricultural roof and bare roof from December 2018 to May 2019.
Water 14 00007 g004aWater 14 00007 g004b
Figure 5. Irrigation water requirement at different stages of Bottle gourd, Tomato, Brinjal and Chili with drip irrigation and traditional irrigation (container, pipe with shower).
Water 14 00007 g005
Figure 6. Percentage of water-saving compared to traditional irrigation approaches.
Water 14 00007 g006
Figure 7. Moisture content (%) at 15 cm depth before and after irrigation: (a) Drip irrigation (b) Traditional Irrigation.
Water 14 00007 g007
Figure 8. Maximum rootzone depth of selected crops in URTA with drip irrigation and traditional irrigation.
Water 14 00007 g008
Figure 9. Yield of selected crops in URTA during drip irrigation and traditional irrigation (container and pipe).
Water 14 00007 g009
Figure 10. Irrigation water productivity of selected crops in URTA with drip irrigation and traditional irrigation (container and pipe) method.
Water 14 00007 g010
Figure 11. (a) Normal P–P plot of observed and expected discharge (lph); (b) Normal Q–Q plot of observed and expected moisture content (%).
Water 14 00007 g011
Figure 12. One-way ANOVA mean discharge (lph) by moisture content (%).
Water 14 00007 g012
Figure 13. Discharge variation of selected emitters of the drip irrigation system in URTA.
Water 14 00007 g013
Figure 14. Performance parameters of drip irrigation system.
Water 14 00007 g014
Table 1. Irrigation water quality of grey and rainwater mix.
Sample Collecting DatepHEC
(µs/cm)
TDS
(mg/L)
As
(ppb)
Fe
(mg/L)
Cl
(mg/L)
Na
(meq/L)
Total Alkalinity
(mg/L)
Total Hardness
(mg/L)
NO3_N
(mg/L)
PO4
(mg/L)
SO4
(mg/L)
7 October 20197.982641300.01851.0028020001.8752
17 October 20197.865831100801.9826018502.370
14 November 20197.4912457001603.7234026460.850
30 November 20197.4914470001121.3032013640.695
15 January 20207.7736368001001.0030022030.260
2 February 20207.482341300851.2024010540.690
17 February 20207.982639800881.0032023030.480
3 March 20207.673842000951.4028018050.660
20 March 20207.262331100861.2027015340.890
Table 2. Physical and chemical characteristics of growing medium (Soil).
Item NameValue in (%)
Moisture content of soil before adding water19.80%
Moisture content of wet soil or field capacity of soil33.58%
Soil textureSilt loam (sand-9%, silt-78% and clay-13%)
pH of soilStrongly acidic (5.5)
Organic matterLow (1.40%)
Total Nitrogen (N)Very low (0.070%)
Potassium (K)1.32 meq/100 g soil (very high)
Calcium (Ca)7.32 meq/100 g soil (very high)
Magnesium (Mg)7.00 meq/100 g soil (very high)
Phosphorus (P)78.93 µg/g (ppm) (very high)
Sulphur (S)143.89 µg/g (ppm) (very high)
Boron (B)0.77 µg/g (ppm) (very high)
Copper©2.28 µg/g (ppm) (very high)
Iron (I)45.16 µg/g (ppm)
Manganese (Mn)13.29 µg/g (ppm) (very high)
Zink (Z)4.47 µg/g (ppm) (very high)
Bulk density of prepared soil1.04 gm/cm3
Note: meq, µg, and ppm represents the milliequivalent, microgram, and parts per million respectively.
Table 3. The average moisture content of soil at different depths in the container during, before and after irrigation (from the top of the container).
Crop’s NameThe Moisture Content before Irrigation (%)The Moisture Content after Irrigation (%)
5 cm15 cm30 cm45 cmTop15 cm30 cm45 cm
Bottle Gourd26.3232019.930.825.322.520.32
BARI Tomato 328.220212031.3426.42422
BARI Hybrid Brinjal26.422201931.526.82119
Bogra local chili26.72221213328.52522
Table 4. Kc values of BARI bottlegourd-3, BARI Tomato-3, BARI Brinjal-8 and Bogra Local Chili.
StageKCb KCbrKCtKCch
Initial stage0.70.420.460.3
Vegetative1.50.80.830.6
Flowering stage1.71.31.080.95
Ripening stage1.40.930.860.8
Note: KCb, KCbr, KCt, and KCch represent the crop co-efficient of Bottle Gourd, Brinjal, Tomato and Chili, respectively.
Table 5. Rainfall (mm) and Evapotranspiration (ETo) in mm/day of the experimental plot’s location.
MonthRainfall (mm)Eto (mm/day)
November203.71
December102.58
January-3.01
February453.61
March454.83
April2155.89
May2956.49
Table 6. Growth stages and irrigation water requirement (IWR) in mm.
Stage IWR (mm) for Rooftop Agriculture
BARI Tomato-3BARI Bottle Gourd-3BARI Brinjal-8Bogra Local Chili
DITI
(Pipe)
TI
(Container)
DITI
(Pipe)
TI
(Container)
DITI
(Pipe)
TI
(Container)
DITI
(Pipe)
TI
(Container)
Initial 7614595941851406810012063121106
Vegetative125350180245578220153200450125285161
Flowering 2365203203369656004716008604161020641
Ripening 2901000750419268015003616001000186450241
Total7262015134510934408246010531500243079018751148
Total IWR for land according to BARI350–425 mm320–350 mm361 mm290–340 mm
Table 7. Average yield and irrigation water requirements of BARI Tomato-3, BARI Bottlegourd-3, BARI Brinjal-8 and Bogra Red Chili.
Exp. StatusName of CropsSource of WaterDrip IrrigationTraditional Method
Average Yield/Plant (kg)Total Irrigation Water Used (mm)Average Yield/Plant (kg)Total Irrigation Water Used/Plant (mm) by ContainerTotal Irrigation Water Used (mm) by Pipe and Pipe with Shower
1st_year experimentWinter seasonBARI Tomato-3Ground water2.357261.9213452015
BARI Bringle-82.110531.815002430
BARI Bottle Gourd-36.510933.524604408
Bogra Red Chili0.657900.411481875
Summer seasonBARI Tomato-40.855110.7721946
BARI Bottle Gourd-44.810134.512461579
2nd_year experiment Winter seasonBARI Tomato-3Green water2.46121.81024.641434
Publisher’s Note: MDPI stays neutral with regard to jurisdictional claims in published maps and institutional affiliations.

