
Proximity to Riparian Wetlands Increases Mercury Burden in Fish in the Upper St. Lawrence River
by
 , and
, and
Autumn Osgood
1, 
Evie S. Brahmstedt
1,
Matthew J.S. Windle
2,
Thomas M. Holsen
3 and
Michael R. Twiss
4,* 1
Institute for a Sustainable Environment, Clarkson University, Potsdam, NY 13699, USA
2
St. Lawrence River Institute of Environmental Sciences, Cornwall, ON K6H 4Z, Canada
3
Department of Civil & Environmental Engineering, Clarkson University, Potsdam, NY 13699, USA
4
Department of Biology, Clarkson University, Potsdam, NY 13699, USA
*
Author to whom correspondence should be addressed.
Water 2022, 14(1), 70; https://doi.org/10.3390/w14010070
Submission received: 27 November 2021
/
Revised: 11 December 2021
/
Accepted: 28 December 2021
/
Published: 1 January 2022
(This article belongs to the Special Issue Climate Change and Water Levels in the Great Lakes)
Abstract
:Mercury deposited in the Upper St. Lawrence River watershed by atmospheric deposition accumulated in riparian wetlands and is at risk of remobilization due to water level fluctuations. To examine if riparian wetlands are a source of mercury to fish, 174 yellow perch (Perca flavescens) and 145 round gobies (Neogobius melanostomus) were collected in 2019 from eight wetland and seven non-wetland habitats throughout the Upper St. Lawrence River. Mercury levels were significantly (p < 0.01) higher in fish collected from wetlands than those collected from non-wetland habitats for both yellow perch and round goby. Perch had mercury concentrations of 74.5 ± 35.4 ng/g dry wt in wetlands compared to 59.9 ± 23.0 ng/g dry wt in non-wetlands. Goby had mercury concentrations of 55.4 ± 13.8 ng/g dry wt in wetlands and non-wetland concentrations of 41.0 ± 14.0 ng/g dry wt. Riparian wetlands are areas of elevated mercury methylation and mobilization in the Upper St. Lawrence River and consequences to predators should be considered from the perspective of both wildlife preservation as well as fish consumption advisories for public health concerns.
1. Introduction
The St. Lawrence Seaway allowed an increased opportunity for abundant hydropower production and transcontinental trade into the United States and Canada by connecting the American Great Lakes to the Atlantic Ocean. However, the construction of the Moses-Saunders hydropower dam (1958) and the St. Lawrence Seaway (1959) on the Upper St. Lawrence River had unforeseen consequences. Prior to the construction of the dam, water levels fluctuated naturally with season- and decadal-scale climate variability. However, the construction of the dam maintained stable water levels in the Upper St. Lawrence River. These stable water levels led to the loss of biodiversity, caused by competition from native and invasive Typha species [1].
In response to the negative ecological repercussions from stable water levels, a five-year study to examine the health of the wetlands and expected benefits and costs in varying water level conditions was conducted by the International Joint Commission [2]. Their results led to the creation of Plan 2014, a revision of the original water level management protocol, Plan-1958DD [2]. Plan 2014 was enacted so water levels may more closely reflect the natural water level fluctuations that existed before the construction of the dam in 1958, all the while continuing to moderate extreme high and low water levels as imposed through Plan-1958DD [2]. Natural water fluctuations are expected to return wetland health and diversity to their pre-1958 state, as expected in a natural system and in alignment with the intermediate disturbance hypothesis [3]. However, there is the possibility that the new regulation plan may increase the mobilization of legacy mercury in riparian wetlands into the aquatic food chain in the Upper St. Lawrence River [4].
Mercury deposited in the region of the Upper St. Lawrence River (USLR) originates largely from coal-fired power plants in North America [5]. Mercury deposition is decreasing in most forms and in most locations in the United States [5], yet the ubiquity of mercury as a contaminant in the landscape is an ongoing threat requiring ongoing research to understand the threat it poses [6]. The deposition of atmospheric mercury in New York State is well documented [7,8,9]. Peak deposition of mercury occurred in the United States in the 1950s and 1960s during a period in which water levels had low inter-annual variability on the USLR [10]. Areas of high mercury contamination are not always reflected in greater concentrations in fish and other biota [11,12,13], suggesting that legacy mercury may not always be bioavailable for the higher food web.
Wetlands are linked to increases in mercury bioavailability in the landscape [14,15]. In the Adirondack Mountain region of New York State, a known regional mercury hotspot [16], wetlands are sources of bioavailable methylmercury [17,18,19]. Fluctuating anoxic and oxic conditions abound in wetlands, which experience repeated cycles of wetting and drying. Snodgrass et al. [20] observed that the wetland hydroperiod played a large role in regulating mercury bioavailability in wetlands. The conversion of inorganic mercury compounds into methylated mercury under anoxic conditions is known to occur through activities of sulfate-reducing bacteria [21], manganese- and iron-reducing bacteria [22], and some Archaea [23]. Upper St. Lawrence River wetland soils contained all three known clades of mercury methylating Bacteria, indicating the potential to convert the mercury into bioavailable methylmercury [4]. Therefore, given the potential for wetlands to mobilize mercury into the food chain, research is needed to determine the relationship between mercury bioaccumulation in fish and habitat selection.
The objective of this study is to examine the concept of riparian wetlands as mercury mobilization hotspots. This objective has a direct bearing on the potential threat of water level fluctuations on mercury mobilization in the Upper St. Lawrence River. Yellow perch (Perca flavescens) and round goby (Neogobius melanostomus) were selected for this study since they inhabit nearshore waters adjacent to wetlands and areas without wetlands. Yellow perch are common to mercury bioaccumulation research [24,25,26] and are consumed by many animals including humans. Round gobies have a high site fidelity [27] and are an aquatic invasive species (AIS) in North America [28], thus making them a good candidate to function as a biomonitor. We hypothesized that yellow perch and round goby living in waters in proximity to riparian wetlands will have higher mercury burdens compared to the same species of fish inhabiting nearshore zones that have no adjacent riparian wetlands.
2. Materials and Methods
2.1. Site Selection, Fish Sampling, and Sample Preparation
Fish were sampled between 18 August and 28 October 2019 in the nearshore of the Upper St. Lawrence River adjacent to 8 wetlands and 7 non-wetland sites (Figure 1). The sample sites were located along a 157 km linear stretch of the USLR (Figure 1). Distances between contrasting sites (wetland vs. non-wetland) were measured in Google Earth Pro 7.3.4.8248 (64-bit) and compared to ensure the likely minimal to no movement of fish among sites. Rules for determining distances among sites were as follows: (1) Sites being compared must be on the same contiguous shoreline, assuming that the young fish will not be crossing the main channel, which has been shown to be a distinct water mass [29], to nearby islands; (2) sites on islands without any sites on the same contiguous island or nearby island separated by shallow water were not compared to other sites given the assumption (1) above; (3) straight lines were used when possible, but exceptions were made for peninsulas where a conservative number of straight lines were used to estimate distance traveled around the land feature. Details of site delineation are found in the associated electronic database (https://data.mendeley.com/datasets/tchh2k8gkm/1, accessed on 31 December 2021).
The longest distance between wetland and non-wetland sites was 79 km and the shortest was 3.6 km. Two wetland and non-wetland sites compared were approximately 4 km apart from each other, but in both cases, sites were judged to be distinct due to existing physical barriers (see electronic appendix: https://doi.org/10.17632/tchh2k8gkm.1, accessed on 31 December 2021). The shoreline riparian zone in wetland sites was categorized as marsh, meadow, emergent cattails, or cultivated. The overwhelming shoreline categorization was natural, with two wetlands categorized as having maintained shoreline. The riparian zone of non-wetland sites was cultivated, with one composed of deciduous forest.
Fish were collected by hand using a 9.5 m × 1.8 m bag seine net with a mesh size of 6.4 mm. The seine net method consisted of 3–5 hauls per site. The number of hauls was dependent upon how many samples were collected in the first haul. Sample areas were selected by accessibility from shore and maneuverability of the seine net.
Lethal methods were employed by cutting the brain cavity of the fish with a stainless-steel knife or flicking the anterior end until death. Collected fish were identified, counted, and measured for total length. Yellow perch and round goby were separated into polyethylene bags (Whirl-Pak) and placed in a cooler until returning to the laboratory where they were frozen (−20 °C) until future processing and analysis. Up to 25 individuals of each species per site were collected for determining Hg content. Sample selection was conducted at random, although fish < 1 cm were released due to their size not being suitable for determining species accurately.
Fish collection permits were obtained from the Ontario Ministry of Natural Resources and Forestry (OMNRF: License Number 1092933).
2.2. Mercury Analysis
Fish individuals were homogenized in a stainless-steel blender after being measured for length. Homogenized tissue from entire individual fish was analyzed for mercury using the DMA-80 Direct Mercury Analyzer (Milestone Srl, Bergamo, Italy). The operating procedure developed was based upon the mercury analysis component of EPA Method 7473. DOLT-5 dogfish liver standard reference material from National Research Council Canada (440 ± 180 ng/g Hg; percent recovery 83.4%) was used in each sample batch in duplicate. Samples were run in duplicate weighing between 0.09 and 0.1 g. The relative standard deviation (RSD) of samples ranged from 0.01–53.5% with an average RSD of 9.06%.
Dry weight calculations were performed by drying two replicates of each sample at 60 °C in a drying oven. Samples were analyzed in wet weight. Results were converted after Hg analysis of wet tissue on the basis of dry weight and reported as Hg per unit dry biomass.
2.3. Summary of Statistical Methods
Each fish species was separated into two groups: Fish caught adjacent to wetlands and fish caught in areas with no adjacent wetlands. A Welch Two-Sample t-test was completed to determine if there is a significant statistical difference between the two groups in length. Measures of length are related to the age of the fish and prey selection (predator fitness). A one-way analysis of covariance (ANCOVA) was conducted to strengthen the confidence of the results by examining the influence of the independent variable of habitat type (wetland or non-wetland) to the dependent variable of mercury content while accounting for the covariate factor of fish size, within a species.
The datasets for both species, regarding [Hg] and length, failed the Shapiro–Wilk normality test (p < 0.05), signifying that the dataset is not well modeled by a normal distribution. Although the test for normality failed for mercury content, yellow perch and round goby passed the equal variance test, indicating the variance within the samples is approximately the same throughout all samples. Both species also passed the equal slopes test, which verified the assumption that the covariate (length) did not significantly affect the treatment variable, [Hg]. The Shapiro–Wilk normality test is not of extreme concern since the ANCOVA is still robust as both the Levene test and the equal slopes test passed.
3. Results & Discussion
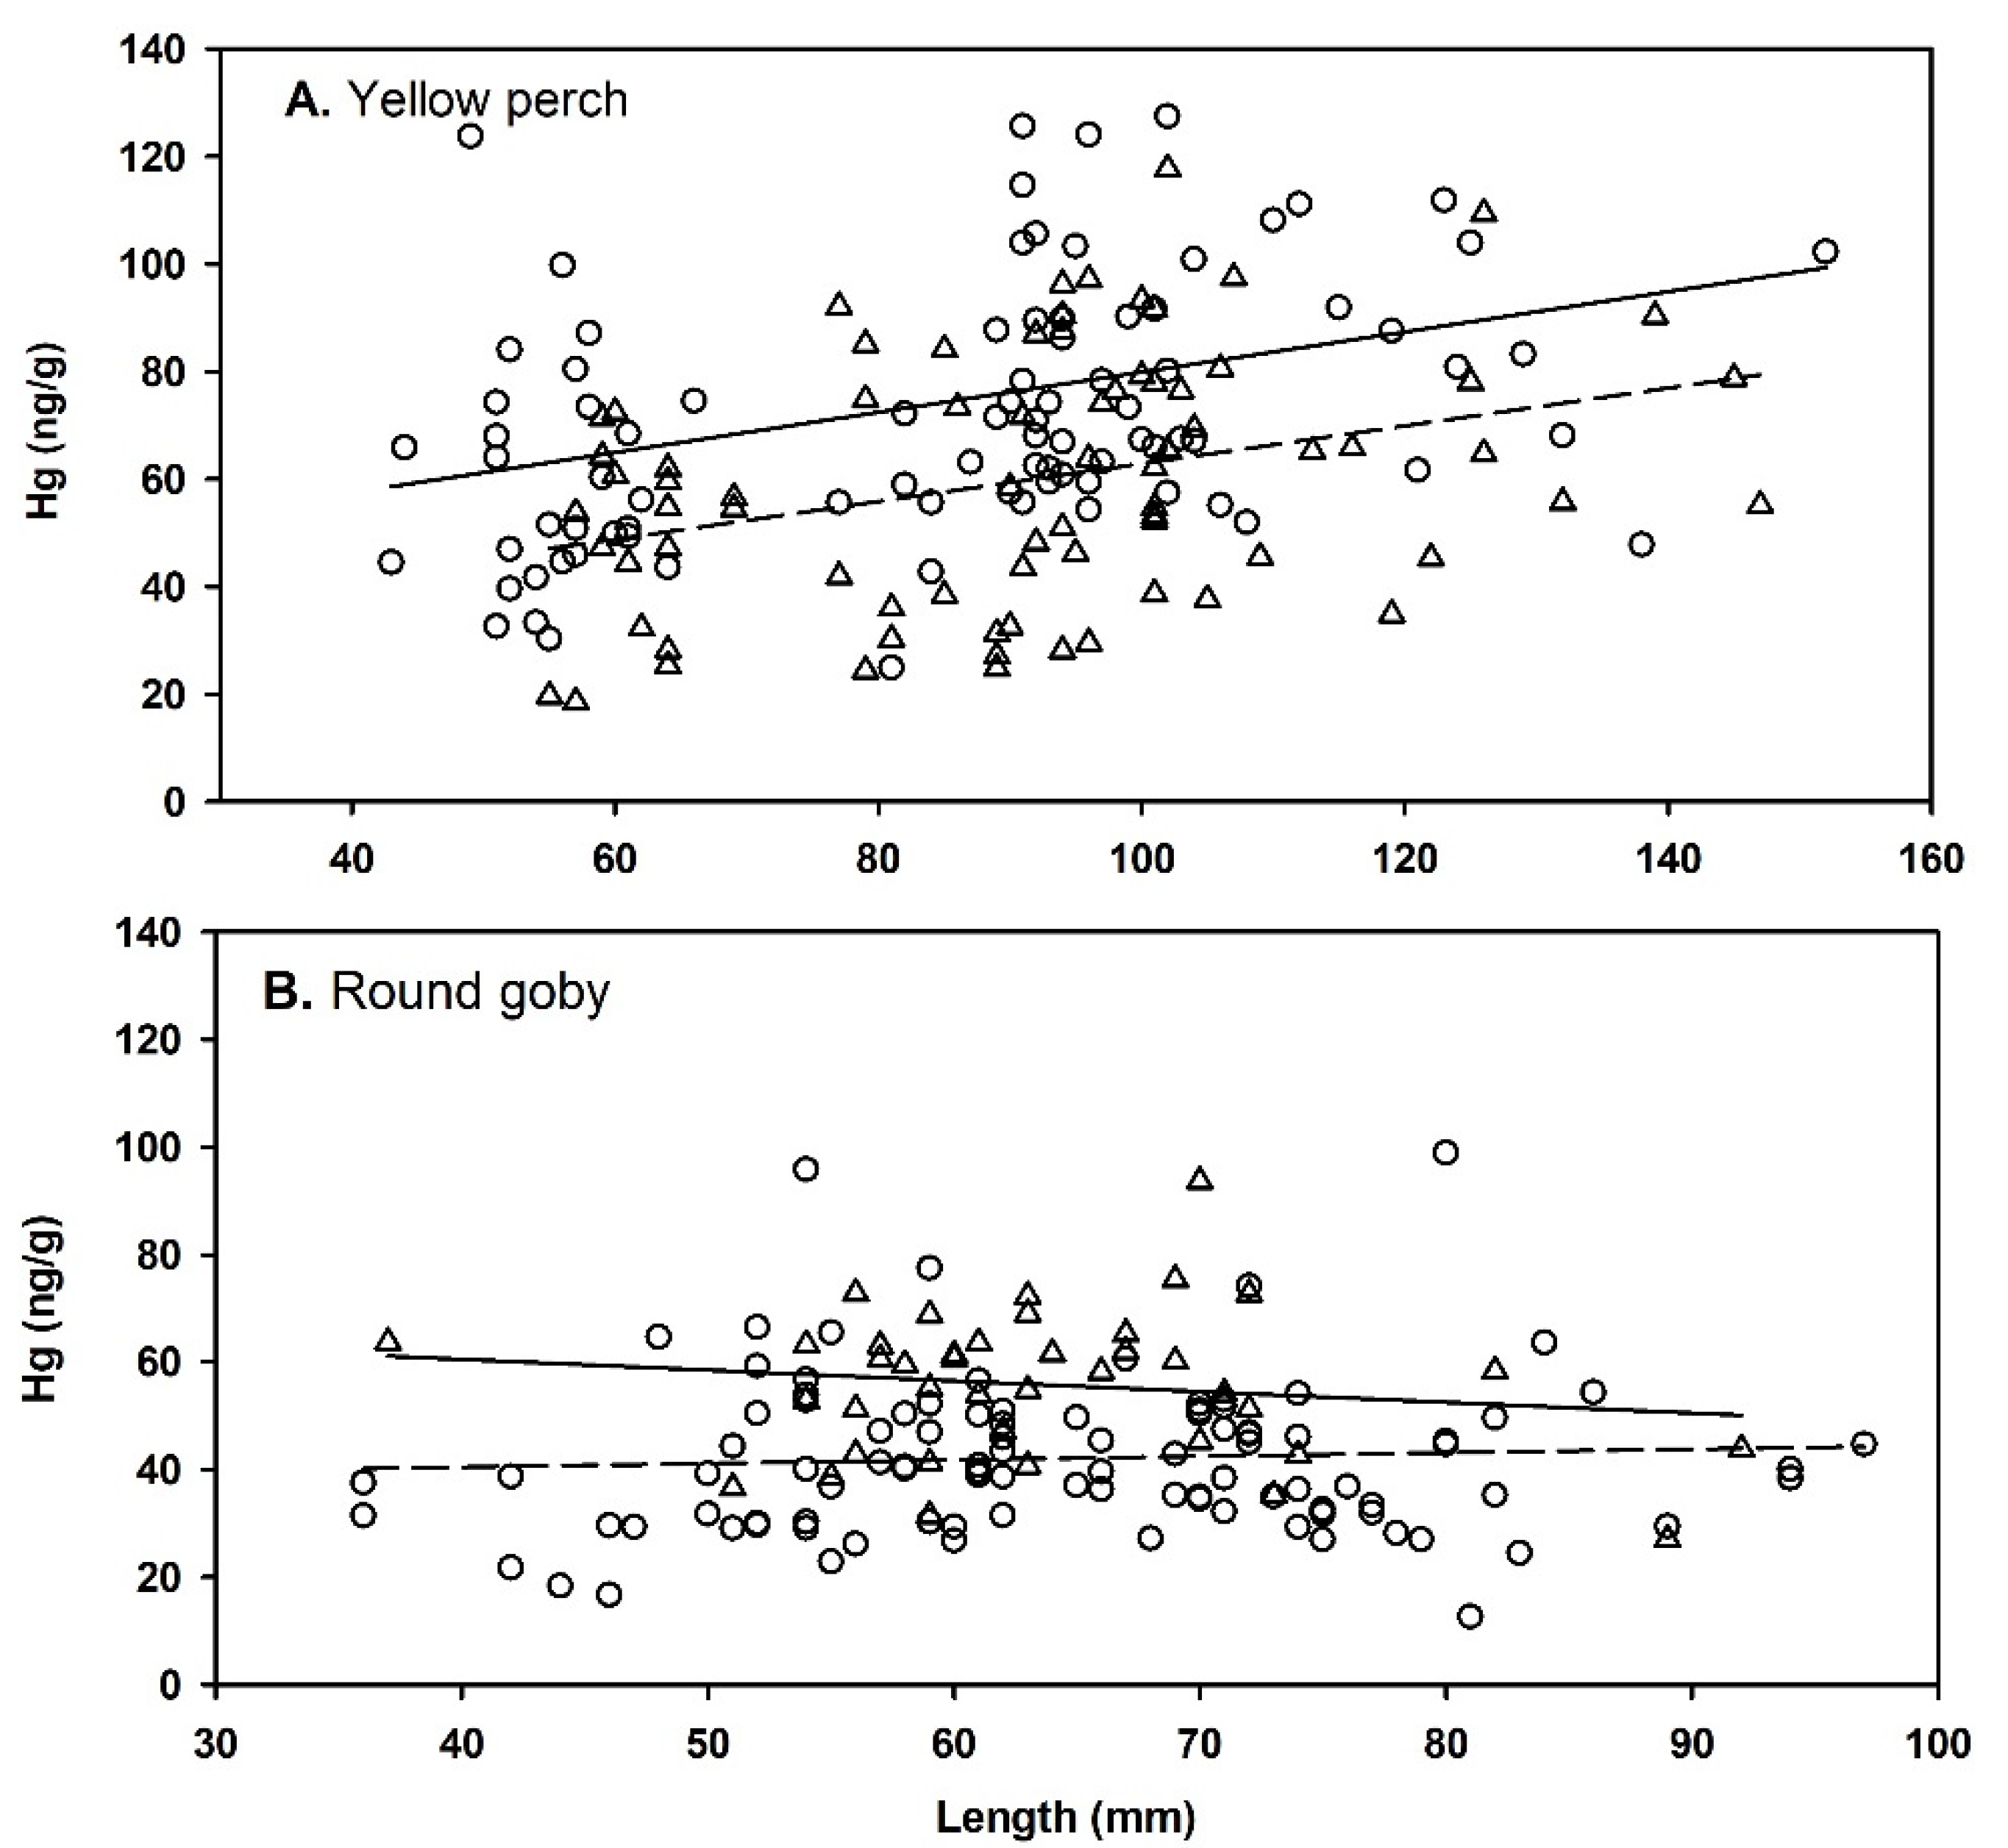
Significant differences were observed for mercury content in both yellow perch and round goby as a function of habitat: Both species demonstrated significantly higher mercury concentrations in wetland habitats (WL) compared to riparian zones without adjacent wetlands (NW) (Figure 2). A total of 174 yellow perch and 145 round gobies were collected during the 2019 field season. Average (± standard deviation; SD) mercury concentrations (ng/g dry wt.) for yellow perch were 74.5 ± 35.4 (n = 89) for WL and 59.9 ± 23.0 (n = 77) for NW; for round gobies, these concentrations were 55.4 ± 13.8 (n = 93) for WL and 41.0 ± 14.0 (n = 48) for NW. A majority (66%) of the round goby was caught in the NW habitat whereas 64% of the yellow perch were caught in WL sites.
There was no significant difference in fish length between habitat types for each of the species (p > 0.05) (Figure 2). Average (± SD) lengths (mm) for yellow perch were 85 ± 25 (n = 89) for WL and 91 ± 22 (n = 77) for NW; for round gobies, average lengths were 64 ± 10 (n = 48) for WL and 65 ± 13 (n = 93) for NW (Figure 2). ANCOVA results for Hg as a function of habitat: Yellow perch p < 0.001; round goby, p < 0.001. The ANCOVA results reveal no significant interaction between the habitat and the covariate length for yellow perch (p = 0.911) and round goby (p = 0.298).
Yellow perch and round goby from wetlands had significantly higher mercury concentrations than those collected from non-wetland sites (p < 0.001, for both yellow perch and round goby, respectively; Figure 2), thus confirming the initial hypothesis. These results are congruent with other studies that demonstrate higher mercury concentrations in biota that reside in wetland habitats (common loons, [31]; brook trout, [32]; various estuarine fish, [33]). In addition, the significance of wetland habitats in elevating mercury burdens in these two species bolsters the idea of wetland habitats as being ideal conditions for mercury methylation due to elemental deposition and fluctuating redox states stimulating mercury methylating microbes. Although the idea of wetlands as sources of methylmercury has been supported in past research [14,15], a study by Brasso et al. [34] comparing songbirds between wetlands and non-wetlands suggests otherwise. They suggest that while songbirds from wetlands may have elevated mercury compared to those from non-wetland habitats, this is not certain [34]. Therefore, it is perhaps fair to state that organisms in wetland habitats are likely to have elevated mercury burdens, but other landscape factors and differences among ecosystems as well as species may modify this pattern.
The round goby mercury concentration does not change with increased length as yellow perch does (Figure 2). While the ANCOVA indicated that the length does not differ between wetland and non-wetland sites for perch, the increasing trendline does indicate likely differences in the diet of yellow perch as they grow larger. Smaller yellow perch (75–118 mm) have some overlap in diet with the round goby [35,36,37]. As yellow perch individuals increase in size, their diet increasingly consists of more fish, dragonflies, bivalves, and other larger organisms [38]. Francis et al. [39] examined mercury throughout the food chain in a wetland estuary in the Great Lakes basin (Old Woman Creek in Lake Erie), and found that mercury concentrations among species, including fish, reflected the widely accepted concept of biomagnification. Given the longer life cycles of the older yellow perch prey items, it may be inferred they bioaccumulate more as they age and feed higher in the food chain, allowing for greater biomagnification. Conversely, round goby feed throughout roughly the same trophic level throughout their lives (zooplankton, benthic macroinvertebrates, and dreissenid mussels, with dreissenid consumption increasing with round goby size) [36]. Thus, in contrast to yellow perch, gobies are likely continuously consuming the same mercury content among prey items and growing simultaneously, creating consistent mercury accumulation over time, with minimal change as they age.
The concentrations of mercury in yellow perch and round goby observed here align with those described elsewhere within the USLR [12,25,40,41,42]. Literature on mercury along the USLR should be interpreted carefully as historic industrial point source mercury pollution exists at the Area of Concern (AOC) in Cornwall, ON. The fish collected in this study were collected upstream of the AOC where the predominant source of mercury is from legacy and ongoing atmospheric deposition to the landscape [43]. Lapointe and Ridal [25] observed that round goby and yellow perch samples had similar Hg concentrations in upstream reference sites; these sites were comparable in legacy Hg source contamination as those in this study. However, the fish they sampled were larger than this study: At their reference sites upstream of the industrial contamination (round goby: 58–82 mm versus 36–97 mm, yellow perch: 70–171 mm versus 44–152; Lapointe and Ridal [25] versus this study, respectively). Generally, concentrations of Hg in fish reported by Lapointe and Ridal [25] were similar in magnitude to ours and discrepancies should be interpreted carefully given the results here are reported per unit dry weight, whereas Lapointe and Ridal [25] report in per unit wet weight (ww). Additionally, Lapointe and Ridal [25] analyzed the whole goby, as did we, although they analyzed just filets for yellow perch. Fowlie et al. [38] also compared yellow perch from both contaminated (AOC industrial contamination) and uncontaminated (upstream, legacy atmospheric mercury deposition only) sites. Yellow perch from one of the uncontaminated sites averaged 86 ng Hg/g ww but ranged from 13–299 ng Hg/g ww, while another uncontaminated site averaged 79 ng Hg/g ww and ranged from 23–169 ng Hg/g ww [38]. Despite reporting units in wet weight (i.e., water diluting Hg relative to dry weight), the results from Fowlie et al. [40] were higher than those in yellow perch analyzed here, although this discrepancy may be due to the overall decline in atmospheric deposition of mercury to the New York [43] and Great Lakes basin [44] over roughly the last two decades. Yellow perch analyzed by Fowlie et al. [40] were longer in length than those collected here as well, averaging 151 mm with a range of 54–197 mm at one uncontaminated site and 138 mm with a range of 55–186 mm at the second uncontaminated site. Therefore, the larger fish may be consuming prey from higher trophic levels than those in our study and may be longer lived and have had longer to accumulate mercury. Skinless white dorsal muscle tissue was also the only tissue included in the analysis, which may contribute to slightly higher reporting concentrations [40]. Neff et al. [42] completed a similar study to Fowlie et al. [40] but expanded to locations upstream and examined trends over several decades (oldest data from 1975 and most recent from 2010). They found that mercury in fish filets declined in upstream sites (same reach of river sampled in this study) over time, confirming that the yellow perch collected by Fowlie et al. [40] may have had higher Hg concentrations than those in this study due to declines in atmospheric deposition. Other studies that measured mercury in yellow perch on the USLR [12,41] report similar results of declining fish Hg concentrations over time in the USLR, both at AOC sites as well as sites uncontaminated by point source industrial mercury. Our results, in the context of these older observations, indicate that while the mercury in fish is generally declining in the USLR, wetlands may still be disproportionately loading bioavailable mercury into the aquatic food chain relative to non-wetland riparian areas.
Yellow perch have long been used as study subjects for Hg contamination in the USLR [12,25,40,41,42] while round goby, first identified in the Great Lakes basin in 1990, has become a widespread AIS causing the displacement of other native species [45] for the last three decades. Round goby are suitable bio-indicators for contaminants, due to their small habitat range [46]. The results here substantiate the relevance of round goby as a biomonitor for contaminants and yellow perch as an effective means of analyzing trends in mercury over time. However, due to the shift in prey items and increase in Hg accumulation over time in yellow perch, round goby may make a more suitable species for spatial monitoring of Hg contamination. Yellow perch should continue to be monitored as a species that indicates trends in fish harvested for food that are higher in the food chain.
To explicitly identify wetlands as areas of higher availability of methylmercury, studies need to be conducted over years of varying seasonal conditions. As this study was completed during a single flood year (2019), it cannot accurately represent year-to-year mercury levels. The results here add to a gap in the knowledge of mercury pathways, differences of Hg concentrations in wetlands versus non-wetlands, and potential effects of Plan 2014 and extreme flooding events on mercury mobilization. While wetlands play an important role in maintaining the health of the surrounding environments, the results of this study indicate that riparian wetlands may mobilize mercury into the aquatic food-chain more so than non-wetland riparian habitats. The fish analyzed here do not pose a risk to public health given current guidelines and assuming no more than two or three servings of these fish are consumed per week by sensitive populations, in consideration of Hg dose and toxicological response [47]. However, fish consuming these yellow perch and round goby as prey may present a greater risk to public health, as well as the health of predators. Therefore, the selection of locations for routine monitoring for fish consumption advisories should consider the presence or absence of riparian wetlands. In addition, water level management plans should include methodologies to observe how changes in wetland saturation and drying might affect mercury burdens in forage fish, as examined here.
Given the ubiquity of mercury in the environment and its tendency to cycle extensively, particularly in aquatic environments, we need to be diligent in research and monitoring efforts, even as emissions from fossil fuel sources decline [6]. This study presents an example of how to target efforts in the face of an ongoing threat. Globally, research that allows us to target management efforts and predict areas of mobilization into the food chain are necessary to effectively combat the threat of mercury persistence, particularly in conjunction with other environmental issues that may enhance mobilization, such as extreme flooding and erosion.
Author Contributions
A.O. was responsible for investigation, formal analysis, writing the original draft, and writing—reviewing and editing. E.S.B. was responsible for conceptualization, project administration, formal analysis, and writing—reviewing and editing. M.J.S.W. was responsible for supervision and writing—reviewing and editing. T.M.H. was responsible for supervision, resources, and writing—reviewing and editing. M.R.T. was responsible for conceptualization, supervision, resources, and writing—reviewing and editing. All authors have read and agreed to the published version of the manuscript.
Funding
This research was funded by grants from Ontario Power Generation and the Trottier Foundation to the St. Lawrence River Institute of Environmental Sciences, and from the Great Lakes Small Grant Program of the Great Lakes Research Consortium (NY) to Clarkson University.
Institutional Review Board Statement
Fish were collected in accordance with a collection permit from the Ontario Ministry of Natural Resources and Forestry to the St. Lawrence River Institute of Environmental Sciences (OMNRF: License Number 1092933).
Informed Consent Statement
Not applicable.
Data Availability Statement
The data presented in this study are openly available in the Mendeley Data repository: Twiss, Michael; Osgood, Autumn; Brahmstedt, Evie (2021), “Mercury burden in round goby and yellow perch in relation to riparian wetlands of the Upper St. Lawrence River”, Mendeley Data, V1, https://data.mendeley.com/datasets/tchh2k8gkm/1 (accessed on 31 December 2021).
Acknowledgments
We thank K. Schwartz, N. Pozega, S. Rodriguez, S. Hildebrand, L. McGaughey, and M. MacDougall at the St. Lawrence River Institute of Environmental Sciences for assistance with sampling and J.J. Ridal for assistance with project coordination. A. Haddad-Carroll assisted with the Hg analysis methodology.
Conflicts of Interest
The authors declare no conflict of interest. The funders had no role in the design of the study; in the collection, analyses, or interpretation of data; in the writing of the manuscript, or in the decision to publish the results.
References
- Farrell, J.M.; Murry, B.A.; Leopold, D.J.; Halpern, A.; Rippke, M.B.; Godwin, K.S.; Hafner, S.D. Water-level regulation and coastal wetland vegetation in the upper St. Lawrence River: Inferences from historical aerial imagery, seed banks, and Typha dynamics. Hydrobiologia 2009, 647, 127–144. [Google Scholar] [CrossRef]
- IJC (International Joint Commission). Regulation Plan 2014 for Lake Ontario and the St. Lawrence River: Compendium Report. 2016. Available online: https://www.ijc.org/sites/default/files/Plan2014_CompendiumReport.pdf (accessed on 11 October 2021).
- Catford, J.A.; Daehler, C.C.; Murphy, H.T.; Sheppard, A.W.; Hardesty, B.D.; Westcott, D.A.; Rejmánek, M.; Bellingham, P.J.; Pergl, J.; Horvitz, C.C.; et al. The intermediate disturbance hypothesis and plant invasions: Implications for species richness and management. Perspect. Plant Ecol. Evol. Syst. 2012, 14, 231–241. [Google Scholar] [CrossRef]
- Brahmstedt, E.S.; Zhou, H.; Eggleston, E.M.; Holsen, T.M.; Twiss, M.R. Assessment of mercury mobilization potential in Upper St. Lawrence River riparian wetlands under new water level regulation management. J. Great Lakes Res. 2019, 45, 735–741. [Google Scholar] [CrossRef]
- Olson, C.I.; Fakhraei, H.; Driscoll, C.T. Mercury emissions, atmospheric concentrations, and wet deposition across the conterminous United States: Changes over 20 years of monitoring. Environ. Sci. Technol. Lett. 2020, 7, 376–381. [Google Scholar] [CrossRef]
- Chen, C.Y.; Driscoll, C.T.; Eagles-Smith, C.A.; Eckley, C.S.; Gay, D.A.; Hsu-Kim, H.; Keane, S.E.; Kirk, J.L.; Mason, R.P.; Obrist, D.; et al. A critical time for mercury science to inform global policy. Environ. Sci. Technol. 2018, 52, 9556–9561. [Google Scholar] [CrossRef] [PubMed] [Green Version]
- Driscoll, C.T.; Han, Y.-J.; Chen, C.Y.; Evers, D.C.; Lambert, K.F.; Holsen, T.M.; Kamman, N.C.; Munson, R.K. Mercury contamination in forest and freshwater ecosystems in the northeastern United States. BioScience 2007, 57, 17–28. [Google Scholar] [CrossRef]
- Lai, S.-O.; Holsen, T.M.; Hopke, P.; Liu, P. Wet deposition of mercury at a New York state rural site: Concentrations, fluxes, and source areas. Atmospheric Environ. 2007, 41, 4337–4348. [Google Scholar] [CrossRef]
- Ye, Z.; Mao, H.; Driscoll, C.T. Controlling factors of mercury wet deposition and precipitation concentrations in Upstate New York. In Proceedings of AGU Fall Meeting, New Orleans, USA. 2017. Available online: http://adsabs.harvard.edu/abs/2017AGUFM.B24A..01Y (accessed on 31 December 2021).
- Butler, T.; Likens, G.; Cohen, M.; Vermeylen, F. Final Report Mercury in the Environment and Patterns of Mercury Deposition from the NADP/MDN Mercury Deposition Network. 2007. Available online: https://www.arl.noaa.gov/documents/reports/MDN_report.pdf (accessed on 11 October 2021).
- Ridal, J.J.; Yanch, L.E.; Fowlie, A.R.; Razavi, N.R.; Delongchamp, T.M.; Choy, E.S.; Fathi, M.; Hodson, P.V.; Campbell, L.M.; Blais, J.M.; et al. Potential causes of enhanced transfer of mercury to St. Lawrence River Biota: Implications for sediment management strategies at Cornwall, Ontario, Canada. Hydrobiologia 2010, 647, 81–98. [Google Scholar] [CrossRef]
- Hodson, P.V.; Norris, K.; Berquist, M.; Campbell, L.M.; Ridal, J.J. Mercury concentrations in amphipods and fish of the Saint Lawrence River (Canada) are unrelated to concentrations of legacy mercury in sediments. Sci. Total Environ. 2014, 494–495, 218–228. [Google Scholar] [CrossRef] [PubMed]
- Wu, P.; Kainz, M.J.; Bravo, A.G.; Åkerblom, S.; Sonesten, L.; Bishop, K. The importance of bioconcentration into the pelagic food web base for methylmercury biomagnification: A meta-analysis. Sci. Total Environ. 2019, 646, 357–367. [Google Scholar] [CrossRef] [PubMed]
- Louis, V.L.S.; Rudd, J.W.M.; Kelly, C.A.; Beaty, K.G.; Bloom, N.S.; Flett, R.J. Importance of wetlands as sources of methyl mercury to boreal forest ecosystems. Can. J. Fish. Aquat. Sci. 1994, 51, 1065–1076. [Google Scholar] [CrossRef]
- Watras, C.J.; Morrison, K.A.; Host, J.S.; Bloom, N.S. Concentration of mercury species in relationship to other site-specific factors in the surface waters of northern Wisconsin lakes. Limnol. Oceanogr. 1995, 40, 556–565. [Google Scholar] [CrossRef] [Green Version]
- Evers, D.C.; Han, Y.-J.; Driscoll, C.T.; Kamman, N.C.; Goodale, M.W.; Lambert, K.F.; Holsen, T.M.; Chen, C.Y.; Clair, T.A.; Butler, T. Biological Mercury hotspots in the northeastern United States and southeastern Canada. BioScience 2007, 57, 29–43. [Google Scholar] [CrossRef]
- Selvendiran, P.; Driscoll, C.T.; Bushey, J.T.; Montesdeoca, M.R. Wetland influence on mercury fate and transport in a temperate forested watershed. Environ. Pollut. 2008, 154, 46–55. [Google Scholar] [CrossRef] [PubMed]
- Driscoll, C.T.; Holsapple, J.; Schofield, C.L.; Munson, R. The chemistry and transport of mercury in a small wetland in the Adirondack region of New York, USA. Biodegradation 1998, 40, 137–146. [Google Scholar] [CrossRef]
- Waldron, M.C.; Colman, J.A.; Breault, R.F. Distribution, hydrologic transport, and cycling of total mercury and methyl mercury in a contaminated river-reservoir-wetland system (Sudbury River, eastern Massachusetts). Can. J. Fish Aquat. Sci. 2000, 57, 1080–1091. [Google Scholar] [CrossRef]
- Snodgrass, J.W.; Jagoe, C.H.; Bryan, A.L., Jr.; Brant, H.A.; Burger, J. Effects of trophic status and wetland morphology, hydro-period, and water chemistry on mercury concentrations in fish. Can. J. Fish Aquat. Sci. 2000, 57, 171–180. [Google Scholar] [CrossRef]
- Gilmour, C.C.; Henry, E.A.; Mitchell, R. Sulfate stimulation of mercury methylation in freshwater sediments. Environ. Sci. Technol. 1992, 26, 2281–2287. [Google Scholar] [CrossRef]
- Fleming, E.J.; Mack, E.E.; Green, P.G.; Nelson, D.C. Mercury Methylation from unexpected sources: Molybdate-inhibited freshwater sediments and an iron-reducing bacterium. Appl. Environ. Microbiol. 2006, 72, 457–464. [Google Scholar] [CrossRef] [Green Version]
- Gilmour, C.C.; Bullock, A.L.; McBurney, A.; Podar, M.; Elias, D.A. Robust mercury methylation across diverse methanogenic Archaea. mBio 2018, 9, e02403-17. [Google Scholar] [CrossRef] [Green Version]
- Kolka, R.K.; Riggs, C.E.; Nater, E.A.; Wickman, T.R.; Witt, E.L.; Butcher, J.T. Temporal fluctuations in young-of-the-year yellow perch mercury bioaccumulation in lakes of northeastern Minnesota. Sci. Total Environ. 2019, 656, 475–481. [Google Scholar] [CrossRef]
- Lapointe, D.; Ridal, J.J. Mercury concentrations in sentinel fish exposed to contaminated sediments under a natural recovery strategy within the St. Lawrence River Area of Concern at Cornwall, Ontario, Canada. Arch. Environ. Contam. Toxicol. 2018, 76, 216–230. [Google Scholar] [CrossRef]
- Wiener, J.G.; Sandheinrich, M.B.; Bhavsar, S.P.; Bohr, J.R.; Evers, D.C.; Monson, B.A.; Schrank, C.S. Toxicological significance of mercury in yellow perch in the Laurentian Great Lakes region. Environ. Pollut. 2012, 161, 350–357. [Google Scholar] [CrossRef]
- Ray, W.J.; Corkum, L.D. Habitat and site affinity of the round goby. J. Great Lakes Res. 2001, 27, 329–334. [Google Scholar] [CrossRef]
- Fuller, P.; Benson, A.; Maynard, E.; Neilson, M.E.; Larson, J.; Fusaro, A.; Sturtevant, R. Neogobius melanostomus (Pallas, 1814): U.S. Geological Survey, Nonindigenous Aquatic Species Database: Gainesville, FL, USA. 2021. Available online: https://nas.er.usgs.gov/queries/FactSheet.aspx?SpeciesID=713 (accessed on 31 December 2021).
- Ball, E.E.; Smith, D.E.; Anderson, E.J.; Skufca, J.D.; Twiss, M.R. Water velocity modeling can delineate nearshore and main channel plankton environments in a large river. Hydrobiologia 2018, 815, 125–140. [Google Scholar] [CrossRef]
- Esri. ArcGIS Pro 2.8.2, Vizzuality; Half-Earth Project: Redlands, CA, USA, 2021. [Google Scholar]
- Kramar, D.; Goodale, W.M.; Kennedy, L.M.; Carstensen, L.W.; Kaur, T. Relating Land Cover Characteristics and Common Loon Mercury Levels Using Geographic Information Systems. Ecotoxicology 2005, 14, 253–262. [Google Scholar] [CrossRef]
- Castro, M.S.; Hilderbrand, R.H.; Thompson, J.; Heft, A.; Rivers, S.E. Relationship between wetlands and mercury in brook trout. Arch. Environ. Contam. Toxicol. 2006, 52, 97–103. [Google Scholar] [CrossRef]
- Eagles-Smith, C.A.; Ackerman, J.T. Mercury bioaccumulation in estuarine wetland fishes: Evaluating habitats and risk to coastal wildlife. Environ. Pollut. 2014, 193, 147–155. [Google Scholar] [CrossRef]
- Brasso, R.; Rittenhouse, K.A.; Winder, V.L. Do songbirds in wetlands show higher mercury bioaccumulation relative to conspecifics in non-wetland habitats? Ecotoxicology 2020, 29, 1183–1194. [Google Scholar] [CrossRef]
- Pothoven, S.A.; Nalepa, T.F.; Brandt, S.B. Age-0 and age-1 yellow perch diet in southeastern Lake Michigan. J. Great Lakes Res. 2000, 26, 235–239. [Google Scholar] [CrossRef] [Green Version]
- Johnson, T.B.; Bunnell, D.; Knight, C.T. A potential new energy pathway in central Lake Erie: The round goby connection. J. Great Lakes Res. 2005, 31, 238–251. [Google Scholar] [CrossRef]
- Brush, J.M.; Fisk, A.T.; Hussey, N.E.; Johnson, T.B. Spatial and seasonal variability in the diet of round goby (Neogobius mel-anostomus): Stable isotopes indicate that stomach contents overestimate the importance of dreissenids. Can. J. Fish. Aquat. Sci. 2012, 69, 573–586. [Google Scholar] [CrossRef]
- Keast, A. Diet overlaps and feeding relationships between the year classes in the yellow perch (Perca flavescens). Environ. Boil. Fishes 1977, 2, 53–70. [Google Scholar] [CrossRef]
- Francis, D.R.; Jude, D.J.; Barres, J.A. Mercury distribution in the biota of a Great Lakes estuary: Old Woman Creek, Ohio. J. Great Lakes Res. 1998, 24, 595–607. [Google Scholar] [CrossRef]
- Fowlie, A.R.; Hodson, P.V.; Hickey, M.B.C. Spatial and seasonal patterns of mercury concentrations in fish from the St. Lawrence River at Cornwall, Ontario: Implications for monitoring. J. Great Lakes Res. 2008, 34, 72–85. [Google Scholar] [CrossRef]
- Goulet, R.R.; Lalonde, J.D.; Chapleau, F.; Findlay, S.C.; Lean, D.R.S. Temporal trends and spatial variability of mercury in four fish species in the Ontario segment of the St. Lawrence River, Canada. Arch. Environ. Contam. Toxicol. 2007, 54, 716–729. [Google Scholar] [CrossRef]
- Neff, M.R.; Robinson, J.M.; Bhavsar, S.P. Assessment of fish mercury levels in the upper St. Lawrence River, Canada. J. Great Lakes Res. 2013, 39, 336–343. [Google Scholar] [CrossRef]
- Evers, D.C.; Sauer, A.K.; Burns, D.A.; Fisher, N.S.; Bertok, D.C.; Adams, E.M.; Burton, M.E.H.; Driscoll, C.T. A synthesis of patterns of environmental mercury inputs, exposure and effects in New York State. Ecotoxicology 2020, 29, 1565–1589. [Google Scholar] [CrossRef]
- Zhou, C.; Cohen, M.D.; Crimmins, B.A.; Zhou, H.; Johnson, T.A.; Hopke, P.K.; Holsen, T.M. Mercury temporal trends in top predator fish of the Laurentian Great Lakes from 2004 to 2015: Are concentrations still decreasing? Environ. Sci. Technol. 2017, 51, 7386–7394. [Google Scholar] [CrossRef]
- Jude, D.J.; Reider, R.H.; Smith, G.R. Establishment of Gobiidae in the Great Lakes Basin. Can. J. Fish. Aquat. Sci. 1992, 49, 416–421. [Google Scholar] [CrossRef]
- Marentette, J.R.; Gooderham, K.L.; McMaster, M.E.; Ng, T.; Parrott, J.L.; Wilson, J.Y.; Wood, C.M.; Balshine, S. Signatures of contamination in invasive round gobies (Neogobius melanostomus): A double strike for ecosystem health? Ecotoxicol. Environ. Saf. 2010, 73, 1755–1764. [Google Scholar] [CrossRef] [PubMed]
- US FDA (United States Food and Drug Administration). Technical Information on Development of FDA/EPA Advice about Eating Fish for Those Who Might Become or Are Pregnant or Breastfeeding and Children Ages 1–11 Years. 2021. Available online: https://www.fda.gov/food/metals-and-your-food/technical-information-development-fdaepa-advice-about-eating-fish-those-who-might-become-or-are (accessed on 8 December 2021).
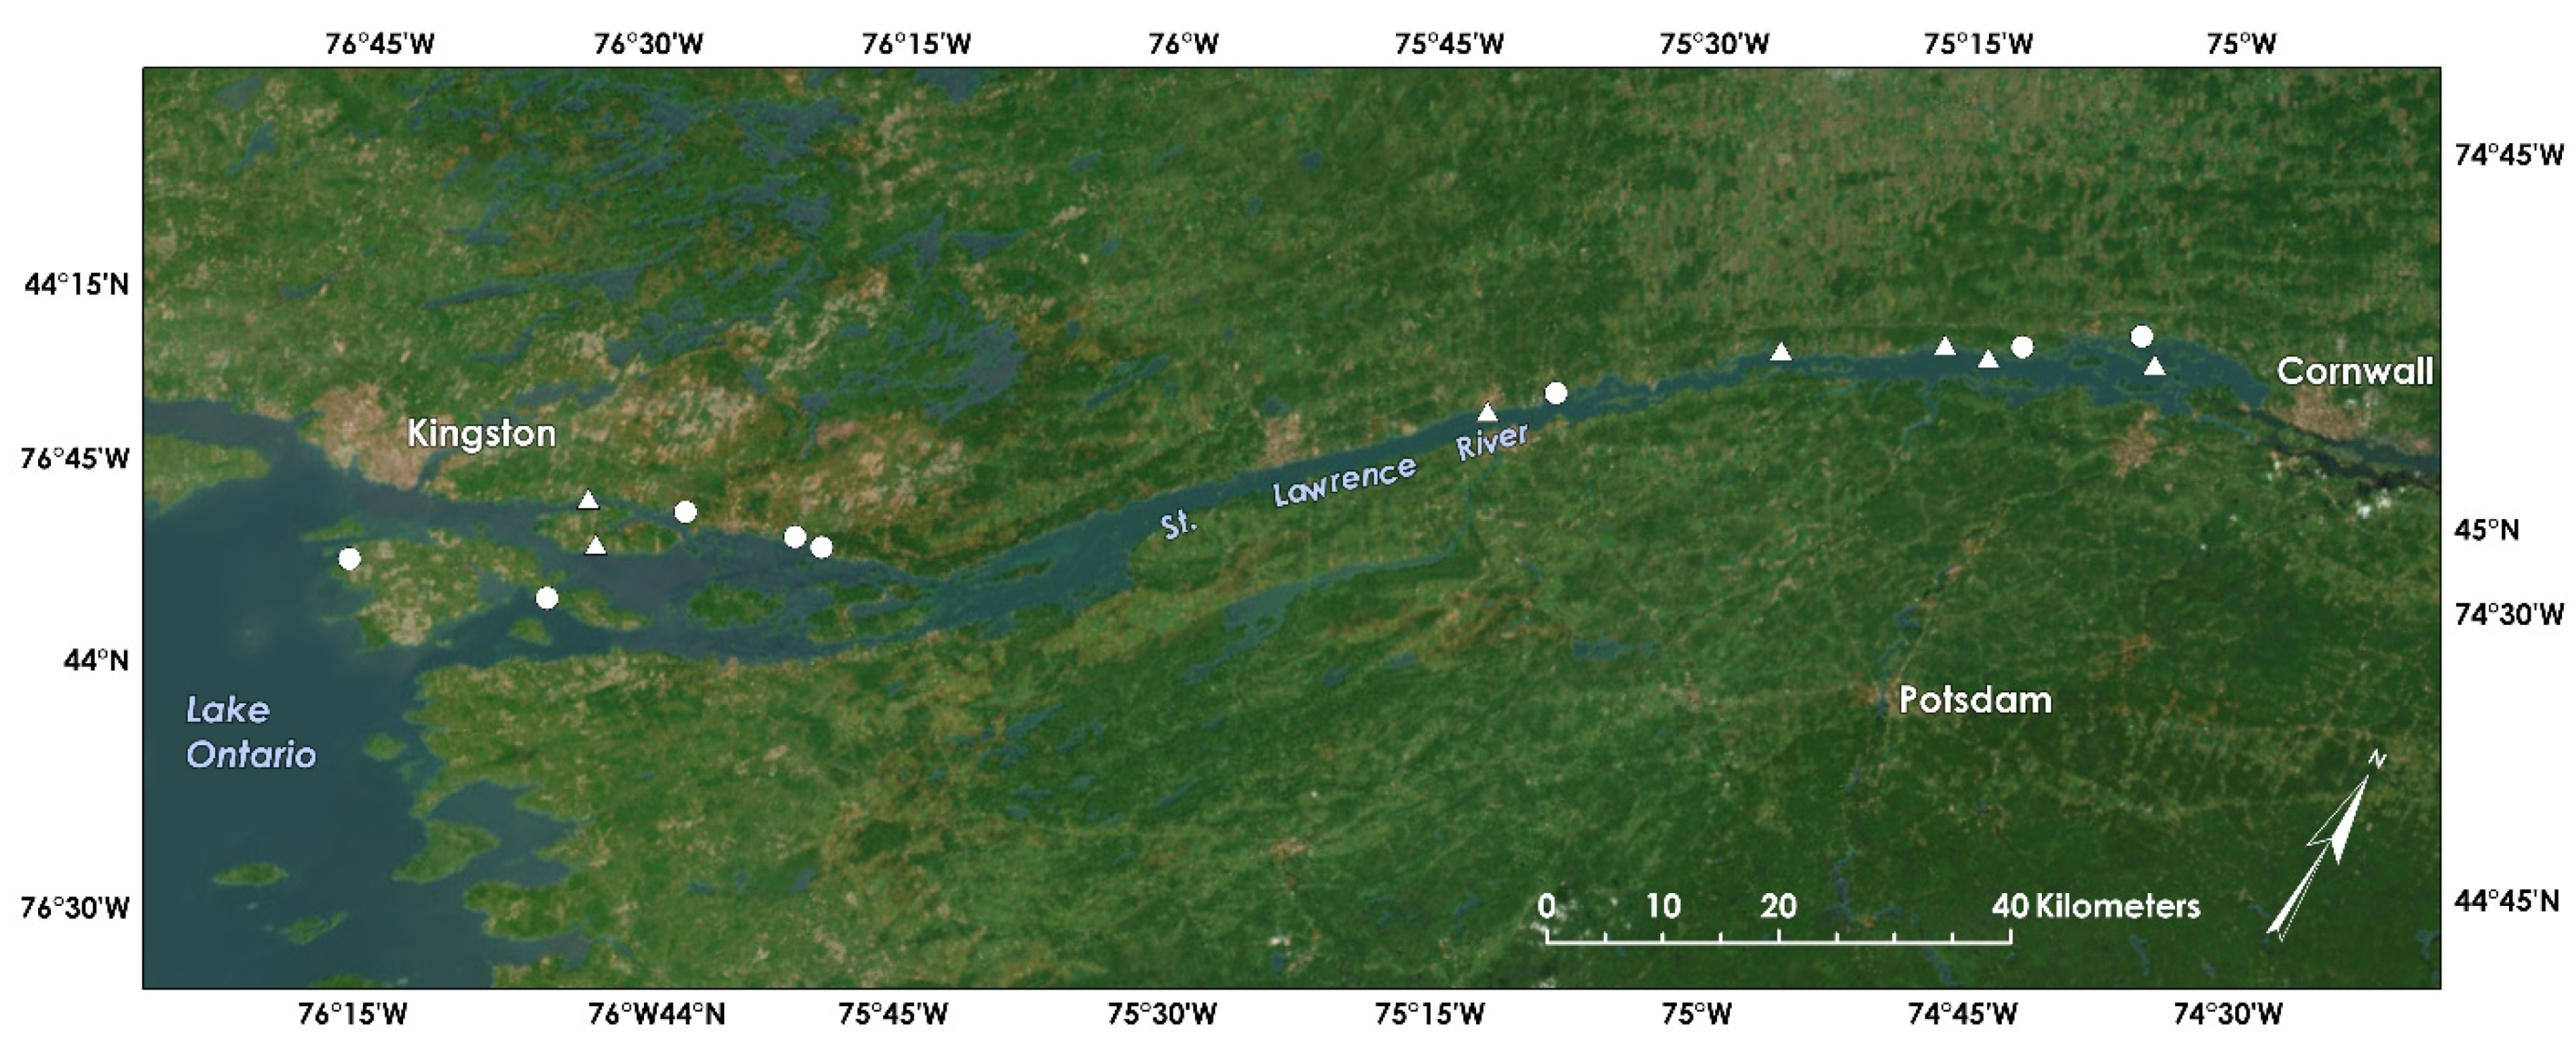
Figure 1.
Riparian sampling sites along the International Section of the Upper St. Lawrence River. Wetland sites are circles; non-wetland sites are triangles. Map created in Esri’s ArcGIS Pro 2.8.2 (2021) [30]. Water flows from Lake Ontario northeast down the St. Lawrence River.
Figure 1.
Riparian sampling sites along the International Section of the Upper St. Lawrence River. Wetland sites are circles; non-wetland sites are triangles. Map created in Esri’s ArcGIS Pro 2.8.2 (2021) [30]. Water flows from Lake Ontario northeast down the St. Lawrence River.

Figure 2.
Mercury content of forage fish sampled from sites along Upper St. Lawrence River as a function of habitat and fish length. Legend: Circles and solid lines are sites adjacent to wetlands; triangles and dashed lines are sites non-wetland sites. Symbols are individual fish; lines are linear least squares regressions.

Publisher’s Note: MDPI stays neutral with regard to jurisdictional claims in published maps and institutional affiliations. |
© 2022 by the authors. Licensee MDPI, Basel, Switzerland. This article is an open access article distributed under the terms and conditions of the Creative Commons Attribution (CC BY) license (https://creativecommons.org/licenses/by/4.0/).
Share and Cite
MDPI and ACS Style
Osgood, A.; Brahmstedt, E.S.; Windle, M.J.S.; Holsen, T.M.; Twiss, M.R. Proximity to Riparian Wetlands Increases Mercury Burden in Fish in the Upper St. Lawrence River. Water 2022, 14, 70. https://doi.org/10.3390/w14010070
AMA Style
Osgood A, Brahmstedt ES, Windle MJS, Holsen TM, Twiss MR. Proximity to Riparian Wetlands Increases Mercury Burden in Fish in the Upper St. Lawrence River. Water. 2022; 14(1):70. https://doi.org/10.3390/w14010070
Chicago/Turabian StyleOsgood, Autumn, Evie S. Brahmstedt, Matthew J.S. Windle, Thomas M. Holsen, and Michael R. Twiss. 2022. "Proximity to Riparian Wetlands Increases Mercury Burden in Fish in the Upper St. Lawrence River" Water 14, no. 1: 70. https://doi.org/10.3390/w14010070
Note that from the first issue of 2016, this journal uses article numbers instead of page numbers. See further details here.