
Patterns of Past and Future Droughts in Permanent Lowland Rivers


Laboratory of Hydrology, Lithuanian Energy Institute, 44403 Kaunas, Lithuania
*
Author to whom correspondence should be addressed.
Water 2022, 14(1), 71; https://doi.org/10.3390/w14010071
Submission received: 26 November 2021
/
Revised: 17 December 2021
/
Accepted: 27 December 2021
/
Published: 1 January 2022
(This article belongs to the Special Issue Research of the Relationship between Climate Change and Runoff in Watershed)
Abstract
:The problem of droughts is acute due to climate change. The study aims to assess the temporal and spatial drought patterns in Lithuanian lowland rivers in the past and to project these phenomena according to climate scenarios and models. Drought analysis was based on Standardized Precipitation Index (SPI), Reconnaissance Drought Index (RDI) and Streamflow Drought Index (SDI). To evaluate the past patterns, the hydrometeorological data of 17 rivers were used from 1961–2020. Future drought changes were analyzed in 2021–2100 according to the selected RCPs (Representative Concentration Pathways) using the hydrological model HBV. There were different patterns of droughts in three hydrological regions of Lithuania (Western, Central and Southeastern). The Southeastern region was more prone to extreme summer hydrological droughts, and they had a shorter accumulation period compared to the other two regions. SPI and RDI indices showed that the number of dry months and the minimum value of the index increased, extending the accumulation period. The highest correlation was recorded between RDI-12/SPI-12 and SDI-12. The amplitude between extremely wet and dry values of river runoff will increase according to RCP8.5. The projections indicated that hydrological drought intensity in the Central region is expected to increase under both analyzed RCPs.
1. Introduction
Drought is a recurring phenomenon that has plagued civilization throughout history [1]. Droughts are among the costliest natural hazards that influence various economic sectors and ecosystems in many different ways. This slowly moving hazard can affect virtually all climatic regimes [2]. It can occur in any part of Europe, in both high and low rainfall areas, and at any time of the year. In recent decades the most severe drought in Europe in 2003 was followed by droughts in 2007, 2011, 2013, 2015, 2017, and 2018 that affected large parts of Southern, Western and even Northern Europe [3]. Pan-European studies [4] show a statistically significant tendency towards less frequent and severe drought events over North-Eastern Europe, especially in winter and spring, and a moderate or more remarkable opposite tendency over Southern and Eastern Europe, especially in summer. The rise of compound warm-season droughts in Europe is a dynamic, developing phenomenon [5]. The most comprehensive climate change analysis in the Sixth Assessment Report published by the IPCC (Intergovernmental Panel on Climate Change) [6] warns that there will be an increasing occurrence of some extreme events unprecedented in the observational record with additional global warming. It means that this phenomenon may intensify further. Many scientists and decision-makers are concerned about the diversity and complexity of drought impacts and the low level of preparedness for future events [7]. U.S. researchers [8] projected that under the most pessimistic scenario, at the end of the 21st century, 43% of the world’s land area would suffer from increased drought. According to Naumann et al. [9], in the absence of climate action (4 °C in 2100 and no adaptation), the combined annual drought losses in the European Union and the United Kingdom are projected to rise to more than €65 billion per year compared with €9 billion per year currently.
There is a growing need to understand the potential impact of this extreme weather-related hydrological phenomenon to reduce or mitigate its threats. According to Encyclopedia Britannica, drought is generally defined as a lack or insufficiency of rain for an extended period that causes a considerable hydrologic (water) imbalance and, consequently, water shortages, crop damage, streamflow reduction, and depletion of groundwater and soil moisture. The drought type generally reflects the compartment of the hydrological cycle or sector of human activity that is affected; deficits typically propagate through the hydrological cycle, affecting different ecosystems and human activities accordingly [10]. The following types/categories/phases of drought can be found in the literature: meteorological, soil moisture/agricultural/vegetation, hydrological, groundwater, environmental and socio-economic drought. Drought indicators or indices are often used to help track droughts, and these tools vary depending on the region and the season [11,12]. Indicators are variables or parameters used to describe drought conditions (e.g., precipitation, temperature, streamflow, groundwater level and soil moisture). Indices are typically computed numerical representations of drought severity, assessed using climatic or/and hydrometeorological inputs, including the indicators listed above. They combine meteorological and hydrological parameters into a single numerical value or formula and provide a comprehensive decision-making picture [13,14,15,16,17]. Among the most frequently used drought indices are the Palmer Drought Severity Index (PDSI) [18], Rainfall Deciles [19], Crop Moisture Index (CMI) [20], Surface Water Supply Index (SWSI) [21], Standardized Precipitation Index (SPI) [22], Reconnaissance Drought Index (RDI) [23] and Drought Frequency Index (DFI) [24]. The National Meteorological and Hydrological Services worldwide are encouraged to use the SPI to describe meteorological drought; however, scientists seem to agree that there is still no “best” hydrological and agricultural drought index, so further discussion is needed on this topic [2]. Each index currently in use is appropriate to meet the expectations of a particular type of drought, while pre-knowledge about each case is crucial. However, the aim should be to develop a composite drought index to integrate all relevant data and drought definitions regarding the dominant types of monthly droughts in time and space, along with climate change scenarios [25].
Even though Lithuania belongs to the humid climate zone and is rich in rivers and lakes, drought is not uncommon. As evidence of climate change increases, research into drought events in this Baltic country intensifies. However, the analysis of dryness dynamics in the Baltic Sea region discovered a decline, shown by the increase in SPI values over the last fifty years in most studied areas [26]. The dynamics of meteorological and hydrological droughts in Lithuania did not reveal clear signs that extreme droughts have also increased. Still, in some sub-basins of the Nemunas River (which basin covers almost 72% of the Lithuanian territory), a statistically significant rise in SPI values was observed [27]. Whereas, at the end of the century, the climate changes are likely to lead to more intense and possibly more frequent meteorological droughts (especially in June–August), and the meteorological conditions will significantly impact river runoff [28,29]. Besides the SPI, for drought investigation, [30] used Hydro-thermal Coefficient of Selyaninov, HTC; [27] applied the Streamflow Drought Index, SDI. Rimkus et al. [31] used the normalized difference vegetation index (NDVI) and Vegetation Condition Index (VCI) to determine drought effect on vegetation. Rimkus et al. [32] analyzed widely used drought detection indices: Standardized Precipitation Evapotranspiration Index, SPEI; Effective Drought Index, EDI; Percent of Normal Precipitation, PNP; Aridity Index, AI. These scientists proposed a new Temperature-Precipitation Index (TPI) to identify agricultural drought in Lithuania. Kugytė and Valiuškevičius [33] analyzed hydrological droughts and suggested a new hydrological drought index SWLI (Standardized Water Level Index) to identify drought in Lithuanian rivers. Research over the last decades has provided important information on drought detection, dynamics, recent trends and projections in Lithuania. So far, however, the main focus of Lithuanian scientists has been on meteorological and agricultural droughts. Less attention was paid to the study of hydrological droughts. There is no research in Lithuania and the Baltic States related to forecasting hydrological droughts in future.
The main objective of our research is to assess the temporal and spatial patterns of hydrological droughts in Lithuanian rivers using multiannual hydrometeorological data, to study how meteorological and hydrological droughts are related and project these phenomena according to new regional climate models. Drought analysis will be based on the Standardized Precipitation Index (SPI), Reconnaissance Drought Index (RDI) and Streamflow Drought Index (SDI).
2. Materials and Methods
2.1. Study Area and Data
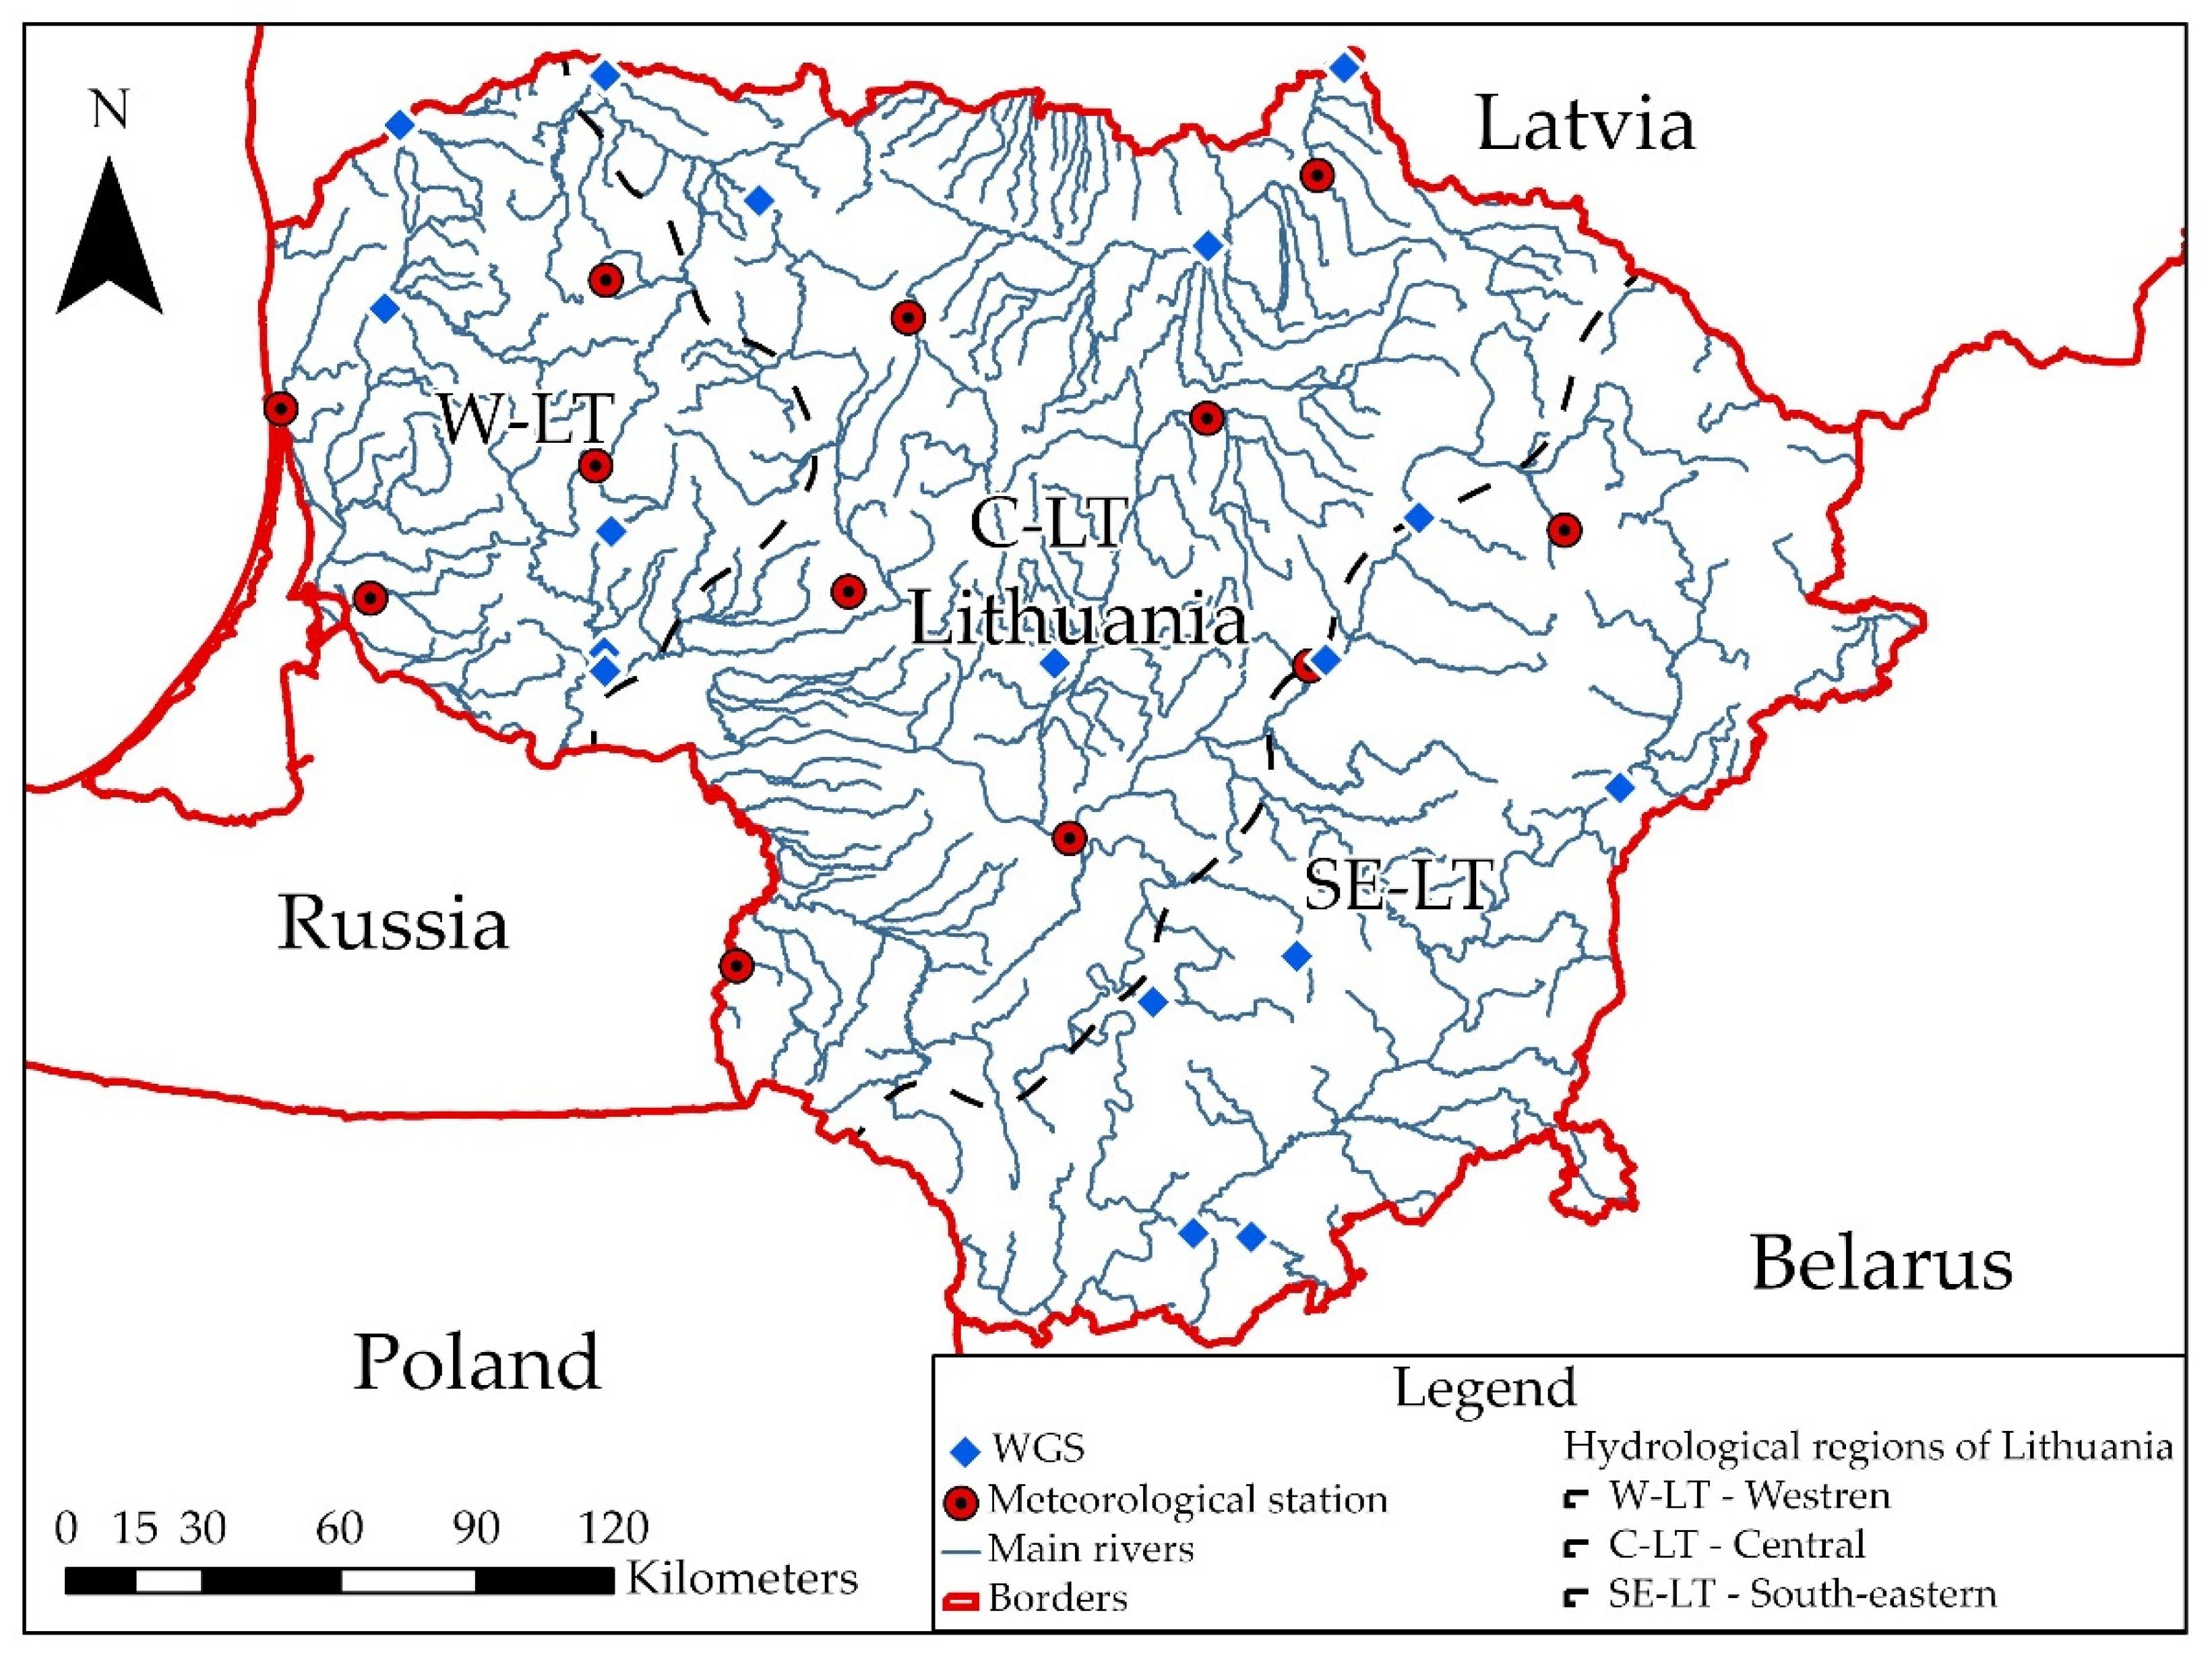
This study focuses on the entire territory of Lithuania, the area of which is 65,200 km2. The whole territory of the country belongs entirely to the plains, with the highest point 294 m above sea level. Lithuania belongs to the humid zone, with annual precipitation in the Western hydrological region (W-LT) 735–810 mm, in the Central hydrological region (C-LT) 600–680 mm and in the Southeastern hydrological region (SE-LT) 600–670 mm [34]. There are about 22,000 rivers in Lithuania with a total length of more than 37,000 km. All Lithuanian rivers belong to the Baltic Sea River Basin. Depending on climatic conditions and types of river feeding, Lithuania is divided into three hydrological regions: the Western, Central and Southeastern regions. During the driest 30-day summer period, the runoff of the rivers in the Western region of Lithuania is 0.4–2.5·10−3 m3/s·km2, in the Center region—0.1–1.7 × 10⁻³ m3/s·km2 and in the Southeastern region—1.7–4.7 × 10⁻³ m3/s·km2 [35]. In the Western hydrological region, the main feeding source is precipitation. In the Central hydrological region, there is no dominant type of river feeding; runoff is formed mainly from snowmelt and rainfall. Groundwater generates runoff in the Southeastern hydrological region [36].
The long-term hydrological and meteorological data sets for this study were obtained from the Lithuanian Hydrometeorological Service. Meteorological data from 12 meteorological stations (MS) from 1961 to 2020 were used. Hydrological data from 17 water gauging stations (WGS) with observation data covering at least 59 years from 1961 to 2020 were applied (Table 1). The selected WGSs are located in different hydrological regions: four WGSs in the Western, six WGSs in the Central and seven WGSs in the Southeastern hydrological region. All hydrological stations describe typically small and medium-sized rivers (catchment area varies from 162 km2 to 5440 km2). The location of the studied basins, WGSs and MSs are shown in Figure 1, and additional information is provided in Table 1.
Three rivers were selected for modeling of hydrological drought index SDI in future. These rivers are located in different hydrological regions of Lithuania: the Minija River in the Western, the Venta in the Central and the Šventoji in the Southeastern hydrological region. Hydrological data from water measurement stations (WMS) and meteorological stations (MS) on these rivers were used for calibration and validation to create hydrological models and project water discharges in future.
Since the network of meteorological stations in Lithuania is sparse, the point data from the meteorological stations were transformed into averages for each basin, using the weighted coefficients of the influence of approximate stations on a given basin. The weighted coefficients were calculated using Thiessen polygons. Polygons were created in ArcGIS 10.8 software using the Create Thiessen Polygons tool. First, all entry points (meteorological stations) were used to create a triangulated irregular network according to Delaunay criteria. The perpendicular bisectors for each triangle edge were generated to form the edges of the Thiessen polygons. The points of bisectors intersection determine the location of the vertices of the future polygons, which are connected around each meteorological station using ArcGIS Pro help archive. The Thiessen polygons method has already been successfully used to calculate climatic parameters [37,38,39]. Further calculation of the percentage of the river basins area belonging to each meteorological station and the creation of maps also took place in ArcGIS 10.8.
2.2. Methodology
Research of past and future droughts was carried out in the following steps:
- Estimating past changes in meteorological and hydrological drought indices (SPI, RDI and SDI) using statistical analysis methods (Section 3.1 and Section 3.2).
- Preparation of data (T, P and Q) for future drought index calculations (in the 21st century) in three Lithuanian river basins according to the selected climate models and scenarios:
- (a)
- preparation of daily air temperature and precipitation series based on the database (Section 3.3);
- (b)
- projection of the daily discharges of three selected rivers according to the selected climate models and scenarios using the HBV hydrological model (Section 3.3).
- Projection of meteorological and hydrological drought indices (SPI, RDI and SDI) and their analysis in the three selected river catchments in the 21st century.
2.2.1. Calculation of Drought Indices
One hydrological (Streamflow Drought Index) and two meteorological indices (Standardized Precipitation Index and Reconnaissance Drought Index) were chosen to identify and characterize droughts in Lithuania. The indices were selected considering their widespread use, the simplicity of the calculations, the availability of the necessary meteorological and hydrological data, and the possibility of the regional analysis. All drought indices were calculated for five different time series, i.e., 1, 3, 6, 9, and 12 months in each river basin.
DrinC software (Drought Indices Calculator) developed by the Center for the Assessment of Natural Hazards and Proactive Planning and the Laboratory of Reclamation Works and Water Resources Management of the National Technical University of Athens was used to calculate the indices [40]. In recent years, this tool was successfully applied to drought analysis [41,42].
Standardized Precipitation Index (SPI) was developed and introduced by McKee et al. [22]. It is now widely used to detect and describe meteorological drought and recommended by World Meteorological Organization (WMO) as the standard drought index [43]. SPI determines precipitation anomalies by comparing the observed total precipitation amounts over the accumulation period of interest (e.g., 1, 6, 12 months) with the long-term historical rainfall record, which is fitted to a probability distribution using the gamma function [44]. Precipitation is transformed into normalized numerical values. The SPI is the number of standard deviations by which the observed precipitation deviates from the long-term mean of a normally distributed random variable [45].
SPI is calculated as follows:
where xi is the precipitation of the selected period during the year i, is long term mean precipitation, and σ is the standard deviation for the selected period. Further details on the SPI index calculation can be found in the work of McKee et al. [22].
The obtained positive SPI index values reflect wet conditions when the total precipitation over a specific period is greater than the median. The negative SPI values describe dry conditions when the total precipitation over a specific period is lower than the median precipitation. The classification of drought conditions according to SPI index values is described in [46,47,48]. Moderately dry drought conditions will be when −1.49 < SPI < −1.0; severely dry conditions—−1.99 < SPI < −1.5; and extremely dry conditions — SPI < −2.0.
The widespread use of the SPI index can be explained by advantages such as the ability to use it in any geographic location and any number of time scales, the possibility of regional analysis and the need for only one input parameter (precipitation accumulation). However, this index does not consider other important meteorological parameters, such as the effect of high temperature and evaporation [44,45]; therefore, for more accurate identification of meteorological droughts in Lithuania, another meteorological index was additionally calculated.
According to McKee et al. [22], at least 30 years of precipitation data without gaps are required to calculate the SPI. Guttman [49] and Wu et al. [50] argue that a data series should be 40–60 years for stable distribution in the central part. A 70–80 year record is needed for stability in tails. It should be noted that for gamma distribution these periods can be longer [50]. In this article, 60 years of data records were used.
Reconnaissance Drought Index (RDI) was presented by Tsakiris and Vangelis [23] and successfully used by many scientists [47,51,52,53]. RDI involves two main parameters such as precipitation (P) and potential evapotranspiration (PET). PET is calculated from temperature data using the Thornthwaite method [54]. RDI can be expressed in three formulas. The first expression, the initial value (α0), is usually calculated for the year i on an annual basis as follows [23]:
in which and are precipitation and potential evapotranspiration of the month j of the year i, starting usually from October as it is customary for Mediterranean countries, N is the total number of years of the available data.
The second expression, the Normalized RDI (RDIn), is computed using the following equation for each year, in which the parameter 0 is the arithmetic mean of α0 values calculated for the N years of data.
The standardized form of the index (RDIst) is calculated as:
in which yi is the , is its arithmetic mean and is its standard deviation.
In this study, the standardized form of the index (RDIst) was used. The calculation of the RDIst was performed by fitting the gamma probability density function (pdf) to the given frequency distribution of the αk, as in most cases, the gamma distribution is more successful than lognormal [55]. The RDI values were classified similarly to the SPI index values.
Streamflow Drought Index (SDI) was developed by Nalbantis and Tsakiris [56] and is based on the concept of the SPI index. The SDI index is a simple and effective index to monitor hydrological droughts using cumulative streamflow discharge [57,58]. The cumulative streamflow discharge Vi,k for the i-th hydrological year and the k-th reference period can be calculated using the following equation:
where is the cumulative streamflow volume for the i-th hydrological year and the k-th reference period, k = 1 for October–December, k = 2 for October–March, k = 3 for October–June, and k = 4 for October–September.
Then, the SDI is defined for each reference period k of the i-th hydrological year by the following equation:
where and are the mean and standard deviation of the cumulative streamflow volumes of the reference period k, respectively.
Like to SPI and RDI, the streamflow probability distribution was normalized using a gamma distribution. An SDI value below zero indicates hydrological drought [48]. Moderate droughts will be when −1.49 < SDI < −1.0; severe droughts—−1.99 < SDI < −1.5; and extreme droughts — SDI < −2.0.
2.2.2. Selection and Preparation of Models
For projection of drought changes in the future, 13 regional climate models were considered that would have data for the two most commonly used RCP scenarios (RCP4.5 and RCP8.5). Monthly temperature and precipitation changes of observed historical data and historical simulated data were analyzed and compared. The correlation method was used for the statistical comparison of simulated and observed data. Additionally, the Wilcoxon test (for data with non-normal distribution) and the Pared t-test (for data with normal distribution) were used to determine whether the simulated data of each specific regional climate models (RCMs) differed from the observation data in a statistically significant manner. The whole analysis was based on data comparison for three meteorological stations (one from each hydrological region): Panevėžys, Vilnius and Telšiai. As a result, three regional climate models were selected: CNRM-CERFACS-CNRM-CM5, ICHEC-EC-EARTH and MPI-M-MPI-ESM-LR.
Daily air temperature (T, °C) and precipitation (P, mm) data of regional climate models were extracted from the EURO-CORDEX database (www.euro-cordex.net (accessed on 14 March 2021)). To adapt mentioned data to the Lithuanian conditions, the quantile mapping method was used [59,60]:
where StObs—observed meteorological parameter, S CM RP—climate model output for the reference period, ECDFObs—empirical cumulative distribution function for the observation period, ECDFCM RP– empirical cumulative distribution function for climate model reference period, and SCM Fut—meteorological parameter, which is modelled by climate model for the future period. All estimated results were compared with the values of the reference period (1986–2005).
2.2.3. Discharge Projections in the Selected River Catchments Using HBV Hydrological Model
The drought projections in the 21st were calculated for three rivers from the different hydrological regions of Lithuania using the HBV model. HBV is a technique of rainfall-runoff modelling used to calculate the total water balance in a catchment. HBV is based on the water balance equation [61]:
where P—precipitation, E—evaporation, Q—discharge, SM—soil moisture SP—snow pack, UZ—upper groundwater zone, LZ—lower groundwater zone, and V—lake or dam volume.
Model computations were performed in three steps: 1. Estimation of precipitation amount that falls to the ground; 2. Estimation of the slope runoff; 3. Evaluation of runoff in watercourse and runoff transformation. A considerable amount of geographical information is necessary to create hydrological models (Table 2).
Calibration of developed hydrological models was performed using 16 main parameters. The correlation coefficients r between measured and calculated water discharges varied from 0.68 to 0.88 in calibration and validation periods (Table 3). High r values enabled to use hydrological models to project selected rivers runoff in climate change conditions. More information on the application of the HBV model to project Lithuanian river runoff is presented in our previous research [36,62].
3. Results
Seventeen rivers with the complete data set (1961–2020) were selected for the temporal and spatial analysis of meteorological and hydrological droughts. In addition, one river (in total, three rivers) from each hydrological region was selected for more detailed analysis and drought projections in the near (2021–2060) and far future (2061–2100) periods.
3.1. Variation of Precipitation and Runoff in the River Catchments in the Past
As already mentioned in the methodology, the value of meteorological indicators (precipitation and temperature) was calculated for each catchment area, considering their affiliation with a particular meteorological station. This section analyzed the annual indicators (sum of annual precipitation and average annual runoff) from 1961 to 2020. Based on the calculated annual averages, the average values for the entire observation period were calculated, and the years with the highest average and lowest average were selected.
The average annual precipitation in the studied catchments from the Southeastern hydrological region (SE-LT) ranged from 599 mm to 665 mm per year. The Central hydrological region (C-LT) had a wider range of the average annual values, from 598 mm to 762 mm. While the Western hydrological region (W-LT) was characterized by the highest precipitation and minor fluctuations in the mean annual values between the catchment areas, ranging from 744 mm to 798 mm.
The presented data of the annual amount of precipitation in the WGS catchments indicate a significant spatial variation within the territory of Lithuania. At the same time, most catchment areas within one hydrological region had the same years with the highest and lowest rainfall. For example, in six out of seven catchments within the SE-LT, the highest amount of precipitation was observed in 2010 and 2017, and the lowest in 1964 and 1971. The catchments of the C-LT did not have pronounced coincidences of years with minimum and maximum values, which may reflect the transitional position of this region between the other two hydrological regions. For the W-LT, 1981 had the highest precipitation amount in all catchments.
In addition to the average annual discharge for each catchment over the studied period (1961–2020), extreme values of the average annual data were calculated. It should be noted that the years with the maximum and minimum annual precipitation in a particular catchment practically did not coincide with the years of maximum and minimum average annual runoff in this catchment. According to precipitation and water discharge, only six catchments out of 17 had the same wettest year. For only one river, the Mūša, the years with the lowest and highest annual precipitation coincided with the years with minimum and maximum values of water discharge. The small number of coincidences of dry years can be explained by the significant impact of groundwater supply and direct human impact.
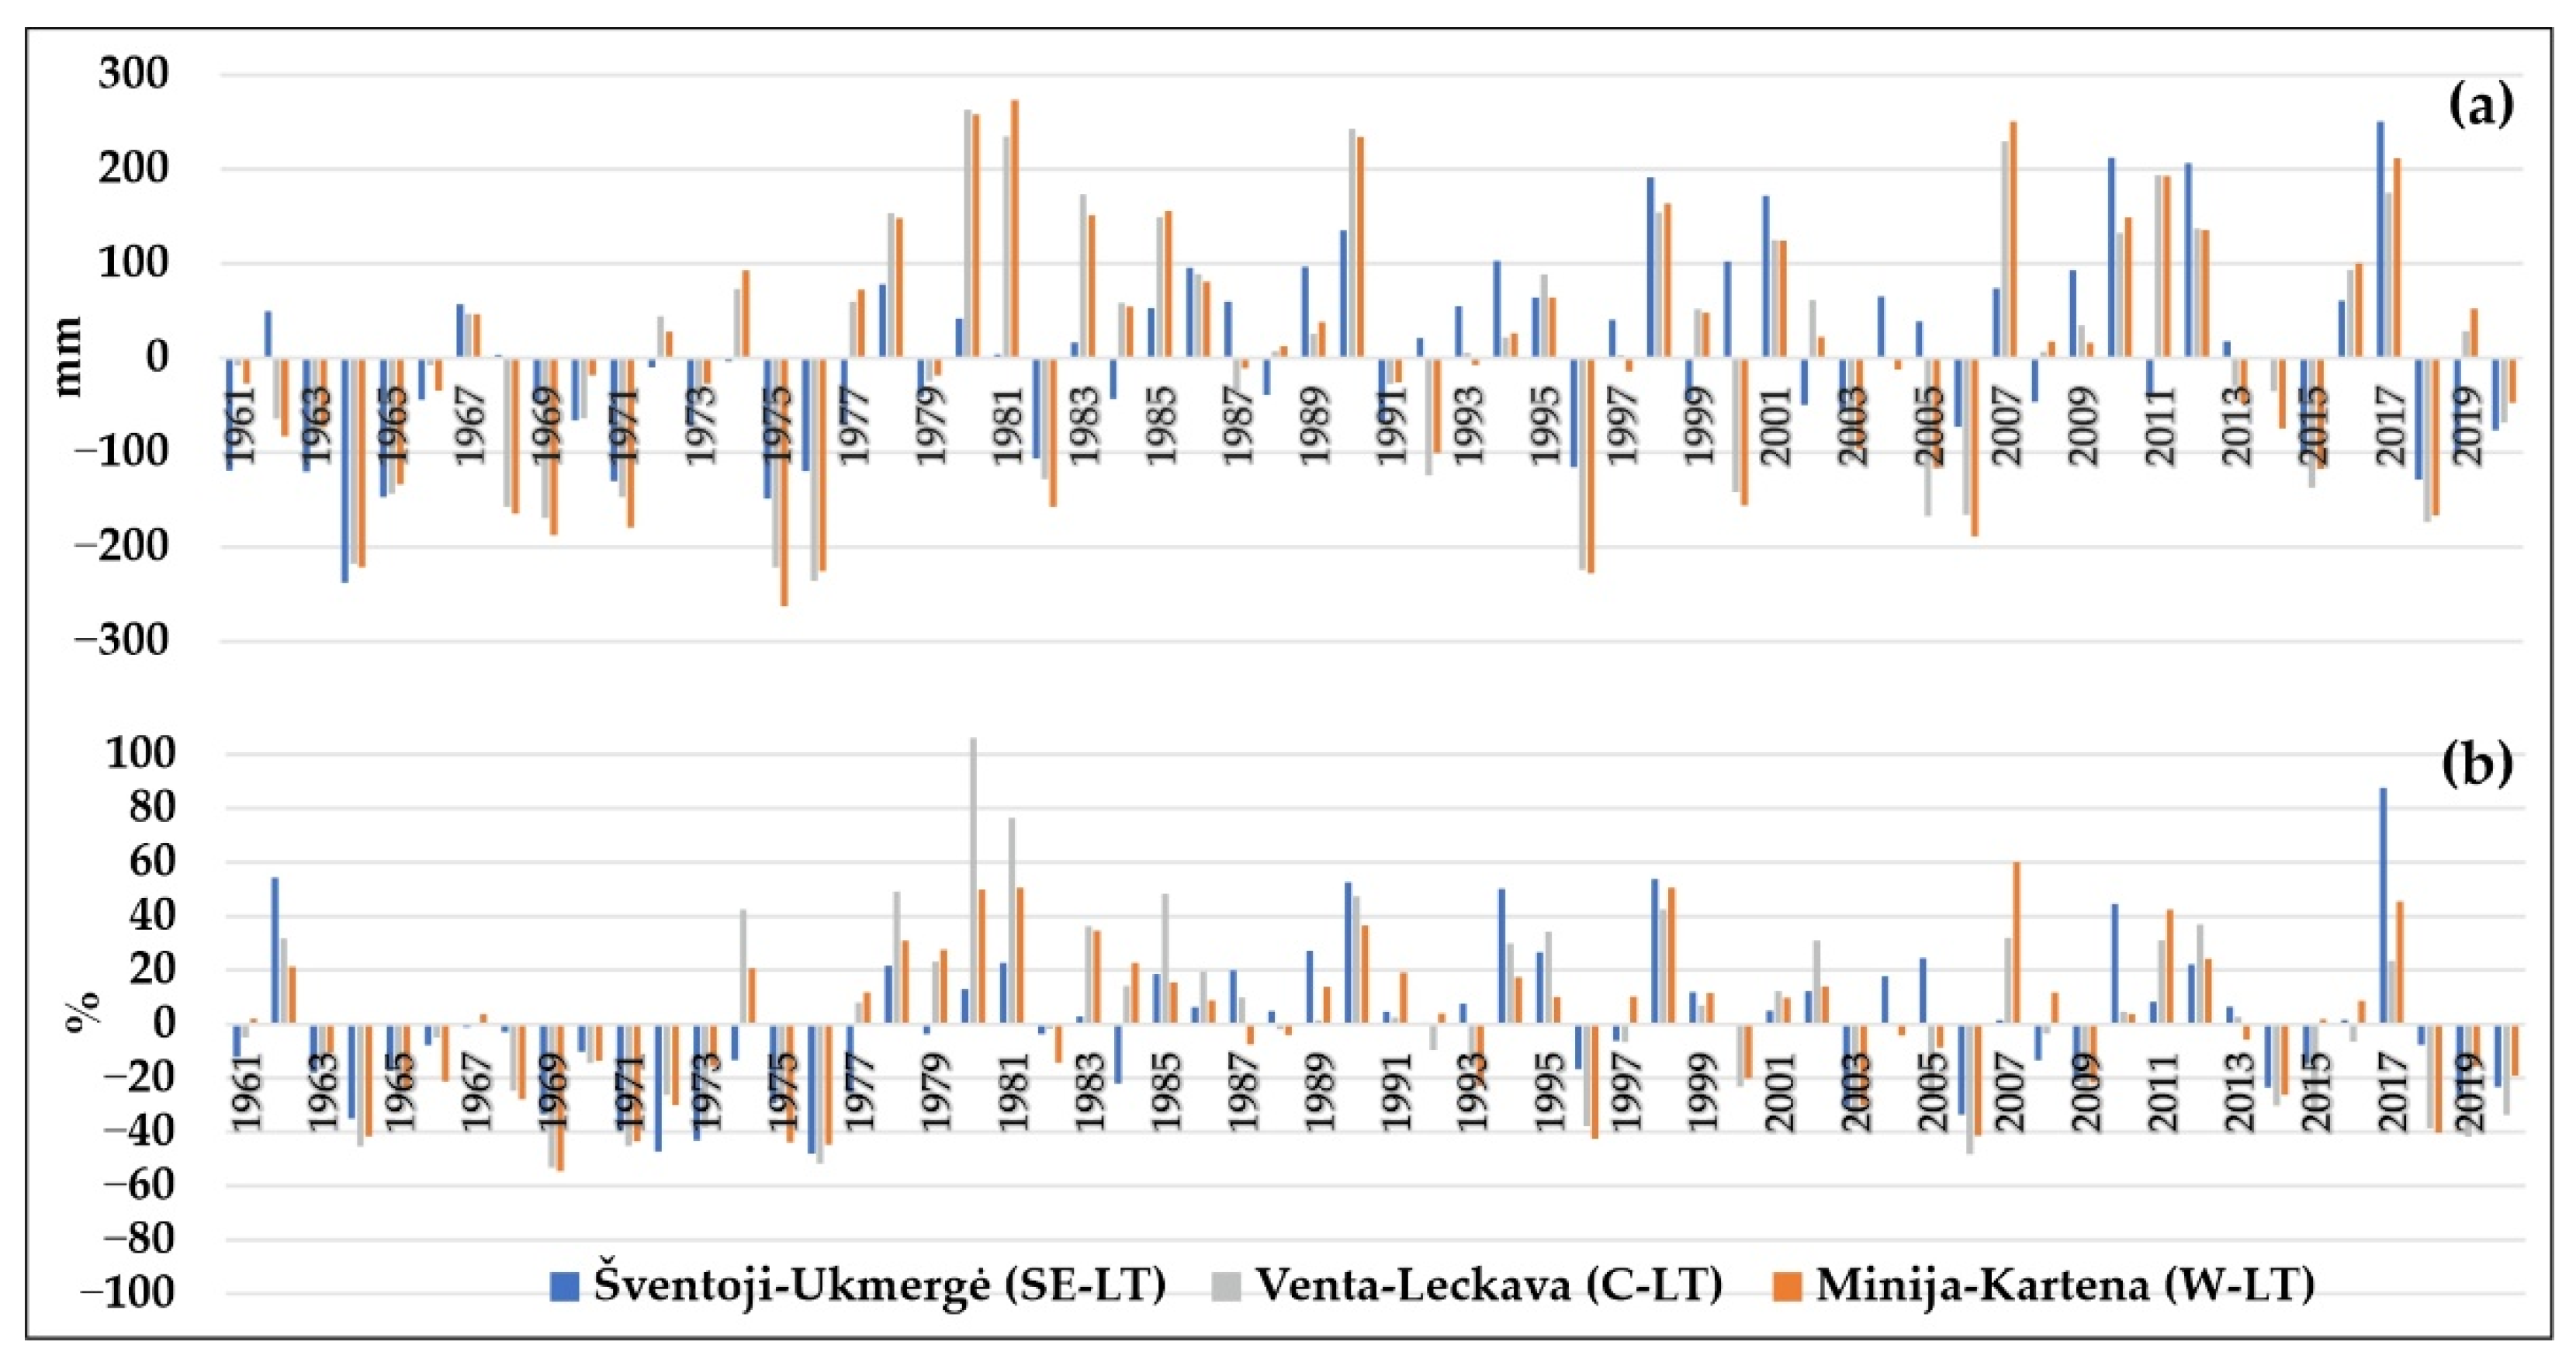
In addition, three representative rivers were selected (one from each hydrological region) to calculate the deviations of annual precipitation and average annual runoff from the average values for the entire study period. The results are presented in Figure 2.
The amount of precipitation in the C-LT was similar to the amount of precipitation in the W-CL and had the same trends. The SE-LT differed significantly in the amount of precipitation from the other two regions and sometimes had opposite trends (as an example, a slight increase compared to the average in the SE-LT with a decrease in precipitation in the other two regions (1962, 1992, 2000 and some other years)). Despite the similarities in precipitation, the C-LT and W-LT had significant differences in river runoff. The peak values of both graphs had some differences. Such a situation indicates the dependence of river runoff on precipitation; however, the critical minimum and maximum discharges are due to other factors.
3.2. Analysis of the Dry Periods Using the Drought Indices
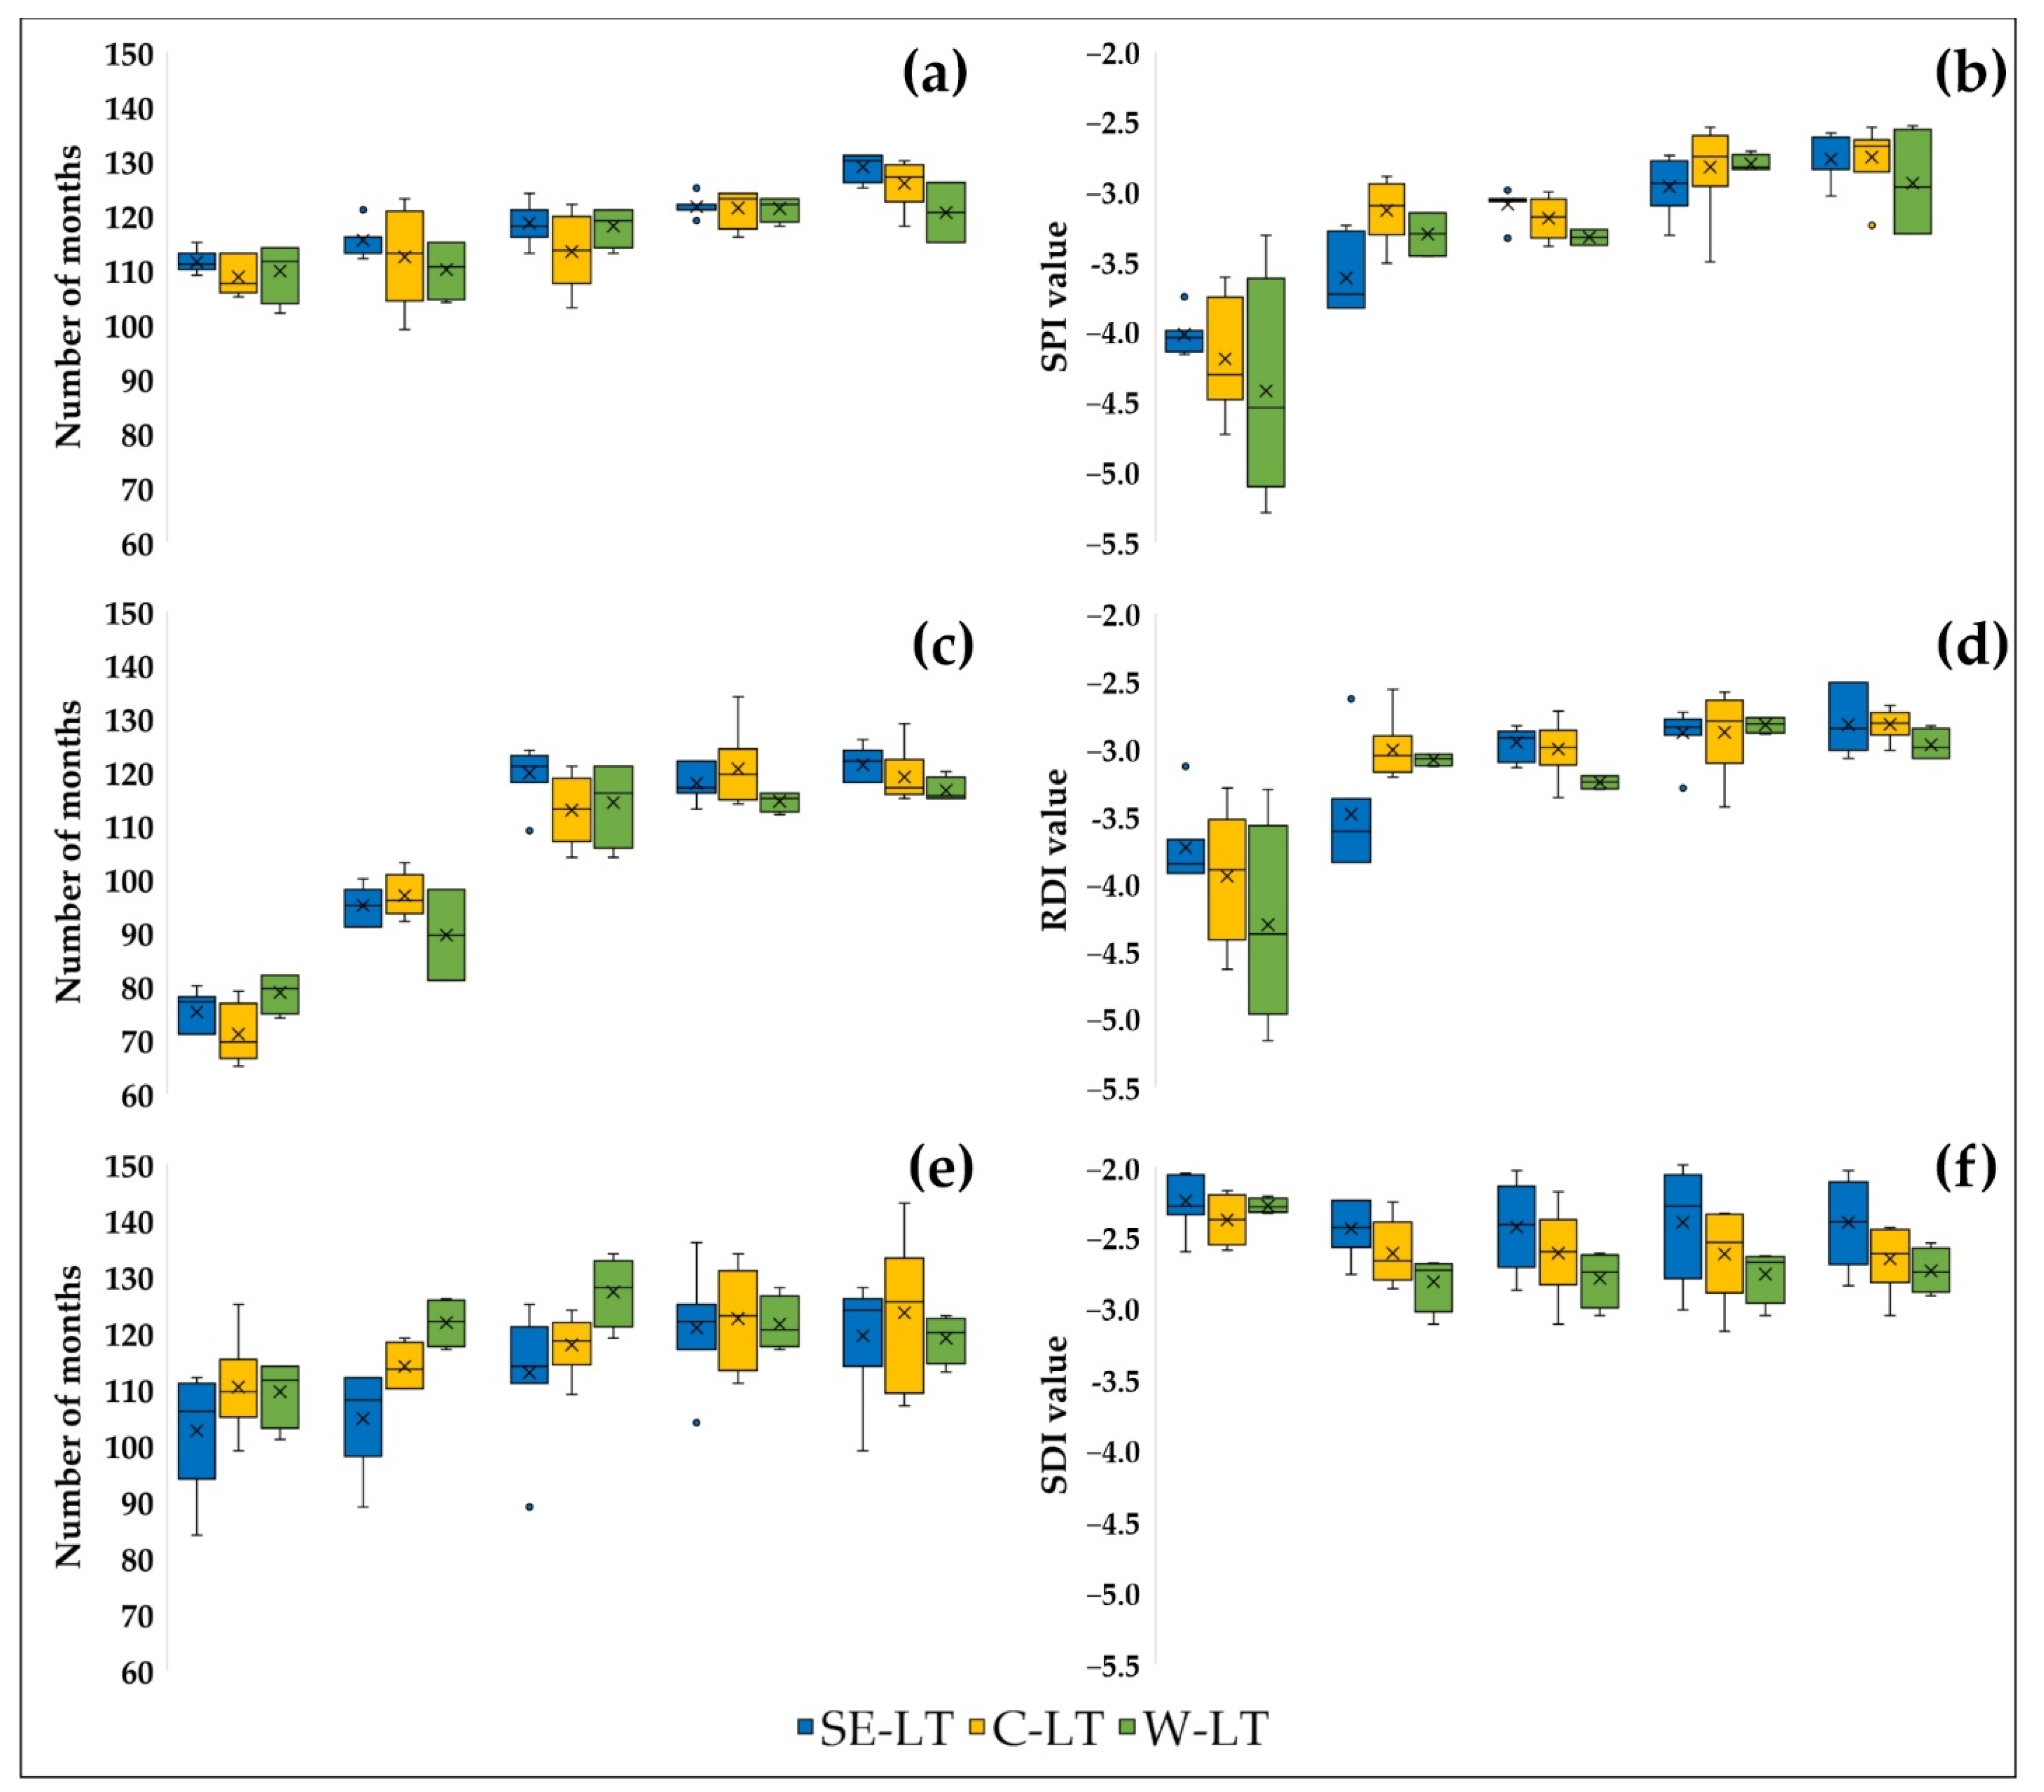
Hydrological and meteorological droughts (or dry periods) were analyzed by the SPI, RDI and SDI indices. The two main parameters, the number of dry months and index minimum value, were calculated for the 1, 3, 6, 9 and 12-month accumulation periods and presented in Appendix A. The distribution of the parameter values by hydrological regions for each index was shown using box plots (Figure 3).
As shown in the tables (Appendix A, Table A1, Table A2 and Table A3), dry periods are those when the index value is ≤−1. The analysis of the obtained SPI parameters showed that, in most cases, the number of dry months and the minimum value of the index increased with the extension of the accumulation period. In addition, during the 12-month accumulation period, the difference in the number of dry months between hydrological regions was more pronounced (125–131 in the SE-LT, 118–130 in the C-LT and 115–126 in the W-LT). At the same time, there were no significant differences in the minimum values of the index between the hydrological regions. As an example, for a 6-month accumulation period, the following distributions were estimated: −3.33 –(−2.99) for the SE-LT, −3.39–(−3.00) for the C-LT and −3.38–(−3.27) for the W-LT (Figure 3b).
The values of the RDI parameters also increased with a longer accumulation period (9 and 12 months). It should be noted that the number of dry months with RDI values ≤ −1 for almost all rivers and periods of accumulation was less than the number of dry months with SPI values ≤ −1. At the same time, with longer periods of accumulation, the difference in the number of dry months between the indices practically disappeared. The difference in minimum values between the RDI and SPI indices was not as evident as in the number of dry months. In addition, no patterns in the distribution of minimum values of meteorological indices according to the different hydrological regions were noted. For example, the lowest values of SPI-1 (−5.29) and RDI-1 (−5.16) were recorded in the W-LT, SPI-3 (−3.83) and RDI-3 (−3.84) in the SE-LT, SPI-6 (−3.39) and RDI-6 (−3.36) in the C-LT, SPI-9 (−3.50) and RDI-9 (−3.43) in the C-LT, and SPI-12 (−3.30) in the W-LT and RDI-12 (−3.07) in the SE-LT and W-LT.
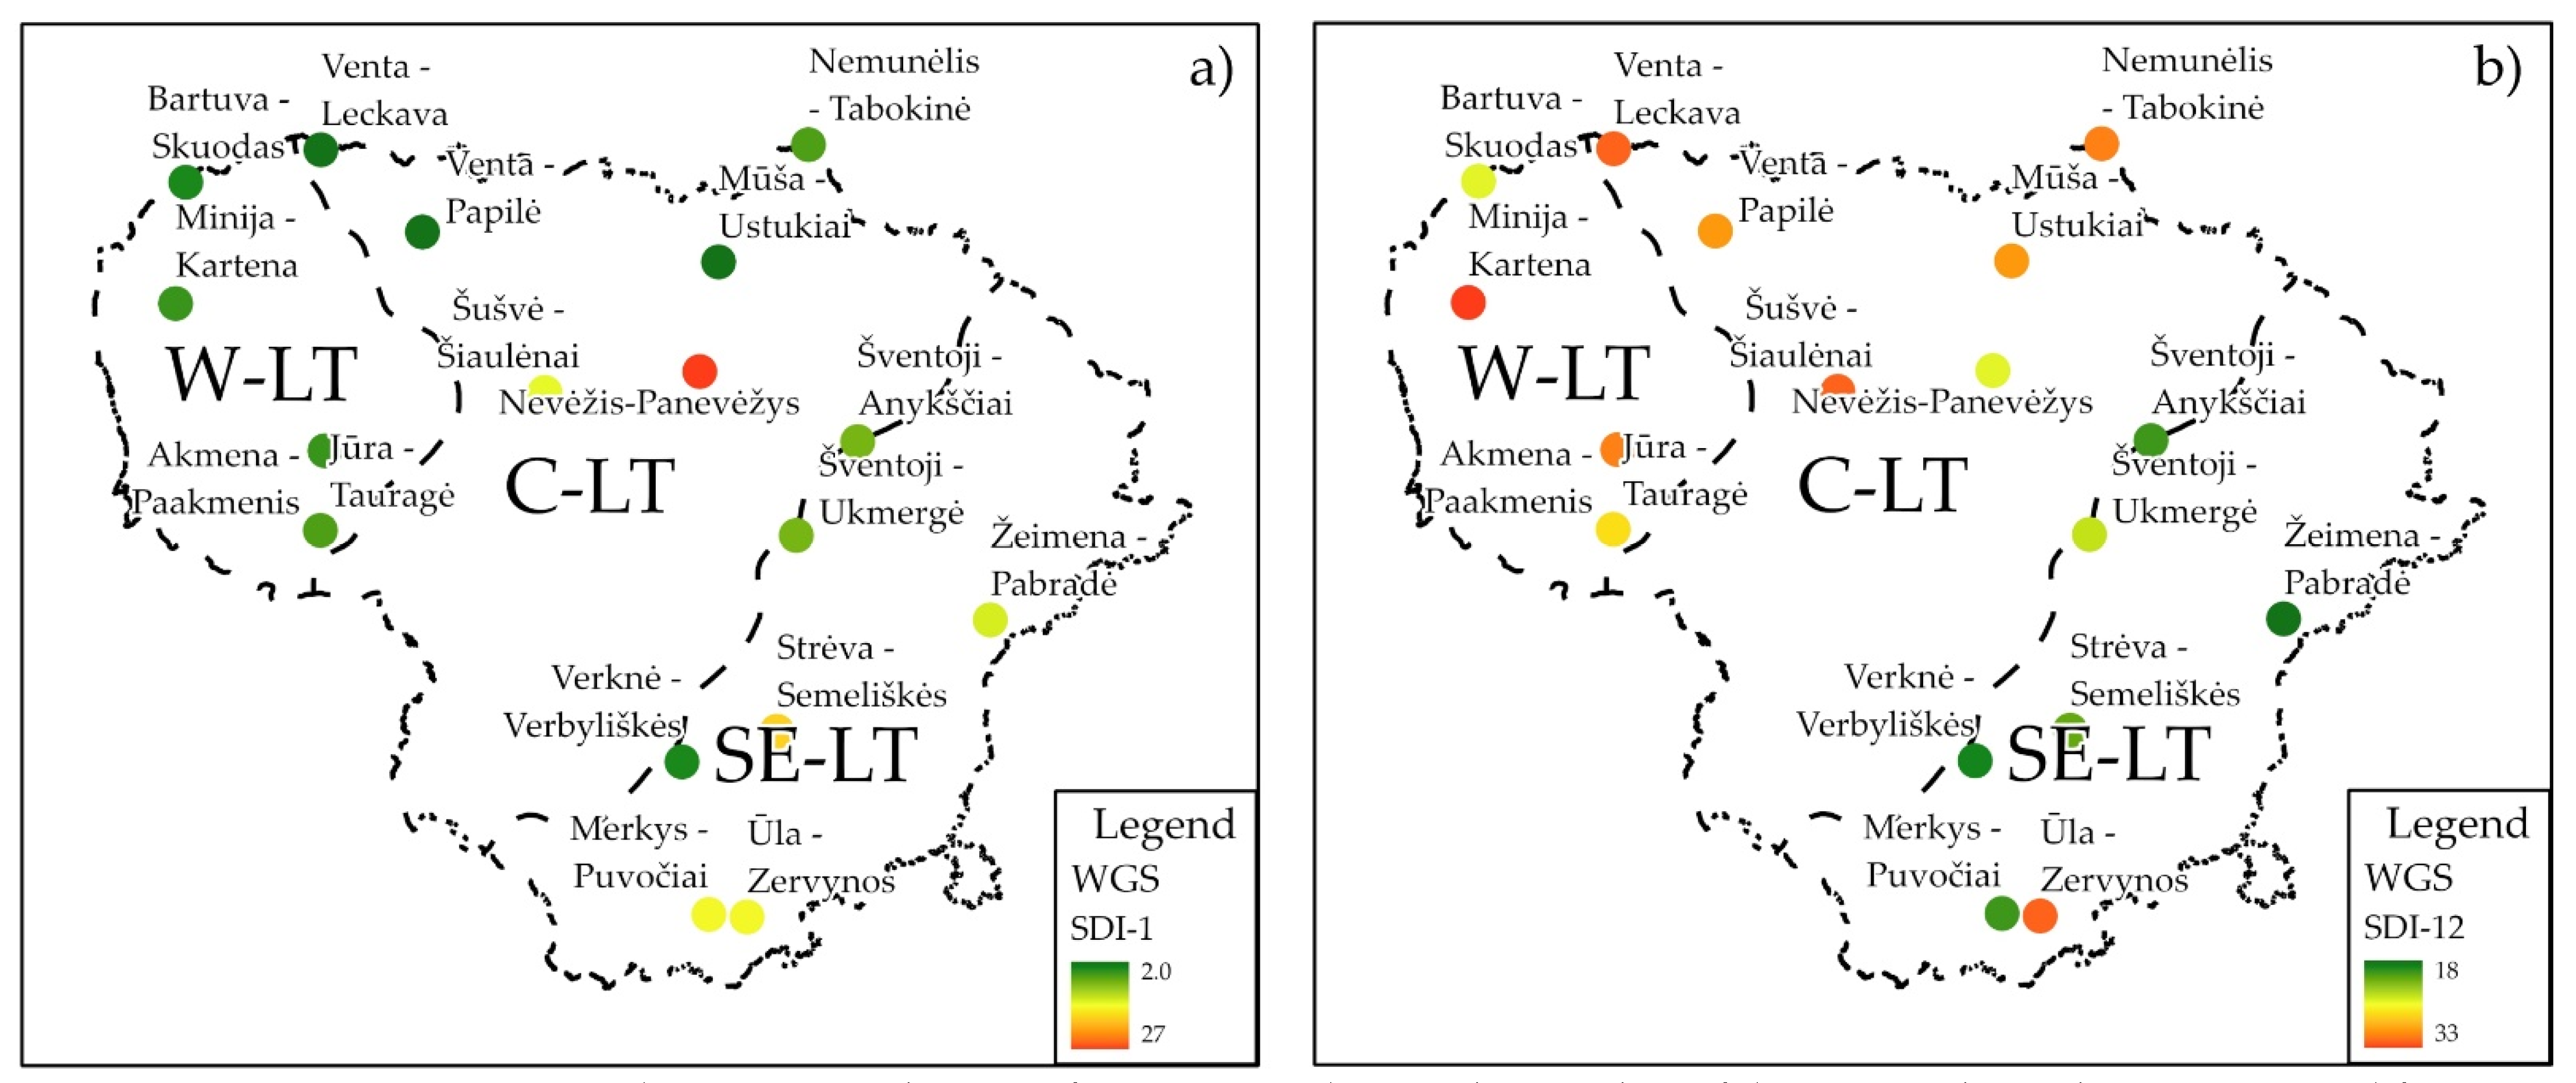
As with meteorological indices, the number of dry months with SDI values ≤ −1 was higher for longer accumulation periods; however, the minimum values of SDI, as opposed to SPI and RDI, did not increase. Therefore, the minimum SDI values for the 3, 6, 9 and 12-month accumulation periods reflected the difference between hydrological regions. The SE-LT was characterized by a wider range (the largest range was noted for SDI-9 from −3.01 to −2.06) and higher minimum values of the SDI index. The W-LT had the lowest average minimum SDI values for the accumulation periods of 3, 6, 9 and 12 months (Figure 3f).
3.3. Distribution of Index Values According to Drought Condition Classes
Table 4 shows the percentage distribution of all months (60 observation years) according to drought condition classes of three indices in the three Lithuanian rivers, each of which represents one of the hydrological regions. The percentage of Extremely Dry months for meteorological indices decreased with the extension of the accumulation period, while the percentage of Moderately Dry and Severely Dry months increased. This might indicate the presence of short but extremely strong dry periods, which became less pronounced as the accumulation period lengthened. According to the hydrological index, the percentage of Moderately Dry months decreased in the rivers from the Central region (Venta) and the Western region (Minija) with an extension of the accumulation period. While in the Šventoji River (SE-LT), there were no regularities for this class. According to the hydrological index, the percentage of Severely Dry and Extremely Dry months increased as the accumulation period lengthened. The increase in the number of extremely dry periods for SDI might be due to the synergistic effect of less significant deviations from normal conditions, which could not be noticed in the smaller accumulation periods. According to meteorological and hydrological indices, the percentage of Extremely Dry and Moderated Dry months had opposite trends with an extension of the accumulation period. The explanation for this may be the different nature of the two processes, namely precipitation, which is not constant and may have significant interruptions, and the runoff formation process, which depends not only on precipitation but also on many different factors.
3.4. Relations between Meteorological and Hydrological Droughts
Pearson’s correlation was used to investigate the relationships between meteorological and hydrological droughts in more detail. Six months of the warm season (May–October) were taken for correlation analysis, as the presented work concentrates on summer droughts. The example of the results of the correlation analysis is presented in Appendix B (Table A4 and Table A5). Only two (Verknė and Strėva) of the seventeen rivers had no strong (≥0.7) correlation between meteorological and hydrological indices for any accumulation period.
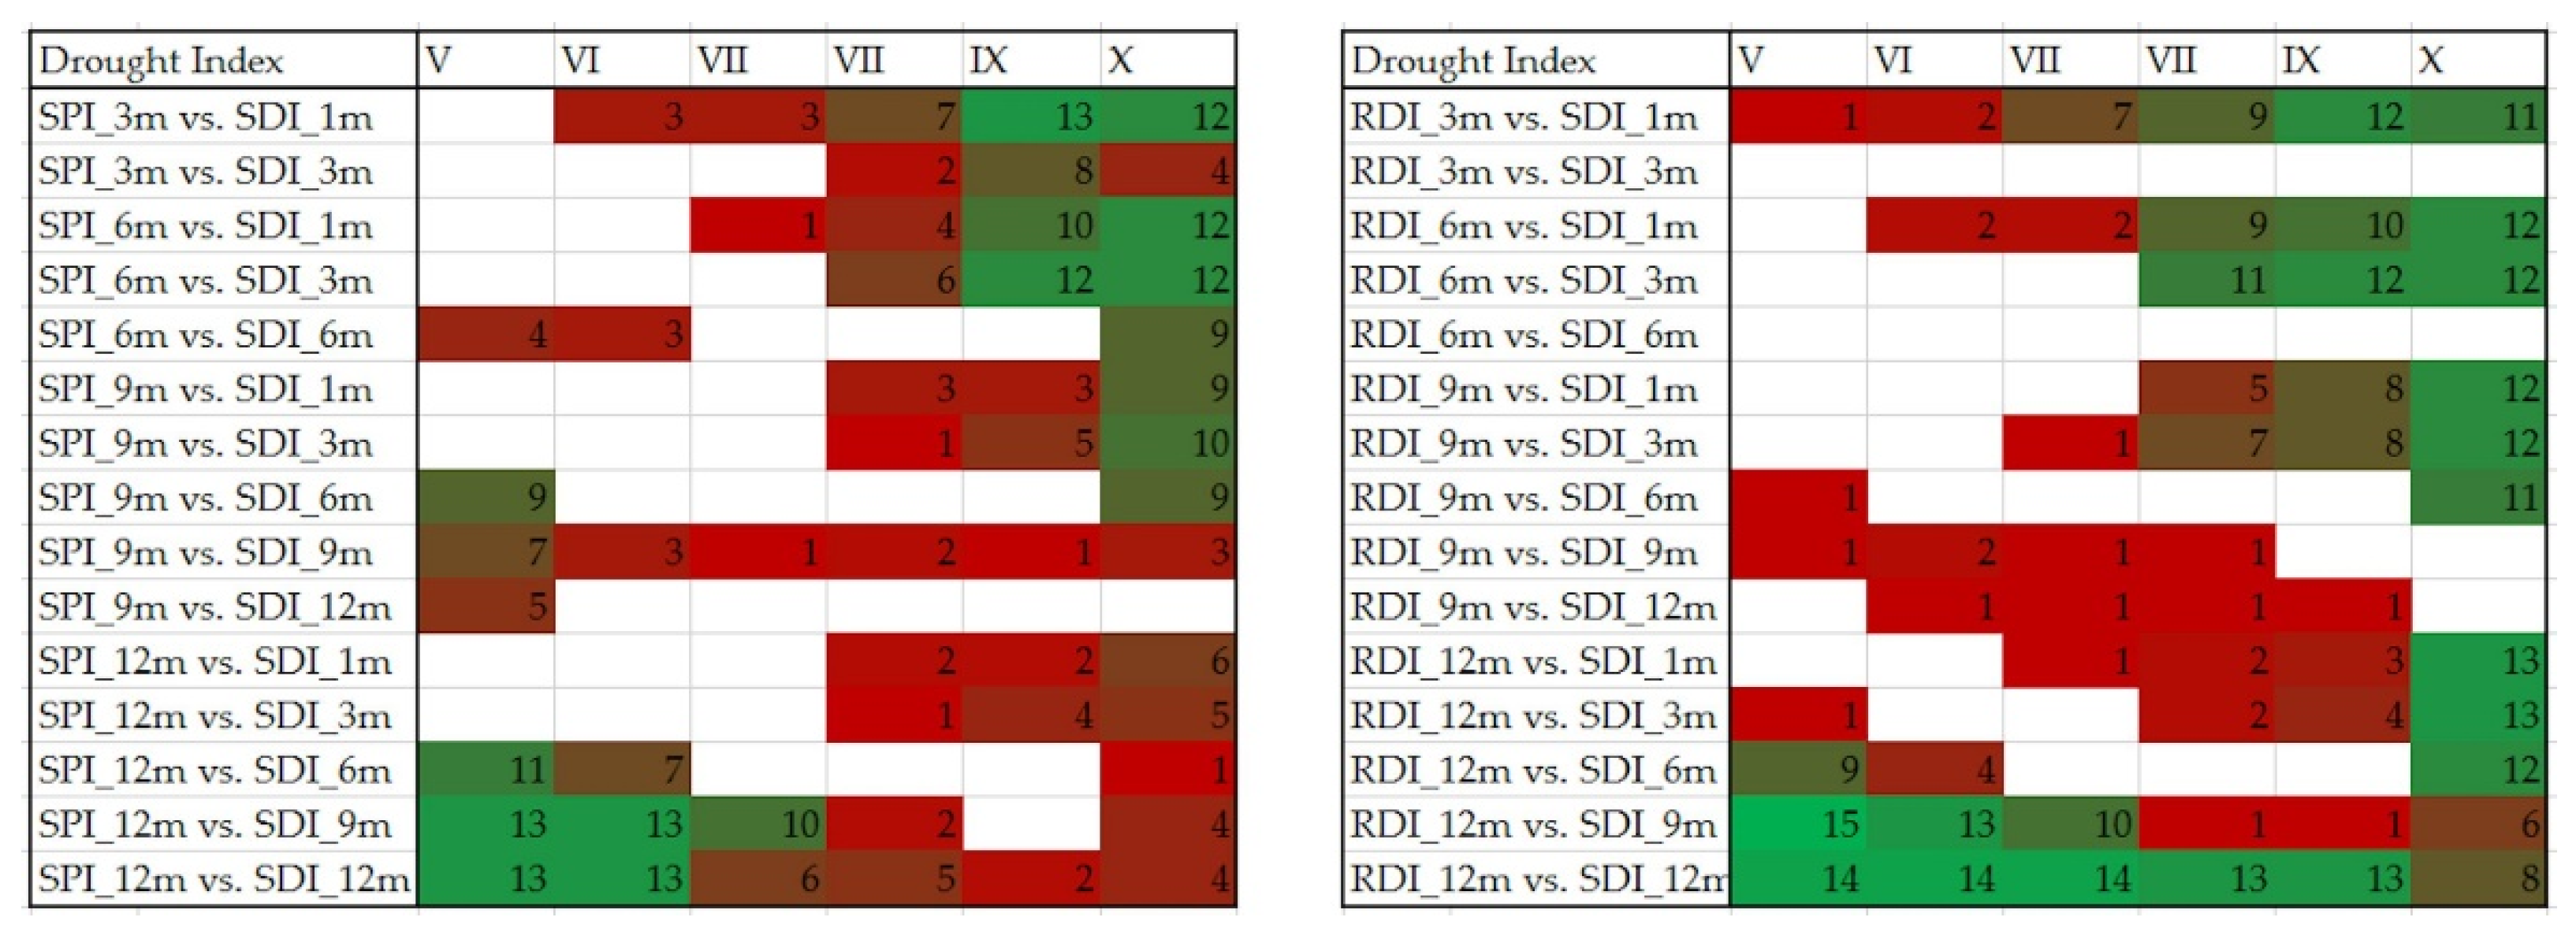
The correlation analysis between SPI and RDI indices with different lengths of accumulation periods (SPI-1 vs. RDI-1, SPI-3 vs. RDI-3, etc.) showed high correlation coefficients, which often approached 1. In most cases, the correlation between SDI and RDI was stronger than between SDI and SPI. Therefore, it was decided to present only the RDI index, as its differences from the SPI were insignificant, and the correlation of RDI with SDI was more pronounced. The general correlation matrix is shown in Figure 4.
The highest number of strong correlations was estimated between RDI-12 and SDI-12, RDI-12 and SDI-9, SPI-12 and SDI-12. For almost all rivers (15 out of 17), a strong correlation was determined between RDI-12 and SDI-9 in May; the correlation coefficient (r) ranged from 0.70 to 0.91, except for the rivers Verknė (r = 0.66) and Strėva (r = 0.52). The strongest correlation was found for the Venta River between the RDI-12 and SDI-12 indices for May (0.907). The highest number of strong correlations (r ≥ 0.7) was in October, followed by September and May (Figure 4).
It is also extremely important to analyze the distribution of correlations in the matrices. The highest number of cases of a strong correlation between the hydrological index with short accumulation periods (one and three months) and the meteorological index with different accumulation periods was determined in October and September. At that time, with long accumulation periods (9 and 12 months) of the hydrological index, most cases of strong correlations were found in May and June. Such a distribution indicates a significant impact on the river runoff of meteorological phenomena that occurred in the winter or summer–autumn period of the year before observation. In addition, a considerable number of strong correlations estimated in September and October indicate the decisive effects of meteorological phenomena on hydrological drought, as the relationship was present not only between short accumulation periods, but also between short accumulation periods of the hydrological index and long accumulation periods of the meteorological index (as an example of RDI-12 and SDI-1).
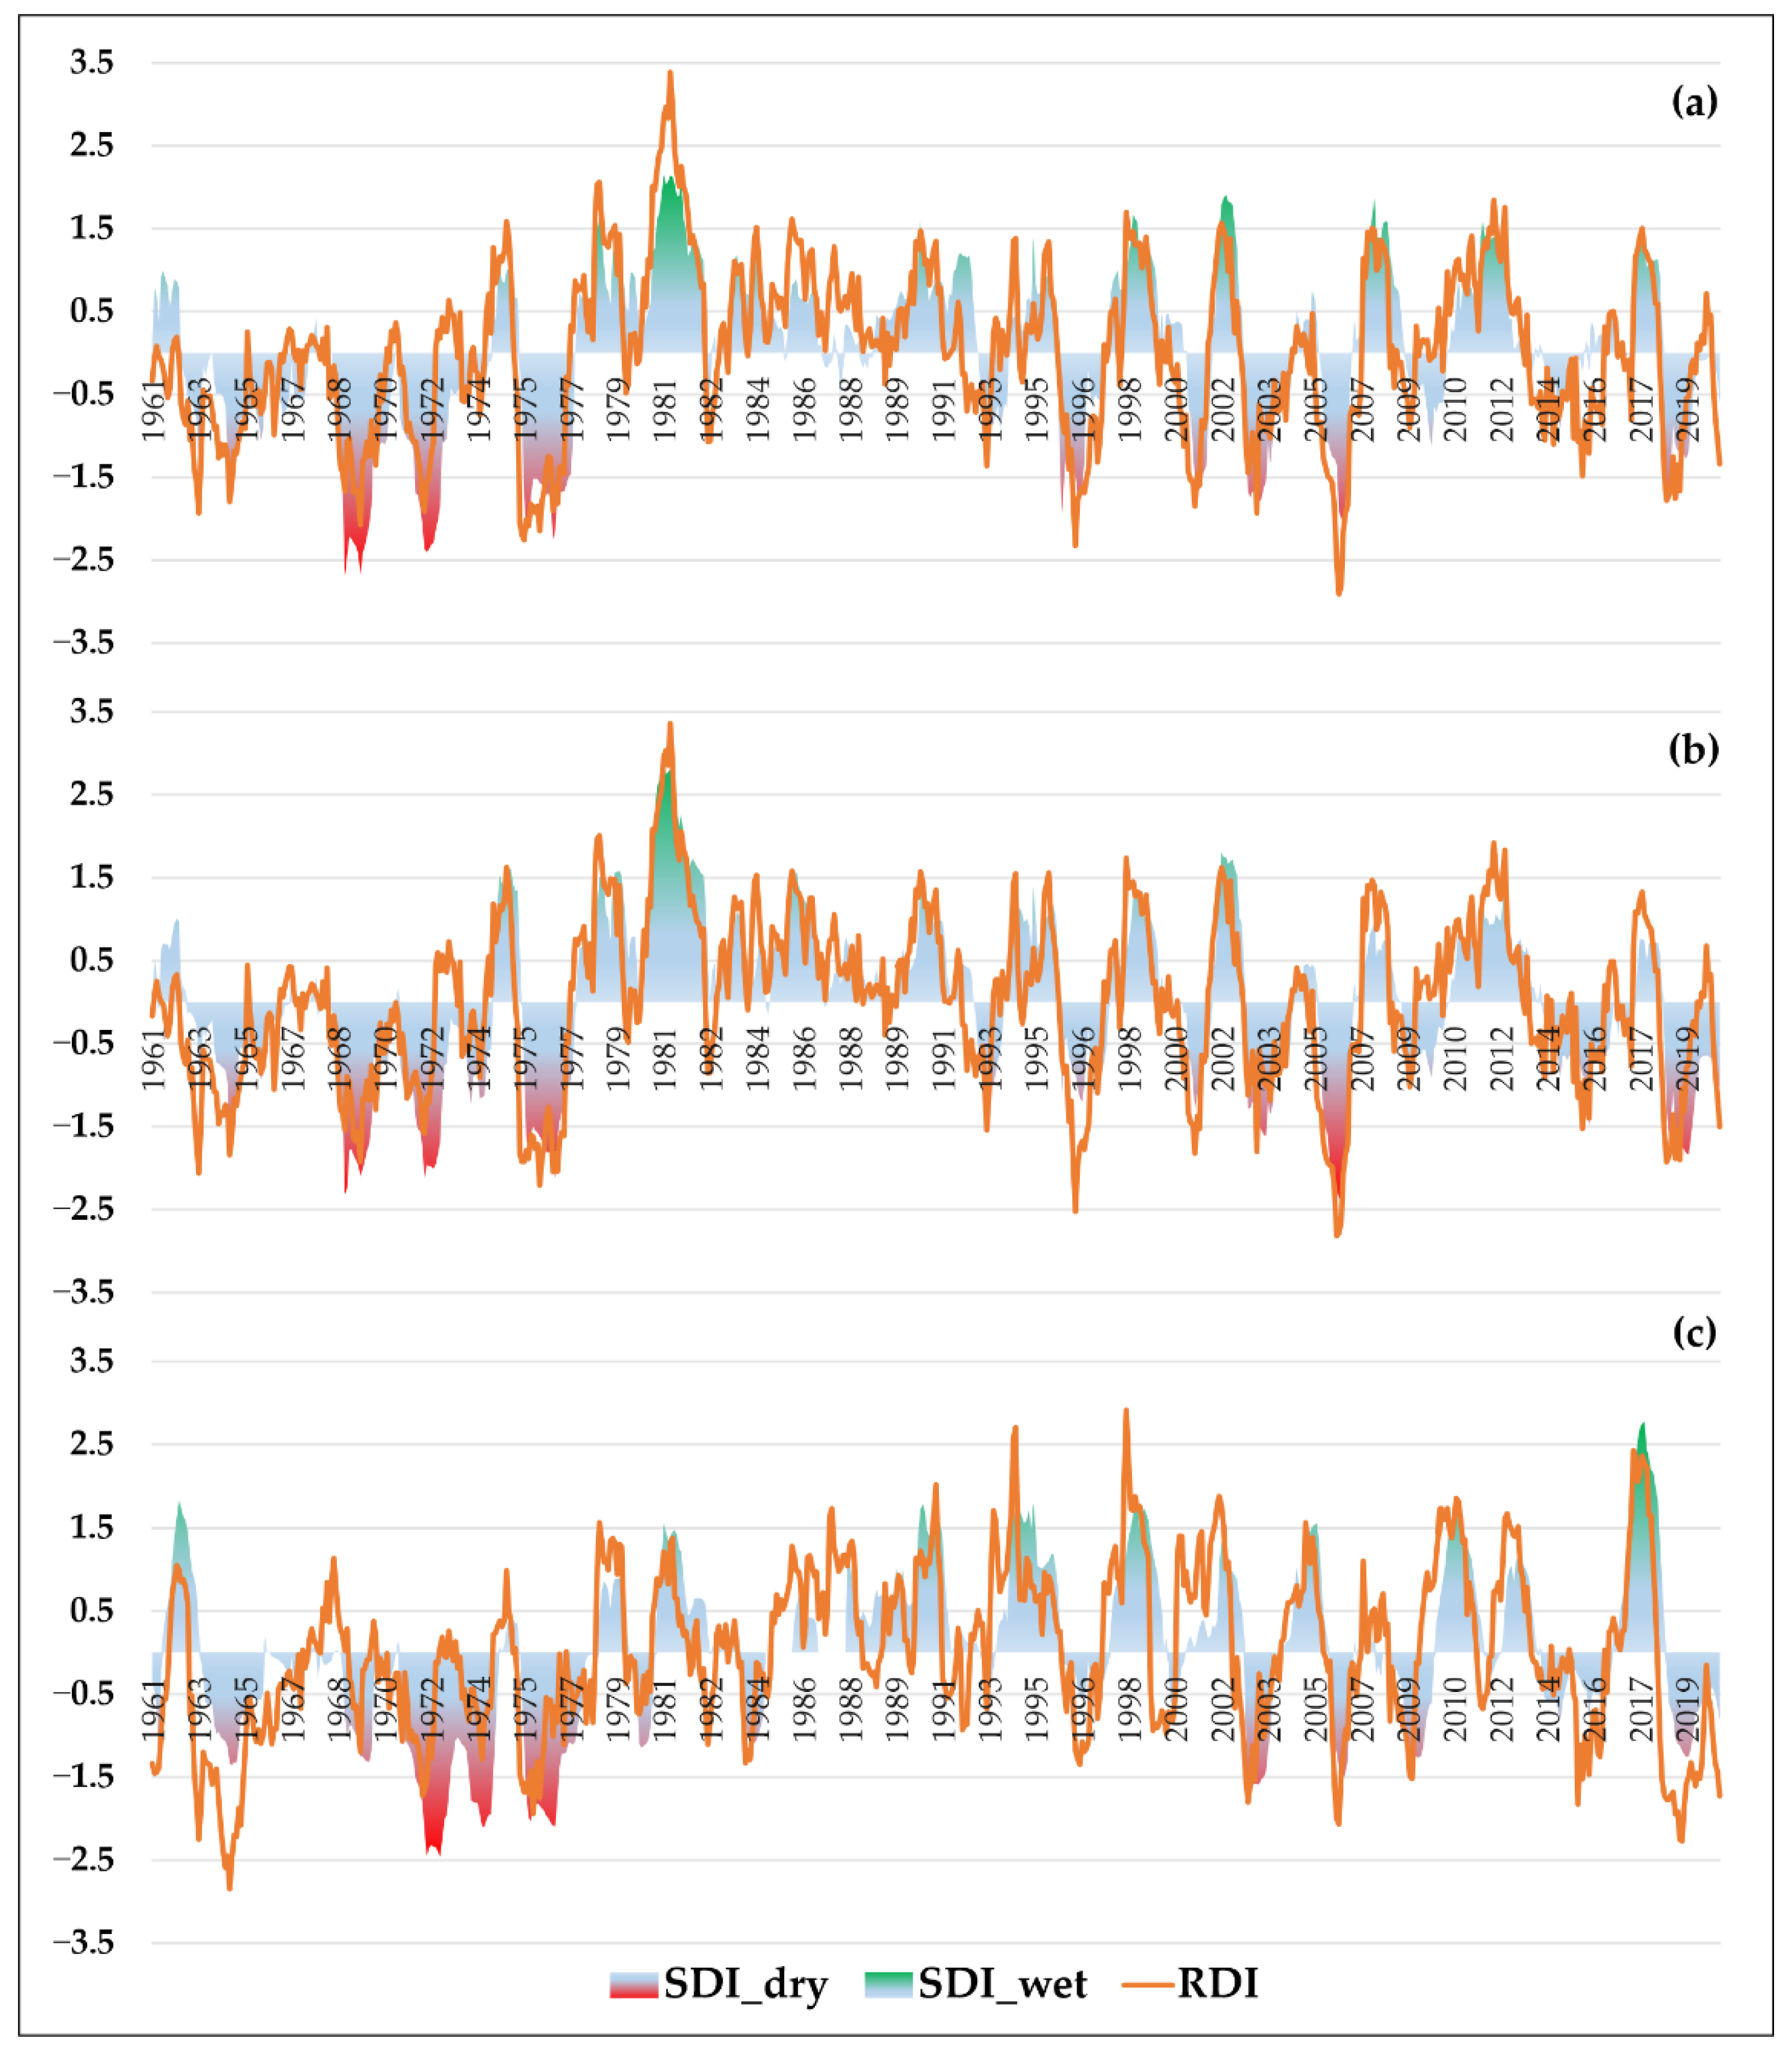
Figure 4 shows the highest correlations between meteorological and hydrological indices with 12 month accumulation periods. Three rivers from different hydrological regions were selected for a detailed analysis of the relationship between RDI and SDI indices (Figure 5). On average, hydrological drought followed the meteorological drought with a delay of three months, but this period may vary depending on the conditions preceding these events.
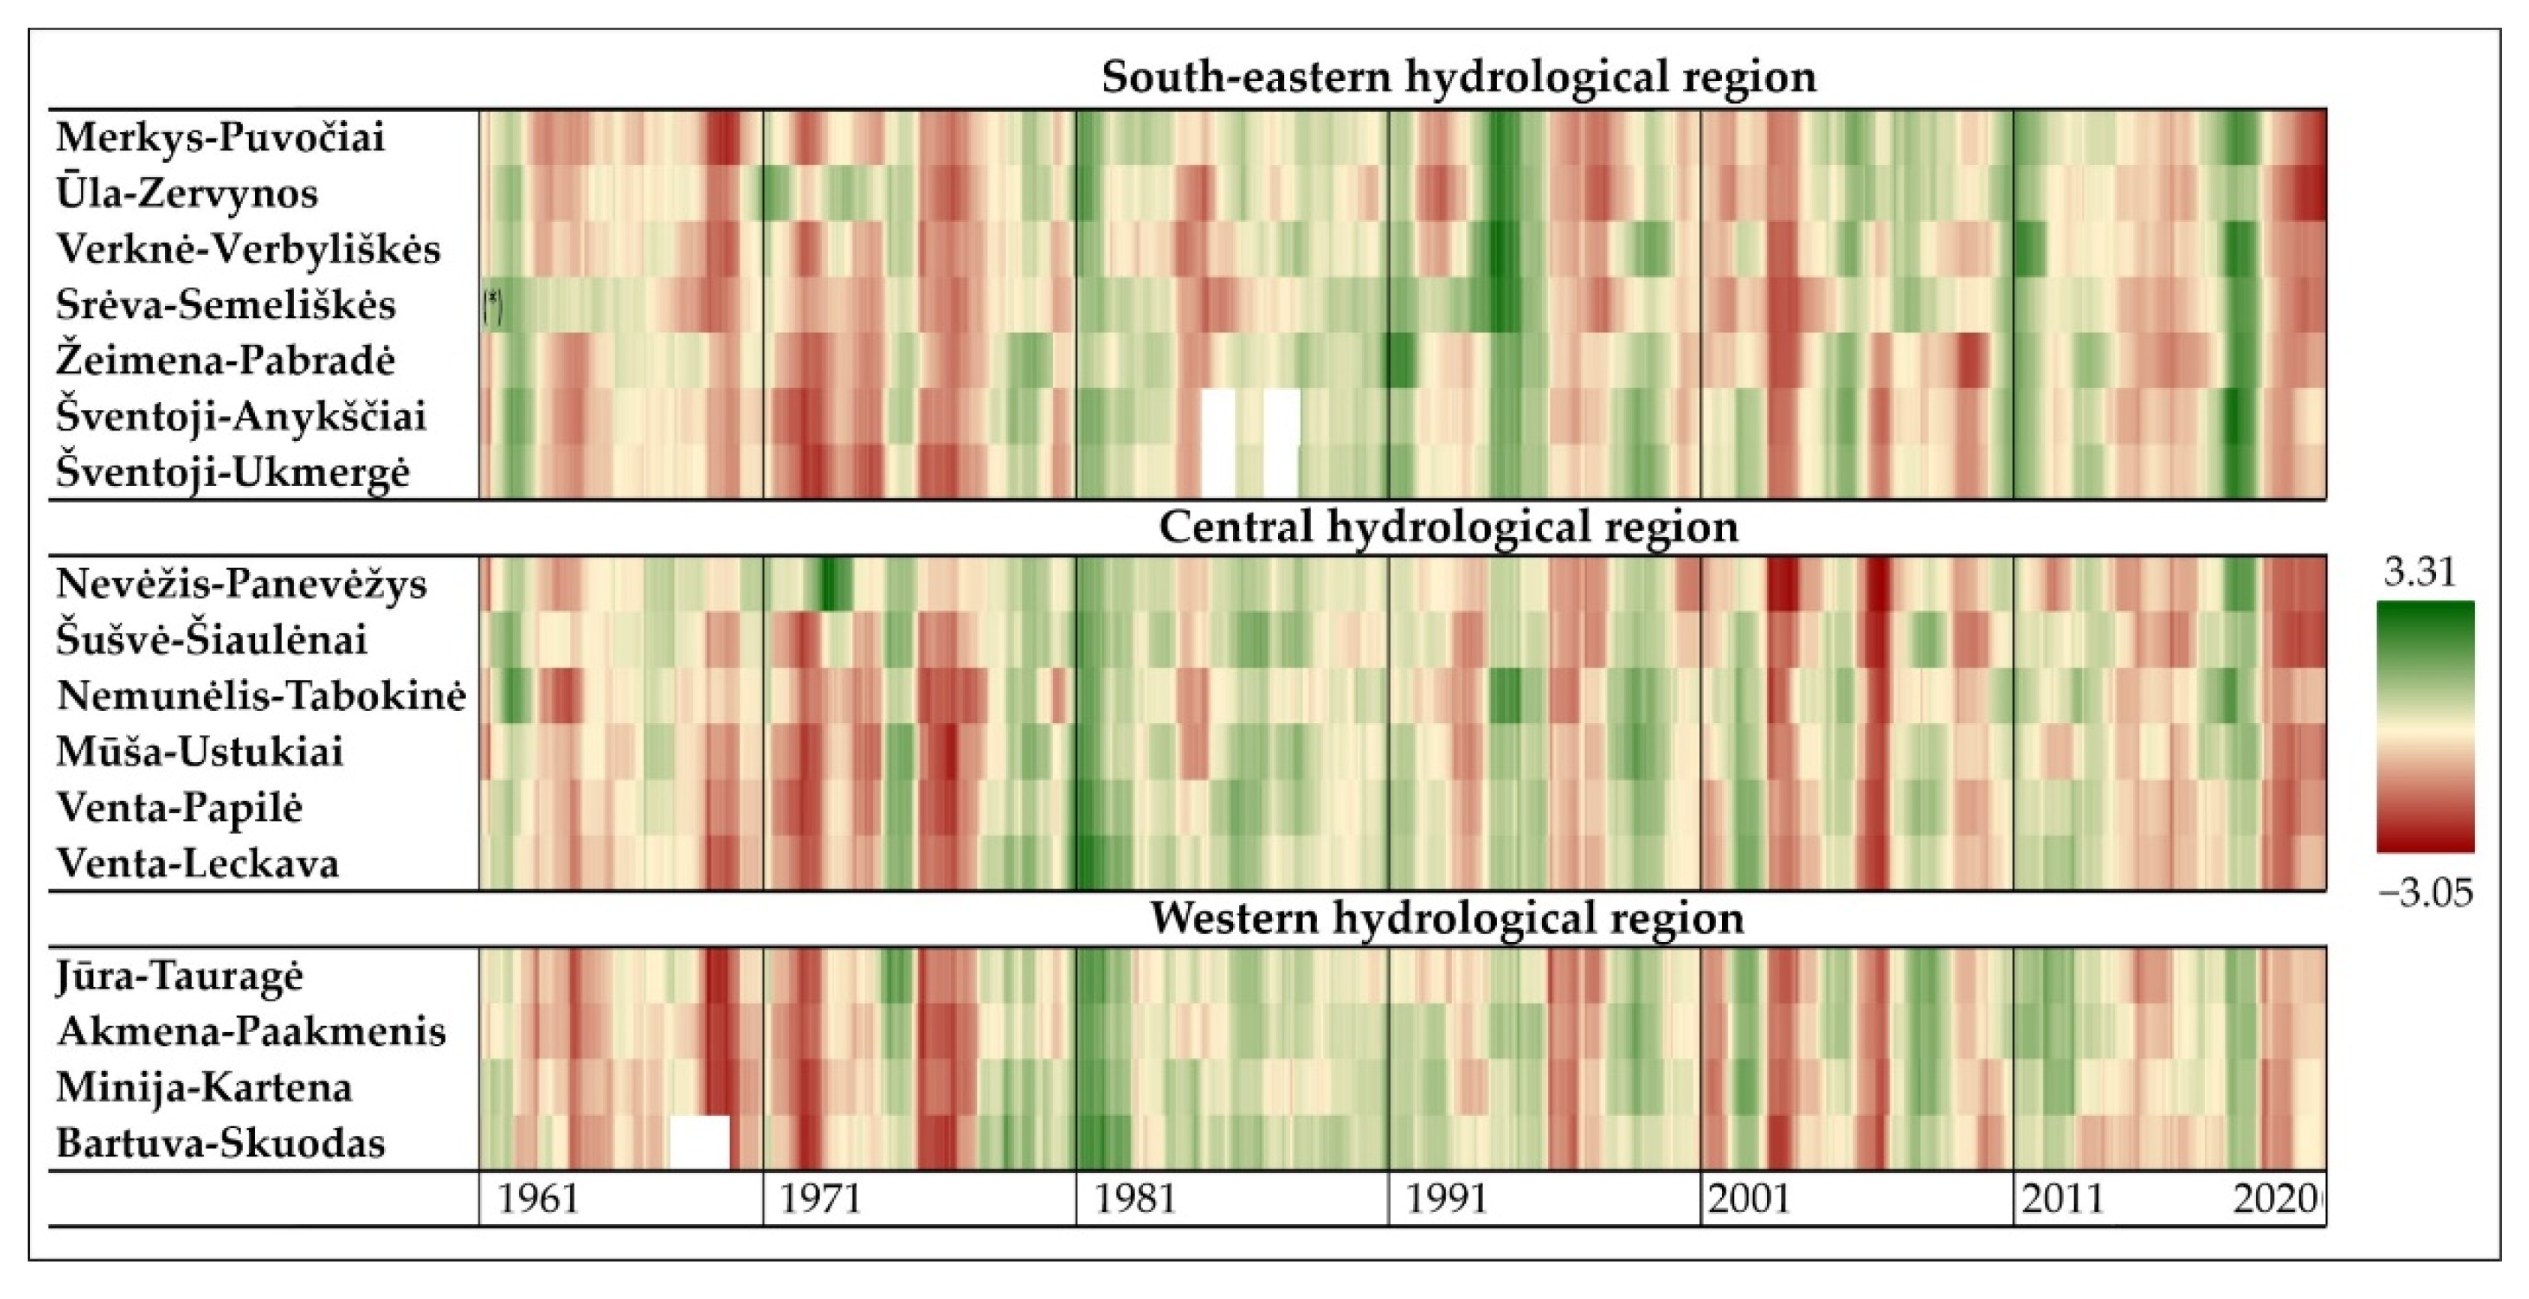
As seen in Figure 5, there was no significant difference between trends in the hydrological and meteorological indices. The Minija and Venta had almost identical plots of index values and a greater dependence on meteorological conditions, since variations in the hydrological index practically repeated the meteorological index. The Šventoji River had a larger difference between the values of hydrological and meteorological indices, but the trends were almost identical. The dry period in the Minija and Venta rivers dated from the end of 1964 to the second half of 1977, with peaks observed in 1969, 1972 and 1976–1977. The Šventoji had a similar dry period, but the extreme values were concentrated at the end of the dry period with peaks in 1972, 1974 and 1976–1977. No significant droughts were observed between 1977 and 1996 in the Minija and Venta rivers, and from 1977 to 2003 in the Šventoji River. In 1996, there was an extreme drought in the Minija, a moderated drought in the Venta and no drought in the Šventoji. There was also a difference in the wettest months: in the Minija and Venta rivers they were in 1981, and in the Šventoji river—in 2017–2018, also in some rivers of the Southeastern hydrological region in 1994 (Figure 6). From 1996 to 2006 in the Minija and Venta rivers, and from 2003 to 2009 in the Šventoji River there were a number of droughts with the extreme in 2006, especially in the rivers of the Central hydrological region (Figure 6). Further, by the end of 2018, the wet periods with short and moderated droughts predominated, and from 2019, droughts appeared throughout Lithuania, with a slight delay in the Southeastern hydrological region (Figure 5 and Figure 6). The values of the indices remained negative until the end of 2020, except for four months in the Bartuva River (Figure 6).
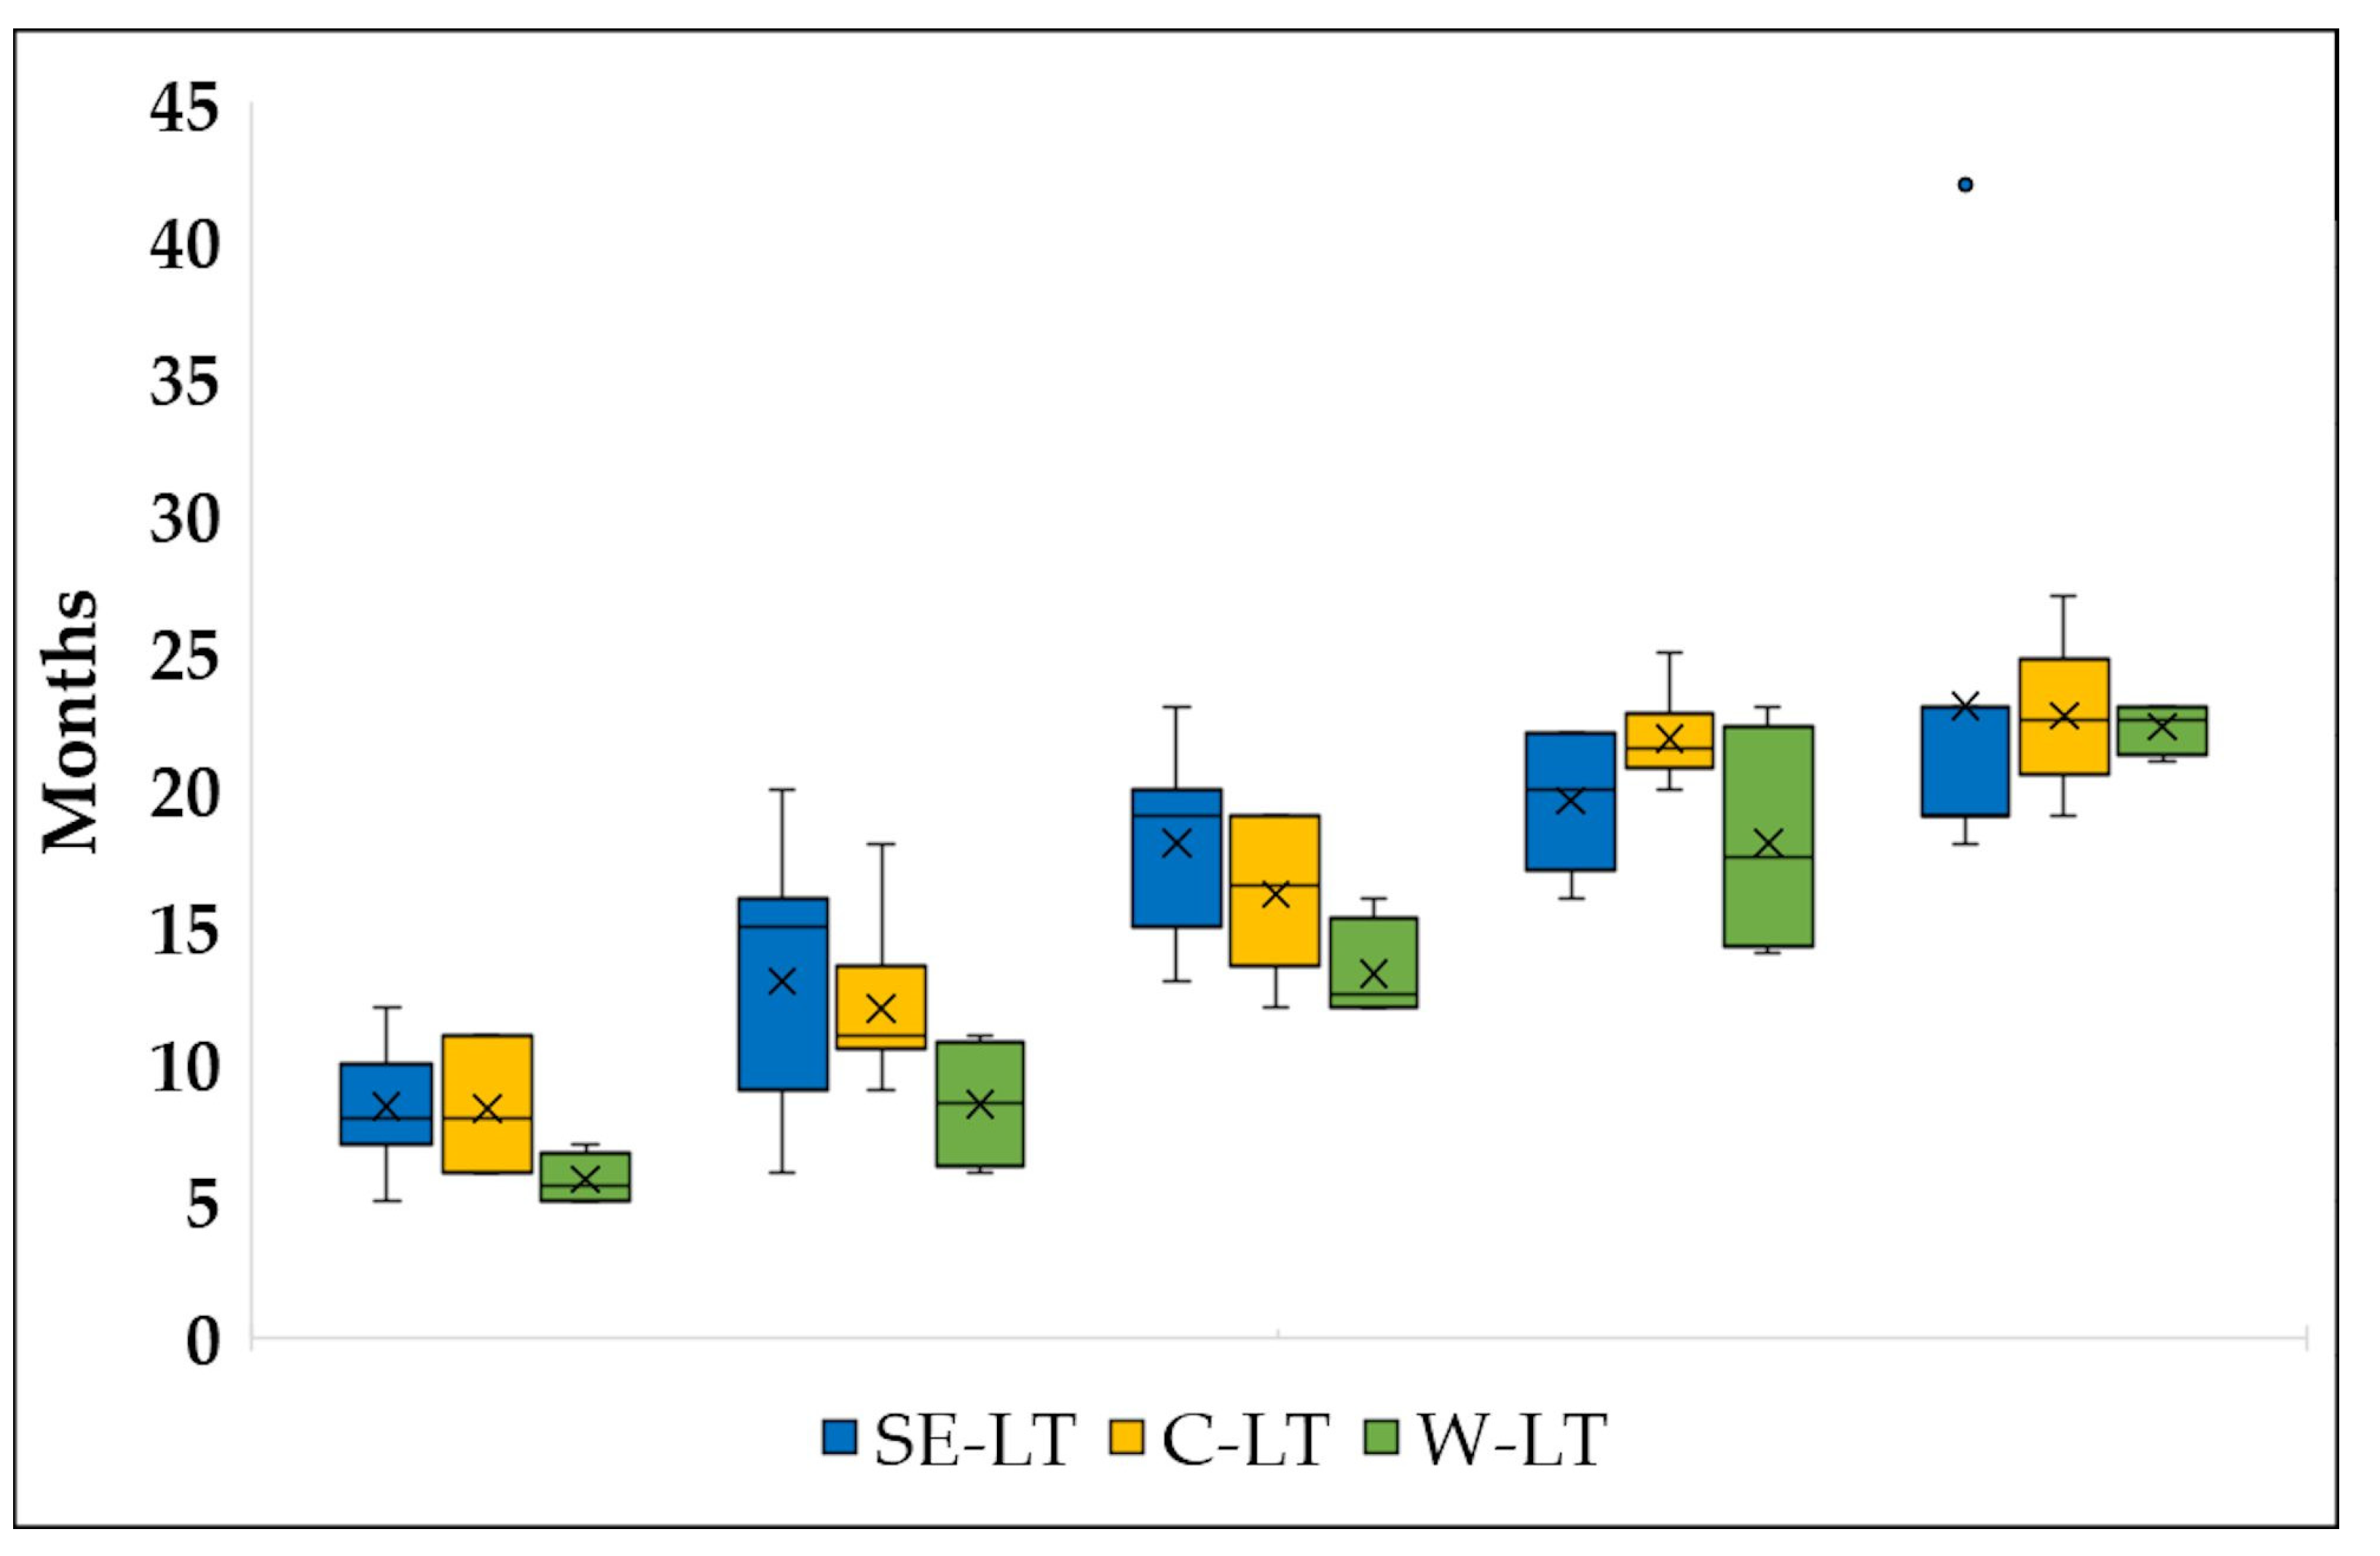
3.5. Analysis of the Hydrological Drought Duration
Duration is one of the main characteristics of droughts. The drought period was considered the period from the month when the SDI value was ≤−1. The duration of the maximum drought increased with the extension of the accumulation period (Figure 7). On average, the duration of hydrological droughts in the W-LT was shorter compared to the SE-LT and C-LT. The maximum duration of the drought was recorded for a 12-month accumulation period in the SE-LT (the Šventoji catchment). The drought lasted 42 months from 05.1971 to 10.1974. The extreme values of SDI-12 for this river (−2.46) were also observed in this period (10.1972). The maximum duration of drought in the C-LT was noted with a 12-month accumulation period in the Nemunėlis River—27 months from 12.1975 to 02.1978. The W-LT had the shortest maximum drought duration among regions based on SDI-12—23 months. This duration was recorded in two rivers of the region: the Akmena and Minija from 12.1975 to 10.1977. Most of the longest droughts were estimated in 1963–1977, which was the driest in the entire analyzed period [34]; almost all extreme droughts were from this period.
3.6. Distribution of Droughts by Summer Months and Their Number
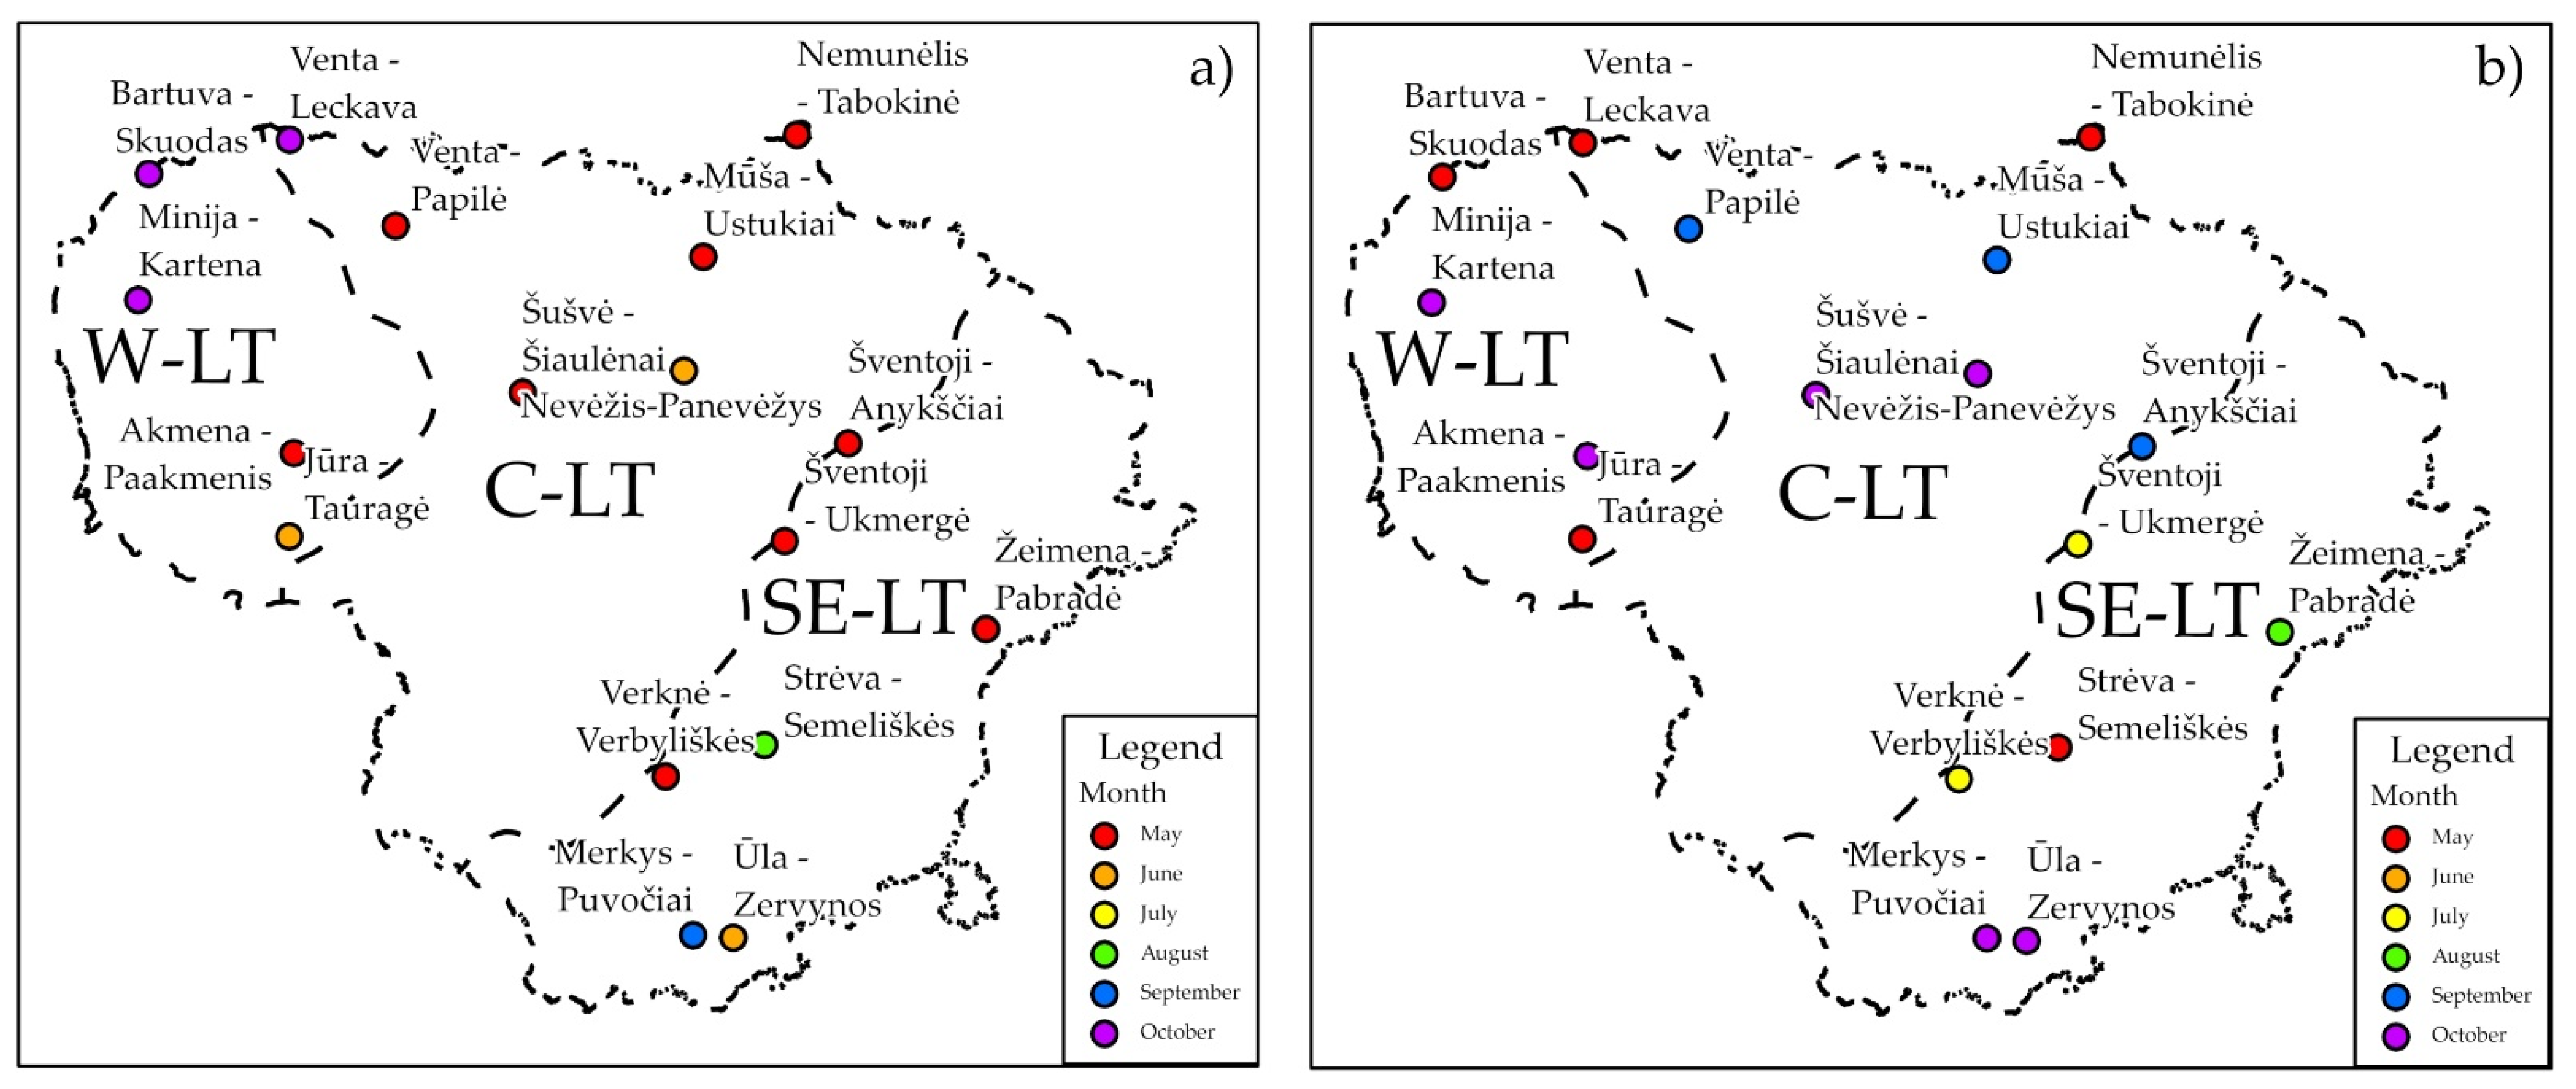
When analyzing the months with the highest number of droughts (Figure 8), it was concluded that there was no clear distribution pattern of rivers related to the driest months in Lithuania. SDI-1 was characterized by the greatest similarity between rivers in terms of the driest months. In most cases with a 1-month accumulation period, most drought events occurred in the first two months of the warm season (May and June). Still, there were also three rivers in northwestern Lithuania, where the greatest number of drought events occurred in October. For SDI-3, the dominance of droughts in the first half of the warm period continued. No patterns were distinguished for SDI-6 and SDI-9. SDI-12 also did not have a clear distribution related to dry months, but there was an increase in the number of droughts in the second half of the warm season.
For comparative analysis, it was decided to calculate the total number of Severely Dry and Extremely Dry months during the warm periods.
According to SDI-1 (Figure 9), the Western hydrological region had the lowest number of Severely Dry and Extremely Dry months, while the Southeastern hydrological region had the highest number. SDI-3 showed similar but less pronounced differences between regions. The analysis of SDI-6 revealed no significant differences between regions. According to SDI-9 and SDI-12, prolonged droughts were more prevalent in the W-LT and C-LT, while the catchments from the SE-LT had fewer dry months. From the above, it can be concluded that the SE-LT is more prone to the extreme summer droughts, which have a shorter period compared to the C-LT and W-LT. However, with a longer accumulation period, the runoff deficit decreased in the SE-LT due to its leveling by wet months. While in the W-LT and C-LT, longer periods with runoff deficit led to more prolonged droughts.
3.7. Analysis of Trends in Future Droughts
It was decided to use a 12-month accumulation period to analyze the projected data, as it sufficiently shows the trends in the occurrence of droughts. Moreover, due to the “smoothing”, it is possible to obtain data closer to the real ones and eliminate extraordinary values.
Meteorological and hydrological indices were calculated for the period from 2021 to 2100 (in total, 80 years). The comparison was made separately for the first subperiod (the near future or the first 50% of the calculated index values) and the second subperiod (the far future or the last 50% of the calculated index values).
3.7.1. Analysis of Future Meteorological Droughts
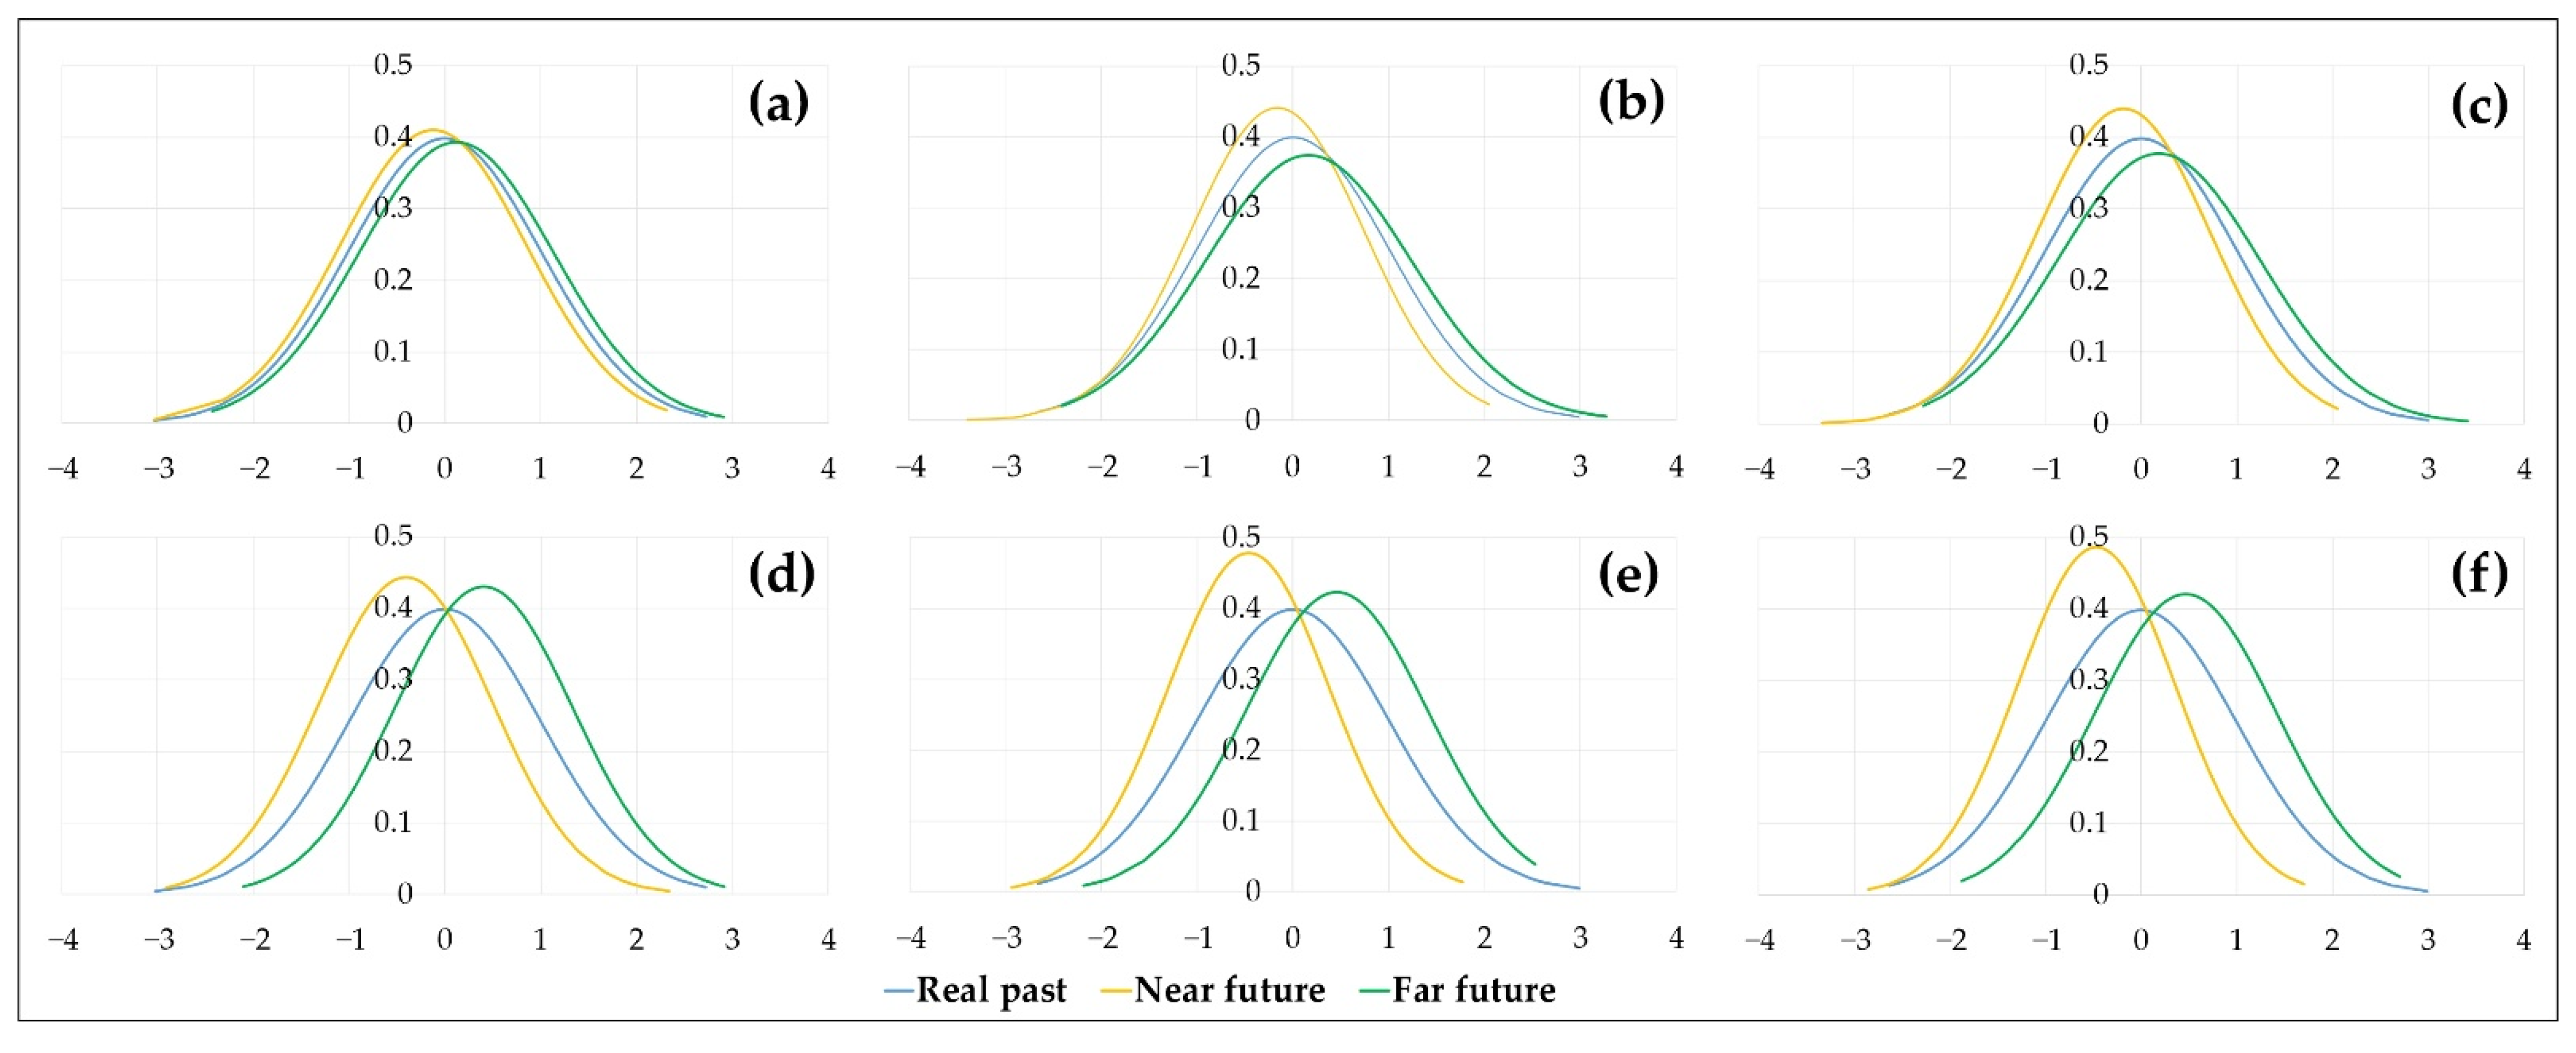
Meteorological indices (SPI and RDI) were calculated according to two scenarios RCP 4.5 and RCP 8.5. The distribution of the SPI index values obtained based on RCP 4.5 is similar to the historical distribution of SPI index values (Figure 10a–c). In all catchments, the number of months with normal conditions decreases in the far future (Table 5). The prognosed percentage of extremely dry months (SPI-12 < −2 according to the RCP 4.5 scenario) increases in the Šventoji and Venta rivers compared to the historical period (most are concentrated in the far future), and opposite trends are observed in the Minija (Table 5).
The distribution of the SPI index values according to RCP 8.5 had more significant deviations than the historical distribution. (Figure 10d–f). As in the case of the RCP 4.5 scenario, all catchments were characterized by increasing deviations from the historical values in the far future (Table 6). Under scenario RCP 8.5, more droughts are expected in the near future, while more wet events are expected to occur in the far future.
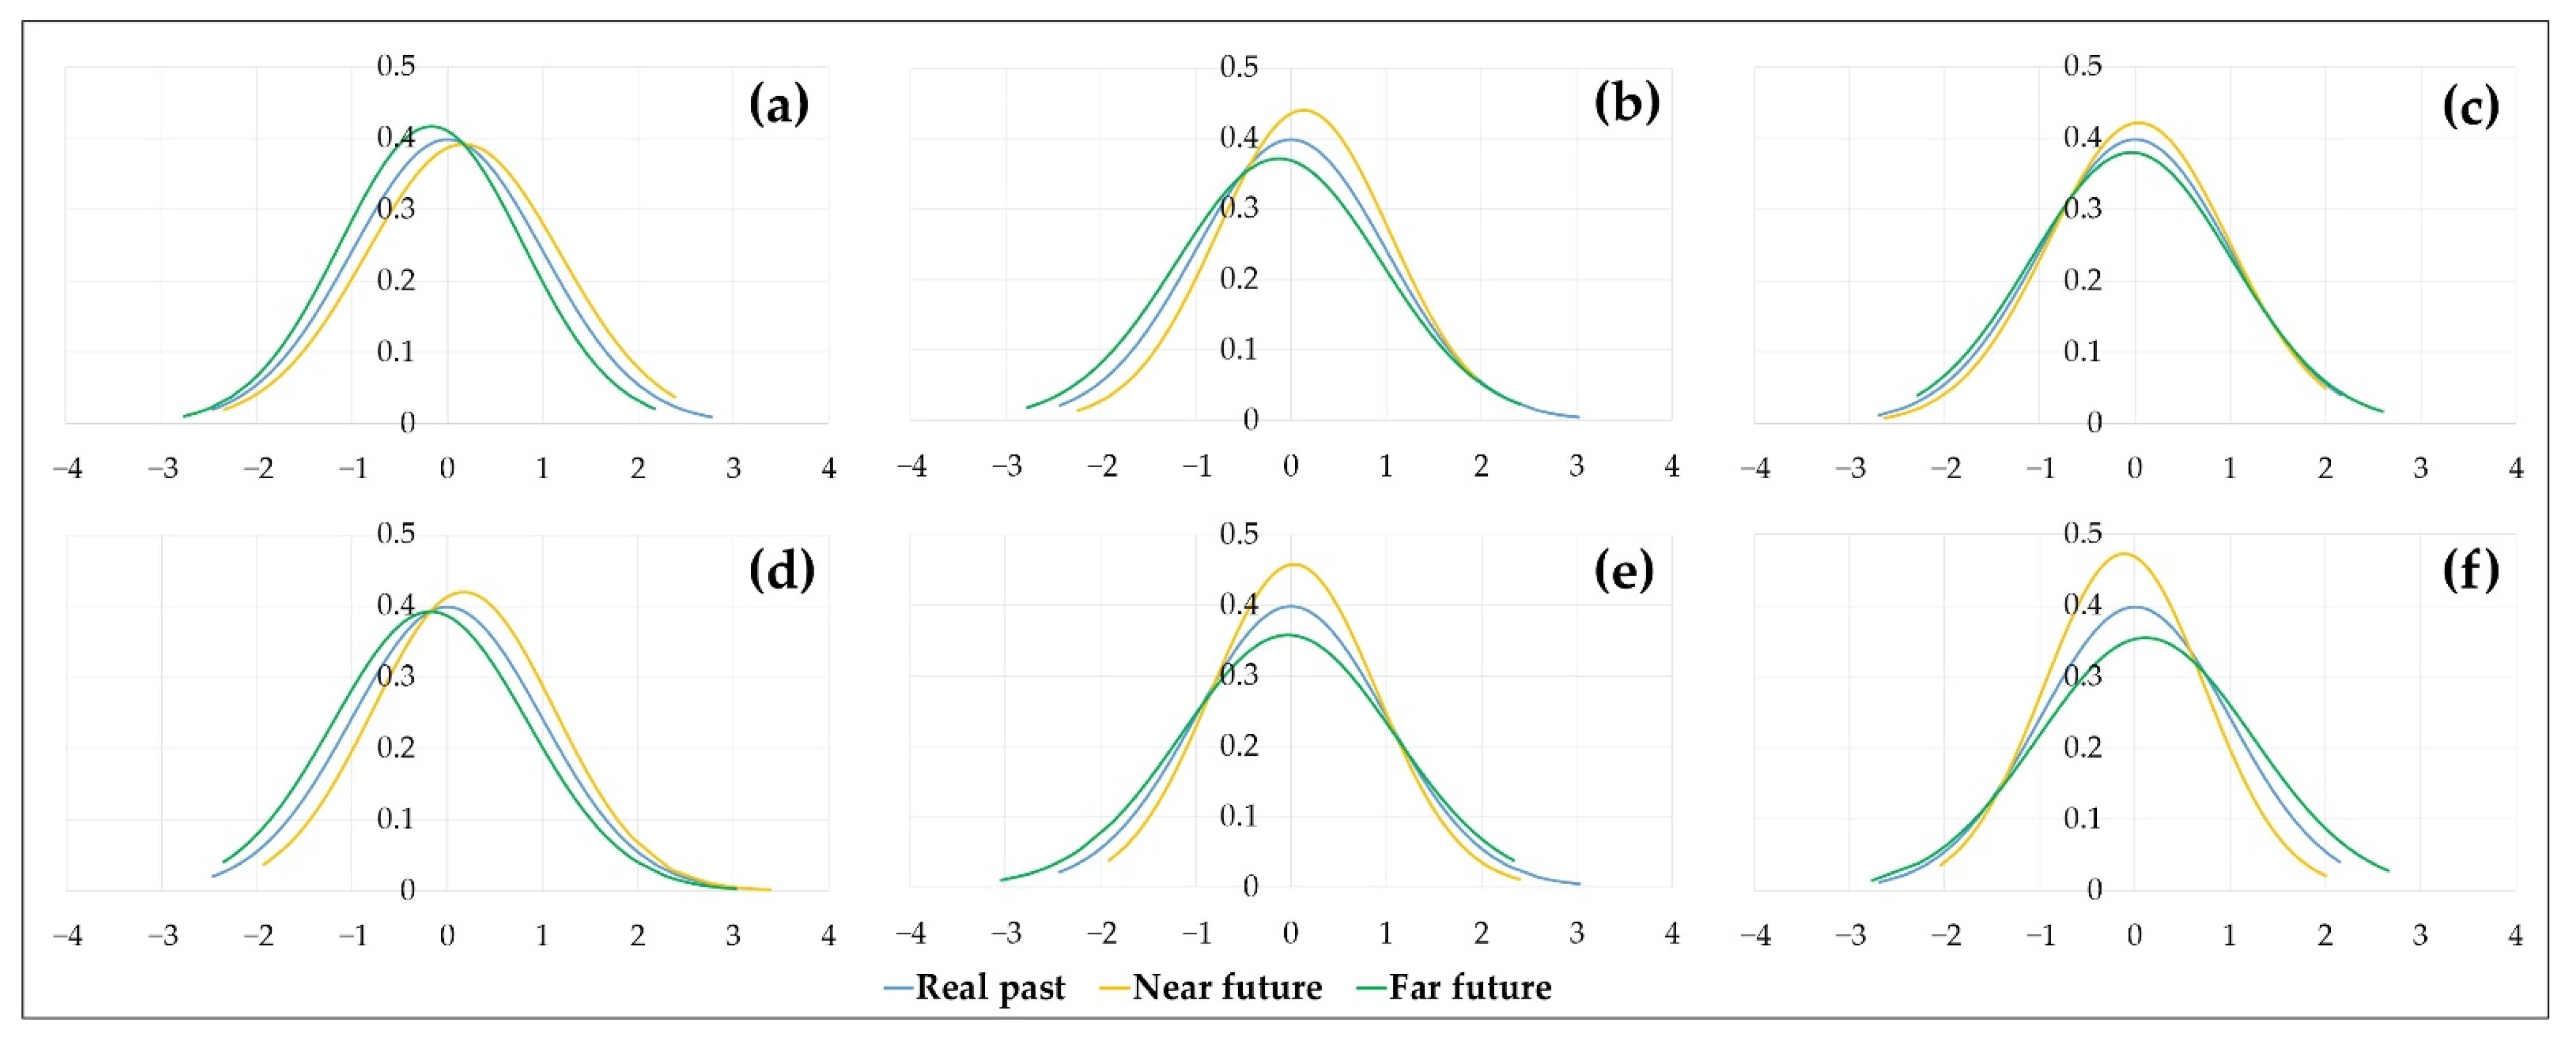
The distribution of RDI index values in both RCP 4.5 and RCP 8.5 scenarios was close to the historical distribution of the data (Figure 11). The percentage of extreme droughts (RDI < −2 according to the RCP 4.5 scenario) is projected to increase compared to the historical period in all rivers (Table 7). Most months with extreme droughts are expected in the distant future.
According to the RDI index calculated under scenario RCP 8.5, an increase in extremely wet months and a decrease in extremely dry months are expected in the Šventoji, and Minija catchments, with most extreme months concentrated in the near future (Table 8).
As can be seen from Figure 10 and Figure 11, the SPI and RDI meteorological indices had significant differences in data distribution, especially under the RCP 8.5 scenario. Such differences may be due to the data used to calculate these indices. In general, historical modelled precipitation data significantly differed from real observation data, while the temperature was more accurate for forecasting. Despite the quantile mapping method, these differences remained. Thus, the SPI index based solely on precipitation gave much more significant differences in data distribution. The RDI index eliminated significant precipitation deviations due to evaporation data (calculated from the temperature) and gave a more even distribution of values.
3.7.2. Analysis of Future Hydrological Droughts
According to the SDI index, calculated using the RCP 4.5 scenario, the percentage of severely and extremely dry months are projected to remain similar to the historical period in the Venta, decrease in the Šventoji and increase in the Minija (Table 9 and Figure 12a–c). In general, the number of dry months is expected to be higher in the far future. Basically, the percentage of extremely wet months should decrease in the future, compared to historical data, with the exception of the Minija (Table 9).
SDI index values calculated using RCP 8.5 scenario showed similar trends as for scenario RCP 4.5 (Figure 12). An increase in the percentage of extremely wet months compared to the historical period was estimated in the far future, while the percentage of severely and extremely dry months decreased (Table 10). It should be noted that most dry months according to the hydrological index are projected at the end of the century.
3.7.3. Comparison of Rivers, According to Meteorological and Hydrological Drought Indices in Future
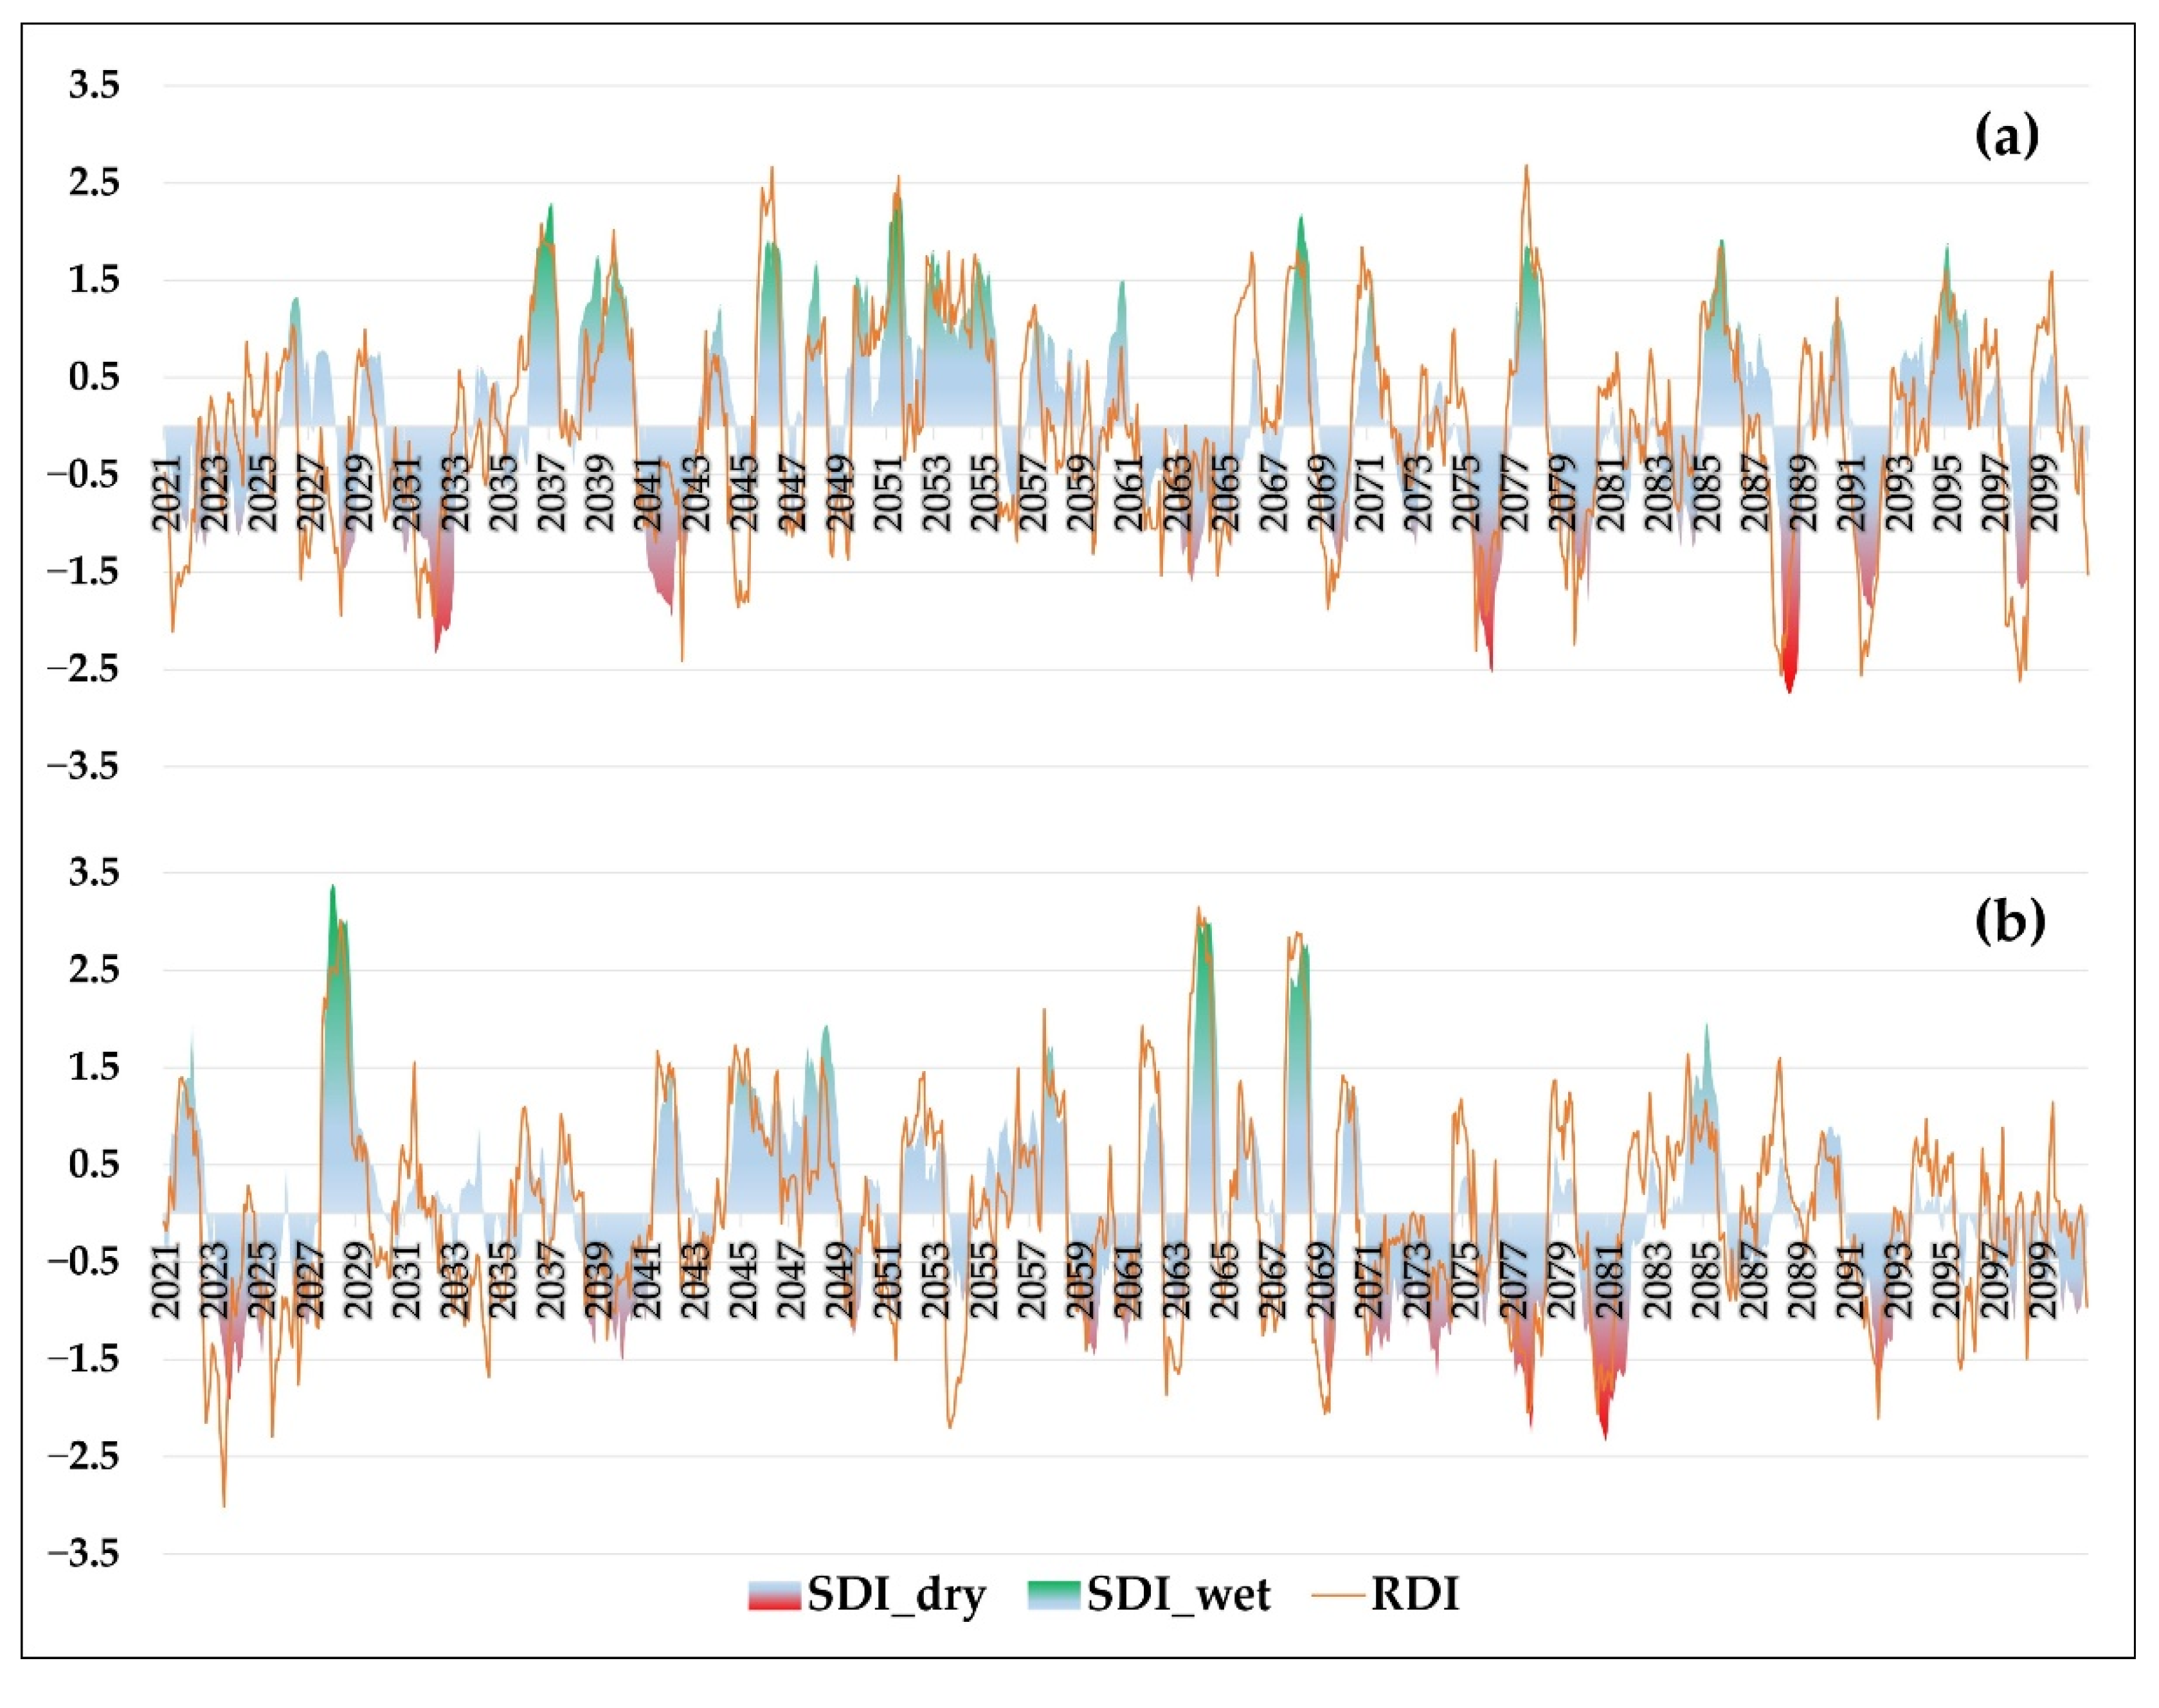
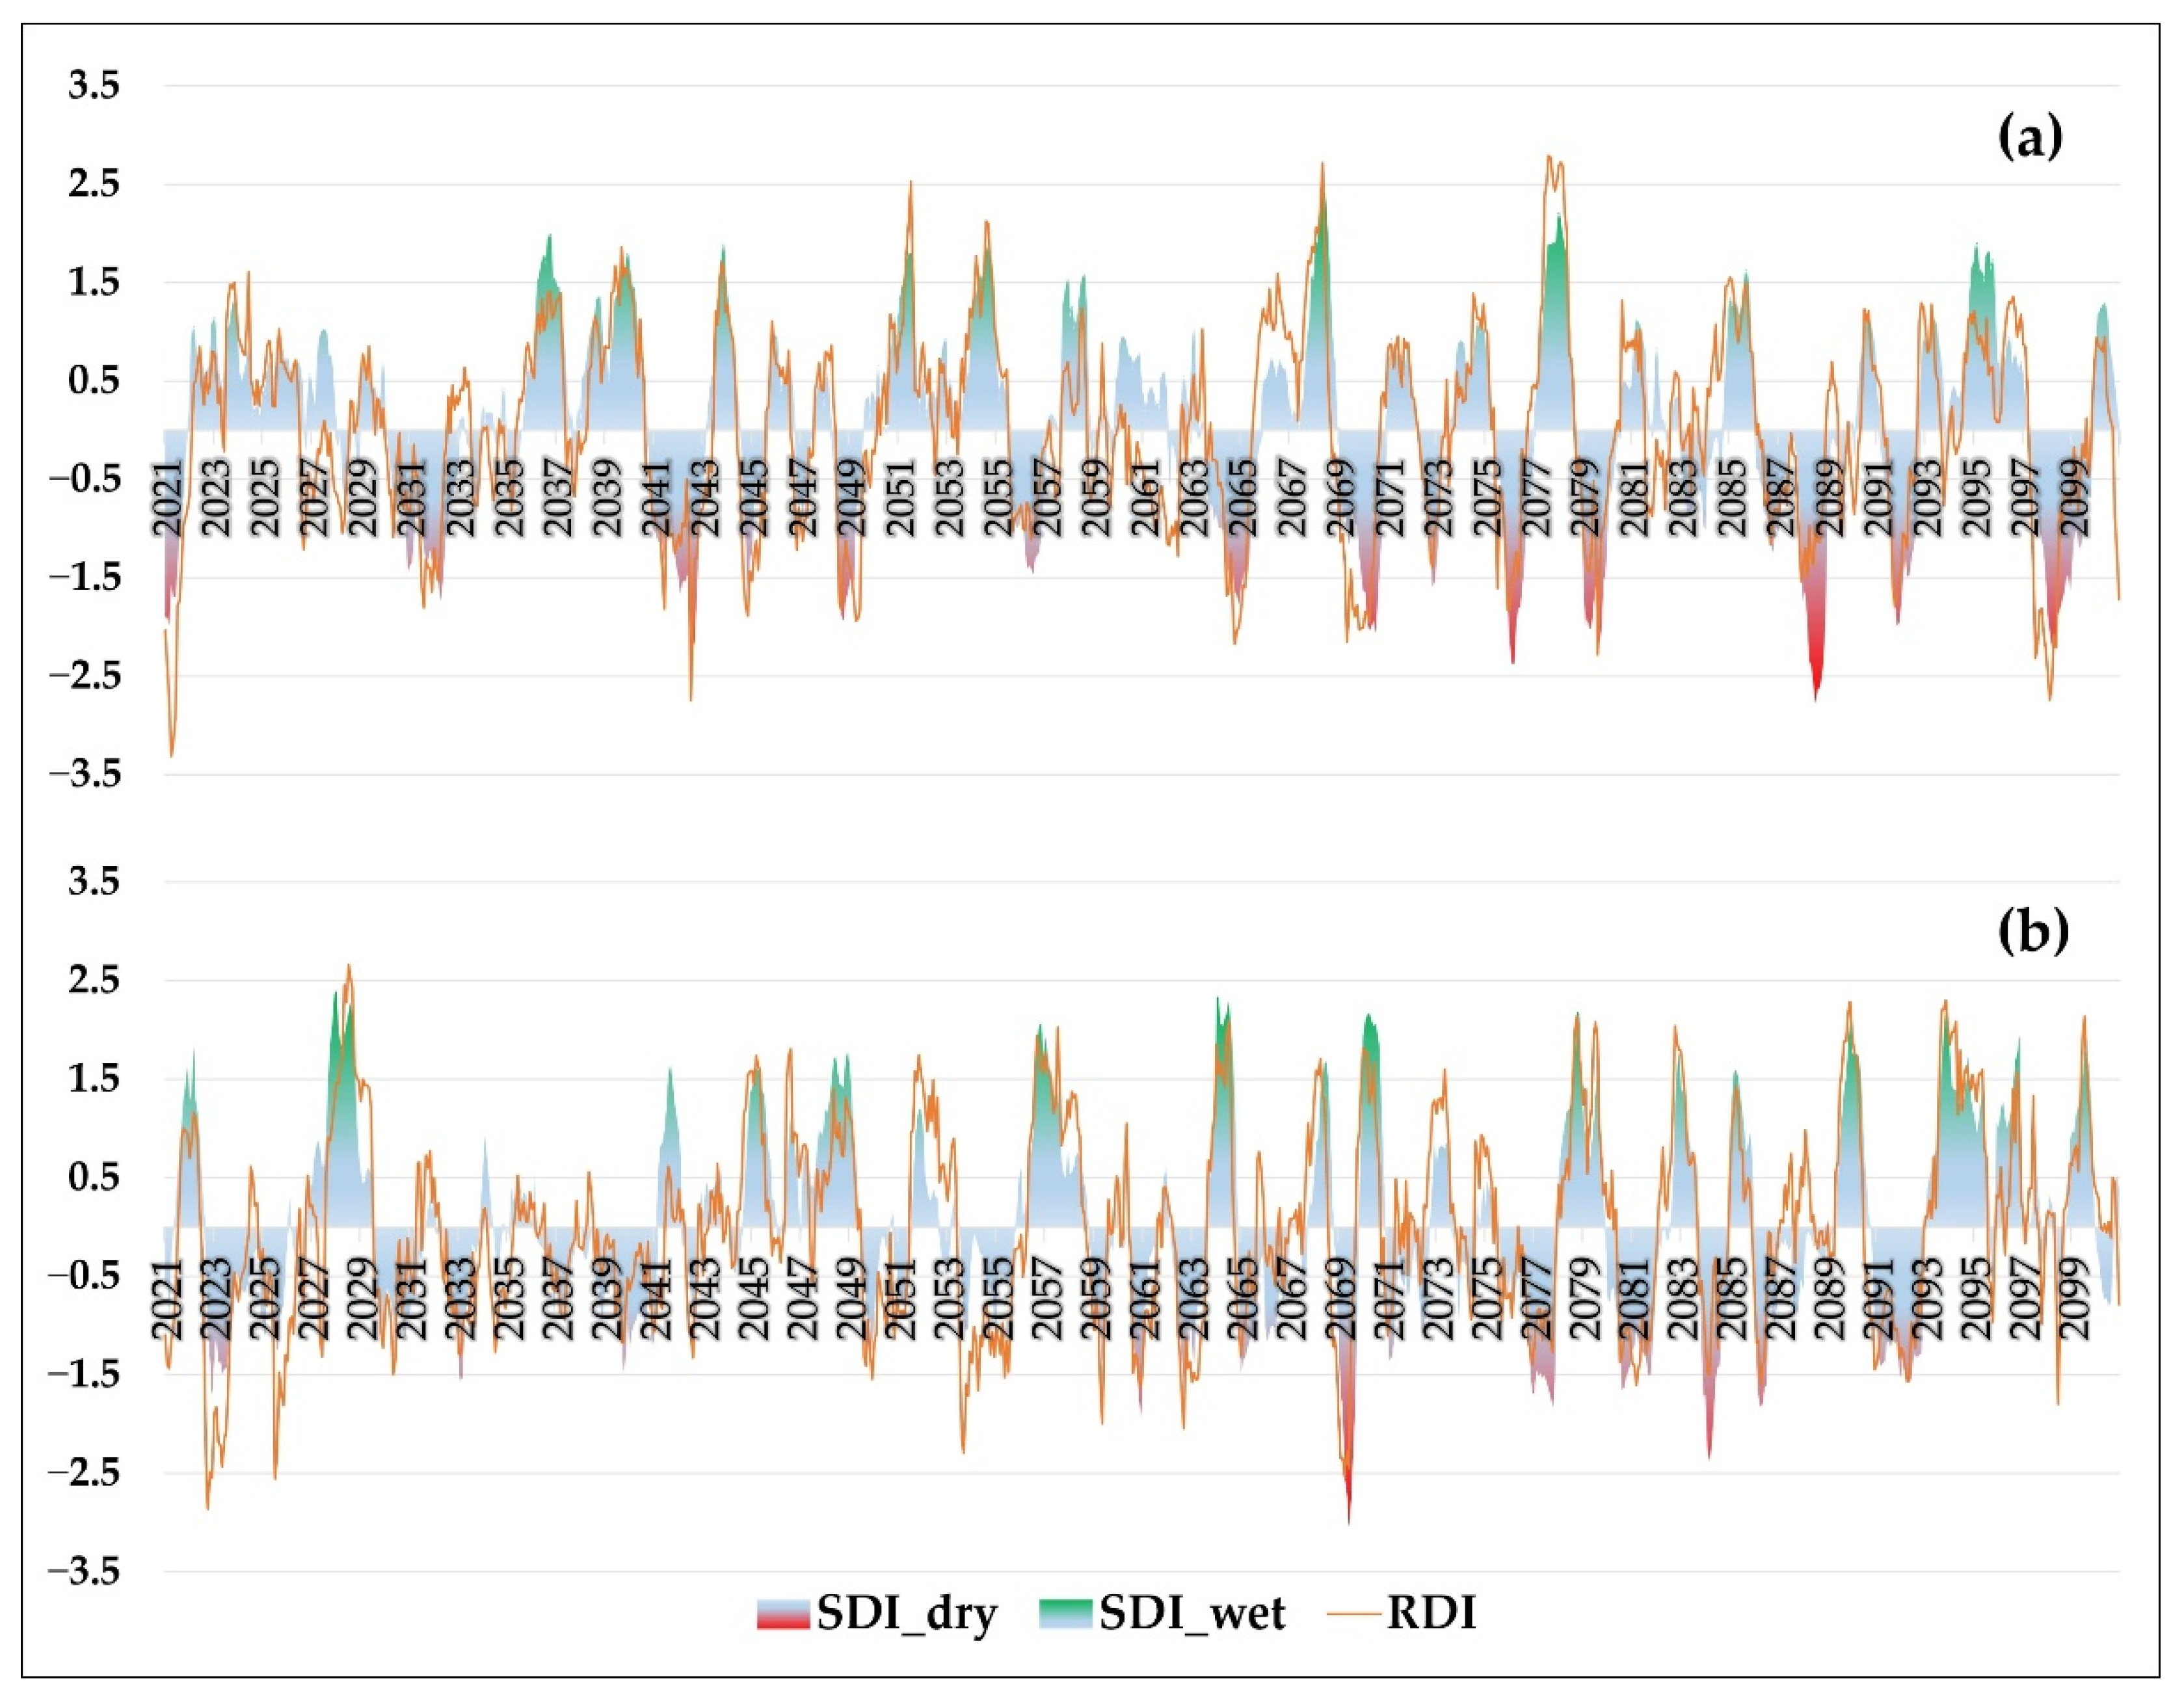
As noted in Section 3.7.2, most hydrological droughts are expected in the far future period. Depending on the climate scenario, each river has its unique characteristics. For example, the SDI index in the Šventoji is characterized by more extreme droughts under the RCP 4.5 scenario, as well as more extreme wet events under the RCP 8.5 scenario (Figure 13). The SDI index, based on the RCP 4.5 scenario, in the Šventoji is characterized by a higher number of severe and extreme dry months. In addition, the opposite extreme values are changing sharper too. While the RCP 8.5 scenario gives a much smaller amplitude of fluctuations most of the time.
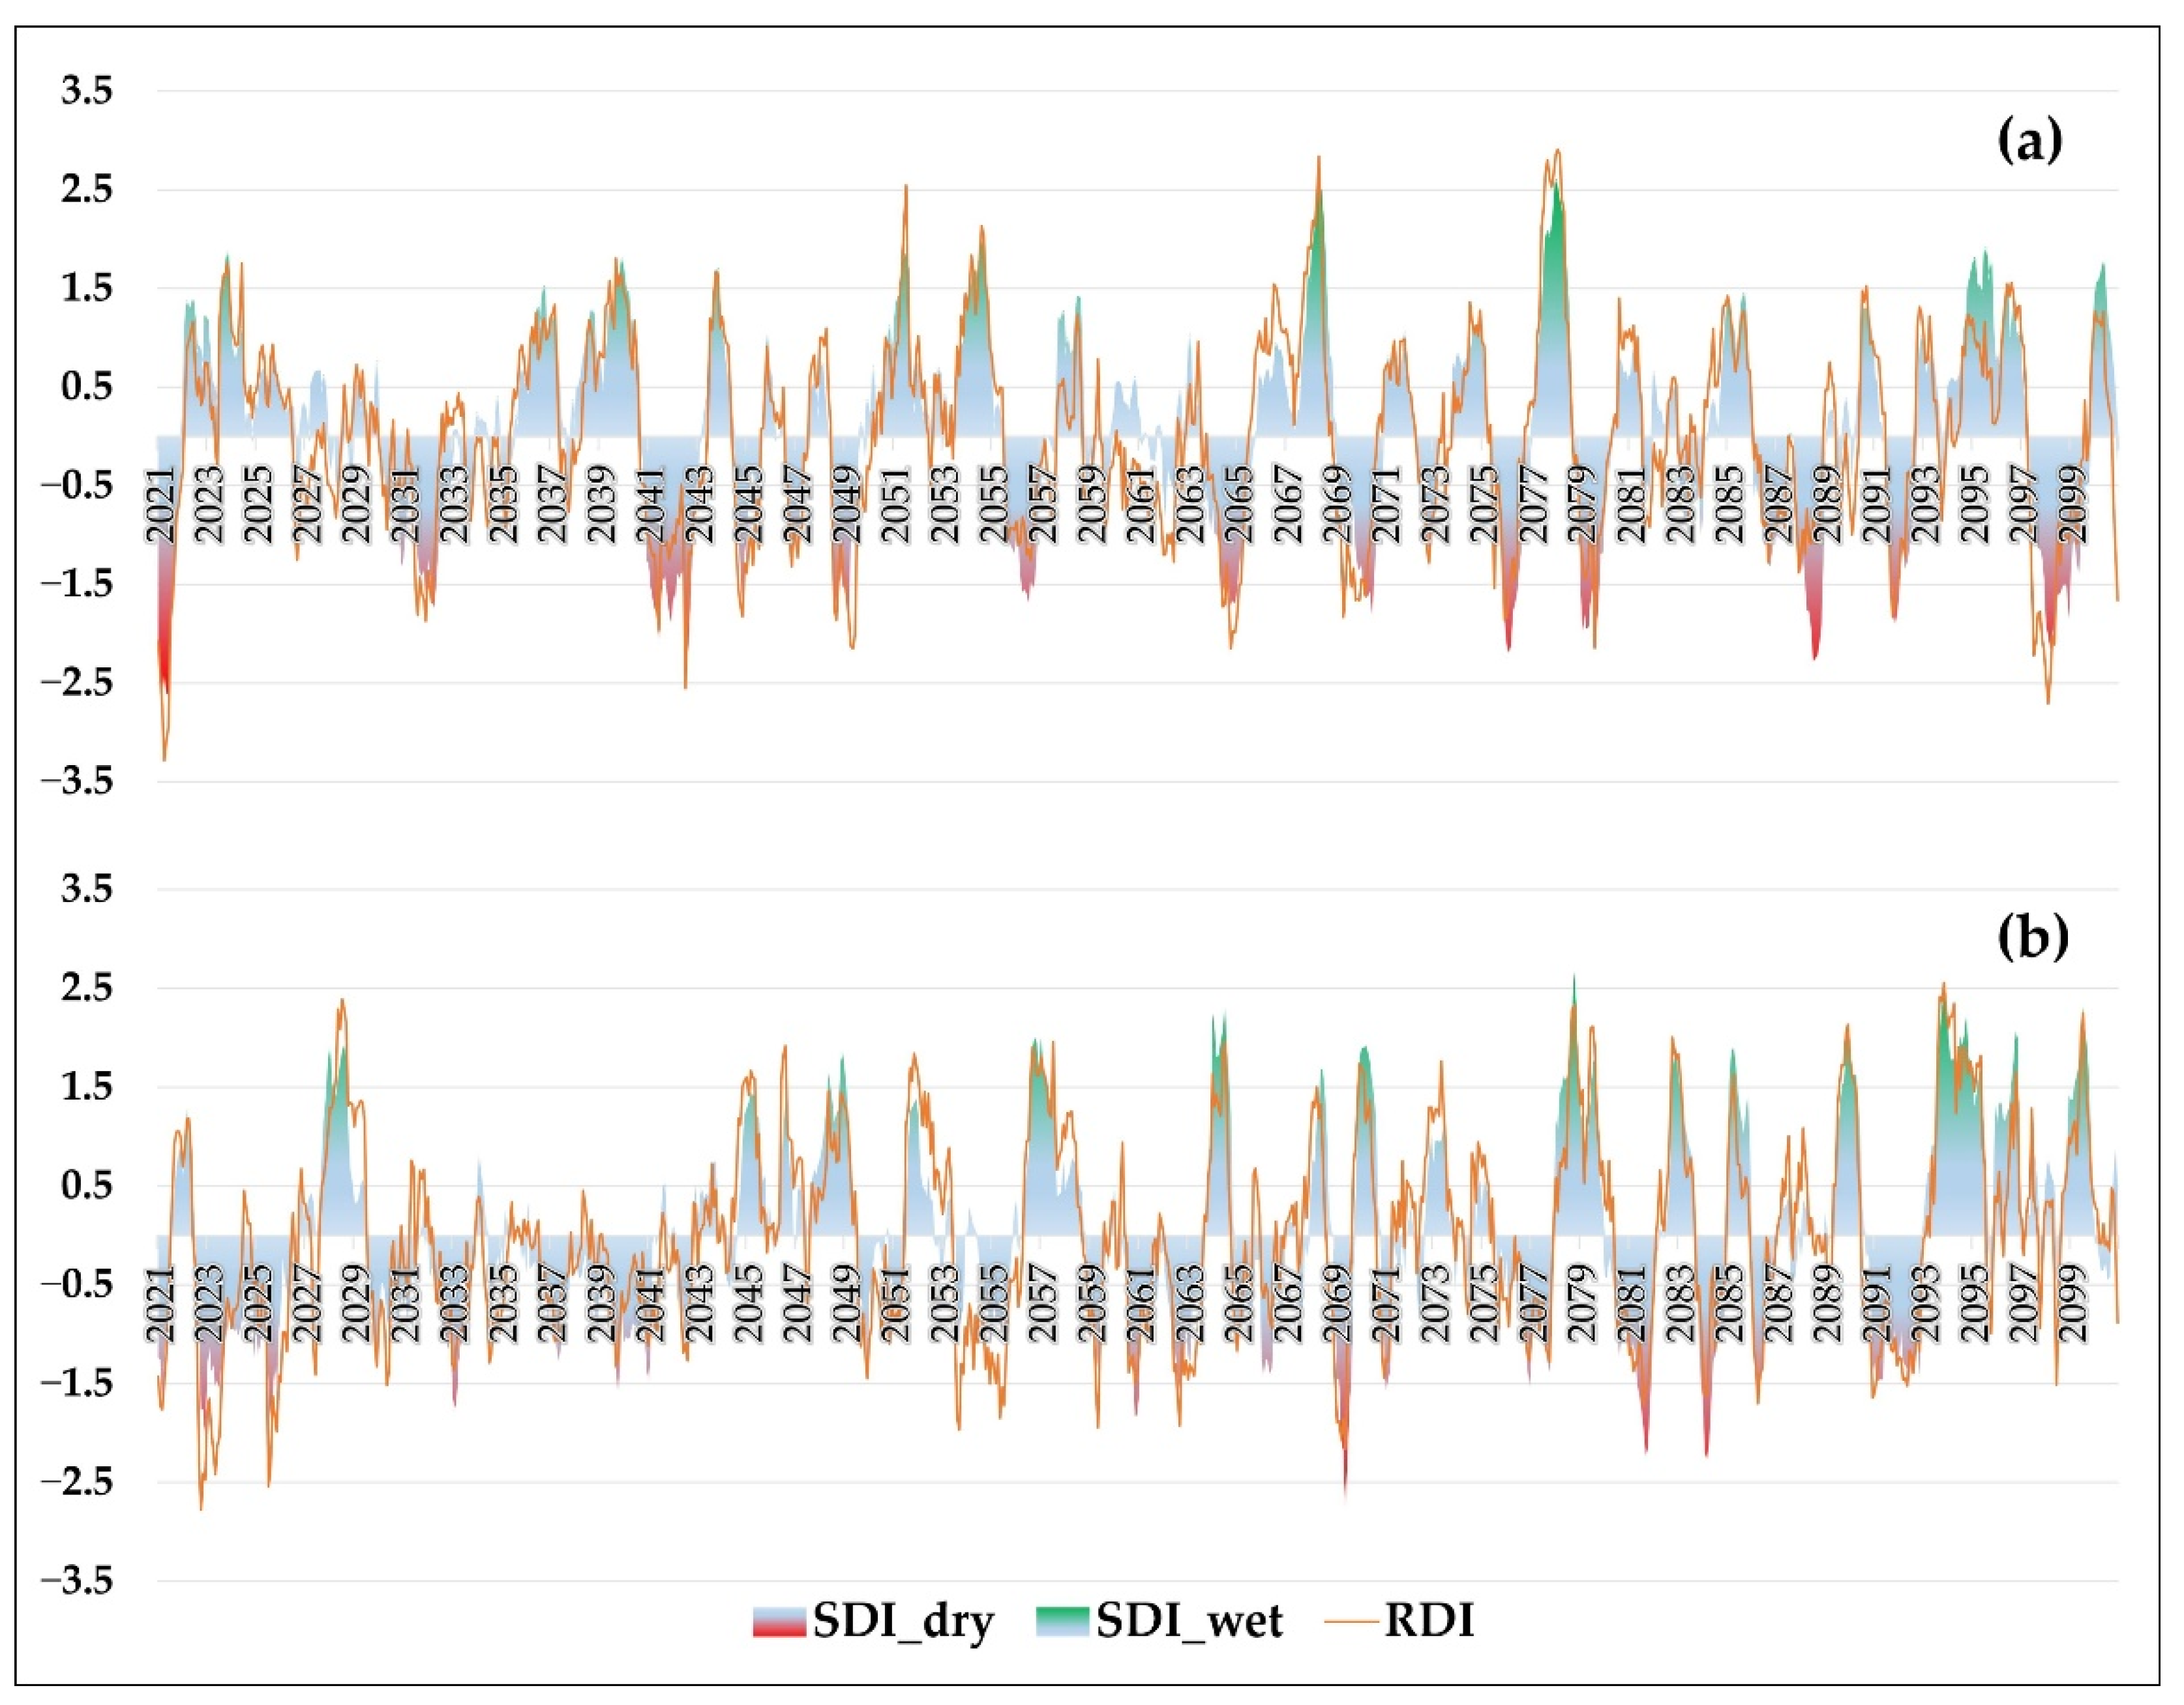
The Venta is characterized by similar amplitudes of the hydrological index values of both climate scenarios (Figure 14). According to both climate scenarios, the number of hydrological droughts and the amplitude of the values will increase in the far future. As in the Šventoji, there will be more extreme droughts under the RCP 4.5 scenario.
The Minija is characterized by considerable changes in the extreme values of the hydrological index under both climate scenarios, which can be explained by the significant impact of precipitation (Figure 15). The amplitude of the values is expected to increase in the far future period. While for other rivers, under the RCP 4.5 scenario, more severe and extremely dry months are projected. In the Minija, under different scenarios, there is no significant difference in the amplitudes of the values of the hydrological index.
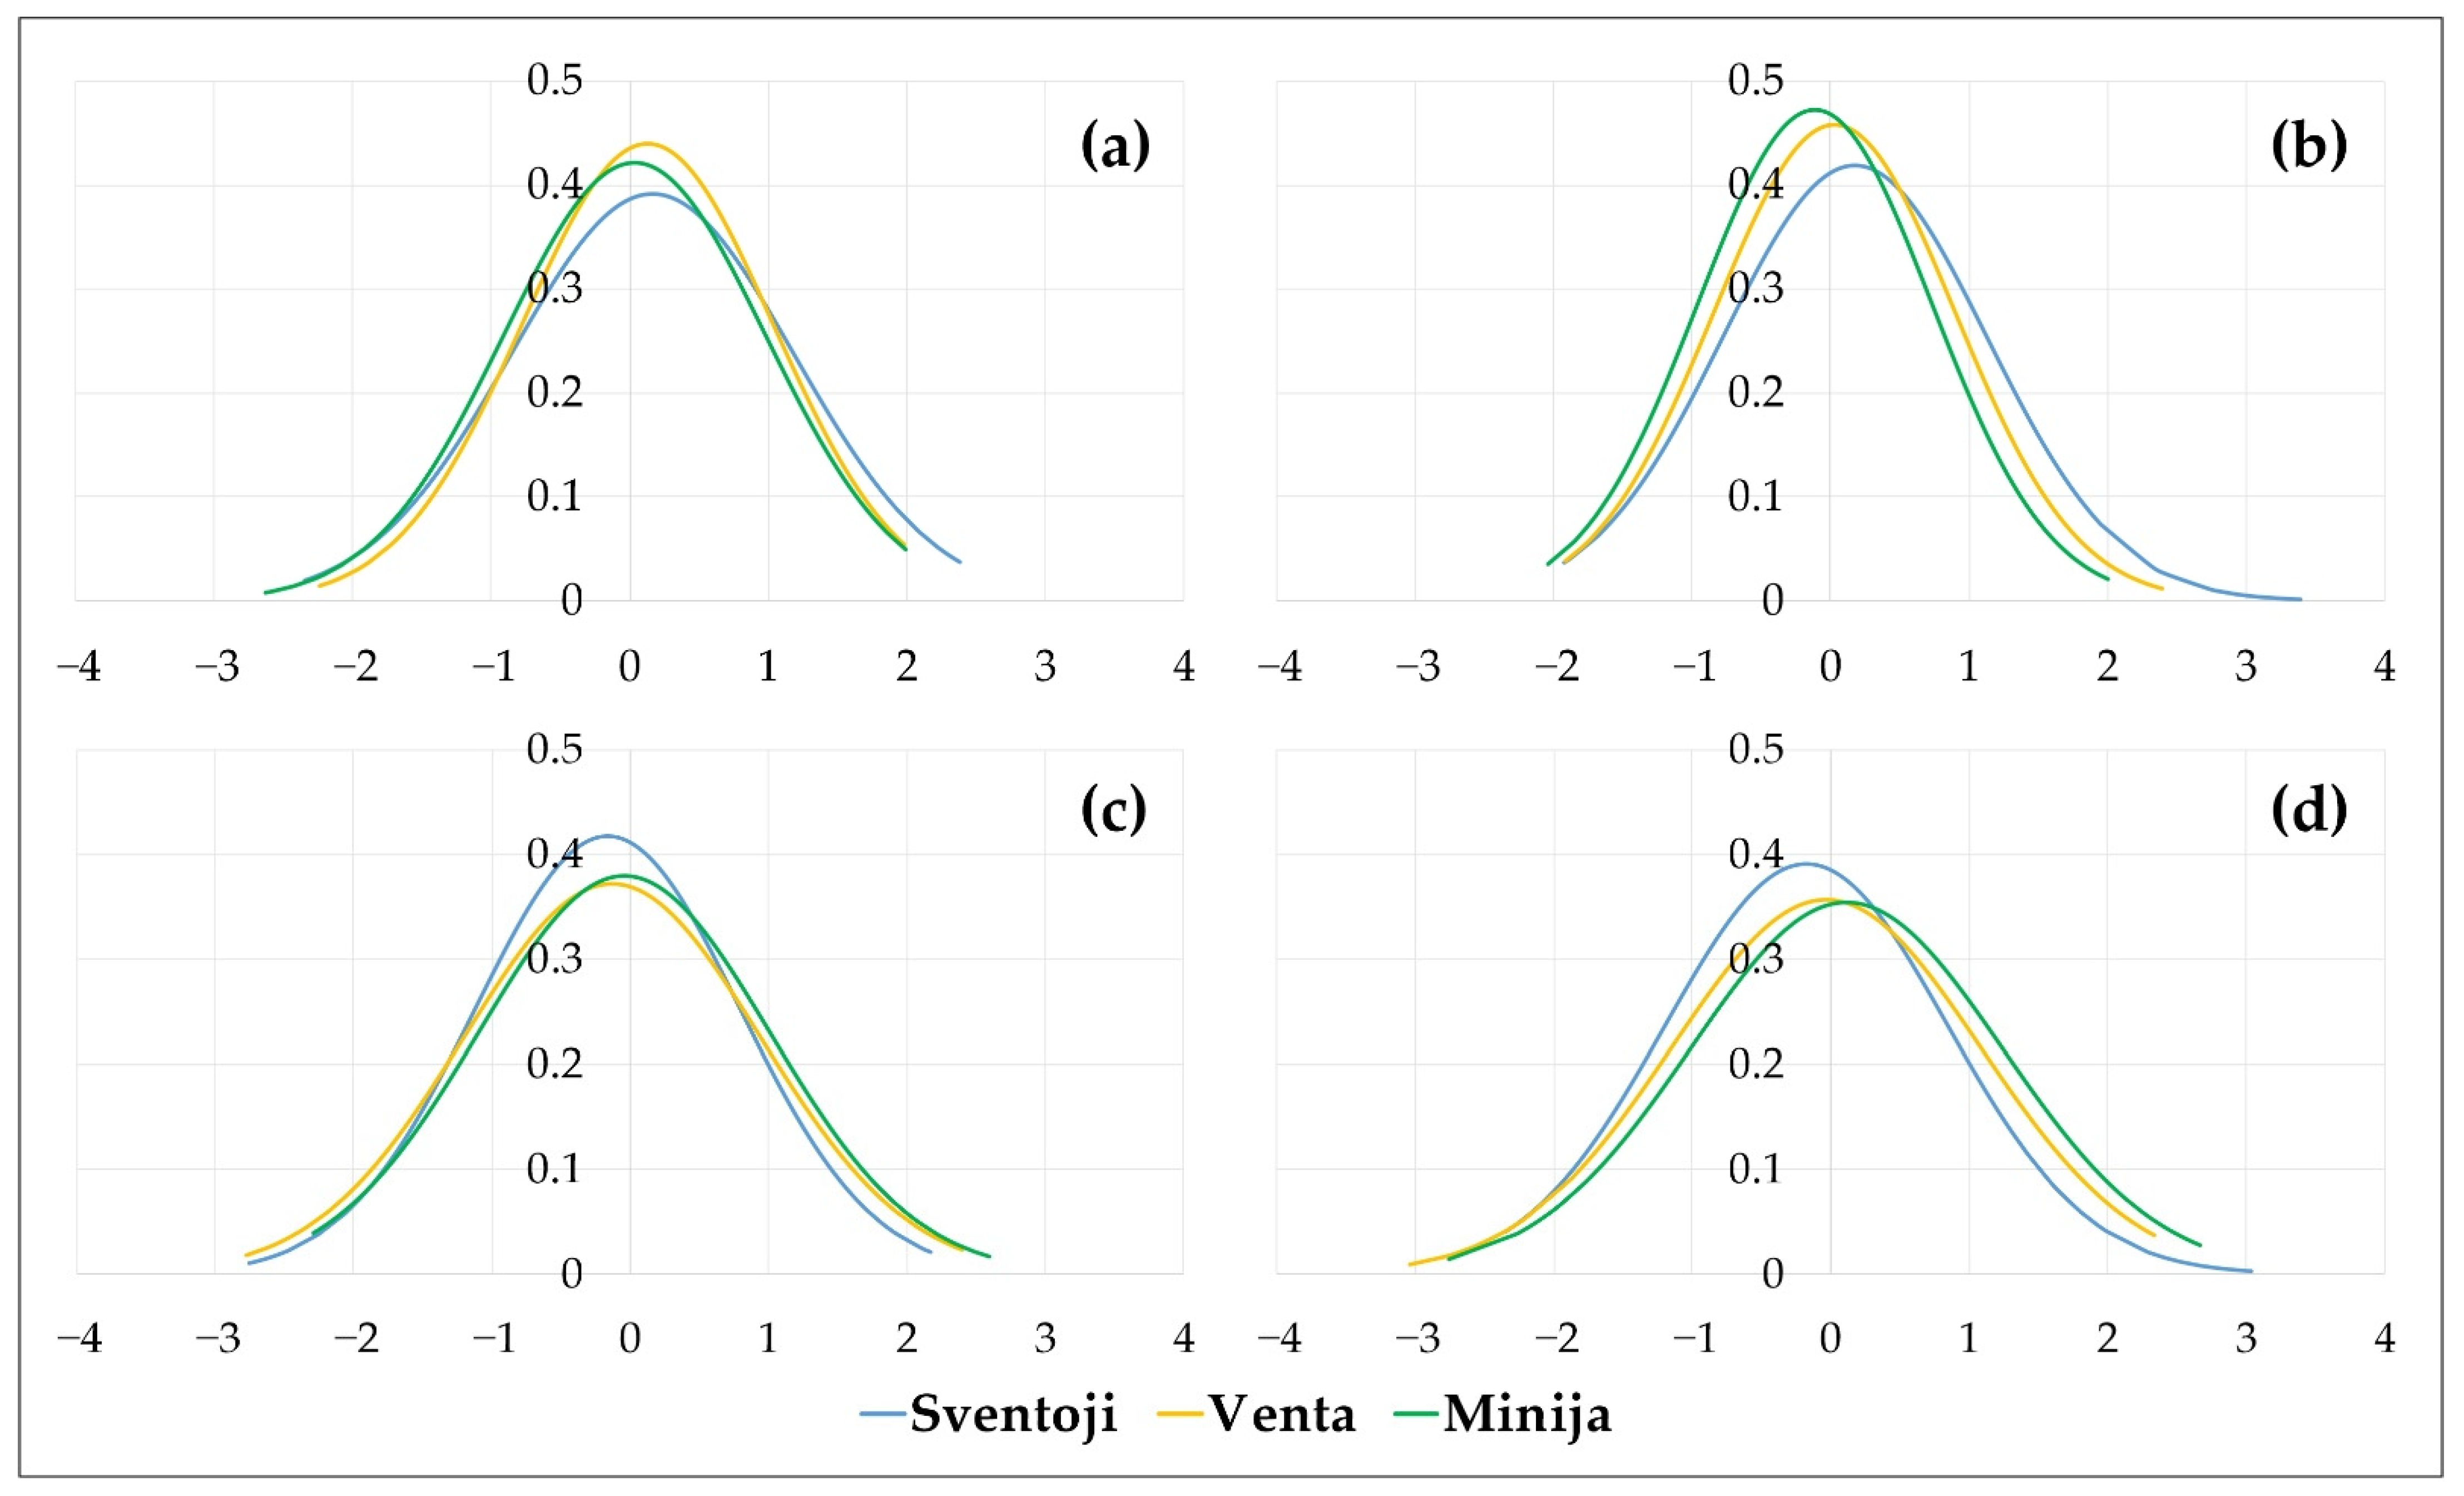
In general, in the near future under both climate scenarios, the Minija is more prone to droughts compared to the Venta and Šventoji, while the Šventoji is characterized by stronger wet events (Figure 16). The Šventoji will have more dry events in the far future than the Minija and Venta. An increase in the percentage of extreme droughts is projected in all rivers at the end of the century.
Comparison of the projection results with historical data (Figure 5) showed that spatial differentiation of hydrological regions will be maintained in the future. The Minija and Venta are expected to remain similar in terms of meteorological and hydrological indices. The delay of hydrological droughts from the beginning of meteorological disappears in the future or lasts no more than three months in the Minija and Venta and up to six months in the Šventoji. The wettest month SDI values for the Šventoji and Venta rivers will decrease under the RCP 4.5 climate scenario and the driest month values will become even more critical, and the opposite trend will occur for the Minija River. The amplitude between the extremely wet and dry values projections based on the RCP 8.5 climate scenario will increase compared to the historical period. According to the climate scenario RCP 8.5, the SDI values of the wettest month are expected to increase in the Šventoji River, and the values of the driest month will become less extreme. No significant changes are projected for the Minija River, except for expanding the range of maximum and minimum values. The Venta River will distinguish by a decrease in the value of the wettest month and an increase in the value of the driest month.
The RCP 4.5 scenario shows an increase in drought intensity for the rivers of the Central and Southeastern hydrological regions. The RCP 8.5 scenario projects a slight decrease in drought intensity for the rivers of the Southeastern hydrological region and an increase for the Western and Central hydrological regions.
4. Discussion
The study aimed to explore the hydrological drought phenomenon in Lithuanian lowland rivers. The problem of droughts has accompanied humanity since time immemorial. Because of the changing climate, droughts tend to get more severe and make life for humans and ecosystems even more complicated [6,63]. Research is changing the view that drought can only be described as a lack of rainfall and shows that there are still many gaps and uncertainties in our knowledge of hydrological droughts [64,65,66,67]. Every new finding and knowledge gained might help better understand the occurrence, spread, and changes of this complex phenomenon over time.
The present study revealed that the Lithuanian lowland river catchments distinguish by considerable differences in precipitation and river runoff as well as drought formation. The diversity of catchment physico-geographical features and climate variability, which mainly depends on the distance of the river catchments from the Baltic Sea, define the origin of runoff formation and make the basis for the regionalization of Lithuanian rivers. In general, the following three distinct hydrological regions: the Western, Central and Southeastern, are used in hydrological studies [68]. The present study shows that the Western region is the wettest, while the Central and Southeastern regions have almost the same amount of precipitation, with a slight predominance in the second one. Considering the river discharge, the driest years in the Western hydrological region are observed in the first half of the study period. In contrast, in the Central and Southeastern hydrological regions, in most catchments, the driest year were observed in the 21st century.
It was found that the SE-LT region is more prone to extreme summer hydrological droughts, and they have a shorter formation period compared to the C-LT and W-LT regions. However, with a longer accumulation period, the discharge deficit is reduced in the SE-LT region due to its leveling by wet months and the maintenance of a more stable water level through groundwater supply. Whereas, in the catchments of the W-LT and C-LT hydrological regions, long periods with discharge deficit lead to more prolonged droughts, as these regions are more dependent on precipitation.
These findings broadly support the results of other studies, suggesting that the identified specifics of river catchments from different hydrological regions and climatic conditions help analyze and project extreme hydrological phenomena in the conditions of changing aridity [28,29,34,69,70]. SPI and RDI parameters showed that in most cases, the number of dry months and the minimum value of the index increased with an extension of the accumulation period. These results reflect those of Kubiak-Wójcicka et al. [71], which, based on the meteorological (SPI) and hydrological (SRI) indices, revealed a weaker response to the precipitation over short time scales (1 and 3 months) and a stronger response over more extended accumulation periods (6, 9 and 12 months). The study of Minea et al. [72] also noticed that the established connection between meteorological and hydrological drought tends to be closer when longer periods (for 6 and 12-month time-scale) are considered.
The analysis on drought in a Slovakian river catchment [71] established high correlations between the SPI and SRI in more extended accumulation periods (6 to 12 months). In the present study, the highest number of strong correlations was estimated between RDI-12 and SDI-12, RDI-12 and SDI-9, SPI-12 and SDI-12. Comparing our results with [71], it was discovered that, with some exceptions, hydrological drought followed the meteorological drought with a 3-month delay. In contrast, studies of the Nemunas River basin [27] found a relatively weak correlation between the droughts (based on the SPI and SDI). Barker et al. [10] determined that catchments underlain by aquifers tended to show more delay in the propagation of drought from meteorological to hydrological drought.
For May and June, a stronger relationship was estimated between long accumulation periods (9 and 12 months). For September and October, there was a stronger relationship when the hydrological index was calculated for shorter accumulation periods (1 and 3 months) and meteorological indices with longer accumulation periods of (6, 9 and 12 months). In Kubiak-Wójcicka et al. [71] study, some high correlations were also recorded in shorter accumulation periods (1 and 3 months) in the summer (VI–VIII) and autumn (X–XI) months.
The present investigation found that the SPI index based on precipitation alone provides much more significant differences in data distribution, while the RDI index eliminates significant precipitation deviations due to evaporation data (calculated from temperature) and gives a more even distribution of values. These results are in line with those of previous studies [73,74,75]. This is especially true for the projection data, as precipitation is almost impossible to model correctly.
The modelling of future drought conditions showed that spatial variation between hydrological regions will be maintained in the future. The amplitude between the extremely wet and dry values of river runoff based on the RCP 8.5 will increase compared to the historical period. The projections revealed that hydrological drought intensity in the Central hydrological region is expected to increase even more under both analyzed RCP scenarios. This tendency is identified in the past and future due to specific conditions of river feeding sources (the smallest amount of precipitation and groundwater feeding in the C-LT region). This could be the reason why almost all Lithuanian intermittent rivers are located in this region [69]. In the future, the hydrological droughts are expected to be more extreme in the C-LT region, and the number of intermittent rivers may even increase. The findings from other studies suggest that, under an ongoing process of warming, the spatial aridity patterns of continentality and oceanicity are not expected to change significantly [76].
The estimated dependence of river runoff on precipitation does not necessarily indicate that there are no other important factors for runoff formation. Critical runoff values are likely to be due to other factors such as land use, water abstraction, changes in river channel morphology, reservoir regulation. Lack of information on human impact is considered an important challenge in modeling and projecting droughts [67,77].
5. Conclusions
In of this study, drought indices were calculated for 17 rivers from three hydrological regions for the period of 1961–2020. The analysis results revealed differences between hydrological regions in terms of the maximum duration of dry months for each accumulation period, extreme values of indices and the distribution of summer severe and extreme droughts by the duration of accumulation periods. A delay of 1 to 3 months was estimated between meteorological and hydrological droughts. The most extreme hydrological droughts were concentrated in the dry periods of 1961–1977, 2000–2007 and 2018–2020.
Correlation analysis showed more cases of a stronger correlation between SDI and RDI than between SDI and SPI. The largest number of significant correlations between rivers was estimated between the indices RDI-12 and SDI-9 in May, but the strongest correlation was found between the indices RDI-12 and SDI-12 (r = 0.907) in the same month.
Three rivers were selected to project droughts in the near (2021–2060) and far future (2061–2100) periods. The findings revealed that most droughts (meteorological and hydrological) would be observed at the end of the century. Under both climate scenarios, the amplitude between the extreme maximum and minimum values will increase. In the Venta River, there an increase in droughts is projected under both climate scenarios. In the Šventoji and Minija, the trends differ depending on the climate scenario.
Author Contributions
Conceptualization, S.N. and J.K.; methodology, S.N. and J.K.; software, S.N. and D.J.; validation, D.J.; formal analysis, S.N.; investigation, S.N. and D.Š.; data curation, S.N.; writing—original draft preparation, S.N.; writing—review and editing, D.Š.; visualization, S.N. All authors have read and agreed to the published version of the manuscript.
Funding
This research received no external funding.
Data Availability Statement
Not applicable.
Acknowledgments
The authors wish to thank the Lithuanian Hydrometeorological Service for providing the daily rainfall and water discharge data.
Conflicts of Interest
The authors declare no conflict of interest.
Appendix A

Table A1.
SPI parameters which present the lowest value for each catchment.
| No | River-WGS | Parameters | SPI-1 | SPI-3 | SPI-6 | SPI-9 | SPI-12 |
|---|---|---|---|---|---|---|---|
| South-eastern hydrological region | |||||||
| 1. | Merkys-Puvočiai | Number of dry months | 111/720 | 116//718 | 116/715 | 122/712 | 131/709 |
| Index minimum value (month) | −3.99 | −3.83 | −3.05 | −2.95 | −2.84 | ||
| 2. | Ūla-Zervynos | Number of dry months | 110/720 | 116/718 | 118/715 | 121/712 | 131/709 |
| Index minimum value (month) | −4.04 | −3.83 | −3.06 | −2.94 | −2.84 | ||
| 3. | Verknė-Verbyliškės | Number of dry months | 109/720 | 112/718 | 124/715 | 122/712 | 130/709 |
| Index minimum value (month) | −4.00 | −3.73 | −2.99 | −3.10 | −2.61 | ||
| 4. | Strėva-Semeliškės | Number of dry months | 110/720 | 116/718 | 118/715 | 121/712 | 131/709 |
| Index minimum value (month) | −4.04 | −3.83 | −3.06 | −2.94 | −2.84 | ||
| 5. | Žeimena-Pabradė | Number of dry months | 112/720 | 113/718 | 121/715 | 121/712 | 125/709 |
| Index minimum value (month) | −4.16 | −3.24 | −3.07 | −2.74 | −2.58 | ||
| 6. | Šventoji-Anykščiai | Number of dry months | 115/720 | 114/718 | 120/715 | 119/712 | 126/709 |
| Index minimum value (month) | −4.14 | −3.28 | −3.06 | −2.78 | −2.63 | ||
| 7. | Šventoji-Ukmergė | Number of dry months | 113/720 | 121/718 | 113/715 | 125/712 | 128/709 |
| Index minimum value (month) | −3.75 | −3.56 | −3.33 | −3.31 | −3.03 | ||
| Central hydrological region | |||||||
| 8. | Nevėžis-Panevėžys | Number of dry months | 113/720 | 123/718 | 109/715 | 124/712 | 118/709 |
| Index minimum value (month) | −3.80 | −2.89 | −3.31 | −3.50 | −3.24 | ||
| 9. | Šušvė-Šiaulėnai | Number of dry months | 106/720 | 112/718 | 115/715 | 123/712 | 127/709 |
| Index minimum value (month) | −4.24 | −3.06 | −3.09 | −2.62 | −2.73 | ||
| 10. | Nemunėlis-Tabokinė | Number of dry months | 113/720 | 120/718 | 122/715 | 116/712 | 130/709 |
| Index minimum value (month) | −4.37 | −2.96 | −3.00 | −2.78 | −2.54 | ||
| 11. | Mūša-Ustukiai | Number of dry months | 105/720 | 114/718 | 119/715 | 124/712 | 129/709 |
| Index minimum value (month) | −3.61 | −3.14 | −3.07 | −2.54 | −2.69 | ||
| 12. | Venta-Papilė | Number of dry months | 107/720 | 106/718 | 103/715 | 123/712 | 124/709 |
| Index minimum value (month) | −4.40 | −3.24 | −3.27 | −2.73 | −2.66 | ||
| 13. | Venta-Leckava | Number of dry months | 108/720 | 99/718 | 112/715 | 118/712 | 127/709 |
| Index minimum value (month) | −4.73 | −3.51 | −3.39 | −2.77 | −2.66 | ||
| Western hydrological region | |||||||
| 14. | Jūra-Tauragė | Number of dry months | 114/720 | 115/718 | 121/715 | 123/712 | 115/709 |
| Index minimum value (month) | −4.54 | −3.15 | −3.27 | −2.84 | −3.30 | ||
| 15. | Akmena-Paakmenis | Number of dry months | 114/720 | 115/718 | 121/715 | 123/712 | 115/709 |
| Index minimum value (month) | −4.54 | −3.15 | −3.27 | −2.84 | −3.30 | ||
| 16. | Minija-Kartena | Number of dry months | 102/720 | 104/718 | 117/715 | 118/712 | 126/709 |
| Index minimum value (month) | −5.29 | −3.46 | −3.38 | −2.71 | −2.63 | ||
| 17. | Bartuva-Skuodas | Number of dry months | 109/720 | 106/718 | 113/715 | 121/712 | 126/709 |
| Index minimum value (month) | −3.31 | −3.45 | −3.38 | −2.81 | −2.53 | ||
Table A2.
RDI parameters which present the lowest value for each catchment.
| No | River-WGS | Parameters | RDI-1 | RDI-3 | RDI-6 | RDI-9 | RDI-12 |
|---|---|---|---|---|---|---|---|
| South-eastern hydrological region | |||||||
| 1. | Merkys-Puvočiai | Number of dry months | 77/561 | 94/667 | 123/715 | 118/712 | 118/709 |
| Index minimum value (month) | −3.67 | −2.63 | −2.87 | −2.73 | −3.07 | ||
| 2. | Ūla-Zervynos | Number of dry months | 71/545 | 91/656 | 121/715 | 122/712 | 122/709 |
| Index minimum value (month) | −3.92 | −3.84 | −2.92 | −2.78 | −3.01 | ||
| 3. | Verknė-Verbyliškės | Number of dry months | 77/545 | 95/656 | 118/715 | 116/712 | 118/709 |
| Index minimum value (month) | −3.88 | −3.61 | −2.83 | −2.90 | −2.79 | ||
| 4. | Strėva-Semeliškės | Number of dry months | 71/545 | 91/656 | 121/715 | 122/712 | 122/709 |
| Index minimum value (month) | −3.92 | −3.84 | −2.92 | −2.78 | −3.01 | ||
| 5. | Žeimena-Pabradė | Number of dry months | 78/523 | 98/637 | 124/715 | 117/712 | 126/709 |
| Index minimum value (month) | −3.85 | −3.37 | −3.14 | −2.84 | −2.51 | ||
| 6. | Šventoji-Anykščiai | Number of dry months | 72/527 | 94/640 | 122/715 | 117/712 | 124/709 |
| Index minimum value (month) | −3.74 | −3.41 | −3.10 | −2.85 | −2.51 | ||
| 7. | Šventoji-Ukmergė | Number of dry months | 80/537 | 100/648 | 109/715 | 113/712 | 119/709 |
| Index minimum value (month) | −3.13 | −3.69 | −2.88 | −3.29 | −2.85 | ||
| Central hydrological region | |||||||
| 8. | Nevėžis-Panevėžys | Number of dry months | 72/543 | 94/653 | 104/715 | 121/712 | 116/709 |
| Index minimum value (month) | −3.29 | −2.56 | −2.96 | −3.43 | −3.01 | ||
| 9. | Šušvė-Šiaulėnai | Number of dry months | 65/545 | 98/653 | 121/715 | 120/712 | 120/709 |
| Index minimum value (month) | −4.18 | −3.03 | −2.91 | −2.58 | −2.80 | ||
| 10. | Nemunėlis-Tabokinė | Number of dry months | 79/529 | 100/642 | 115/715 | 115/712 | 118/709 |
| Index minimum value (month) | −3.60 | −3.02 | −3.04 | −2.82 | −2.68 | ||
| 11. | Mūša-Ustukiai | Number of dry months | 67/546 | 103/655 | 118/715 | 134/712 | 129/709 |
| Index minimum value (month) | −3.61 | −3.07 | −2.72 | −2.66 | −2.75 | ||
| 12. | Venta-Papilė | Number of dry months | 67/545 | 94/653 | 108/715 | 119/712 | 116/709 |
| Index minimum value (month) | −4.34 | −3.16 | −3.02 | −2.77 | −2.86 | ||
| 13. | Venta-Leckava | Number of dry months | 76/546 | 92/654 | 111/715 | 114/712 | 115/709 |
| Index minimum value (month) | −4.63 | −3.21 | −3.36 | −3.00 | −2.82 | ||
| Western hydrological region | |||||||
| 14. | Jūra-Tauragė | Number of dry months | 82/532 | 98/646 | 121/715 | 116/712 | 115/709 |
| Index minimum value (month) | −4.37 | −3.04 | −3.20 | −2.77 | −3.07 | ||
| 15. | Akmena-Paakmenis | Number of dry months | 82/532 | 98/646 | 121/715 | 116/712 | 115/709 |
| Index minimum value (month) | −4.37 | −3.04 | −3.20 | −2.77 | −3.07 | ||
| 16. | Minija-Kartena | Number of dry months | 74/561 | 81/666 | 111/715 | 114/712 | 120/709 |
| Index minimum value (month) | −5.16 | −3.13 | −3.30 | −2.86 | −2.91 | ||
| 17. | Bartuva-Skuodas | Number of dry months | 77/565 | 81/669 | 104/715 | 112/712 | 116/709 |
| Index minimum value (month) | −3.30 | −3.11 | −3.29 | −2.89 | −2.83 | ||
Table A3.
SDI parameters which present the lowest value for each catchment.
| No | River-WGS | Parameters | SDI-1 | SDI-3 | SDI-6 | SDI-9 | SDI-12 |
|---|---|---|---|---|---|---|---|
| South-eastern hydrological region | |||||||
| 1. | Merkys-Puvočiai | Number of dry months | 112/720 | 112/718 | 121/715 | 124/712 | 124/709 |
| Index minimum value (month) | −2.34 | −2.76 | −2.87 | −3.01 | −2.69 | ||
| 2. | Ūla-Zervynos | Number of dry months | 108/720 | 112/718 | 114/715 | 118/712 | 120/709 |
| Index minimum value (month) | −2.29 | −2.57 | −2.71 | −2.79 | −2.84 | ||
| 3. | Verknė-Verbyliškės | Number of dry months | 84/720 | 89/718 | 89/715 | 104/712 | 99/709 |
| Index minimum value (month) | −2.05 | −2.24 | −2.14 | −1.99 | −2.03 | ||
| 4. | Strėva-Semeliškės | Number of dry months | 111/719 | 109/717 | 125/714 | 136/711 | 126/708 |
| Index minimum value (month) | −2.60 | −2.43 | −2.03 | −2.06 | −2.11 | ||
| 5. | Žeimena-Pabradė | Number of dry months | 103/720 | 108/718 | 117/715 | 117/712 | 128/709 |
| Index minimum value (month) | −2.28 | −2.24 | −2.41 | −2.28 | −2.24 | ||
| 6. | Šventoji-Anykščiai | Number of dry months | 94/715 | 98/709 | 113/700 | 122/691 | 114/682 |
| Index minimum value (month) | −2.08 | −2.26 | −2.27 | −2.10 | −2.39 | ||
| 7. | Šventoji-Ukmergė | Number of dry months | 106/716 | 105/710 | 111/701 | 125/692 | 125/683 |
| Index minimum value (month) | −2.06 | −2.56 | −2.56 | −2.53 | −2.46 | ||
| Central hydrological region | |||||||
| 8. | Nevėžis-Panevėžys | Number of dry months | 125/720 | 118/718 | 109/715 | 111/712 | 110/709 |
| Index minimum value (month) | −2.59 | −2.78 | −3.11 | −3.16 | −3.05 | ||
| 9. | Šušvė-Šiaulėnai | Number of dry months | 110/720 | 110/718 | 121/715 | 134/712 | 143/709 |
| Index minimum value (month) | −2.54 | −2.69 | −2.72 | −2.80 | −2.74 | ||
| 10. | Nemunėlis-Tabokinė | Number of dry months | 112/720 | 115/718 | 116/715 | 121/712 | 124/709 |
| Index minimum value (month) | −2.43 | −2.25 | −2.18 | −2.34 | −2.45 | ||
| 11. | Mūša-Ustukiai | Number of dry months | 107/720 | 112/718 | 124/715 | 130/712 | 130/709 |
| Index minimum value (month) | −2.17 | −2.44 | −2.44 | −2.33 | −2.72 | ||
| 12. | Venta-Papilė | Number of dry months | 99/720 | 110/718 | 119/715 | 125/712 | 127/709 |
| Index minimum value (month) | −2.21 | −2.64 | −2.48 | −2.47 | −2.51 | ||
| 13. | Venta-Leckava | Number of dry months | 109/720 | 119/718 | 118/718 | 114/712 | 107/709 |
| Index minimum value (month) | −2.32 | −2.86 | −2.74 | −2.60 | −2.43 | ||
| Western hydrological region | |||||||
| 14. | Jūra-Tauragė | Number of dry months | 101/720 | 119/718 | 129/715 | 122/712 | 121/709 |
| Index minimum value (month) | −2.21 | −2.76 | −3.05 | −3.05 | −2.91 | ||
| 15. | Akmena-Paakmenis | Number of dry months | 114/720 | 126/718 | 134/715 | 128/712 | 119/709 |
| Index minimum value (month) | −2.30 | −2.68 | −2.61 | −2.65 | −2.81 | ||
| 16. | Minija-Kartena | Number of dry months | 114/720 | 125/718 | 127/715 | 119/712 | 123/709 |
| Index minimum value (month) | −2.33 | −2.70 | −2.66 | −2.70 | −2.68 | ||
| 17. | Bartuva-Skuodas | Number of dry months | 109/708 | 117/704 | 119/698 | 117/692 | 113/686 |
| Index minimum value (month) | −2.27 | −3.11 | −2.83 | −2.63 | −2.54 | ||
Appendix B
Table A4.
Correlation matrix between SPI and SDI indices for the Venta river.
| Venta (Leckava) | V | VI | VII | VII | IX | X |
|---|---|---|---|---|---|---|
| SPI_1m-SDI_1m | 0.438566 | 0.52179 | 0.522196 | 0.432577 | 0.511287 | 0.517274 |
| SPI_3m-SDI_1m | 0.439635 | 0.677741 | 0.729274 | 0.733918 | 0.74253 | 0.739166 |
| SPI_6m-SDI_1m | 0.113354 | 0.494797 | 0.601909 | 0.748575 | 0.757464 | 0.847492 |
| SPI_9m-SDI_1m | 0.081331 | 0.405502 | 0.6076 | 0.578648 | 0.634412 | 0.770859 |
| SPI_12m-SDI_1m | 0.081105 | 0.268421 | 0.460981 | 0.507884 | 0.516487 | 0.722681 |
| SPI_1m-SDI_3m | 0.035133 | −0.0408 | 0.171667 | 0.155903 | 0.393833 | 0.286132 |
| SPI_3m-SDI_3m | 0.46934 | 0.283162 | 0.48995 | 0.610626 | 0.724616 | 0.686152 |
| SPI_6m-SDI_3m | 0.300222 | 0.00152 | 0.490719 | 0.718403 | 0.776125 | 0.826458 |
| SPI_9m-SDI_3m | 0.304656 | −0.10348 | 0.410175 | 0.636726 | 0.671734 | 0.739972 |
| SPI_12m-SDI_3m | 0.360282 | 0.01429 | 0.262677 | 0.551994 | 0.594173 | 0.69634 |
| SPI_1m-SDI_6m | 0.032039 | 0.221978 | 0.026692 | 0.035433 | 0.372737 | 0.263181 |
| SPI_3m-SDI_6m | 0.431848 | 0.315926 | 0.27886 | 0.170803 | 0.356854 | 0.579309 |
| SPI_6m-SDI_6m | 0.699706 | 0.69863 | 0.57025 | 0.433641 | 0.501551 | 0.75319 |
| SPI_9m-SDI_6m | 0.793667 | 0.694251 | 0.60626 | 0.390036 | 0.33608 | 0.711345 |
| SPI_12m-SDI_6m | 0.828129 | 0.724013 | 0.560023 | 0.373205 | 0.22315 | 0.66654 |
| SPI_1m-SDI_9m | −0.04632 | 0.145703 | 0.100638 | −0.05173 | 0.253752 | 0.216767 |
| SPI_3m-SDI_9m | 0.232695 | 0.136184 | 0.251505 | 0.211968 | 0.270961 | 0.420208 |
| SPI_6m-SDI_9m | 0.457959 | 0.429043 | 0.423859 | 0.457612 | 0.418885 | 0.565521 |
| SPI_9m-SDI_9m | 0.758522 | 0.682662 | 0.661398 | 0.694014 | 0.674152 | 0.673338 |
| SPI_12m-SDI_9m | 0.882964 | 0.856286 | 0.804855 | 0.748443 | 0.699335 | 0.718789 |
| SPI_1m-SDI_12m | −0.04585 | 0.132035 | 0.103784 | −0.03116 | 0.147464 | 0.170617 |
| SPI_3m-SDI_12m | 0.228471 | 0.109841 | 0.203879 | 0.186348 | 0.219857 | 0.304002 |
| SPI_6m-SDI_12m | 0.438818 | 0.381528 | 0.339196 | 0.321838 | 0.279446 | 0.435852 |
| SPI_9m-SDI_12m | 0.736912 | 0.624787 | 0.562608 | 0.500811 | 0.469398 | 0.509169 |
| SPI_12m-SDI_12m | 0.883212 | 0.852088 | 0.783614 | 0.718392 | 0.682026 | 0.692041 |
Table A5.
Correlation matrix between RDI and SDI indices for the Venta river.
| Venta (Leckava) | V | VI | VII | VII | IX | X |
|---|---|---|---|---|---|---|
| SPI_1m-SDI_1m | 0.422751 | 0.538263 | 0.527077 | 0.453273 | 0.533017 | 0.455596 |
| SPI_3m-SDI_1m | 0.582746 | 0.681573 | 0.75476 | 0.756971 | 0.776756 | 0.743278 |
| SPI_6m-SDI_1m | 0.370211 | 0.606282 | 0.672286 | 0.8092 | 0.805992 | 0.881525 |
| SPI_9m-SDI_1m | 0.285118 | 0.498874 | 0.69302 | 0.680835 | 0.73178 | 0.829062 |
| SPI_12m-SDI_1m | 0.225049 | 0.349344 | 0.535786 | 0.618231 | 0.626306 | 0.795132 |
| SPI_1m-SDI_3m | 0.011056 | −0.0291 | 0.180125 | 0.172375 | 0.402495 | 0.232847 |
| SPI_3m-SDI_3m | 0.506038 | 0.429392 | 0.425472 | 0.126592 | −0.05476 | −0.09243 |
| SPI_6m-SDI_3m | 0.44694 | 0.151508 | 0.598191 | 0.780142 | 0.820816 | 0.870169 |
| SPI_9m-SDI_3m | 0.403485 | 0.036881 | 0.530402 | 0.737399 | 0.758702 | 0.81402 |
| SPI_12m-SDI_3m | 0.477185 | 0.17955 | 0.363737 | 0.655712 | 0.69666 | 0.785597 |
| SPI_1m-SDI_6m | 0.001228 | 0.224248 | 0.056605 | 0.05283 | 0.38707 | 0.229194 |
| SPI_3m-SDI_6m | 0.297243 | 0.39832 | 0.462469 | 0.465396 | 0.313494 | 0.130515 |
| SPI_6m-SDI_6m | 0.621902 | 0.677149 | 0.628834 | 0.497074 | 0.242101 | 0.270968 |
| SPI_9m-SDI_6m | 0.703749 | 0.652796 | 0.667311 | 0.50781 | 0.471564 | 0.798675 |
| SPI_12m-SDI_6m | 0.812572 | 0.713131 | 0.616483 | 0.490953 | 0.370681 | 0.768149 |
| SPI_1m-SDI_9m | −0.08721 | 0.151522 | 0.10543 | −0.03842 | 0.246979 | 0.178806 |
| SPI_3m-SDI_9m | 0.128766 | 0.15413 | 0.164223 | 0.288418 | 0.333946 | 0.30909 |
| SPI_6m-SDI_9m | 0.398717 | 0.440392 | 0.497524 | 0.639634 | 0.652861 | 0.532271 |
| SPI_9m-SDI_9m | 0.708252 | 0.737927 | 0.733605 | 0.706605 | 0.624919 | 0.488545 |
| SPI_12m-SDI_9m | 0.900809 | 0.870797 | 0.828021 | 0.758949 | 0.723791 | 0.7894 |
| SPI_1m-SDI_12m | −0.09215 | 0.137399 | 0.105944 | −0.01863 | 0.13692 | 0.141561 |
| SPI_3m-SDI_12m | 0.128035 | 0.143992 | 0.132195 | 0.133378 | 0.126168 | 0.105677 |
| SPI_6m-SDI_12m | 0.384629 | 0.403476 | 0.41951 | 0.429169 | 0.44735 | 0.463396 |
| SPI_9m-SDI_12m | 0.69338 | 0.706672 | 0.707485 | 0.719752 | 0.713447 | 0.671286 |
| SPI_12m-SDI_12m | 0.906566 | 0.907277 | 0.896123 | 0.888607 | 0.860717 | 0.781048 |
References
- Heim, R.R., Jr. A Review of Twentieth-Century Drought Indices Used in the United States. Bull. Am. Meteorol. Soc. 2002, 83, 1149–1166. [Google Scholar] [CrossRef] [Green Version]
- Hayes, M.J.; Svoboda, M.; Wall, N.A.; Widhalm, M. The Lincoln Declaration on Drought Indices: Universal Meteorological Drought Index Recommended. Bull. Am. Meteorol. Soc. 2011, 92, 485–488. [Google Scholar] [CrossRef] [Green Version]
- Revision of the Policy Instruments and Their Potential to Contribute to EU Droughts And Water Scarcity Policies. Available online: https://www.gwp.org/globalassets/global/gwp-cee_files/idmp-cee/revision_of_the_policy_instruments_of_drought_2020.pdf (accessed on 26 October 2021).
- Spinoni, J.; Naumann, G.; Vogt, J. Pan-European seasonal trends and recent changes of drought frequency and severity. Glob. Planet. Chang. 2017, 148, 113–130. [Google Scholar] [CrossRef]
- Markonis, Y.; Kumar, R.; Hanel, M.; Rakovec, O.; Máca, P.; AghaKouchak, A. The rise of compound warm-season droughts in Europe. Sci. Adv. 2021, 7, eabb9668. [Google Scholar] [CrossRef]
- Intergovernmental Panel on Climate Change (IPCC). Summary for Policymakers. In Climate Change 2021: The Physical Science Basis. Contribution of Working Group I to the Sixth Assessment Report of the Intergovernmental Panel on Climate Change; Masson-Delmotte, V., Zhai, P., Pirani, A., Connors, S.L., Péan, C., Berger, S., Caud, N., Chen, Y., Goldfarb, L.M.I., Huang, M., et al., Eds.; Cambridge University Press: Cambridge, UK, 2021. [Google Scholar]
- Wilhite, D.A. Droughts as a natural hazard: Concepts and definitions. In Drought, a Global Assessment; Wilhite, D.A., Ed.; Routledge: London, UK, 2000; Volume 1, pp. 3–18. [Google Scholar]
- Asadieh, B.; Krakauer, N.Y. Global change in streamflow extremes under climate change over the 21st century. Hydrol. Earth Syst. Sci. 2017, 21, 5863–5874. [Google Scholar] [CrossRef] [Green Version]
- Naumann, G.; Cammalleri, C.; Mentaschi, L.; Feyen, L. Increased economic drought impacts in Europe with anthropogenic warming. Nat. Clim. Chang. 2021, 11, 485–491. [Google Scholar] [CrossRef]
- Barker, L.J.; Hannaford, J.; Chiverton, A.; Svensson, C. From meteorological to hydrological drought using standardised indicators. Hydrol. Earth Syst. Sci. 2016, 20, 2483–2505. [Google Scholar] [CrossRef] [Green Version]
- Zargar, A.; Sadiq, R.; Naser, B.; Khan, F.I. A review of drought indices. Environ. Rev. 2011, 19, 333–349. [Google Scholar] [CrossRef]
- World Meteorological Organization (WMO); Global Water Partnership (GWP). Handbook of Drought Indicators and Indices; WMO and GWP: Geneva, Switzerland, 2016; pp. 1–52. [Google Scholar]
- Mishra, A.K.; Singh, V.P. A review of drought concept. J. Hydrol. 2010, 391, 202–216. [Google Scholar] [CrossRef]
- Dai, A. Drought under global warming: A review. Wiley Interdiscip. Rev. Clim. Change 2011, 2, 45–65. [Google Scholar] [CrossRef] [Green Version]
- Rossi, G.; Cancelliere, A. Managing drought risk in water supply systems in Europe: A review. Int. J. Water Resour. D 2013, 29, 272–289. [Google Scholar] [CrossRef]
- Pedro-Monzonís, M.; Solera, A.; Ferrer, J.; Estrela, T.; Paredes-Arquiola, J. A review of water scarcity and drought indexes in water resources planning and management. J. Hydrol. 2015, 527, 482–493. [Google Scholar] [CrossRef] [Green Version]
- Eslamian, S.; Ostad-Ali-Askari, K.; Singh, V.P.; Dalezios, N.R.; Ghane, M.; Yihdego, Y.; Matouq, M. A review of drought indices. Int. J. Constr. Res. Civ. Eng. 2017, 3, 48–66. [Google Scholar] [CrossRef]
- Palmer, W.C. Meteorologic Drought; Research Paper No. 45; US Department of Commerce: Washington, WA, USA, 1965; pp. 1–58. [Google Scholar]
- Gibbs, W.J.; Maher, J.V. Rainfall Deciles as Drought Indicators; Bulletin No. 48; Bureau of Meteorology: Melbourne, Australia, 1967; pp. 1–84. [Google Scholar]
- Palmer, W.C. Keeping track of crop moisture conditions, nationwide: The new crop moisture index. Weatherwise 1968, 21, 156–161. [Google Scholar] [CrossRef]
- Shafer, B.A.; Dezman, L.E. Development of a surface water supply index (SWSI) to assess the severity of drought conditions in snowpack runoff areas. In Western Snow Conference; Colorado State University: Reno, NV, USA, 1982; pp. 164–175. [Google Scholar]
- McKee, T.B.; Doesken, N.J.; Kleist, J. The Relationship of Drought Frequency and Duration to Time Scales. In Proceedings of the 8th Conference on Applied Climatology, Anaheim, CA, USA, 17–22 January 1993; pp. 179–184. [Google Scholar]
- Tsakiris, G.; Vangelis, H.J.E.W. Establishing a drought index incorporating evapotranspiration. Eur. Water 2005, 9, 3–11. [Google Scholar]
- González, J.; Valdés, J.B. New drought frequency index: Definition and comparative performance analysis. Water Resour. Res. 2006, 42, W11421. [Google Scholar] [CrossRef]
- Yihdego, Y.; Vaheddoost, B.; Al-Weshah, R.A. Drought indices and indicators revisited. Arab. J. Geosci. 2019, 12, 69. [Google Scholar] [CrossRef]
- Rimkus, E.; Valiukas, D.; Kažys, J.; Gečaite, I.; Stonevičius, E. Dryness dynamics of the Baltic Sea region. Baltica 2012, 25, 129–142. [Google Scholar] [CrossRef] [Green Version]
- Rimkus, E.; Stonevičius, E.; Korneev, V.; Kažys, J.; Valiuškevičius, G.; Pakhomau, A. Dynamics of meteorological and hydrological droughts in the Neman river basin. Environ. Res. Lett. 2013, 8, 1–10. [Google Scholar] [CrossRef]
- Stonevičius, E.; Rimkus, E.; Kažys, J.; Bukantis, A.; Kriaučiūienė, J.; Akstinas, V.; Jakimavičius, D.; Povilaitis, A.; Ložys, L.; Kesminas, V.; et al. Recent aridity trends and future projections in the Nemunas river basin. Clim. Res. 2018, 75, 143–154. [Google Scholar] [CrossRef]
- Šarauskienė, D.; Akstinas, V.; Kriaučiūnienė, J.; Jakimavičius, D.; Bukantis, A.; Kažys, J.; Povilaitis, A.; Ložys, L.; Kesminas, V.; Virbickas, T.; et al. Projection of Lithuanian river runoff, temperature and their extremes under climate change. Hydrol. Res. 2018, 49, 344–362. [Google Scholar] [CrossRef]
- Valiukas, D. Droughts analysis in Lithuania using SPI and HTC indices. In Proceedings of the International Conference BALWOIS 2012, Ohrid, North Macedonia, 28 May–2 June 2012; pp. 1–9. [Google Scholar]
- Rimkus, E.; Stonevicius, E.; Kilpys, J.; Maciulyte, V.; Valiukas, D. Drought identification in the eastern Baltic region using NDVI. Earth Syst. Dynam. 2017, 8, 627–637. [Google Scholar] [CrossRef] [Green Version]
- Rimkus, E.; Mačiulytė, V.; Stonevičius, E.; Valiukas, D. A revised agricultural drought index in Lithuania. Agric. Food Sci. 2020, 29, 359–371. [Google Scholar] [CrossRef]
- Kugytė, G.; Valiuškevičius, G. Identification of Hydrological Droughts in Lithuanian Rivers. Geogr. Ir. Edukac. 2021, 9, 87–99. [Google Scholar] [CrossRef]
- Kriaučiūnienė, J.; Meilutytė-Barauskienė, D.; Reihan, A.; Koltsova, T.; Lizuma, L.; Šarauskienė, D. Variability in temperature, precipitation and river discharge in the Baltic States. Boreal Environ. Res. 2012, 17, 150–162. [Google Scholar]
- Kriaučiūnienė, J.; Kovalenkovienė, M.; Meilutytė-Barauskienė, D. Changes of the Low Flow in Lithuanian Rivers. Environ. Res. Eng. Manag. 2007, 42, 5–12. [Google Scholar]
- Akstinas, V.; Jakimavičius, D.; Meilutytė-Lukauskienė, D.; Kriaučiūnienė, J.; Šarauskienė, D. Uncertainty of annual runoff projections in Lithuanian rivers under a future climate. Hydrol. Res. 2020, 51, 257–271. [Google Scholar] [CrossRef]
- Kwadijk, J.; Deursen, W.P.A. Development and Testing of a GIS Based Water Balance Model for the Rhine Drainage Basin; University of Utrecht: Utrecht, The Netherlands, 1999; pp. 22–29. [Google Scholar]
- Fiedler, F.R. Simple, practical method for determining station weights using Thiessen polygons and Isohyetal maps. J. Hydrol. Eng. 2003, 8, 219–221. [Google Scholar] [CrossRef]
- Ashraful, M.; Chowdhury, M.A.; Kabir, M.M.; Sayed, A.; Hossain, S. Estimation of rainfall patterns in Bangladesh using different computational methods (arithmetic average, Thiessen polygon and Isohyet). J. Biodivers. Environ. Sci. 2016, 8, 2222–3045. [Google Scholar]
- Tigkas, D.; Vangelis, H.; Tsakiris, G. DrinC: A software for drought analysis based on drought indices. Earth Sci. Inform. 2015, 8, 697–709. [Google Scholar] [CrossRef]
- Surendran, U.; Anagha, B.; Raja, P.; Kumar, V.; Rajan, K.; Jayakumar, M. Analysis of Drought from Humid, Semi-Arid and Arid Regions of India Using DrinC Model with Different Drought Indices. Water Resour. Manag. 2019, 33, 1521–1540. [Google Scholar] [CrossRef]
- Abrha, H.; Hagos, H. Future drought and aridity monitoring using multi-model approach under climate change in Hintalo Wejerat district, Ethiopia. Sustain. Water Resour. Manag. 2019, 5, 1963–1972. [Google Scholar] [CrossRef]
- World Meteorological Organization. Standardized Precipitation Index User Guide; WMO-No. 1090; World Meteorological Organization: Geneva, Switzerland, 2012; pp. 1–24. [Google Scholar]
- Standardized Precipitation Index (SPI). Available online: https://edo.jrc.ec.europa.eu/documents/factsheets/factsheet_spi.pdf (accessed on 26 October 2021).
- Tirivarombo, S.; Osupile, D.; Eliasson, P. Drought monitoring and analysis: Standardised Precipitation Evapotranspiration Index (SPEI) and Standardised Precipitation Index (SPI). Phys. Chem. Earth Pt. A/B/C 2018, 106, 1–10. [Google Scholar] [CrossRef]
- Asadi Zarch, M.A.; Malekinezhad, H.; Mobin, M.H.; Dastorani, M.T.; Kousari, M.R. Drought Monitoring by Reconnaissance Drought Index (RDI) in Iran. Water Resour. Manag. 2011, 25, 3485–3504. [Google Scholar] [CrossRef] [Green Version]
- Zarei, A.R.; Moghimi, M.M.; Mahmoudi, M.R. Analysis of Changes in Spatial Pattern of Drought Using RDI Index in south of Iran. Water Resour. Manag. 2016, 30, 3723–3743. [Google Scholar] [CrossRef]
- Surendran, U.; Kumar, V.; Ramasubramoniam, S.; Raja, P. Development of Drought Indices for Semi-Arid Region Using Drought Indices Calculator (DrinC)—A Case Study from Madurai District, a Semi-Arid Region in India. Water Resour. Manag. 2017, 31, 3593–3605. [Google Scholar] [CrossRef]
- Guttman, N.B. On the sensitivity of sample L moments to sample size. J. Climatol. 1994, 7, 1026–1029. [Google Scholar] [CrossRef]
- Wu, H.; Hayes, M.J.; Wilhite, D.A.; Svoboda, M.D. The effect of the length of record on the standardized precipitation index calculation. Int. J. Climatol. 2005, 25, 505–520. [Google Scholar] [CrossRef] [Green Version]
- Alwan, I.A.; Ziboon, A.R.T.; Khalaf, A.G. Utilization of reconnaissance drought index (RDI) for monitoring of meteorological drought over middle Euphrates region during the period from 1988 to 2017. IOP Conf. Ser. Mater. Sci. Eng. 2019, 518, 22035. [Google Scholar] [CrossRef]
- Abubakar, H.; Newete, S.; Scholes, M. Drought Characterization and Trend Detection Using the Reconnaissance Drought Index for Setsoto Municipality of the Free State Province of South Africa and the Impact on Maize Yield. Water 2020, 12, 2993. [Google Scholar] [CrossRef]
- Merabti, A.; Martins, D.S.; Meddi, M.; Pereira, L.S. Spatial and Time Variability of Drought Based on SPI and RDI with Various Time Scales. Water Resour. Manag. 2018, 32, 1087–1100. [Google Scholar] [CrossRef]
- Thornthwaite, C.W. An approach towards a rational classification of climate. Geogr. Rev. 1948, 38, 55–94. [Google Scholar] [CrossRef]
- Kwarteng, F.; Shwetha, G.; Patil, R. Reconnaissance Drought Index as Potential Drought Monitoring Tool in a Deccan Plateau, Hot Semi-Arid Climatic Zone. Int. J. Agric. Sci. 2016, 8, 51. [Google Scholar]
- Nalbantis, I.; Tsakiris, G. Assessment of hydrological drought revisited. Water Resour. Manag. 2009, 23, 881–897. [Google Scholar] [CrossRef]
- Tabari, H.; Nikbakht, J.; Talaee, P.H. Hydrological Drought Assessment in Northwestern Iran Based on Streamflow Drought Index (SDI). Water Resour. Manag. 2012, 27, 137–151. [Google Scholar] [CrossRef]
- Myronidis, D.; Ioannou, K.; Fotakis, D.; Dörflinger, G. Streamflow and Hydrological Drought Trend Analysis and Forecasting in Cyprus. Water Resour. Manag. 2018, 32, 1759–1776. [Google Scholar] [CrossRef]
- Gudmundsson, L.; Bremnes, J.B.; Haugen, J.E.; Engen–Skaugen, T. Technical Note: Downscaling RCM precipitation to the station scale using statistical transformations—A comparison of methods. Hydrol. Earth Syst. Sci. Discuss. 2012, 16, 3383–3390. [Google Scholar] [CrossRef] [Green Version]
- Sunyer, M.A.; Hundecha, Y.; Lawrence, D.; Madsen, H.; Willems, P.; Martinkova, M.; Vormoor, K.; Burger, G.; Hanel, M.; Kriaučiūnienė, J.; et al. Inter–comparison of statistical downscaling methods for projection of extreme precipitation in Europe. Hydrol. Earth Syst. Sci. 2015, 19, 1827–1847. [Google Scholar] [CrossRef] [Green Version]
- SMHI. Integrated Hydrological Modelling System, Manual; Version 5.8; Swedish Meteorological and Hydrological Institute: Norrköping, Sweden, 2005; p. 115. [Google Scholar]
- Jakimavičius, D.; Adžgauskas, G.; Šarauskienė, D.; Kriaučiūnienė, J. Climate Change Impact on Hydropower Resources in Gauged and Ungauged Lithuanian River Catchments. Water 2020, 12, 3265. [Google Scholar] [CrossRef]
- Vicente-Serrano, S.M.; Quiring, S.M.; Peña-Gallardo, M.; Yaun, S.; Dominguez-Castro, F. A review of environmental droughts: Increased risk under global warming? Earth-Sci. Rev. 2020, 201, 102953. [Google Scholar] [CrossRef]
- Luo, L.; Apps, D.; Arcand, S.; Xu, H.; Pan, M.; Hoerling, M. Contribution of temperature and precipitation anomalies to the California drought during 2012–2015. Geophys. Res. Lett. 2017, 44, 3184–3192. [Google Scholar] [CrossRef]
- Hao, Z.; Singh, V.P.; Xia, Y. Seasonal drought prediction: Advances, challenges, and future prospects. Rev. Geophys. 2018, 56, 108–141. [Google Scholar] [CrossRef] [Green Version]
- Karamuz, E.; Bogdanowicz, E.; Senbeta, T.B.; Napiórkowski, J.J.; Romanowicz, R.J. Is It a Drought or Only a Fluctuation in Precipitation Patterns?—Drought Reconnaissance in Poland. Water 2021, 13, 807. [Google Scholar] [CrossRef]
- Brunner, M.I.; Slater, L.; Tallaksen, L.M.; Clark, M. Challenges in modeling and predicting floods and droughts: A review. WIREs Water 2021, 8, 1520. [Google Scholar] [CrossRef]
- Gailiušis, B.; Jablonskis, J.; Kovalenkovienė, M. Lithuanian Rivers: Hydrography and Runoff. In Lithuanian Rivers: Hydrography and Runoff; Lithuanian Energy Institute: Kaunas, Lithuanian, 2001; p. 792. [Google Scholar]
- Šarauskienė, D.; Akstinas, V.; Nazarenko, S.; Kriaučiūnienė, J.; Jurgelėnaitė, A. Impact of physico-geographical factors and climate variability on flow intermittency in the rivers of water surplus zone. Hydrol. Processes 2020, 34, 4727–4739. [Google Scholar] [CrossRef]
- Ionita, M.; Scholz, P.; Chelcea, S. Spatio-temporal variability of dryness/wetness in the Danube River Basin. Hydrol. Process 2015, 29, 4483–4497. [Google Scholar] [CrossRef]
- Kubiak-Wójcicka, K.; Nagy, P.; Zeleňáková, M.; Hlavatá, H.; Abd-Elhamid, H.F. Identification of Extreme Weather Events Using Meteorological and Hydrological Indicators in the Laborec River Catchment, Slovakia. Water 2021, 13, 1413. [Google Scholar] [CrossRef]
- Minea, I.; Iosub, M.; Boicu, D. Multi-scale approach for different type of drought in temperate climatic conditions. Nat. Hazards 2021, 1–25. [Google Scholar] [CrossRef]
- Jamshidi, H.; Khalili, D.; Zadeh, M.R.; Hosseinipour, E.Z. Assessment and Comparison of SPI and RDI Meteorological Drought Indices in Selected Synoptic Stations of Iran. In World Environmental and Water Resources Congress; Environmental and Water Resources Institute of ASCE: Palm Springs, CA, USA, 22–26 May 2011. [Google Scholar] [CrossRef]
- Memon, A.V.; Shah, N.V. Assessment and Comparison of SPI and RDI Meteorological Drought Indices in Panchmahals District of Gujarat, India. Int. J. Curr. Microbiol. App. Sci. 2019, 8, 1995–2004. [Google Scholar] [CrossRef]
- Khan, M.I.; Zhu, X.; Jiang, X.; Saddique, Q.; Saifullah, M.; Niaz, Y.; Sajid, M. Projection of Future Drought Characteristics under Multiple Drought Indices. Water 2021, 13, 1238. [Google Scholar] [CrossRef]
- Cheval, S.; Dumitrescu, A.; Birsan, M.-V. Variability of the aridity in the South-Eastern Europe over 1961–2050. CATENA 2017, 151, 74–86. [Google Scholar] [CrossRef]
- Van Loon, A. Hydrological drought explained. WIREs Water 2015, 2, 359–392. [Google Scholar] [CrossRef]
Figure 1.
Location of hydrological regions and selected WGSs and MSs.

Figure 2.
(a) Deviations from the average amount of precipitation (in mm); (b) Deviations from the average amount of discharge (in %).
Figure 2.
(a) Deviations from the average amount of precipitation (in mm); (b) Deviations from the average amount of discharge (in %).

Figure 3.
Distribution of drought values in the different hydrological regions (the accumulation period increases from left to right: 1, 3, 6, 9 and 12, respectively): (a) number of dry months for SPI-index; (b) distribution of minimum values by region for SPI-index; (c) number of dry months for RDI-index; (d) distribution of minimum values by region for RDI-index; (e) number of dry months for SDI-index; (f) distribution of minimum values by region for SDI-index.

Figure 4.
The number of strong correlations among all rivers for each summer month (numbers indicate the number of rivers that had a strong correlation in a particular month, color displays data in ascending order from red (1) to green (15), months without any strong correlation are not colored).
Figure 4.
The number of strong correlations among all rivers for each summer month (numbers indicate the number of rivers that had a strong correlation in a particular month, color displays data in ascending order from red (1) to green (15), months without any strong correlation are not colored).

Figure 5.
Values of meteorological (SPI-12) and hydrological (SDI-12) indices during the period from 1961 to 2020, in: (a) Minija-Kartena; (b) Venta-Leckava; (c) Šventoji-Ukmergė.
Figure 5.
Values of meteorological (SPI-12) and hydrological (SDI-12) indices during the period from 1961 to 2020, in: (a) Minija-Kartena; (b) Venta-Leckava; (c) Šventoji-Ukmergė.

Figure 6.
Graphical representation of the SDI-12 index calculation results in 1961–2020, where green indicates wet months and red indicates dry months, white—no data, the magnitude of the events depends on the brightness of the color.
Figure 6.
Graphical representation of the SDI-12 index calculation results in 1961–2020, where green indicates wet months and red indicates dry months, white—no data, the magnitude of the events depends on the brightness of the color.

Figure 7.
Box plot based on hydrological drought duration in months (the accumulation period increases from left to right: 1, 3, 6, 9 and 12, respectively).
Figure 7.
Box plot based on hydrological drought duration in months (the accumulation period increases from left to right: 1, 3, 6, 9 and 12, respectively).

Figure 8.
Distribution of rivers according to the driest months in the warm period: (a) SDI index with 1-month accumulation period; (b) SDI index with 12-month accumulation period.
Figure 8.
Distribution of rivers according to the driest months in the warm period: (a) SDI index with 1-month accumulation period; (b) SDI index with 12-month accumulation period.

Figure 9.
Distribution of rivers according to the number of driest months in the warm period for: (a) SDI index with 1-month accumulation period; (b) SDI index with 12-month accumulation period.
Figure 9.
Distribution of rivers according to the number of driest months in the warm period for: (a) SDI index with 1-month accumulation period; (b) SDI index with 12-month accumulation period.

Figure 10.
Deviation of SPI index with 12-month accumulation period in: (a) Šventoji—Ukmergė under RCP 4.5; (b) Venta—under RCP 4.5; (c) Minija—Kartena under RCP 4.5; (d) Šventoji—Ukmergė under RCP 8.5; (e) Venta—Leckava under RCP 8.5; (f) Minija—Kartena under RCP 8.5.
Figure 10.
Deviation of SPI index with 12-month accumulation period in: (a) Šventoji—Ukmergė under RCP 4.5; (b) Venta—under RCP 4.5; (c) Minija—Kartena under RCP 4.5; (d) Šventoji—Ukmergė under RCP 8.5; (e) Venta—Leckava under RCP 8.5; (f) Minija—Kartena under RCP 8.5.

Figure 11.
Deviation of RDI index with 12-month accumulation period: (a) Šventoji—Ukmergė under RCP 4.5; (b) Venta—Leckava under RCP 4.5; (c) Minija—Kartena RCP under 4.5; (d) Šventoji—Ukmergė RCP under 8.5; (e) Venta—Leckava under RCP 8.5; (f) Minija—Kartena under RCP 8.5.
Figure 11.
Deviation of RDI index with 12-month accumulation period: (a) Šventoji—Ukmergė under RCP 4.5; (b) Venta—Leckava under RCP 4.5; (c) Minija—Kartena RCP under 4.5; (d) Šventoji—Ukmergė RCP under 8.5; (e) Venta—Leckava under RCP 8.5; (f) Minija—Kartena under RCP 8.5.

Figure 12.
Deviation of SDI index with 12-month accumulation period: (a) Šventoji—Ukmergė under RCP 4.5; (b) Venta—Leckava under RCP 4.5; (c) Minija—Kartena under RCP 4.5; (d) Šventoji—Ukmergė under RCP 8.5; (e) Venta—Leckava under RCP 8.5; (f) Minija—Kartena under RCP 8.5.
Figure 12.
Deviation of SDI index with 12-month accumulation period: (a) Šventoji—Ukmergė under RCP 4.5; (b) Venta—Leckava under RCP 4.5; (c) Minija—Kartena under RCP 4.5; (d) Šventoji—Ukmergė under RCP 8.5; (e) Venta—Leckava under RCP 8.5; (f) Minija—Kartena under RCP 8.5.

Figure 13.
The Šventoji River, accumulation period 12 months: (a) RCP 4.5; (b) RCP 8.5.

Figure 14.
The Venta River, accumulation period 12 months: (a) RCP 4.5; (b) RCP 8.5.

Figure 15.
The Minija River, accumulation period 12 months: (a) RCP 4.5; (b) RCP 8.5.

Figure 16.
SDI index with 12-month accumulation period: (a) RCP 4.5 near future; (b) RCP 8.5 near future; (c) RCP 4.5 far future; (d) RCP 8.5 far future.
Figure 16.
SDI index with 12-month accumulation period: (a) RCP 4.5 near future; (b) RCP 8.5 near future; (c) RCP 4.5 far future; (d) RCP 8.5 far future.

Table 1.
List of the studied gauging station catchments with the main characteristics (observation period 1961–2020).
Table 1.
List of the studied gauging station catchments with the main characteristics (observation period 1961–2020).
| No | River | WGS | A, km2 | Qaverage, m3/s | Qmax, m3·s−1 (Year) | Qmin, m3·s−1 (Year) |
|---|---|---|---|---|---|---|
| Southeastern hydrological region | ||||||
| 1. | Merkys | Puvočiai | 4300 | 31.6 | 43.3 (1994) | 20.9 (2020) |
| 2. | Ūla | Zervynos | 679 | 4.82 | 6.95 (1994) | 2.84 (2020) |
| 3. | Verknė | Verbyliškės | 694 | 5.00 | 8.33 (1994) | 3.27 (1969) |
| 4. | Strėva | Semeliškės | 234 | 1.64 | 2.43 (1994) | 1.16 (2003) |
| 5. | Žeimena | Pabradė | 2580 | 20.3 | 31.1 (1990) | 14.1 (2003) |
| 6. | Šventoji | Anykščiai | 3600 | 26.5 | 50.9 (2017) | 14.9 (1971) |
| 7. | Šventoji | Ukmergė | 5440 | 38.9 | 73.0 (2017) | 20.2 (1976) |
| Central hydrological region | ||||||
| 8. | Nevėžis | Panevėžys | 1090 | 7.25 | 19.7 (1972) | 2.11 (2003) |
| 9. | Šušvė | Šiaulėnai | 162 | 1.18 | 2.11 (1980) | 0.43 (2020) |
| 10. | Nemunėlis | Tabokinė | 2690 | 19.5 | 37.1 (1962) | 9.19 (2006) |
| 11. | Mūša | Ustukiai | 2280 | 10.2 | 19.7 (1998) | 2.89 (1976) |
| 12. | Venta | Papilė | 1570 | 9.66 | 18.8 (1980) | 3.88 (1976) |
| 13. | Venta | Leckava | 4060 | 29.5 | 60.8 (1980) | 13.8 (1963) |
| Western hydrological region | ||||||
| 14. | Jūra | Tauragė | 1690 | 21.9 | 37.7 (1974) | 10.6 (1964) |
| 15. | Akmena | Paakmenis | 314 | 4.26 | 6.87 (1998) | 1.96 (1964) |
| 16. | Minija | Kartena | 1230 | 16.5 | 26.3 (2007) | 7.47 (1969) |
| 17. | Bartuva | Skuodas | 612 | 7.50 | 13.6 (1981) | 3.17 (1969) |
Table 2.
Main characteristics of the selected river catchments.
| River-WGS | Hydrological Characteristic | Geographical Characteristic | |||
|---|---|---|---|---|---|
| Average Discharge, m3 s−1 | Basin Area, km2 | Lakes, % | Wetland, % | Woods, % | |
| Šventoji-Ukmergė | 38.9 | 5440 | 3.8 | 9.0 | 12.0 |
| Minija-Kartena | 16.5 | 1230 | 1.4 | 8.0 | 20.0 |
| Venta-Leckava | 29.5 | 4060 | 1.0 | 9.0 | 22.0 |
Table 3.
Results of calibration and validation of hydrological models (where NSE is Nash–Sutcliffe model efficiency coefficient: RE is a difference between observed and modeled runoff in %).
Table 3.
Results of calibration and validation of hydrological models (where NSE is Nash–Sutcliffe model efficiency coefficient: RE is a difference between observed and modeled runoff in %).
| River-WGS | Calibration | Validation | ||||
|---|---|---|---|---|---|---|
| r | NSE | RE, % | r | NSE | RE, % | |
| Šventoji-Ukmergė | 0.75 | 0.64 | 2.6 | 0.68 | 0.64 | 12.9 |
| Minija-Kartena | 0.88 | 0.77 | 3.8 | 0.83 | 0.70 | −1.1 |
| Venta-Leckava | 0.88 | 0.77 | −2.6 | 0.81 | 0.75 | 3.5 |
Table 4.
Percentage distribution of index values by drought condition classes.
| Index | Extremely Wet Index > 2.0 | Severely Wet 2.0 > Index > 1.5 | Moderately Wet 1.5 > Index > 1.0 | Normal 1.0 > Index > −1.0 | Moderately Dry −1.0 < Index < −1.5 | Severely Dry −1.5 > Index > −2.0 | Extremely Dry Index < −2.0 |
|---|---|---|---|---|---|---|---|
| Šventoji–Ukmergė | |||||||
| SPI-1 | 1.39 | 3.33 | 9.45 | 70.14 | 7.64 | 3.61 | 4.44 |
| SPI-3 | 1.11 | 5.85 | 9.75 | 66.44 | 9.61 | 4.04 | 3.20 |
| SPI-6 | 1.82 | 5.17 | 9.23 | 67.97 | 9.37 | 4.20 | 2.24 |
| SPI-9 | 1.69 | 5.34 | 8.71 | 66.71 | 10.81 | 4.77 | 1.97 |
| SPI-12 | 2.40 | 4.65 | 8.60 | 66.29 | 11.43 | 5.08 | 1.55 |
| RDI-1 | 2.79 | 2.61 | 8.38 | 71.32 | 8.38 | 3.73 | 2.79 |
| RDI-3 | 2.47 | 5.56 | 7.25 | 69.29 | 10.03 | 3.24 | 2.16 |
| RDI-6 | 2.10 | 6.29 | 8.39 | 67.97 | 8.81 | 4.62 | 1.82 |
| RDI-9 | 2.11 | 5.34 | 9.55 | 67.13 | 9.27 | 4.63 | 1.97 |
| RDI-12 | 1.83 | 4.8 | 10.72 | 65.87 | 9.59 | 5.22 | 1.97 |
| SDI-1 | 4.19 | 3.49 | 7.54 | 69.97 | 10.90 | 3.77 | 0.14 |
| SDI-3 | 3.66 | 3.66 | 9.02 | 68.87 | 9.44 | 4.79 | 0.56 |
| SDI-6 | 2.42 | 4.28 | 9.70 | 67.76 | 9.42 | 5.28 | 1.14 |
| SDI-9 | 1.73 | 5.78 | 8.81 | 65.61 | 11.13 | 5.35 | 1.59 |
| SDI-12 | 1.32 | 6.00 | 10.1 | 64.28 | 10.98 | 4.83 | 2.49 |
| Venta–Leckava | |||||||
| SPI-1 | 1.11 | 4.03 | 9.03 | 70.83 | 7.22 | 4.31 | 3.41 |
| SPI-3 | 1.67 | 4.46 | 8.63 | 71.45 | 6.13 | 4.60 | 3.06 |
| SPI-6 | 1.82 | 5.31 | 9.23 | 67.97 | 9.09 | 3.92 | 2.66 |
| SPI-9 | 1.97 | 4.35 | 10.25 | 66.85 | 8.57 | 5.48 | 2.53 |
| SPI-12 | 1.13 | 4.94 | 11.14 | 64.88 | 9.87 | 5.92 | 2.12 |
| RDI-1 | 1.65 | 3.30 | 9.16 | 71.98 | 7.87 | 3.84 | 2.20 |
| RDI-3 | 2.60 | 3.06 | 9.48 | 70.80 | 7.49 | 4.43 | 2.14 |
| RDI-6 | 2.38 | 3.50 | 10.91 | 67.69 | 8.81 | 4.75 | 1.96 |
| RDI-9 | 1.55 | 4.49 | 10.67 | 67.28 | 7.44 | 6.04 | 2.53 |
| RDI-12 | 1.83 | 3.25 | 11.28 | 67.42 | 7.62 | 7.19 | 1.41 |
| SDI-1 | 3.47 | 3.75 | 9.31 | 68.33 | 11.11 | 3.61 | 0.42 |
| SDI-3 | 2.65 | 4.87 | 8.64 | 67.27 | 11.42 | 4.04 | 1.11 |
| SDI-6 | 2.52 | 4.19 | 8.39 | 68.39 | 10.21 | 4.06 | 2.24 |
| SDI-9 | 1.68 | 4.92 | 7.86 | 69.52 | 8.57 | 5.34 | 2.11 |
| SDI-12 | 1.83 | 4.09 | 9.45 | 69.53 | 6.35 | 6.77 | 1.97 |
| Minija–Kartena | |||||||
| SPI-1 | 0.97 | 3.89 | 9.44 | 71.53 | 6.53 | 3.61 | 4.03 |
| SPI-3 | 1.67 | 4.32 | 8.50 | 71.03 | 6.96 | 4.04 | 3.48 |
| SPI-6 | 1.82 | 5.03 | 9.93 | 66.85 | 9.37 | 4.34 | 2.66 |
| SPI-9 | 1.54 | 5.06 | 10.53 | 66.29 | 8.57 | 5.06 | 2.95 |
| SPI-12 | 1.27 | 5.50 | 10.16 | 65.30 | 9.59 | 6.35 | 1.83 |
| RDI-1 | 1.78 | 4.10 | 9.09 | 71.84 | 7.67 | 2.85 | 2.67 |
| RDI-3 | 2.55 | 3.00 | 8.56 | 73.73 | 6.31 | 3.90 | 1.95 |
| RDI-6 | 2.38 | 3.91 | 10.35 | 67.83 | 9.51 | 3.64 | 2.38 |
| RDI-9 | 1.69 | 4.35 | 11.10 | 66.85 | 8.99 | 4.49 | 2.53 |
| RDI-12 | 2.26 | 2.40 | 13.12 | 65.30 | 9.45 | 5.78 | 1.69 |
| SDI-1 | 3.33 | 4.03 | 8.89 | 67.92 | 10.97 | 3.89 | 0.97 |
| SDI-3 | 2.23 | 3.90 | 10.58 | 65.88 | 11.56 | 3.48 | 2.37 |
| SDI-6 | 1.12 | 4.19 | 10.91 | 66.01 | 9.79 | 4.90 | 3.08 |
| SDI-9 | 0.28 | 4.36 | 11.80 | 66.85 | 7.02 | 6.18 | 3.51 |
| SDI-12 | 0.99 | 3.53 | 11.14 | 66.99 | 7.19 | 6.63 | 3.53 |
Table 5.
Changes of SPI (x in Table) according to RCP 4.5.
| Condition Classes | Šventoji–Ukmergė | Venta–Leckava | Minija–Kartena | ||||||
|---|---|---|---|---|---|---|---|---|---|
| Historical Data (1961–2020) | Near Future (2021–2060) | Far Future (2061–2100) | Historical Data (1961–2020) | Near Future (2021–2060) | Far Future (2061–2100) | Historical Data (1961–2020) | Near Future (2021–2060) | Far Future (2061–2100) | |
| x > 2.0 | 2.40 | 1.15 | 1.25 | 1.13 | 0.10 | 1.67 | 1.27 | 0.10 | 1.56 |
| 1.5 < x ˂ 2.0 | 4.65 | 1.15 | 1.88 | 4.94 | 1.25 | 2.40 | 5.50 | 1.04 | 3.75 |
| 1.0 < x ˂ 1.5 | 8.60 | 4.69 | 6.67 | 11.14 | 3.02 | 7.50 | 10.16 | 3.44 | 6.67 |
| −1.0 < x ˂ 1.0 | 66.29 | 33.54 | 32.08 | 64.88 | 35.94 | 31.14 | 65.30 | 35.42 | 31.04 |
| −1.0 > x > −1.5 | 11.43 | 5.41 | 4.69 | 9.87 | 6.15 | 4.06 | 9.59 | 6.77 | 3.96 |
| −1.5 > x > −2.0 | 5.08 | 3.12 | 2.08 | 5.92 | 2.60 | 1.77 | 6.35 | 2.19 | 2.50 |
| x < −2.0 | 1.55 | 0.94 | 1.35 | 2.12 | 0.94 | 1.46 | 1.83 | 1.04 | 0.52 |
| SUM | 100 | 50 | 50 | 100 | 50 | 50 | 100 | 50 | 50 |
Table 6.
Changes of SPI (x in Table) according to RCP 8.5.
| Condition Classes | Šventoji–Ukmergė | Venta–Leckava | Minija–Kartena | ||||||
|---|---|---|---|---|---|---|---|---|---|
| Historical Data (1961–2020) | Near Future (2021–2060) | Far Future (2061–2100) | Historical Data (1961–2020) | Near Future (2021–2060) | Far Future (2061–2100) | Historical Data (1961–2020) | Near Future (2021–2060) | Far Future (2061–2100) | |
| x > 2.0 | 2.40 | 0.31 | 1.98 | 1.13 | 0.00 | 2.71 | 1.27 | 0.00 | 3.23 |
| 1.5 < x ˂2.0 | 4.65 | 0.83 | 2.50 | 4.94 | 0.52 | 5.31 | 5.50 | 0.31 | 4.58 |
| 1.0 < x ˂ 1.5 | 8.60 | 1.46 | 9.38 | 11.14 | 1.88 | 6.88 | 10.16 | 2.29 | 7.39 |
| −1.0 < x ˂ 1.0 | 66.29 | 35.1 | 31.77 | 64.88 | 35.10 | 32.60 | 65.30 | 34.90 | 31.88 |
| −1.0 > x > −1.5 | 11.43 | 6.67 | 3.54 | 9.87 | 8.75 | 1.77 | 9.59 | 8.65 | 2.50 |
| −1.5 > x > −2.0 | 5.08 | 3.65 | 0.73 | 5.92 | 2.29 | 0.42 | 6.35 | 2.81 | 0.42 |
| x < −2.0 | 1.55 | 1.98 | 0.10 | 2.12 | 1.46 | 0.31 | 1.83 | 1.04 | 0.00 |
| SUM | 100 | 50 | 50 | 100 | 50 | 50 | 100 | 50 | 50 |
Table 7.
Changes of RDI (x in Table) according to RCP 4.5.
| Condition Classes | Šventoji–Ukmergė | Venta–Leckava | Minija–Kartena | ||||||
|---|---|---|---|---|---|---|---|---|---|
| Historical Data (1961–2020) | Near Future (2021–2060) | Far Future (2061–2100) | Historical Data (1961–2020) | Near Future (2021–2060) | Far Future (2061–2100) | Historical Data (1961–2020) | Near Future (2021–2060) | Far Future (2061–2100) | |
| x > 2.0 | 1.83 | 1.25 | 0.42 | 1.83 | 0.41 | 1.67 | 2.26 | 0.42 | 1.77 |
| 1.5 < x ˂ 2.0 | 4.80 | 2.71 | 2.71 | 3.25 | 1.56 | 0.83 | 2.40 | 1.67 | 1.04 |
| 1.0 < x ˂ 1.5 | 10.72 | 5.00 | 4.58 | 11.28 | 5.21 | 6.35 | 13.12 | 5.21 | 6.56 |
| −1.0 < x ˂ 1.0 | 65.87 | 34.16 | 33.13 | 67.42 | 36.04 | 31.98 | 62.30 | 35.62 | 31.56 |
| −1.0 > x > −1.5 | 9.59 | 4.27 | 4.06 | 7.62 | 4.17 | 4.28 | 9.45 | 4.06 | 5.42 |
| −1.5 > x > −2.0 | 5.22 | 2.40 | 2.81 | 7.19 | 1.88 | 2.92 | 5.78 | 1.98 | 2.50 |
| x < −2.0 | 1.97 | 0.21 | 2.29 | 1.41 | 0.73 | 1.67 | 1.69 | 1.04 | 1.15 |
| SUM | 100 | 50 | 50 | 100 | 50 | 50 | 100 | 50 | 50 |
Table 8.
Changes of RDI (x in Table) according to RCP 8.5 for three rivers.
| Condition Classes | Šventoji–Ukmergė | Venta–Leckava | Minija–Kartena | ||||||
|---|---|---|---|---|---|---|---|---|---|
| Historical Data (1961–2020) | Near Future (2021–2060) | Far Future (2061–2100) | Historical Data (1961–2020) | Near Future (2021–2060) | Far Future (2061–2100) | Historical Data (1961–2020) | Near Future (2021–2060) | Far Future (2061–2100) | |
| x > 2.0 | 1.83 | 1.35 | 2.29 | 1.83 | 0.63 | 1.25 | 2.26 | 0.52 | 1.77 |
| 1.5 < x ˂ 2.0 | 4.80 | 1.46 | 1.36 | 3.25 | 2.40 | 4.58 | 2.40 | 2.61 | 3.75 |
| 1.0 < x ˂ 1.5 | 10.72 | 4.89 | 3.33 | 11.28 | 4.58 | 4.37 | 13.12 | 4.58 | 5.00 |
| −1.0 < x ˂ 1.0 | 65.87 | 35.42 | 35.1 | 67.42 | 33.85 | 31.88 | 62.30 | 33.54 | 31.46 |
| −1.0 > x > −1.5 | 9.59 | 4.17 | 5.00 | 7.62 | 5.73 | 6.15 | 9.45 | 5.73 | 6.25 |
| −1.5 > x > −2.0 | 5.22 | 1.67 | 2.29 | 7.19 | 1.46 | 1.15 | 5.78 | 1.98 | 1.56 |
| x < −2.0 | 1.97 | 1.04 | 0.63 | 1.41 | 1.35 | 0.62 | 1.69 | 1.04 | 0.21 |
| SUM | 100 | 50 | 50 | 100 | 50 | 50 | 100 | 50 | 50 |
Table 9.
Changes of SDI (x in Table) according to RCP 4.5.
| Condition Classes | Šventoji–Ukmergė | Venta–Leckava | Minija–Kartena | ||||||
|---|---|---|---|---|---|---|---|---|---|
| Historical Data (1961–2020) | Near Future (2021–2060) | Far Future (2061–2100) | Historical Data (1961–2020) | Near Future (2021–2060) | Far Future (2061–2100) | Historical Data (1961–2020) | Near Future (2021–2060) | Far Future (2061–2100) | |
| x > 2.0 | 1.32 | 0.94 | 0.21 | 1.83 | 0.00 | 0.63 | 0.99 | 0.00 | 1.35 |
| 1.5 < x ˂ 2.0 | 6.00 | 3.75 | 2.08 | 4.09 | 3.23 | 2.60 | 3.53 | 2.40 | 2.29 |
| 1.0 < x ˂ 1.5 | 10.10 | 7.08 | 3.75 | 9.45 | 5.21 | 3.54 | 11.14 | 5.31 | 4.69 |
| −1.0 < x ˂ 1.0 | 64.28 | 31.46 | 34.27 | 69.53 | 34.58 | 31.88 | 66.99 | 34.27 | 31.04 |
| −1.0 > x > −1.5 | 10.98 | 4.38 | 5.52 | 6.35 | 4.48 | 5.10 | 7.19 | 4.27 | 5.42 |
| −1.5 > x > −2.0 | 4.83 | 1.56 | 2.61 | 6.77 | 2.29 | 4.27 | 6.63 | 2.71 | 4.06 |
| x < −2.0 | 2.49 | 0.83 | 1.56 | 1.97 | 0.21 | 1.98 | 3.53 | 1.04 | 1.15 |
| SUM | 100 | 50 | 50 | 100 | 50 | 50 | 100 | 50 | 50 |
Table 10.
Changes of SDI (x in Table) according to RCP 8.5.
| Condition Classes | Šventoji–Ukmergė | Venta–Leckava | Minija–Kartena | ||||||
|---|---|---|---|---|---|---|---|---|---|
| Historical Data (1961–2020) | Near Future (2021–2060) | Far Future (2061–2100) | Historical Data (1961–2020) | Near Future (2021–2060) | Far Future (2061–2100) | Historical Data (1961–2020) | Near Future (2021–2060) | Far Future (2061–2100) | |
| x > 2.0 | 1.32 | 1.35 | 2.08 | 1.83 | 0.94 | 1.99 | 0.99 | 0.10 | 1.98 |
| 1.5 < x ˂ 2.0 | 6.00 | 2.08 | 0.83 | 4.09 | 2.81 | 3.23 | 3.53 | 2.08 | 6.04 |
| 1.0 < x ˂ 1.5 | 10.10 | 5.00 | 2.50 | 9.45 | 3.86 | 6.04 | 11.14 | 3.44 | 4.69 |
| −1.0 < x ˂ 1.0 | 64.28 | 35.63 | 34.79 | 69.53 | 38.02 | 27.50 | 66.99 | 37.08 | 28.33 |
| −1.0 > x > −1.5 | 10.98 | 5.21 | 5.94 | 6.35 | 3.85 | 6.98 | 7.19 | 5.73 | 6.46 |
| −1.5 > x > −2.0 | 4.83 | 0.73 | 3.13 | 6.77 | 0.52 | 3.44 | 6.63 | 1.46 | 1.56 |
| x < −2.0 | 2.49 | 0.00 | 0.73 | 1.97 | 0.00 | 0.83 | 3.53 | 0.11 | 0.94 |
| SUM | 100 | 50 | 50 | 100 | 50 | 50 | 100 | 50 | 50 |
Publisher’s Note: MDPI stays neutral with regard to jurisdictional claims in published maps and institutional affiliations. |
© 2022 by the authors. Licensee MDPI, Basel, Switzerland. This article is an open access article distributed under the terms and conditions of the Creative Commons Attribution (CC BY) license (https://creativecommons.org/licenses/by/4.0/).
Share and Cite
MDPI and ACS Style
Nazarenko, S.; Kriaučiūnienė, J.; Šarauskienė, D.; Jakimavičius, D. Patterns of Past and Future Droughts in Permanent Lowland Rivers. Water 2022, 14, 71. https://doi.org/10.3390/w14010071
AMA Style
Nazarenko S, Kriaučiūnienė J, Šarauskienė D, Jakimavičius D. Patterns of Past and Future Droughts in Permanent Lowland Rivers. Water. 2022; 14(1):71. https://doi.org/10.3390/w14010071
Chicago/Turabian StyleNazarenko, Serhii, Jūratė Kriaučiūnienė, Diana Šarauskienė, and Darius Jakimavičius. 2022. "Patterns of Past and Future Droughts in Permanent Lowland Rivers" Water 14, no. 1: 71. https://doi.org/10.3390/w14010071
Note that from the first issue of 2016, this journal uses article numbers instead of page numbers. See further details here.