Article

Effect of the Aeration Strategy on NOB Suppression in Activated Sludge and Biofilm in a Hybrid Reactor with Nitrification/Denitrification

by
Olga Zajac
1,*,
Monika Zubrowska-Sudol
1,
Slawomir Ciesielski
2 and
Martyna Godzieba
2
1
Department of Water Supply and Wastewater Treatment, Faculty of Building Services Hydro and Environmental Engineering, Warsaw University of Technology, Nowowiejska 20, 00-653 Warsaw, Poland
2
Department of Environmental Biotechnology, University of Warmia and Mazury in Olsztyn, Sloneczna 45G, 10-709 Olsztyn, Poland
*
Author to whom correspondence should be addressed.
Water 2022, 14(1), 72; https://doi.org/10.3390/w14010072
Submission received: 24 November 2021 / Revised: 15 December 2021 / Accepted: 28 December 2021 / Published: 1 January 2022

Abstract

:
The purpose of the study was to analyse the impact of aeration strategies defined by the changes in the duration of aerated sub-phases, the ratio between non-aerated and aerated sub-phase times (R), and dissolved oxygen concentrations (DO) on the suppression of nitrite-oxidizing bacteria (NOB) in activated sludge and biofilm developing in a hybrid reactor with nitrification/denitrification. The primary factor causing NOB suppression both in biofilm and in activated sludge was an increase in the R-value (from 0 to 1/4 and from 1/4 to 1/3). After reducing the DO from 3 to 2 mg O2/L, there were no changes in the frequency of NOB occurrence, and no reduction in the nitrite oxidation rate was recorded. The abundance of Comammox bacteria was considerably affected by the change from continuous to intermittent aeration. Activated sludge showed a substantial increase in the quantity of clade A and B, whereas the quantity considerably decreased in biofilm.

1. Introduction

An intriguing research problem is the possibility of inhibition of the nitrification process at its first stage, namely nitritation. In comparison to the traditional model of biological nitrogen removal in nitrification/denitrification (N/D) systems, the implementation of processes based on partial nitrification offers the possibility of saving 25% of energy costs used for aeration, reducing the demand for organic carbon for conducting the denitrification process by 40%, and reducing sludge production by 50% [1]. Suppression of nitrification at its first stage is also necessary for the application of innovative systems of nitrogen removal in wastewater treatment plants, such as Sharon, Canon, Oland, or SNAD [2,3]. The aforementioned effects permit reduction in the energy consumption in the wastewater treatment process, therefore contributing to an increase in the energy self-sufficiency of a wastewater treatment plant. They also respond to the challenges of the circular economy.
The literature offers many publications regarding suppression of nitrification at its first stage, but most of them concern deammonification systems operating based on the biofilm [4,5], granular sludge [6], or activated sludge technology [7,8], or those focusing exclusively on the nitrification process, where biomass develops in the form of activated sludge [9,10] or biofilm [11,12]. One of the methods of suppression of bacteria that oxidize nitrites to nitrates (NOB) is conducting the wastewater treatment process at a low concentration of dissolved oxygen (DO) [10,12]. It is believed that in such conditions, the activity of ammonia-oxidizing bacteria (AOB) is higher than that of nitrite-oxidizing bacteria (NOB). This is due to the fact that the half-saturation constant (Ko) of AOB is lower than the index value for NOB. As a result, at lower availability of oxygen, the quantity of NOB in the biomass gradually decreases [13]. Another frequently used method of NOB suppression is a combination of a low dissolved oxygen concentration and the application of intermittent aeration in the case of which an important factor affecting the suppression of NOB are durations of aerated (t1) and non-aerated phases (t2), and the related ratio t2/t1 (R) [4,8]. For example, Ma et al. [8], conducting research in an SBR at oxygen concentration in aerobic phases at a level of 0.08–0.25 mg O2/L and comparing different durations of aerated and non-aerated phases (30 min:30 min, R = 1; 30 min:60 min, R = 2; 15 min:90 min, R = 6; 15 min:15 min, R = 1), recorded the highest accumulation of NO2 (27.3 mg N-NO2/L) at the highest value of R. According to the literature, low DO in intermittent aeration systems does not always favor NOB suppression. For DO of 0.3 ± 0.14 mg O2/L, Bao et al. [9] observed ammonia nitrogen oxidation to nitrates, and obtained accumulation of NO2 by increasing the DO level to 1.8 ± 0.32 mg O2/L (the system operated at R = 1, and t1 and t2 reached 10 min.
Publications discussing NOB suppression in the mainstream systems with N/D are still scarce. Most of them concern activated sludge technology [1,14,15,16,17,18]. In addition, in this case, one of the reported methods of NOB suppression is conducting the treatment process at low DO concentration. According to most researchers, a decrease in oxygen concentration in the reactor has a positive effect on the suppression of NOB [1,16,17]. More than 95% accumulation of nitrites in the effluent was obtained by maintaining oxygen concentration within a range of 0.4–0.7 mg O2/L. An increase in the value of the indicator to 2–3 mg O2/L resulted in the domination of nitrates in the effluent [16]. Equally high accumulation of NO2 (90%) was obtained when the DO level in the reactor was in a range of 0.2–0.3 mg O2/L by Zeng et al. [1]. It was additionally evidenced that a decrease in hydraulic retention time (HRT) is a factor contributing to NOB suppression. By decreasing DO from 5.7 to 0.7 mg O2/L, Ruiz et al. [17] only observed the accumulation of nitrites when the concentration of the analyzed indicator reached 1.4 mg O2/L. Maximum accumulation of NO2 was recorded at DO = 0.7 mg O2/L; it was 65%. In systems with N/D, NOB suppression was also obtained by the introduction of intermittent aeration. Katsogiannis et al. [14] reported more than 95% accumulation of nitrite nitrogen, attributing it to the suppression of the activity of NOB due to the short duration of the aerated phase. In the system applied by the authors, the durations of aerated and non-aerated phases were 20 min and 60 min, respectively (R = 3), and DO was in a range of 2–6.5 mg O2/L. Equally high accumulation of nitrites (92.25%) was recorded by Li et al. [15] using the strategy of intermittent aeration with simultaneous maintenance of a low DO (the duration of aerated and non-aerated phases was 30 min and 10 min, respectively; R = 1/3, DO was 0.2 mg O2/L).
Little investigation has been so far performed regarding NOB suppression in the mainstream system with N/D operating in the biofilm or hybrid technology [19,20]. After a change in the aeration strategy from continuous to intermittent (2 min with aeration: 2 min without aeration; R = 1), Yang and Yang [20] recorded an increase in the accumulation of nitrites from 4.5% to 49.1%. After prolonging the non-aerated phase to 4 min (R = 2), they obtained an accumulation of NO2 at a level of 79.4% (the study was conducted in a moving-bed membrane bioreactor). The observations were equated with the suppression of the activity of NOB, not with their complete washing out from the reactor. Bhatia et al. [19], conducting research regarding the effect of intermittent aeration on microbial diversity in an integrated fixed-film activated sludge reactor, evidenced that a decrease in the value of R from 0.66 to 0.2 was accompanied by a decrease in the abundance of bacteria from genus Nitrospira, identified as the dominating nitrite oxidizers. The authors, however, did not explain the recorded changes in the abundance of Nitrospira sp. in reference to the form in which biomass developed in the reactor (i.e., suspended biomass and attached biomass on fixed curtains).
This study presents results of research aimed at the determination of the effect of different aeration strategies on the suppression of NOB in a hybrid system with nitrification/denitrification, with consideration of the form in which biomass develops in the reactor (i.e., suspended biomass and attached biomass on moving carriers). The experiment was conducted in an integrated fixed-film activated sludge moving-bed sequencing batch biofilm reactor (IFAS-MBSBBR) with N/D. To the best knowledge of the authors, it is the first attempt of explaining the suppression of NOB in this type of reactor. The experiment involved changes in the durations of aerated sub-phases, values of the R index, and values of dissolved oxygen concentration in aerated sub-phases, in search for the determination in what way the aforementioned factors affect the suppression of NOB developing in activated sludge flocs and how they affect biomass developing in the same reactor but in the form of biofilm. Solving the defined problem involved the application of two types of batch tests: (I) ammonia utilization rate test (AUR), permitting the determination of the rate of ammonia nitrogen oxidation and observation of the accumulation of nitrites; (II) nitrite utilization rate test (NitUR) permitting the determination of the rate of nitrite nitrogen oxidation. The determination of changes in the frequency of occurrence of ammonia-oxidizing bacteria (AOB), nitrite-oxidizing bacteria (NOB), and Comammox bacteria employed the quantitative polymerase chain reaction (qPCR). The results presented in this paper will allow broadening the knowledge on the impact of various aeration strategies on NOB suppression in the IFAS-MBSBBR systems, providing support in the design and operation of such systems on a technical scale.

2. Materials and Methods

2.1. Reactor Set-Up and Operation

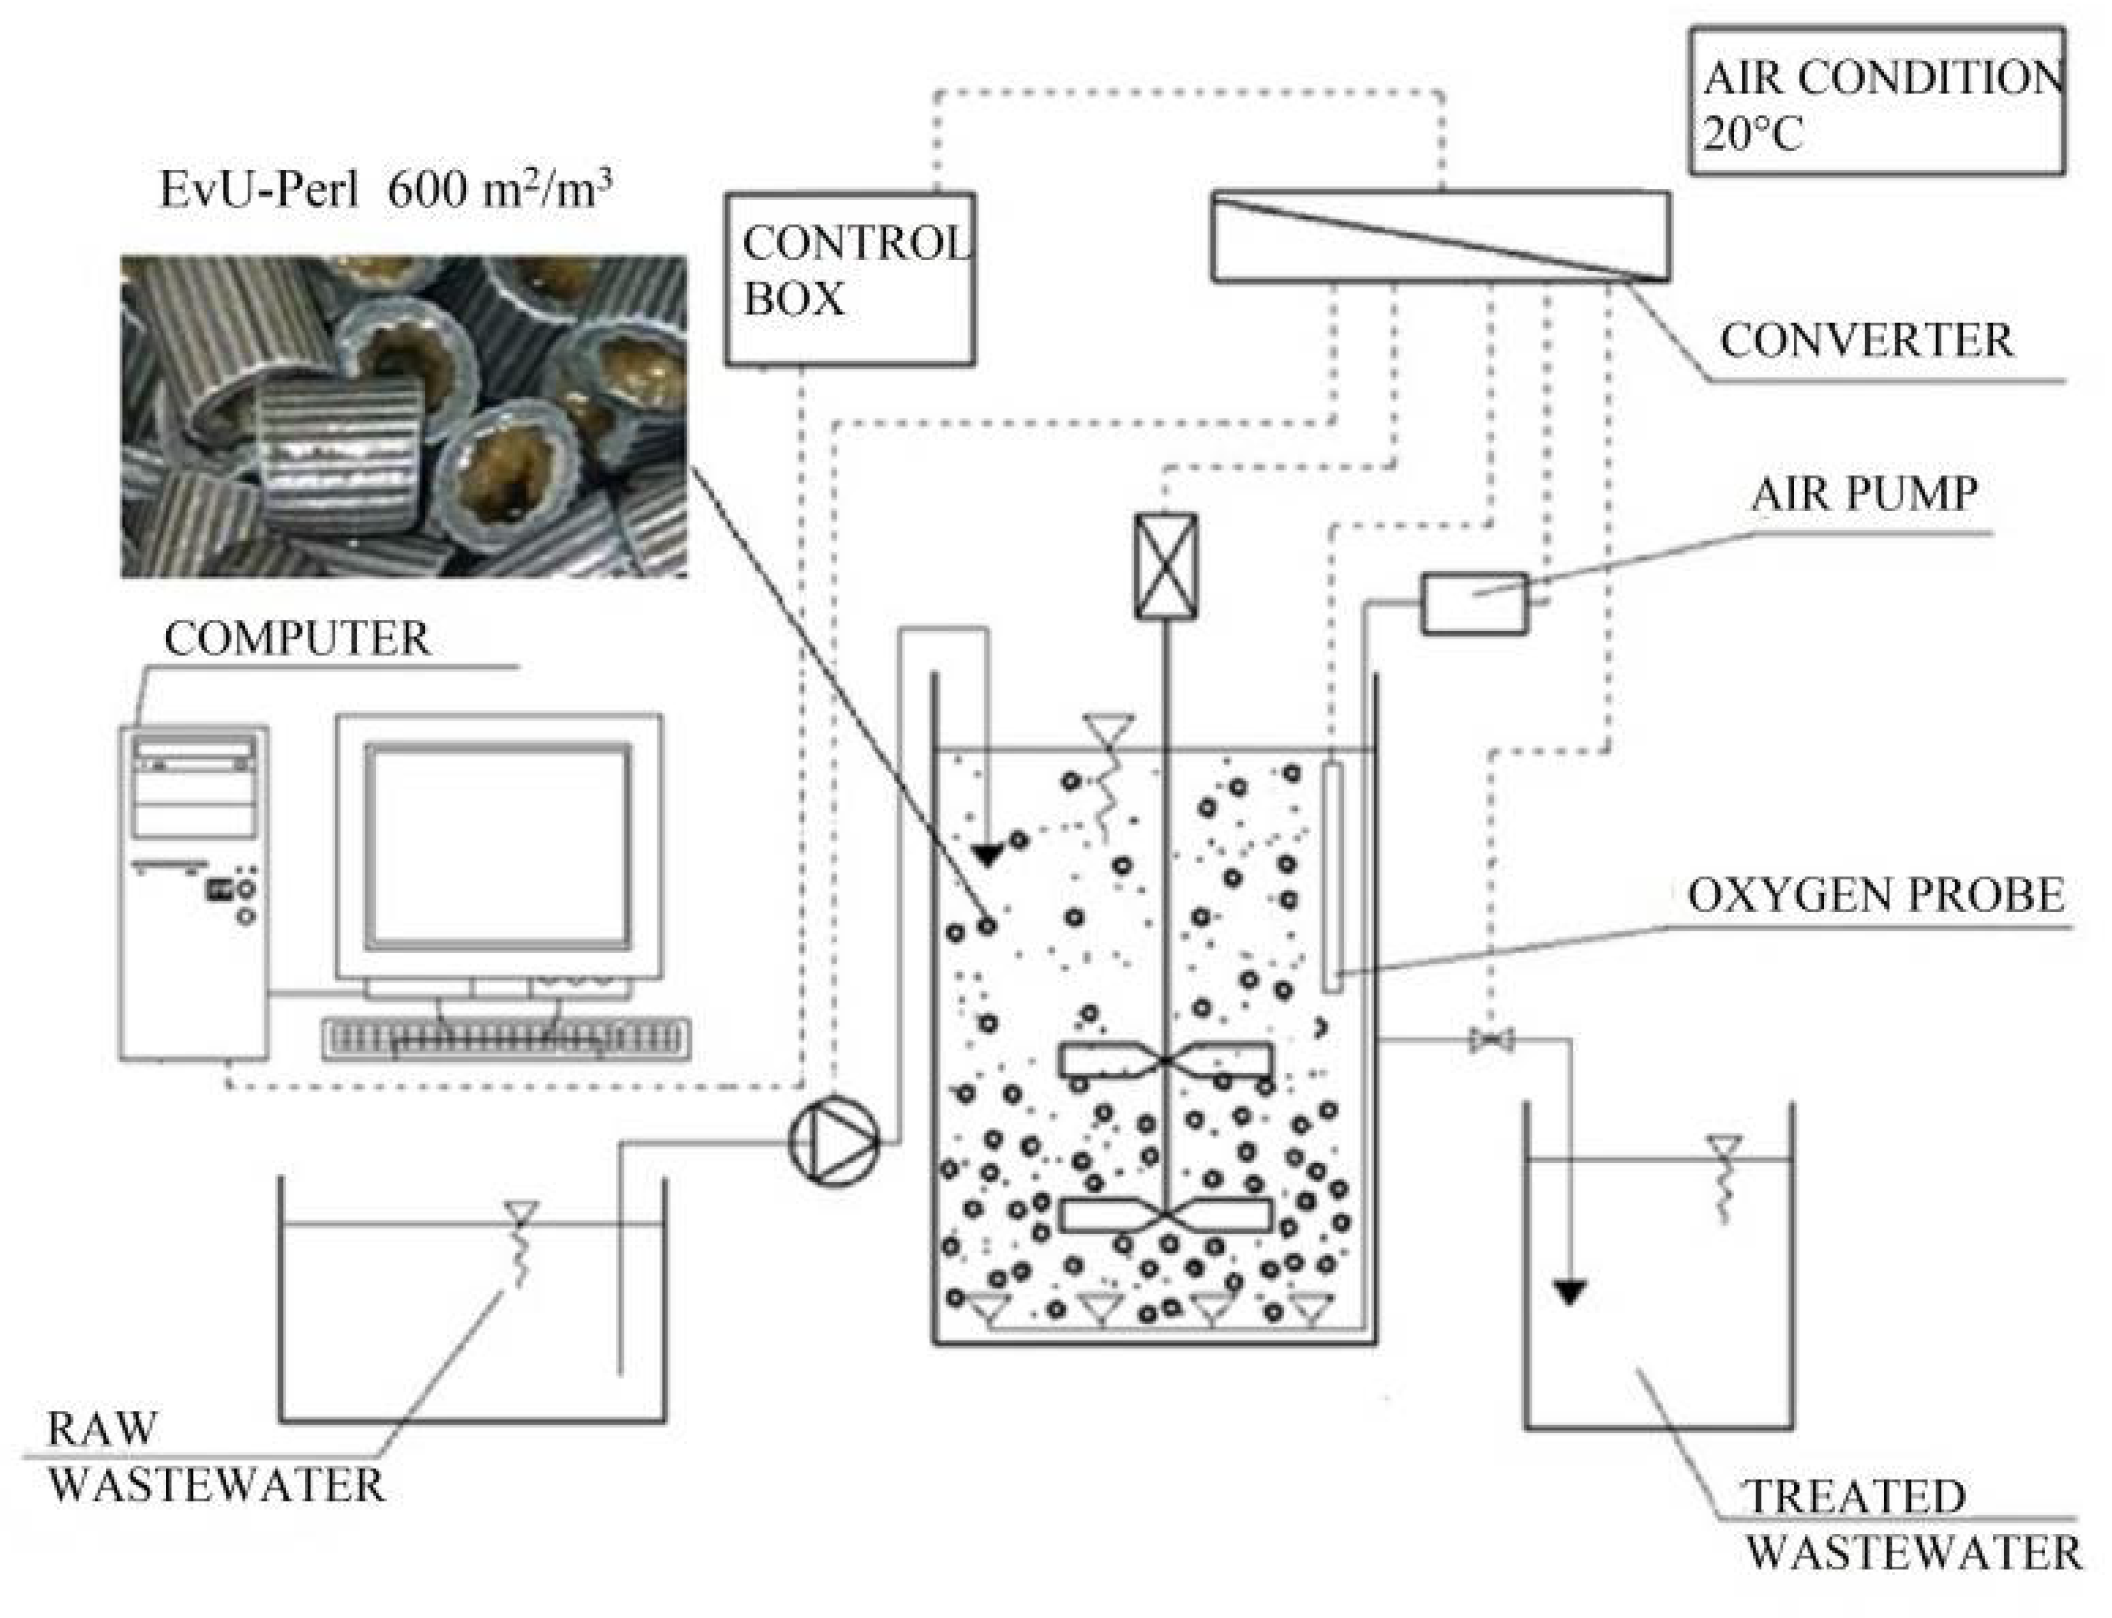
2.1.1. Reactor Description

A laboratory-scale IFAS-MBSBBR with an active volume of 28 L is shown in Figure 1. Raw wastewater was dosed into the reactor using an IsmatecEcoline peristaltic pump. Its content was mixed by means of a slow-speed blade mixer R-50D. At the bottom of the reactor, an air distribution system was installed in the form of an aquarium filter. Air was introduced to the system by air pumps. The automatic control system (DreamSpark Premium software based on the SCADA system) was responsible for the maintenance of the assumed level of DO in aerobic phases of the cycle, as well as for conducting the remaining technological operations through the activation of the pump dosing raw wastewater as well as the mixer and decanting valve. The control system cooperated with the optical oxygen probe OXY-MAX COS 61Dc connected to a converter Liguiline CM442. The temperature in the reactor was maintained at a level of 20 °C owing to a system of external air conditioning. As a carrier of biofilm, EvU-Perl moving bed was applied, with an active surface of 600 m2/m3.

2.1.2. Synthetic Wastewater

The IFAS-MBSBBR was supplied with synthetic wastewater simulating municipal wastewater. The wastewater was prepared based on dechlorinated tap water and a mixture of: peptone 135 mg/L; starch 45 mg/L; glucose 45 mg/L; glycerine 0.0495 mL/L; ammonium acetate 225 mg/L; NaHCO₃ 125 mg/L; Na2HPO4 15 mg/L; KH2PO4 4.5 mg/L. The characteristics of the influent were as follows: COD 518.76 ± 9.02 mg O2/L; TN 63.96 ± 0,83 mg N/L; N-NH4+ 39.91 ± 1.00 mg N-NH4+/L; P-PO43- 7.22 ± 0.68 mg P-PO43-/L; alkalinity 397.2 ± 32.6 mg CaCO3/L; pH 7.6–7.9. A new portion of wastewater was prepared every day except for weekends and holidays, when wastewater was prepared once every two days.

2.1.3. Operation Conditions

In the experiment lasting for 100 days, four research stages were designated (I–IV), differing in the applied aeration strategy (Table 1).
The study was launched on an operating IFAS-MBSBBR where biomass developing in the form of biofilm on moving carriers and in the form of activated sludge (1.885 g MLSS/L) provided for highly efficient nitrification (98.16%, concentration of ammonia nitrogen in treated wastewater 0.70 mg/L). The efficiency of removal of organic compounds, nitrogen, and phosphorus compounds, in that case, reached 97.17%, 80.79%, and 74.86%, respectively (COD values, TN and P concentration in treated wastewater reached 14.50 mg O2/L, 12.10 mg N/L, and 1.85 mg P/L). It was an important methodical assumption that common features for all research stages were as follows:
  • An 8 h operation cycle composed of the following phases: 50 min anoxic/anaerobic phase I with wastewater dosage (2/3 of the total amount of wastewater dosed to the reactor in a single cycle (VC)), 190 min aerobic phase I (with continuous or intermittent aeration), 30 min anoxic/anaerobic phase II with wastewater dosing (1/3 VC), 150 min aerobic phase II (with continuous or intermittent aeration), 50 min sedimentation, and 10 min decantation;
  • The volume (VC) and composition of raw wastewater dosed into the reactor, and therefore organic loading rate (L): VC = 10 L, the qualitative characteristics of the wastewater are described in point 2.1.2., organic compounds load and nitrogen load on the reactor was: LCOD = 555 ± 17 g COD/m3·d, LN = 68.9 ± 1.8 g N/m3·d;
  • Concentration of biomass developing in the form of activated sludge: it was assumed that the value of this parameter would be maintained at the level obtained after the development of the reactor, i.e., approximately 1.8 g MLSS/L;
  • The quantity of carriers in the reactor constituting 25% of the active volume of the reactor, i.e., 7 L;
  • Temperature in the reactor: 20 °C.
The experiment began with the stage at which the reactor operated with continuous aeration and DO at a level of 3.0 mg O2/L (Stage I). At subsequent stages, intermittent aeration was applied, with the introduction of changes: (I) in R values through the reduction in the duration of aerobic sub-phases (the duration of non-aerated sub-phases was constant and reached 10 min), and (II) in DO values in aerobic sub-phases. Detailed characteristics of the aeration strategies applied at subsequent research stages are presented in Table 1. Throughout the experiment, analysis of raw and treated wastewater was performed twice a week in the following scope: COD, TN, N-NH4+, N-NO2, N-NO3, P-PO43−, alkalinity, pH, and determination of the concentration of activated sludge. The concentration of ammonia nitrogen in the effluent from the reactor was controlled six times a week (Monday–Saturday).
In order to trace how technological changes introduced at subsequent stages of the experiment affected the suppression of the bacteria of the II nitrification phase, batch tests AUR and NitUR were conducted, as well as microbiological analyses. It was presumed that batch tests would be performed when for at least 10 subsequent days after changing the aeration strategy, the IFAS-MBSBBR shows comparable efficiency of the nitrification process (as concluded based on the concentration of ammonia nitrogen in treated wastewater). On the day of batch tests, samples of activated sludge and biofilm were collected for microbiological analyses.

2.2. Batch Experiments Testing the Suppression of Nitrite-Oxidizing Bacteria

Batch tests were used as a tool for tracking NOB suppression in IFAS-MBSBBR: ammonia utilization rate test—AUR and nitrite utilization rate test—NitUR. In sequencing reactors in which nitrification and denitrification occur in a single reactor, it is possible not to record the shortcut nitrification process that is associated with the appearance of nitrites in the effluent. It is due to the fact that the nitrite nitrogen produced in that process can be simultaneously used by denitrification bacteria. Therefore, lack of nitrites in the effluent does not point to the fact that no nitritation occurs in the system. It also provides no possibility to answer the question of how the applied aeration strategy affects NOB suppression.
Each test was performed separately for suspended biomass and biofilm. The tests were marked as follows: AUR-SB—ammonia utilization test for suspended biomass; AUR-B—ammonia utilization test for biofilm; NitUR-SB—nitrite utilization rate test for suspended biomass; NitUR-B—nitrite utilization test for biofilm.
Each test was performed with the following assumptions:
  • Oxygen concentration at a level of 7 mg O2/L.
The value of this parameter was assumed at a level that does not constitute a factor limiting the rate of ammonia nitrogen oxidation in the AUR test and the rate of nitrite nitrogen oxidation in the NitUR test. In the case of biofilm, one of the factors determining the course of aerobic processes is oxygen diffusion into the biofilm [21,22]. Limiting the effect of this factor in the treated medium requires the maintenance of high dissolved oxygen concentration. According to Rother and Cornel [23] and Pal et al. [24], the provision of highly efficient nitrification in pure moving-bed technology requires the maintenance of DO concentration at least at a level of 5 mg O2/L. Oxygen diffusion does not play such an important role in the case of activated sludge flocs, although in order to maintain identical conditions in test reactors, the same oxygen concentration as for tests with biofilm was also adopted for this form of biomass.
2.
Activated sludge concentration at a level of approximately 0.9 g MLSS/L (concerns tests AUR-SB and NitUR-SB), percent content of moving bed of 25% of the active volume of the test reactor, i.e., 2 L (concerns tests AUR-B and NitUR-B);
3.
Initial concentration of ammonia nitrogen in the AUR test of 15 mg N-NH4+/L and nitrite nitrogen in the NitUR test of 15 mg N-NO2/L;
4.
Temperature at a level of 20 °C.
Based on the results of AUR tests, the following was determined:
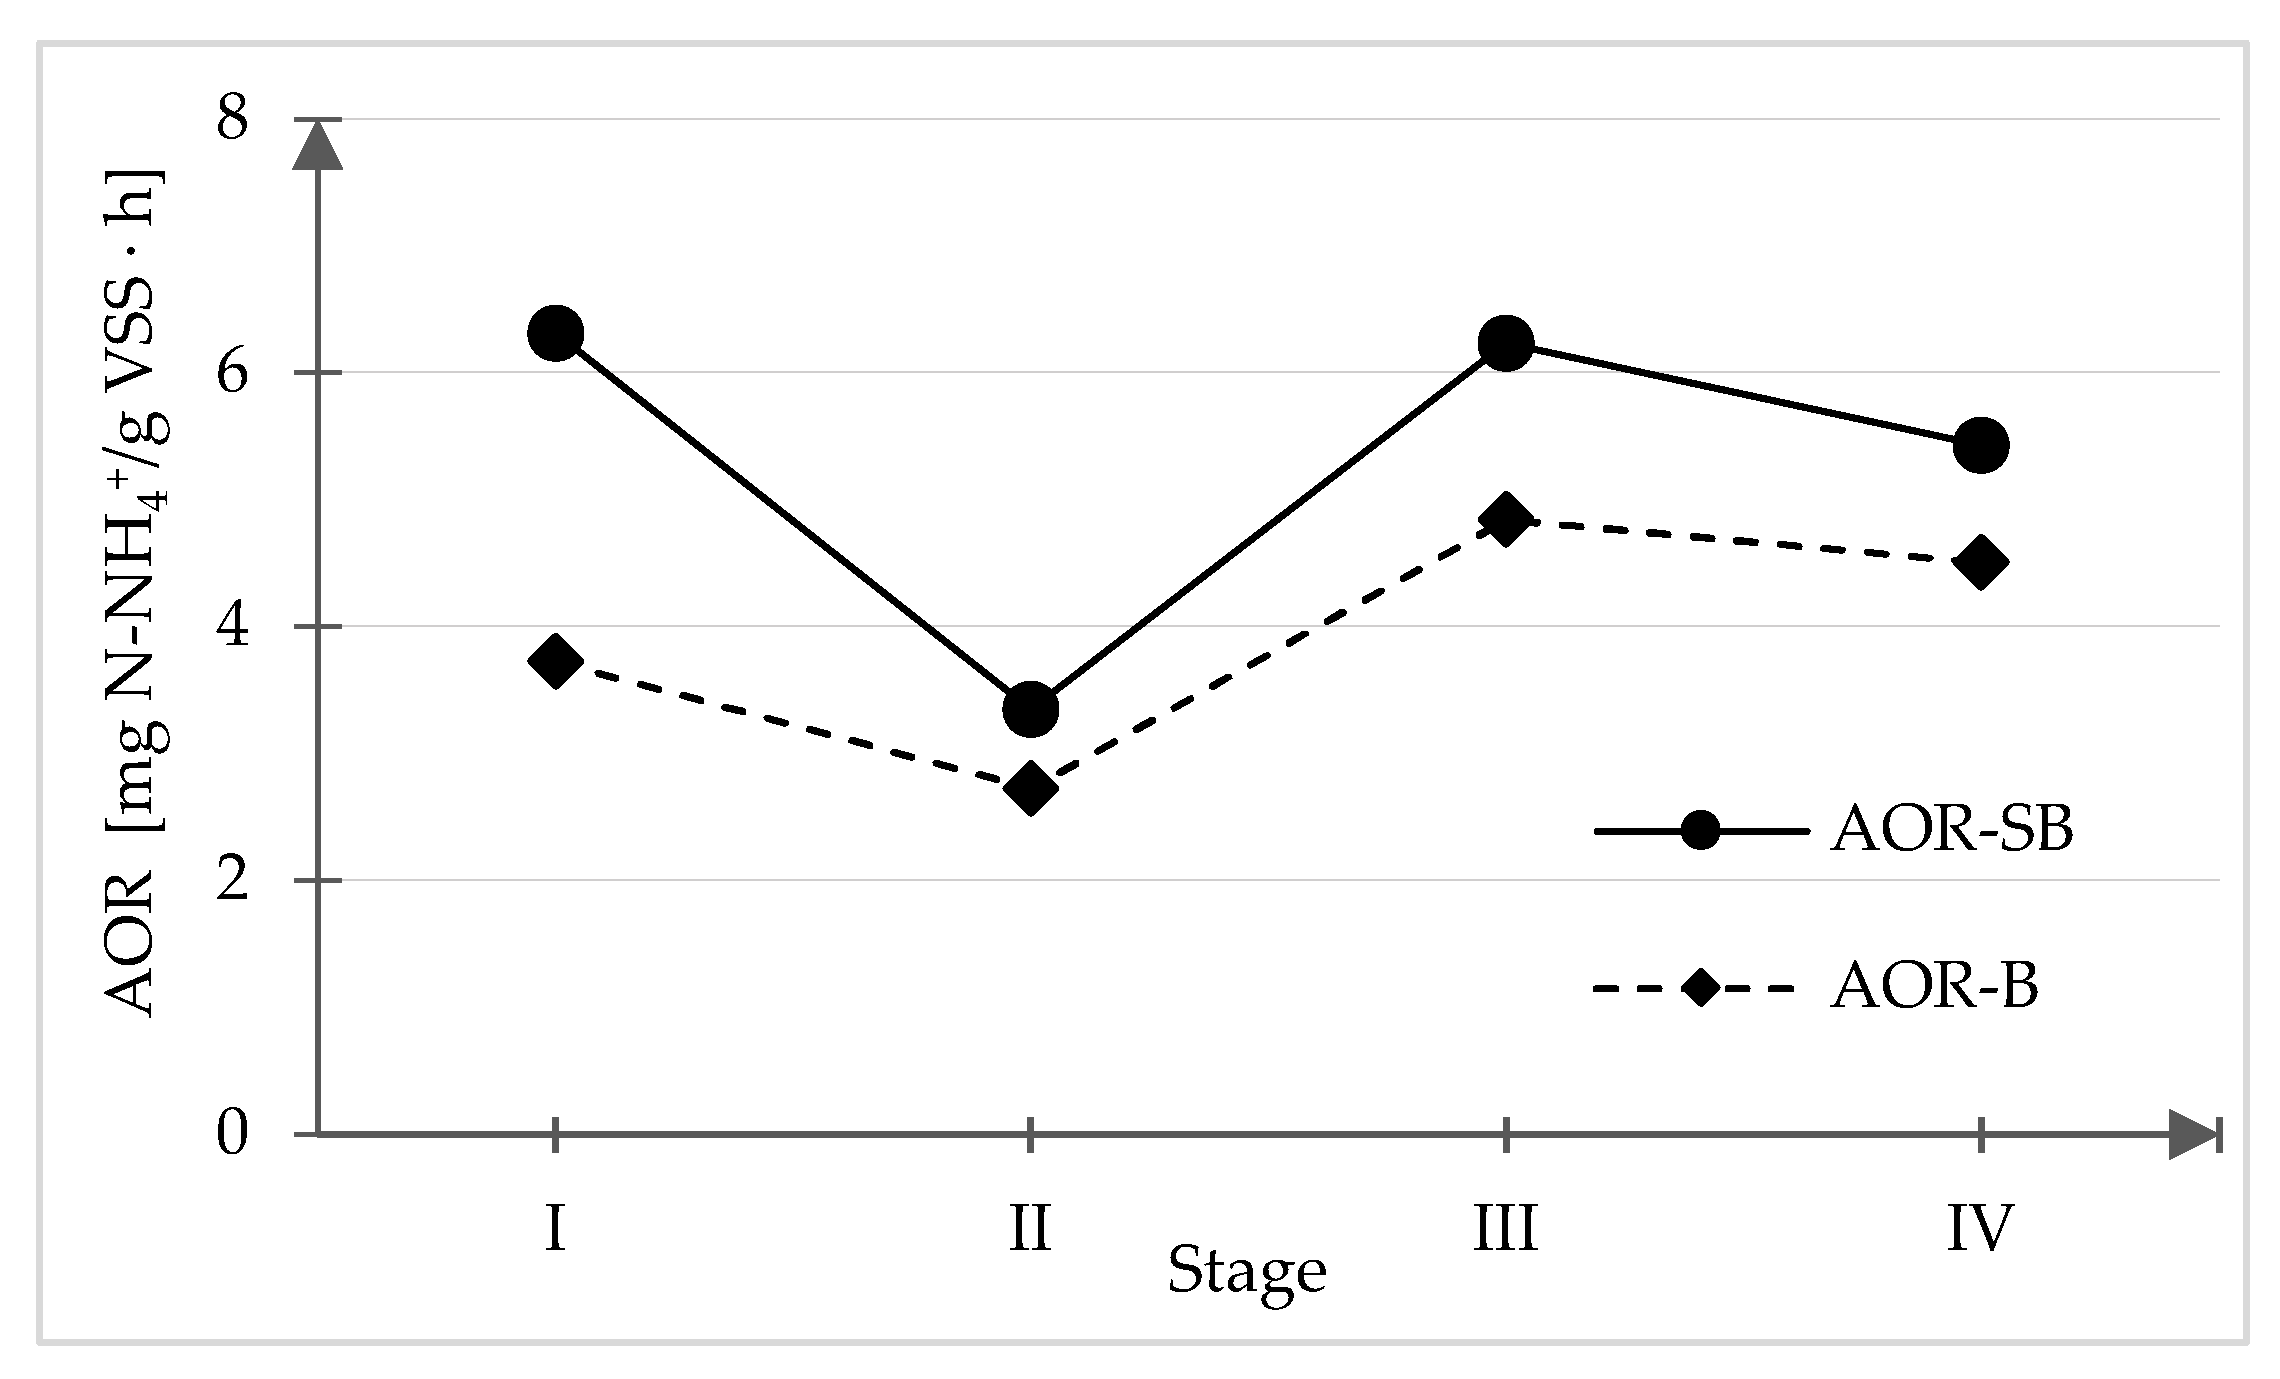
  • Ammonia nitrogen oxidation rate—AOR, mg N-NH4+/gVSS∙h;
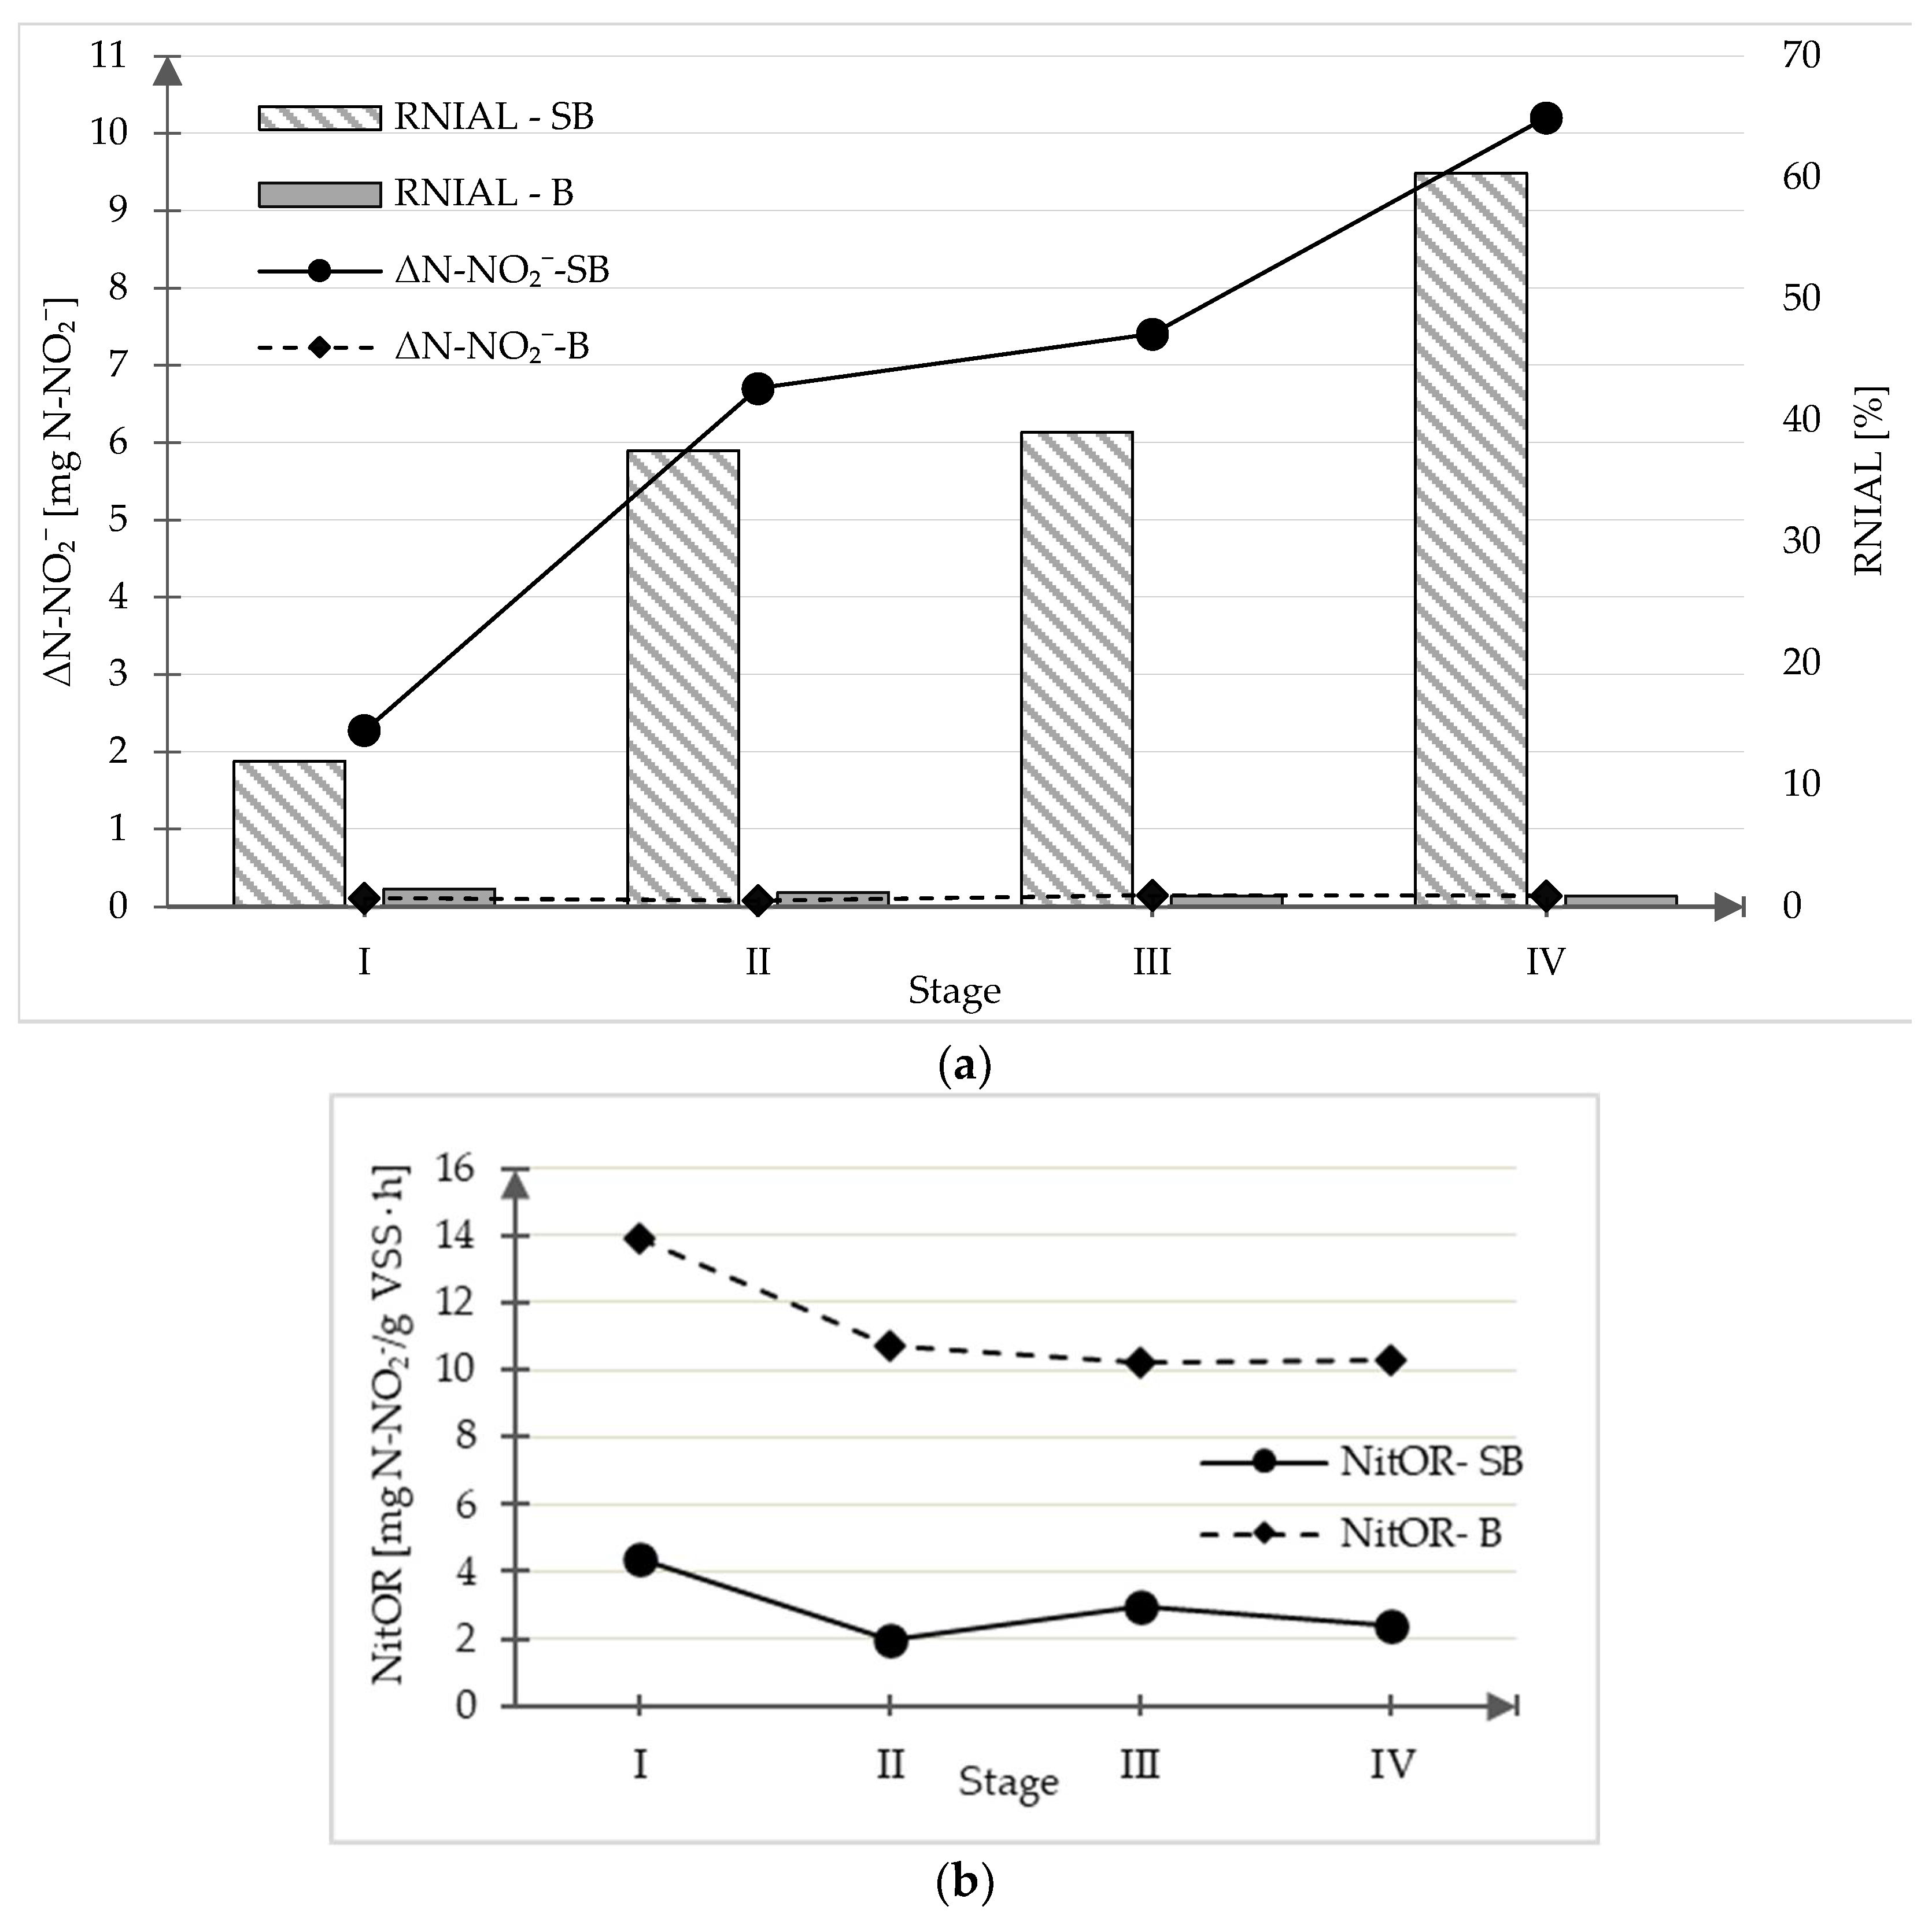
  • Accumulation of nitrite nitrogen—ΔN-NO2, mg N-NO2/L;
  • Ratio between nitrite increase and ammonia loss—RNIAL, %.
Based on the results of NitUR tests, the following was determined:
  • Nitrite nitrogen oxidation rate—NitOR, mg N-NO2/gVSS∙h.

2.2.1. Ammonia Utilization Batch Test (AUR)—Test Procedure

A single AUR test was conducted in the test reactor with an active volume of 2 L. Before the tests, biomass sampled from the IFAS-MBSBBR was washed in dechlorinated tap water to remove N-NH4+, N-NO2, N-NO3, and then placed in the test reactor. The reactor was filled to 1.9 L with dechlorinated tap water previously heated to 20 °C and saturated with oxygen to 7 mg O2/L. Then, the oxygen concentration was controlled by means of a digital meter Multi 3410 (WTW, Wroclaw, Poland). If it was lower than 7 mg O2/L, the content of the reactor was aerated until obtaining the assumed level of the indicator. The initial alkalinity value was assumed to be 200 mg CaCO3/L. After dosing of the appropriate amount of 5% KHCO3 solution, the pH was adjusted to 7.6–7.8 with 10% HCl. At the next stage, 4% NH4Cl solution was added to the reactor in quantity, providing an N-NH4+ concentration of 15 mg/L. During the test, the alkalinity value was monitored on an ongoing basis. When it was found to be lower than 50 mg CaCO3/L, KHCO3 solution was added to ensure the indicator value in the reactor was at a level of approximately 150 mg CaCO3/L.
Throughout the experiment, the reactor was aerated using an air pump and aquarium filter. The beaker content was mixed with a magnetic mixer. Samples with a volume of 30 mL were collected from the reactor every 30 min and immediately filtered through filters with a mesh of 0.45 μm. In the filtrate, the concentration of the following was determined: N-NH4+, N-NO2, N-NO3. The test lasted until the moment when ammonia concentration decreased to a value approximate to 0 mg N-NH4+/L or when the concentration of the indicator was maintained at a comparable level for the subsequent 60 min. In the case of the test conducted for suspended biomass, mixed liquor volatile suspended solids (MLVSS) concentrations were also determined. In the case of tests conducted with the application of carriers, the mass of the biofilm was determined (as volatile suspended solids).
The determination of the ammonia nitrogen oxidation rate involved the application of a straight line fragment of the function of the change in ammonia nitrogen concentration in time characterized by coefficient R2 ≥ 0.97. The rate was expressed in mg N-NH4+ per (gVSS∙h).

2.2.2. Nitrite Utilization Batch Test (NitUR)—Test Procedure

A single NitUR test was conducted analogically to the AUR test, except that a 5% solution of KNO2 was used instead of ammonium chloride in order to ensure initial N-NO2- concentration at a level of 15 mg/L. Another difference was the analytical scope. The test determined the concentration of N-NO2, N-NO3, and it was conducted until nitrite nitrogen concentration decreased to a level approximate to 0 mg/L or until the concentration of the indicator was maintained at a constant level for a subsequent 60 min.
The determination of the nitrite nitrogen oxidation rate involved the application of a straight line fragment of the function of change in concentration of nitrite nitrogen in time, characterized by coefficient R2 ≥ 0.97. The rate was expressed in mg N-NO2 per (gVSS∙h).

2.3. Microbiological Analysis

2.3.1. DNA Extraction

Biomass samples for microbiological tests were collected from sludge and biofilm at specified intervals. Until DNA isolation, the samples were stored at −25 °C. DNA was isolated from 200 ng of biomass (both sludge and biofilm) using the FastDNA™ SPIN Kit for Soil (MP Biomedicals, Solon, OH, USA). The isolation procedure was performed according to the manufacturer’s instructions. A Qubit fluorometer (Invitrogen, Carlsbad, CA, USA) was used to measure the amount of isolated DNA. The obtained DNA was stored at −18 °C until further analysis.

2.3.2. Quantitative Polymerase Chain Reaction

AOB was detected using PCR primers corresponding to 16 S rRNA: CTO189f (5′GGAGmAAAGyAGGGGATCG3′) and CTO-654R (CTAGCyTTGTAGTTTCAAACGC) designed by Kowalchuk et al. [25]. NOB were analyzed using primers NSR1113f (5′ kowaCCTGCTTTCAGTTGCTACCG 3′) and NSR1264r (5′ GTTTGCAGCGCTTTGTACCG 3′) in accordance with Dionisi et al. [26]. For detection of Comammox Nitrospira clade A and B in the tested samples, two sets of primers were used: comaA-244F and coma-659 R and comaB-244F and comaB-659R [27]. These primers targeted the ammonia monooxygenase gene (amoA).
The PCR reaction was performed in an ABI 7500 real-time PCR thermocycler (Applied Biosystems, Carlsbad, CA, USA), in MicroAmp TM Optical 96-well reaction plates, using Mix SYBR® A RT PCR reagents (A&A Biotechnology, Gdynia, Poland). Each sample was analyzed in triplicate. The obtained data were analyzed using the relative quantification method. The biomass used for the development process was used as the reference sample. Relative quantification was calculated based on the formula RQ = 2−ΔCt, where ΔCt is the difference between the Ct of the marker gene in the test sample and the same gene in the biomass at the beginning of the process [28].

2.4. Analytical Methods

Concentrations of COD, N-NH4+, N-NO2, N-NO3, TN, P-PO43− were analyzed spectrometrically by means of cuvette tests (Hach Lange GmbH) and DR 3900 spectrophotometer (Hach Lange GmbH, Berlin, Germany) according to APHA Standard Methods [29]. Mixed liquor suspended solids (MLSS), and mixed liquor volatile suspended solids (MLVSS) were determined using gravimetric methods in accordance with the Polish standard PN-EN 872:2007. Total volatile solids in the biofilm were also measured in accordance with the Polish standard by calculation of weight loss. The biofilm was mechanically removed from the carriers. All chemical analyses were performed in duplicates.

3. Results

3.1. Reactor Performance

Table 2 presents concentration values of pollutants in influent and effluent from the IFAS-MBSBBR and the mean efficiency of removal of organic compounds, nitrification, and denitrification determined for particular stages of the experiment.
For each of the stages, comparable efficiency of the organic compounds removal (ECOD) and the nitrification process (EN) was recorded in the IFAS-MBSBBR. The mean value of ECOD and EN determined based on results obtained at all stages reached 97.21% ± 0.47% and 98.61% ± 0.93%, and COD and N-NH4+ concentration in treated wastewater 14.49 ± 2.46 mg O2/L and 0.56 ± 0.37 mg N-NH4+/L, respectively.
At stages I and II of the experiment, mean values of the efficiency of the denitrification process (ED) were maintained at a comparable level, and TN concentration in the effluent from the IFAS-MBSBBR reached 13.25 ± 1.26 mg N/L and 13.48 ± 0.86 mg N/L, respectively. A certain increase in the value of ED was recorded for stage III when it increased from 78.81% ± 1.37% (stage II) to 82.79% ± 3.02%. The contributing factor could have been a decrease in oxygen concentration from 3 to 2 mg O2/L, resulting in conditions more beneficial for the course of the process of simultaneous denitrification in deeper layers of the biofilm and/or activated sludge flocs to which dissolved oxygen did not diffuse [31]. The mean value of ED at the last stage of the experiment was approximate to that recorded at stage III and reached 82.30% ± 2.27%. No accumulation of nitrite nitrogen was observed in the effluent in the study, which is explained in Section 2.2, in SBR cannot be equated with the lack of NOB suppression.

3.2. Analysis of the Suppression of the Nitrite Nitrogen Oxidation Process Based on the Results of Batch Experiments

3.2.1. Ammonia Oxidation Rate for Suspended Biomass and Biofilm

Figure 2 presents ammonia nitrogen oxidation rates for activated sludge and biofilm determined in batch tests (results of particular tests are presented in Supplementary Material). Because all tests were conducted in the same conditions (described in detail in Section 2.2), it was assumed that the change in the ammonia nitrogen oxidation rate would indirectly indicate that the technological conditions of operation of the IFAS-MBSBBR caused changes in the population of microorganisms able to oxidize ammonia nitrogen.
The analysis of the presented data shows that microorganisms able to oxygenate ammonia nitrogen inhabiting both forms of biomass developing in the IFAS-MBSBBR responded to changes in the aeration strategy introduced at subsequent stages of the experiment in a similar way.
The comparison of AOR values determined for stages I and II shows that the change in aeration strategy from continuous to intermittent (R = 1/4), both in the case of suspended biomass and biofilm, caused a decrease in the AOR value by 47% (from 6.310 mg N-NH4+/gVSS∙h to 3.347 mg N-NH4+/gVSS∙h) and 27% (from 3.727 mg N-NH4+/gVSS∙h to 2.725 mg N-NH4+/gVSS∙h, respectively). A larger percent decrease in the AOR value in the case of suspended biomass form suggests that the microorganisms inhabiting activated sludge flocs were more sensitive to changes introduced in the aeration strategy applied in the operation of the IFAS-MBSBBR.
Results of AUR tests conducted at the end of stage III, involving a decrease in DO value in the IFAS-MBSBBR (from 3 to 2 mg O2/L), pointed to an increase in the AOR value for both forms of biomass. The value of the analyzed indicator recorded at stage III for suspended biomass was 6.231 mg N-NH4+/gVSS∙h and was approximate to that determined for stages I with continuous aeration. This suggests that AOB bacteria adjusted to the specific conditions of intermittent aeration, and through the selection of particular metabolic pathways, they returned to their previous activity. The value obtained in that case for biofilm (4.842 mg N-NH4+/gVSS∙h) was 78% higher than that recorded at stage II and 30% higher than the value obtained at stage I.
The reduction in the duration of aerobic sub-phases to 30 min at the last of the research stages (IV) had no substantial effect on changes in AOR values observed both in the case of suspended biomass and biofilm in comparison to those recorded for the previous stage.

3.2.2. N-NO2 Accumulation Based on Ammonia Utilization Rate Test Results

AUR tests are primarily used for the assessment of the ammonia nitrogen oxidation rate, although through tracking changes in the concentration of ammonia nitrogen, nitrites, and nitrates, their results can also be used to assess NOB suppression. The experiment assumed that if NOB suppression occurs in the IFAS-MBSBBR, an increase in accumulation of nitrites (ΔN-NO2) and an increase in RNIAL would be recorded in AUR tests.
In the case of biomass in the form of biofilm, no accumulation of N-NO2 was recorded in any of the tests. The concentration of this indicator during the tests oscillated in a range of 0.08–0.15 mg N-NTaO2/L (Figure 3a).
Accumulation of nitrites was, on the other hand, observed in tests conducted for activated sludge. After a change in the aeration strategy from continuous to intermittent with R = 1/4 introduced at stage II of the experiment, the recorded accumulation of nitrite nitrogen increased by 194% in comparison with the value obtained for stage I reaching 2.28 mg N-NO2/L. The consequence was more than a three-fold increase in the RNIAL value from 11.9% (stage I) to 37.5% (stage II). Another change involving a decrease in oxygen concentration from 3 to 2 mg O2/L only resulted in an inconsiderable increase in ΔN-NO2 value (increase by 10% in comparison to stage II). RNIAL values for stages II and III were at a comparable level. The reduction in the duration of aeration sub-phases at the last stage of the experiment by 25% in comparison to research stage III caused, such as after the introduction of intermittent aeration at stage II, an increase in ΔN-NO2 value and RNIAL index. The nitrite accumulation value recorded in the AUR test conducted at the end of research stage IV was 10.20 mg N-NO2/L and was 52% and 38% higher than the values recorded for stage II (6.70 mg N-NO2/L) and III (7.40 mg N-NO2/L), respectively. RNIAL reached a level of 60.4%, constituting a value 1.5 times and 1.6 times higher than those determined for stage III (RNIAL = 39.1%) and stage II (RNIAL = 37.5%), respectively. In comparison to stage I, the value was as many as five times higher.

3.2.3. Nitrite Nitrogen Oxidation Rate Based on Nitrite Utilization Rate Test Results

According to reports presented in the literature, since 2015, oxidation of ammonia nitrogen can be carried out directly to nitrates by Comammox bacteria [32,33]. Therefore, conducting only AUR tests and tracking ΔN-NO2 and the RNIAL index may be insufficient to assess how the applied aeration strategy affected NOB suppression. Due to this, parallel conducting of the nitrite utilization rate test—NitUR was proposed in the study, and the nitrite nitrogen oxidation rates (NitOR) determined based on the test are presented in Figure 3b. Because each NitUR test was conducted in the same conditions, it was assumed that the occurrence of NOB suppression in the IFAS-MBSBBR would result in a decrease in NitOR values.
The analysis of NitOR values obtained at subsequent research stages for biofilm shows that their decrease occurred only after the change of aeration strategy from continuous to intermittent. The value of the analyzed indicator decreased by 23% from 13.906 mg N-NO2/gVSS∙h (stage I) to 10.687 mg N-NO2/gVSS∙h (stage II), and at the following stages, it was maintained at a comparable level (10.242 mg N-NO2/gVSS∙h—stage III, 10.306 mg N-NO2/gVSS∙h—stage IV).
In the case of activated sludge, NitOR values decreased each time after an increase in the R index. When R increased from 0 (stage I) to 1/4 (stage II), they decreased by 55%, and when R increased from 1/4 (stage III) to 1/3 (stage IV), they decreased by 19%. Decreases in the NitOR value were also expected after a decrease in oxygen concentration in the IFAS-MBSBBR. Contrary to expectations, an almost 51% increase in the value of the index was recorded (from 1.976 mg N-NO2/gVSS∙h for stage II to 2.977 mg N-NO2/gVSS∙h for stage III).

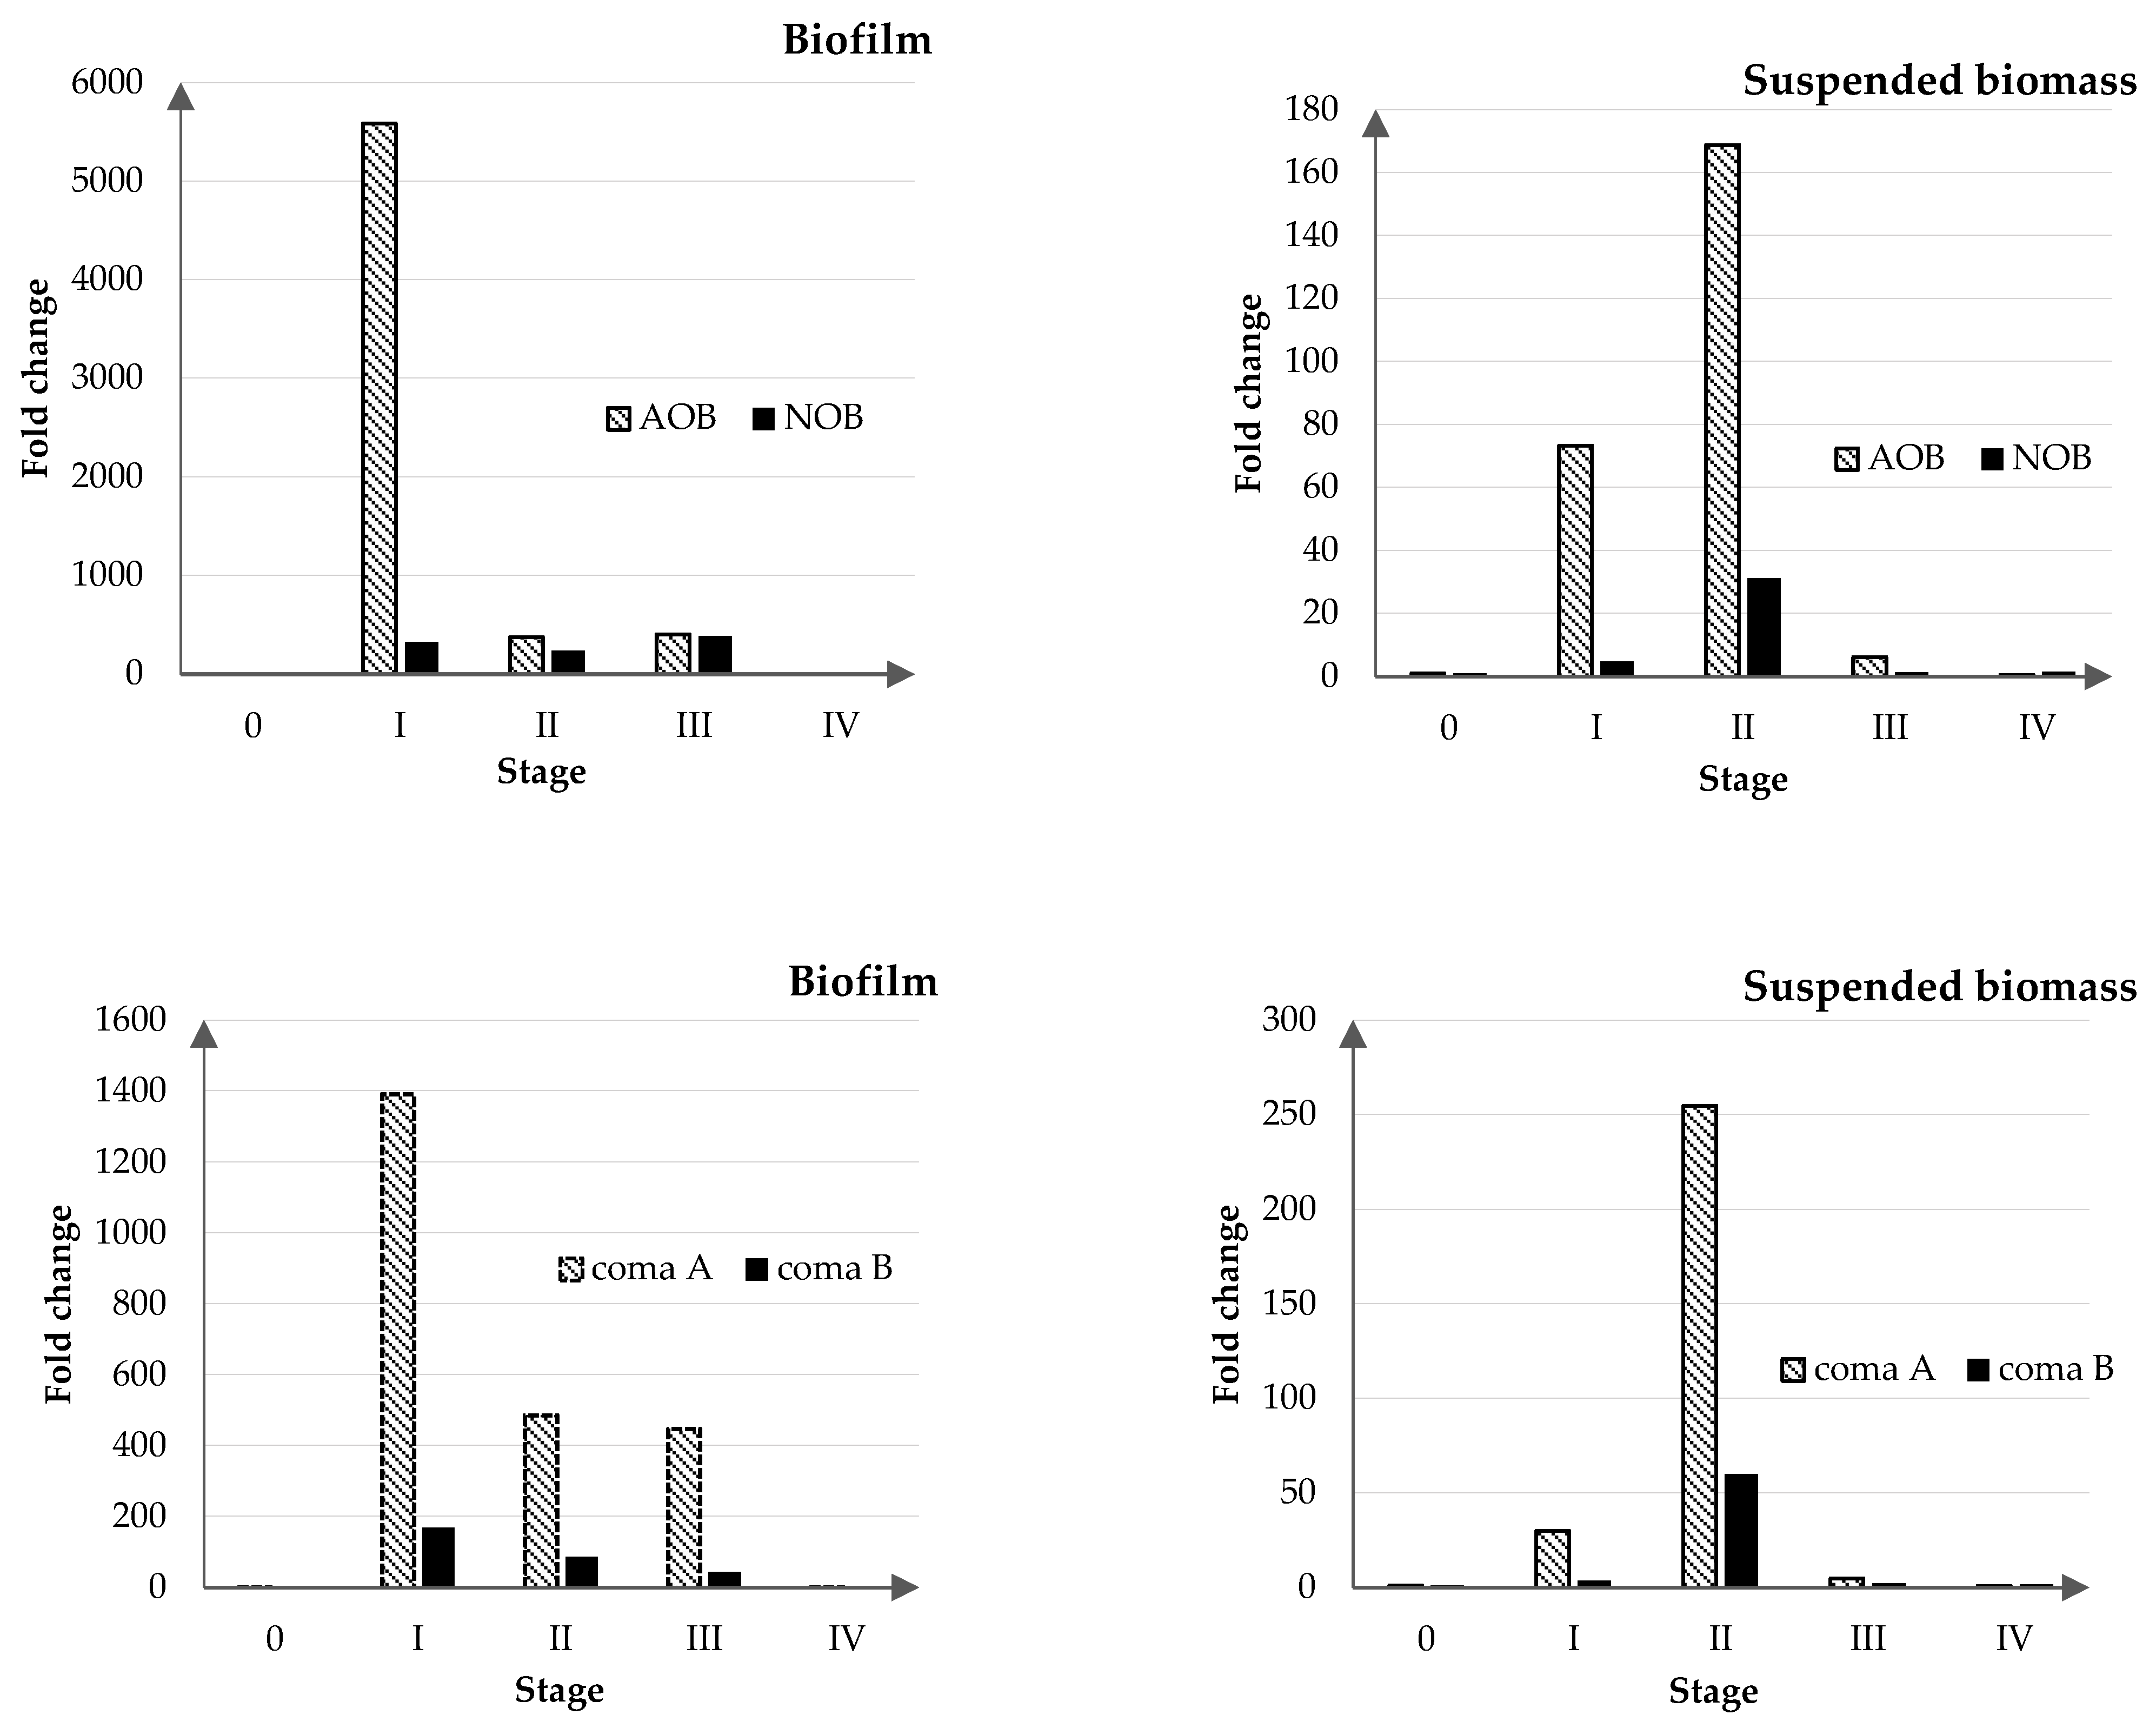
3.3. Changes in AOB, NOB, and Comammox Bacteria Abundance

Quantitative PCR analysis showed the presence of ammonia-oxidizing bacteria (AOB) and nitrite-oxidizing bacteria (NOB) in both forms of biomass. In the biofilm, a significant increase in AOB was observed at the first stage (fold change of approximately 5500). At the second and third stages, the AOB abundance was at a similar level, although lower than at the first stage (fold change of approximately 400). The abundance of NOB was at a similar level at the first, second, and third stages (fold change in a range of 237–386). At the fourth stage, the abundance of both AOB and NOB decreased significantly. In the activated sludge, the abundance of AOB was the highest at the first (fold change 73) and second stage (fold change 168). After that, at the third and fourth stages, their abundance significantly decreased.
Comammox bacteria were analyzed with the application of the qPCR approach by means of two PCR primer pairs specific for different Nitrospira Comammox lineages [27]. In the biofilm, a significant increase in bacteria belonging to both lineages was observed at the first stage (Figure 4). The fold changes for comA and comB were almost 1400 and 200, respectively. After that, at the second and third stages, both groups of Comammox bacteria decreased. At the end of the process, at the fourth stage, their abundance was even lower than at the beginning of the process. Similarly, in activated sludge, the highest abundance was determined for comA. The abundance of bacteria belonging to this group was the highest at the second stage (fold change 254), followed by the first stage (fold change 30). At the third and fourth stages, their abundance significantly decreased. The comaB group showed the highest abundance at the second stage (fold change 60). At the remaining stages, the fold change was lower than 3.5.

4. Discussion

The primary objective of the study was the comparison of the effect of the aeration strategy (continuous and intermittent aeration with different R and DO concentrations) on NOB suppression in activated sludge and biofilm in the IFAS-MBSBBR with nitrification/denitrification. The analysis of literature reports suggests that NOB suppression is usually identified based on the appearance of nitrites in the effluent from the biological reactor [1,16,17,18]. In the case of sequencing reactors where nitrification and denitrification occur in a single reactor, even in the conditions of the complete elimination of bacteria-oxidizing nitrites to nitrates or complete suppression of their activity, substantial accumulation of nitrites in the effluent from the reactor may not be recorded. Nitrite nitrogen developed in the course of shortcut nitrification can be simultaneously used by denitrification bacteria that reduce it to gas nitrogen. Therefore, for the purpose of tracking NOB suppression, parallel batch tests were conducted after each of the four research stages (differing in the aeration strategy) for both forms of biomass. NitUR and AUR tests were conducted, providing the basis for the determination of the nitrite nitrogen oxidation rate (NitOR) and volume of accumulation of nitrite nitrogen (ΔN-NO2), as well as the ratio between nitrite increase and ammonia loss (RNIAL). Because all tests were conducted in the same conditions (described in detail in Section 2.2), it was assumed that a change in values of the aforementioned indicators would indirectly indicate that the aeration strategy applied at a given research stage in the IFAS-MBSBBR affected NOB suppression. Based on the results of AUR tests, ammonia nitrogen oxidation rates (AOR) were also determined. Moreover, microbiological analyses were conducted to determine the effect of the aeration strategy on the occurrence of bacteria responsible for nitrogen transformations. The research employed quantitative PCR analysis with primer pairs detecting the presence of microorganisms responsible for the oxidation of nitrites. In order to perform a complex assessment of changes occurring in activated sludge and biofilm, the abundance of AOB was also determined using primers corresponding to 16S rRNA (CTO189f and CTO-654R) and Comammox Nitrospira clade A and B (using primers comaA-244F and coma-659R and comaB-244F and comaB-659R).
The obtained results showed that the primary factor causing NOB suppression both in biofilm and activated sludge was an increase in the value of the R index, i.e., the transition from continuous (R = 0) to intermittent aeration with durations of aeration and non-aeration sub-phases of 40 min and 10 min, respectively (R = 1/4), and a reduction in the duration of aeration sub-phases from 40 to 30 min (change in R from 1/4 to 1/3). After changing continuous (R = 0, stage I) to intermittent aeration (R = 1/4, stage II), suppression of nitrite-oxidizing bacteria was observed for each form of biomass. In the case of biofilm, it was suggested by a decrease in the abundance of NOB bacteria and a lower nitrite nitrogen oxidation rate evidenced in batch tests. In activated sludge, NOB suppression was observed as a decrease in the value of NitOR-SB and an increase in the accumulation of nitrites, and therefore an increase in the value of RNIAL recorded in the batch tests (NitUR and AUR, respectively). The reduction in the duration of aeration sub-phases from 40 to 30 min (changes introduced between stage III and IV) caused a decrease in the abundance of NOB developing in the biofilm. Results of NitUR tests conducted for activated sludge showed that the nitrite nitrogen oxidation rate decreased during that time, and an AUR test showed a considerable increase in the accumulation of nitrite nitrogen and an increase in the value of RNIAL. Because microbiological analyses between stage I and II and between stage III and IV showed no decrease in the abundance of NOB bacteria in activated sludge flocs, it is highly probable that the suppression observed in the batch tests resulted from a change in the activity of microorganisms responsible for nitrites oxidation. It also cannot be excluded that microorganisms able to oxidize nitrite nitrogen that are not detected with the applied starters due to their high phylogenetic diversity occurred at the time in the IFAS-MBSBBR [34]. Yang and Yang [20], conducting research in a moving-bed membrane bioreactor with simultaneous nitrification and denitrification, also evidenced an increase in NOB suppression in biofilm and suspended biomass after a change of the aeration strategy from continuous to intermittent (2 min with aeration: 2 min without aeration; R = 1). These observations were equated by the authors with the suppression of NOB activity and not with their complete flushing from the reactor. The suppression was concluded based on an increase in the nitrite accumulation rate (NAR) in the effluent from the reactor, as well as a comparison of results of batch tests aimed at the assessment of the nitrification characteristics under the intermittently aerated mode and results of microbiological analyses. The effect of intermittent aeration on NOB suppression was also evidenced by Katsogiannis et al. [14] conducting research in an SBR reactor with N/D with activated sludge. The phenomenon was attributed to the suppression of the activity of bacteria-oxidizing nitrites to nitrates due to a short duration of the aeration phase—the durations of aeration and non-aeration phases were 20 min and 60 min (R = 3), respectively. NOB suppression was concluded based on N-NO2 accumulation at the end of each aeration phase during the observation of the entire operation cycle of the reactor.
Considering literature reports [1,10,12,16,17], NOB suppression was also expected after the reduction in oxygen concentration in aeration phases from 3 to 2 mg O2/L (i.e., between stages II and III). After the introduction of such changes in the operation of the IFAS-MBSBBR, however, no changes in the frequency of occurrence of NOB occurred, nor a reduction in the nitrites to nitrates oxidation rate. In the case of activated sludge, qPCR results provided the basis for recording a decrease in the frequency of occurrence of NOB, although it was not accompanied by a decrease in the rate of oxidation of nitrite nitrogen in the NitUR-SB test or a considerable increase in the accumulation of nitrites in the AUR-SB test. Lack of NOB suppression after a decrease in oxygen concentration was also observed by Liu and Wang [35], Bao et al. [9], and Cao et al. [7] according to the first of the aforementioned research groups, as a result of a long-term operation of the nitrification reactor at DO at a level of 0.3 and 0.16 mg O2/L, nitrite-oxidizing bacteria become a better oxygen competitor than AOB, resulting in complete nitrification. Cao et al. [7] recorded an increase in the abundance and activity of NOB in activated sludge, accompanied by a change in the dominant genus from Nitrobacter to Nitrospira, as a result of a decrease in DO from 1.7 to 1.0 mg O2/L. Bao et al. [9], conducting research in a nitrification reactor, for DO at a level of 0.3 ± 0.14 mg O2/L, observed complete nitrification, and accumulation of NO2 was only obtained after an increase in the DO level to 1.8 ± 0.32 mg O2/L (the system operated at R = 1, and t1 and t2 reached 10 min).
During AUR tests for the separated forms of biomass coming from the same reactor, it was observed that the accumulation of nitrite nitrogen, constituting one of the indicators of NOB suppression, occurred only for activated sludge. In the case of biofilm, despite a decrease in the frequency of occurrence of NOB bacteria and/or nitrite nitrogen oxidation rate (NitUR tests), accumulation of N-NO2 never occurred in AUR tests. In order to explain that phenomenon, ratios between the nitrite nitrogen oxidation rates and the ammonia nitrogen oxidation rates were determined ( N i t O R A O R ) for both forms of biomass. They were 0.44–0.69 for activated sludge and 2.12–3.73 for biofilm, which in the first case pointed to the much higher activity of microorganisms-oxidizing ammonia nitrogen, and in the second case, to the much higher activity of microorganisms-oxidizing nitrites. This suggests that in the case of biofilm, nitrites produced by AOB were immediately used by NOB, and therefore no N-NO2 accumulation was observed in AUR tests. It is particularly supported by the consideration that in the case of biofilm, an important role in the course of biochemical processes is played by the diffusion of substrates/products within the biofilm [36].
Until recently, in the case of suppression of the nitrification process, at its first stage, emphasis was put on the suppression of bacteria able to oxidize nitrite nitrogen to nitrates with concurrent maximization of the activity of AOB bacteria. After the discovery of Comammox bacteria able to oxidize ammonia nitrogen directly to nitrates [7,32,33,37], this approach had to be verified. The bacteria compete for ammonia nitrogen with bacteria conducting nitritation, resulting in a decrease in the quantity of produced nitrites. Based on the obtained results, it was found that the frequency of occurrence of Comammox bacteria was largely determined by the change of aeration strategy from continuous to intermittent, whereas it was different for both studied forms of biomass. The biofilm showed a considerable decrease in the abundance of both clades, whereas its substantial increase occurred in activated sludge. A further decrease in the frequency of occurrence of Comammox bacteria in the biofilm was recorded with another increase in the R-value. The observations lead to the conclusion that in the studied system, a reduction in the duration of aeration sub-phases contributed to a decrease in the abundance of Comammox bacteria. It was a relatively surprising observation, considering the fact that the introduction of intermittent aeration results in prolongation of time in which biomass is subject to lower DO concentrations, and such conditions are considered favorable for the development of Comammox bacteria [37,38]. Roots et al. [37] observed that Comammox bacteria constituted the majority of ammonia-oxidizing microorganisms in the intermittently aerated SBR reactor operating at DO concentrations in aeration phases at a level of 0.2–1 mg O2/L. Liu et al. [39], conducting research in two SBR reactors differing in the applied aeration strategy, determined a considerably higher abundance of Comammox bacteria in the reactor operating with intermittent aeration (SBR1) with DO below 0.40 mg/L (averaged 0.14 mg/L) than in that with continuous aeration (SBR2) (range 0.29–0.65 mg/L, average 0.40 mg/L). The authors suggested that lower DO concentration in intermittently aerated SBR1 may favor the development of Comammox bacteria because, in their genomes, they had the reductive tricarboxylic acid cycle and cytochrome bd-like oxidases for microaerophilic adaptions [40,41]. Considering the cited literature reports, an increase in the frequency of occurrence of Comammox was also expected after a decrease in oxygen concentration from 3 to 2 mg O2/L. In this study, the abundance of Comammox in the biofilm was, however, at a comparable level, and in activated sludge, a considerably lower abundance of these microorganisms was recorded. Lack of expected changes in the frequency of occurrence of Comammox bacteria in the observed system may result from the fact that despite a decrease in the DO concentration, it remained on a level sufficiently high for Comammox bacteria.
The division of Comammox into two distinct clades is caused by phylogenetic differences in the alpha subunit of ammonium monooxygenase. The ecological distribution and factors determining the niche differentiation of these two phylotypes are currently poorly understood. Between two groups of Comammox, the comaA lineage was more abundant. It is consistent with the study by Spasov et al. [42], who found no clade B in rotating biological contactors. Clade A was also dominant in 14 out of 18 samples from various environments, including the activated sludge and anaerobic sludge samples, in the study by Xia et al. [43]. It was observed, however, that this disproportion may result from limited coverage of the used primers. The authors of the primers used in this study determined the coverage of these primers at 95% for clade A and 83% for clade B [27]. Therefore, the differences in the proportions between clade A and B may be, to some extent, the result of imperfections in the available primers. Moreover, the primers used to detect Comammox bacteria are degenerate primers, which can lead to non-specific amplification and overestimation of their abundance [44].
The comparison of the occurrence of the analyzed groups of microorganisms in activated sludge and biofilm showed that the biofilm was an environment in which more nitrification organisms developed. Similar conclusions were drawn by Chao et al. [45], Li et al. [46], and Shao et al. [47]. Conducting research in hybrid reactors, due to longer SRT, the authors identified this form of biomass as an environment favorable for the development of slow-growing nitrifiers. The conducted research also evidenced the effect of the adopted aeration strategy on the frequency of occurrence of microorganisms able to oxidize ammonia nitrogen to nitrites present both in the biofilm and in activated sludge. After the transition from continuous to intermittent aeration, a considerable decrease in the abundance of AOB was determined in the biofilm developed on moving beds. Nonetheless, no related negative effect on the efficiency of the nitrification process was recorded in the IFAS-MBSBBR. At each of the stages, the efficiency of ammonia nitrogen removal was higher than 98%, and the concentration of the indicator in treated wastewater was lower than 1 mg N-NH4+/L. The observations suggest that despite changes in the abundance of AOB, their quantity was sufficient to obtain high efficiency of removal of the load of ammonia nitrogen supplied to the IFAS-MBSBBR.

5. Conclusions

  • The primary factor causing NOB suppression in the biomass developing in the IFAS-MBSBBR, both in biofilm and activated sludge, was an increase in the ratio between non-aerated and aerated sub-phase times;
  • The accumulation of nitrite nitrogen, constituting one of the indicators of NOB suppression, was only recorded in AUR tests performed for activated sludge;
  • The abundance of Comammox bacteria was largely determined by a change in the aeration strategy from continuous to intermittent, whereas it was different for both analyzed forms of biomass. Activated sludge showed a considerable increase in the quantity clade A and B, whereas, in biofilm, the quantity substantially decreased;
  • Biofilm was the environment in which more nitrification organisms developed;
  • The AUR and NitUR batch test performed in parallel can be an indirect tool to truck the suppression of nitrite-oxidizing microorganisms in wastewater treatment systems. Indicators determined on their basis, i.e., ΔN-NO2, RNIAL, nitrite nitrogen oxidation rate and ratios between the nitrite nitrogen oxidation rates and the ammonia nitrogen oxidation rates, can be used to assess the impact of the studied factors on the suppression of NOB occurring in the analyzed wastewater treatment system.

Supplementary Materials

The following are available online at https://www.mdpi.com/article/10.3390/w14010072/s1, Figure S1: N-NH4+, N-NO2, N-NO3 profiles during test (a) AUR-SB (b) NitUR-SB. Stage I; Figure S2: N-NH4+, N-NO2, N-NO3 profiles during test (a) AUR-B (b) NitUR-B. Stage I; Figure S3: N-NH4+, N-NO2, N-NO3 profiles during test (a) AUR-SB (b) NitUR-SB. Stage II; Figure S4: N-NH4+, N-NO2, N-NO3 profiles during test (a) AUR-B (b) NitUR-B. Stage II; Figure S5: N-NH4+, N-NO2, N-NO3 profiles during test (a) AUR-SB (b) NitUR-SB. Stage III; Figure S6: N-NH4+, N-NO2, N-NO3 profiles during test (a) AUR-B (b) NitUR-B. Stage III; Figure S7: N-NH4+, N-NO2, N-NO3 profiles during test (a) AUR-SB (b) NitUR-SB. Stage IV; Figure S8: N-NH4+, N-NO2, N-NO3 profiles during test (a) AUR-B (b) NitUR-B. Stage IV.

Author Contributions

Conceptualization, O.Z. and M.Z.-S.; Formal analysis, O.Z. and M.G.; Investigation, O.Z. and M.G.; Methodology, O.Z., M.Z.-S., and S.C.; Project administration, M.Z.-S.; Supervision, M.Z.-S.; Visualization, O.Z.; Writing—original draft, O.Z. (Section 1, Section 2.1, Section 2.2, Section 2.4, Section 3.1, Section 3.2, Section 4 and Section 5) and M.G. (2.3; 3.3); Writing—review and editing, M.Z.-S., S.C., and M.G. All authors will be informed about each step of manuscript processing including submission, revision, revision reminder, etc. via emails from our system or assigned assistant editor. All authors have read and agreed to the published version of the manuscript.

Funding

This research was funded by the Polish National Science Center under project no. UMO-2017/27/B/NZ9/01039.

Institutional Review Board Statement

Not applicable.

Informed Consent Statement

Not applicable.

Data Availability Statement

Not applicable.

Conflicts of Interest

The authors declare no conflict of interest. The funders had no role in the design of the study, in the collection, analyses, or interpretation of data, in the writing of the manuscript, or in the decision to publish the results.

References

  1. Zeng, W.; Wang, X.; Li, B.; Bai, X.; Peng, Y. Nitritation and denitrifying phosphorus removal via nitrite pathway from domestic wastewater in a continuous MUCT process. Bioresour. Technol. 2013, 143, 187–195. [Google Scholar] [CrossRef]
  2. Ali, M.; Okabe, S. Anammox-based technologies for nitrogen removal: Advances in process start-up and remaining issues. Chemosphere 2015, 141, 144–153. [Google Scholar] [CrossRef]
  3. Bagchi, S.; Biswas, R.; Nandy, T. Autotrophic ammonia removal processes: Ecology to technology. Crit. Rev. Environ. Sci. Technol. 2012, 42, 1353–1418. [Google Scholar] [CrossRef]
  4. Zubrowska-Sudol, M.; Yang, J.; Trela, J.; Plaza, E. Evaluation of deammonification process performance at different aeration strategies. Water Sci. Technol. 2011, 63, 1168–1176. [Google Scholar] [CrossRef] [PubMed]
  5. Persson, F.; Sultana, R.; Suarez, M.; Hermansson, M.; Plaza, E.; Wilén, B.M. Structure and composition of biofilm communities in a moving bed biofilm reactor for nitritation-anammox at low temperatures. Bioresour. Technol. 2014, 154, 267–273. [Google Scholar] [CrossRef] [PubMed]
  6. Wang, X.; Gao, D. In-situ restoration of one-stage partial nitritation-anammox process deteriorated by nitrate build-up via elevated substrate levels. Sci. Rep. 2016, 6, 37500. [Google Scholar] [CrossRef] [Green Version]
  7. Cao, Y.; Kwok, B.H.; van Loosdrecht, M.C.M.; Daigger, G.; Png, H.Y.; Long, W.Y.; Eng, O.K. The influence of dissolved oxygen on partial nitritation/ anammox performance and microbial community of the 200,000 m3/d activated sludge process at the Changi water reclamation plant (2011 to 2016). Water Sci. Technol. 2018, 78, 634–643. [Google Scholar] [CrossRef] [Green Version]
  8. Ma, B.; Bao, P.; Wei, Y.; Zhu, G.; Yuan, Z.; Peng, Y. Suppressing nitrite-oxidizing bacteria growth to achieve nitrogen removal from domestic wastewater via anammox using intermittent aeration with low dissolved oxygen. Sci. Rep. 2015, 5, 13048. [Google Scholar] [CrossRef]
  9. Bao, P.; Wang, S.; Ma, B.; Zhang, Q.; Peng, Y. Achieving partial nitrification by inhibiting the activity of Nitrospira-like bacteria under high-DO conditions in an intermittent aeration reactor. J. Environ. Sci. (China) 2017, 56, 71–78. [Google Scholar] [CrossRef]
  10. Blackburne, R.; Yuan, Z.; Keller, J. Partial nitrification to nitrite using low dissolved oxygen concentration as the main selection factor. Biodegradation 2008, 19, 303–312. [Google Scholar] [CrossRef] [PubMed]
  11. Bougard, D.; Bernet, N.; Chèneby, D.; Delgenès, J.P. Nitrification of a high-strength wastewater in an inverse turbulent bed reactor: Effect of temperature on nitrite accumulation. Process Biochem. 2006, 41, 106–113. [Google Scholar] [CrossRef]
  12. Park, S.; Chung, J.; Rittmann, B.E.; Bae, W. Nitrite Accumulation from Simultaneous Free-Ammonia and Free-Nitrous-Acid Inhibition and Oxygen Limitation in a Continuous-Flow Biofilm Reactor. Biotechnol. Bioeng. 2015, 112, 43–52. [Google Scholar] [CrossRef]
  13. Manser, R.; Gujer, W.; Siegrist, H. Consequences of mass transfer effects on the kinetics of nitrifiers. Water Res. 2005, 39, 4633–4642. [Google Scholar] [CrossRef]
  14. Katsogiannis, A.N.; Kornaros, M.; Lyberatos, G. Enhanced nitrogen removal in SBRs bypassing nitrate generation accomplished by multiple aerobic/anoxic phase pairs. Water Sci. Technol. 2003, 47, 53–59. [Google Scholar] [CrossRef]
  15. Li, J.; Elliott, D.; Nielsen, M.; Healy, M.G.; Zhan, X. Long-term partial nitrification in an intermittently aerated sequencing batch reactor (SBR) treating ammonium-rich wastewater under controlled oxygen-limited conditions. Biochem. Eng. J. 2011, 55, 215–222. [Google Scholar] [CrossRef]
  16. Ma, Y.; Peng, Y.; Wang, S.; Yuan, Z.; Wang, X. Achieving nitrogen removal via nitrite in a pilot-scale continuous pre-denitrification plant. Water Res. 2009, 43, 563–572. [Google Scholar] [CrossRef] [PubMed]
  17. Ruiz, G.; Jeison, D.; Rubilar, O.; Ciudad, G.; Chamy, R. Nitrification-denitrification via nitrite accumulation for nitrogen removal from wastewaters. Bioresour. Technol. 2006, 97, 330–335. [Google Scholar] [CrossRef]
  18. Ge, S.; Peng, Y.; Qiu, S.; Zhu, A.; Ren, N. Complete nitrogen removal from municipal wastewater via partial nitrification by appropriately alternating anoxic/aerobic conditions in a continuous plug-flow step feed process. Water Res. 2014, 55, 95–105. [Google Scholar] [CrossRef] [PubMed]
  19. Bhatia, A.; Singh, N.K.; Bhando, T.; Pathania, R.; Kazmi, A.A. Effect of intermittent aeration on microbial diversity in an intermittently aerated IFAS reactor treating municipal wastewater: A field study. J. Environ. Sci. Health A-Part A Toxic/Hazard. Subst. Environ. Eng. 2017, 52, 440–448. [Google Scholar] [CrossRef] [PubMed]
  20. Yang, S.; Yang, F. Nitrogen removal via short-cut simultaneous nitrification and denitrification in an intermittently aerated moving bed membrane bioreactor. J. Hazard. Mater. 2011, 195, 318–323. [Google Scholar] [CrossRef]
  21. Ødegaard, H.; Rusten, B.; Westrum, T. A new moving bed biofilm reactor-applications and results. Water Sci. Technol. 1994, 29, 157–165. [Google Scholar] [CrossRef]
  22. Hem, L.; Rusten, B.; Ødegaard, H. Nitrification in a moving bed biofilm reactor. Water Res. 1994, 28, 1425–1433. [Google Scholar] [CrossRef]
  23. Rother, E.; Cornel, P. Optimising design, operation and energy consumption of biological aerated filters (BAF) for nitrogen removal of municipal wastewater. Water Sci. Technol. 2004, 50, 131–139. [Google Scholar] [CrossRef] [PubMed]
  24. Pal, L.; Kraigher, B.; Brajer-Humar, B.; Levstek, M.; Mandic-Mulec, I. Total bacterial and ammonia-oxidizer community structure in moving bed biofilm reactors treating municipal wastewater and inorganic synthetic wastewater. Bioresour. Technol. 2012, 110, 135–143. [Google Scholar] [CrossRef] [PubMed]
  25. Kowalchuck, G.A.; Stephen, J.R.; De Boer, W.; Prosser, J.I.; Embley, T.M.; Woldendorp, J.M. Analysis of ammonia-oxidizing bacteria of the β subdivision of the class Proteobacteria in coastal sand dunes by denaturing gradient gel electrophoresis and sequencing of PCR-amplified 16S ribosomal DNA fragments. Appl. Environ. Microbiol. 1997, 63, 1489–1497. [Google Scholar] [CrossRef] [PubMed] [Green Version]
  26. Dionisi, H.M.; Layton, A.C.; Harms, G.; Gregory, I.R.; Robinson, K.G.; Sayler, G.S. Quantification of Nitrosomonas oligotropha-like ammonia-oxidizing bacteria and Nitrospira spp. from full-scale wastewater treatment plants by competitive PCR. Appl. Environ. Microbiol. 2002, 68, 245–253. [Google Scholar] [CrossRef] [Green Version]
  27. Pjevac, P.; Schauberger, C.; Poghosyan, L.; Herbold, C.W.; van Kessel, M.A.H.J.; Daebeler, A.; Steinberger, M.; Jetten, M.S.M.; Lücker, S.; Wagner, M.; et al. AmoA-targeted polymerase chain reaction primers for the specific detection and quantification of comammox Nitrospira in the environment. Front. Microbiol. 2017, 8, 1508. [Google Scholar] [CrossRef] [Green Version]
  28. Livak, K.J.; Schmittgen, T.D. Analysis of Relative Gene Expression Data Using Real-Time Quantitative PCR and the 2-ΔΔCT Method. Methods 2001, 25, 402–408. [Google Scholar] [CrossRef] [PubMed]
  29. APHA. Standard Methods for the Examination of Water and Wastewater, 21st ed.; American Public Health Association/American Water Works Association/Water Environment Federation: Washington, DC, USA, 2005; pp. 1–1368. [Google Scholar]
  30. Podedworna, J.; Zubrowska-Sudoł, M. Nitrogen and phosphorus removal in a denitrifying phosphorus removal process in a sequencing batch reactor with a forced anoxic phase. Environ. Technol. 2021, 33, 237–245. [Google Scholar] [CrossRef] [PubMed]
  31. Wang, J.; Rong, H.; Zhang, C. Evaluation of the impact of dissolved oxygen concentration on biofilm microbial community in sequencing batch biofilm reactor. J. Biosci. Bioeng. 2018, 125, 532–542. [Google Scholar] [CrossRef] [PubMed]
  32. van Kessel, M.A.H.J.; Speth, D.R.; Albertsen, M.; Nielsen, P.H.; Op Den Camp, H.J.M.; Kartal, B.; Jetten, M.S.M.; Lücker, S. Complete nitrification by a single microorganism. Nature 2015, 528, 555–559. [Google Scholar] [CrossRef] [Green Version]
  33. Daims, H.; Lebedeva, E.V.; Pjevac, P.; Han, P.; Herbold, C.; Albertsen, M.; Jehmlich, N.; Palatinszky, M.; Vierheilig, J.; Bulaev, A.; et al. Complete nitrification by Nitrospira bacteria. Nature 2015, 528, 504–509. [Google Scholar] [CrossRef] [PubMed]
  34. Diwan, V. Composition and Abundance of Nitrifiers in Engineered Systems: Molecular and Community Ecology Approaches. Ph.D Thesis, Technical University of Denmarik, Lyngby, Denmarik, 2019. [Google Scholar]
  35. Liu, G.; Wang, J. Long-term low DO enriches and shifts nitrifier community in activated sludge. Environ. Sci. Technol. 2013, 47, 5109–5117. [Google Scholar] [CrossRef] [PubMed]
  36. Pérez, J.; Picioreanu, C.; van Loosdrecht, M. Modeling biofilm and floc diffusion processes based on analytical solution of reaction-diffusion equations. Water Res. 2005, 39, 1311–1323. [Google Scholar] [CrossRef] [PubMed]
  37. Roots, P.; Wang, Y.; Rosenthal, A.F.; Griffin, J.S.; Sabba, F.; Petrovich, M.; Yang, F.; Kozak, J.A.; Zhang, H.; Wells, G.F. Comammox Nitrospira are the dominant ammonia oxidizers in a mainstream low dissolved oxygen nitrification reactor. Water Res. 2019, 157, 396–405. [Google Scholar] [CrossRef] [PubMed]
  38. Camejo, P.Y.; Santo Domingo, J.; McMahon, K.D.; Noguera, D.R. Genome-Enabled Insights into the Ecophysiology of the Comammox Bacterium “Candidatus Nitrospira nitrosa”. mSystems 2017, 2, e00059-17. [Google Scholar] [CrossRef] [PubMed] [Green Version]
  39. Liu, T.; Liu, S.; He, S.; Tian, Z.; Zheng, M. Minimization of N2O emission through intermittent aeration in a sequencing batch reactor (SBR): Main behavior and mechanism. Water 2021, 13, 210. [Google Scholar] [CrossRef]
  40. Lawson, C.E.; Lücker, S. Complete ammonia oxidation: An important control on nitrification in engineered ecosystems. Curr. Opin. Biotechnol. 2018, 50, 158–165. [Google Scholar] [CrossRef] [PubMed]
  41. Palomo, A.; Pedersen, A.G.; Fowler, S.J.; Dechesne, A.; Sicheritz-Pontén, T.; Smets, B.F. Comparative genomics sheds light on niche differentiation and the evolutionary history of comammox Nitrospira. ISME J. 2018, 12, 1779–1793. [Google Scholar] [CrossRef] [PubMed] [Green Version]
  42. Spasov, E.; Tsuji, J.M.; Hug, L.A.; Doxey, A.C.; Sauder, L.A.; Parker, W.J.; Neufeld, J.D. High functional diversity among Nitrospira populations that dominate rotating biological contactor microbial communities in a municipal wastewater treatment plant. ISME J. 2020, 14, 1857–1872. [Google Scholar] [CrossRef] [Green Version]
  43. Xia, F.; Wang, J.G.; Zhu, T.; Zou, B.; Rhee, S.K.; Quan, Z.X. Ubiquity and diversity of complete ammonia oxidizers (comammox). Appl. Environ. Microbiol. 2018, 84. [Google Scholar] [CrossRef] [PubMed] [Green Version]
  44. Harringer, M.; Alfreider, A. Primer evaluation and development of a droplet digital PCR protocol targeting amoA genes for the quantification of Comammox in lakes. Sci. Rep. 2021, 11, 2982. [Google Scholar] [CrossRef] [PubMed]
  45. Chao, Y.; Mao, Y.; Yu, K.; Zhang, T. Novel nitrifiers and comammox in a full-scale hybrid biofilm and activated sludge reactor revealed by metagenomic approach. Appl. Microbiol. Biotechnol. 2016, 100, 8225–8237. [Google Scholar] [CrossRef] [PubMed]
  46. Li, B.; Qiu, Y.; Zhang, C.; Chen, L.; Shi, H. Understanding biofilm diffusion profiles and microbial activities to optimize integrated fixed-film activated sludge process. Chem. Eng. J. 2016, 302, 269–277. [Google Scholar] [CrossRef]
  47. Shao, Y.; Shi, Y.; Mohammed, A.; Liu, Y. Wastewater ammonia removal using an integrated fixed-film activated sludge-sequencing batch biofilm reactor (IFAS-SBR): Comparison of suspended flocs and attached biofilm. Int. Biodeterior. Biodegrad. 2017, 116, 38–47. [Google Scholar] [CrossRef]
Figure 1. Schematic of reactor with accessories.
Water 14 00072 g001
Figure 2. Ammonia oxidation rate for suspended biomass (AOR- SB) and biofilm (AOR-B).
Water 14 00072 g002
Figure 3. (a) Accumulation of nitrites (ΔN-NO2), RNIAL values, (b) nitrite nitrogen oxidation rate (NitOR) for suspended biomass (SB) and biofilm (B).
Water 14 00072 g003
Figure 4. Relative qPCR analysis of bacterial population changes in IFAS-MBSBBR. The results show the values of fold changes for biofilm and activated sludge at four stages of the process (I–IV) in relation to biomass at the beginning of the process (0). AOB—ammonia-oxidizing bacteria, NOB—nitrite-oxidizing bacteria, coma A—lineage A of Comammox bacteria, coma B—lineage B of Comammox bacteria.
Water 14 00072 g004
Table 1. Reactor operation stages.
StageDuration
(Days)
Description of Aeration StrategyDay of Performance of Batch Tests and Collection of Samples for Microbiological Analyses
Times of Aerated t1 and Non-Aerated t2 Sub-PhasesRatio between Times of Non- Aerated and Aerated Sub-Phases (R)O2 Concentration during Aerated Sub-Phases (mg/L)
I0–39Continuous0332
II40–70Intermittent aeration:
t1 = 40 min, t2 = 10 min
1/4367
III71–84Intermittent aeration:
t1 = 40 min, t2 = 10 min
1/4282
IV85–100Intermittent aeration:
t1 = 30 min, t2 = 10 min
1/3297
Table 2. Influent and effluent characteristics.
ParameterInfluentEffluent
IIIIIIIV
CODmg O2/Lmin508.0010.2011.7011.8010.90
max535.0016.5018.4018.4018.30
average518.76 ± 9.0213.58 ± 2.2814.78 ± 2.2115.80 ± 2.6914.10 ± 3.11
TNmg N/Lmin63.0012.0012.358.769.75
max65.0015.8014.6514.0012.40
average63.96 ± 0.8313.25 ± 1.2613.48 ± 0.8611.09 ± 1.9511.46 ± 1.23
TKNmg N/Lmin60.910.951.780.280.70
max63.363.504.912.133.06
average62.04 ± 0.842.04 ± 0.763.09 ± 1.161.51 ± 0.721.76 ± 0.99
N-NH4+mg N-NH4+/Lmin38.000.140.140.190.07
max42.001.331.750.760.61
average39.91 ± 1.000.71 ± 0.340.69 ± 0.450.36 ± 0.190.28 ± 0.13
N-NO2mg N-NO2Lminnd00.010.010.01
max0.560.230.070.20
average0.09 ± 0.190.04 ± 0.060.03 ± 0.020.04 ± 0.05
N-NO3mg N-NO3/Lmin1.639.848.957.138.34
max2.4812.3012.2012.2010.50
average1.99 ± 0.2511.12 ± 0.9310.37 ± 1.059.56 ± 1.859.64 ± 1.20
COD removal efficiency 1%97.36 ± 0.4597.19 ± 0.4296.96 ± 0.4997.24 ± 0.62
Nitrification efficiency 1%98.38 ± 0.8598.19 ± 1.1699.05 ± 0.4999.23 ± 0.29
Denitrification efficiency 1%79.21 ± 2.0078.81 ± 1.3782.79 ± 3.0282.19 ± 2.06
nd—not detected, 1—values calculated in accordance with the methodology provided in the [30].
Publisher’s Note: MDPI stays neutral with regard to jurisdictional claims in published maps and institutional affiliations.

