
Spatiotemporal Change Analysis of Soil Moisture Based on Downscaling Technology in Africa


1
School of Physics and Electronic Engineering, Ningxia University, Yinchuan 750021, China
2
Hulunbeir Grassland Ecosystem Research Station, Institute of Agricultural Resources and Regional Planning, Chinese Academy of Agricultural Sciences, Beijing 100081, China
3
Faculty of Geographical and Environmental Science, University of Khartoum, Khartoum 11111, Sudan
4
School of Surveying and Geo-Informatics, Shandong Jianzhu University, Jinan 250100, China
5
State Key Laboratory of Remote Sensing Science, Institute of Remote Sensing and Digital Earth Research, Chinese Academy of Sciences and Beijing Normal University, Beijing 100101, China
*
Author to whom correspondence should be addressed.
†
These authors contributed equally to this work.
Water 2022, 14(1), 74; https://doi.org/10.3390/w14010074
Submission received: 29 September 2021
/
Revised: 22 December 2021
/
Accepted: 28 December 2021
/
Published: 2 January 2022
(This article belongs to the Special Issue Remote Sensing Application on Soil Moisture)
Abstract
:Evaluating the long-term spatiotemporal variability in soil moisture (SM) over Africa is crucial for understanding how crop production is affected by drought or flooding. However, the lack of continuous and stable long-term series and high-resolution soil moisture records impedes such research. To overcome the inconsistency of different microwave sensors (Advanced Microwave Scanning Radiometer-EOS, AMSR-E; Soil Moisture and Ocean Salinity, SMOS; and Advanced Microwave Scanning Radiometer 2, AMSR2) in measuring soil moisture over time and depth, we built a time series reconstruction model to correct SM, and then used a Spatially Weighted Downscaling Model to downscale the SM data from three different sensors to a 1 km spatial resolution. The verification of the reconstructed data shows that the product has high accuracy, and can be used for application and analysis. The spatiotemporal trends of SM in Africa were examined for 2003–2017. The analysis indicated that soil moisture is declining in Africa as a whole, and it is notably higher in central Africa than in other subregions. The most significant decrease in SM was observed in the savanna zone (slope < −0.08 m3 m−3 and P < 0.001), followed by South Africa and Namibia (slope < −0.07 m3 m−3 and P < 0.01). Seasonally, the most significant downward trends in SM were observed during the spring, mainly over eastern and central Africa (slope < −0.07 m3 m−3, R < −0.58 and P < 0.001). The analysis of spatiotemporal changes in soil moisture can help improve the understanding of hydrological cycles, and provide benchmark information for drought management in Africa.
1. Introduction
Soil moisture (SM) changes, as a vital factor in climate change, play a significant role in the environment [1,2,3]. SM has been widely applied in many fields, notably in weather forecasting [4,5,6], agricultural drought monitoring, and land degradation, which provides information for hydrological applications [7,8]. In practice, SM is strongly correlated with drought, so it is considered an indicator of crop water demand in drought modeling [9]. Therefore, monitoring the spatiotemporal distribution of SM dynamics is crucial to understanding crop water demand and drought events in semiarid regions [10,11]. In addition, timely access to accurate SM data will help to map the spatial distribution of SM, which is important in food security and dryland management. There are many traditional methods of obtaining soil moisture, such as drying and weighing, capacitance, neutron meter detection, tensiometer techniques, and time domain reflection (TDR). These are slow and continuous, and only offer a limited monitoring scale [12]. The number of ground soil moisture observation sites is often limited, especially in Africa. Although SM data can be obtained from weather stations with traditional point measurements, it is difficult to investigate the spatiotemporal patterns of SM over a large area because of spatial differences [13]. Remote sensing technology develops rapidly, and can provide real-time dynamic information for an entire region, so it is a practical method for obtaining SM information in developing regions with limited ground measurements, which may underpin analysis of the impact of drought on agriculture [12,14,15].
The remote sensing technique of SM retrieval mainly involves two methods: microwave and optical remote sensing methods [16]. In general, microwave methods are more acceptable than optical methods (near-infrared and thermal infrared bands), in that microwave signals have a higher penetration capability, which means they are more sensitive to SM [17]. Microwave remote sensing encompasses passive and active methods, providing the opportunity to obtain SM information on a large scale, which helps in the monitoring of soil moisture and groundwater [18,19,20]. Many microwave radiation sensors, such as the Advanced Microwave Scanning Radiometer-Earth observing system (AMSR-E) [21,22], the Advanced Microwave Scanning Radiometer 2 (AMSR2) [23], Scanning Multichannel Microwave Radiometer (SMMR) [24,25], the Soil Moisture Ocean Salinity (SMOS) systems [26], Fengyun [27], and the Tropical Rainfall Measuring Mission Microwave Imager (TRMM-TMI) [28], are used for studying SM dynamics. Although the SM data obtained from these microwave radiometers are very effective for drought monitoring and hydrological investigations [29], they have coarse spatial resolutions (10–40 km), and are thus difficult to use at regional scales for certain research models [30]. Thus, it is necessary to downscale the SM products from coarse to fine scales [31].
Multiple methods have been developed by correlating soil moisture and visible/thermal infrared remote sensing to improve the resolution of microwave radiometers [32]. Downscaling techniques based on the higher resolution of visible/thermal infrared data can provide more accurate SM data, and have been widely employed to reflect the spatial heterogeneity of low-spatial resolution data [11,33]. This downscaling approach originated from the ‘universal triangle’ concept [34,35], which describes the correlation between SM, vegetation indices, and land surface temperature (LST) [36]. Many studies have used linear regression formulas for downscaling soil moisture [36,37]. For instance, Choi et al. [36] applied linear regression analysis to AMSR-E SM data. Guevara et al. [38] also applied a machine learning technique to boost the pixel size of passive microwave SM data, and found that the accuracy of the downscaled datasets was very good at the size of 1 km pixel compared with the original data at the size of 27 km pixel. Likewise, Chen et al. [39] downscaled AMSR-E SM data by using a random forest algorithm and cubist models with multisource remote sensing data. Peng et al. [40] proposed a simplified model to increase the spatial resolution of microwave SM with the vegetation temperature condition index (VTCI) as a distinctive downscaling factor. However, there are still challenges in the downscaling of remotely sensed SM: (1) the relationship between SM and land surface variables (e.g., surface albedo, surface roughness length, land surface temperature, and land cover) is dynamic and cannot be adequately described by linear models. (2) In complex terrains, downscaling is low in terms of effectiveness, and more methods need to be explored. (3) Many factors determine SM, so downscaling techniques that use only a limited number of factors cannot be optimized.
All of the above SM downscaling approaches are based on a single microwave sensor. Consequently, it is very difficult to find reliable long-term SM data with fine spatial resolution over large areas, such as the African continent. Africa is one of the largest continents in the world. Drought threatens the lives and livelihoods of millions in African countries, as their economies mainly depend on agricultural activities, and their food mostly relies on rainfed crop production [41]. Over the last decades, most of the African subregions have encountered severe agricultural drought that profoundly impacts crop production, and leads to severe food insecurity issues [42]. In recent years, major drought events in the subregions of Africa have been recorded, such as Tunisia and Algeria in northern Africa from 1999 to 2002 [43], western African shale regions from the early to mid-1980s [44], eastern African countries during the 1980s [45], and southern African regions from 2001 to 2003 [46]. Therefore, it is critical to understand the dynamic variability of SM for the management of agriculture in Africa [47]. The objectives of this study were to (1) downscale SM data to obtain high-resolution datasets from 2003 to 2017 for Africa based on visible/thermal infrared data; (2) use in situ measurement points to validate the downscaled time series data; and (3) take advantage of microwave radiometer measurements to examine the spatiotemporal changes in SM that occurred in African subregions.
2. Materials and Methods
2.1. Study Area
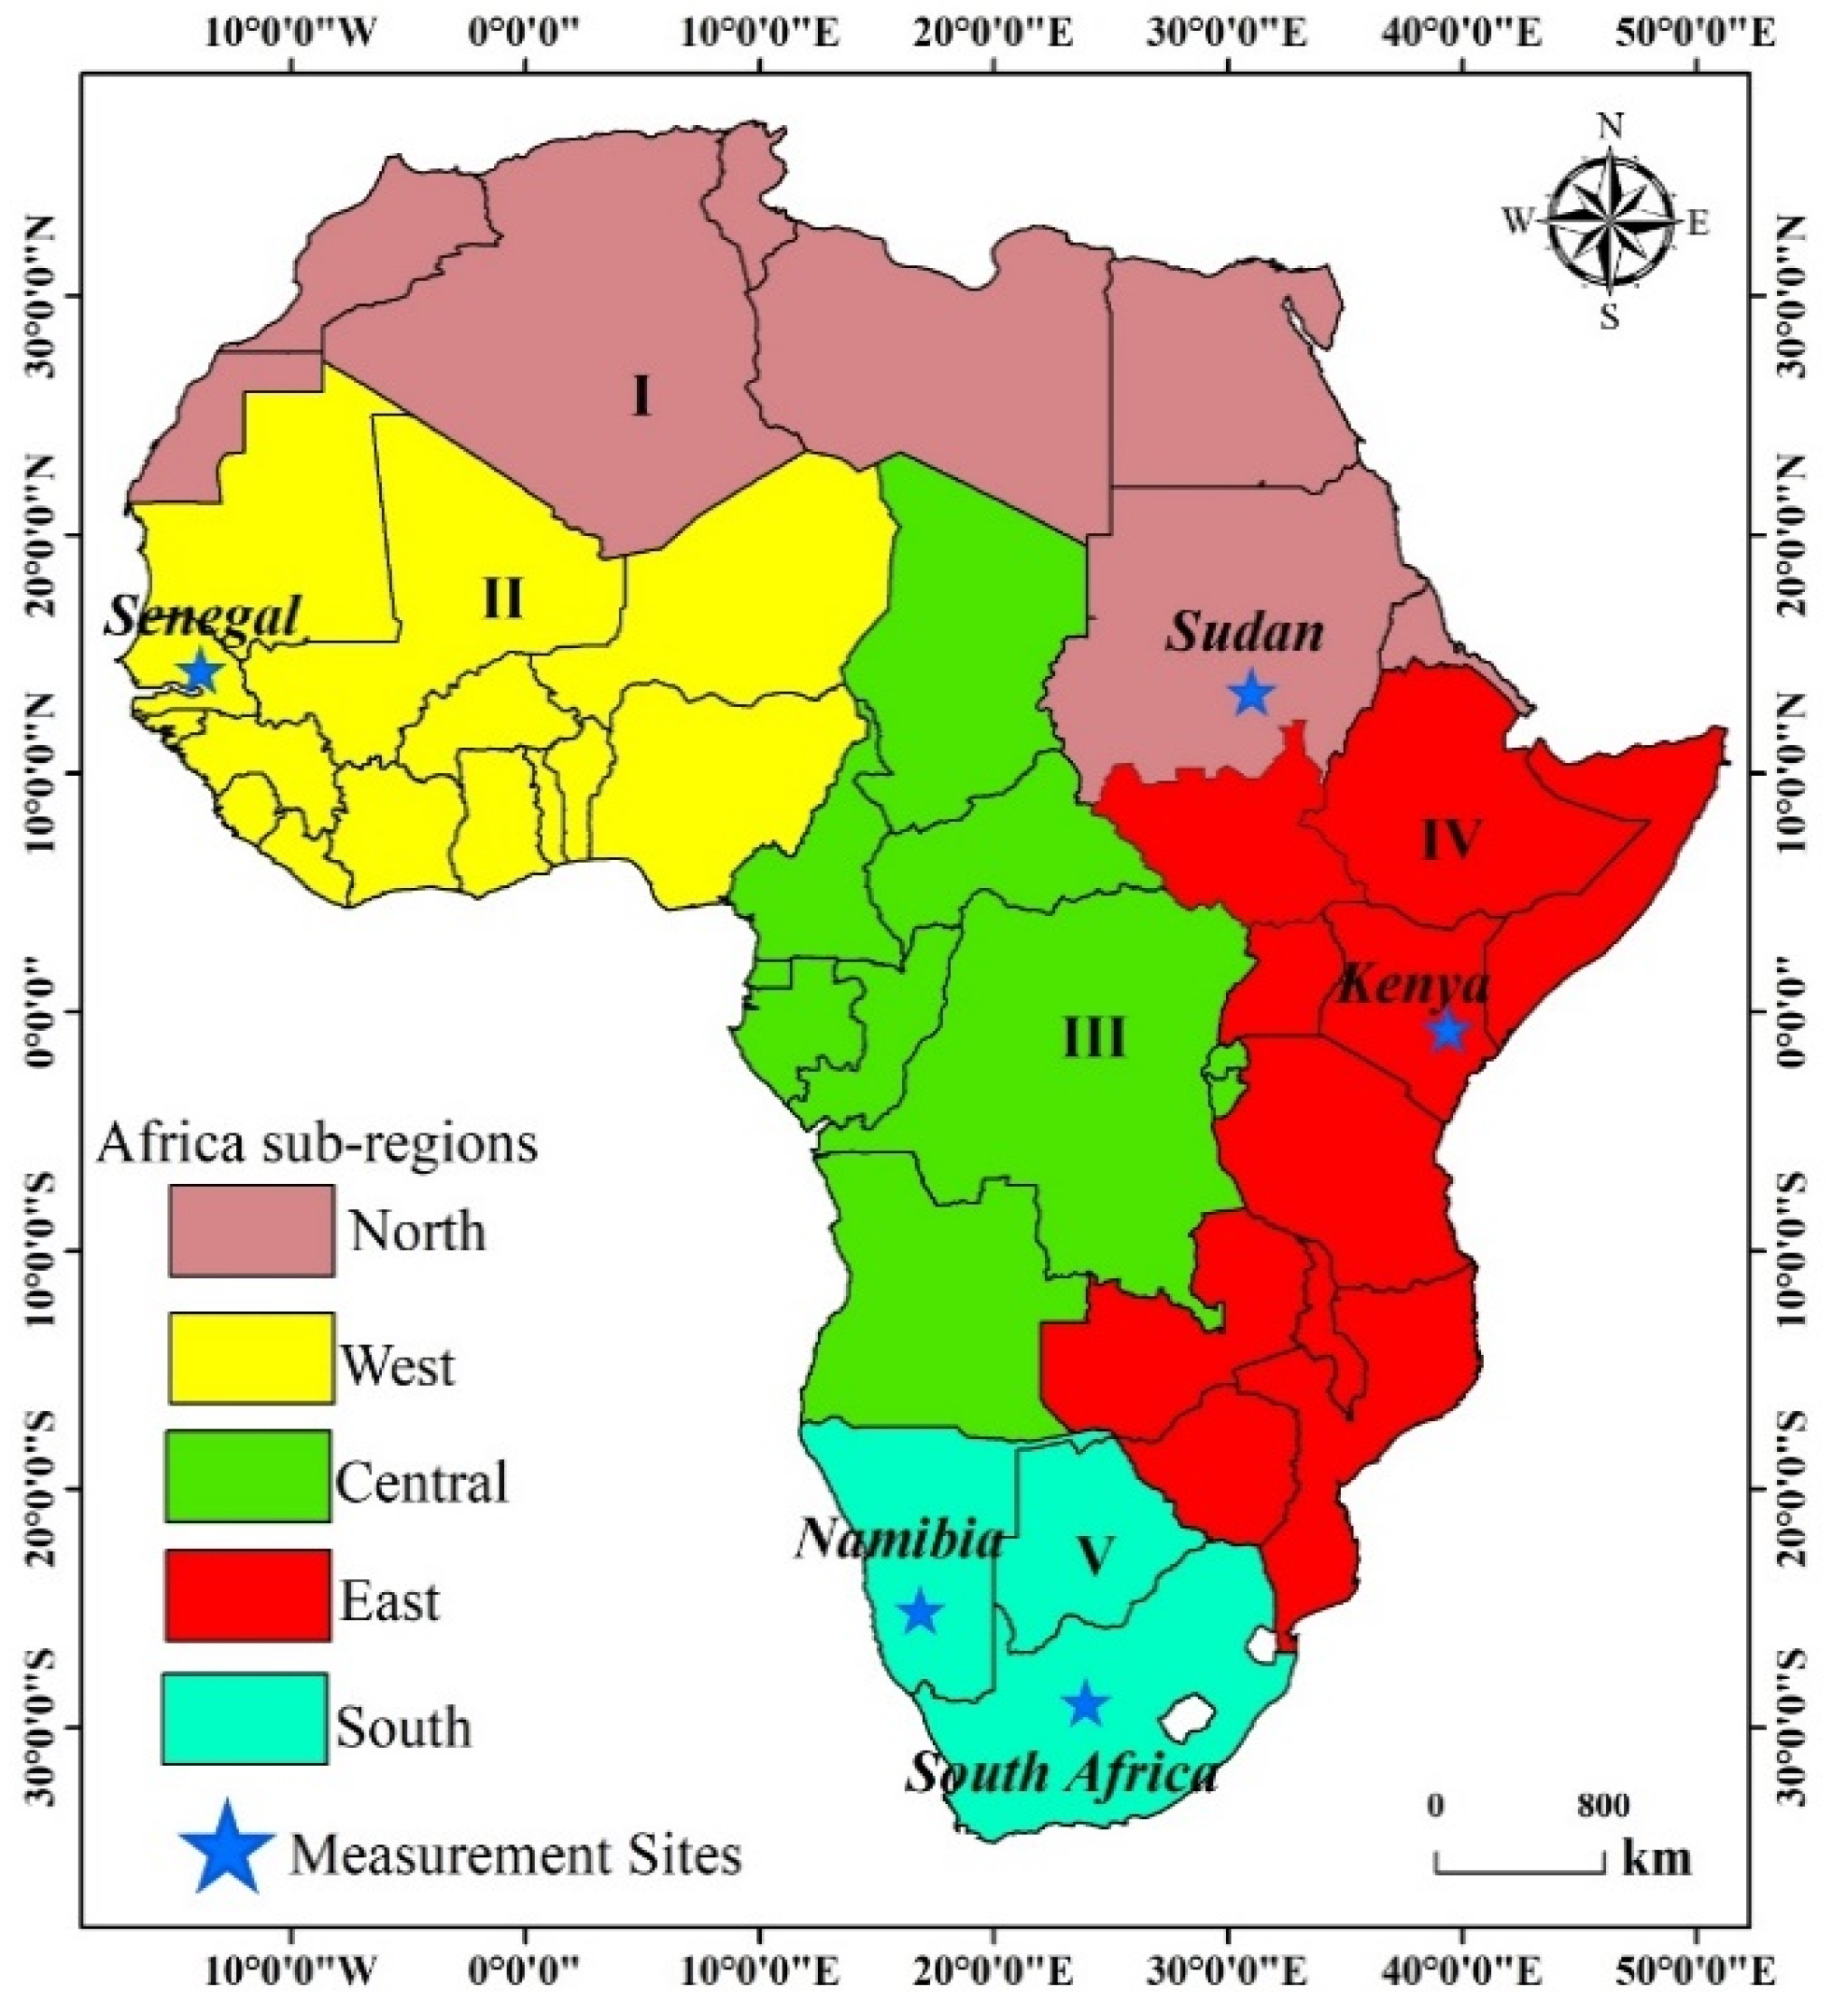
According to the United Nations geographic classification scheme, the African continent covers five main geographical subregions: north, south, east, west, and central, with 54 countries (Figure 1). The boundaries of the region are shaped by the Mediterranean Sea to the north, the Red Sea to the northeast, the Atlantic Ocean to the west, and the Indian Ocean to the southeast.
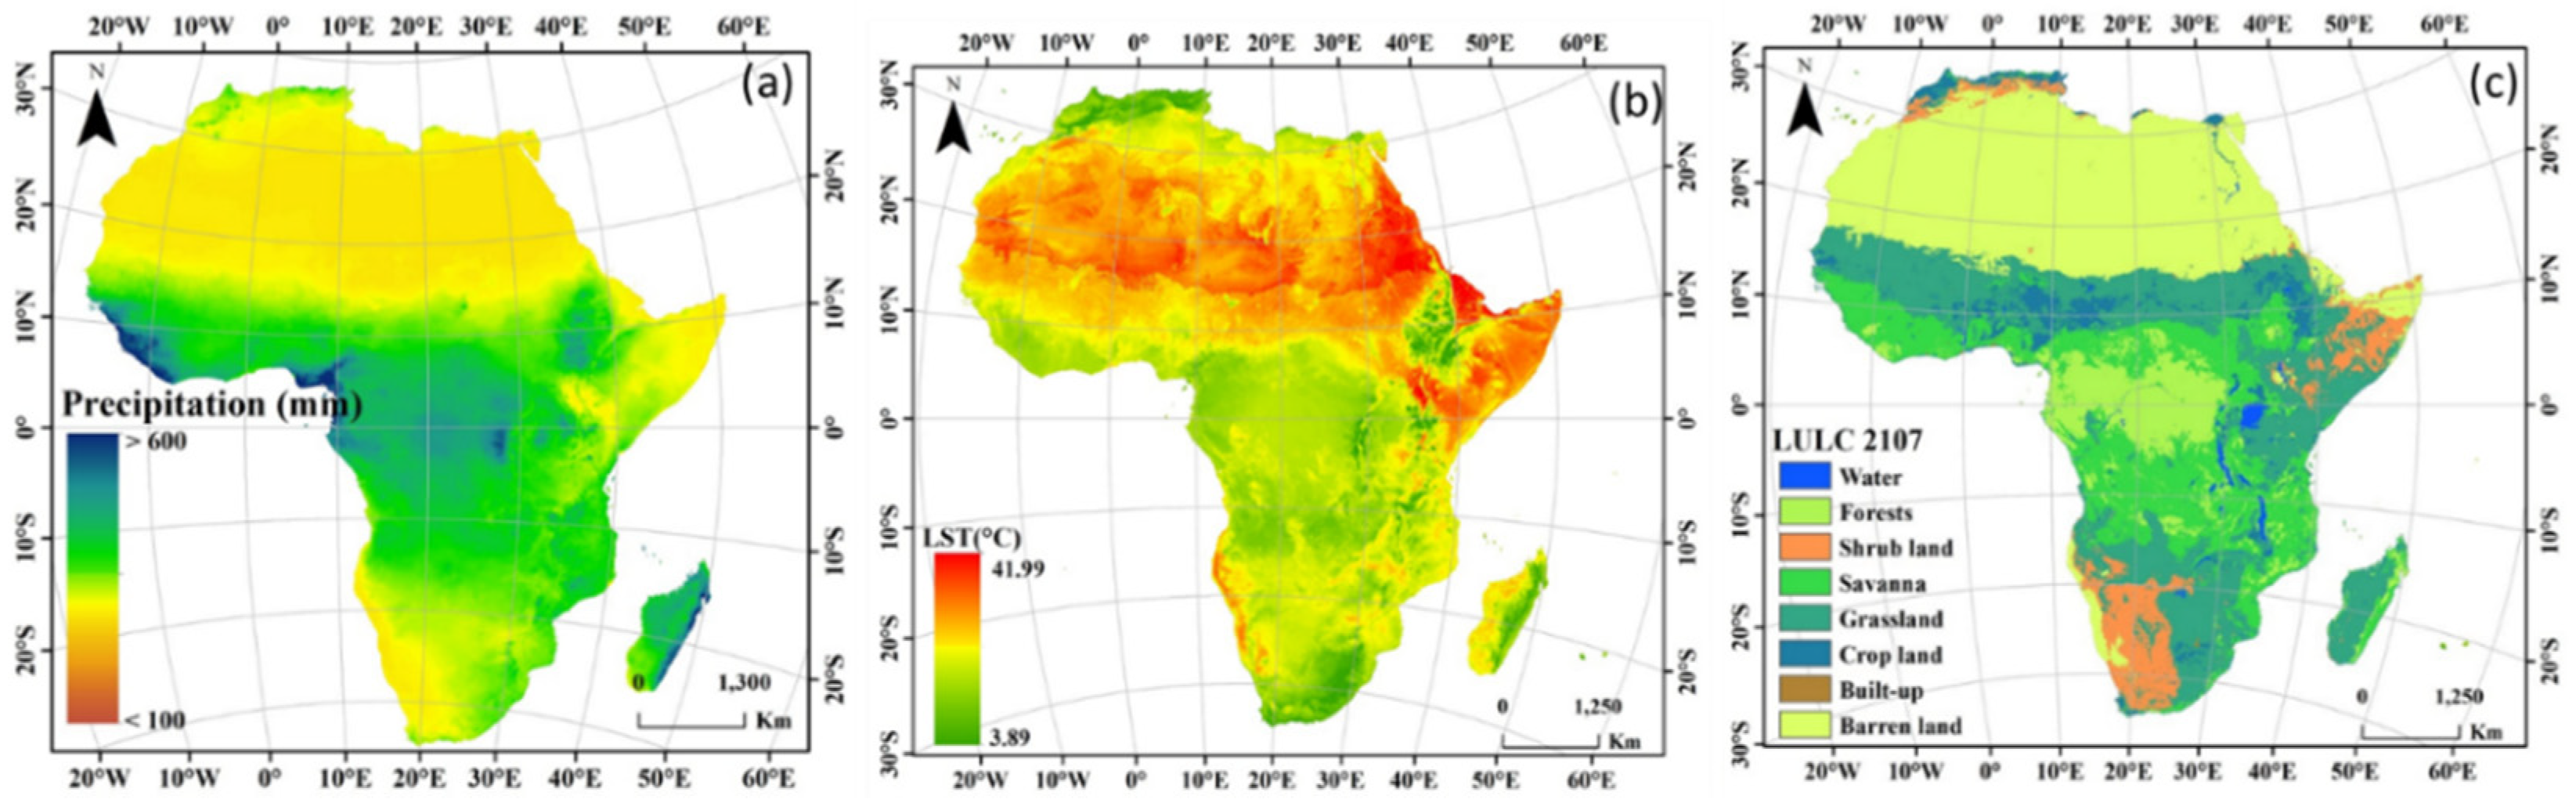
Africa’s climate and topography vary from warm lowland to moderate and wet highland and littoral. Geographical scientists divided Africa into two regions based on elevation: high (from southern Ethiopia to South Africa) and low (plains for the rest of the region) [48]. The rainfall in Africa is highly variable even over a small area, and this variability refers to the effect of complex topography, streams, and wet weather with seasonal dynamics [49]. The average annual rainfall ranges from 100 mm to 3000 mm, with lower rainfall over arid and semiarid regions, such as the Sahara zone in the north and west, and higher rainfall over the savanna and rainforest zones. The average annual precipitation from the Climate Hazards Group InfraRed Precipitation with Station (CHIRPS) over Africa from 2003 to 2017 was 345 mm (Figure 2a).
During most months of the year, most areas of Africa experience extreme temperatures, especially arid and semiarid areas, with a mean annual temperature of 33.9 °C. According to the Moderate Resolution Imaging Spectroradiometer (MODIS) monthly data at a spatial resolution of 1 km from the Aqua satellite (MYD11C3), the average annual LST from 2003 to 2017 was 27 °C (Figure 2b). Africa’s population was estimated at 1.3 billion in 2018. Africans are dependent on agricultural production (crop and livestock) as the main source of food and economy. Most African countries experience numerous drought events because of their high dependency on rainfed agriculture, which has resulted in the depletion of SM coupled with an increase in population growth.
Due to the low resolution of passive microwave images, most of the pixels are mixed pixels. In order to simplify the analysis, we reclassified the surface types. MODIS land cover (MCD12C1) was reclassified into six classes (Figure 2c): water, forests (evergreen coniferous forests, evergreen broadleaf forests, deciduous coniferous forests, deciduous broadleaf forests, and mixed forests), shrublands (closed shrublands and open shrublands), savanna (woody savannas and savannas), built-up lands (urban and built-up lands, and cropland/natural vegetation mosaics), and barren land (barren). Currently, the dominant land cover types are bare areas and cropland, accounting for approximately 38 and 18%, respectively, of the land surface.
2.2. Data Collection and Processing
2.2.1. Soil Moisture Data
Three SM products were used to investigate the variation in SM over the African continent at different time scales. The Aqua satellite with AMSR-E was launched in May 2002, and passes over the equator two times per day (1:30 p.m. and 1:30 a.m., equatorial local passing time) [50,51]. The coverage of AMSR-E soil moisture data level 3 was from July 2002 to September 2011, available at the EOS Data Gateway site (ftp://n4ftl01u.ecs.nasa.gov/SAN/AMSA/AE_Land3.002/, accessed on 29 December 2018), with a spatial resolution of 25 km.
The AMSR2 sensor, as a successor to AMSR-E, was mounted on the Global Change Observation Mission–Water 1 (GCOM-W1) satellite by JAXA, and launched in 2012. AMSR2 is close to AMSR-E because it has daily data at 1:30 p.m. (ascending) and 1:30 a.m. (descending) at the equatorial local time [51]. SM data from AMSR2 were retrieved using brightness temperature (Tb) (C- and X-bands). In this study, the AMSR2 Level 3 SM data were obtained from JAXA’s GCOM website (http://suzaku.eorc.jaxa.jp/, accessed on 12 January 2019). Therefore, we needed to obtain soil moisture product data from other satellites.
The European Space Agency’s (ESA’s) SMOS was launched in 2009, and is equipped with L-band sensors that can retrieve soil moisture. SMOS uses the L-band at incidence angles from 0–55° to measure the brightness temperature released from land across a swath of ~1000 km at a spatial resolution of 35 to 50 km. The soil moisture observation depth in the L-band is deeper than that of AMSR-E and AMSR2. However, the transit times of ascending and descending orbits are at approximately 06:00 a.m. and 06:00 p.m., respectively. SMOS-IC V105 SM data were obtained from the CATDS website (https://www.catds.fr/Products/Available-products-from-CEC-SM/SMOS-IC, accessed on 18 January 2019).
2.2.2. MODIS Data
MODIS products were used in this work, including the 16-day composite Normalized Difference Vegetation Index (NDVI) product (MYD13A3) and the 1-km, 8-day composite LST (day/night) product (MYD11A2), which were used as input parameters for the vegetation temperature condition index (VTCI) model. The calculated result was used as a weighting factor to downscale the coarse-scale soil products. The MODIS LST product was obtained from NASA’s Land Processes Distributed Active Archive Center (LPDAAC) (https://lpdaac.usgs.gov, accessed on 25 December 2018). A small number of missing values were filled by interpolation methods [52]. In addition, The Shuttle Radar Topography Mission (SRTM) DEM data with a resolution of 1 km were obtained from USGS (https://lpdaac.usgs.gov/, accessed on 25 December 2018), which provides terrain factors (e.g., elevation and slope) for the downscaling model. The remote sensing data description is shown in Table 1.
2.2.3. Ground Observation Data
It is assumed that the validation of remote sensing SM products across Africa will reveal new significant challenges, which will improve the accuracy of satellites, and the processing accuracy of raw data and recovery algorithms [53]. The SM data from the International Soil Moisture Network (ISMN) were used to verify and precisely control the downscaling of the SM products. These stations were established in different regions of the study area. Table 2 shows some observation networks (Cosmic-ray Soil Moisture Observing System, COSMOS; Carbon Cycle and Other GHG gases in Sub-Sahara Africa, CARBOAFRICA. Dahra is a town in Senegal; Plate Boundary Observatory H2O network, PBO_H2O). Some of these network data are fused into the ISMN, and are freely available, and more detailed information can be found on the ISMN website (https:/ismn.geo.tuwien.ac.at/en, accessed on 25 August 2019) [54,55,56,57], which enables global verification of satellite imagery products. In this study, the five observatories used for verification were placed in the most significant countries based on the availability of data. The SM data from the ground observation sites were interpolated to a 1 km raster dataset for the purpose of downscaling for validation.
2.2.4. Vegetation Temperature Condition Index (VTCI)
The lower the VTCI value, the lower the soil moisture value (drier). In contrast, the higher the VTCI value, the higher the soil moisture value (wetter). Therefore, the VTCI was used as a scaling factor to enhance the quality of the SM products. Many variables, such as clouds, terrain, and land cover heterogeneity, might affect VTCI data performance [54,58,59]. The VTCI values were calculated following Equations (1)–(3) [54,58,59].
where and are the respective maximum and minimum LSTs of the pixels with values in a study region. is the LST of one pixel; and , and and denote the intercept and slope of the dry and wet edge equations, respectively. The value of VTCI ranges from 0 to 1.
2.2.5. Soil Moisture Time Series Method
The AMSR-E sensor was terminated in October 2011, and AMSR2 was launched in May 2012 as a follow-up to AMSR-E. Therefore, some SM products are discontinuous between October 2011 and May 2012. To obtain the long-term sequences of the SM data sets from AMSR series satellites (same descending and ascending times), we used SMOS to compensate for the missing data. To ensure the consistency of observation time and depth, we used the Time Series Reconstruction of Difference Decomposition (TSRDD) method to obtain the long-term sequence of SM data [60], which was utilized to eliminate the differences between different products, and the soil moisture data of the overlapping time of different soil moisture products were used to build a correction model, where W is defined as the selection window area of the overlapping time (Equations (4)–(6)) [60].
where is the SM reconstructed during the daytime in month y of year x, and represents the SM reconstructed at night in month y of year x. is the mean value in month y of year x. is the difference between day and night. represent the mean SM for the day and night, respectively. W is the selected year window size.
2.2.6. Downscaling
The Spatially Weighted Downscaling Model (SWDM) was used to downscale the SM data from a 25 km spatial resolution to a 1 km spatial resolution. The SWDM depends on the identification of a negative correlation between the SM products and the VTCI [61]. Based on this, monthly high spatial resolution (1 km) VTCI values were used to weight the SM data at a low spatial resolution (25 km) pixel by pixel. The weight was used to segment the SM product from 25 km into 1 km, and was estimated as follows in Equation (7) [60]:
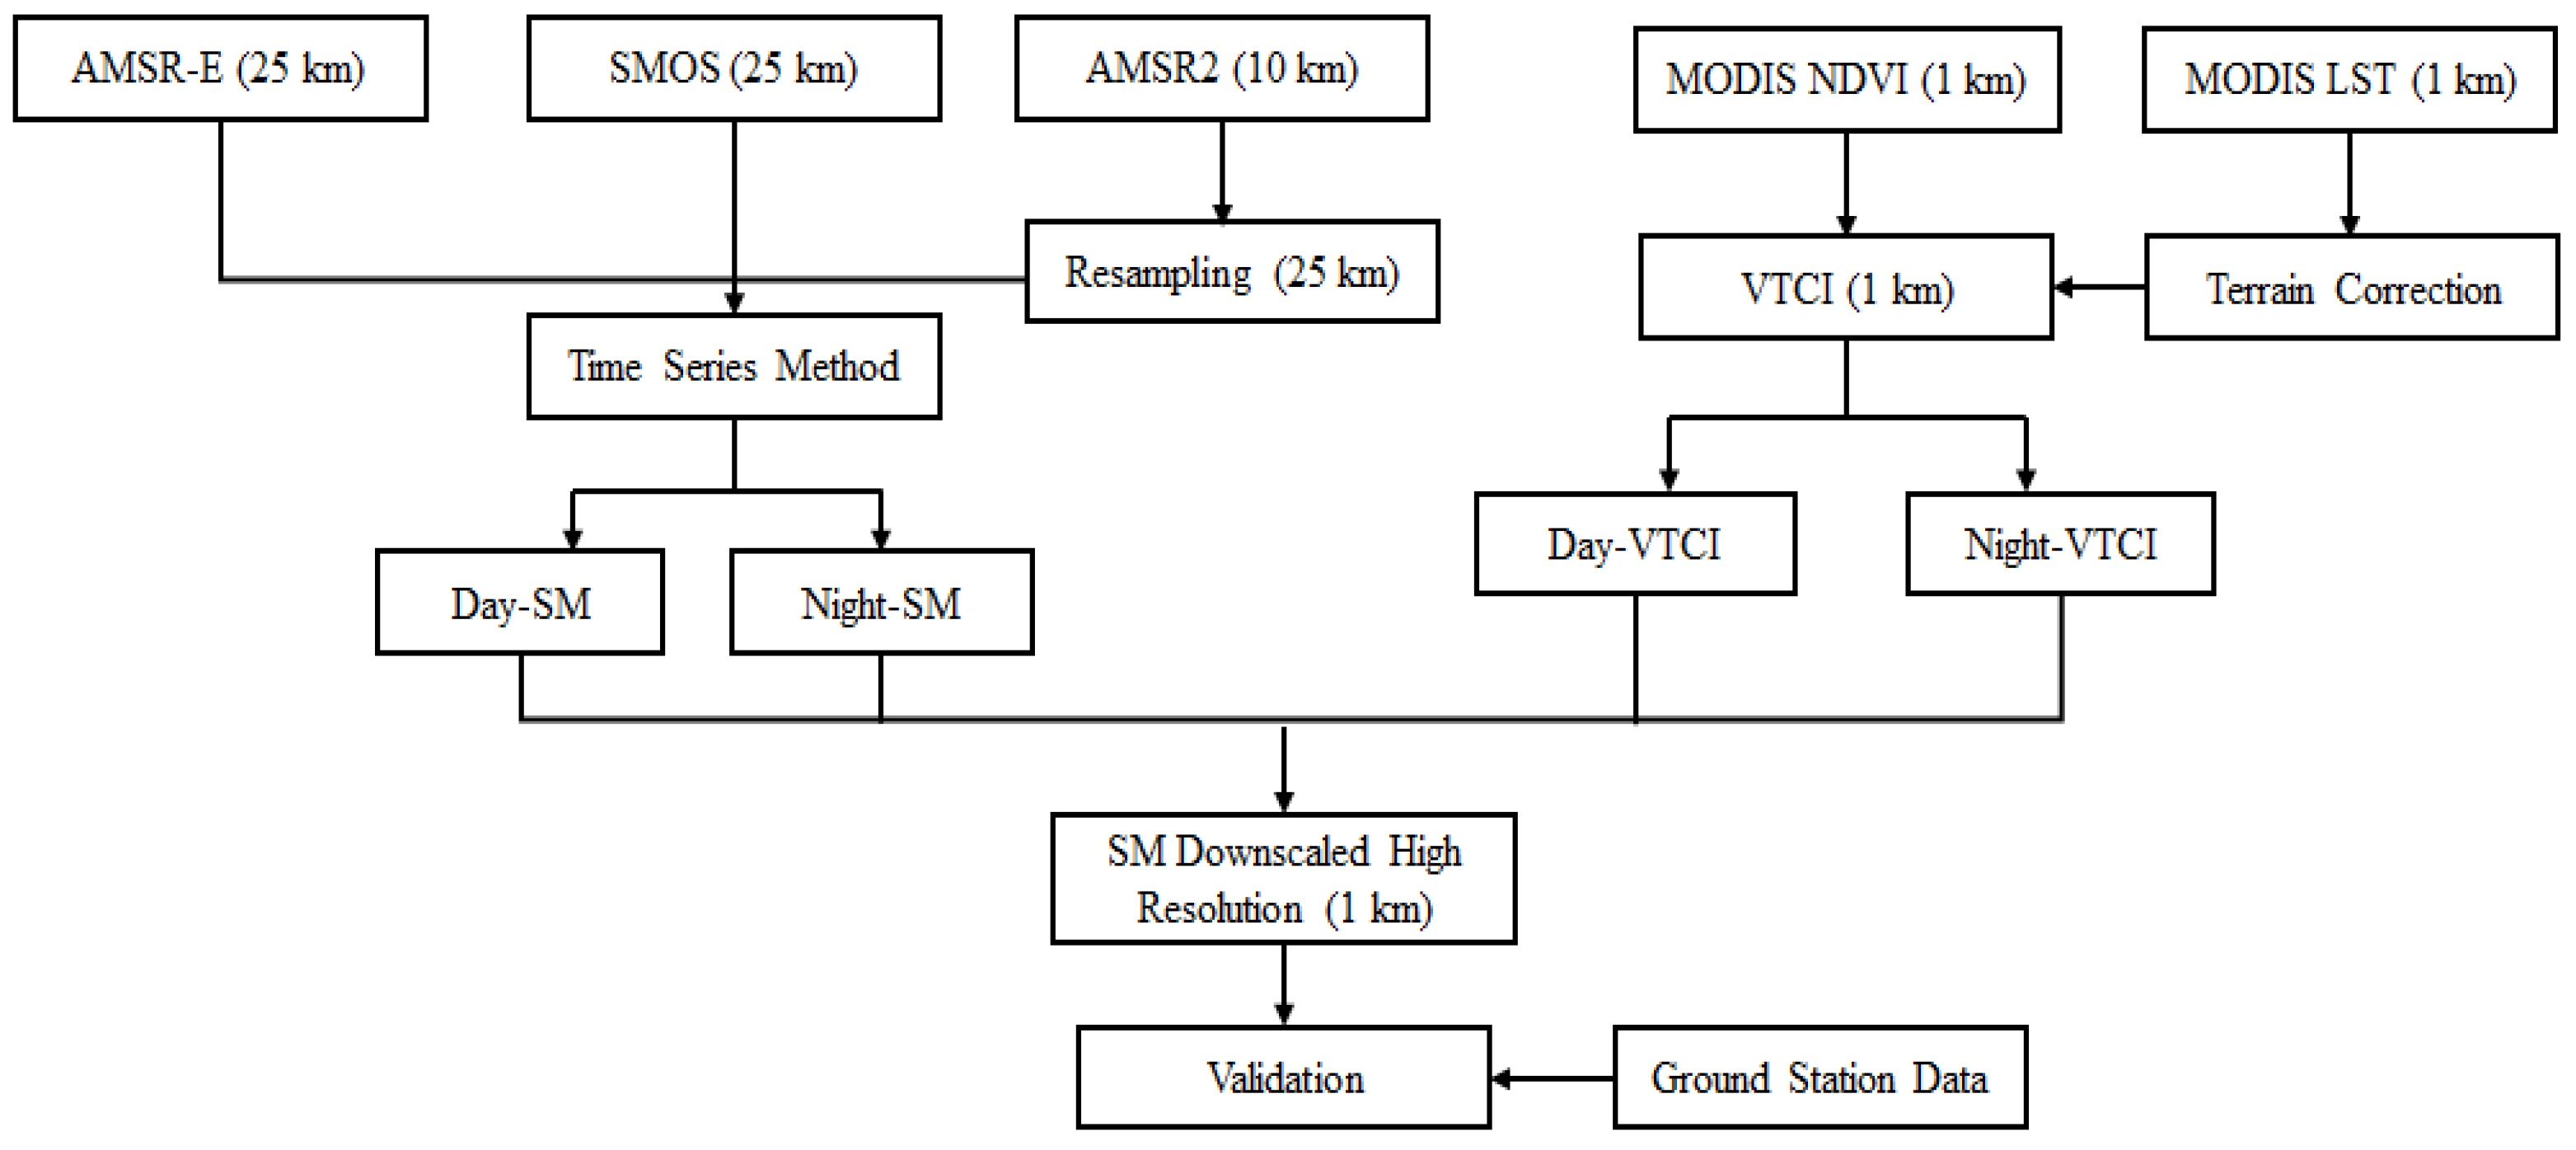
where is the downscaled SM at a spatial resolution of 1 km, is the original SM data obtained at a spatial resolution of 25 km, represents the VTCI pixel value that corresponds to the downscaled SM, and is the mean of all corresponding VTCI pixel values of the pixels. The downscaling process is shown in Figure 3. First, we resample different soil moisture products (AMSR-E, SMOS, AMSR2) to the same resolution, and then we use MODIS surface temperature products, and NDVI products to generate a drought index. Finally, we use the downscaling method to downscale the coarse-resolution soil moisture products after the consistency check.
2.2.7. Validation
The accuracy of the downscaled SM data was evaluated based on several statistical measures, such as the correlation coefficient (R) (Equation (8)), root mean square error (RMSE) (Equation (10)), and mean absolute error (MAE) (Equation (9)), in comparison with the ground SM data.
where is the correlation coefficient, is the downscaled data, is the original/ground data, x is the overall mean of the downscaled data, and is the average SM of n ground station data. RMSE is an indicator reflecting the bias in the mean and spatial variance. MAE denotes the error magnitude; low values imply excellent performance [62].
2.2.8. Time Series Trend Analysis of Soil Moisture
Soil moisture change trends were calculated using the slope and correlation coefficient (Equation (11)).
where k is the study period, j is the number of years (j = 1, 2, 3... u, where u = 15 in this paper), and xmj is the SM in year j. If the value of the slope reaches 0, the pattern does not change (P < 0.05). A positive slope means an increase in SM relative to the previous period. By contrast, if the slope is negative, SM decreases from the previous period. When the slope is 0, there is no change from the previous period. The significance of the trend was assessed using the F-test for each pixel at P < 0.05.
3. Results
3.1. Soil Mositure Time Series Verification
The most suitable time window (W) was chosen to ensure consistency of the data between different sensors and SMOS during the day- and night-time periods. The SM data were distributed in the study area, which met the basic criteria for the analysis of the correlation between the simulated, corrected, and original values. The relationship between the corrected variables and descriptive variables (original value) varied significantly for different window sizes (w). The validation statistics for TSRDD are presented in Table 3. For the average day and night times, the indices were best matched when w was 6: the RMSE, MAE, and R were 0.0105 m3/m3, 0.0115 m3/m3, and 0.91, respectively. Therefore, the six-pixel sliding window was the most suitable for correcting and decomposing SM data from daily SMOS.
3.2. Verification of the Downscaled
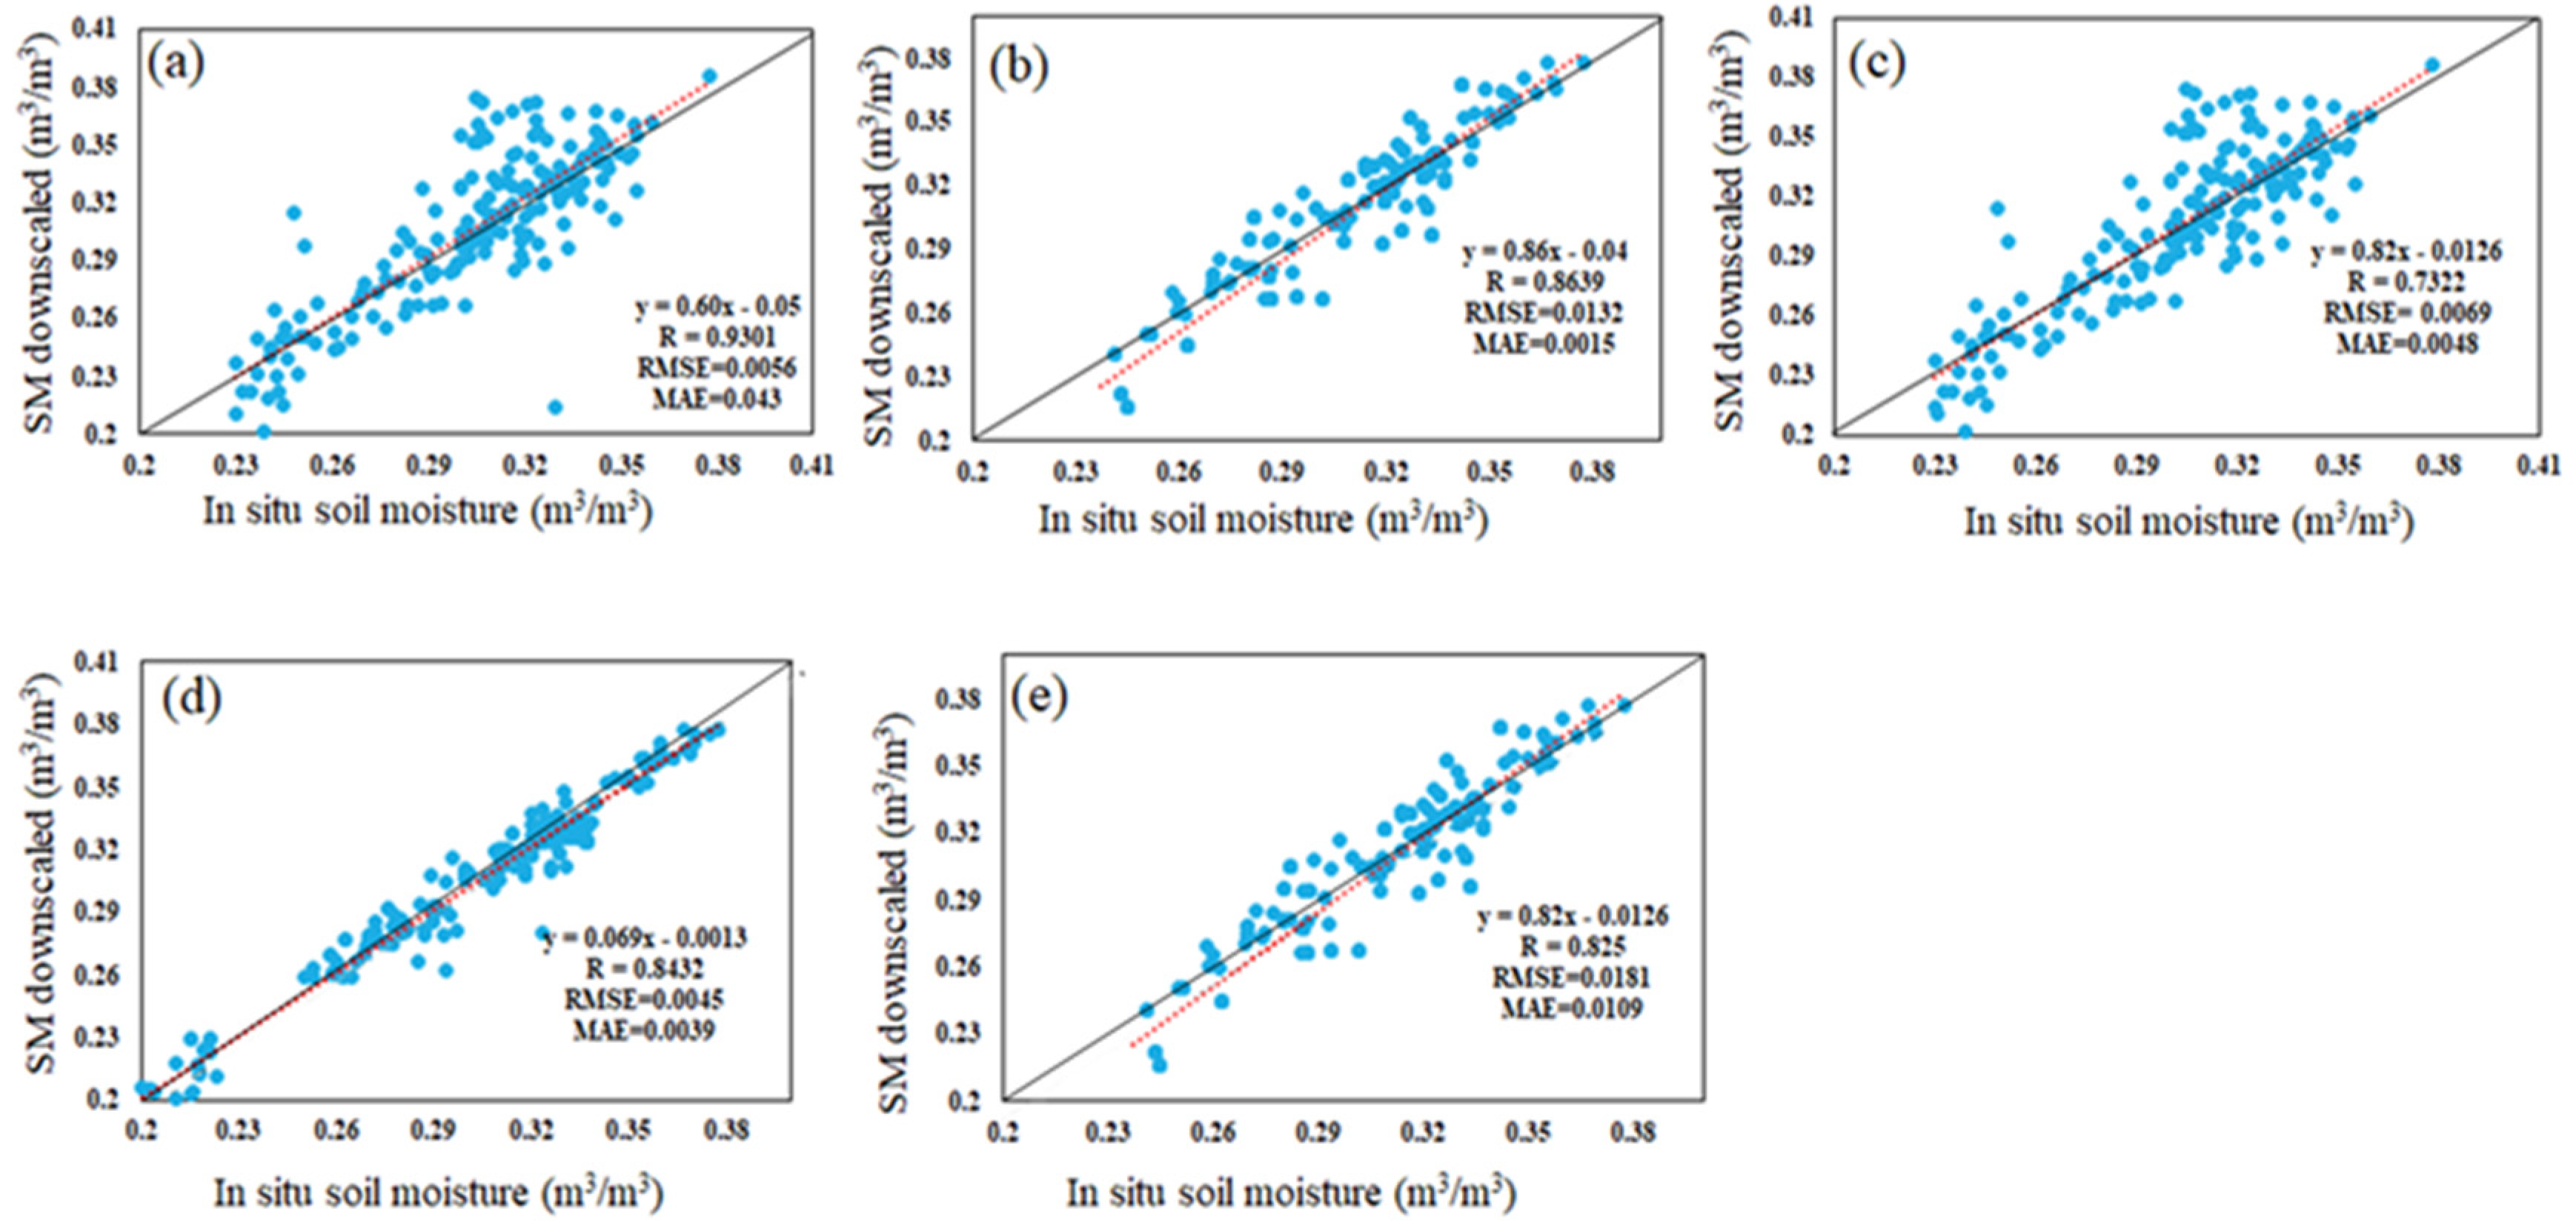
The SM data from the ISMN were used to test the quality of the downscaled results for different regions. The R values ranged from 0.73 to 0.93 for all five countries (Kenya, Namibia, Sudan, Senegal, and South Africa), with an average of 0.836 (Figure 4). The RMSE ranged from 0.0045 to 0.0181 m3/m3, with an average of 0.0096 m3/m3. The MAE varied between 0.0015 and 0.0109 m3/m3, with an average of 0.0051 m3/m3. In addition, we further evaluated the data on a seasonal scale, and the evaluation results (RMSE) are shown in Table 4. Spring had the maximum average RMSE of 0.0612 m3/m3, followed by summer with a value of 0.0085 m3/m3.
The distribution of RMSE on the seasonal scale differed considerably between the regions in the east and west. For all stations located in the same locations (i.e., Sudan in region I, and Kenya in region IV), the maximum RMSE values were observed in summer, whereas the highest values for most sites in region V were observed in the spring months (Table 4). The downscaled products showed high SM in the wet season, as expected. The comparative results suggested that the mean RMSE for the eastern area between ground-based observation data and SM data during the four seasons was lower than that observed for South Africa and Kenya (means of 0.0312 m3/m3 and 0.0255 m3/m3, respectively). In region IV, the spatial heterogeneity of climate change, which is dependent on large-scale West Indian Ocean pressure systems and neighboring landmasses, may be the reason for such heterogeneity. The validation results showed that the new high-resolution soil moisture dataset is reliable.
3.3. Average Soil Mositure Analysis
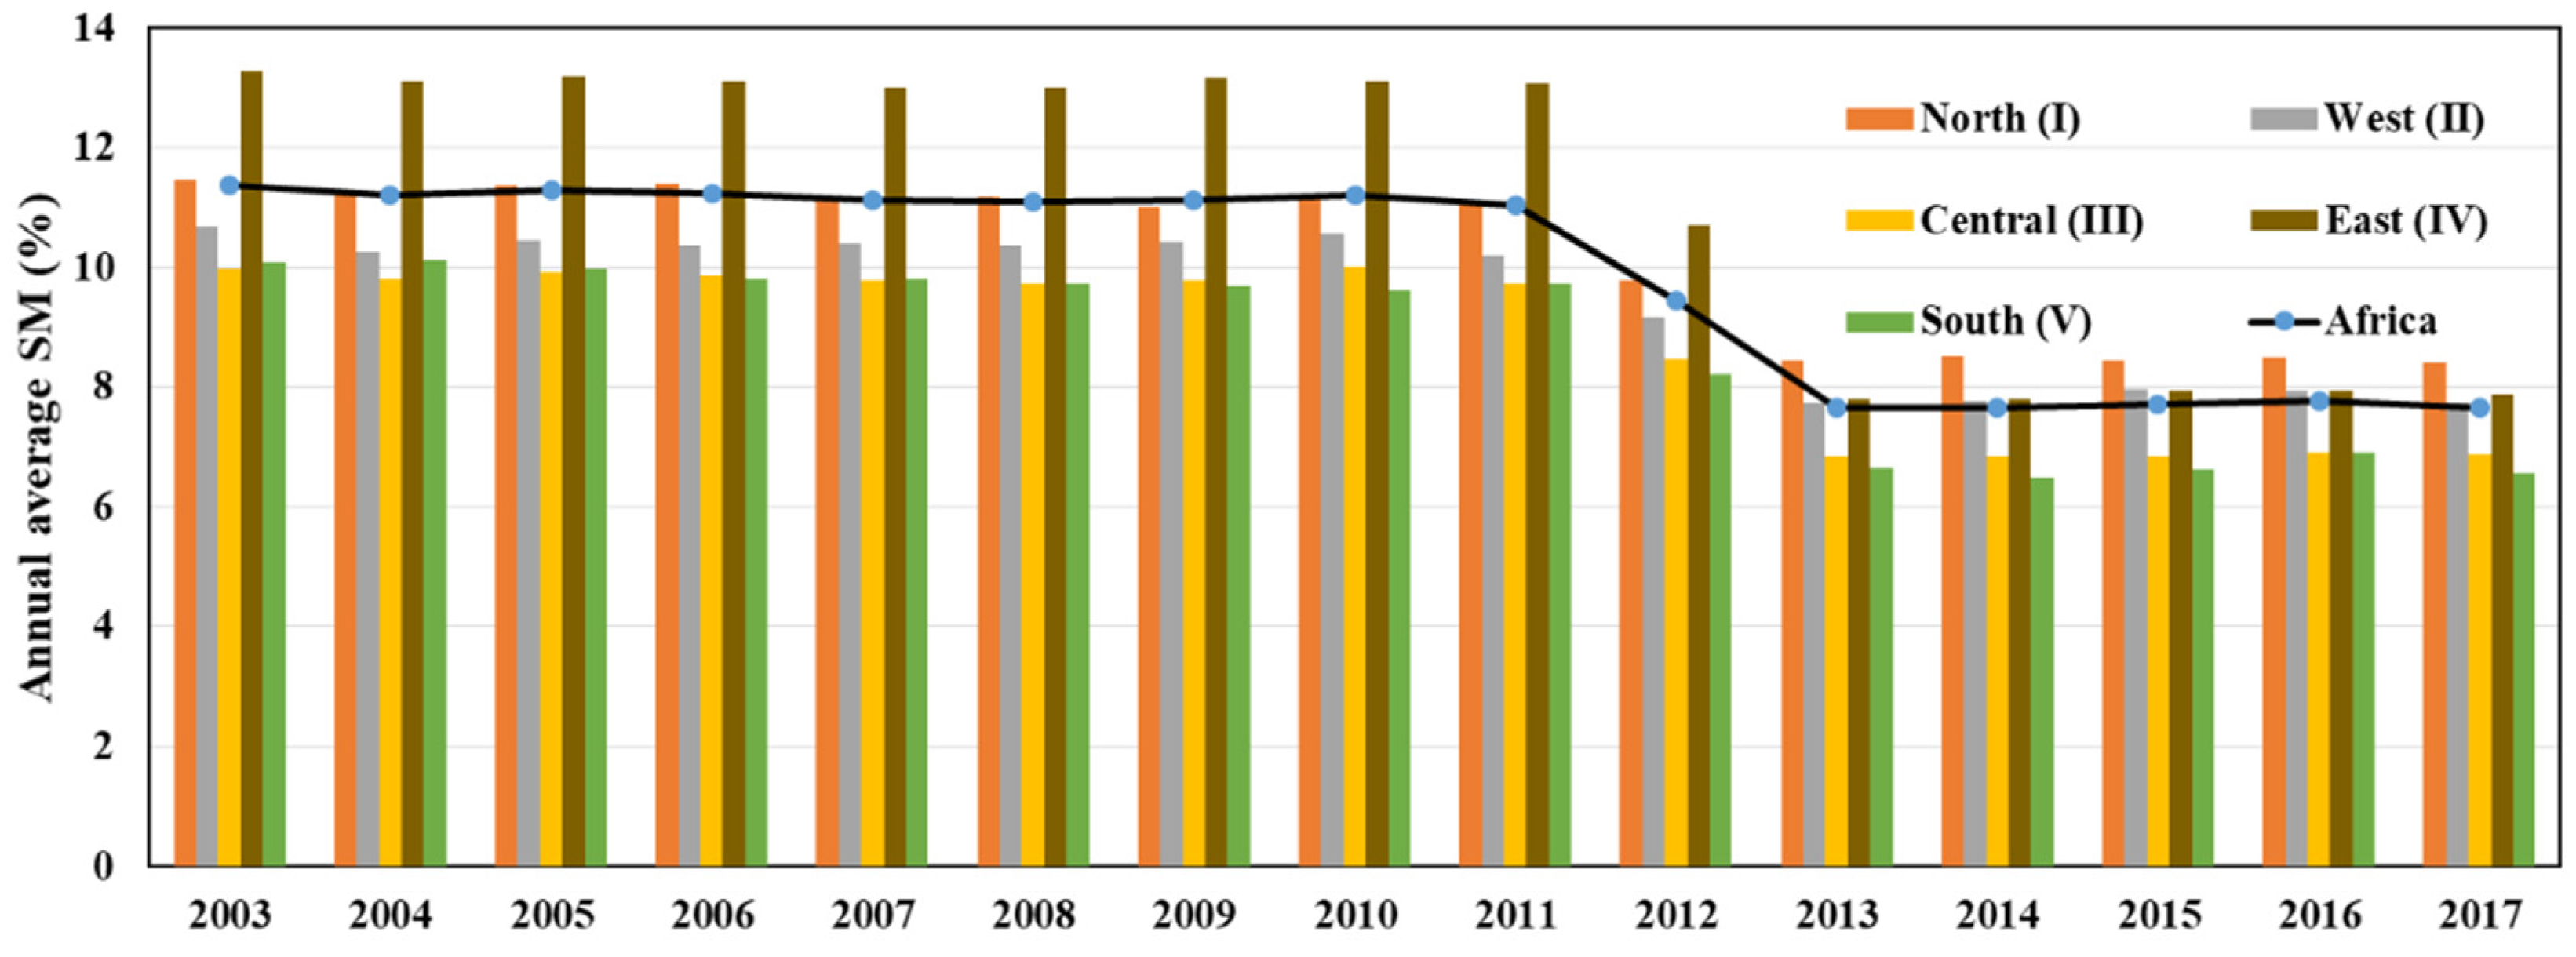
The spatiotemporal changes in SM in Africa were investigated to analyze the annual changes in different subregions of Africa during the 2003–2017 period. Figure 5 indicates that the average SM content was approximately 10.09%, exhibiting a decreasing trend over the last 15 years.
From 2003–2011, there were slight fluctuations, but after 2012, the values decreased sharply. In addition, SM was higher in 2003 (11.77%) and lower in 2017 (7.66%). The annual average SM content of each subregion indicated that during the previous 15 years, the SM values in the eastern region were much higher than those recorded in the other regions (on average 11.70%). This result explains the agricultural drought events that affected the eastern region from 2008 to 2010, during which more than 12 million people were affected [63]. The significant decline in this region shows that it was strongly affected by ENSO (La Niña) [64]. Additionally, some studies have stated that precipitation declined in the eastern region, especially in the horn of Africa [65,66,67]. Generally, the cumulative annual precipitation has a strong effect on the SM content, including climate and hydrological systems.
In the northern region, the values from 2003–2011 were consistent with the average SM over the entire African continent, and the values recorded from 2011–2013 exceeded the average. The central region (rainforest zone) ranked second, with an average SM of 10.17%, followed by the northern desert region, the western region, and the southern region, with averages of 9.63%, 9.52%, and 8.33%, respectively.
3.3.1. Annual Change Analysis
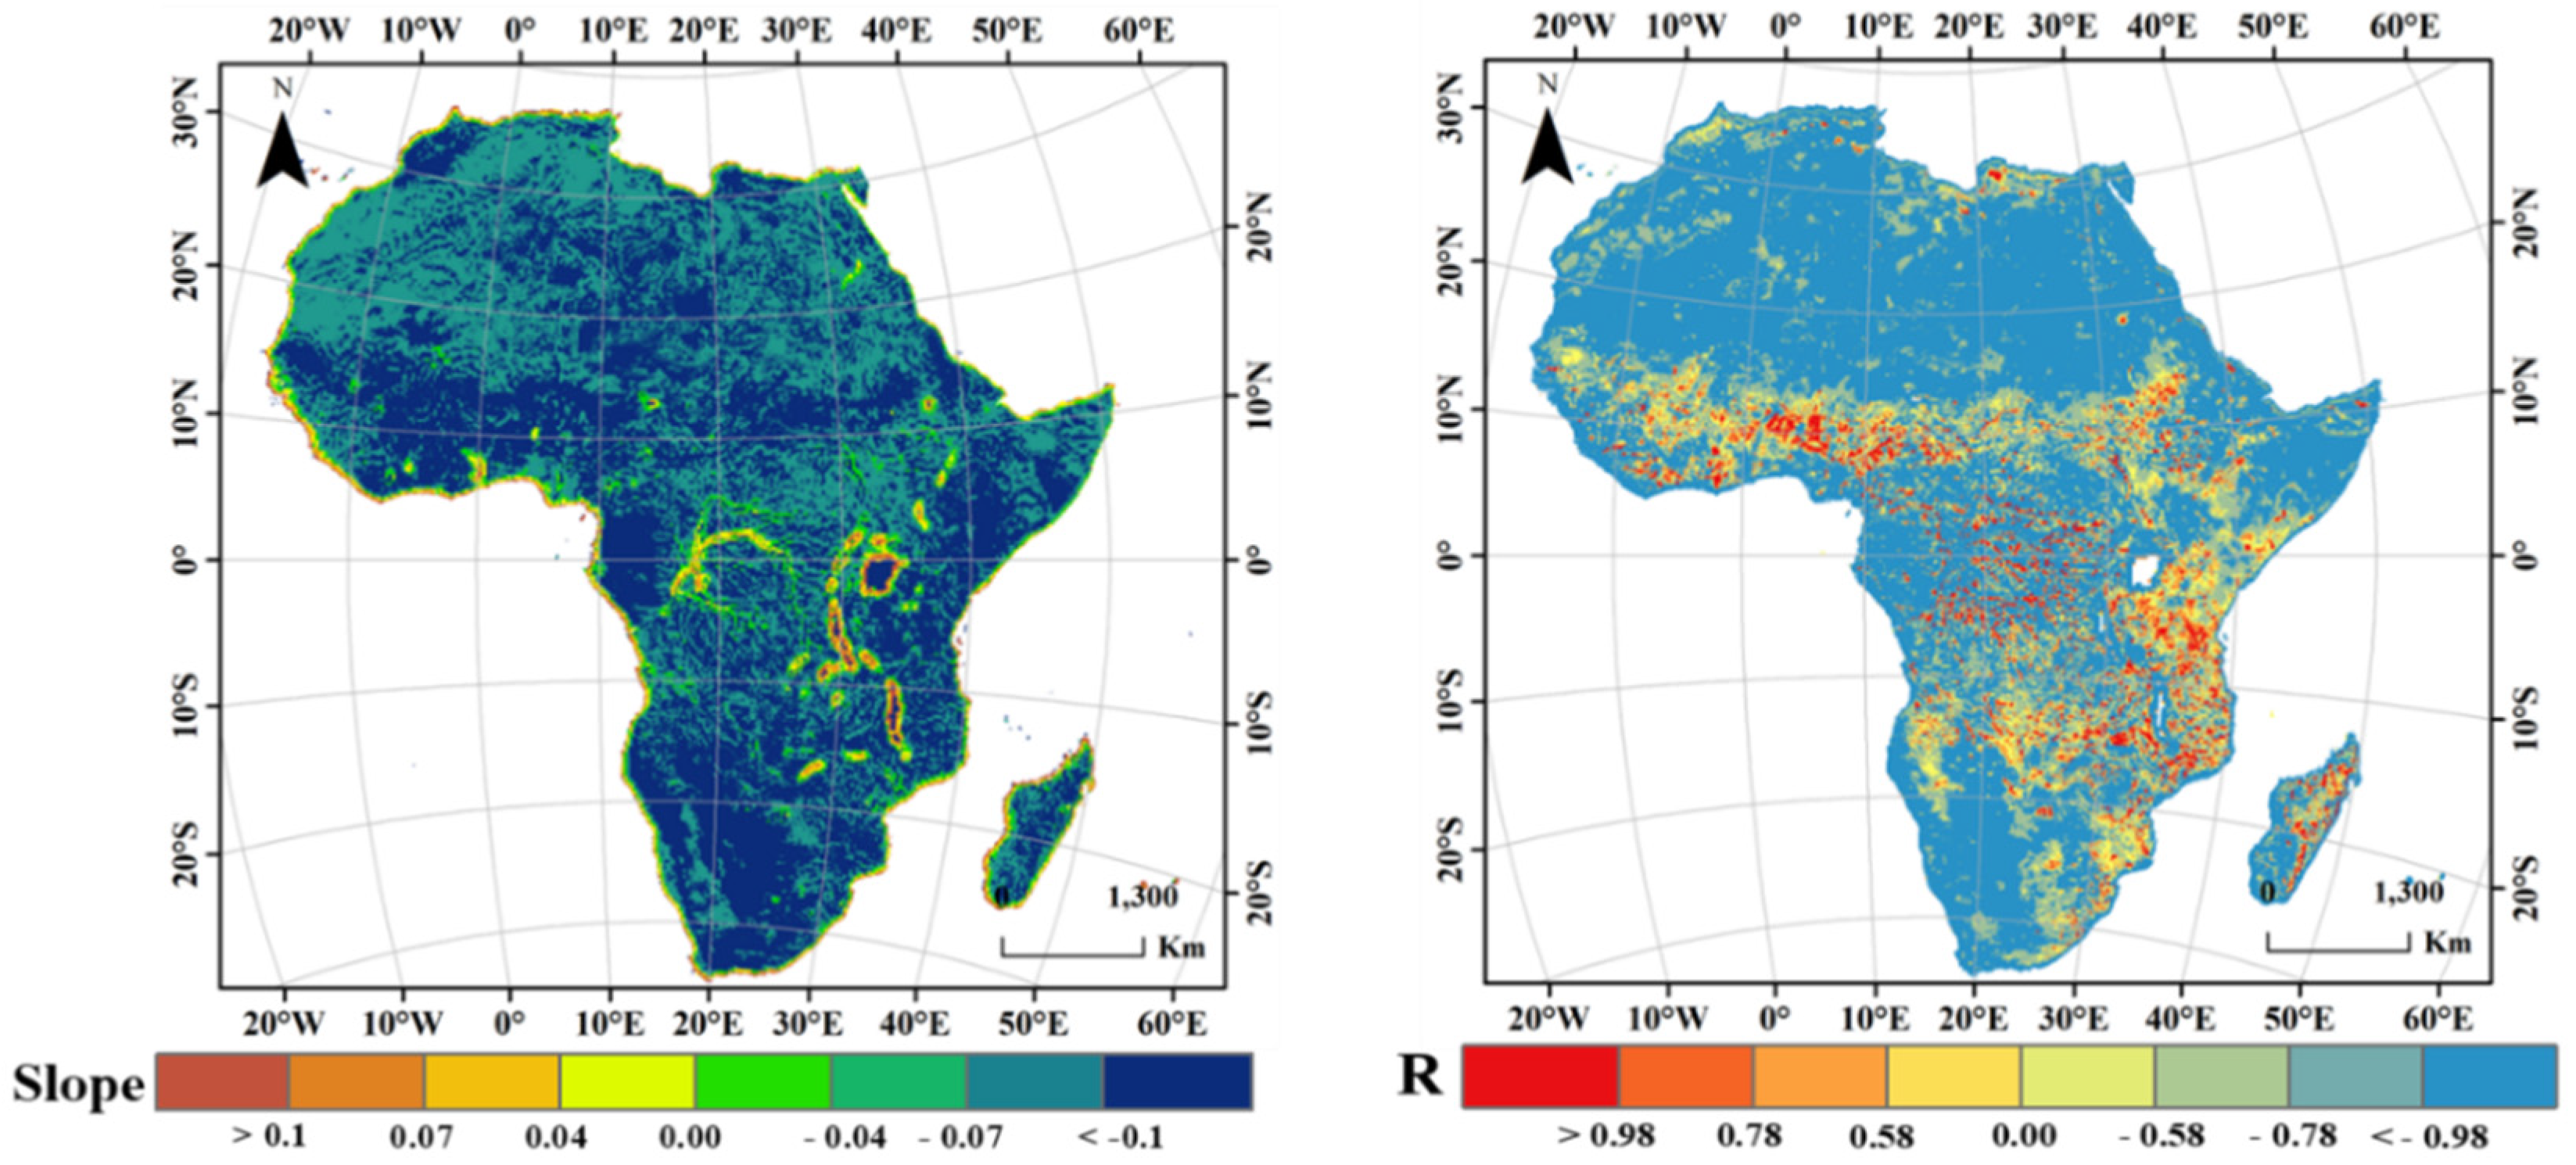
In general, agricultural drought is characterized by a deficiency in SM. To understand the overall SM variation across the African continent from 2003 to 2017, we applied Equation (11), as shown in Figure 6. The areas with significantly reduced soil moisture (slope < −0.08 m3 m−3 and P < 0.001) were mainly in the savanna region. The decreasing trend over savanna and green land may be due to the degradation of grassland and rainforest in these regions [68]. A relatively distinct significantly decreasing trend (slope < −0.07 m3 m−3) can be observed in the north, the open areas west of the Atlas Mountains and Ethiopian Highlands situated in the Horn of Africa, Congo, and the desert area in southern Africa (Namibia). Moreover, the largest dryland between a highland plateau and the Atlantic Ocean is Namibia. The annual average of precipitation over Namibia is characterized by low and non-homogenous distribution. Typically, in desert regions, precipitation is the main source of decline in SM [69]. Decreased soil moisture leads to drought, which further causes a substantial reduction in crop yields, which has a great impact on southern African countries, such as Zimbabwe, Mozambique, and Zambia.
The SM contents increased significantly in the coastal regions close to the Indian Ocean, the Mediterranean Sea, the Red Sea, and the area close to Lake Victoria in Africa. The main reason for this is the change in rainfall during the dry season in Africa due to the influence of the ENSO phenomenon [70,71]. ENSO has a substantial impact on weather factors, and contributes to drought (soil moisture) throughout the world [72], which often affects agricultural droughts in South Africa [73].
3.3.2. The Characteristics of the Seasonal Trend
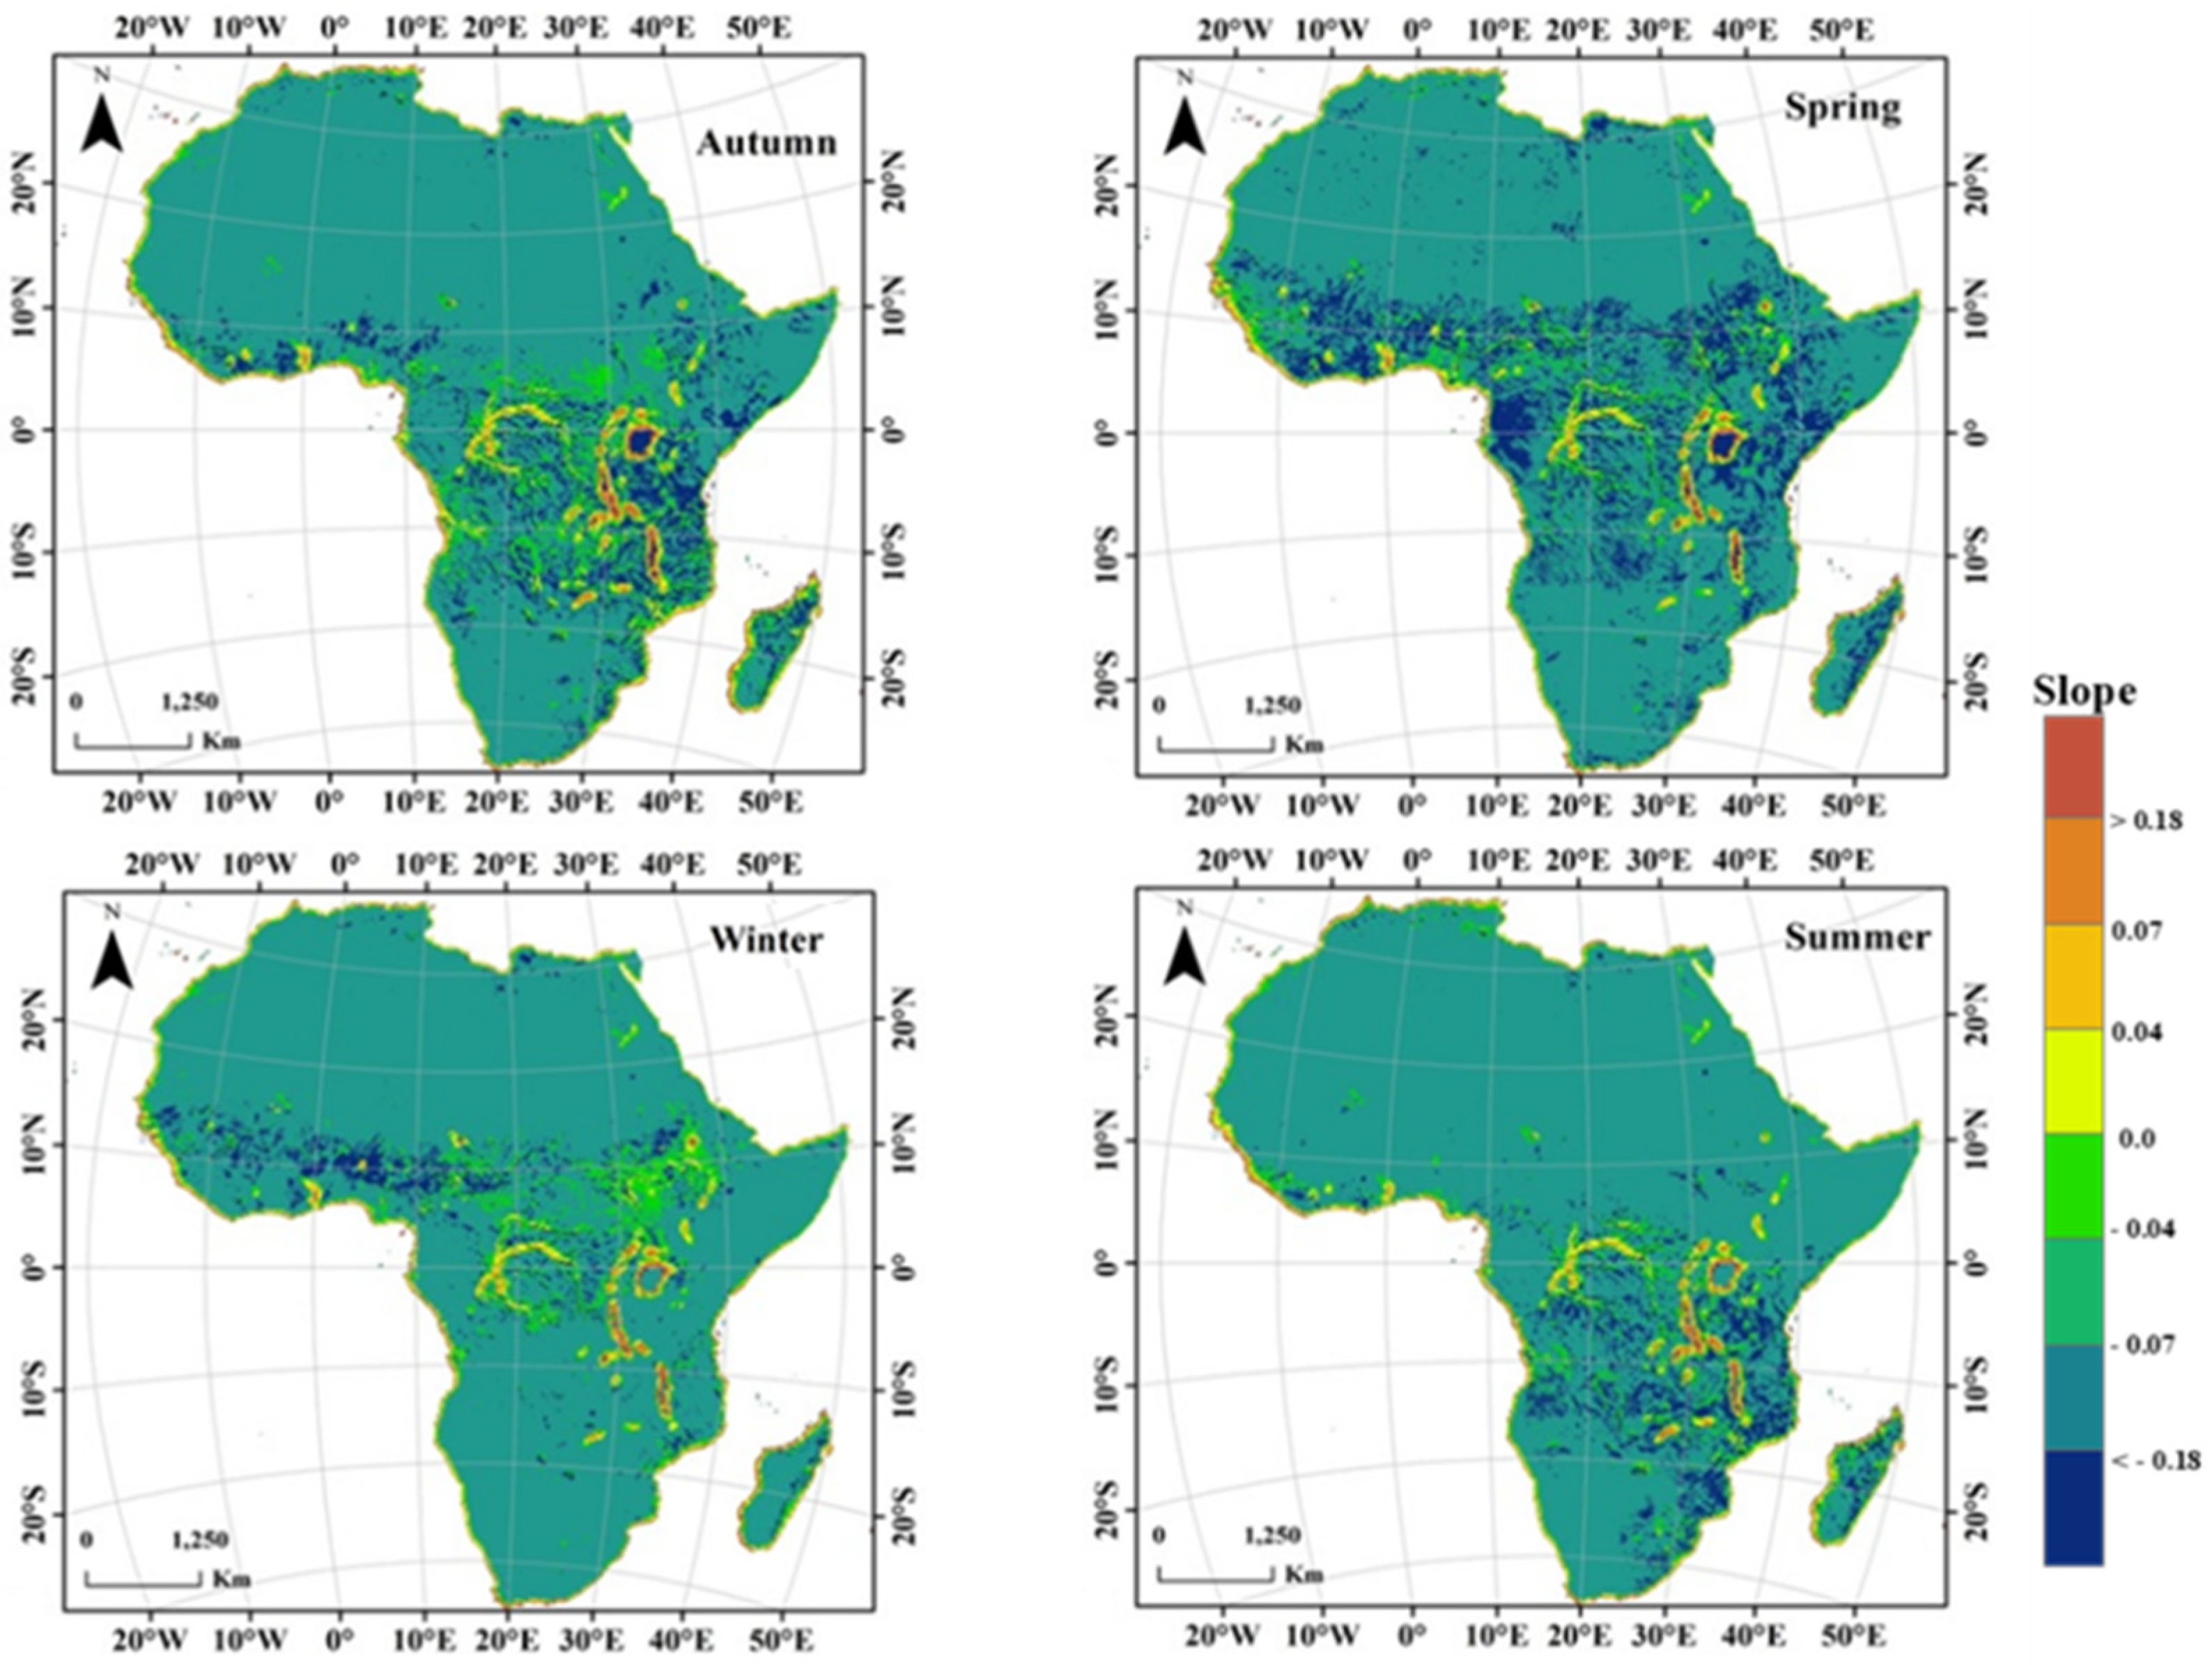
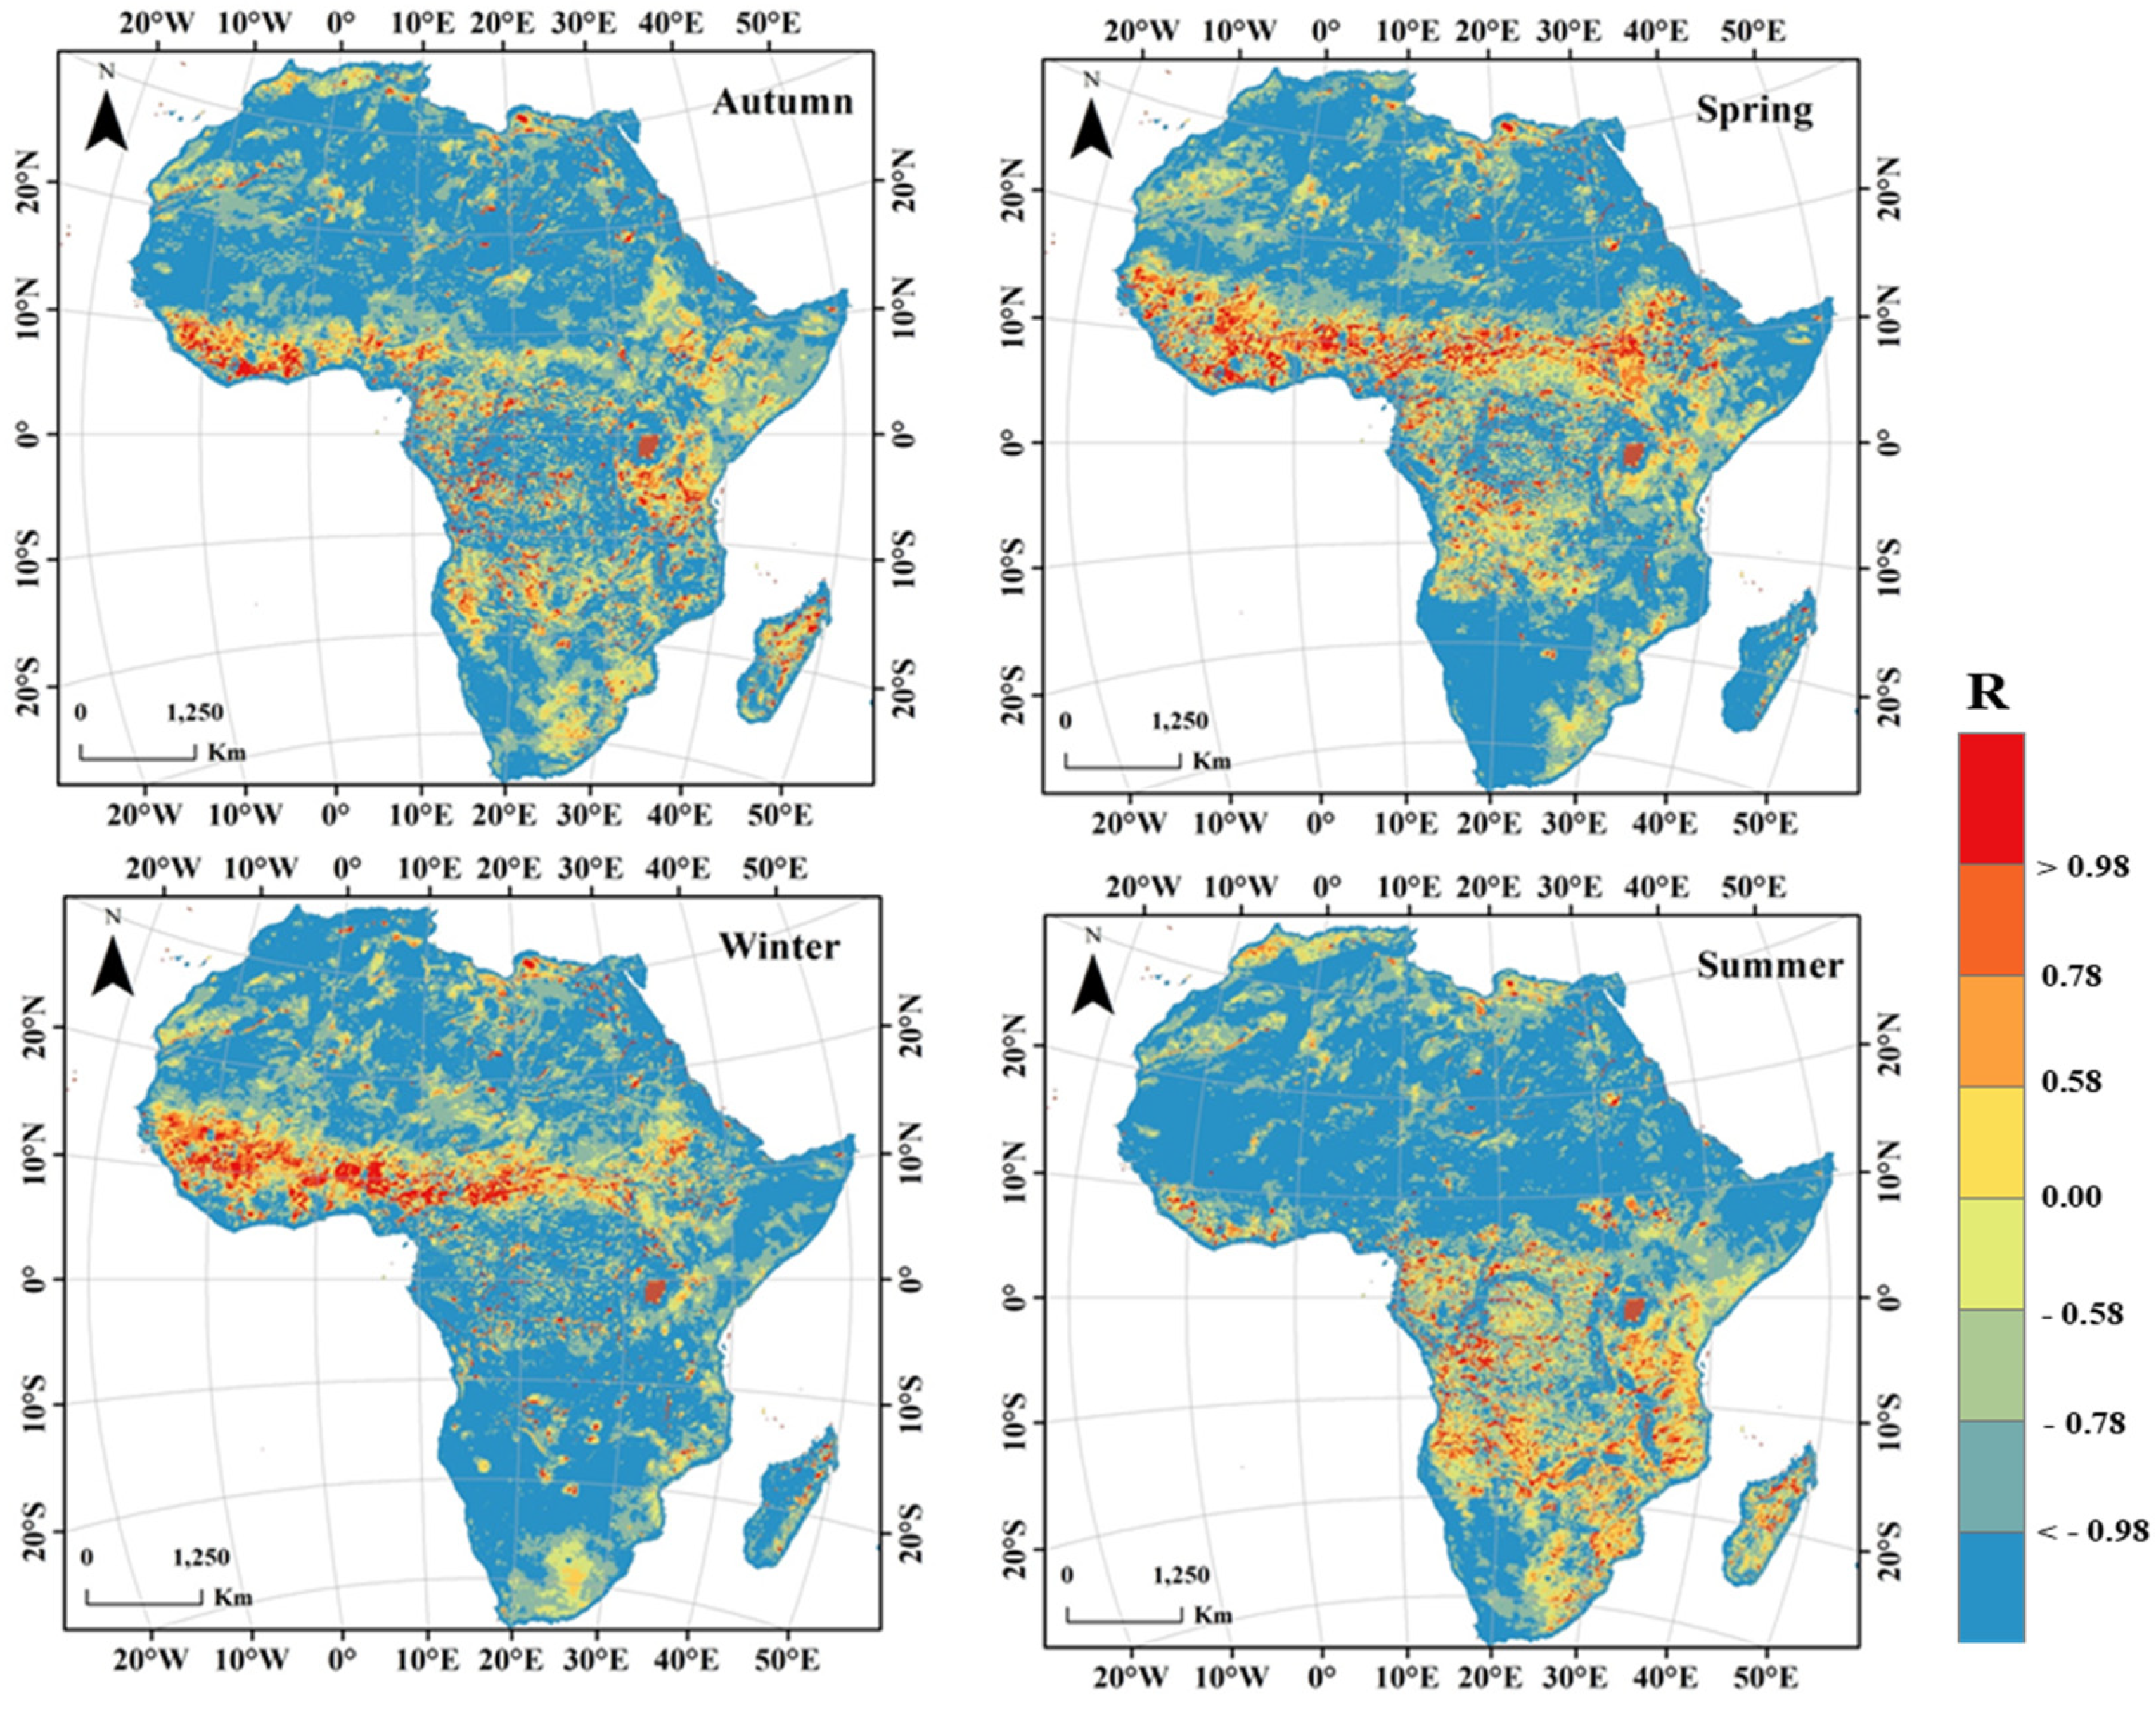
To further investigate the details of SM changes over the past 15 years across Africa, seasonal SM trends were analyzed (Figure 7, Figure 8 and Figure S2). In the spring, the rate of the significant increase in SM was relatively high, except in some areas of region IV, the areas close to Lake Victoria, and the Ethiopian highland (P-value ranged from 0.05 to >0.18). In central Africa, more than 93.2% of the region showed different decreasing trends, especially in Gabon, where the value of the slope was less than −0.07 m3 m−3 (R < −0.58, and P < 0.001). Another significant severe decline occurred in the savanna zone, especially in southern Sudan and Nigeria (slope < −0.7 m3 m−3, R < −0.78, and P-value from <0.001 to <0.01). In summer, the distribution of SM changes in the five subregions was obvious, and a sizeable significant change in the trends occurred in southeastern Tanzania, where the slope was higher than 0.06 (R > 0.76). The summer soil moisture changes in the Sahel are mainly affected by the El Niño event and rainfall [74]. Another reason may be that the temperature in these areas is increasing, which leads to increased evaporation [75,76].
In southern Africa, the SM trend significantly decreased in Malawi and Madagascar (slope < −0.07 m3 m−3, R < −0.78, and P < 0.001). Generally, given the substantial interannual changes in temperature and seasonal rainfall, the area under the influence of the monsoon in the east changed considerably. From summer to winter, the range of the SM fluctuation in the southern African monsoon region (Malawi and Zambia) increased significantly. The SM in the Sahara zone located in regions I and II (Ghana and Togo) showed an extreme downward trend in autumn (slopes less than −0.08 (R< −0.78). The Sahelian region is more vulnerable than other Africa regions to the effects of tropical and ocean weather conditions (Atlantic and tropical Pacific) [77,78]. There was also a significant downward trend in the Republic of Congo, which is bordered by the central region rainforest, and the southern monsoon region (slope < −0.07 m3 m−3, R < −0.58, and P < 0.001).
The change in soil moisture in summer and winter was obvious, mainly due to the imbalance of evaporation caused by rainfall and high temperature, which causes great differences in seasonal and spatial changes in soil moisture. Compared to other seasons, highly significant (P < 0.001) changes in SM were recorded in winter. The decline occurred mainly in savanna zones, such as Nigeria, Burkina Faso, and southern Sudan. Furthermore, rainfall anomalies, including flooding events, were observed in these regions, which have negative effects on agricultural production. Ground runoff appears to be the principal reason for the low infiltration rates and increased evaporation trend in cropland areas [79], which has a strong effect on the growing season.
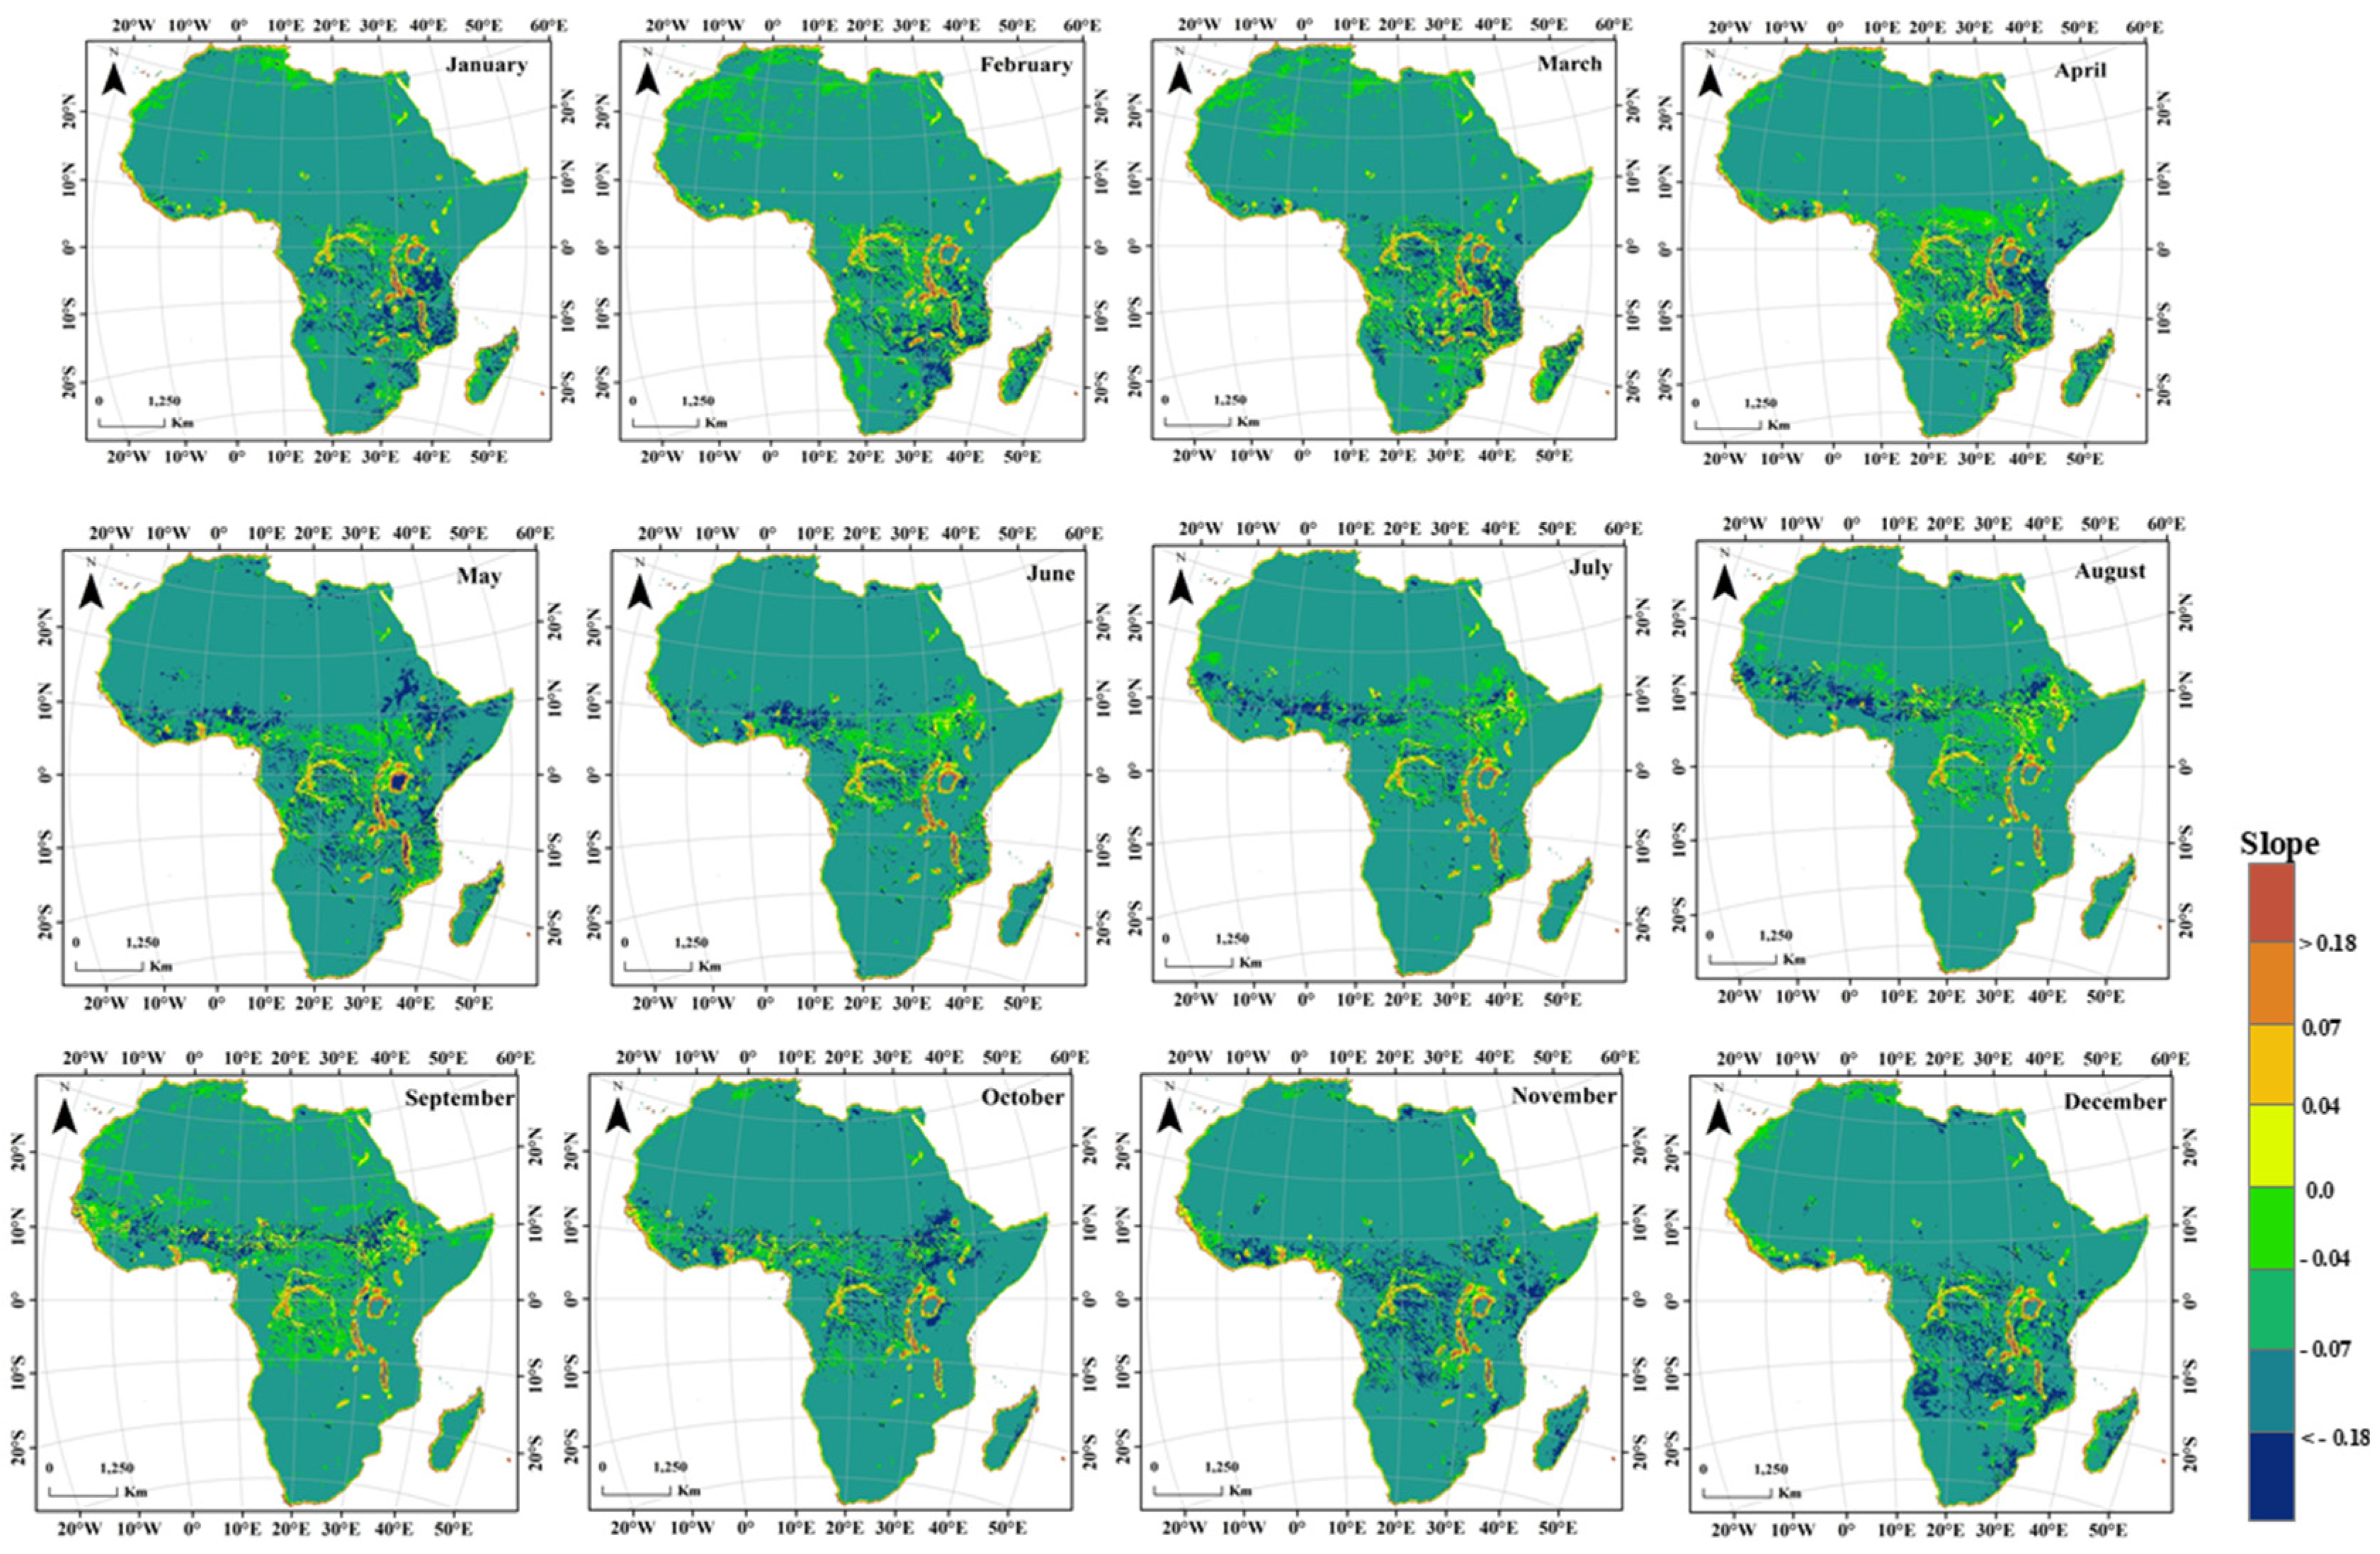
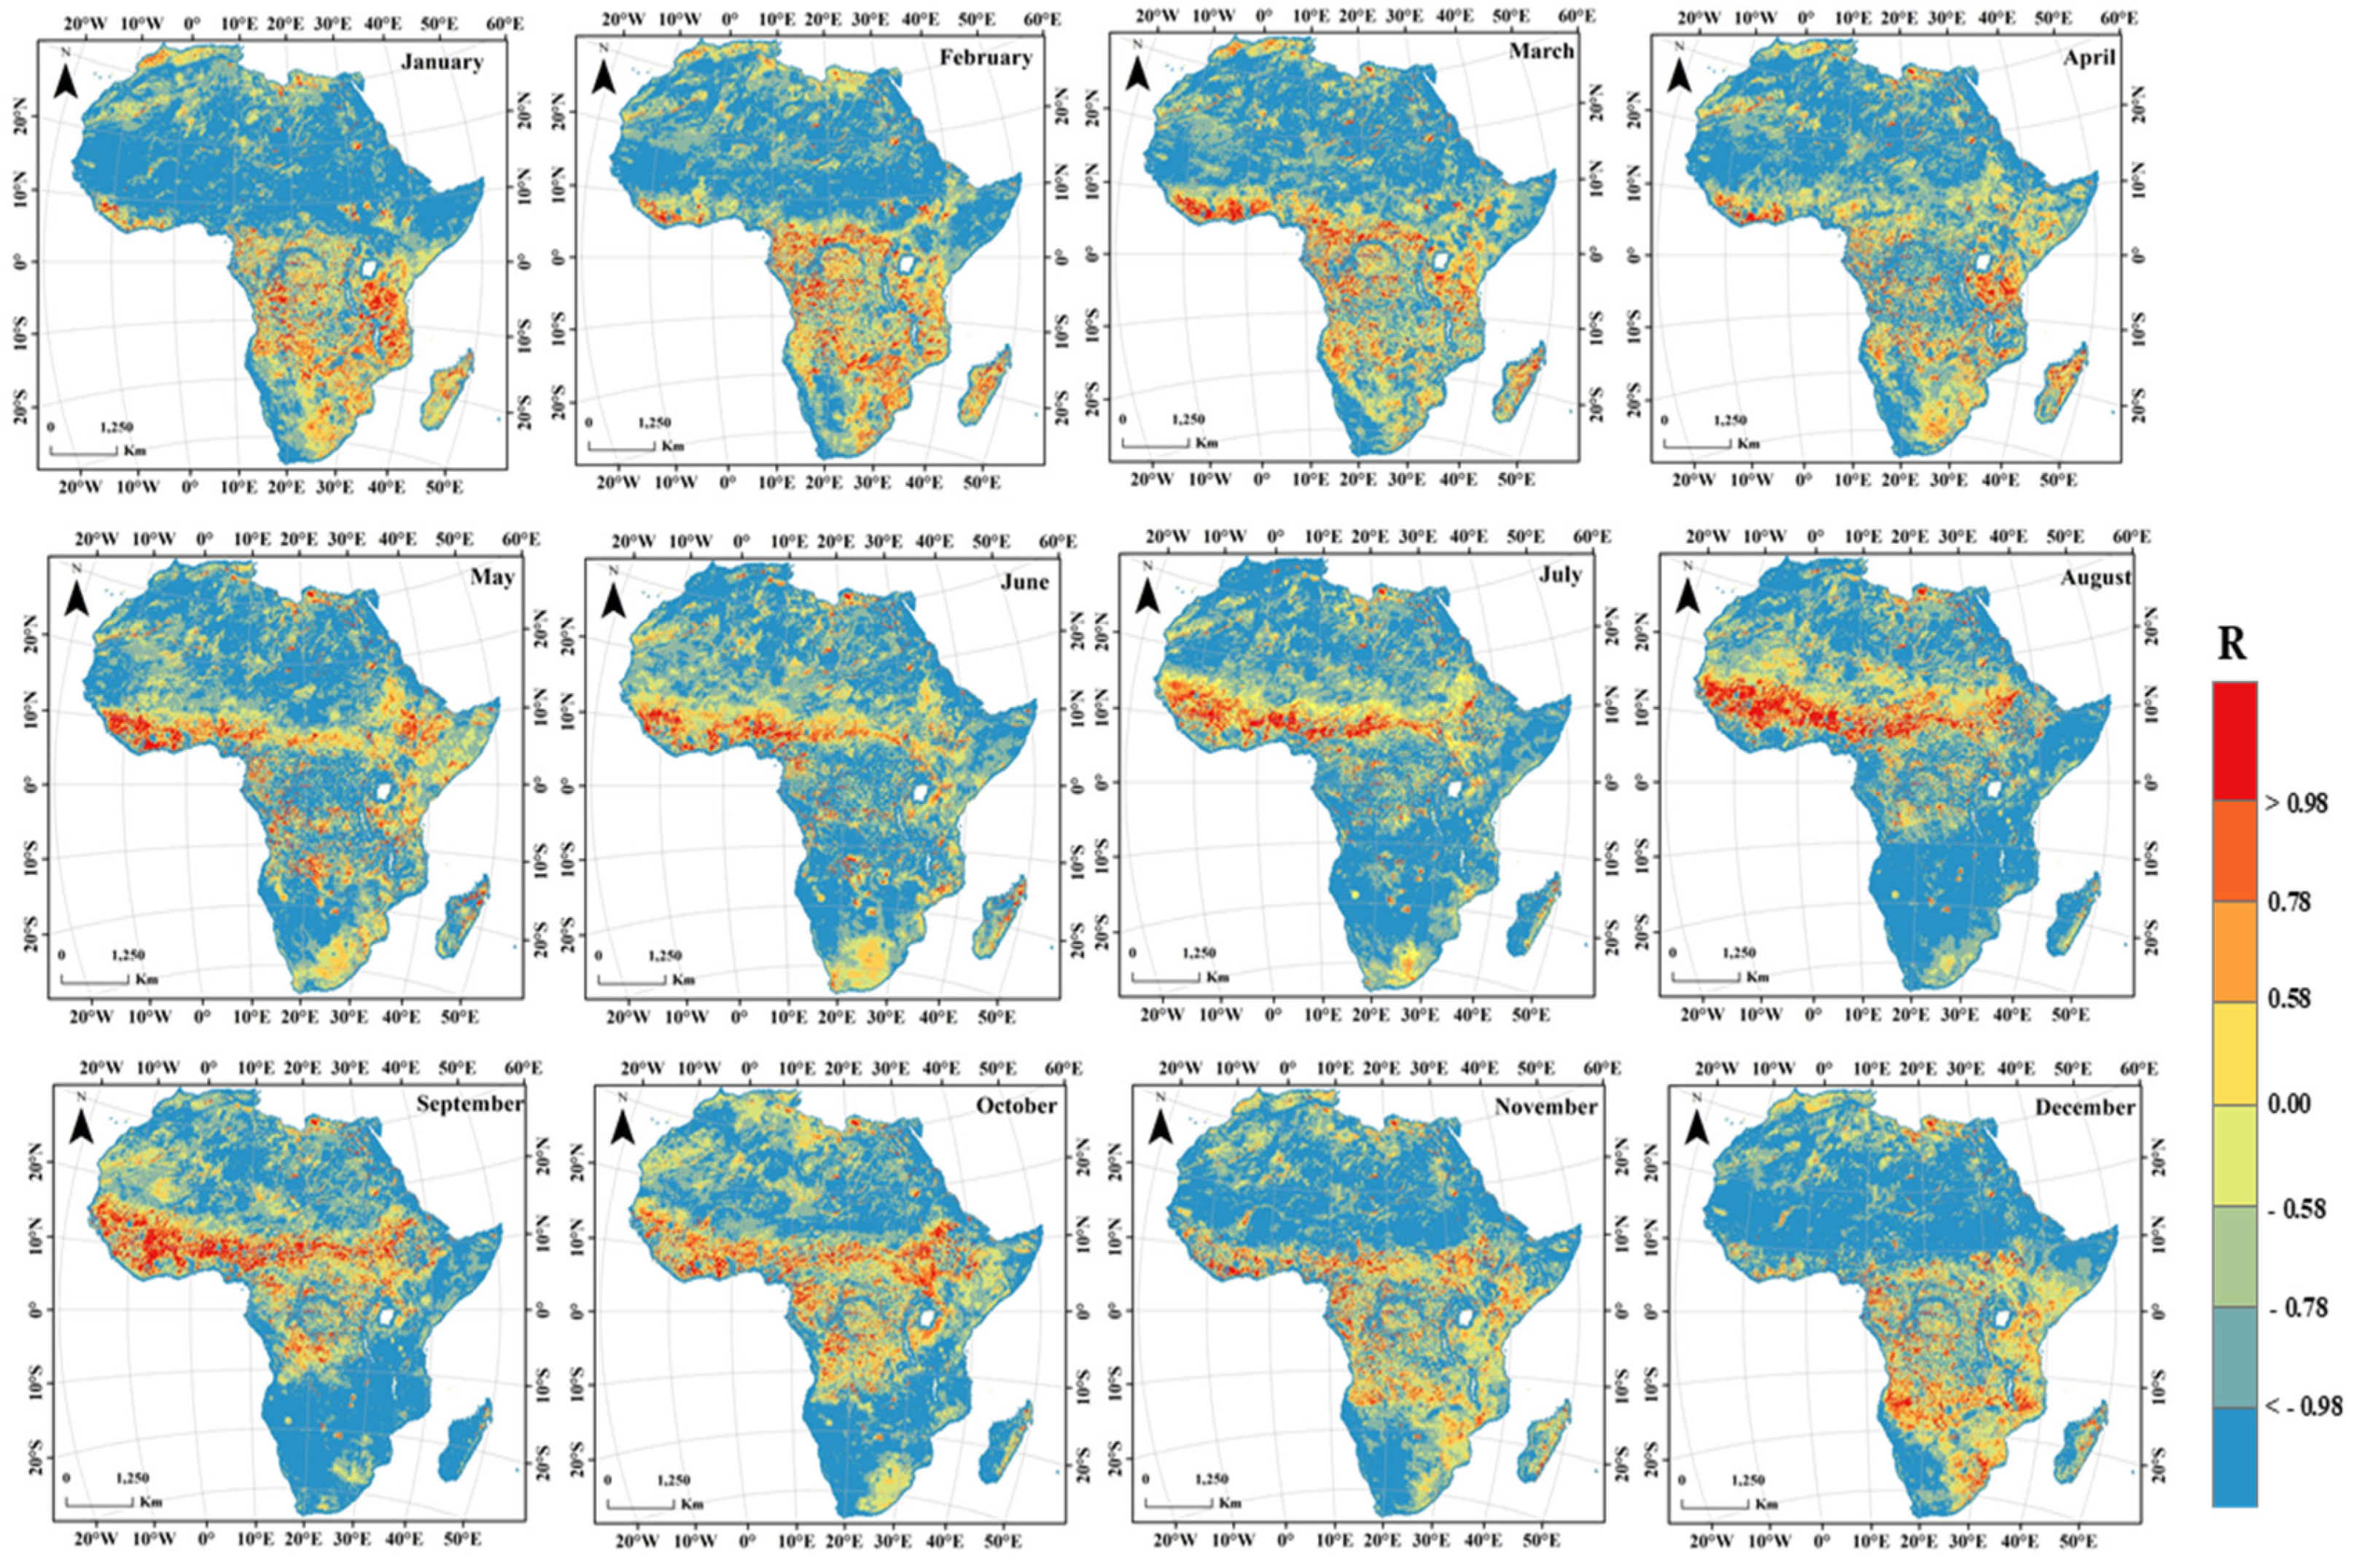
3.3.3. Soil Moisture Time Series Trend at Monthly Scale
To understand the temporal and spatial changes in soil moisture on a monthly scale in more detail, we performed further analysis of the SM data on a monthly scale. As shown in Figure 9 and Figure 10 (significant trends as in Figure S3), the Sahel belt and desert zones in the northern, southern, and Horn of Africa regions experienced the most significant decreasing trends (slope < −0.07 m3 m−3, R < −0.78, and P < 0.001) due to an increased warming trend in March, April, and May. It can be seen from the trend map that in May, the SM content dropped significantly (slope < −0.07 m3 m−3, R< −0.57, and P < 0.001), accounting for 76.45% of the total area. Relatively significant decreasing trends (slope < −0.06 m3 m−3, R < −0.7, and P < 0.001) occurred in Nigeria and Ghana. In June, the area in which the soil moisture increased accounted for 7.3% of the total area of Africa, and it was most obvious in the Sahel zone (slope > 0.07 m3 m−3 and P < 0.001); the significance values ranged from <0.001 to <0.01 (growing season). In September, there was a relatively significant (P < 0.001) downward trend, accounting for 86.4% of the total area, and this trend continued until November. These results are suitable for interpreting the decreased annual precipitation trend during the rainy season over Africa [30]. The cause of agricultural drought is a regular meteorological drought, which has a direct effect on the SM trend. This means that the reduction in rainfall and water stored in the soil is the main driving force that reduces crop yield [30].
3.4. Correlation of SM with Climate and Non-Climate Factors
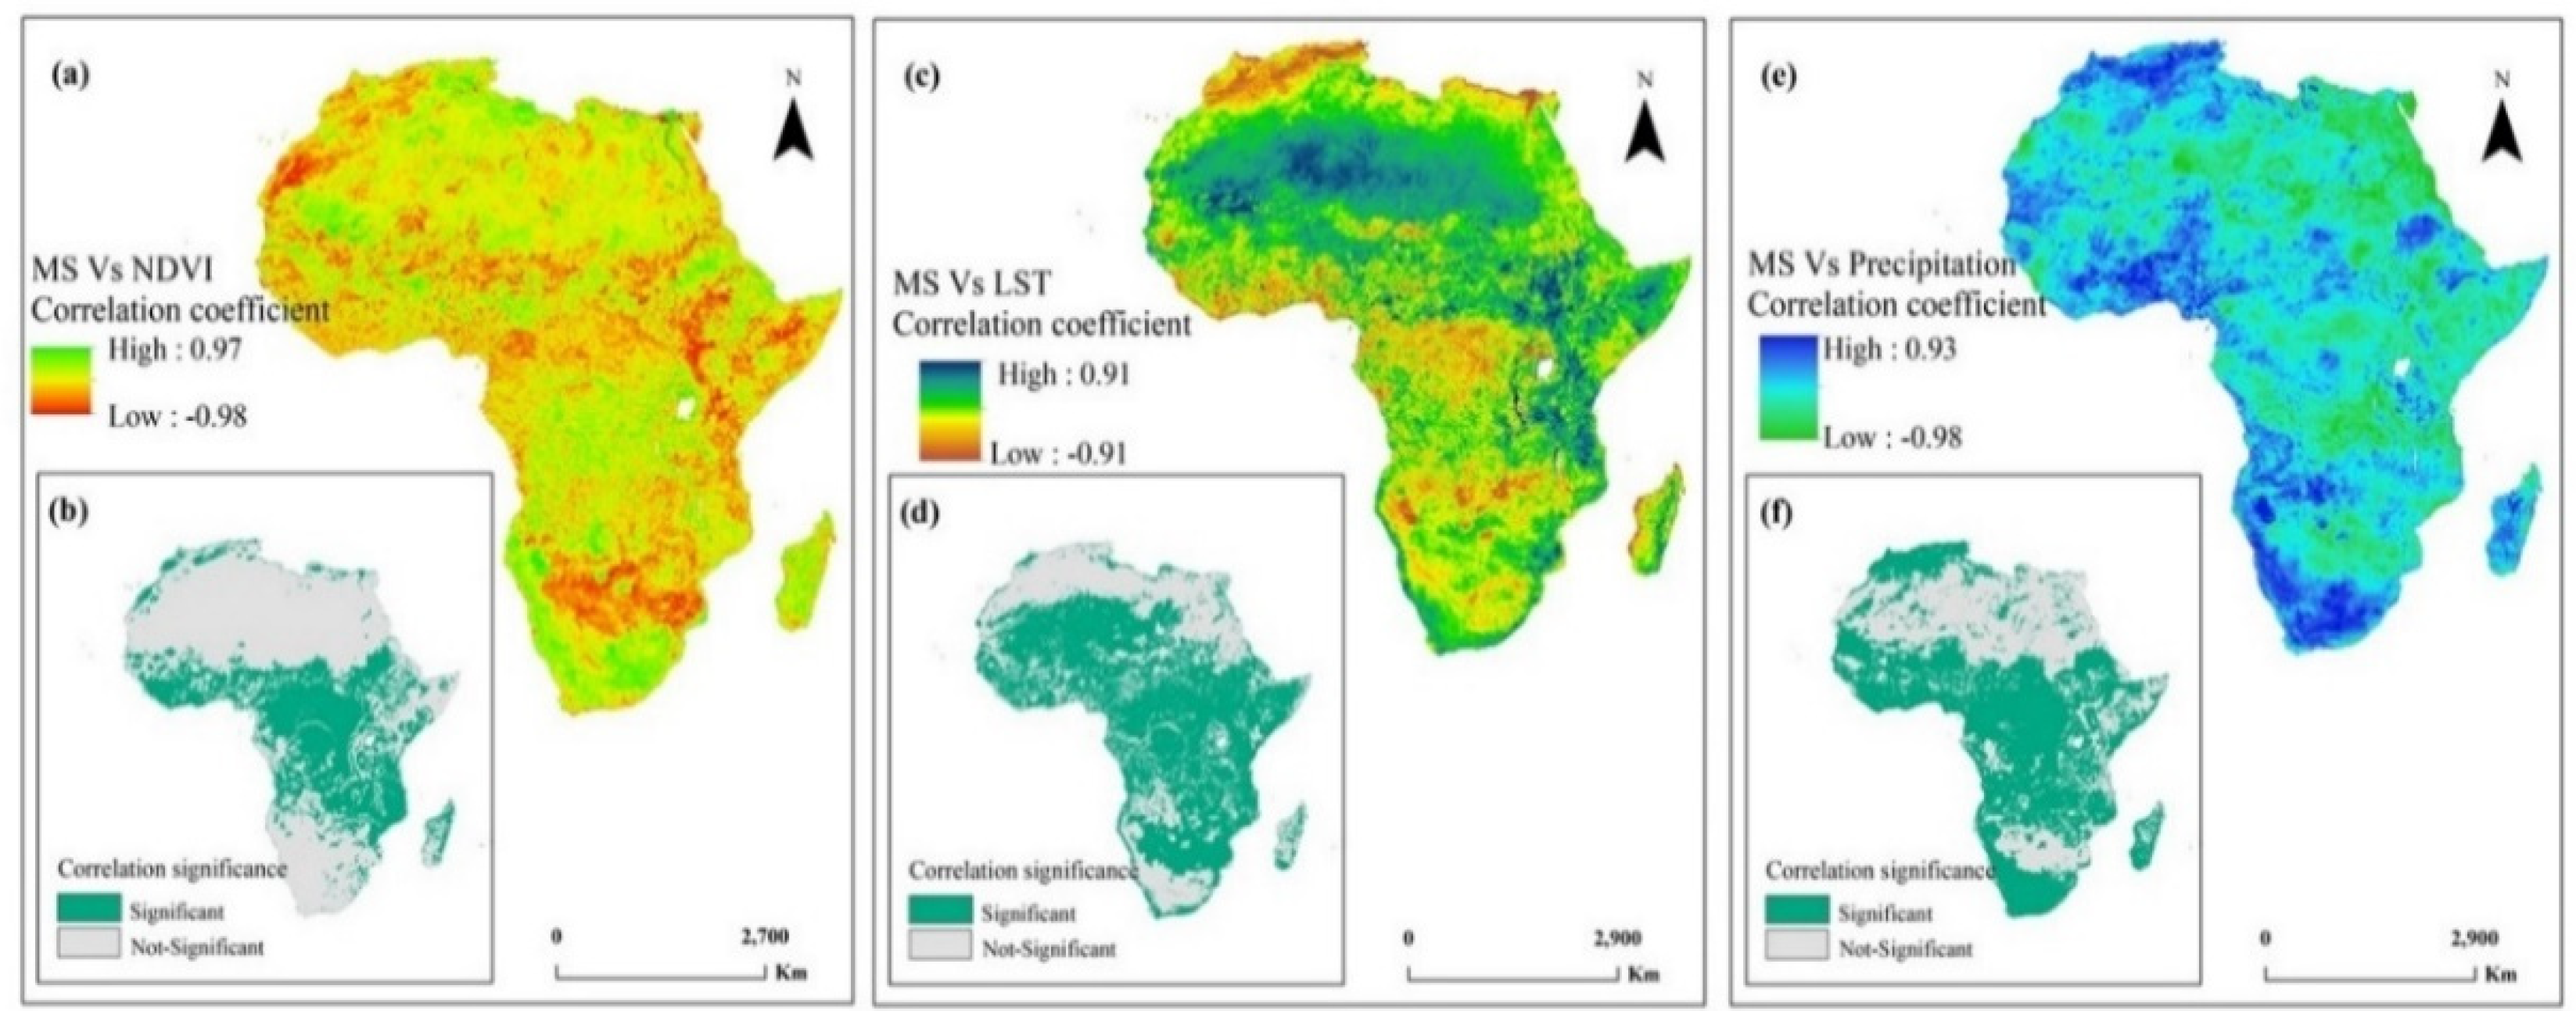
To better analyze the annual changes in soil moisture, we performed correlation analysis for the annual average soil moisture, the annual average NDVI, and the annual average precipitation and temperature (Figure 11). In North Africa, the temperature increased considerably across most of Algeria, and decreased in coastal land areas, whereas the vegetation and precipitation decreased. In East Africa, the vegetation cover and precipitation increased, whereas the LST decreased. For instance, in the semiarid areas of north and east Africa, the vegetation decreased, whereas the drought conditions and temperature in Sudan and Eritrea increased [76,80]. Philippon et al. [81] revealed that African vegetation cover is mostly affected by rainfall shortages. Our results (Figure 9a,b) show that there was a positive correlation between SM and NDVI, accounting for 54.5% of the study area, especially in central Africa and the savanna areas. As shown in Figure 9, the annual average soil moisture of 45.41% of the study area was negatively correlated with the annual average LST (64.56% was significant). We found a positive correlation between average annual precipitation and SM in 47% of the area (58% was significant), but a negative correlation in 53% of the study sites (42% was not significant).
The correlation coefficient showed that the equatorial rainforest belt and the high-altitude regions (Atlas Mountains) of central Africa exhibited the strongest correlation between the average annual SM and the average annual precipitation. Generally, SM is positively related to precipitation, and is negatively correlated with temperature. This implies that the variation in LST and the decline in precipitation due to climate variability and climate change determine the spatiotemporal changes in SM. The atmospheric demands for evaporation depend strongly on the near-surface air temperature and humidity conditions [82]. More modifications are needed to obtain reliable SM data due to the limitations of the sensors themselves, i.e., near the coastline (such as Madagascar), rivers, and lakes (Victoria), and there may be a need to develop ground control verifications (Figure 11).
4. Discussion
Soil moisture change is a significant challenge, specifically in rainfed Africa. SM is an essential variable for climate forecasting and drought assessments [83]. In addition, SM not only directly influences the circulation of surface water, but also affects surface evaporation, runoff, reflectivity, and emissivity [39]. Soil moisture drought frequently occurs in many African countries, mainly due to precipitation decreases [84], and these droughts directly affect soil moisture. In addition, it is challenging to obtain SM data from field ground stations across African countries. Because of the limitation in the number of weather stations [76], microwave remote sensing data from satellites can provide better results over large scales [85].
In this study, visible/thermal infrared remote sensing data (LST/NDVI) at a 1 km spatial resolution were applied to calculate VTCI (1 km) as an input in the Spatial Weight Downscaling Model (SWDM) to downscale SM data at a spatial resolution of 25 km × 25 km to 1 km. By training the accuracy of different time series windows, a suitable window was selected to downscale the time series SM data with fine spatial resolution at different time scales (day/night) (extending from 2003–2017, ~1 km). Then, the variations in SM in Africa were investigated over 15 years at different time scales, which provided new insight by downscaling the SM data. Our analysis showed that the SM over the 15 years had a downward trend. Regionally, the SM trends in the Sahel region decreased most significantly at all time scales (annual, seasonal, and monthly). The SM displayed a slight upward trend in 2003 of 11.77%, and the lower water content observed in 2017 was 7.77%, with 28% of the trends being significant (Figure S1b). The strongest significant decreasing trend was observed in the savanna, followed by desert regions, such as North Africa, and the highlands in East Africa. The variability of climate factors plays a key role in agricultural drought in most African regions. In reality, the reasons for drought events in eastern Africa are related to changes in the Niño–Southern Oscillation (ENSO) and land–atmosphere feedbacks [86,87].
Additionally, the water system in remote regions depends closely on precipitation [39], the timing of agronomic practices (e.g., planting, fertilizer, pesticides, and herbicide application), and irrigation scheduling, which are all affected by SM conditions [84,88], and SM changes can regulate LST and evapotranspiration (ET). The trends of high SM were observed in wet regions, such as rainforest zones and savanna zones, and the impacts of shortages in precipitation in these regions will result in a prolonged period of drought [89]. The increase in LST and ET reduces SM, leading to drought, and directly affecting crops [90,91].
Recently, several regions in Africa have experienced major drying patterns in recent decades that have caused serious social, economic, and environmental problems. There are other factors that lead to reduced soil moisture, such as soil degradation, deforestation, urbanization, and industrialization [92]. Many previous studies have reported that many social conflicts are related to soil moisture drought events. For example, in 2000–2013, Ethiopia had prolonged drought events that led to internal conflicts [93], whereas in Somalia, soil moisture drought occurrence had a significant relationship with violent local conflicts [94]. These results imply that decreasing rainfall and soil moisture during the growing season can exacerbate violent fights over water, pasture, and farmland, creating a full-blown civil war [95].
In vegetated regions, the vegetation covering the land will reduce soil moisture evaporation, and SM and NDVI are positively correlated, especially in dense vegetation regions, such as savannas and rainforests. In arid and semiarid regions, SM deficiency is a key factor in vegetation activity. In the Sahelian region, the vegetation cover has a direct relationship with SM accumulated over a long time. Pang et al. [96] reported that SM and NDVI have a significant correlation in arid and semiarid regions, which are common in Africa. The correlation between NDVI and soil moisture in Africa, especially in Sahelian countries, was considered the main factor in assessing land degradation. In addition, the vegetation change caused by anthropogenic activity has a strong effect on the SM trend, as the capacity of the soil decreases to retain rainwater, and increases runoff. Vegetation change can alter soil infiltration and field capacity, thus affecting soil moisture and the availability of groundwater for human and agricultural purposes [97] (Sterling et al. 2012).
It is important to study SM changes to understand and monitor soil moisture drought to reduce the consequences that could be faced regionally in the context of food security in Africa. In Africa, there are regular droughts due to shortages of precipitation, and high LST. In addition, throughout Africa, SM drought causes social, economic, environmental, and conflict challenges [98]. Therefore, there is a need to integrate scientific findings and regional environmental planning in Africa, and abide by international conventions, such as combating desertification, and mitigating the effect of climate variability and climate changes.
5. Conclusions
Studying the temporal and spatial changes in soil moisture in Africa is very important for understanding and managing African agricultural production. In this study, the spatiotemporal changes in SM (2003–2017) were examined using a time series of three types of passive microwave soil moisture data (AMSR2, AMSR-E, and SMOS) in Africa. The Soil Moisture Time Series Method was used to confirm the continuity and consistency of long-term SM data sequences. Then, the Spatial Weight Downscaling Model (SWDM) was used for downscaling based on the relationship between SM and the Vegetation Temperature Condition Index (VTCI). The spatiotemporal analysis indicated that soil moisture is declining in Africa as a whole, and it is notably higher in central Africa than in other subregions. The most significant decrease in SM was observed in the savanna zone, followed by South Africa and Namibia. Seasonally, the most significant downward trends in SM were observed during the spring, mainly over eastern and central Africa. In order to improve the accuracy of soil moisture monitoring, we need to obtain more ground observation data in Africa. According to topography and climate conditions, Africa is divided into regions, and local correction models are established using data from ground observation sites in different regions to further improve the accuracy of soil moisture products, and temporal and spatial changes analysis, which can help improve the understanding of hydrological cycles, and provide benchmark information for drought management in Africa.
As a vital drought factor and a significant climate change indicator, SM in Africa is gradually decreasing on an annual scale. The results showed that despite regional variances, an overall decreasing trend of SM was observed across the Africa over the past 15 years, and the highest SM content during the studied period was in 2003, whereas 2017 had the lowest SM content. The spatiotemporal analysis of the annual average SM revealed that the fluctuations in the LST and precipitation were the main factors causing the decrease in the SM content over Africa. At seasonal and monthly scales, highly significant decreasing trends were generally observed for SM across Africa. However, the most significant decreasing SM trends occurred in the desert zone and savanna, whereas an increase was recorded for wetlands.
Reduced soil moisture leads to an increased risk of drought, so government agencies and agricultural-based organizations need to prioritize policies and advocacies related to food sufficiency to reduce the number of people affected by food shortages in developing countries. Despite decentralization, such as irrigation systems and water recycling, it is still challenging to reverse agricultural drought, which directly impacts crop production. Drought mitigation measures should be taken from local to regional scales, and every country and region should comply with international climate change conventions.
Supplementary Materials
The following are available online at https://www.mdpi.com/article/10.3390/w14010074/s1, Figure S1. The spatial distribution of the annual soil moisture significance and area percentage (%) trends in Africa from 2003 to 2017. (***, **, * Significant at the P = 0.001, 0.01 and 0.05 confidence levels, respectively). Figure S2. Significance of the spatial distribution of seasonal soil moisture trends with area percentage (%) from 2003 to 2017. (***, **, * Significant at the P = 0.001, 0.01 and 0.05 confidence levels, respectively). Figure S3. Significance and area percentage (%) of the spatial distribution of monthly soil moisture trends in Africa from 2003 to 2017. (***, **, * Significant at the P=0.001, 0.01 and 0.05 confidence levels, respectively).
Author Contributions
Conceptualization, K.M.; methodology, Z.Y. and N.N.; software, N.N. and Z.Y.; validation, N.N. and Z.Y.; formal analysis, Z.Y. and N.N.; investigation, N.N. and Z.Y.; resources, Z.Q.; data curation, N.N. and Z.Y.; writing—original draft preparation, N.N. and Z.Y.; writing—review and editing, K.M., T.X. and Z.Q.; visualization, N.N. and Z.Y.; supervision, K.M. and Z.Q.; project administration, K.M. and Z.Q.; funding acquisition, K.M. and Z.Q. All authors have read and agreed to the published version of the manuscript.
Funding
This research was funded by the National Key Research and Development Program of China (2019YFE0127600), National Natural Science Foundation of China (41771406), Fundamental Research Funds for Central Nonprofit Scientific Institution (Grant No. 1610132020014), and Open Fund of State Key Laboratory of Remote Sensing Science (Grant No. OFSLRSS201910).
Data Availability Statement
Not applicable.
Acknowledgments
The authors would like to thank the relevant data centers for providing the research data. The authors are grateful to two anonymous reviewers for their constructive comments and suggestions on this manuscript.
Conflicts of Interest
The authors declare no conflict of interest.
References
- Abbaszadeh, P.; Moradkhani, H.; Zhan, X. Downscaling SMAP Radiometer Soil Moisture over the CONUS Using an Ensemble Learning Method. Water Resour. Res. 2019, 55, 324–344. [Google Scholar] [CrossRef] [Green Version]
- Cherkauer, K.A.; Bowling, L.C.; Lettenmaier, D.P. Variable infiltration capacity cold land process model updates. Glob. Planet. Chang. 2003, 38, 151–159. [Google Scholar] [CrossRef]
- Mao, K.B.; Tang, H.J.; Zhang, L.X.; Li, M.C.; Guo, Y.; Zhao, D.Z.; Grassland, H.; Observation, E.; Normal, B. A method for retrieving soil moisture in Tibet region by utilizing microwave index from TRMM / TMI data. Int. J. Remote Sens. 2008, 29, 2903–2923. [Google Scholar] [CrossRef]
- Drusch, M. Initializing numerical weather prediction models with satellite-derived surface soil moisture: Data assimilation experiments with ECMWF’s Integrated Forecast System and the TMI soil moisture data set. Geophys. Res. 2007, 112, 1–14. [Google Scholar] [CrossRef]
- de Rosnay, P.; Drusch, M.; Vasiljevic, D.; Balsamo, G.; Albergel, C.; Isaksen, L. A simplified Extended Kalman Filter for the global operational soil moisture analysis at ECMWF. Q. J. R. Meteorol. Soc. 2012, 3, 1–15. [Google Scholar] [CrossRef]
- Rodríguez-Fernández, N.; de Rosnay, P.; Albergel, C.; Richaume, P.; Aires, F.; Prigent, C.; Kerr, Y. SMOS Neural Network Soil Moisture Data Assimilation in a Land Surface Model and Atmospheric Impact. Remote Sens. 2019, 11, 1334. [Google Scholar] [CrossRef] [Green Version]
- Mao, K.B.; Ying, M.A.; Lang, X.I.A.; Hua-jun, T.; Li-juan, H.A.N. The Monitoring Analysis for the Drought in China by Using an Improved MPI Method. J. Integr. Agric. 2012, 11, 1048–1058. [Google Scholar] [CrossRef]
- Brocca, L.; Ciabatta, L.; Massari, C.; Camici, S.; Tarpanelli, A. Soil moisture for hydrological applications: Open questions and new opportunities. Water 2017, 9, 140. [Google Scholar] [CrossRef]
- Yang, H.; Wang, H.; Fu, G.; Yan, H.; Zhao, P. A modified soil water deficit index (MSWDI) for agricultural drought monitoring: Case study of Songnen Plain, China. Agric. Water. Manag. 2017, 194, 125–138. [Google Scholar] [CrossRef]
- Rossato, L.; Regina, C.; Alvalá, S.; Marengo, J.A.; Zeri, M.; Ana, P.M.; Cunha, A.; Pires, L.B.M.; Barbosa, H.A. Impact of Soil Moisture on Crop Yields over Brazilian Semiarid. Front. Environ. Sci. 2017, 5, 1–16. [Google Scholar] [CrossRef] [Green Version]
- Wang, J.; Ling, Z.; Wang, Y.; Zeng, H. Improving spatial representation of soil moisture by integration of microwave observations and the temperature—vegetation—drought index derived from MODIS products. Photogram. Remote Sens. 2016, 113, 144–146. [Google Scholar] [CrossRef] [Green Version]
- Shaodan, C.; Dunxian, S.; Liping, Z.; Mengyao, G.; Xin, L.S. Spatial Downscaling Methods of Soil Moisture Based on Multisource Remote Sensing Data and Its Application. Water 2019, 11, 1401. [Google Scholar]
- García, G.A.; Venturini, V.; Brogioni, M.; Walker, E.; Agustín, G.; Venturini, V.; Brogioni, M.; Walker, E.; Brogioni, M. Soil moisture estimation over flat lands in the Argentinian Pampas region using Sentinel-1A data and non-parametric methods. Int. J. Remote Sens. 2019, 40, 3689–3720. [Google Scholar] [CrossRef]
- Sharma, P.K.; Kumar, D.; Srivastava, H.S.; Patel, P. Assessment of Different Methods for Soil Moisture Estimation: A Review. J. Remote Sens. GIS 2018, 9, 2230–7990. [Google Scholar]
- Xia, L.; Zhao, F.; Mao, K.; Yuan, Z.; Zuo, Z.; Xu, T. SPI-Based Analyses of Drought Changes over the Past 60 Years in China’s Major Crop-Growing Areas. Remote Sens. 2018, 1, 171. [Google Scholar] [CrossRef] [Green Version]
- Wang, L.; Qu, J.J. Satellite remote sensing applications for surface soil moisture monitoring: A review. Front. Earth Sci. 2009, 3, 237–247. [Google Scholar] [CrossRef]
- Zhao, W.; Sánchez, N.; Lu, H.; Li, A. A spatial downscaling approach for the SMAP passive surface soil moisture product using random forest regression. J. Hydrol. 2018, 563, 1009–1024. [Google Scholar] [CrossRef]
- Bolten, J.D.; Crow, W.T.; Zhan, X.; Jackson, T.J.; Reynolds, C.A. Evaluating the Utility of Remotely Sensed Soil Moisture Retrievals for Operational Agricultural Drought Monitoring. IEEE J. Sel. Top. Appl. Earth Obs. Remote Sens. 2010, 3, 57–66. [Google Scholar] [CrossRef] [Green Version]
- Shen, X.; Mao, K.; Qin, Q.; Hong, Y.; Zhang, G.; Member, S. Bare Surface Soil Moisture Estimation Using Double-Angle and Dual-Polarization L-Band Radar Data. IEEE Trans. Geosci. Remote Sens. 2013, 51, 3931–3942. [Google Scholar] [CrossRef]
- Zheng, D.; Wang, X.; van der Velde, R.; Ferrazzoli, P.; Wen, J.; Wang, Z.; Schwank, M.; Colliander, A.; Bindlish, R.; Su, Z. Impact of surface roughness, vegetation opacity and soil permittivity on L-band microwave emission and soil moisture retrieval in the third pole environment. Remote Sens. Environ. 2018, 209, 633–647. [Google Scholar] [CrossRef]
- Shen, X.; Hong, Y.; Qin, Q.; Basara, J.B.; Mao, K.; Wang, D. A Semiphysical Microwave Surface Emission Model for Soil Moisture Retrieval. IEEE Trans. Geosci. Remote Sens. 2015, 53, 4079–4090. [Google Scholar] [CrossRef]
- Sridhar, V.; Jaksa, W.; Fang, B.; Lakshmi, V.; Hubbard, K.G.; Jin, X. Evaluating Bias-Corrected AMSR-E Soil Moisture using in situ Observations and Model Estimates. Vadose Zone J. 2013, 12, 1–13. [Google Scholar] [CrossRef]
- Entekhabi, D.; Asrar, G.R.; Betts, A.K.; Beven, K.J.; Bras, R.L.; Duffy, C.J.; Dunne, T.; Koster, R.D.; Lettenmaier, D.P.; McLaughlin, D.B.; et al. An Agenda for Land Surface Hydrology Research and a Call for the Second International Hydrological Decade. Bull. Am. Meteorol. Soc. 1999, 80, 2043–2058. [Google Scholar] [CrossRef] [Green Version]
- Guha, A.; Lakshmi, V.; Member, S. Use of the Scanning Multichannel Microwave Radiometer (SMMR) to Retrieve Soil Moisture and Surface Temperature Over the Central United States. IEEE Trans. Geosci. Remote Sens. 2004, 42, 1482–1494. [Google Scholar] [CrossRef]
- Reichle, R.H.; Koster, R.D.; Liu, P.; Mahanama, S.P.P.; Njoku, E.G.; Owe, M. Comparison and assimilation of global soil moisture retrievals from the Advanced Microwave Scanning Radiometer for the Earth Observing System (AMSR-E) and the Scanning Multichannel Microwave Radiometer (SMMR). J. Geophys. Res. 2007, 112, D09108. [Google Scholar]
- Kerr, Y.; Waldteufel, P.; Wigneron, J.; Delwart, S.; Boutin, J.; Escorihuela, M.J.; Font, J.; Reul, N.; Kerr, Y.; Waldteufel, P.; et al. The SMOS mission: New tool for monitoring key elements of the global water cycle. Proc. IEEE 2010, 98, 666–687. [Google Scholar] [CrossRef] [Green Version]
- Sun, R.; Zhang, Y.; Wu, S. The application of FengYun-3 Microwave Radiation Imager soil moisture product in drought monitoring. In Proceedings of the 22nd EGU General Assembly, Online, 4–8 May 2020. [Google Scholar] [CrossRef]
- Bindlish, R.; Jackson, T.J.; Wood, E.; Gao, H.; Starks, P.; Bosch, D.; Lakshmi, V. Soil moisture estimates from TRMM Microwave Imager observations over the Southern United States. Remote Sens. Environ. 2003, 85, 507–515. [Google Scholar] [CrossRef]
- Velpuri, N.M.; Senay, G.B.; Morisette, J.T. Evaluating New SMAP Soil Moisture for Drought Monitoring in the Rangelands of the US High Plains. RALA 2016, 38, 183–190. [Google Scholar] [CrossRef] [Green Version]
- Indeje, M.; Semazzi, F.H.; Ogallo, L.J. ENSO signals in East African rainfall seasons. Int. J. Climatol. J. R. Meteorol. Soc. 2000, 20, 19–46. [Google Scholar] [CrossRef]
- Piles, M.; Sánchez, N.; Vall-llossera, M.; Member, S.; Camps, A. A Downscaling Approach for SMOS Land Observations: Evaluation of High-Resolution Soil Moisture Maps Over the Iberian Peninsula. IEEE J. Sel. Top. Appl. Earth Obs. Remote Sens. 2014, 7, 3845–3857. [Google Scholar] [CrossRef] [Green Version]
- Kim, J.; Hogue, T.S. Improving Spatial Soil Moisture Representation through Integration of AMSR-E and MODIS Products. IEEE Trans. Geosci. Remote Sens. 2012, 50, 446–460. [Google Scholar] [CrossRef]
- Maltese, A.; Capodici, F.; Ciraolo, G.; Loggia, G. La, Soil Water Content Assessment: Critical Issues Concerning the Operational Application of the Triangle Method. Sensors 2015, 15, 6699–6718. [Google Scholar] [CrossRef]
- Carlson, T. An Overview of the “Triangle Method” for Estimating Surface Evapotranspiration and Soil Moisture from Satellite Imagery. Sensors 2007, 7, 1612–1629. [Google Scholar] [CrossRef] [Green Version]
- Carlson, T.N.; Gillies, R.R.; Perry, E.M. A method to make use of thermal infrared temperature and NDVI measurements to infer surface soil water content and fractional vegetation cover. Remote Sens. Rev. 2009, 9, 37–41. [Google Scholar] [CrossRef]
- Choi, M.; Hur, Y. A microwave-optical/infrared disaggregation for improving spatial representation of soil moisture using AMSR-E and MODIS products. Remote Sens. Environ. 2012, 124, 259–269. [Google Scholar] [CrossRef]
- Piles, M.; Camps, A.; Vall-llossera, M.; Corbella, I.; Member, S.; Panciera, R.; Rüdiger, C.; Kerr, Y.H.; Member, S.; Walker, J. Downscaling SMOS-Derived Soil Moisture Using MODIS Visible/Infrared Data. IEEE Trans. Geosci. Remote Sens. 2011, 49, 3156–3166. [Google Scholar] [CrossRef]
- Guevara, M.; Vargas, R. Downscaling satellite soil moisture using Geomorphometry and machine learning. PLoS ONE 2019, 14, e0219639. [Google Scholar] [CrossRef] [Green Version]
- Meng, X.; Mao, K.; Meng, F.; Shi, J.; Zeng, J.; Shen, X.; Cui, Y.; Jiang, L.; Guo, Z. A fine-resolution soil moisture dataset for China in 2002–2018. Earth Syst. Sci. Data 2021, 13, 3239–3261. [Google Scholar] [CrossRef]
- Peng, J.; Loew, A.; Zhang, S.; Wang, J.; Niesel, J. Spatial Downscaling of Satellite Soil Moisture Data Using a Vegetation Temperature Condition Index. IEEE Trans. Geosci. Remote Sens. 2015, 54, 558–566. [Google Scholar] [CrossRef]
- Nhamo, L.; Matchaya, G.; Mabhaudhi, T.; Nhlengethwa, S.; Nhemachena, C.; Mpandeli, S. Cereal Production Trends under Climate Change: Impacts and Adaptation Strategies in Southern Africa. Agriculture 2019, 9, 30. [Google Scholar] [CrossRef] [Green Version]
- Rufino, M.C.; Thornton, P.K.; Ng, S.K.; Mutie, I.; Jones, P.G.; van Wijk, M.T.; Herrero, M. Transitions in agro-pastoralist systems of East Africa: Impacts on food security and poverty. Agric. Ecosyst. Environ. 2013, 179, 215–230. [Google Scholar] [CrossRef]
- Masih, I.; Maskey, S.; Trambauer, P. A review of droughts on the African continent: A geospatial and long-term perspective. Hydrol. Earth Syst. Sci. 2014, 18, 3635–3649. [Google Scholar] [CrossRef] [Green Version]
- Brooks, N. Drought in the African Sahel: Long-Term Perspectives and Future Prospects. Tyndall Cent. Clim. Chang. Res. 2004, 61, 31. [Google Scholar]
- Parinussa, R.M.; Yilmaz, M.T.; Anderson, M.C.; Hain, C.R.; De Jeu, R.A.M. An intercomparison of remotely sensed soil moisture products at various spatial scales over the Iberian Peninsula. Hydrol. Process. 2014, 28, 4865–4876. [Google Scholar] [CrossRef]
- Vogel, C.; Koch, I.; Van Zyl, K. “A persistent truth”—Reflections on drought risk management in southern Africa. Weather Clim. Soc. 2010, 2, 9–22. [Google Scholar] [CrossRef]
- Jackson, T.J. Measuring Surface Soil Moisture Using Passive Microwave Remote Sensing. Hydrol. Process. 1993, 7, 139–152. [Google Scholar] [CrossRef]
- Poynton, J.C. Distribution of amphibians in sub-Saharan Africa, Madagascar, and Seychelles. Patterns Distrib. Amphib. Glob. Perspect. 1999, 483–539. [Google Scholar]
- Nicholson, S.E. Climate and Climatic Variability of Rainfall over Eastern Africa. Rev. Geophys. 2017, 55, 590–635. [Google Scholar] [CrossRef] [Green Version]
- Draper, C.S.; Walker, J.P.; Steinle, P.J.; De Jeu, R.A.; Holmes, T.R. An evaluation of AMSR–E derived soil moisture over Australia. Remote Sens. Environ. 2009, 113, 703–710. [Google Scholar] [CrossRef]
- Imaoka, K.; Kachi, M.; Fujii, H.; Murakami, H.; Hori, M.; Ono, A.; Igarashi, T.; Nakagawa, K.; Oki, T.; Honda, Y.; et al. Global Change Observation Mission (GCOM) for monitoring carbon, water cycles, and climate change. Proc. IEEE 2010, 98, 717–734. [Google Scholar] [CrossRef]
- Zhao, B.; Mao, K.; Cai, Y.; Shi, J.; Li, Z.; Qin, Z.; Meng, X. A combined Terra and Aqua MODIS land surface temperature and meteorological station data product for China from 2003–2017. Earth Syst. Sci. Data 2020, 12, 2555–2577. [Google Scholar] [CrossRef]
- Dostálová, A.; Doubková, M.; Sabel, D.; Bauer-marschallinger, B. Seven Years of Advanced Synthetic Aperture Radar (ASAR) Global Monitoring (GM) of Surface Soil Moisture over Africa. Remote Sens. 2014, 6, 7683–7707. [Google Scholar] [CrossRef] [Green Version]
- Zreda, M.; Desilets, D.; Ferré, T.P.A.; Scott, R.L. Measuring soil moisture content non-invasively at intermediate spatial scale using cosmic-ray neutrons. Geophys. Res. Lett. 2008, 35, 1–5. [Google Scholar] [CrossRef] [Green Version]
- Zreda, M.; Shuttleworth, W.J.; Zeng, X.; Zweck, C.; Desilets, D.; Franz, T.; Rosolem, R. COSMOS: The COsmic-ray Soil Moisture Observing System. Hydrol. Earth Syst. Sci. 2012, 16, 4079–4099. [Google Scholar] [CrossRef] [Green Version]
- Tagesson, T.; Fensholt, R.; Guiro, I.; Rasmussen, M.; Huber, S.; Mbow, C.; Garcia, M.; Horion, S.; Sandholt, I.; Holm-Rasmussen, B.; et al. Ecosystem properties of semi-arid savanna grassland in west africa and its relationship to environmental variability. Glob. Change Biol. 2014, 21, 250–264. [Google Scholar] [CrossRef] [Green Version]
- Larson, K.M.; Small, E.E.; Gutmann, E.D.; Bilich, A.L.; Braun, J.J.; Zavorotny, V.U. Use of GPS receivers as a soil moisture network for water cycle studies. Geophys. Res. Lett. 2008, 35, 1–5. [Google Scholar] [CrossRef] [Green Version]
- de Tomás, A.; Nieto, H.; Guzinski, R.; Salas, J.; Sandholt, I.; Berliner, P. Validation and Scale Dependencies of the Triangle Method for the Evaporative Fraction Estimation over Heterogeneous Areas. Remote Sens. Environ. 2014, 152, 493–511. [Google Scholar] [CrossRef]
- Han, J.; Mao, K.; Xu, T.; Guo, J.; Zuo, Z.; Gao, C. A Soil Moisture Estimation Framework Based on the CART Algorithm and Its Application in China. J. Hydrol. 2018, 561, 65–75. [Google Scholar] [CrossRef]
- Meng, X.; Mao, K.; Meng, F.; Shen, X.; Xu, T.; Cao, M. Long-Term Spatiotemporal Variations in Soil Moisture in North East China Based on 1-km Resolution Downscaled Passive Microwave Soil Moisture Products. Sensors 2019, 19, 3527. [Google Scholar] [CrossRef] [Green Version]
- Jin, Y.; Ge, Y.; Wang, J.; Chen, Y.; Heuvelink, G.B.M.; Atkinson, P.M. Downscaling AMSR-2 soil moisture data with geographically weighted area-to-area regression kriging. IEEE Trans. Geosci. Remote Sens. 2017, 56, 2362–2376. [Google Scholar] [CrossRef] [Green Version]
- Res, C.; Willmott, C.J.; Matsuura, K. Advantages of the mean absolute error (MAE) over the root mean square error (RMSE) in assessing average model performance. Clim. Res. 2005, 30, 79–82. [Google Scholar]
- Mueller, N.D.; Gerber, J.S.; Johnston, M.; Ray, D.K.; Ramankutty, N.; Foley, J.A. Closing Yield Gaps through Nutrient and Water Management. Nature 2012, 490, 254–257. [Google Scholar] [CrossRef]
- Dutra, E.; Magnusson, L.; Wetterhall, F.; Cloke, H.L.; Balsamo, G.; Boussetta, S.; Pappenberger, F. The 2010–2011 drought in the Horn of Africa in ECMWF reanalysis and seasonal forecast products. Int. J. Climatol. 2013, 33, 1720–1729. [Google Scholar] [CrossRef] [Green Version]
- Dawelbait, M.; Morari, F. Monitoring desertification in a Savannah region in Sudan using Landsat images and spectral mixture analysis. J. Arid. Environ. 2012, 80, 45–55. [Google Scholar] [CrossRef]
- Maslin, M.A.; Brierley, C.M.; Milner, A.M.; Shultz, S.; Trauth, M.H.; Wilson, K.E. East African climate pulses and early human evolution. Quat. Sci. Rev. 2014, 101, 1–17. [Google Scholar] [CrossRef]
- Nyssen, J.; Frankl, A.; Haile, M.; Hurni, H.; Descheemaeker, K.; Crummey, D.; Ritler, A.; Portner, B.; Nievergelt, B.; Moeyersons, J.; et al. Environmental conditions and human drivers for changes to north Ethiopian mountain landscapes over 145 years. Sci. Total Environ. 2014, 485, 164–179. [Google Scholar] [CrossRef] [PubMed] [Green Version]
- Jimoh, S.O.; Muraina, T.O.; Bello, S.K.; NourEldeen, N. Emerging issues in grassland ecology research: Perspectives for advancing grassland studies in Nigeria. Acta Oecologica 2020, 106, 103548. [Google Scholar] [CrossRef]
- Li, B.; Wang, L.; Kaseke, K.F.; Li, L.; Seely, M.K. The impact of rainfall on soil moisture dynamics in a foggy desert. PLoS ONE 2016, 11, e0164982. [Google Scholar] [CrossRef] [PubMed] [Green Version]
- Brown, M.E.; Funk, C.C. Early Warning of Food Security Crises in Urban areas: The Case of Harare, Zimbabwe, 2007. Geospat. Tech. Urban Hazard Disaster Anal. 2019, 2, 229–241. [Google Scholar]
- Robinson, E.S.; Yang, X.; Lee, J.E. Ecosystem Productivity and Water Stress in Tropical East Africa: A Case Study of the 2010–2011 Drought. Land 2019, 8, 52. [Google Scholar] [CrossRef] [Green Version]
- Yang, X.; DelSole, T. Systematic comparison of ENSO teleconnection patterns between models and observations. J. Clim. 2012, 25, 425–446. [Google Scholar] [CrossRef]
- Winkler, K.; Gessner, U.; Hochschild, V. Identifying droughts affecting agriculture in Africa based on remote sensing time series between 2000–2016: Rainfall anomalies and vegetation condition in the context of ENSO. Remote Sens. 2017, 9, 831. [Google Scholar] [CrossRef] [Green Version]
- Caminade, C.; Terray, L. Twentieth century Sahel rainfall variability as simulated by the ARPEGE AGCM, and future changes. Clim. Dyn. 2010, 35, 75–94. [Google Scholar] [CrossRef]
- Mao, K.B.; Ma, Y.; Tan, X.L.; Shen, X.Y.; Liu, G.; Li, Z.L.; Chen, J.M.; Xia, L. Global surface temperature change analysis based on MODIS data in recent twelve years. Adv. Sp. Res. 2016, 59, 503–512. [Google Scholar] [CrossRef] [Green Version]
- Noureldeen, N.; Mao, K.; Yuan, Z.; Shen, X.; Xu, T. Analysis of the Spatiotemporal Change in Land Surface Temperature for a Long—Term Sequence in Africa (2003–2017). Remote Sens. 2020, 12, 488. [Google Scholar] [CrossRef] [Green Version]
- Mohino, E.; Rodríguez-Fonseca, B.; Losada, T.; Gervois, S.; Janicot, S.; Bader, J.; Ruti, P.; Chauvin, F. Changes in the interannual SST-forced signals on West African rainfall. AGCM intercomparison. Clim. Dyn. 2011, 37, 1707–1725. [Google Scholar] [CrossRef] [Green Version]
- Martin, E.R.; Thorncroft, C.D. The impact of the AMO on the West African monsoon annual cycle. Q. J. R. Meteorol. Soc. 2014, 140, 31–46. [Google Scholar] [CrossRef]
- Philippon, N.; Martiny, N.; Camberlin, P.; Hoffman, M.T.; Gond, V. Timing and patterns of the ENSO signal in Africa over the last 30 years: Insights from normalized difference vegetation index data. J. Clim. 2014, 27, 2509–2532. [Google Scholar] [CrossRef]
- Measho, S.; Chen, B.; Trisurat, Y.; Pellikka, P.; Guo, L. Spatio-Temporal Analysis of Vegetation Dynamics as a Response to Climate Variability and Drought Patterns in the Semiarid Region, Eritrea. Remote Sens. 2019, 11, 724. [Google Scholar] [CrossRef] [Green Version]
- Philippon, N.; Richard, Y.; Camberlin, P. Predictability of NDVI in semi-arid African regions. Theor. Appl. Climatol. 2009, 100, 467–484. [Google Scholar]
- Koster, R.D.; Mahanama, S.P.P.; Yamada, T.J.; Balsamo, G.; Berg, A.A.; Boisserie, M.; Dirmeyer, P.A.; Doblas-Reyes, F.J.; Drewitt, G.; Gordon, C.T.; et al. The Second Phase of the Global Land—Atmosphere Coupling Experiment: Soil Moisture Contributions to Subseasonal Forecast Skill. J. Hydrometeorol. 2011, 2, 805–822. [Google Scholar] [CrossRef]
- Myeni, L.; Moeletsi, M.E.; Clulow, A.D. Present status of soil moisture estimation over the African continent. J. Hydrol. Reg. Stud. 2019, 21, 14–24. [Google Scholar] [CrossRef]
- Gebrehiwot, T.; van der Veen, A.; Maathuis, B. Spatial and temporal assessment of drought in the Northern highlands of Ethiopia. Int. J. Appl. Earth Obs. Geoinf. 2011, 13, 309–321. [Google Scholar] [CrossRef]
- Owe, M.; de Jeu, R.; Walker, J. A Methodology for Surface Soil Moisture and Vegetation Optical Depth Retrieval Using the Microwave Polarization Difference Index. IEEE Trans. Geosci. Remote Sens. 2001, 39, 1643–1654. [Google Scholar] [CrossRef] [Green Version]
- Zeng, N. Drought in the Sahel. Science 2003, 302, 5647. [Google Scholar] [CrossRef]
- Hua, W.; Zhou, L.; Chen, H.; Nicholson, S.E.; Raghavendra, A.; Jiang, Y. Possible causes of the Central Equatorial African long-term drought. Environ. Res. Lett. 2016, 11, 124002. [Google Scholar] [CrossRef]
- Chartzoulakis, K.; Bertaki, M. Sustainable water management in agriculture under climate change. Agric. Agric. Sci. Procedia 2015, 4, 88–98. [Google Scholar] [CrossRef] [Green Version]
- Klemas, V.; Pieterse, A. Using remote sensing to map and monitor water resources in arid and semiarid regions. In Advances in Watershed Science and Assessment; Springer International Publishing: New York, NY, USA, 2015; Volume 33, pp. 33–60. [Google Scholar]
- Park, S.; Im, J.; Jang, E.; Rhee, J. Drought assessment and monitoring through blending of multi-sensor indices using machine learning approaches for different climate regions. Agric. For. Meteorol. 2016, 216, 157–169. [Google Scholar] [CrossRef]
- Vicente-Serrano, S.M.; Beguería, S.; López-Moreno, J.I. A multiscalar drought index sensitive to global warming: The standardized precipitation evapotranspiration index. J. Clim. 2009, 23, 1696–1718. [Google Scholar] [CrossRef] [Green Version]
- Abdelhadi, A.W.; Hata, T.; Tanakamaru, H.; Tada, A.; Tariq, M.A. Estimation of crop water requirements in arid region using Penman±Monteith equation with derived crop coefficients: A case study on Acala cotton in Sudan Gezira irrigated scheme. Agric. Water Manag. 2000, 45, 203–214. [Google Scholar] [CrossRef]
- Delbiso, T.D.; Rodriguez-llanes, J.M.; Donneau, A.; Asia, E. Drought, conflict and children’ s undernutrition in Ethiopia 2000–2013: A meta-analysis. Research 2017, 95, 94–102. [Google Scholar]
- Selby, J.; Hoffmann, C. Beyond scarcity: Rethinking water, climate change and conflict in the Sudans. Glob. Environ. Chang. 2014, 29, 360–370. [Google Scholar] [CrossRef] [Green Version]
- Van Baalen, S.; Mobjörk, M. Climate change and violent conflict in East Africa: Integrating qualitative and quantitative research to probe the mechanisms. Int. Stud. Rev. 2018, 20, 547–575. [Google Scholar] [CrossRef]
- Pang, G.; Wang, X.; Yang, M. Using the NDVI to identify variations in, and responses of, vegetation to climate change on the Tibetan Plateau from 1982 to 2012. Quat. Int. 2017, 444, 87–96. [Google Scholar] [CrossRef]
- Sterling, S.M.; Ducharne, A.; Polcher, J. The impact of global land-cover change on the terrestrial water cycle. Nat. Clim. Chang. 2012, 3, 385–390. [Google Scholar] [CrossRef]
- Tambo, J.A. Adaptation and resilience to climate change and variability in north-east Ghana. Int. J. Disaster Risk Reduct. 2016, 17, 85–94. [Google Scholar] [CrossRef]
Figure 1.
Overview of the station locations and study regions across Africa: north (I), west (II), central (III), east (IV), and south (V).
Figure 1.
Overview of the station locations and study regions across Africa: north (I), west (II), central (III), east (IV), and south (V).

Figure 2.
Annual mean Africa climate factors: (a) precipitation (mm), (b) land surface temperature (°C) from 2003 to 2017, and (c) land use/land cover classes from the MODIS satellite (MCD12C1, 2017).
Figure 2.
Annual mean Africa climate factors: (a) precipitation (mm), (b) land surface temperature (°C) from 2003 to 2017, and (c) land use/land cover classes from the MODIS satellite (MCD12C1, 2017).

Figure 3.
Overall workflow for the soil moisture downscaling mode.

Figure 4.
The R and RMSE between downscaled and in situ monthly observations of soil moisture (SM) ((a): Kenya, (b): Namibia, (c): Sudan, (d): Senegal, (e): South Africa).
Figure 4.
The R and RMSE between downscaled and in situ monthly observations of soil moisture (SM) ((a): Kenya, (b): Namibia, (c): Sudan, (d): Senegal, (e): South Africa).

Figure 5.
Interannual variations in the annual average soil moisture (SM) in African subregions from 2003 to 2017.
Figure 5.
Interannual variations in the annual average soil moisture (SM) in African subregions from 2003 to 2017.

Figure 6.
Interannual variability rates (slope, left) and correlation coefficients (R, right) of soil moisture from 2003 to 2017.
Figure 6.
Interannual variability rates (slope, left) and correlation coefficients (R, right) of soil moisture from 2003 to 2017.

Figure 7.
The slope of seasonal soil moisture change from 2003 to 2017.

Figure 8.
The correlation coefficient of seasonal soil moisture change from 2003 to 2017.

Figure 9.
The interannual change (slope) of the monthly average soil moisture from 2003 to 2017.

Figure 10.
The interannual change correlation coefficient (R) of the monthly average soil moisture content from 2003 to 2017.
Figure 10.
The interannual change correlation coefficient (R) of the monthly average soil moisture content from 2003 to 2017.

Figure 11.
Relationship between annual soil moisture (SM) change versus (a) Normalized Difference Vegetation Index (NDVI), (c) Land Surface Temperature (LST), and (e) precipitation during the 2003–2017 period in Africa; respective correlation significances (b,d,f).
Figure 11.
Relationship between annual soil moisture (SM) change versus (a) Normalized Difference Vegetation Index (NDVI), (c) Land Surface Temperature (LST), and (e) precipitation during the 2003–2017 period in Africa; respective correlation significances (b,d,f).


Table 1.
Summary of the remote sensing data used in this research.
| Sensor | Product | Time | Spatial Resolution | Unit | Level |
|---|---|---|---|---|---|
| AMSR-E | Soil moisture | daily | 25 km | % | L3 |
| AMSR2 | Soil moisture | 25 km | % | L3 | |
| SMOS | Soil moisture | 25 km | % | L3 | |
| MYD11A2 | LST | 8 days | 1 km | K | L3 |
| MYD13A3 | NDVI | 16 days | 1 km | L3 | |
| SRTM | Digital elevation model (DEM) | - | 90 m | m | - |
Table 2.
Information about in situ ground soil moisture observation networks and sites in Africa.
| Network | Kenya | Namibia | Sudan | Senegal | South Africa |
|---|---|---|---|---|---|
| COSMOS | 2 (2011–2017) | 1 (2014–2017) | / | / | 5 (2014–2018) |
| CARBOAFRICA | / | / | 1 (2002–2010) | / | / |
| DAHRA | / | / | / | 1 (2002–2016) | / |
| PBO_H2O | / | / | / | / | 4 (2014–2017) |
Note: “/” represents missing data.
Table 3.
Test window size between corrected variables and descriptive variables (original value).
| W | Average Day- and Night-Time Values (m3/m3) | ||
|---|---|---|---|
| RMSE | MAE | R | |
| 2 | 0.067 | 0.023 | 0.63 |
| 4 | 0.0153 | 0.0180 | 0.90 |
| 6 | 0.0105 | 0.0115 | 0.91 |
| 8 | 0.0203 | 0.0289 | 0.89 |
| 10 | 0.0130 | 0.0177 | 0.87 |
| 12 | 0.0198 | 0.0182 | 0.64 |
| 14 | 0.0132 | 0.0286 | 0.89 |
Note: W is the window size for the selected year based on Equation (6).
Table 4.
The analysis of the seasonal ground observations in the five countries.
| Region | Validation Period | Spring | Summer | Autumn | Winter |
|---|---|---|---|---|---|
| Kenya | 2011–2017 | 0.0612 | 0.0135 | 0.0451 | 0.0053 |
| Namibia | 2014–2017 | 0.0178 | 0.0052 | 0.042 | 0.0154 |
| Sudan | 2003–2010 | 0.035 | 0.002 | 0.0043 | 0.0136 |
| Senegal | 2003–2016 | 0.046 | 0.016 | 0.052 | 0.049 |
| South Africa | 2014–2017 | 0.051 | 0.0153 | 0.056 | 0.061 |
Publisher’s Note: MDPI stays neutral with regard to jurisdictional claims in published maps and institutional affiliations. |
© 2022 by the authors. Licensee MDPI, Basel, Switzerland. This article is an open access article distributed under the terms and conditions of the Creative Commons Attribution (CC BY) license (https://creativecommons.org/licenses/by/4.0/).
Share and Cite
MDPI and ACS Style
Yuan, Z.; NourEldeen, N.; Mao, K.; Qin, Z.; Xu, T. Spatiotemporal Change Analysis of Soil Moisture Based on Downscaling Technology in Africa. Water 2022, 14, 74. https://doi.org/10.3390/w14010074
AMA Style
Yuan Z, NourEldeen N, Mao K, Qin Z, Xu T. Spatiotemporal Change Analysis of Soil Moisture Based on Downscaling Technology in Africa. Water. 2022; 14(1):74. https://doi.org/10.3390/w14010074
Chicago/Turabian StyleYuan, Zijin, Nusseiba NourEldeen, Kebiao Mao, Zhihao Qin, and Tongren Xu. 2022. "Spatiotemporal Change Analysis of Soil Moisture Based on Downscaling Technology in Africa" Water 14, no. 1: 74. https://doi.org/10.3390/w14010074
Note that from the first issue of 2016, this journal uses article numbers instead of page numbers. See further details here.