
Detecting Extreme Rainfall Events Using the WRF-ERDS Workflow: The 15 July 2020 Palermo Case Study


1
Department of Environment, Land and Infrastructure Engineering (DIATI), Politecnico di Torino, 10129 Torino, Italy
2
CIMA Research Foundation, 17100 Savona, Italy
*
Author to whom correspondence should be addressed.
Water 2022, 14(1), 86; https://doi.org/10.3390/w14010086
Submission received: 5 December 2021
/
Revised: 20 December 2021
/
Accepted: 31 December 2021
/
Published: 3 January 2022
(This article belongs to the Special Issue Hydrometeorological Forecasting Using the Weather Research and Forecasting Model)
Abstract
:In this work, we describe the integration of Weather and Research Forecasting (WRF) forecasts produced by CIMA Research Foundation within ITHACA Extreme Rainfall Detection System (ERDS) to increase the forecasting skills of the overall early warning system. The entire workflow is applied to the heavy rainfall event that affected the city of Palermo on 15 July 2020, causing urban flooding due to an exceptional rainfall amount of more than 130 mm recorded in about 2.5 h. This rainfall event was not properly forecasted by meteorological models operational at the time of the event, thus not allowing to issue an adequate alert over that area. The results highlight that the improvement in the quantitative precipitation scenario forecast skills, supported by the adoption of the H2020 LEXIS computing facilities and by the assimilation of in situ observations, allowed the ERDS system to improve the prediction of the peak rainfall depths, thus paving the way to the potential issuing of an alert over the Palermo area.
1. Introduction
The Weather and Climate pilot of the LEXIS (Large-scale EXecution for Industry & Society) H2020 project aims at developing workflows based on weather-related models to improve existing hydro-meteorological applications for severe rainfall, flash-flood, wildland forest fires, and air quality predictions [1,2]. This pilot is taking advantage of cloud solutions and large-scale geographically distributed High-Performance Computing (HPC) resources displaced in several European countries to run experiments that require the processing of a large amount of data on a dedicated platform.
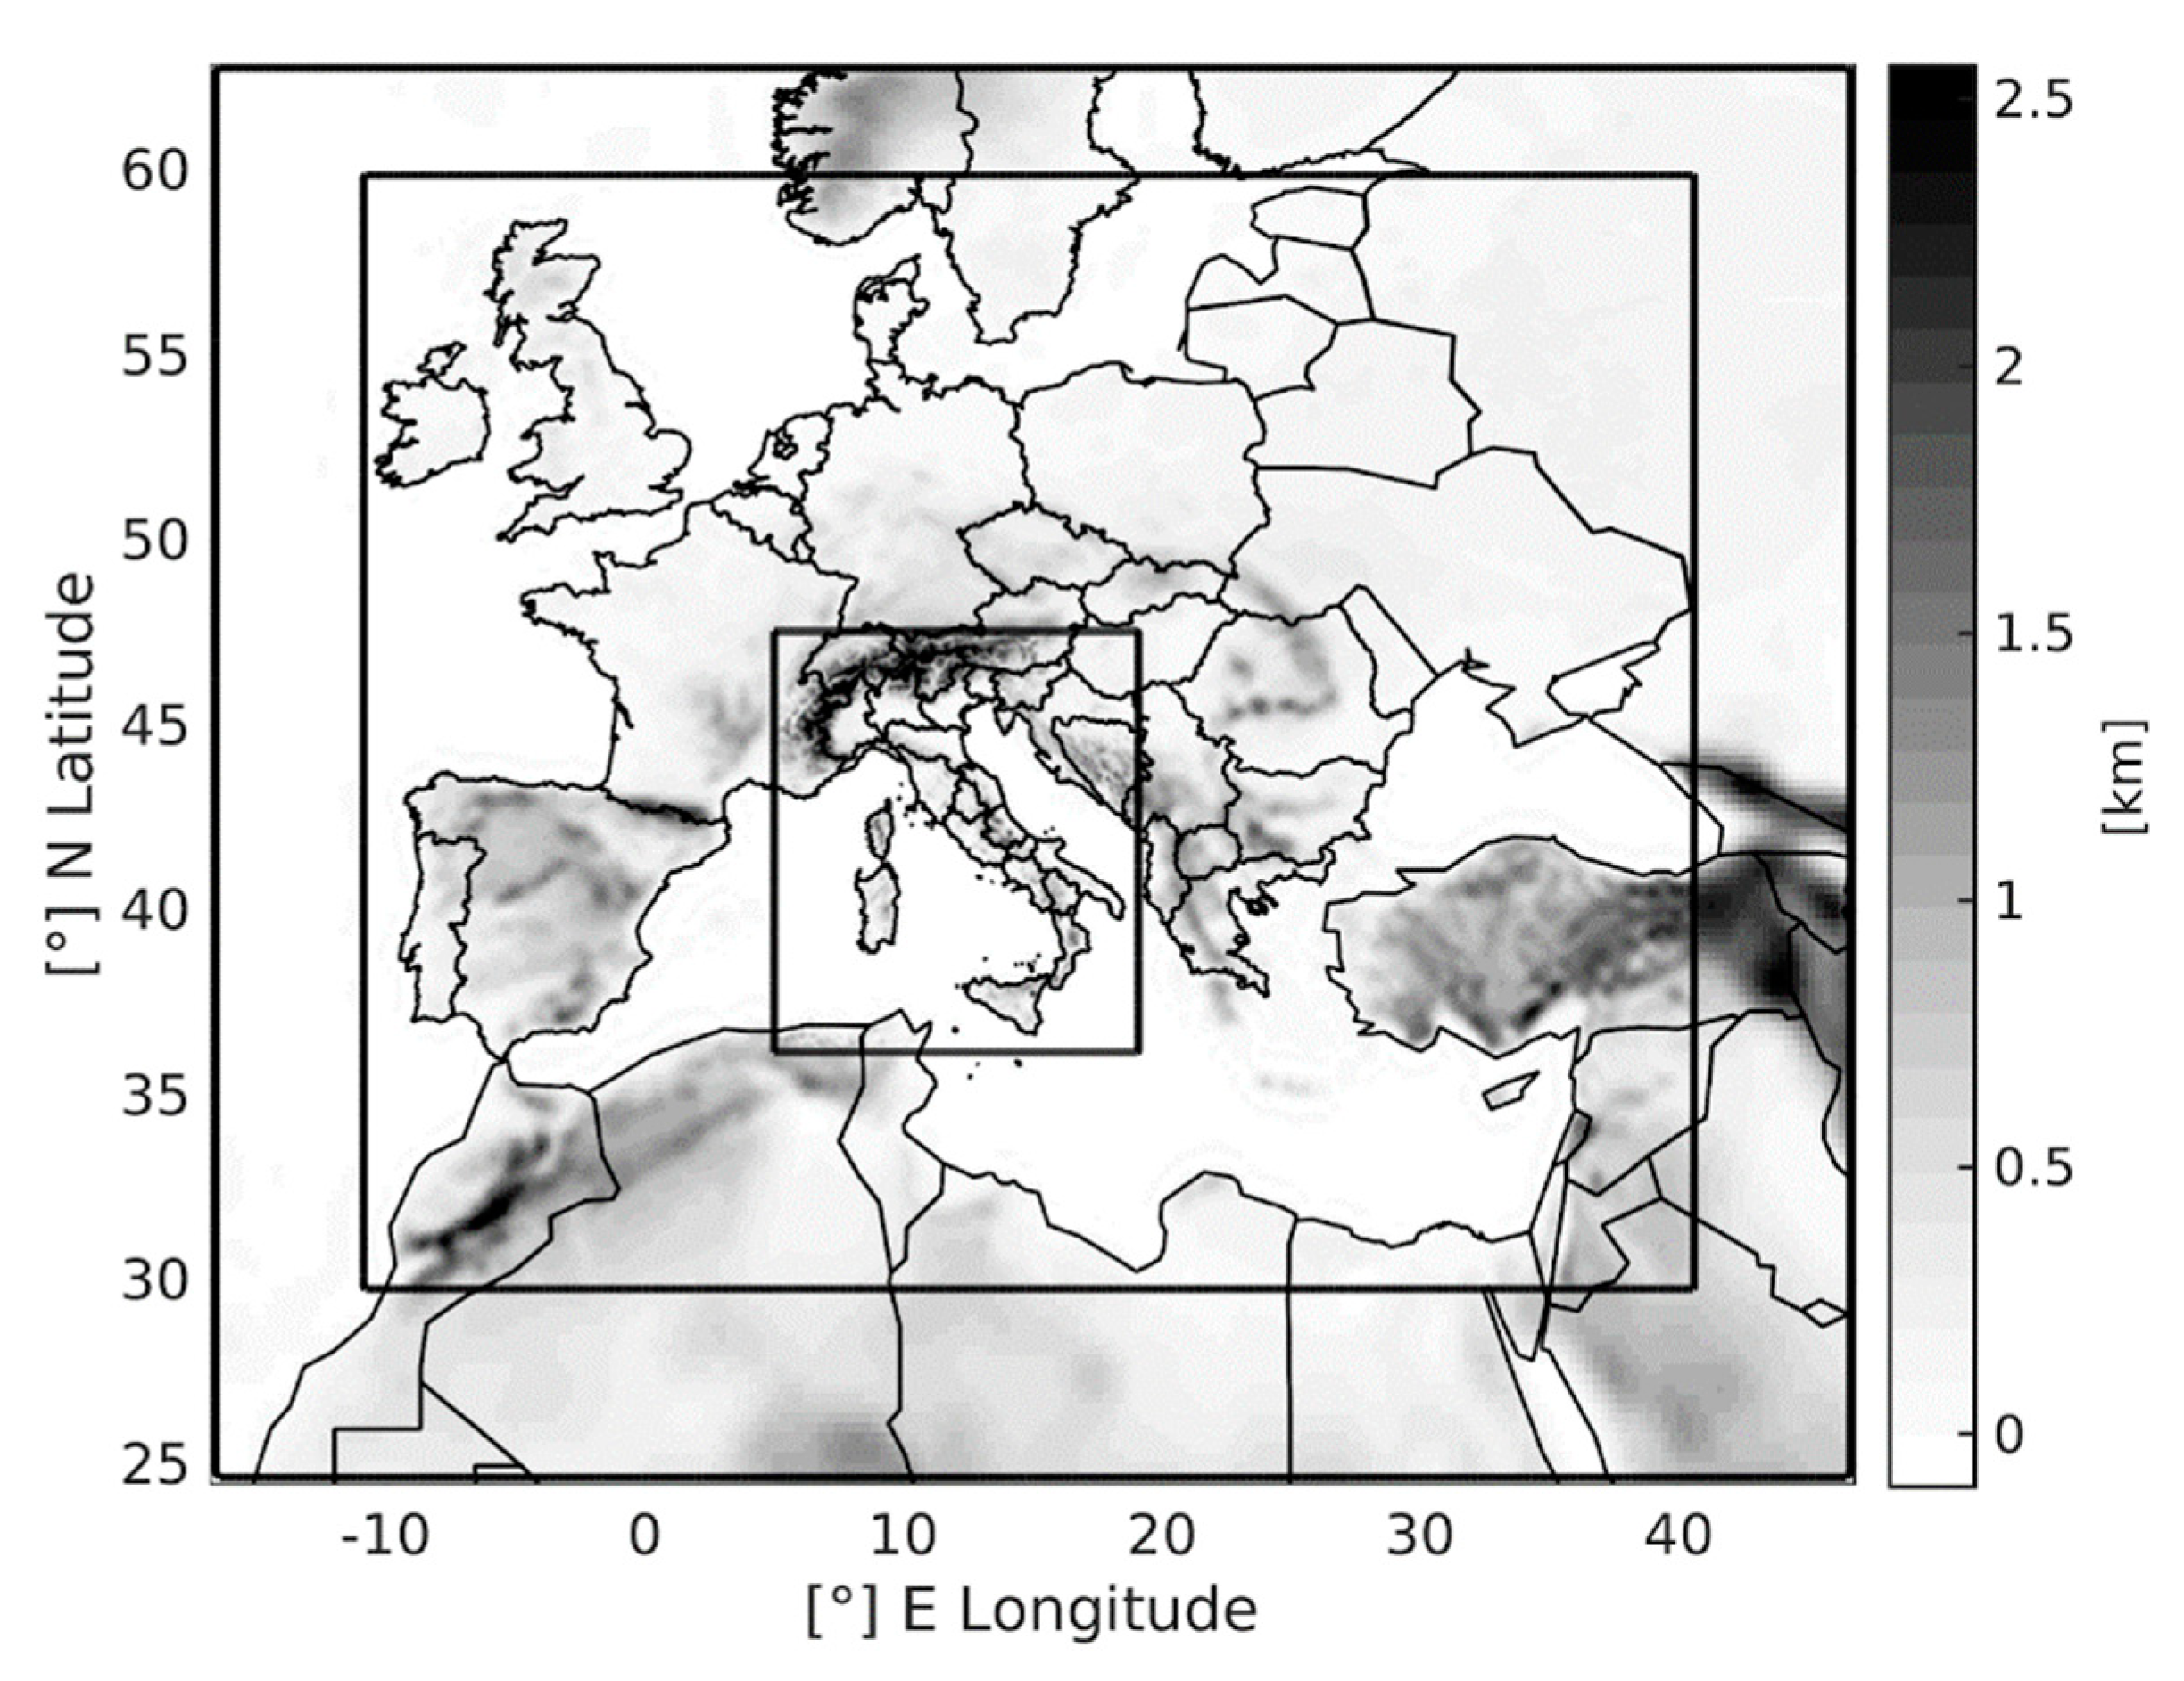
Within the project, CIMA Research Foundation is running a Weather Research and Forecasting (WRF) model with different configurations and twice-a-day updates (00 and 12 UTC), able to provide forecasts up to 48 h at hourly temporal resolution. The model has a European coverage and three nested domains of 22.5, 7.5 and 2.5 km resolution (Figure 1).
The innermost domain is centered over Italy and may involve weather radar data assimilation over Italy (reflectivity CAPPI—Constant Altitude Plan Position Indicator—at 2000, 3000, 4000 and 5000 m), alone or in combination with authoritative weather stations over the Italian area. A detailed overview of several validation studies performed by CIMA Research Foundation in mid-latitude areas is reported in [3,4].
The WRF model forecasts are then processed by the Extreme Rainfall Detection System (ERDS) [5], an early warning system developed by ITHACA to issue heavy rainfall alerts after having performed rainfall monitoring using datasets with a global (or quasi-global) spatial coverage. This system is independent from the analysis performed by the local institutions in charge of issuing hydrometeorological alerts for civil protection purposes at the national and regional levels. However, ERDS can be relevant in data-scarce regions where a dense network of in situ measurements is not available and in areas where a complete civil protection mechanism is missing or under development. Furthermore, ERDS can be used as an additional source of information in regions where a complete alerting mechanism is already up and running.
Before the inclusion of ERDS in the LEXIS project, this early warning system was executed on top of two different rainfall products. The first one is a near real-time rainfall monitoring product named Global Precipitation Measurement (GPM) Integrated Multi-satellitE Retrievals for GPM (IMERG) Early run data, available at 0.1° spatial resolution with a ~4 h latency [6]. These data are characterized by a full coverage in the 60° N–60° S latitude range, while at higher latitudes of both hemispheres (i.e., in the 30° amplitude bands up to 90°), the precipitation field is partial due to the masking out of IR-based precipitation estimates over grids with snow/ice on the surface. The second one is instead based on rainfall forecasts provided by the 00:00 and 12:00 UTC runs of the Global Forecast System (GFS) at 0.25° spatial resolution. Time intervals of 12, 24, 48, 72 and 96 h are considered in both analyses for the evaluation of the rainfall depths. GPM data are used to provide information regarding the accumulated rainfall over the past 12, 24, 48, 72 and 96 h, while GFS data are used to provide the forecasts for the upcoming 12, 24, 48, 72 and 96 h. The system was tested and validated over several case studies, highlighting good alerting capabilities [7,8,9,10,11]. However, some types of rainfall events (such as short-duration, very localized convective events) can undermine its capacity to detect extreme rainfall events [7].
In this work, we describe the integration of WRF forecasts into the ERDS system to provide more accurate and timely heavy rainfall alerts. We also describe several data assimilation experiments conducted to increase the accuracy of WRF forecasts. The tests were not only performed using the model used within the LEXIS project (i.e., the one that includes weather radar data assimilation over Italy) but also using other configurations, such as the data assimilation of in situ data collected by hygrometers, anemometers and thermometers managed by the Italian Civil Protection Department (separately in the first step, and then all together), to evaluate a possible modification of the data assimilation procedure.
The entire workflow is applied in the case of the heavy rainfall event (130 mm in about 2.5 h) that affected the city of Palermo (Sicily Island, South of Italy) during the early afternoon of 15 July 2020. This rainfall event was selected as it represents an interesting case study: it was not properly forecasted by meteorological models operational at the time of the event, thus not allowing the Italian Civil Protection to issue an alert over that area.
2. Materials and Methods
2.1. The Palermo Case Study
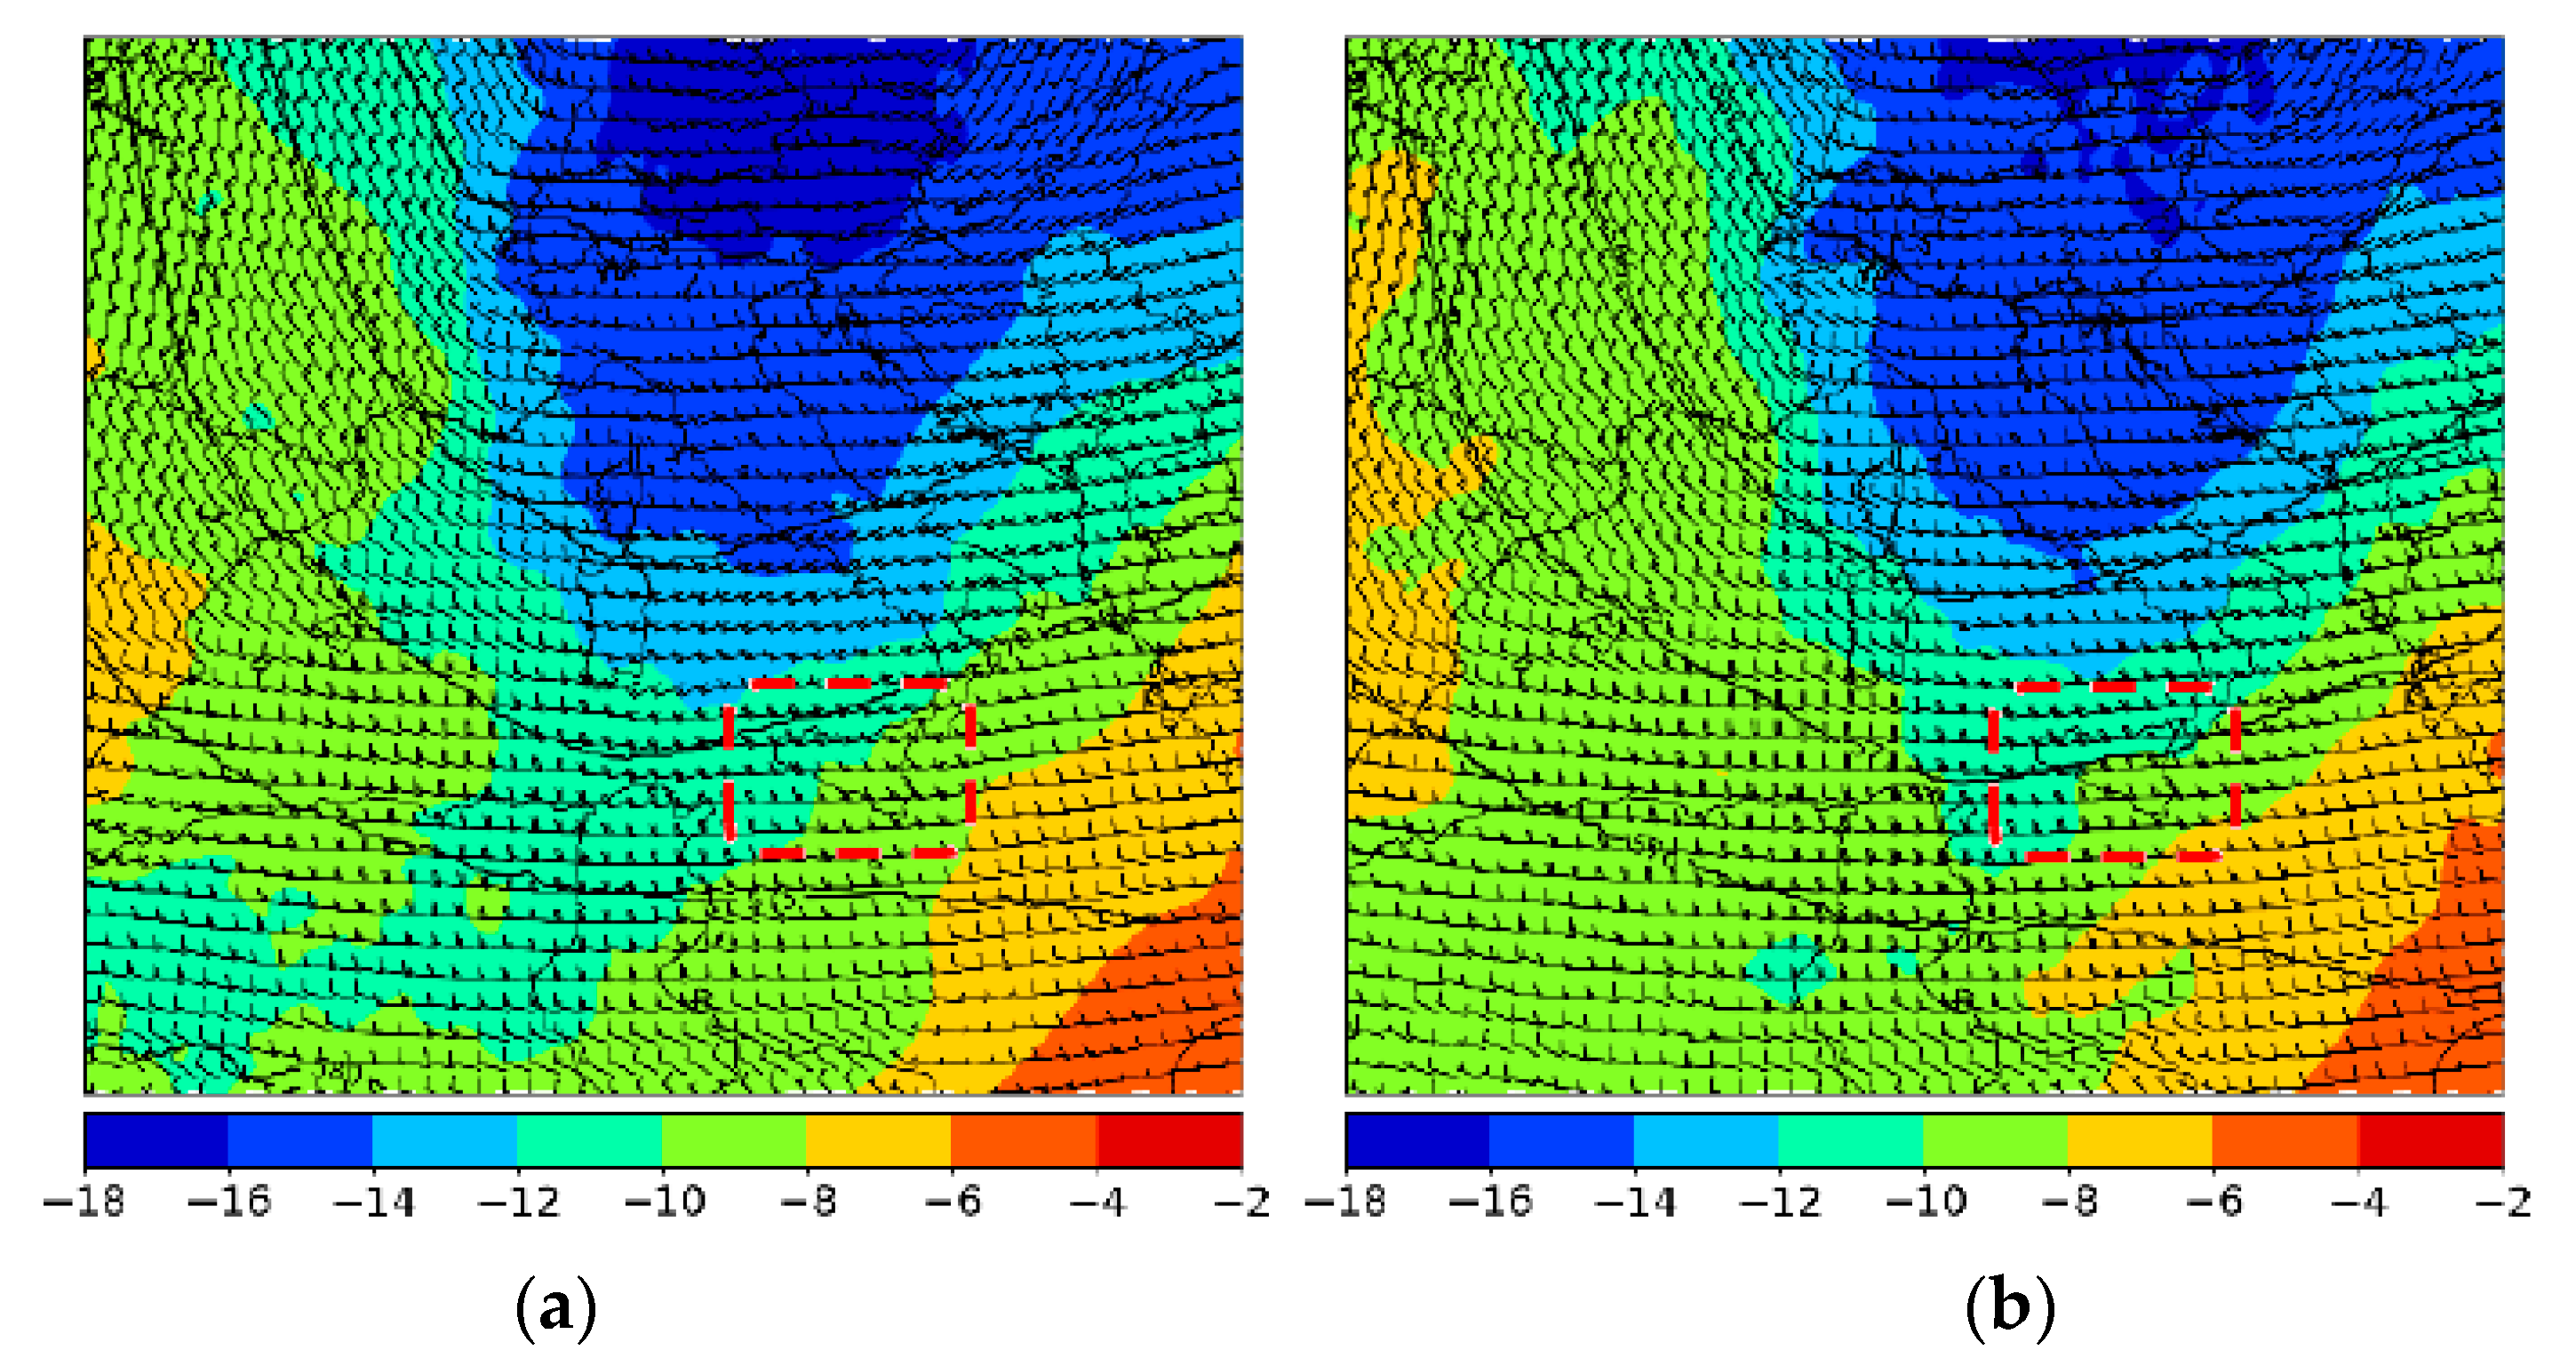
On 15 July 2020, a deep trough moved over Italy from west to east. The time evolution of the temperature, wind and geopotential at 500 hPa between 12:00 and 15:00 UTC shows the structure approaching the northern coast of Sicily and activating zonal currents that were quite intense in the upper level of the troposphere (Figure 2). Indeed, the interaction between the trough and the anticyclonic field present over North Africa favored the ascent of a branch of the subtropical jet.
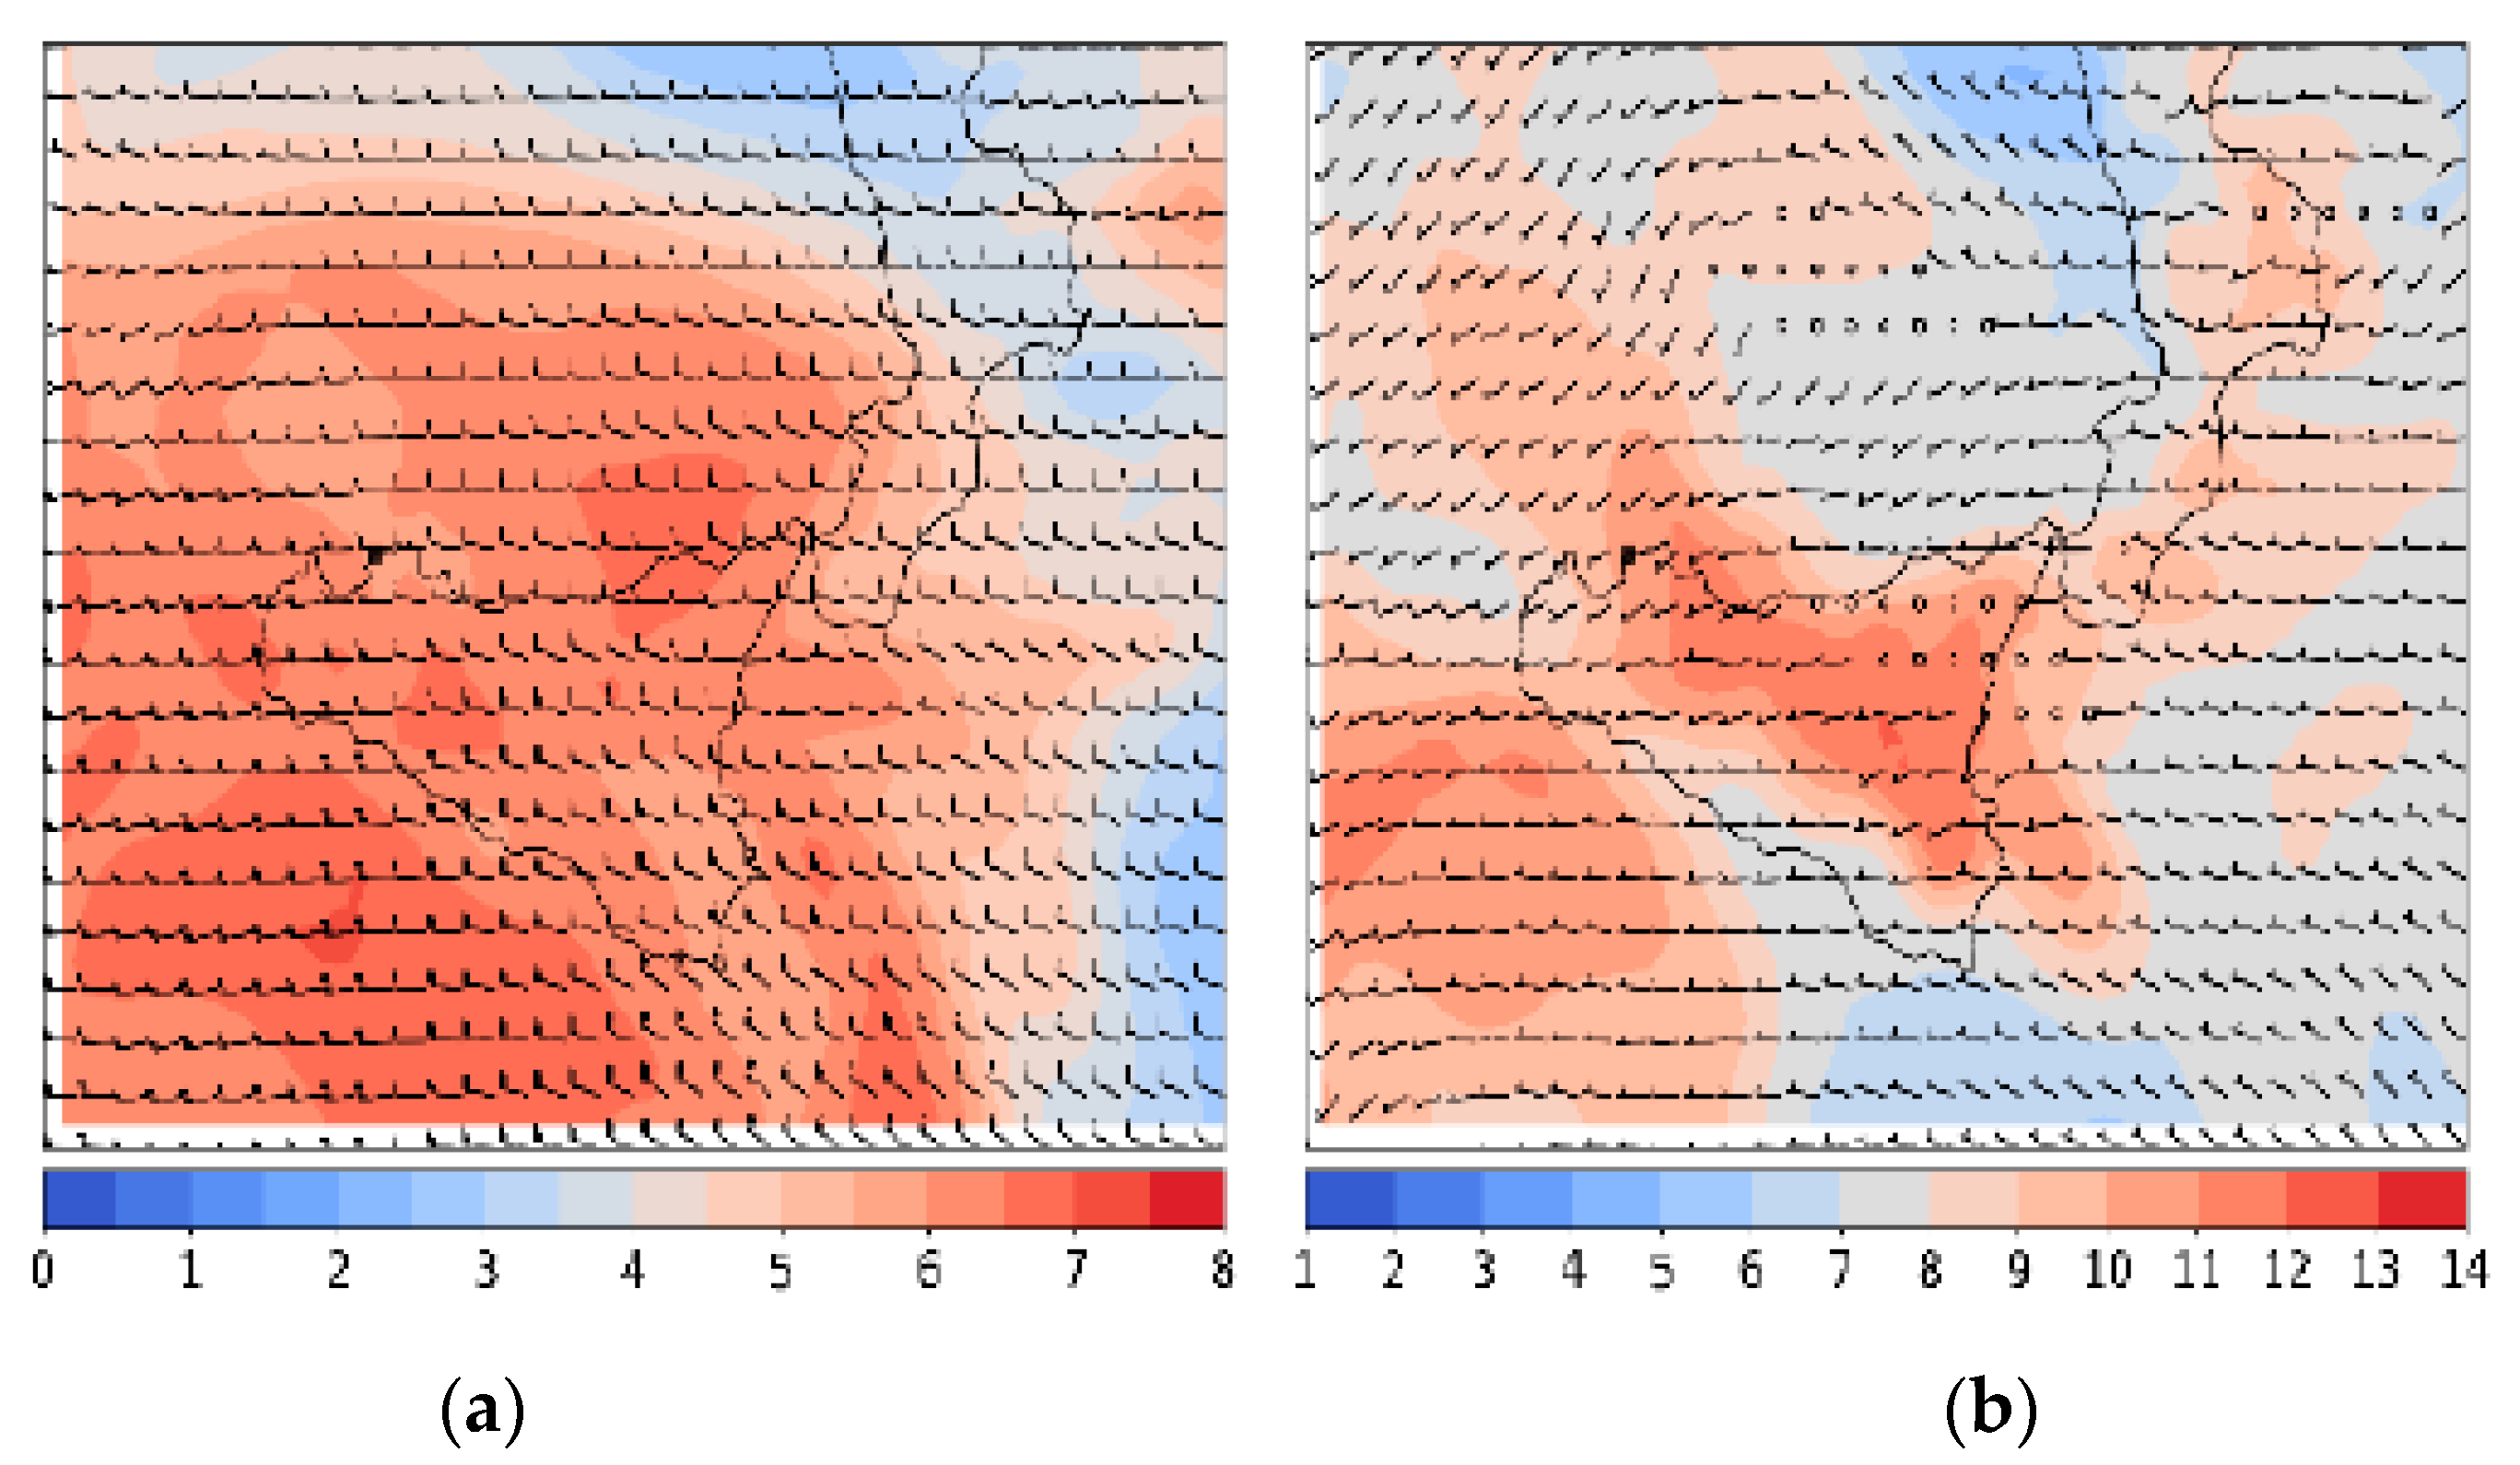
While in the higher levels of the atmosphere, the conditions were quite dynamic and unstable, in the lowest part, the humidity was rather high over the whole region (Figure 3), as shown by the specific humidity at 15:00 UTC at different elevations (700 hPa and 850 hPa, respectively).
The confluence between the air coming from the west and the weak ventilation of thermal origin (sea-breeze) from the north, characteristic of the Gulf of Palermo area, triggered intense vertical motions in the afternoon hours, which often led to the development of thunderstorm activity of thermo-convective type.
Additionally, the complex terrain around the Palermo area played an important role in promoting an orographic forcing. The probability of heavy storms was very high in the whole area of Palermo, but the system developed over the north-western part of the city. The convective tower was shifted at the top by the intense winds, creating the conditions for a self-generating cell. In fact, due to the inclination of the cell, the updraft was not disturbed by the downdraft, and the thunderstorm could persist for a couple of hours over the same point approximately.
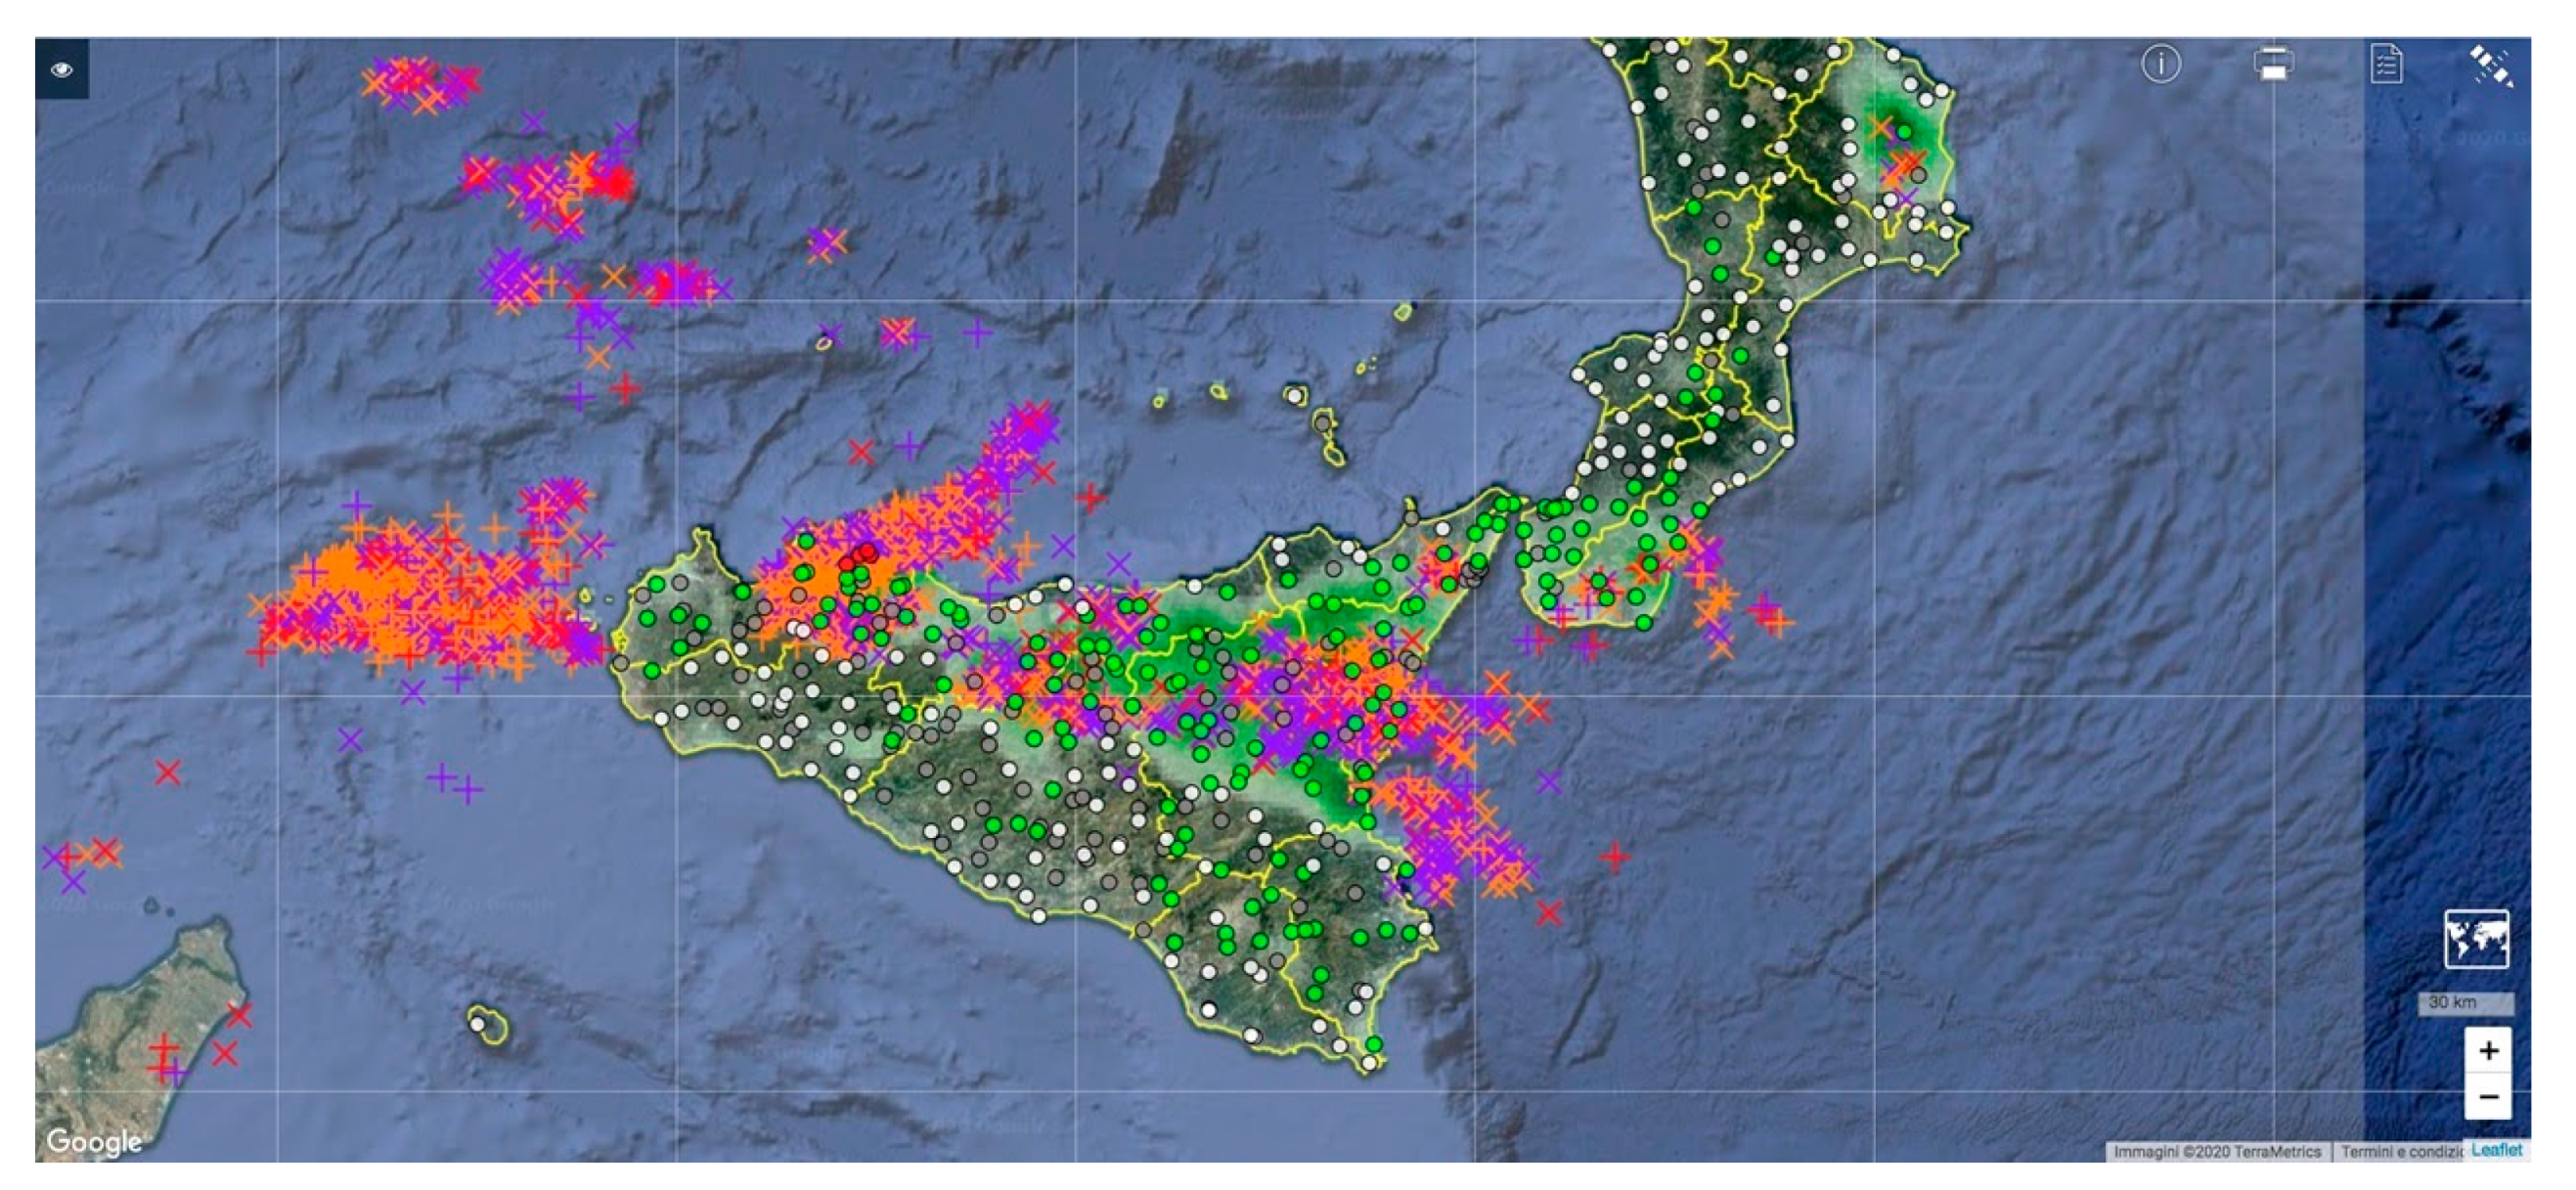
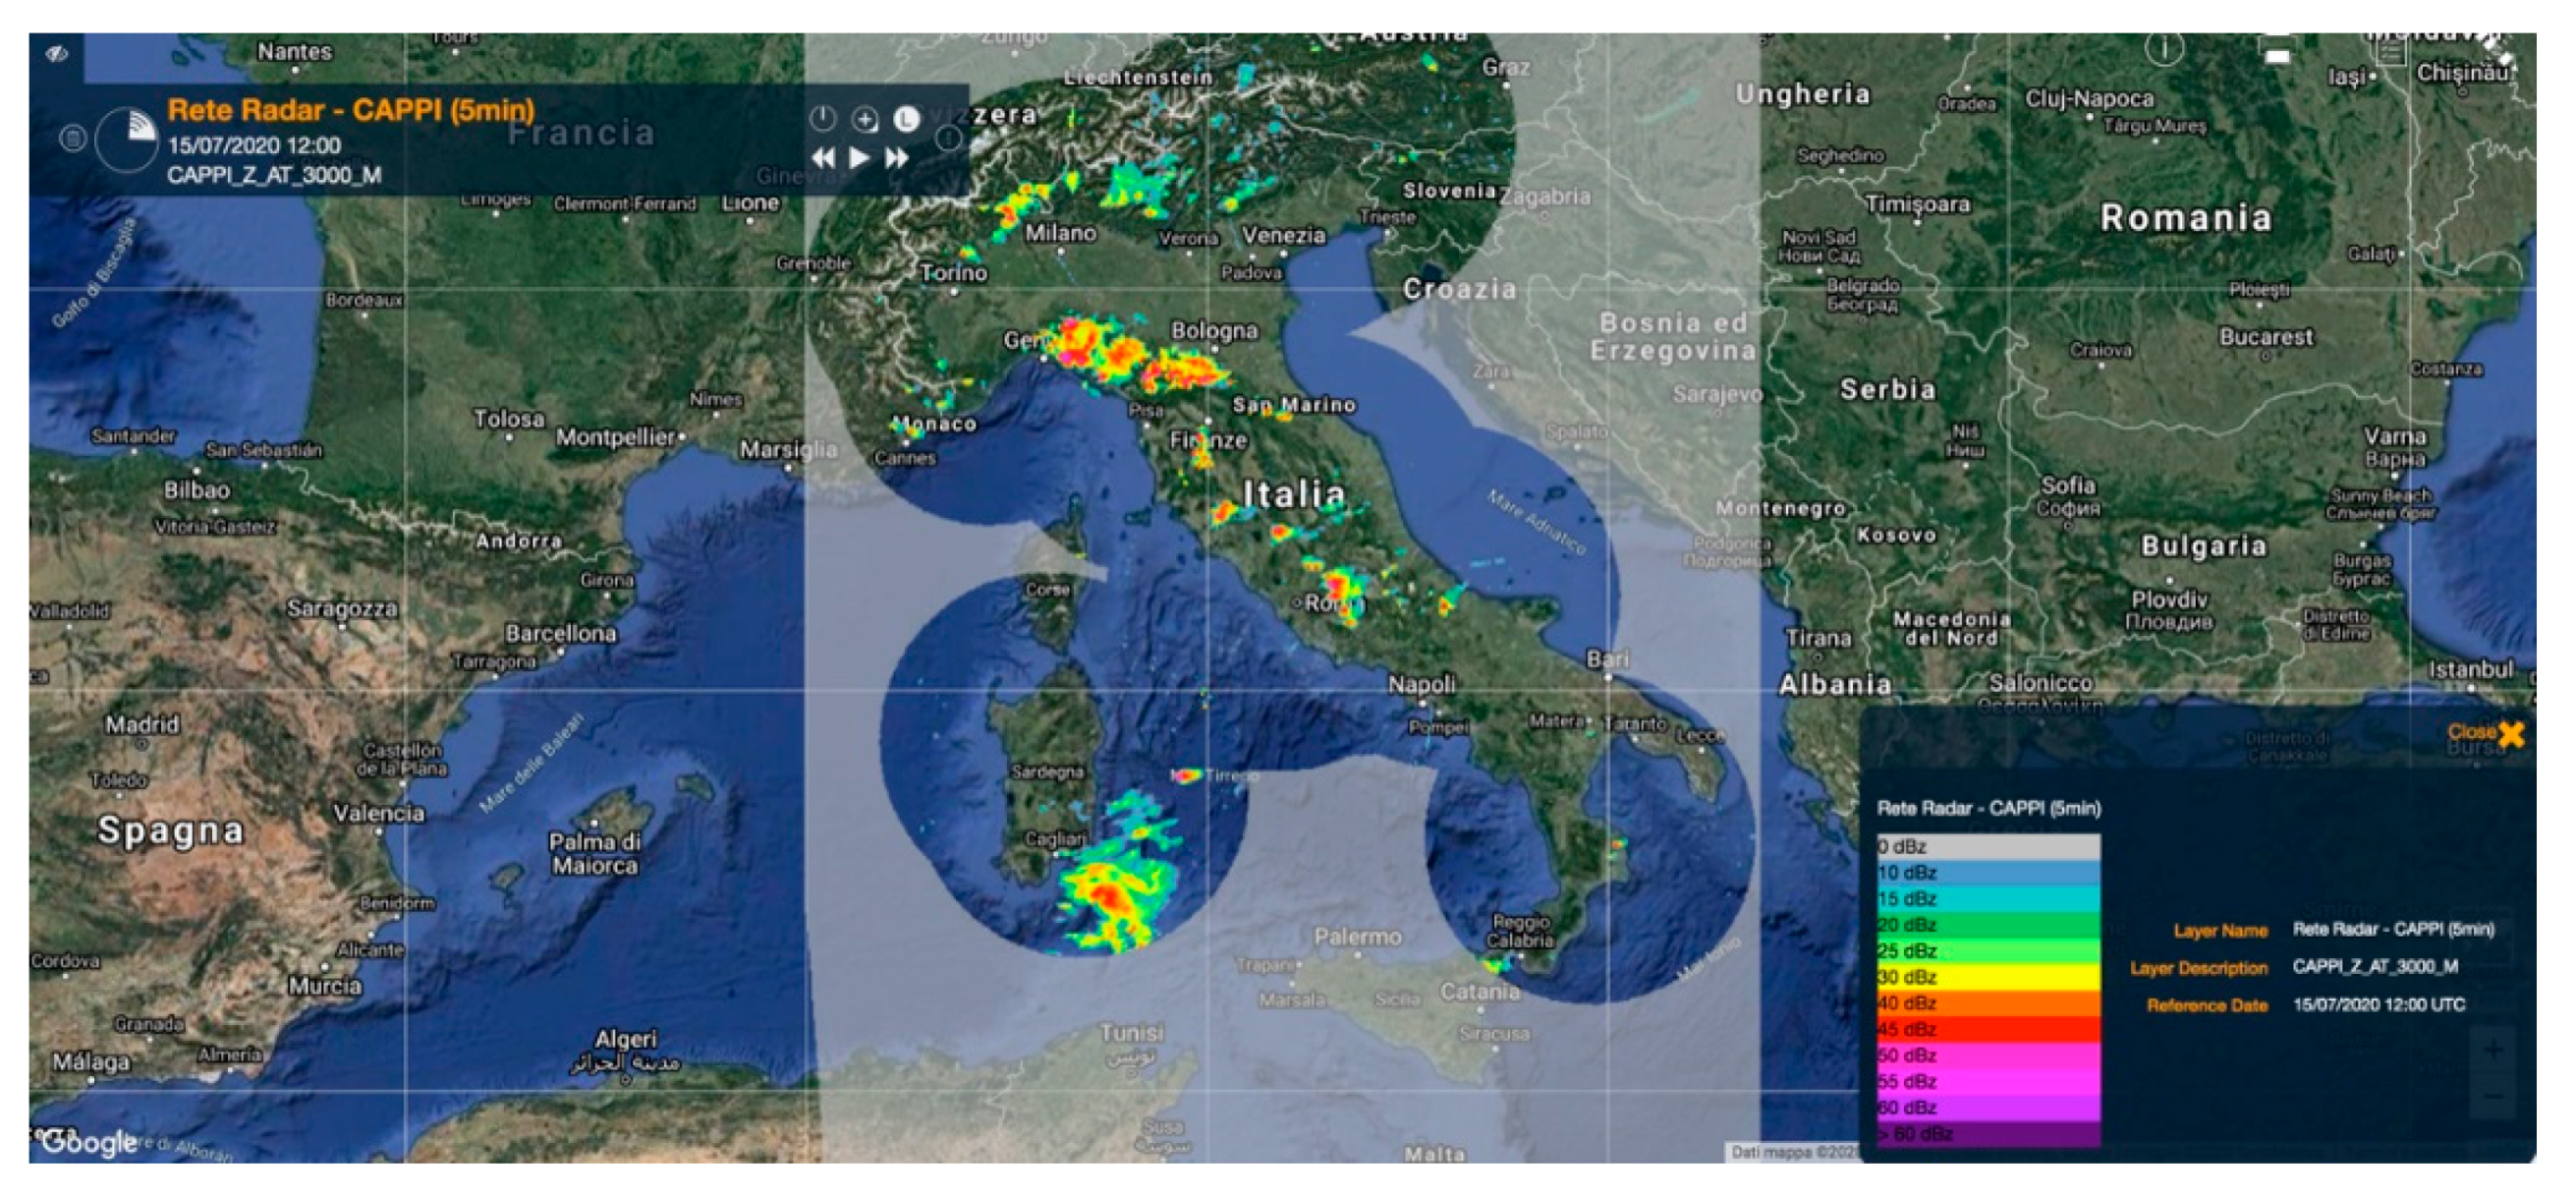
The significant convective activity over the Island is also confirmed by the lightning strikes detected by the Italian Air Force Meteorological Service (LAMPINET) from 13 to 16 UTC (Figure 4). It is worth mentioning that, during that day, the weather radar located in Sicily was not working due to technical problems (Figure 5).
According to SIAS (Servizio Informativo Agrometeorologico Siciliano) [12], more than 130 mm of rainfall was recorded in about 2.5 h at Palermo city: this severe storm was the heaviest rainfall event recorded in the city of Palermo during the last 90 years, and it represents the wettest day in July since 1797 [13]. The return period of both 1 and 3 h durations estimated by [13] using the growth curves obtained by [14] resulted in values greater than 200 years, confirming the exceptionality of this rainfall event. The hyetograph of the rainfall event (not reported here for the sake of brevity) is included in [13] together with some information regarding hourly intensities and instantaneous intensity peaks. Widespread damages caused by urban flooding phenomena were reported in the city area. More details regarding the meteorological, pluviometric and hydrological post-event analyses are reported in [13,15] together with a brief description of the effect on the ground and a collection of media news regarding the event.
This rainfall event attracted the attention of the media not only for having broken some meteorological records but also because it was not properly forecasted in its full intensity by meteorological models operational at the time of the event, thus not adequately supporting the Italian Civil Protection Department to issue an alert over the affected area. During that day, a yellow alert—on a scale from yellow (low) to orange (medium) to red (high)—for thunderstorms was issued by the Italian Civil Protection Department on northern-central and western Sicily, thus not including the Palermo area.
2.2. The WRF-ERDS Workflow
In a first step, a WRF model experiment with only weather radar data assimilation over Italy was executed for obtaining up to 48 h forecasts at 22.5, 7.5 and 2.5 km resolution: initial and boundary conditions were provided by the GFS model (18 UTC run on 14 July), thus enriched by 3DVAR assimilation of radar reflectivity CAPPI (2000, 3000 and 5000 m) at 18, 21 and 00 UTC. The data cover a box of about 50° × 30° extent, with longitudes between −11° and 41°, and latitudes between 30° and 60° and is available with bi-daily updates (00 and 12 UTC model run). In this work, we analyzed the 00 UTC model runs of both the 14 and the 15 July, and the 12 UTC model run of the 15 July. The results presented here focus on both the 7.5 km and the 2.5 km resolution data, while the 22.5 km resolution ones are not presented and discussed due to their coarse spatial resolution comparable with GFS one.
Then, a WRF modeling experiment with three nested domains characterized by 22.5, 7.5 and 2.5 km grid spacing was executed, assimilating both weather radar data and combinations of in situ data collected over Italy by hygrometers, anemometers and thermometers managed by the regional hydrological agencies and collected by the Italian Civil Protection Department into the 15 July 12:00 UTC model run (3DVAR of radar data, and combinations of hygrometers, anemometers and thermometers at 06, 09 and 12 UTC into GFS run 06 UTC). The results obtained at a 2.5 km resolution are presented and compared with the one produced by the first set of simulations (i.e., the ones performed using only the data assimilation of weather radar data).
In this work, GFS model data have been selected for the provision of the initial and boundary conditions because it is available free of charge. Integrated Forecasting System (IFS) data produced by ECMWF was not tested due to the complex data policy. In general, IFS data are available upon payment, making its use not suitable for inclusion in an operational system for weather prediction with bi-daily updates like the WRF-ERDS workflow.
2.3. The Extreme Rainfall Detection
The extreme rainfall detection is performed using a pixel-by-pixel approach by comparing maps of rainfall amounts (evaluated separately on the basis of GPM, GFS and WRF data) with maps of pre-calculated rainfall thresholds: an alert is issued if the accumulated rainfall exceeds a specific threshold value [7]. The alerts issued with this procedure are then processed by applying a binary mask that distinguishes pixels covered by land from pixels covered by water (sea or ocean). This mask was obtained by processing the water cover map provided by NASA [16], which contains the water percentage of each 0.1° cell (0 to 100%). Alerts issued over water surfaces are discarded.
This thresholding approach is not new: many meteorological hazards (such as rainfall, flooding, landslides and temperature) are currently detected, analyzing the probability of overcoming thresholds that are defined on the basis of historical measurements recorded over a given area [7,17,18,19,20,21]. In our case, this analysis is performed using threshold values that are both space-dependent (each pixel has its threshold value) and time-dependent (each rainfall duration has its threshold value).
The rainfall thresholds used by ERDS were estimated using an optimization technique, running a set of simulations (more information will be provided in the following) and identifying the threshold values that allow maximizing the number of identified events while minimizing the number of false alarms, as performed in [7].
We applied a specific calibration procedure for each dataset processed by ERDS. Threshold values that are currently applied to GPM data have been evaluated using GPM data covering the period 2014–2017 [7], while GFS data have been evaluated using GFS data covering the period 2015–2019. Threshold values that will be applied to WRF data cannot be calibrated using historical WRF forecasts since historical WRF data were not available for calibration purposes. Moreover, it would be impossible to run the WRF model over a quite long period (5–10 years) due to the lack of historical weather radar data needed by the model in the data assimilation step and the computational effort needed beyond the reach of this study. Gridded datasets with global or European coverage and with characteristics similar to WRF forecasts (European coverage, 7.5 km spatial resolution and 1 h temporal resolution) were investigated. It was then decided to use ERA5-Land as its characteristics are comparable: ERA5-Land is a reanalysis dataset produced by ECMWF at a 0.1° (about 9 km) spatial resolution and 1 h temporal resolution that combines model data with observations by using atmospheric variables (such as air temperature and air humidity) as input to control the simulated land fields (atmospheric forcing). Among all the available variables, we only used the total precipitation, which is the sum of large-scale and convective precipitation. Only the data in the 2010–2019 time period included in the 50° × 30° box analyzed by the WRF model were considered.
The first step necessary for the threshold calibration was searching the databases of hydrometeorological disasters to be used as truth data. As performed in [7], for the WRF threshold evaluation, we used disaster records contained in disaster databases, such as the Emergency Events Database (EM-DAT) [22], Floodlist [23], ReliefWeb [24], Desinventar [25], the European Severe Weather Database (ESWD) [26] and Severe Weather Europe [27], integrated using newspaper news, case studies addressed in scientific articles and with disaster reports, where available (see, e.g., [28] for more information regarding the disaster reports drawn by the Decentralized Functional Centers of the Italian Civil Protection). Only records related to the European countries were considered, for a total of 807 different heavy rainfall events that caused severe ground effects.
Each temporal interval (in this case, 24 and 48 h intervals) was analyzed separately. Maps of accumulated rainfall were evaluated over the entire 10-year period, and then several threshold masks were applied to identify potential heavy rainfall alerts. Thresholds equal to a percentage of the mean annual precipitation (calculated using 10 years of ERA5-Land data, from 2010 to 2019) were used. The threshold masks were evaluated using the equation
where:
T = MAP × p,
- T is the threshold mask, expressed in mm;
- MAP is the mean annual precipitation, expressed in mm;
- p is a parameter that represents the percentage of the mean annual precipitation leading to the extreme event identification (0 to 100%).
Percentages ranging from 4 to 8% were used. A lower and an upper bound were also applied to the threshold masks because the precipitation does not occur with the same frequency and intensity in every place of the world [7,29]. There are in fact places where the mean annual precipitation is very low (below 100–200 mm of rainfall), which would lead to extremely low threshold values, comparable with the model error. These extremely low threshold values would lead to a high number of false alarms. Conversely, there are places where the precipitation tends to occur with lower intensity but higher frequency. Mean annual precipitation of more than 2000 mm would lead to very high threshold values, not allowing the system to provide alerts. We then decided to test different lower (40 to 190 mm, with a 10 mm step) and upper (50 to 200 mm, with a 10 mm step) bounds. A total of 680 different threshold masks were thus tested for each aggregation interval.
For each threshold mask, the dates of the alerts issued by ERDS were compared with the dates of the hydrometeorological disasters to evaluate missed alarms, false alarms and identified events. Missed alarms and false alarms were then combined, as performed in [7], to evaluate the total cost of the threshold masks, using the equation
where:
TC(T) = nFA(T) × CFA + nMA(T) × CMA,
- TC(T) is the total cost related to the threshold T;
- nFA(T) is the number of false alarms issued using the threshold T;
- CFA is the false alarm cost (equal to 1, as adopted in [7]);
- nMA(T) is the number of missed alarms issued using the threshold T;
- CMA is the missed alarm cost (equal to 5, as adopted in [7]).
Finally, the optimal threshold mask corresponds to the one that is able to minimize the total cost. The threshold masks evaluated using ERA5-Land data were then resampled at 7.5 and 2.5 km to match the WRF model’s data resolution.
3. Results
3.1. The Rainfall Thresholds
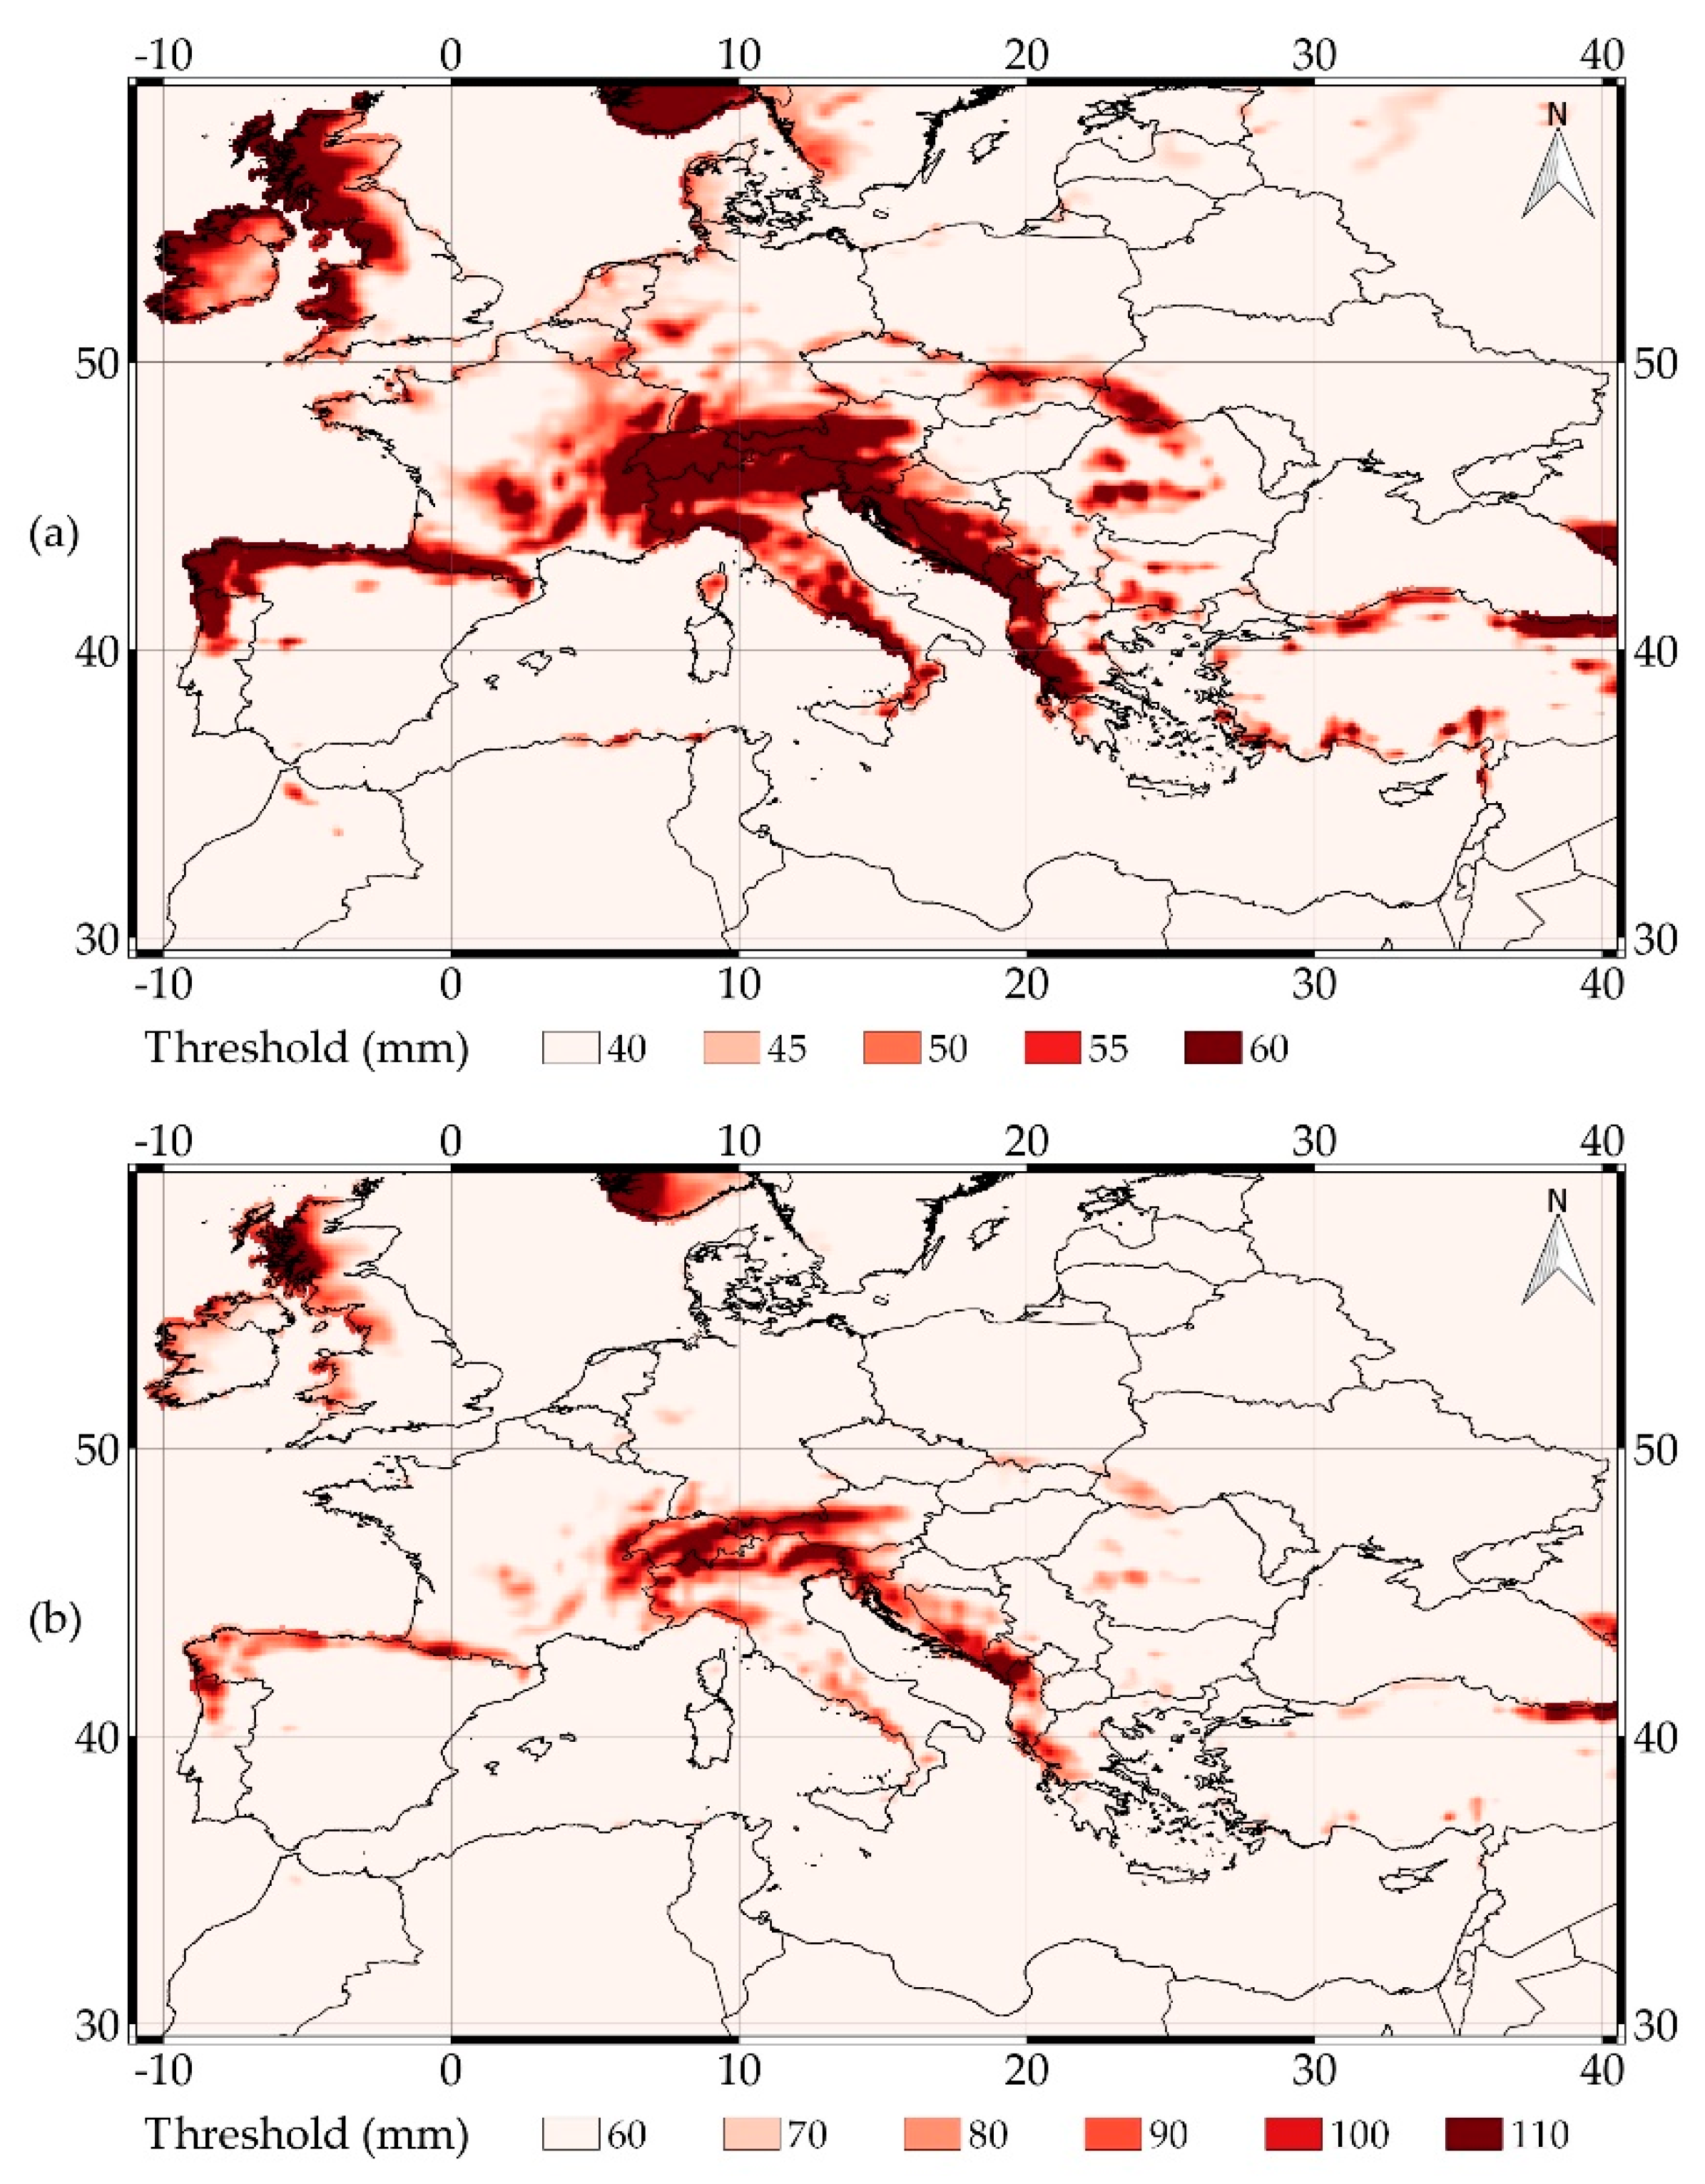
The rainfall thresholds currently applied by ERDS to WRF data, obtained with the methodology described in Section 2, are shown in Figure 6. For the 24 h interval, the best results were achieved using the threshold mask characterized by p = 5%, a lower bound equal to 40 mm and an upper bound equal to 60 mm. For the 48 h interval, instead, the selected mask has p = 6%, lower bound equal to 60 mm and upper bound equal to 110 mm.
3.2. The Palermo Case Study
The event was analyzed by using both ERDS and the WRF-ERDS workflow as performed every day in real-time mode. Maps of rainfall depths were evaluated using the different datasets, and then the thresholds masks were applied to evaluate the possible presence of heavy rainfall events.
GPM data cannot be used in real-time for this type of event due to the ~4 h latency in data availability. In this case, the data latency is longer than the event duration, so the alerts can be provided when they would not be useful anymore. The information provided by ERDS using these data both in terms of rainfall depth and heavy rainfall alerts is therefore not reported here for the sake of brevity.
The event was thus first analyzed using GFS forecasts. No alert was issued by ERDS using GFS data as input due to a severe underestimation in the rainfall forecasts. About 5 mm in 48 h were forecasted in that area by both the 00:00 UTC and the 12:00 UTC model runs of the 14 July. The same amounts were provided by the 24 and 48 h forecasts of the 15 July 00:00 UTC model run.
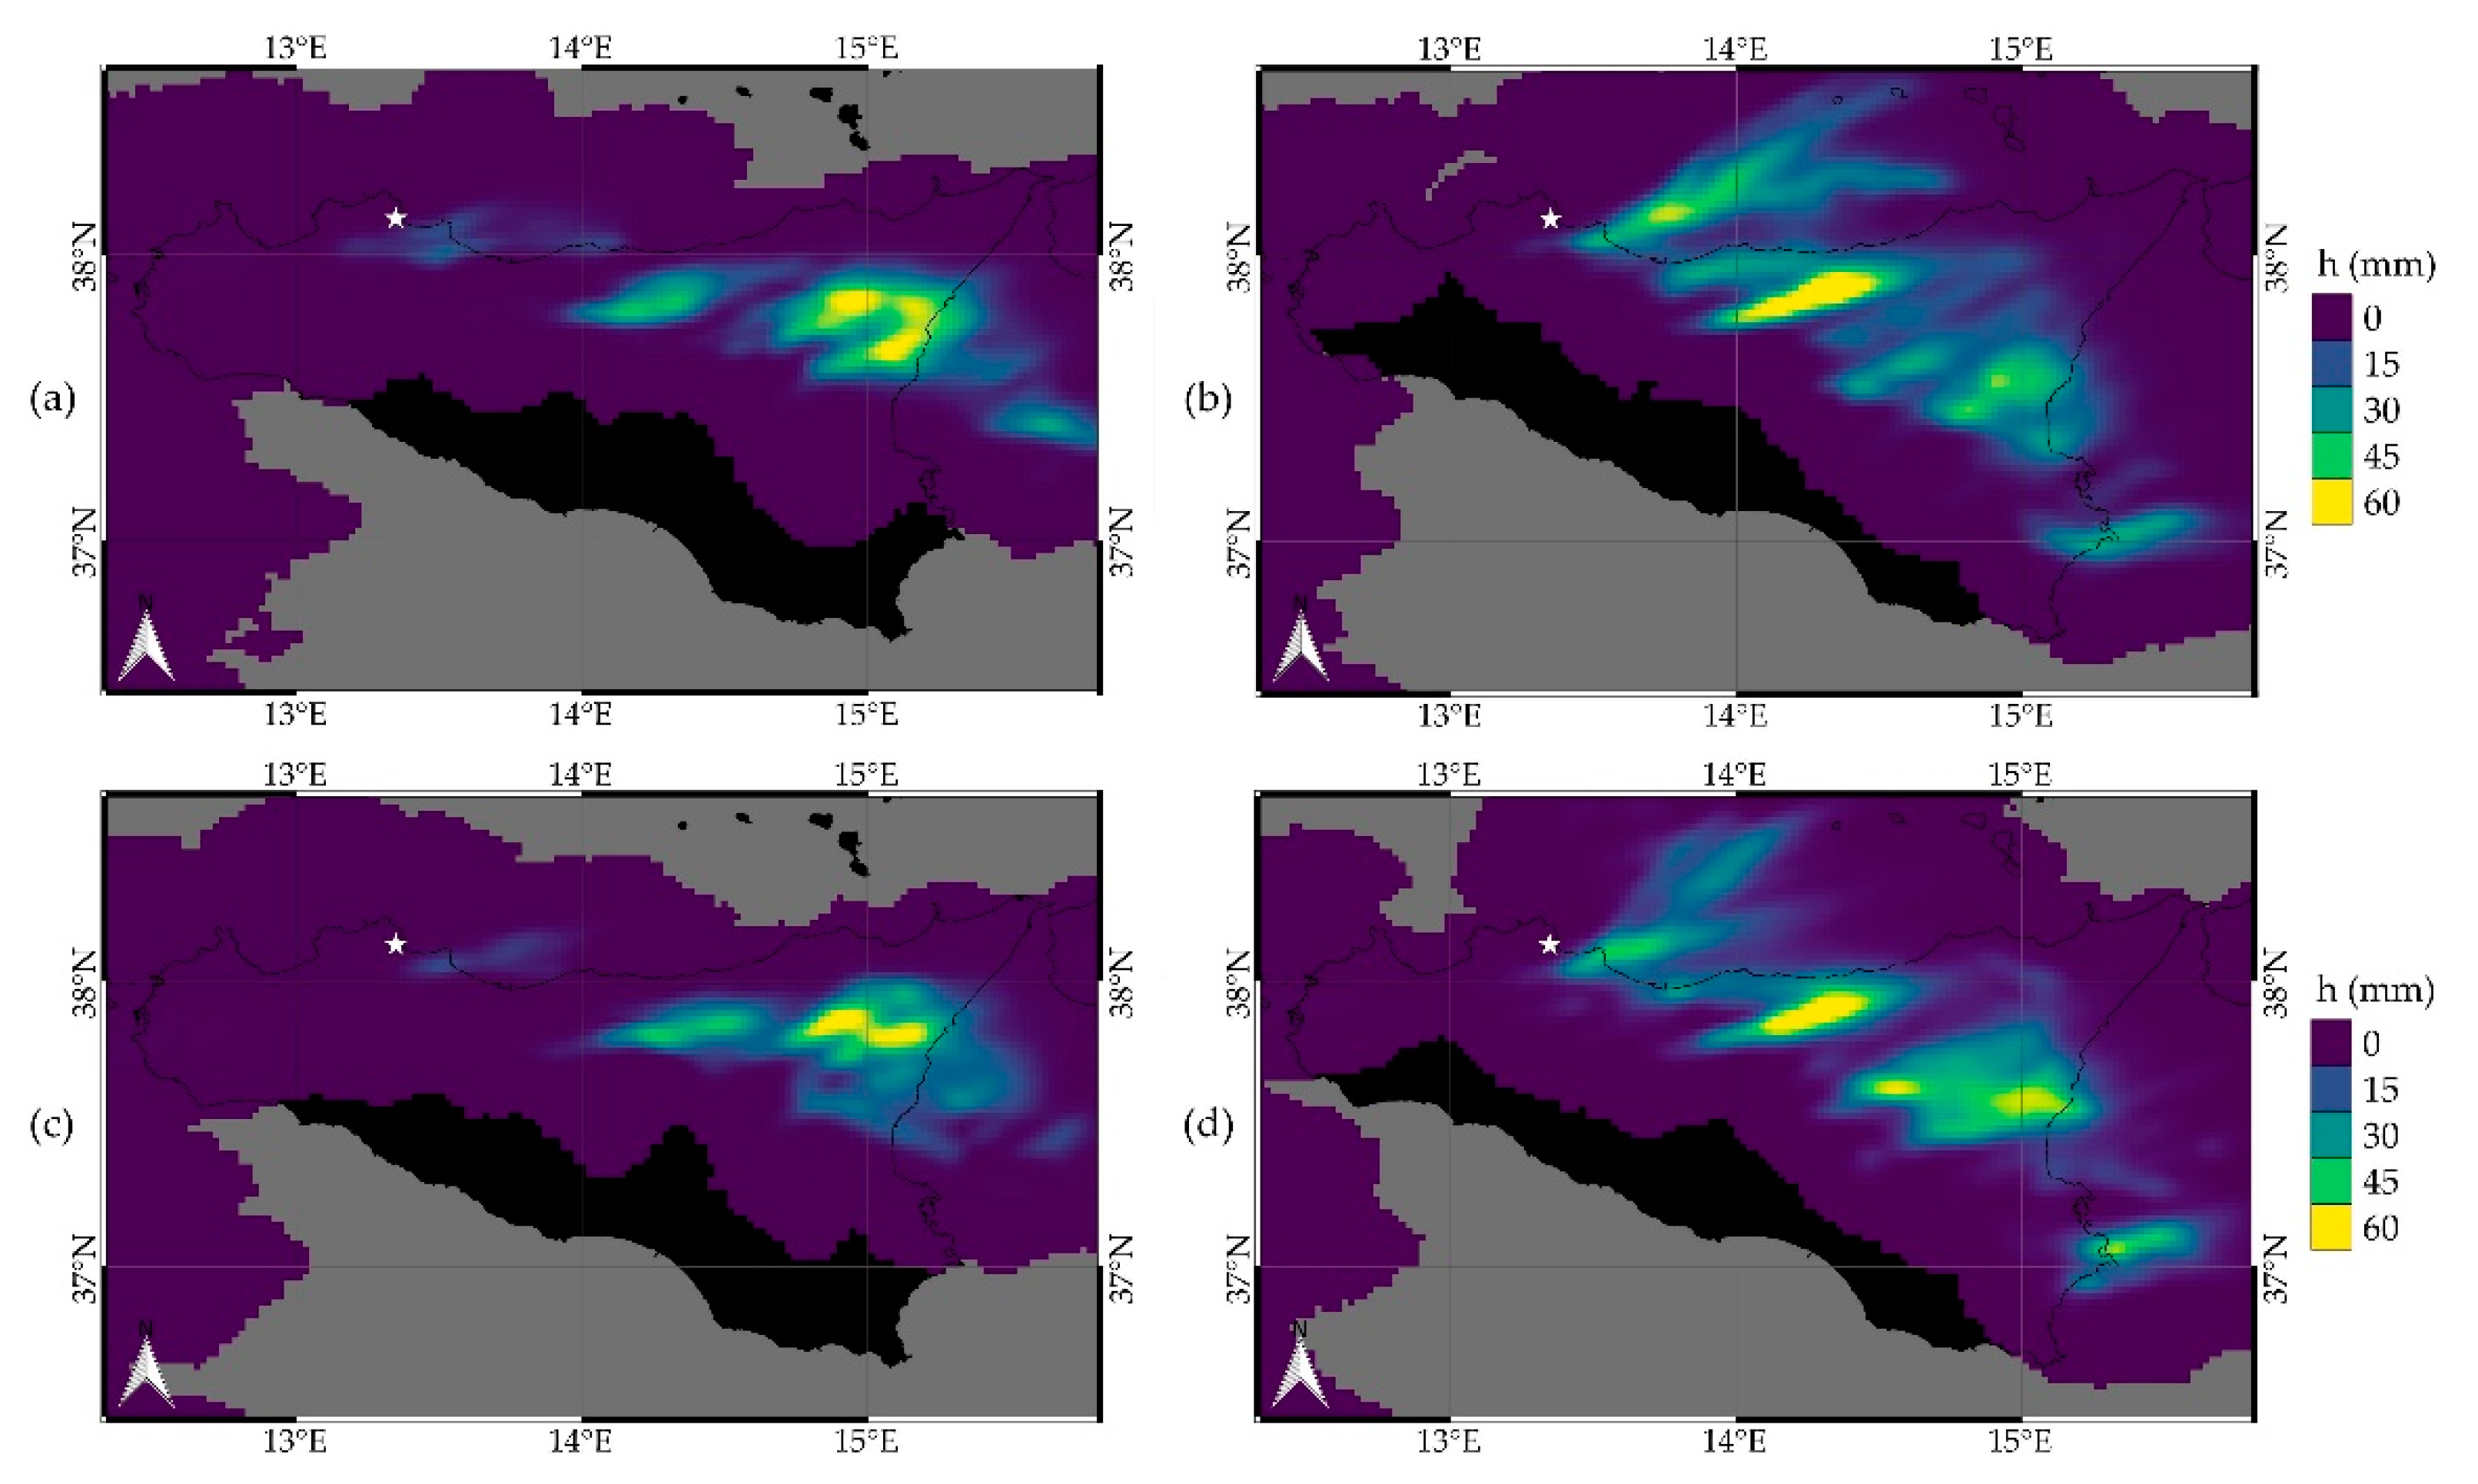
The standard configuration of the WRF model used within the LEXIS project (i.e., the one with radar data assimilation over Italy) produced better forecasts (compared to GFS ones). However, these forecasts are also affected by an underestimation of the rainfall depth. The WRF forecasts at 7.5 km were analyzed in a first step. The 00:00 UTC model run on 14 July forecasted 48 mm of rainfall in the following 48 h in the eastern areas nearby Palermo, a few km far from the city center (Figure 7a). A heavy rainfall alert was unfortunately not issued by ERDS (Figure 7b) due to this underestimation (the 48 h threshold for that area is 60 mm; see Figure 6b for a comparison). The situation worsened using the 00:00 UTC model run of the 15 July, which forecasted a different rainfall pattern, slightly shifted south, with only 2 mm of rainfall in the following 24 h over Palermo (Figure 7c) and, consequently, no alerts (Figure 7d), and the 12:00 UTC model run of the 15 July, which forecasted 5 mm in the upcoming 24 h (not reported here for the sake of brevity).
Additionally, the predicted rain at 2.5 km resolution is less than observed. The 00:00 UTC model run of the 14 July forecasted 56 mm of rainfall in the upcoming 48 h near Palermo, about 10 km far from the city center (Figure 7e), thus producing a better forecast compared to the 7.5 km resolution one. This forecast did not allow an alert to be issued over the city. However, an alert was issued 30 km far from Palermo, in the southeast direction (Figure 7f). The 00:00 UTC model run of the 15 July forecasted a different rainfall pattern, as in the 7.5 km resolution case, with 24 h rainfall depths that reach lower values than those obtained the previous day (Figure 7g). Moreover, in this case, an alert was issued about 20 km far from Palermo, while no alerts were issued over the city (Figure 7h).
A set of experiments was then executed using the 15 July 12:00 UTC model run by assimilating not only weather radar data but also in situ weather data (hygrometers, thermometers and anemometers) collected by the Italian Civil Protection Department in the data assimilation procedure. The in situ data were assimilated separately in a first step and then all together.
Figure 8a shows the rainfall depth at 2.5 km resolution forecasted from 12 to 16 UTC by the WRF model experiment on the 15 July at 12:00 UTC using only the weather radar data assimilation and serves as a reference. Figure 8b shows the same forecast, obtained with data assimilation of weather radar data and hygrometers: higher rainfall depths were forecasted not too far from the Palermo area, over the sea, in the northeast direction. Anemometers were used in place of hygrometers in the simulation shown in Figure 8c. Unfortunately, the inclusion of these data reduced the rainfall depth forecast. The final test, conducted by assimilating weather radar data and anemometer, hygrometers and thermometers, is instead reported in Figure 8d. This final test produces the best forecast, even if an underestimation is still present. It results in the prediction of around 50 mm of rainfall in 3 h less than 30 km far from the most affected area (Figure 8d). This value, if analyzed using the approach applied by the Italian Civil Protection Department, would support at least a yellow alert over Palermo.
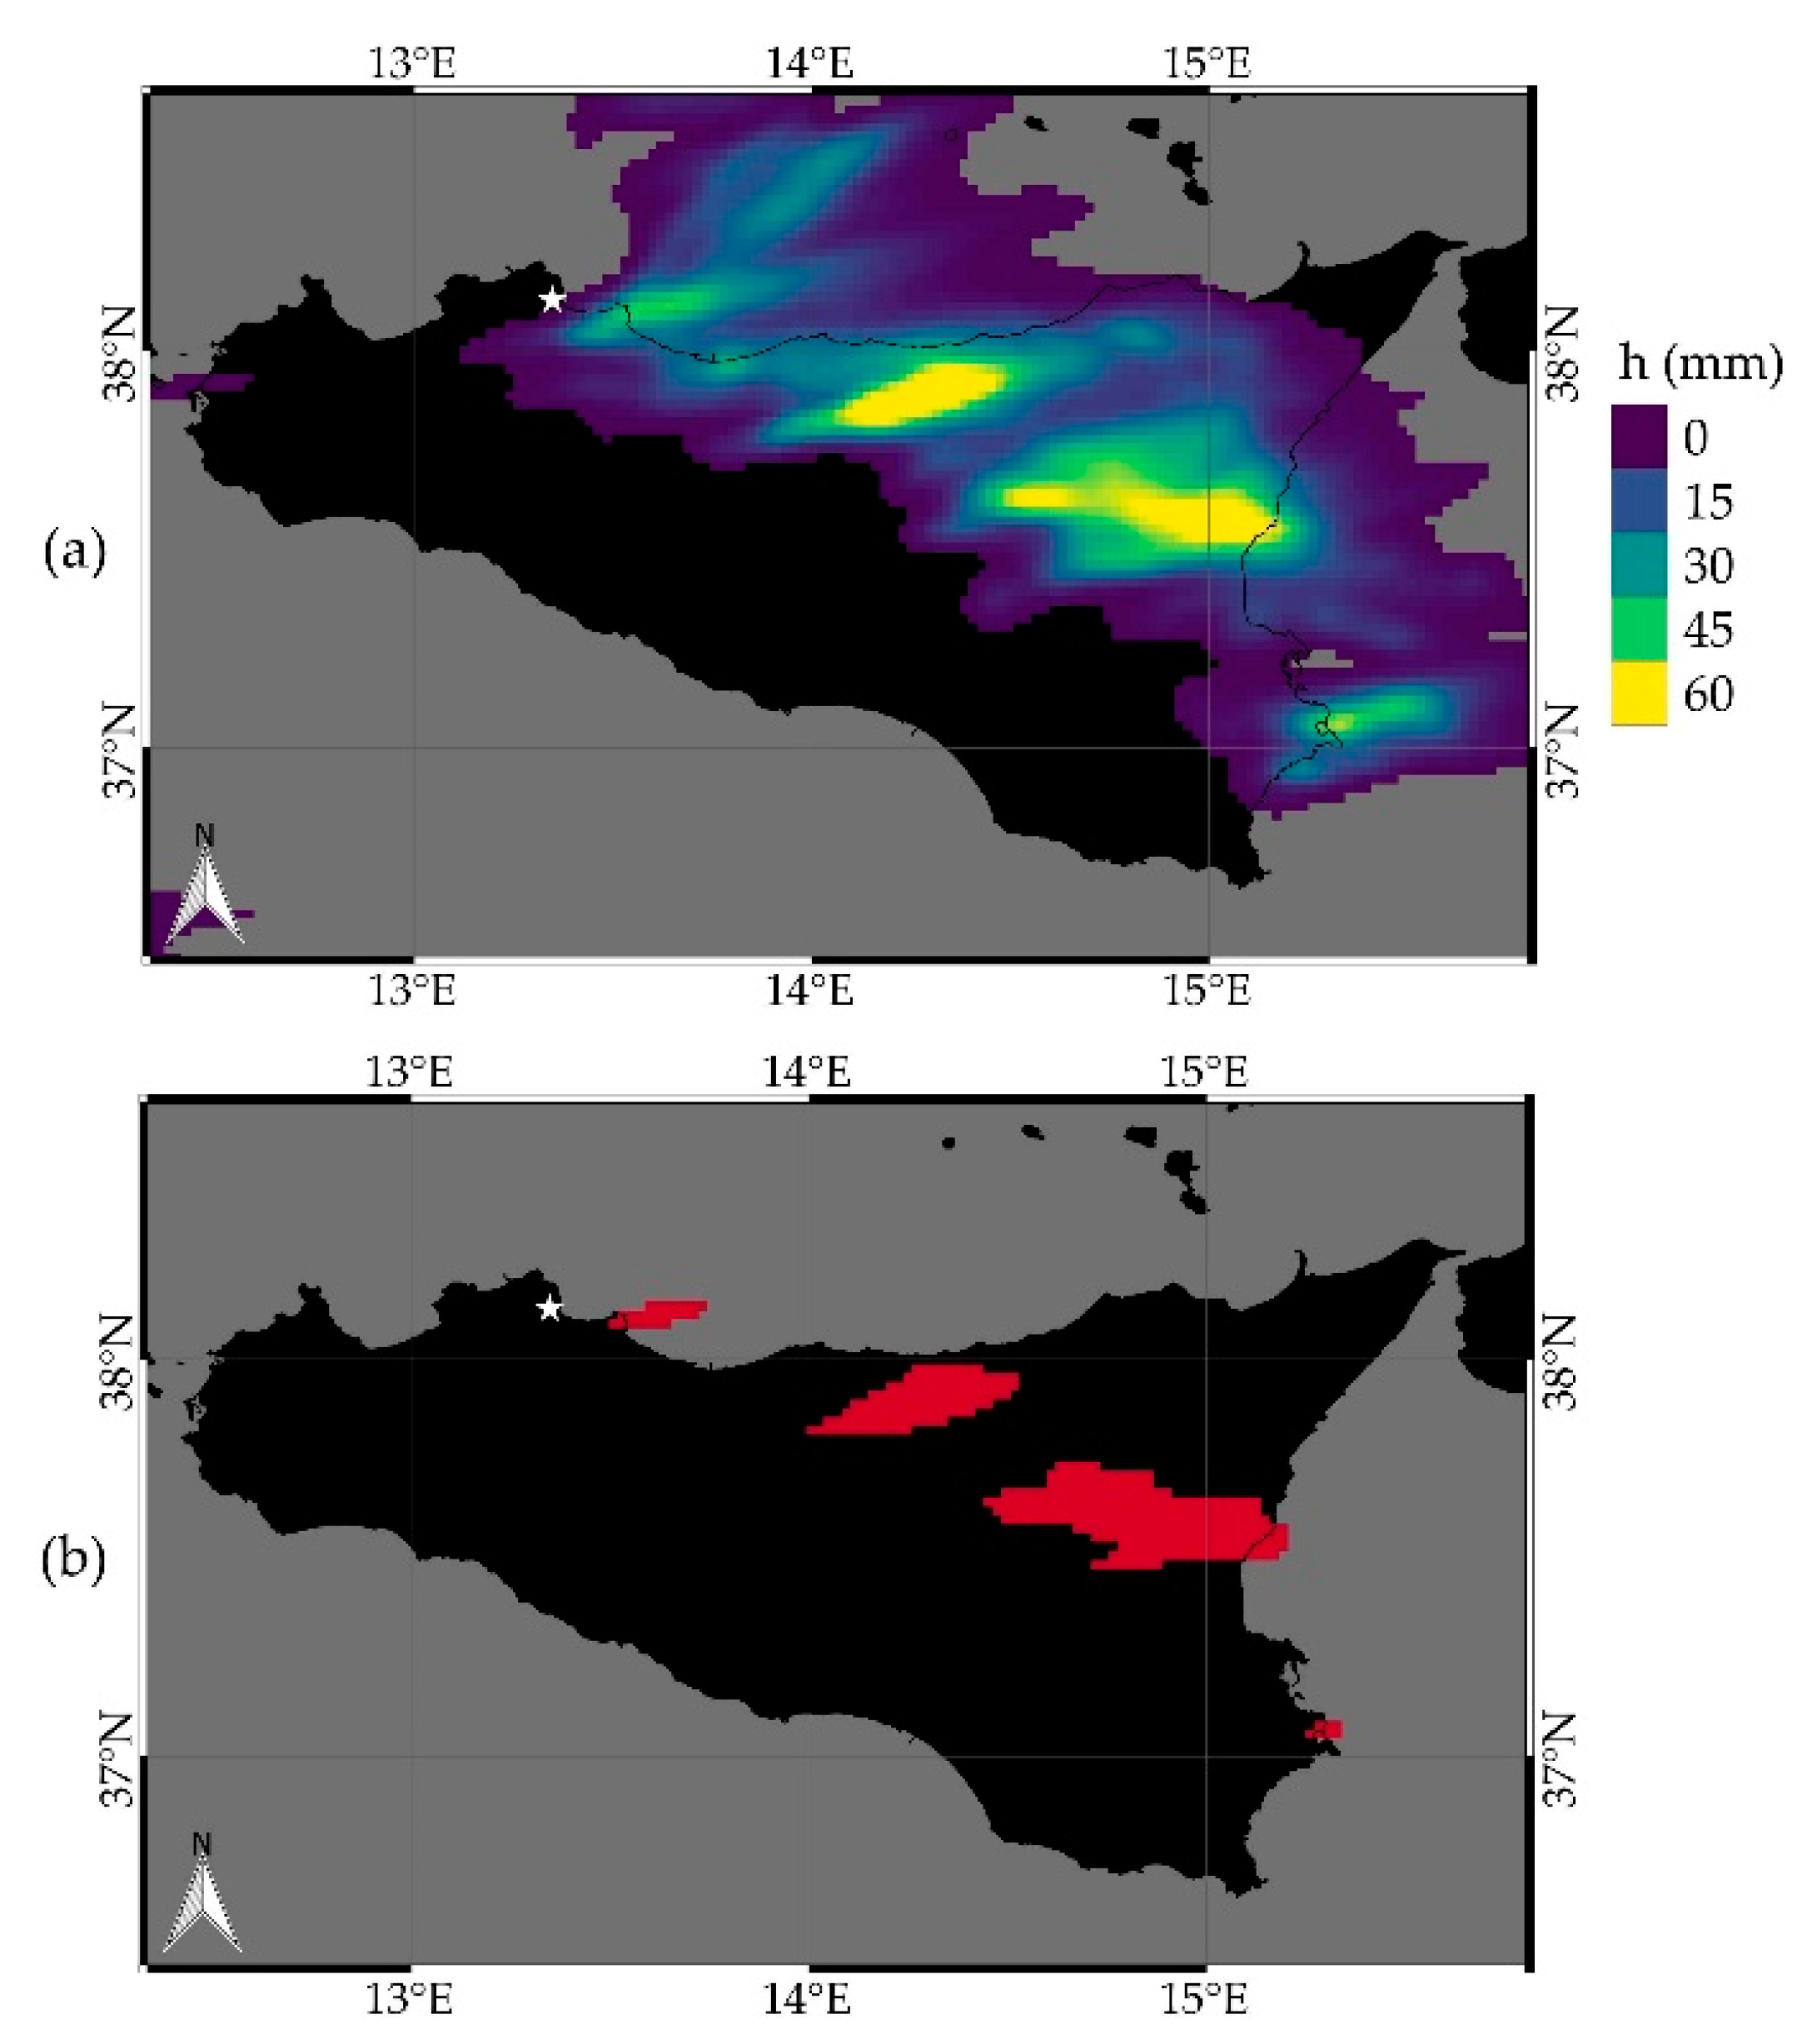
In addition, the Extreme Rainfall Detection System would also issue an alert by thresholding the 48 h rainfall depth values. Figure 9a shows the 48 h rainfall depth provided by the WRF model, while Figure 9b shows the alerts issued by ERDS: a cluster of pixels with rainfall depths higher than the pluviometric threshold is visible about 15 to 30 km far from Palermo (red areas).
4. Discussion
The results presented in this study highlight that different datasets need to be used and integrated to provide reliable heavy rainfall alerts.
For short-duration heavy rainfall events, near real-time satellite products cannot be used for early warning purposes, while they can provide valuable near real-time information on the accumulated rainfall, especially in data-scarce regions and in the case of an event duration longer than the data latency.
GFS data can put a strain on ERDS accuracy in extreme rainfall detection. The inclusion of a second dataset of rainfall forecasts, such as those provided by the WRF model, can reduce the possible high number of missed alarms caused by GFS underestimation and low resolution. As discussed in Section 3, WRF model data can provide more reliable forecasts (and, consequently, heavy rainfall alerts) than those of the GFS model, especially when the data assimilation of authoritative in situ weather measurements is included. However, the main limitation of these data is the limited spatial coverage, if compared to GFS one. We then suggest using WRF forecast at 2.5 km resolution over Italy and WRF forecasts at 7.5 km over Europe, while GFS data continue to be of fundamental importance in the other areas.
The experiment performed in this case study proved that the inclusion of multiple weather variables allows the model to forecast the rainfall pattern with higher accuracy. However, the model completely relies on the quality of the input data, so we suggest using only authoritative datasets as a quality control procedure is not applicable in real-time. Further studies could be performed to investigate if the inclusion of all the available variables (wind speed and direction, temperature and humidity) always represents the best combination or if some variables could be discarded.
For this specific case study, this data assimilation test, if performed in real-time, would not have allowed us to provide a forecast well in advance due to the reduced time interval between the availability of the WRF forecasts and the event time. However, the main conclusions drawn by analyzing the results are valid.
The peculiarity of this case study is related to the fact that the forecast of the 14th of July (the day before) is more accurate than those obtained on the 15th. However, in this study, we show that the data assimilation procedure can increase the accuracy, allowing ERDS to issue alerts using these data.
The analysis of the forecasts produced by this workflow suggest also a possible new modification of the thresholding methodology. The 00:00 UTC model run of the 14 July (in the configuration used within the LEXIS project, at 7.5 km resolution) forecasted 48 mm of rainfall in 48 h, not allowing to issue an alert (as mentioned before, the 48 h threshold for that area is 60 mm). However, the model forecasted 0 mm of rainfall in the first 24 h, from 14 July 00 UTC until 15 July 00 UTC. Thus, all the 48 mm of rainfall is related to the 15 July. If analyzed in this context, the application of the 24 h rainfall threshold to a rainfall depth of 48 mm in 24 h would allow an alert to be issued (the 24 h threshold for that area is 40 mm). The same is also true for the 2.5 km resolution data produced by the same model run. Further studies could be conducted to evaluate if the application of the 24 h threshold on both the two daily forecasts covered by a 48 h interval can increase the number of identified events compared to the standard approach (i.e., 24 h rainfall depths processed by applying the 24 h thresholds and 48 h rainfall depths processed by applying the 48 h thresholds). The possibility of using shorter periods (of 6 or 12 h) will be also investigated.
In conclusion, this test represents an interesting example of the integration of multiple datasets and systems to develop an additional alerting workflow. Further studies will be conducted to perform systematic validation of this new workflow over a modest period, as soon as a significant number of daily forecasts will be executed by the model made operational within the LEXIS project. These tests should also consider possible issues induced by threshold values evaluated at 0.1° and then resampled at 2.5 km. Possible improvements can be deriving from a threshold calibration performed using the forecasts executed within the LEXIS project (despite the limited period covered by these data) or by using rain gauge data, where available.
5. Conclusions
This work describes the first results achieved by the WRF-ERDS workflow in the 15 July 2020 Palermo extreme rainfall events. The standard analysis performed by ERDS, using both GPM and GFS data, was not able to detect this localized and very intense rainfall event. More specifically, the GFS model significantly underestimated the rainfall forecast, while GPM data could not be used for providing near real-time information due to the latency in the data availability and publication, greater than the event duration. The WRF model proved to be able to provide more reliable forecasts, especially at higher resolution (2.5 km), while assimilating both weather radar data and in situ weather station measurements. In this work, we show that the WRF model experiment that includes in situ data assimilation was able to forecast about 50 mm in 3 h, values that would lead the Italian Civil Protection Department to issue an alert.
The obtained results also show that improved weather forecasts can significantly increase the extreme rainfall detection accuracy. As pointed out, the system, for this specific case study, was not able to provide heavy rainfall alerts due to the combination of different shortcomings (low resolution, severe underestimation and data latency longer than the event duration) that characterize the input data (GPM and GFS). The inclusion of the 2.5 km resolution WRF forecasts allowed the system to issue an alert.
Author Contributions
Conceptualization, A.P. (Antonio Parodi) and P.M.; methodology, A.P. (Andrea Parodi), A.P. (Antonio Parodi) and P.M.; software, A.P. (Andrea Parodi), A.P. (Antonio Parodi) and P.M.; validation, A.P. (Antonio Parodi) and P.M.; formal analysis, A.P. (Antonio Parodi) and P.M.; investigation, A.P. (Antonio Parodi) and P.M.; resources, A.P. (Antonio Parodi) and P.M.; data curation, A.P. (Antonio Parodi) and P.M.; writing—original draft preparation, A.P. (Antonio Parodi) and P.M.; writing—review and editing, A.P. (Andrea Parodi)., A.P. (Antonio Parodi) and P.M.; visualization, A.P. (Antonio Parodi) and P.M.; supervision, A.P. (Antonio Parodi); project administration, A.P. (Antonio Parodi); funding acquisition, A.P. (Antonio Parodi) All authors have read and agreed to the published version of the manuscript.
Funding
This research was funded by the EU’s Horizon 2020 research and innovation programme (2014–2020), grant number 825532.
Institutional Review Board Statement
Not applicable.
Informed Consent Statement
Not applicable.
Data Availability Statement
The ERA5-Land data used for the threshold evaluation is available on the Climate Data Store (https://cds.climate.copernicus.eu/cdsapp#!/home, last accessed on 4 December 2021). The software necessary to run the ERDS system is available on https://github.com/ITHACA-org/gfs-accumul, on https://github.com/ITHACA-org/gpm-accumul and on https://github.com/ITHACA-org/aux-accumul (last accessed on 4 December 2021). WRF data is available upon request.
Acknowledgments
The authors acknowledge the support of Paolo Pasquali and Simone Balbo in the development of the ERDS web app. The authors also acknowledge the use of data from EM-DAT, CRED/UCLouvain, Brussels, Belgium—www.emdat.be (accessed on 30 December 2021) (D. Guha-Sapir).
Conflicts of Interest
The authors declare no conflict of interest. The funders had no role in the design of the study; in the collection, analyses, or interpretation of data; in the writing of the manuscript; or in the decision to publish the results.
References
- Parodi, A.; Danovaro, E.; Hawkes, J.; Quintino, T.; Lagasio, M.; Delogu, F.; D’Andrea, M.; Parodi, A.; Sardo, B.M.; Ajmar, A.; et al. LEXIS Weather and Climate large-scale pilot. In Advances in Intelligent Systems and Computing, Proceeding of the Complex, Intelligent and Software Intensive Systems (CISIS 2020); Barolli, L., Poniszewska-Maranda, A., Enokido, T., Eds.; Springer: Cham, Switzerland, 2021; Volume 1194, pp. 267–277. [Google Scholar]
- Scionti, A.; Martinovic, J.; Terzo, O.; Walter, E.; Levrier, M.; Hachinger, S.; Magarielli, D.; Goubier, T.; Louise, S.; Parodi, A.; et al. HPC, Cloud and Big-Data convergent architectures: The LEXIS approach. In Advances in Intelligent Systems and Computing, Proceeding of the Complex, Intelligent, and Software Intensive Systems (CISIS 2019); Barolli, L., Hussain, F., Ikeda, M., Eds.; Springer: Cham, Switzerland, 2020; Volume 993, pp. 200–212. [Google Scholar] [CrossRef]
- Parodi, A.; Lagasio, M.; Meroni, A.N.; Pignone, F.; Silvestro, F.; Ferraris, L. A hindcast study of the Piedmont 1994 flood: The CIMA Research Foundation hydro-meteorological forecasting chain. Bull. Atmos. Sci. Technol. 2020, 1, 297–318. [Google Scholar] [CrossRef]
- Apicella, L.; Puca, S.; Lagasio, M.; Meroni, A.N.; Milelli, M.; Vela, N.; Garbero, V.; Ferraris, L.; Parodi, A. The predictive capacity of the high resolution weather research and forecasting model: A year-long verification over Italy. Bull. Atmos. Sci. Technol. 2021, 2, 3. [Google Scholar] [CrossRef]
- Extreme Rainfall Detection System. Available online: http://erds.ithacaweb.org (accessed on 24 September 2021).
- Huffman, G.J.; Bolvin, D.T.; Braithwaite, D.; Hsu, K.; Joyce, R.; Kidd, C.; Nelkin, E.J.; Sorooshian, S.; Tan, J.; Xie, P. NASA Global Precipitation Measurement (GPM) Integrated Multi-Satellite Retrievals for GPM (IMERG) Algorithm Theoretical Basis Document (ATBD) Version 06 (2020). Available online: https://gpm.nasa.gov/sites/default/files/2020-05/IMERG_ATBD_V06.3.pdf (accessed on 25 September 2021).
- Mazzoglio, P.; Laio, F.; Balbo, S.; Boccardo, P.; Disabato, F. Improving an Extreme Rainfall Detection System with GPM IMERG data. Remote Sens. 2019, 11, 677. [Google Scholar] [CrossRef] [Green Version]
- Mazzoglio, P.; Laio, F.; Sandu, C.; Boccardo, P. Assessment of an Extreme Rainfall Detection System for flood prediction over Queensland (Australia). Proceedings 2019, 18, 7. [Google Scholar] [CrossRef]
- Mazzoglio, P.; Domeneghetti, A.; Ceola, S. Flood detection and monitoring with EO data tools and systems. In Earth Observation for Flood Applications, 1st ed.; Schumann, G.J.P., Ed.; Elsevier: Amsterdam, The Netherlands, 2021; pp. 195–215. [Google Scholar] [CrossRef]
- Mazzoglio, P.; Ajmar, A.; Schumann, G.J.P.; Balbo, S.; Boccardo, P.; Perez, F.; Borgogno-Mondino, E. Satellite-based approaches in the detection and monitoring of selected hydrometeorological disasters. In The Increasing Risk of Floods and Tornadoes in Southern Africa, 1st ed.; Nhamo, G., Chapungu, L., Eds.; Springer: Cham, Switzerland, 2021; pp. 19–37. [Google Scholar] [CrossRef]
- Mazzoglio, P. Insights on a global Extreme Rainfall Detection System. In Precipitation Science, 1st ed.; Michaelides, S., Ed.; Elsevier: Amsterdam, The Netherlands, 2022; pp. 135–155. [Google Scholar] [CrossRef]
- SIAS. Available online: http://www.sias.regione.sicilia.it/ (accessed on 2 October 2021).
- Francipane, A.; Pumo, D.; Sinagra, M.; La Loggia, G.; Noto, L.V. A paradigm of extreme rainfall pluvial floods in complex urban areas: The flood event of 15 July 2020 in Palermo (Italy). Nat. Hazards Earth Syst. Sci. 2021, 21, 2563–2580. [Google Scholar] [CrossRef]
- Forestieri, A.; Caracciolo, D.; Arnone, E.; Noto, L.V. Derivation of rainfall thresholds for flash flood warning in a Sicilian basin using a hydrological model. Proced. Eng. 2016, 154, 818–825. [Google Scholar] [CrossRef] [Green Version]
- Centro Funzionale Decentrato. Rapporto Sugli Eventi Meteo Del 14–15 Luglio 2020. Available online: https://drive.google.com/file/d/1FGPjN_S40lFI5oyXb5dDAaCKPJrg3l69/view?usp=sharing (accessed on 4 December 2021).
- Surfrac0.1.PPS. Available online: https://pmm.nasa.gov/sites/default/files/downloads/surfrac0.1.PPS.gz (accessed on 4 December 2021).
- Reichenbach, P.; Cardinali, M.; De Vita, P.; Guzzetti, F. Regional hydrological thresholds for landslides and floods in the Tiber River Basin (central Italy). Env. Geol. 1998, 35, 146–159. [Google Scholar] [CrossRef]
- Guzzetti, F.; Peruccacci, S.; Rossi, M.; Stark, C.P. Rainfall thresholds for the initiation of landslides in central and southern Europe. Meteorol. Atmos. Phys. 2007, 239–267. [Google Scholar] [CrossRef]
- Olsson, J.; Lindström, G. Evaluation and calibration of operational hydrological ensemble forecasts in Sweden. J. Hydrol. 2008, 350, 14–24. [Google Scholar] [CrossRef]
- Peruccacci, S.; Brunetti, M.T.; Gariano, S.L.; Melillo, M.; Rossi, M.; Guzzetti, F. Rainfall thresholds for possible landslide occurrence in Italy. Geomorphology 2017, 290, 39–57. [Google Scholar] [CrossRef]
- Martina, M.L.V.; Todini, E.; Libralon, A. A Bayesian decision approach to rainfall thresholds based flood warning. Hydrol. Earth Syst. Sci. 2006, 10, 413–426. [Google Scholar] [CrossRef] [Green Version]
- EM-DAT: The Emergency Events Database, CRED/UCLouvain, Brussels, Belgium. Available online: www.emdat.be (accessed on 2 October 2021).
- Floodlist. Available online: https://floodlist.com/ (accessed on 2 October 2021).
- ReliefWeb. Available online: https://reliefweb.int (accessed on 2 October 2021).
- Desinventar. Available online: https://www.desinventar.net/ (accessed on 5 November 2021).
- European Severe Weather Database. Available online: https://www.eswd.eu/ (accessed on 5 November 2021).
- Severe Weather Europe. Available online: https://www.severe-weather.eu/ (accessed on 5 November 2021).
- Mazzoglio, P.; Macchia, S.; Gallo, E.; Winter, J.; Claps, P. Disaster Tales as Communication Tool for Increasing Risk Resilience. Int. J. Disaster Risk. Sci. 2021, 12, 341–354. [Google Scholar] [CrossRef]
- Pendergrass, A.G.; Knutti, R. The uneven nature of daily precipitation and its change. Geophys. Res. Lett. 2018, 45, 11, 980–988. [Google Scholar] [CrossRef]
Figure 1.
The extent of the three nested domains of the WRF model (22.5, 7.5 and 2.5 km resolution). The elevation is represented using a grayscale colormap.
Figure 1.
The extent of the three nested domains of the WRF model (22.5, 7.5 and 2.5 km resolution). The elevation is represented using a grayscale colormap.

Figure 2.
ECMWF HRES analysis: 500 hPa geopotential height (dm, contours), temperature (°C) and wind (barbs) at 12:00 UTC (a) and 15:00 UTC (b) on 15 July. The red dashed box identifies the position of Sicily.
Figure 2.
ECMWF HRES analysis: 500 hPa geopotential height (dm, contours), temperature (°C) and wind (barbs) at 12:00 UTC (a) and 15:00 UTC (b) on 15 July. The red dashed box identifies the position of Sicily.

Figure 3.
Specific humidity (g/kg) and wind (barbs) at 700 (a) and 850 (b) hPa at 15:00 UTC. ECMWF-HRES forecast (+3 h) starting on 15 July 12 UTC.
Figure 3.
Specific humidity (g/kg) and wind (barbs) at 700 (a) and 850 (b) hPa at 15:00 UTC. ECMWF-HRES forecast (+3 h) starting on 15 July 12 UTC.

Figure 4.
Lightning strikes detected by the Italian Air Force Meteorological Service (LAMPINET) during the 15 of July from 13 to 16 UTC. Image obtained from myDEWETRA platform, courtesy of the Italian Civil Protection Department.
Figure 4.
Lightning strikes detected by the Italian Air Force Meteorological Service (LAMPINET) during the 15 of July from 13 to 16 UTC. Image obtained from myDEWETRA platform, courtesy of the Italian Civil Protection Department.

Figure 5.
CAPPI (Constant Altitude Plan Position Indicator) radar measurement at 3000 m of 15 July 2020 12:00 UTC. Most of Sicily is covered by a light grey, which corresponds to missing data. Image obtained from my DEWETRA platform, courtesy of the Italian Civil Protection Department.
Figure 5.
CAPPI (Constant Altitude Plan Position Indicator) radar measurement at 3000 m of 15 July 2020 12:00 UTC. Most of Sicily is covered by a light grey, which corresponds to missing data. Image obtained from my DEWETRA platform, courtesy of the Italian Civil Protection Department.

Figure 6.
The maps show the rainfall thresholds that are currently applied to WRF data by ERDS for the extreme rainfall detection in the 24 (a) and 48 (b) hour durations.
Figure 6.
The maps show the rainfall thresholds that are currently applied to WRF data by ERDS for the extreme rainfall detection in the 24 (a) and 48 (b) hour durations.

Figure 7.
The maps show: 48 h rainfall forecasts (a) and heavy rainfall alerts (b) provided by the 00 UTC model run on 14 July at 7.5 km resolution; 24 h rainfall forecasts (c) and heavy rainfall alerts (d) provided by the 00 UTC model run on 15 July at 7.5 km resolution; 48 h rainfall forecasts (e) and heavy rainfall alerts (f) provided by the 00 UTC model run on 14 July at 2.5 km resolution; 24 h rainfall forecasts (g) and heavy rainfall alerts (h) provided by the 00 UTC model run on the 15 July at 2.5 km resolution. The white star represents the position of Palermo.

Figure 8.
The map shows the rainfall depth at 2.5 km resolution forecasted from 12 to 16 UTC by the WRF model experiment of the 15 July 12:00 UTC using: for (a) only the weather radar data assimilation, for (b) weather radar data and hygrometers, for (c) weather radar data and anemometers and for (d) weather radar data, anemometer, hygrometers and thermometers.

Figure 9.
The maps show the rainfall depths evaluated using the 2.5 km resolution 48 h rainfall forecast of the 15 July 12:00 UTC model run (a) and the heavy rainfall alerts issued by ERDS using the 2.5 km resolution 48 h rainfall forecast of the 15 July 12:00 UTC model run (b). The white star represents the position of Palermo.

Publisher’s Note: MDPI stays neutral with regard to jurisdictional claims in published maps and institutional affiliations. |
© 2022 by the authors. Licensee MDPI, Basel, Switzerland. This article is an open access article distributed under the terms and conditions of the Creative Commons Attribution (CC BY) license (https://creativecommons.org/licenses/by/4.0/).
Share and Cite
MDPI and ACS Style
Mazzoglio, P.; Parodi, A.; Parodi, A. Detecting Extreme Rainfall Events Using the WRF-ERDS Workflow: The 15 July 2020 Palermo Case Study. Water 2022, 14, 86. https://doi.org/10.3390/w14010086
AMA Style
Mazzoglio P, Parodi A, Parodi A. Detecting Extreme Rainfall Events Using the WRF-ERDS Workflow: The 15 July 2020 Palermo Case Study. Water. 2022; 14(1):86. https://doi.org/10.3390/w14010086
Chicago/Turabian StyleMazzoglio, Paola, Andrea Parodi, and Antonio Parodi. 2022. "Detecting Extreme Rainfall Events Using the WRF-ERDS Workflow: The 15 July 2020 Palermo Case Study" Water 14, no. 1: 86. https://doi.org/10.3390/w14010086
Note that from the first issue of 2016, this journal uses article numbers instead of page numbers. See further details here.