
Chemical and Isotopic Tracers for Characterization of the Groundwater in the Heterogeneous System: Case from Chichaoua-Imin’tanout (Morocco)


 , and
, and
Abstract
:1. Introduction
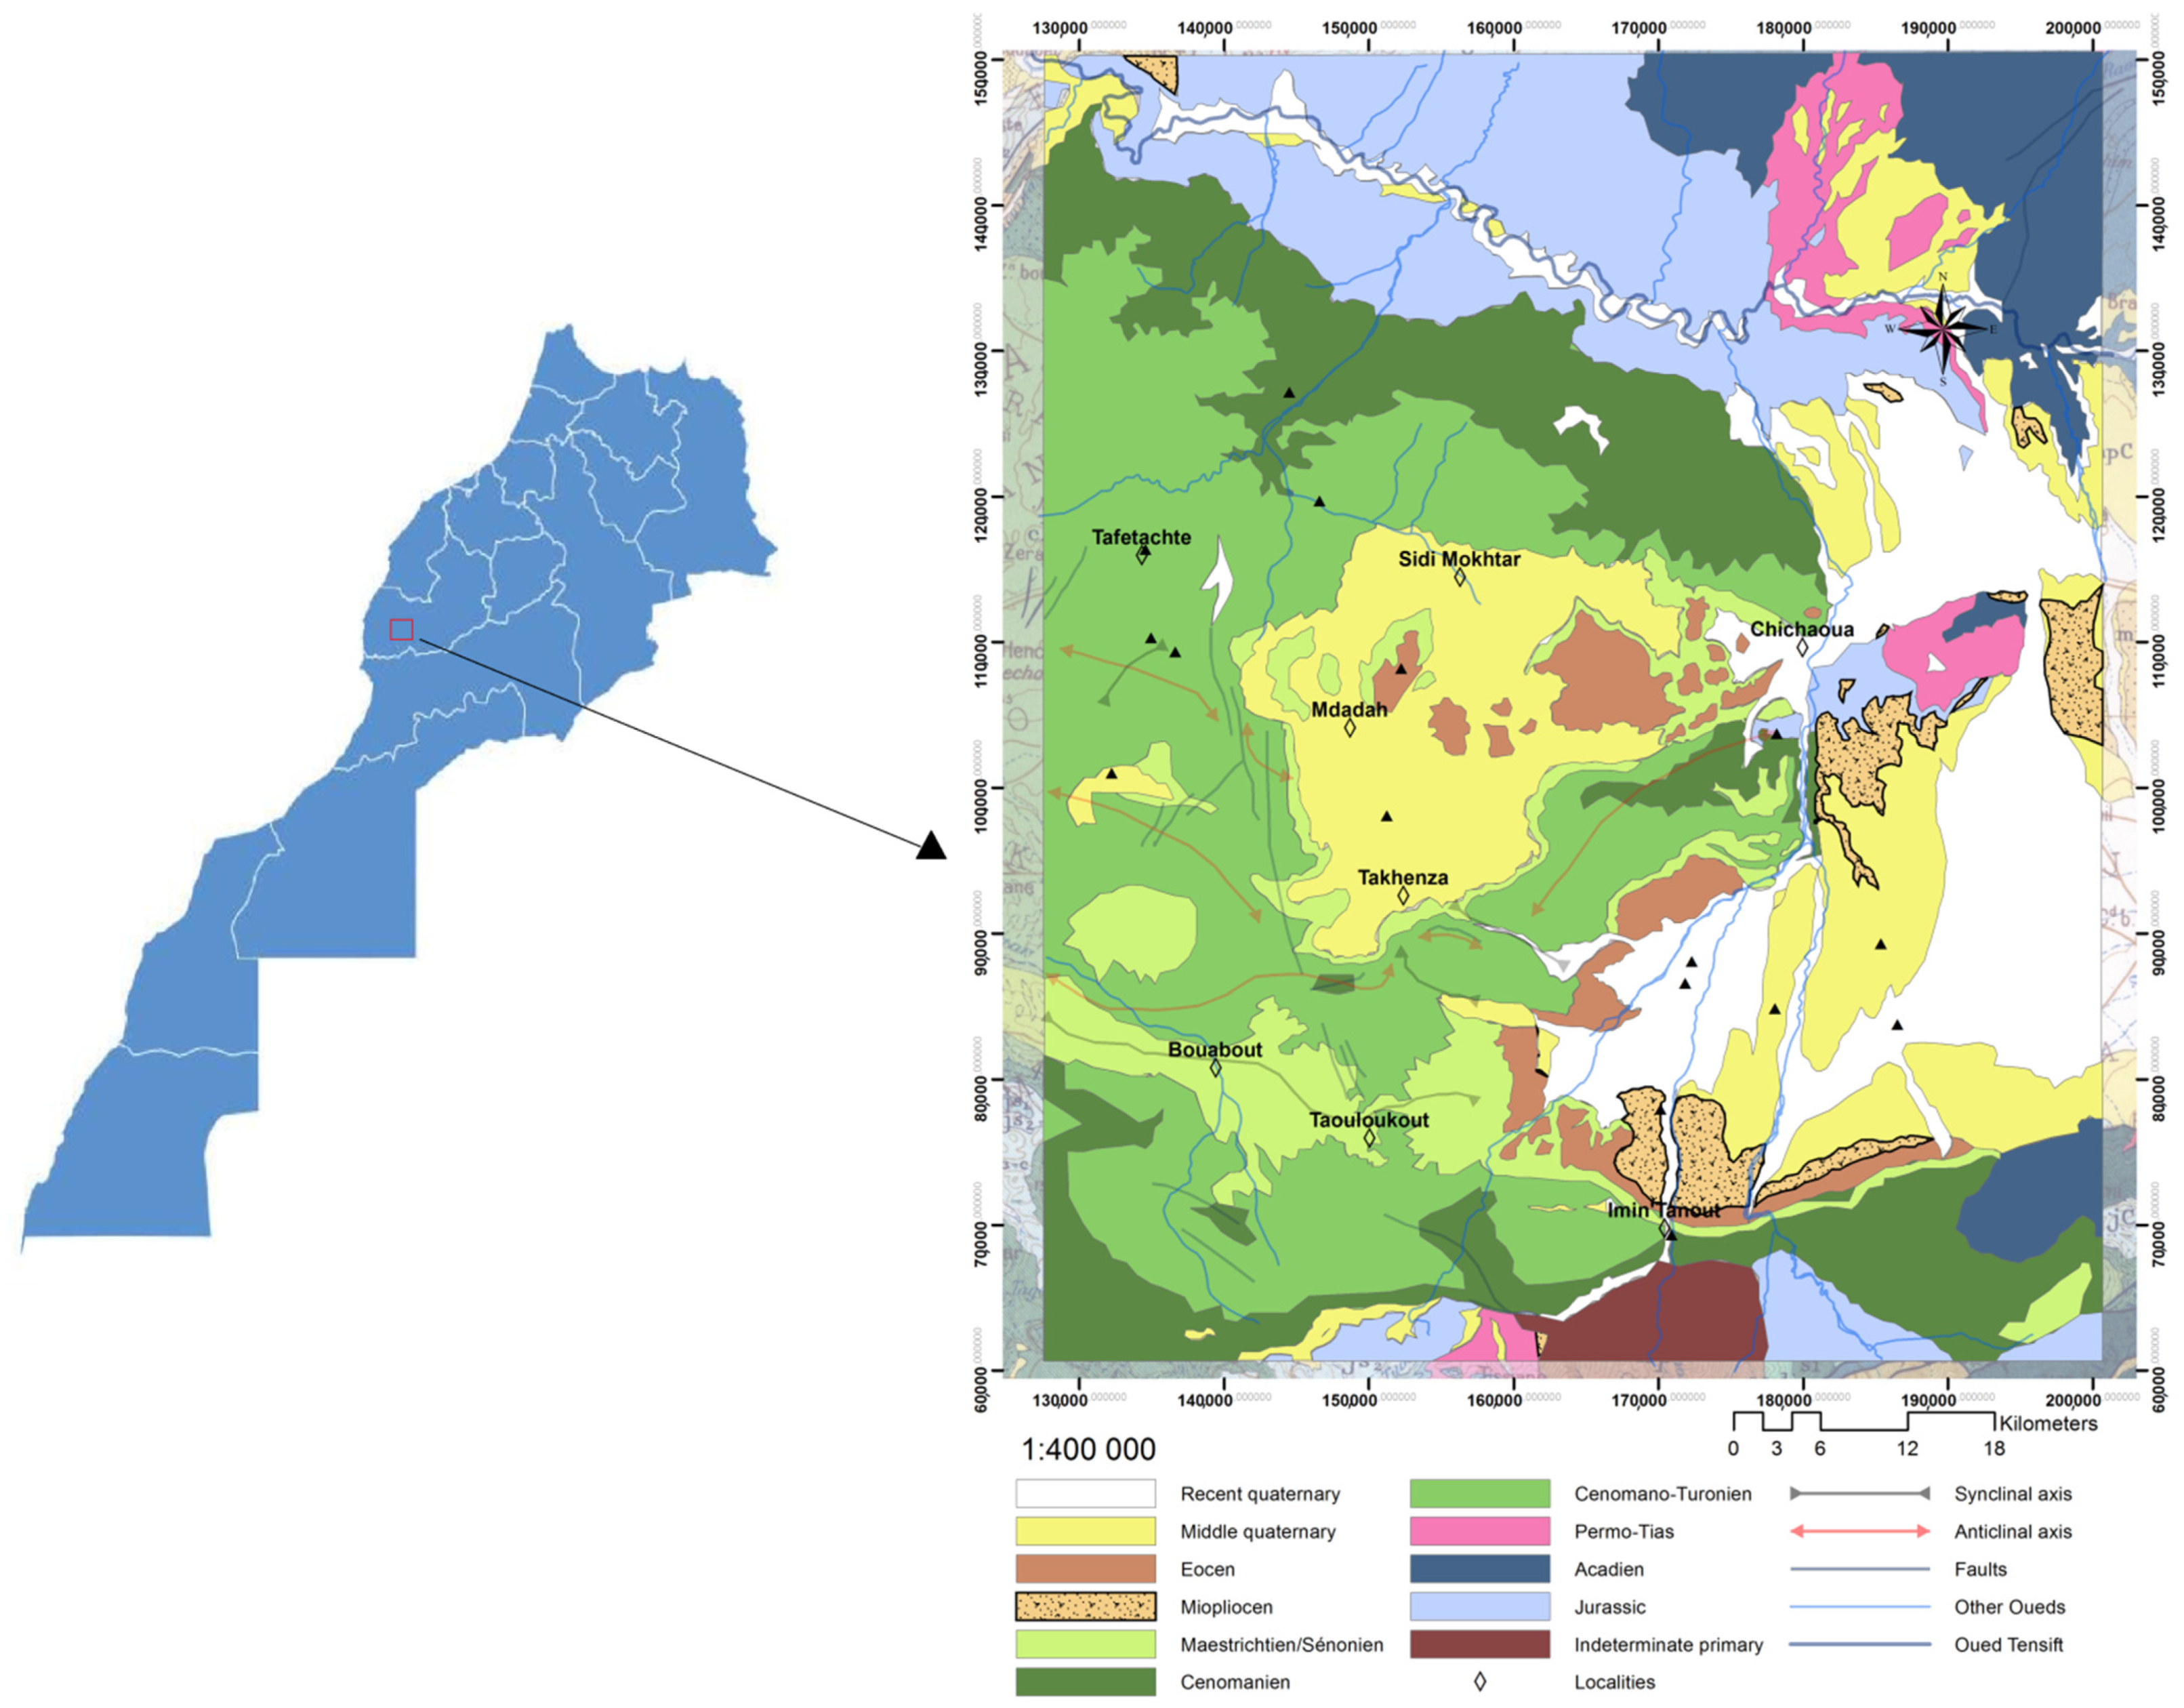
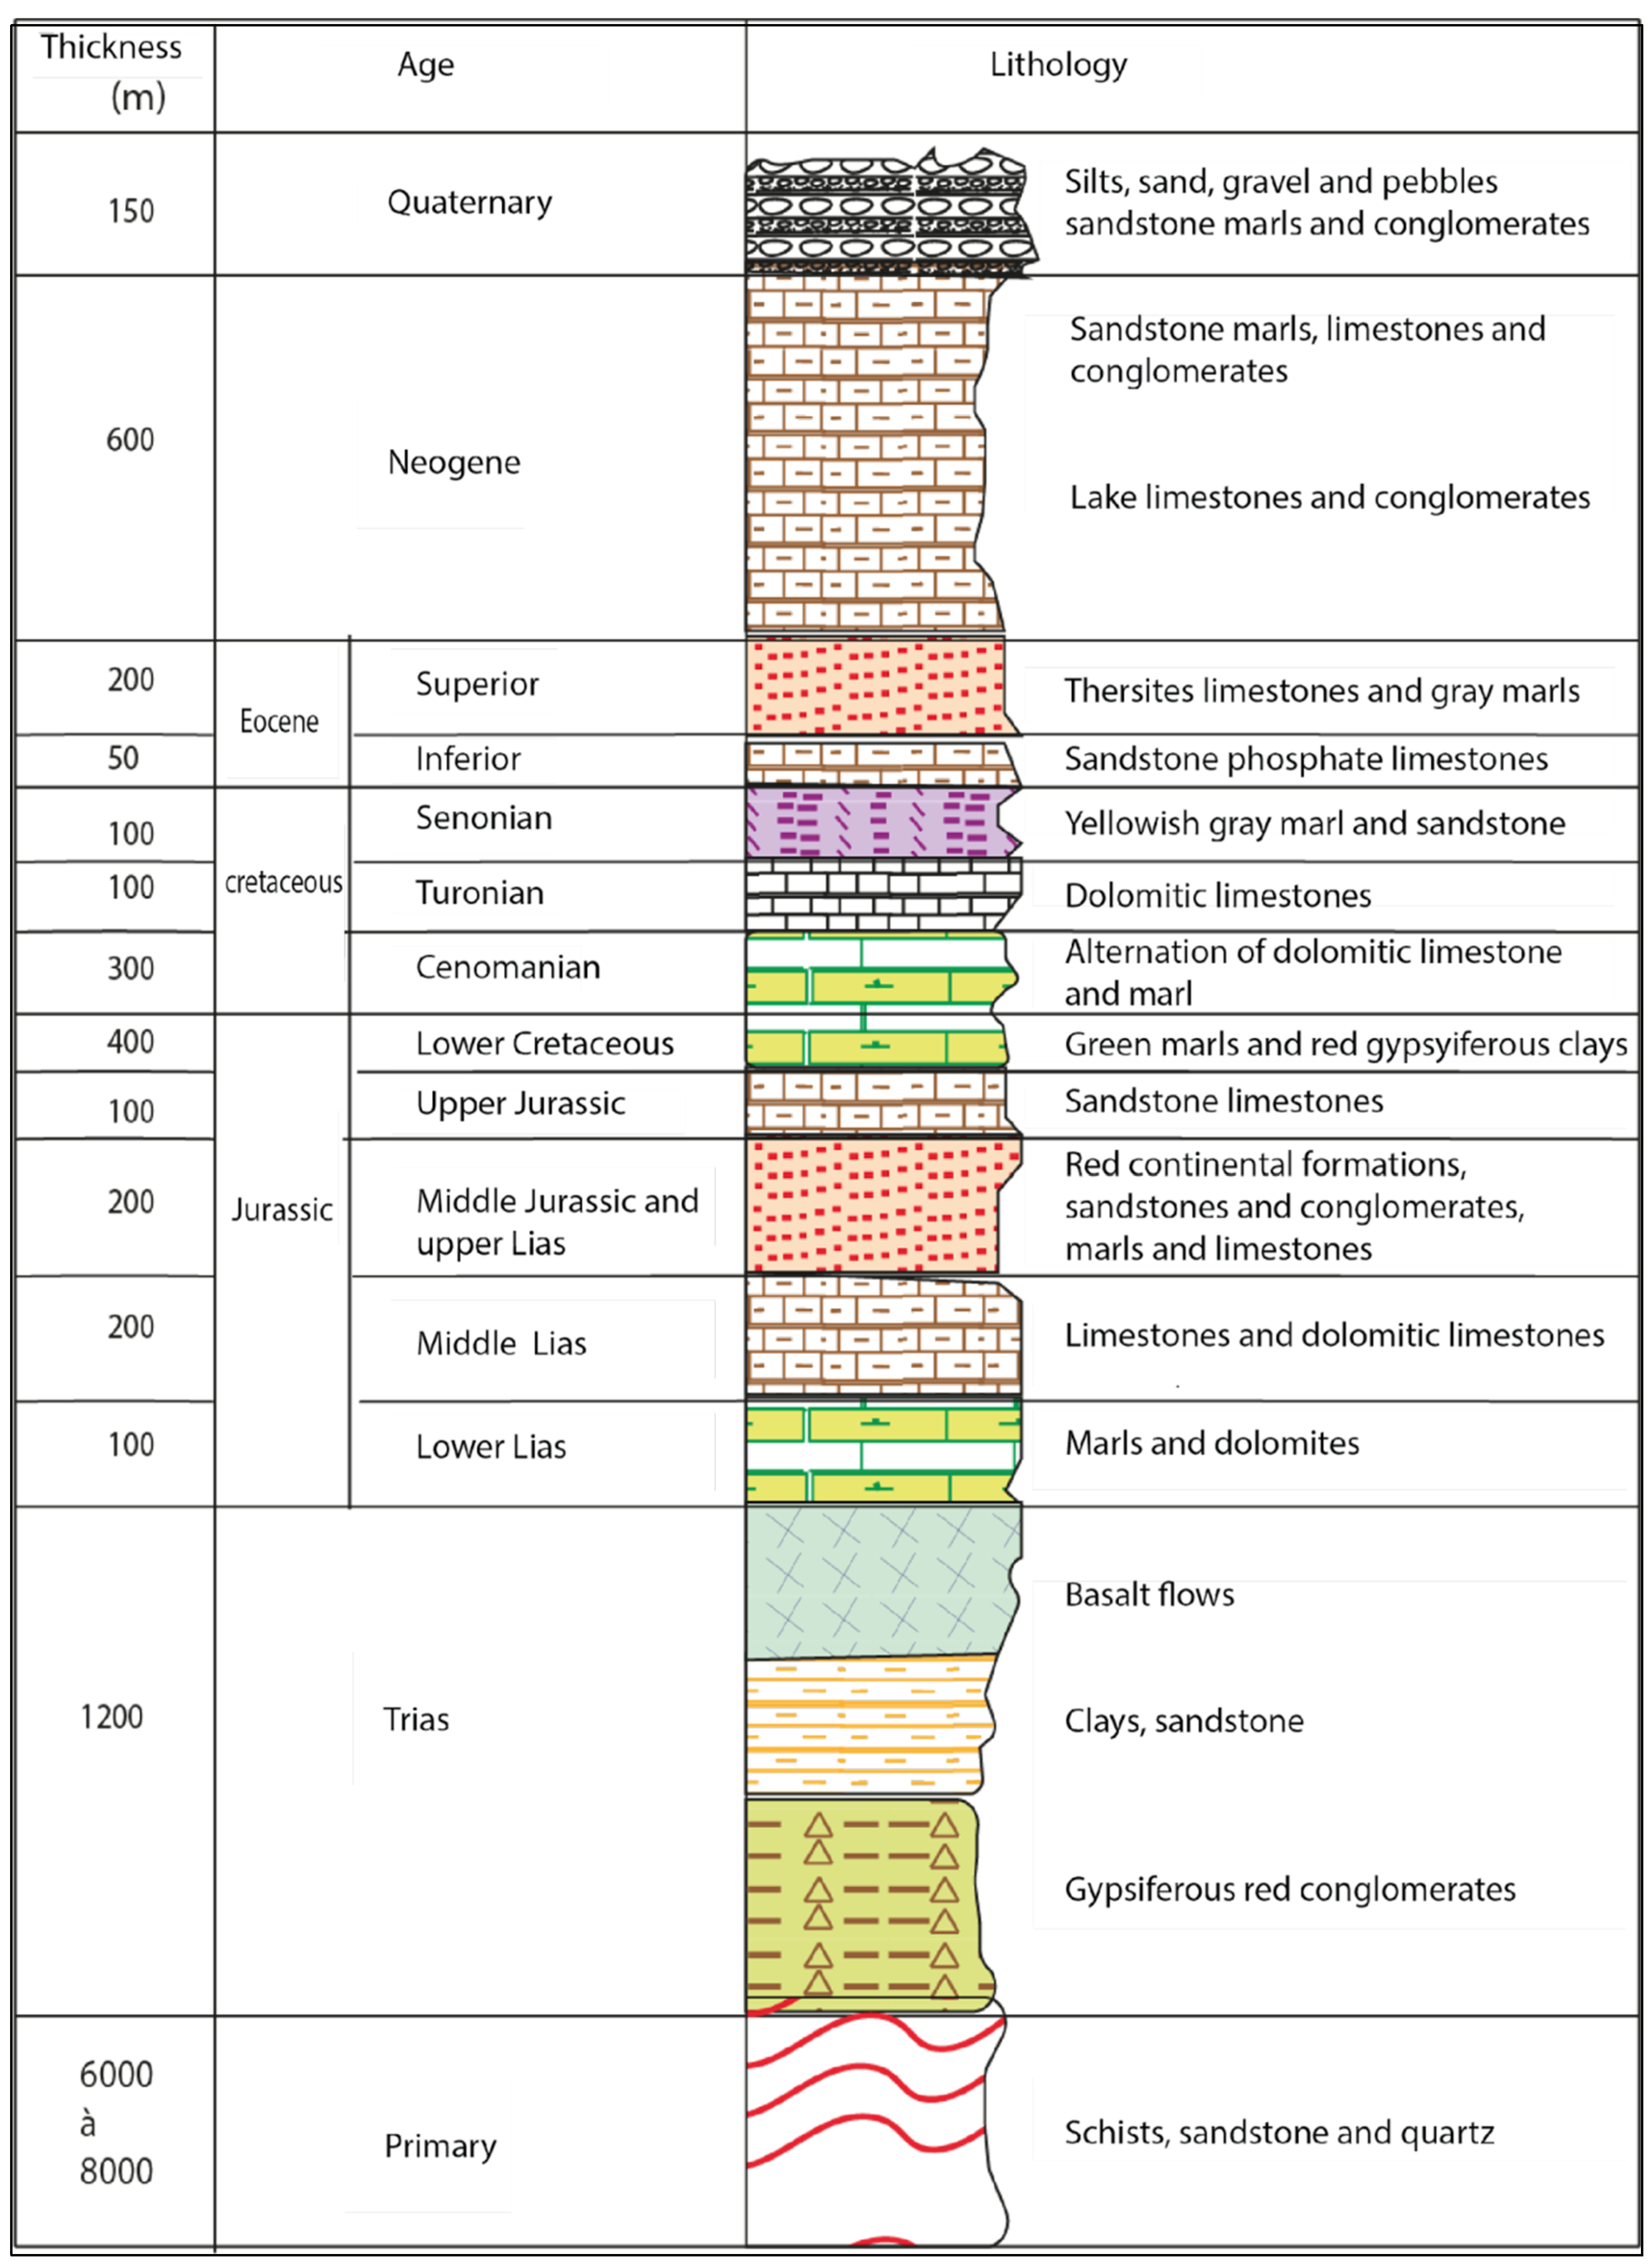
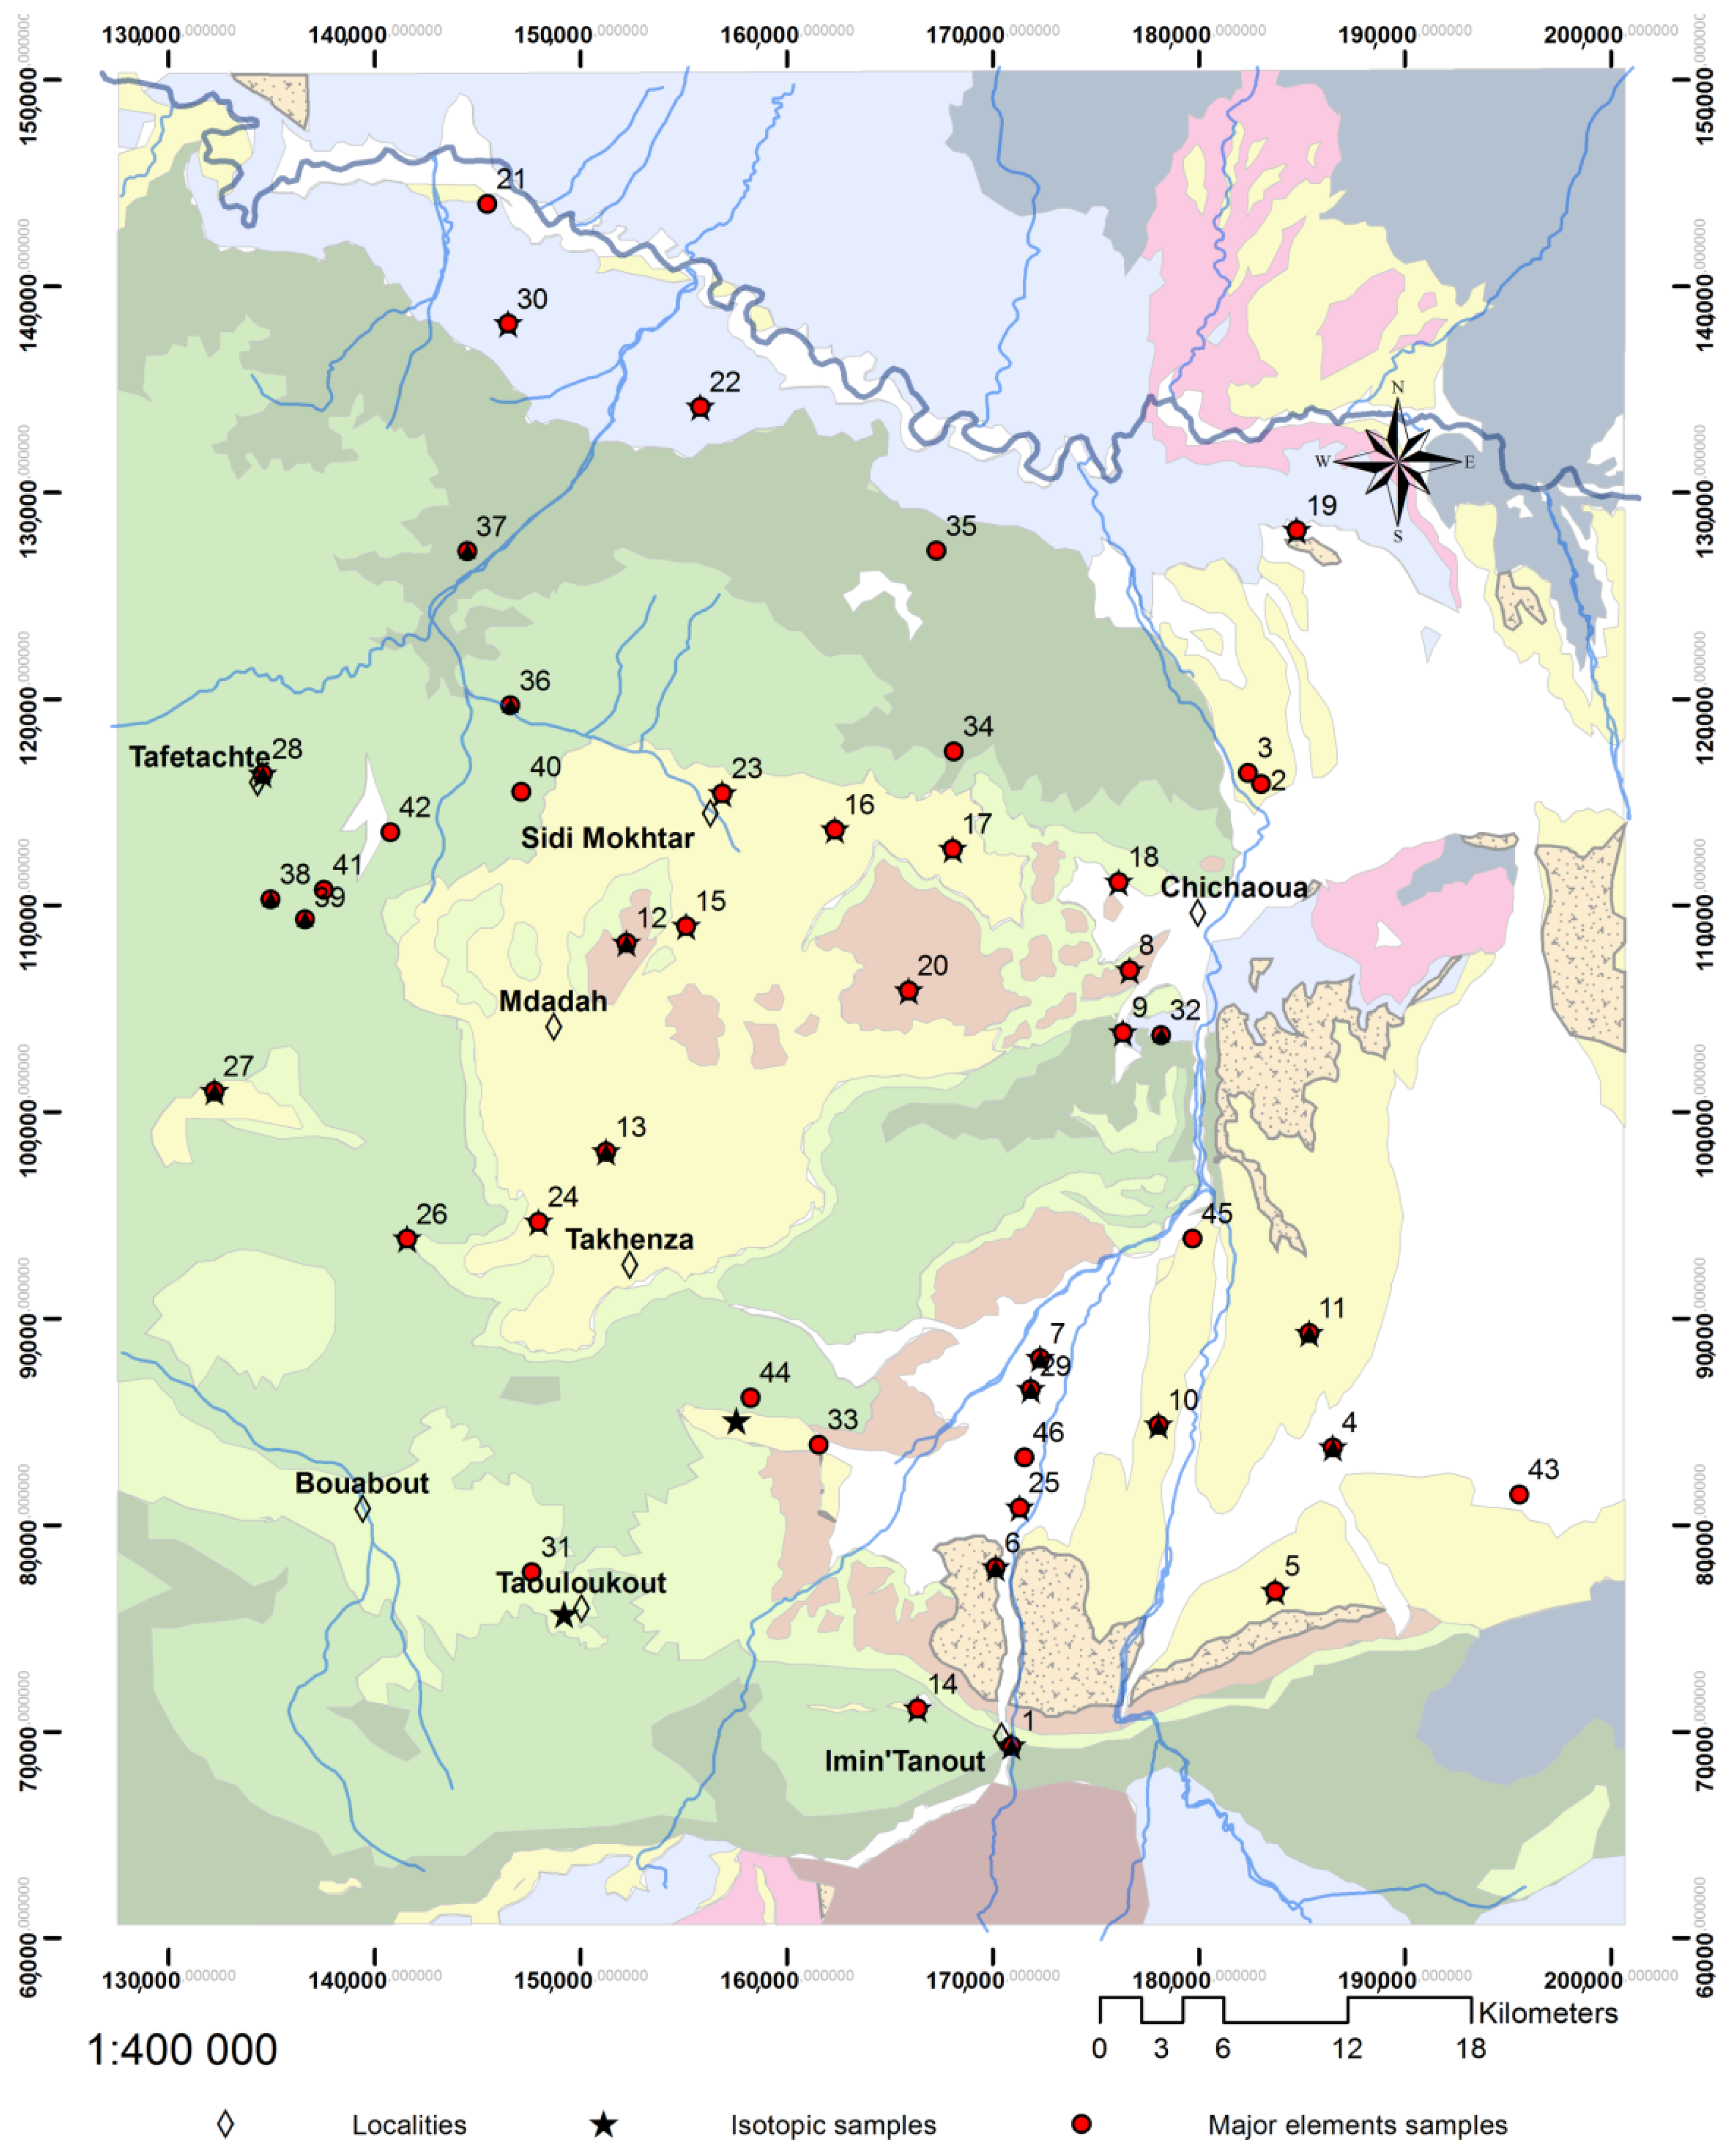
2. Geographical and Geological Context
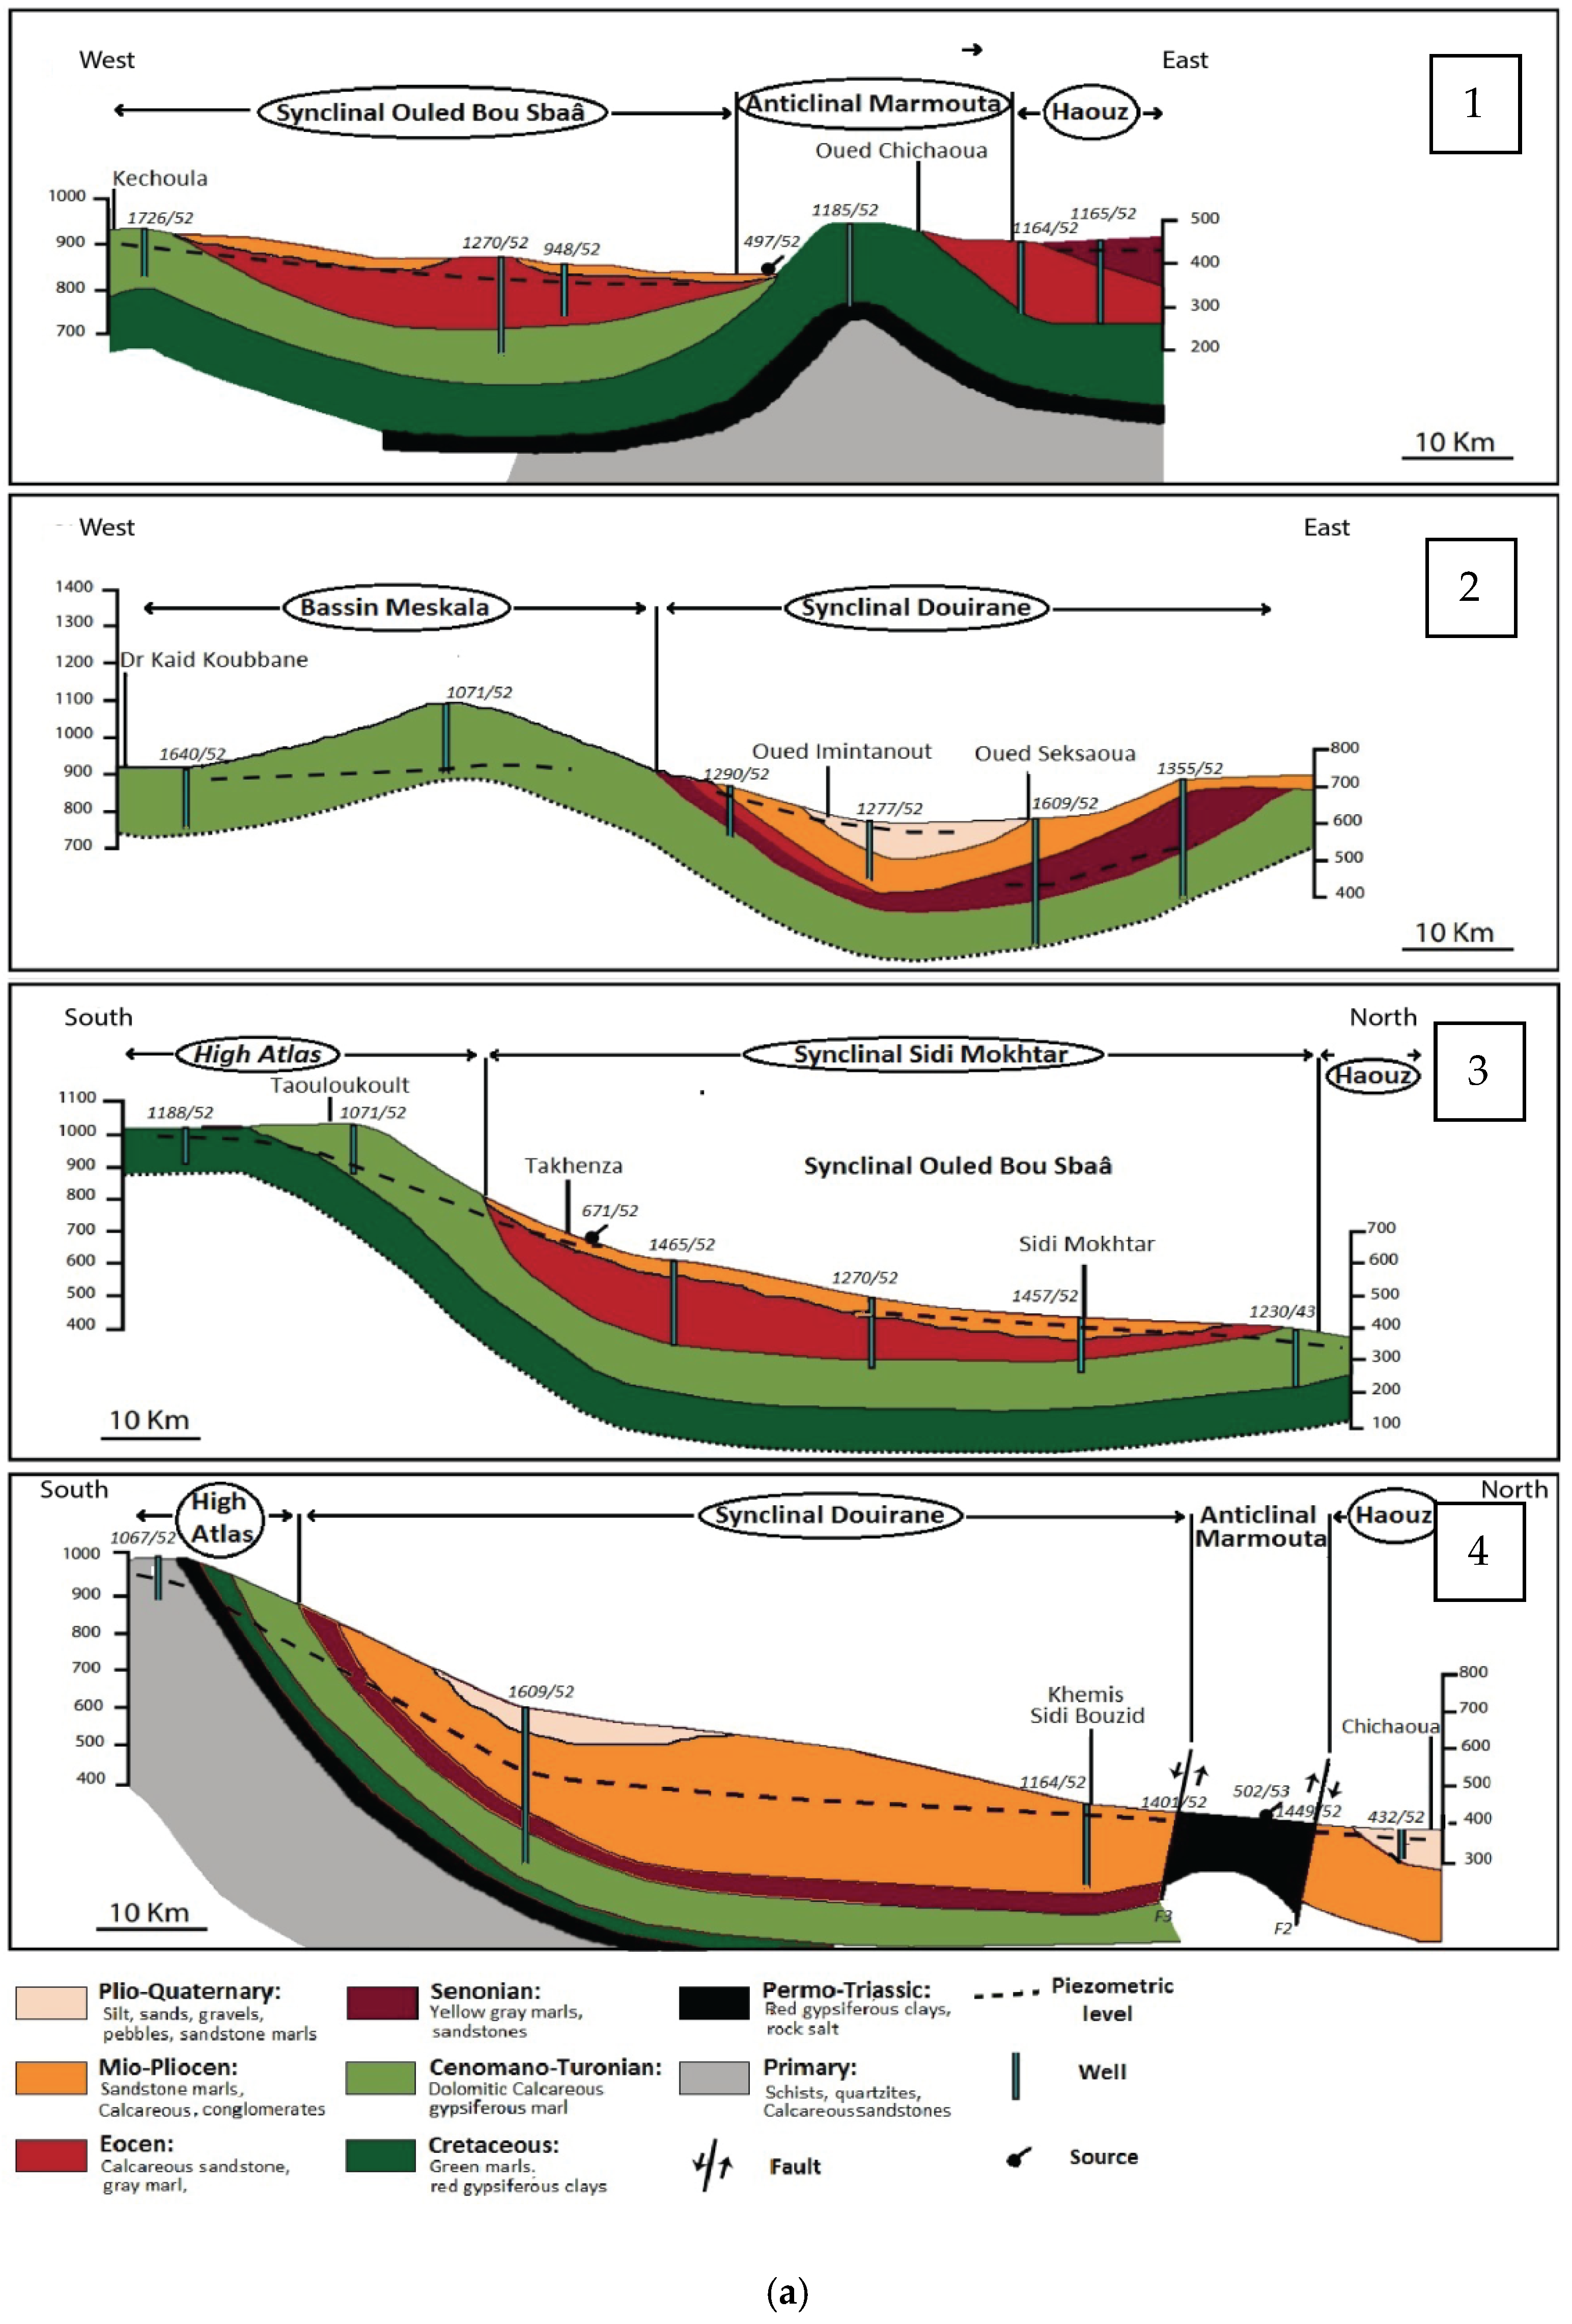
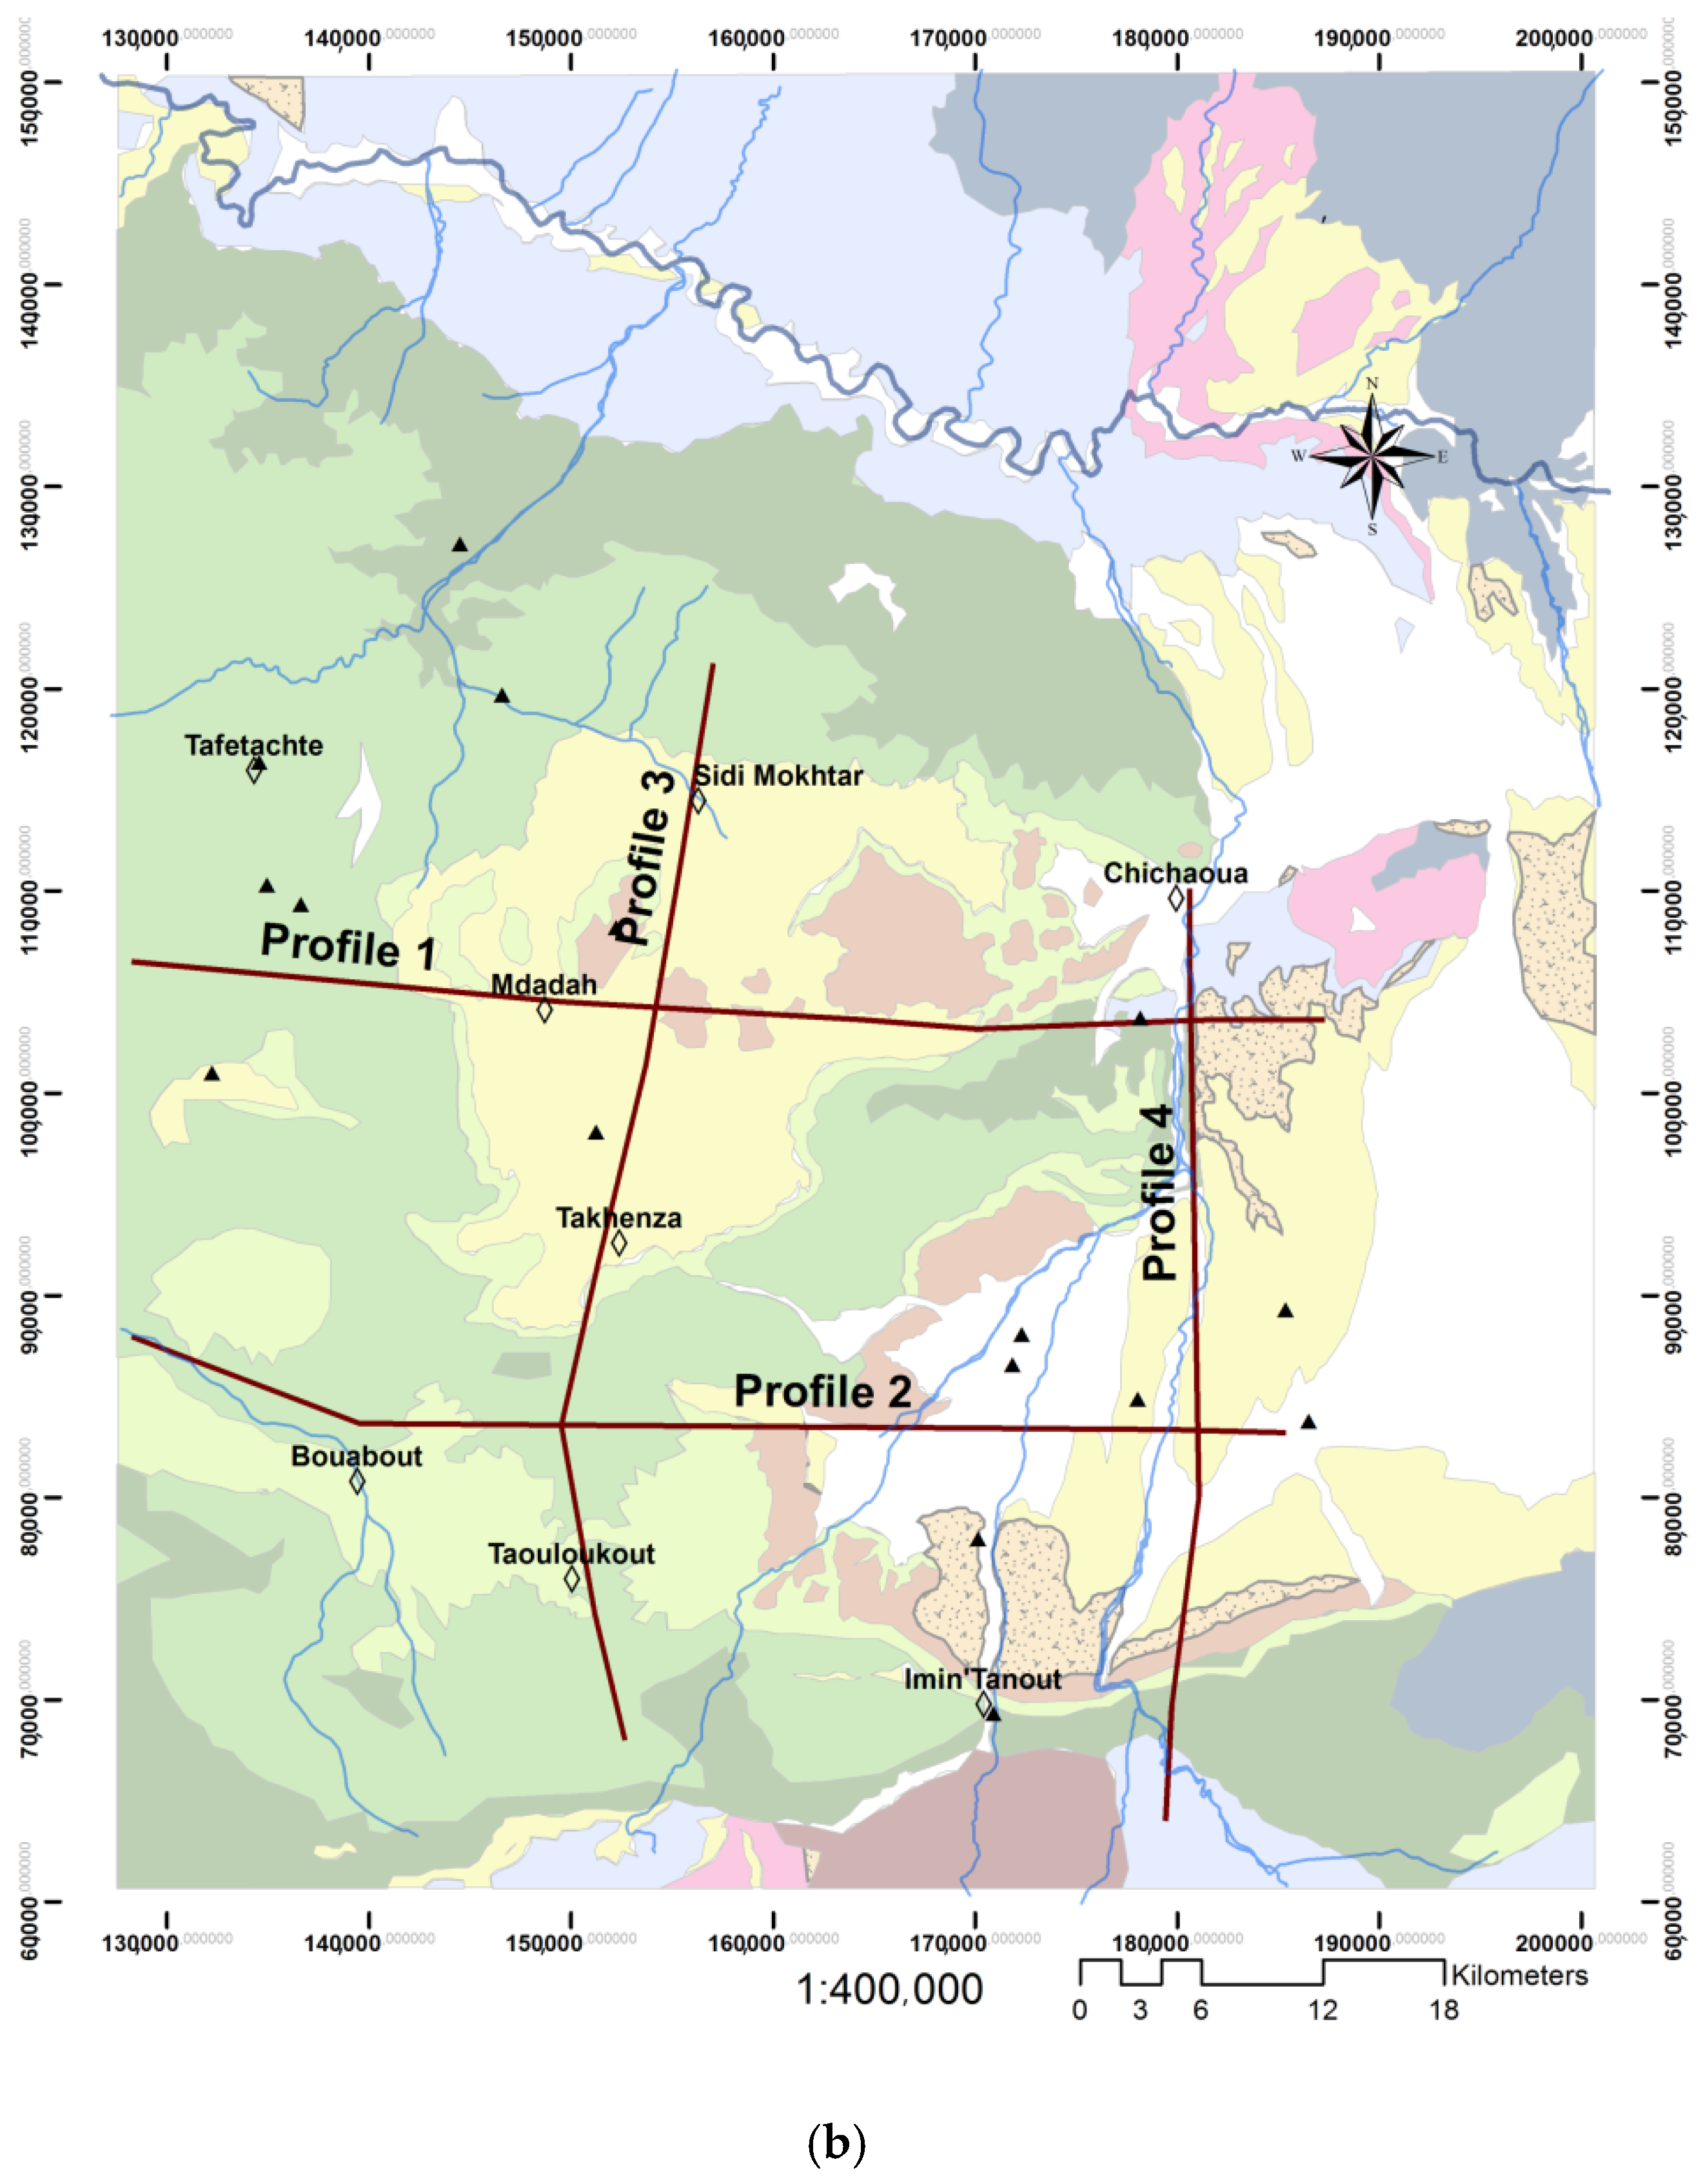
- Profiles 1 and 2 describe two synclines and one anticline separated by Cretaceous layers under Lower Cretaceous formations (Sidi Mokhtar). The first cuvette of Sidi Mokhtar shows Eocene formations in the surface laying on limestone from Cenomanian-Turonian. These structures cover green marls and marl limestones of the Lower Cretaceous. The anticline of Marmouta favors the occurrence of resurgences of the aquifer (source 497/52). The second cuvette of Douirane is formed by the Quaternary that sits on the Mio-Pliocene and the Cenomanian-Turonian (that comes to the surface toward the west).
- Profile 3 highlights the Sidi Mokhtar Syncline with Mio-Pliocene and Eocene filling over the Cenomanian-Turonian limestone. Cretaceous outcrops around the Sub-Atlas structure as shown in the southern part of the profile.
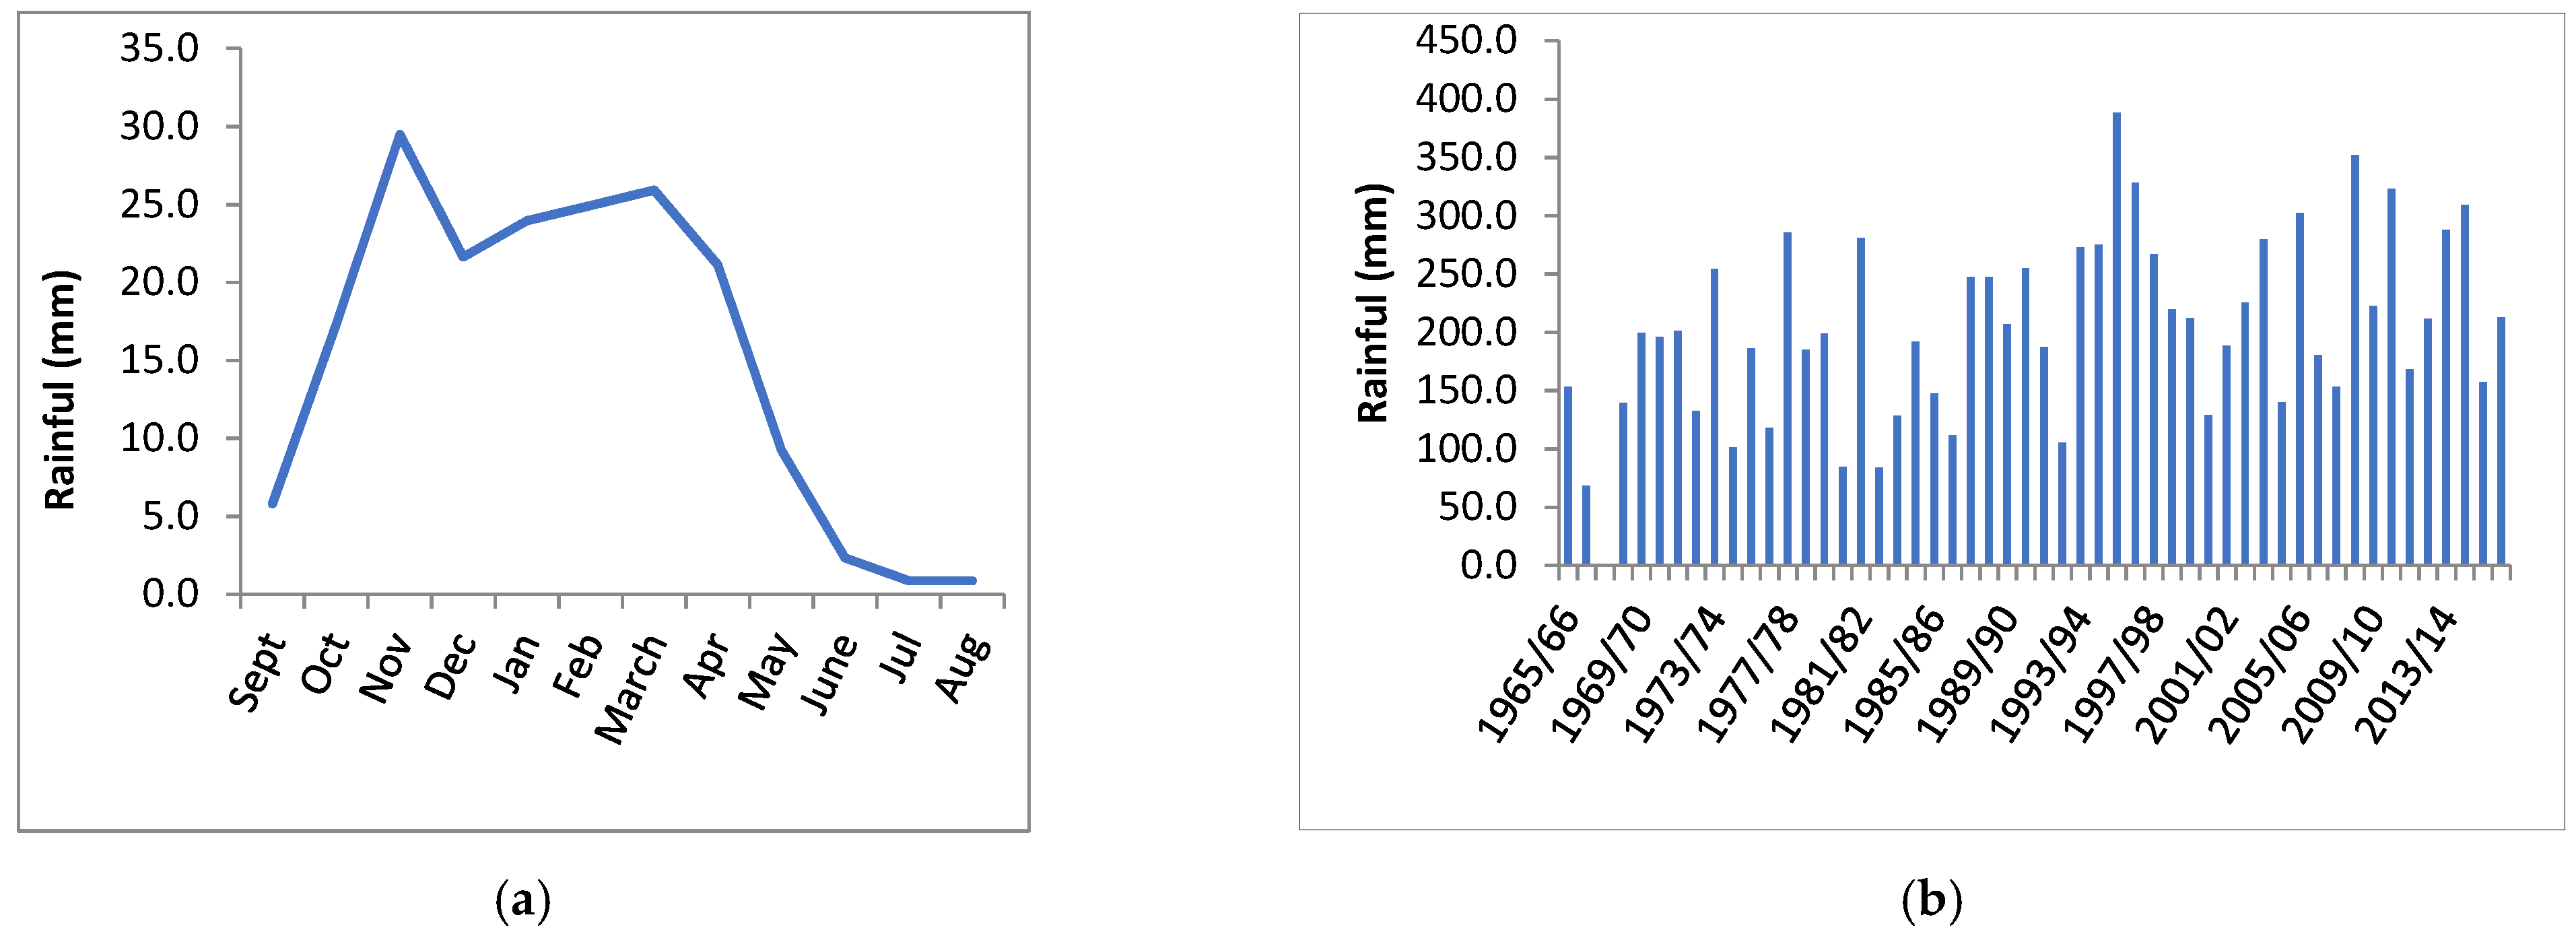
3. Climate and Hydrology
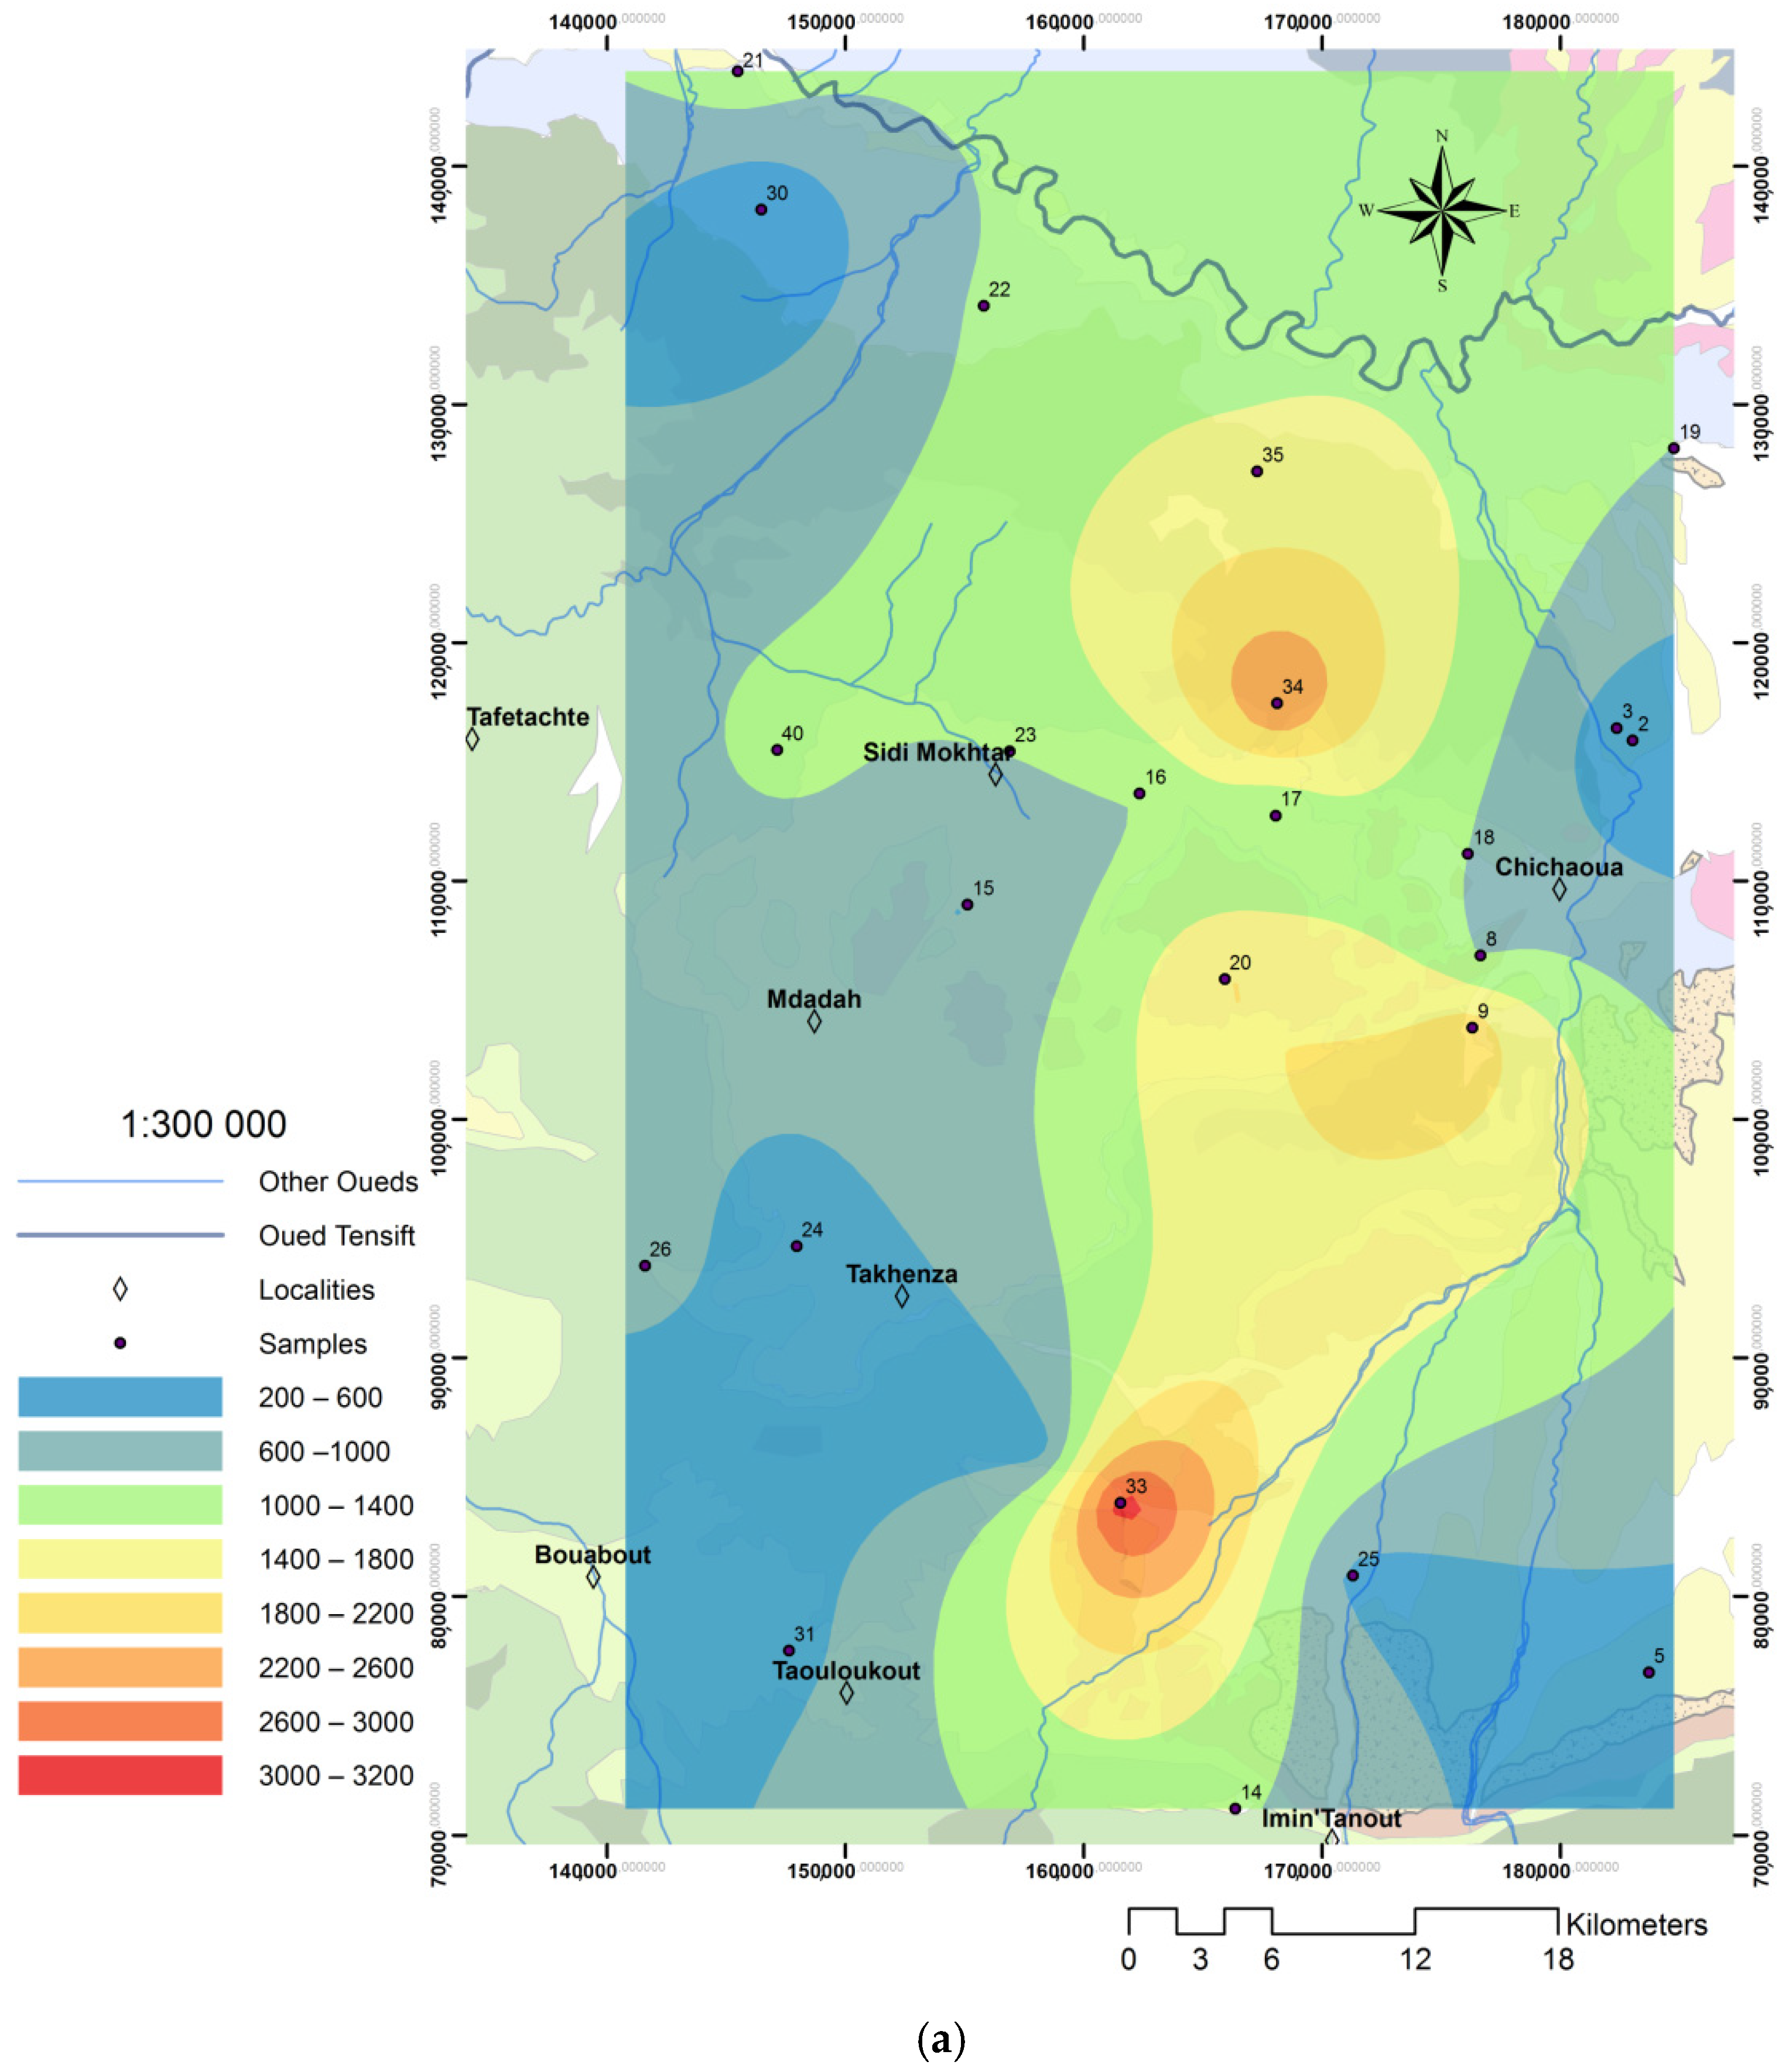
4. Hydrogeology
5. Methodology
6. Results: Hydrochemistry Characterization
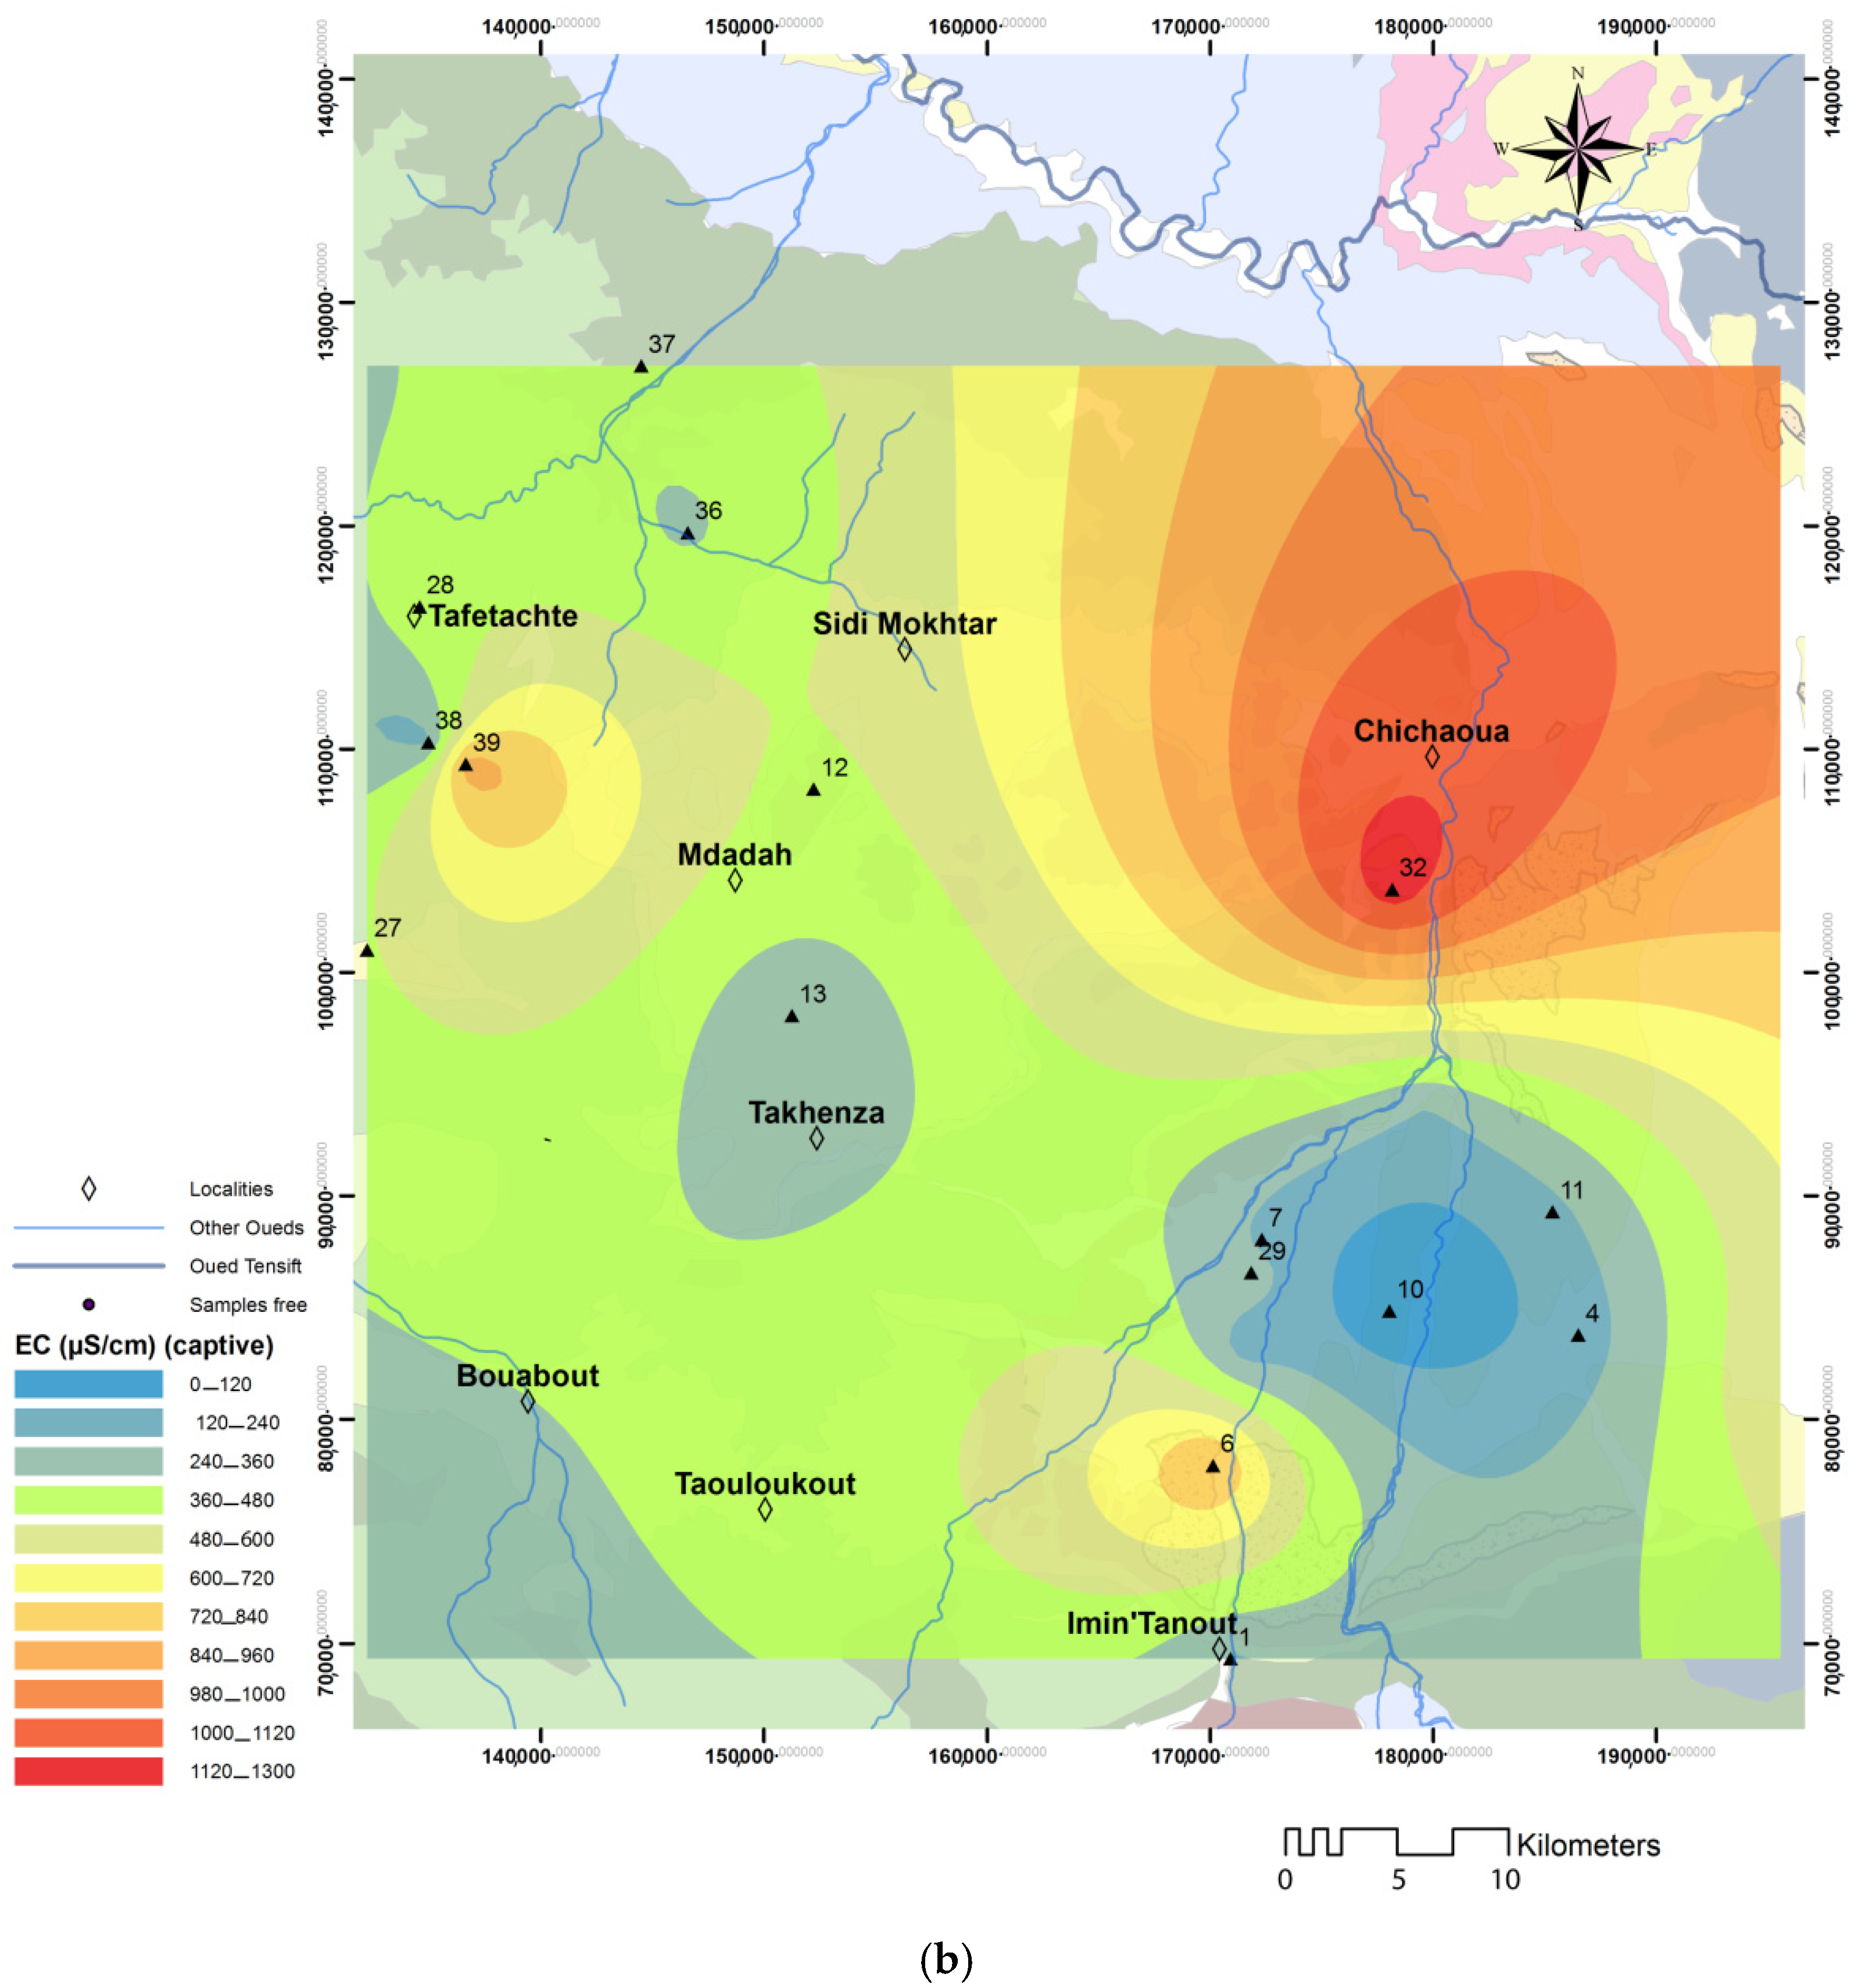
6.1. Spatial Distribution of the Electric Conductivity (EC)
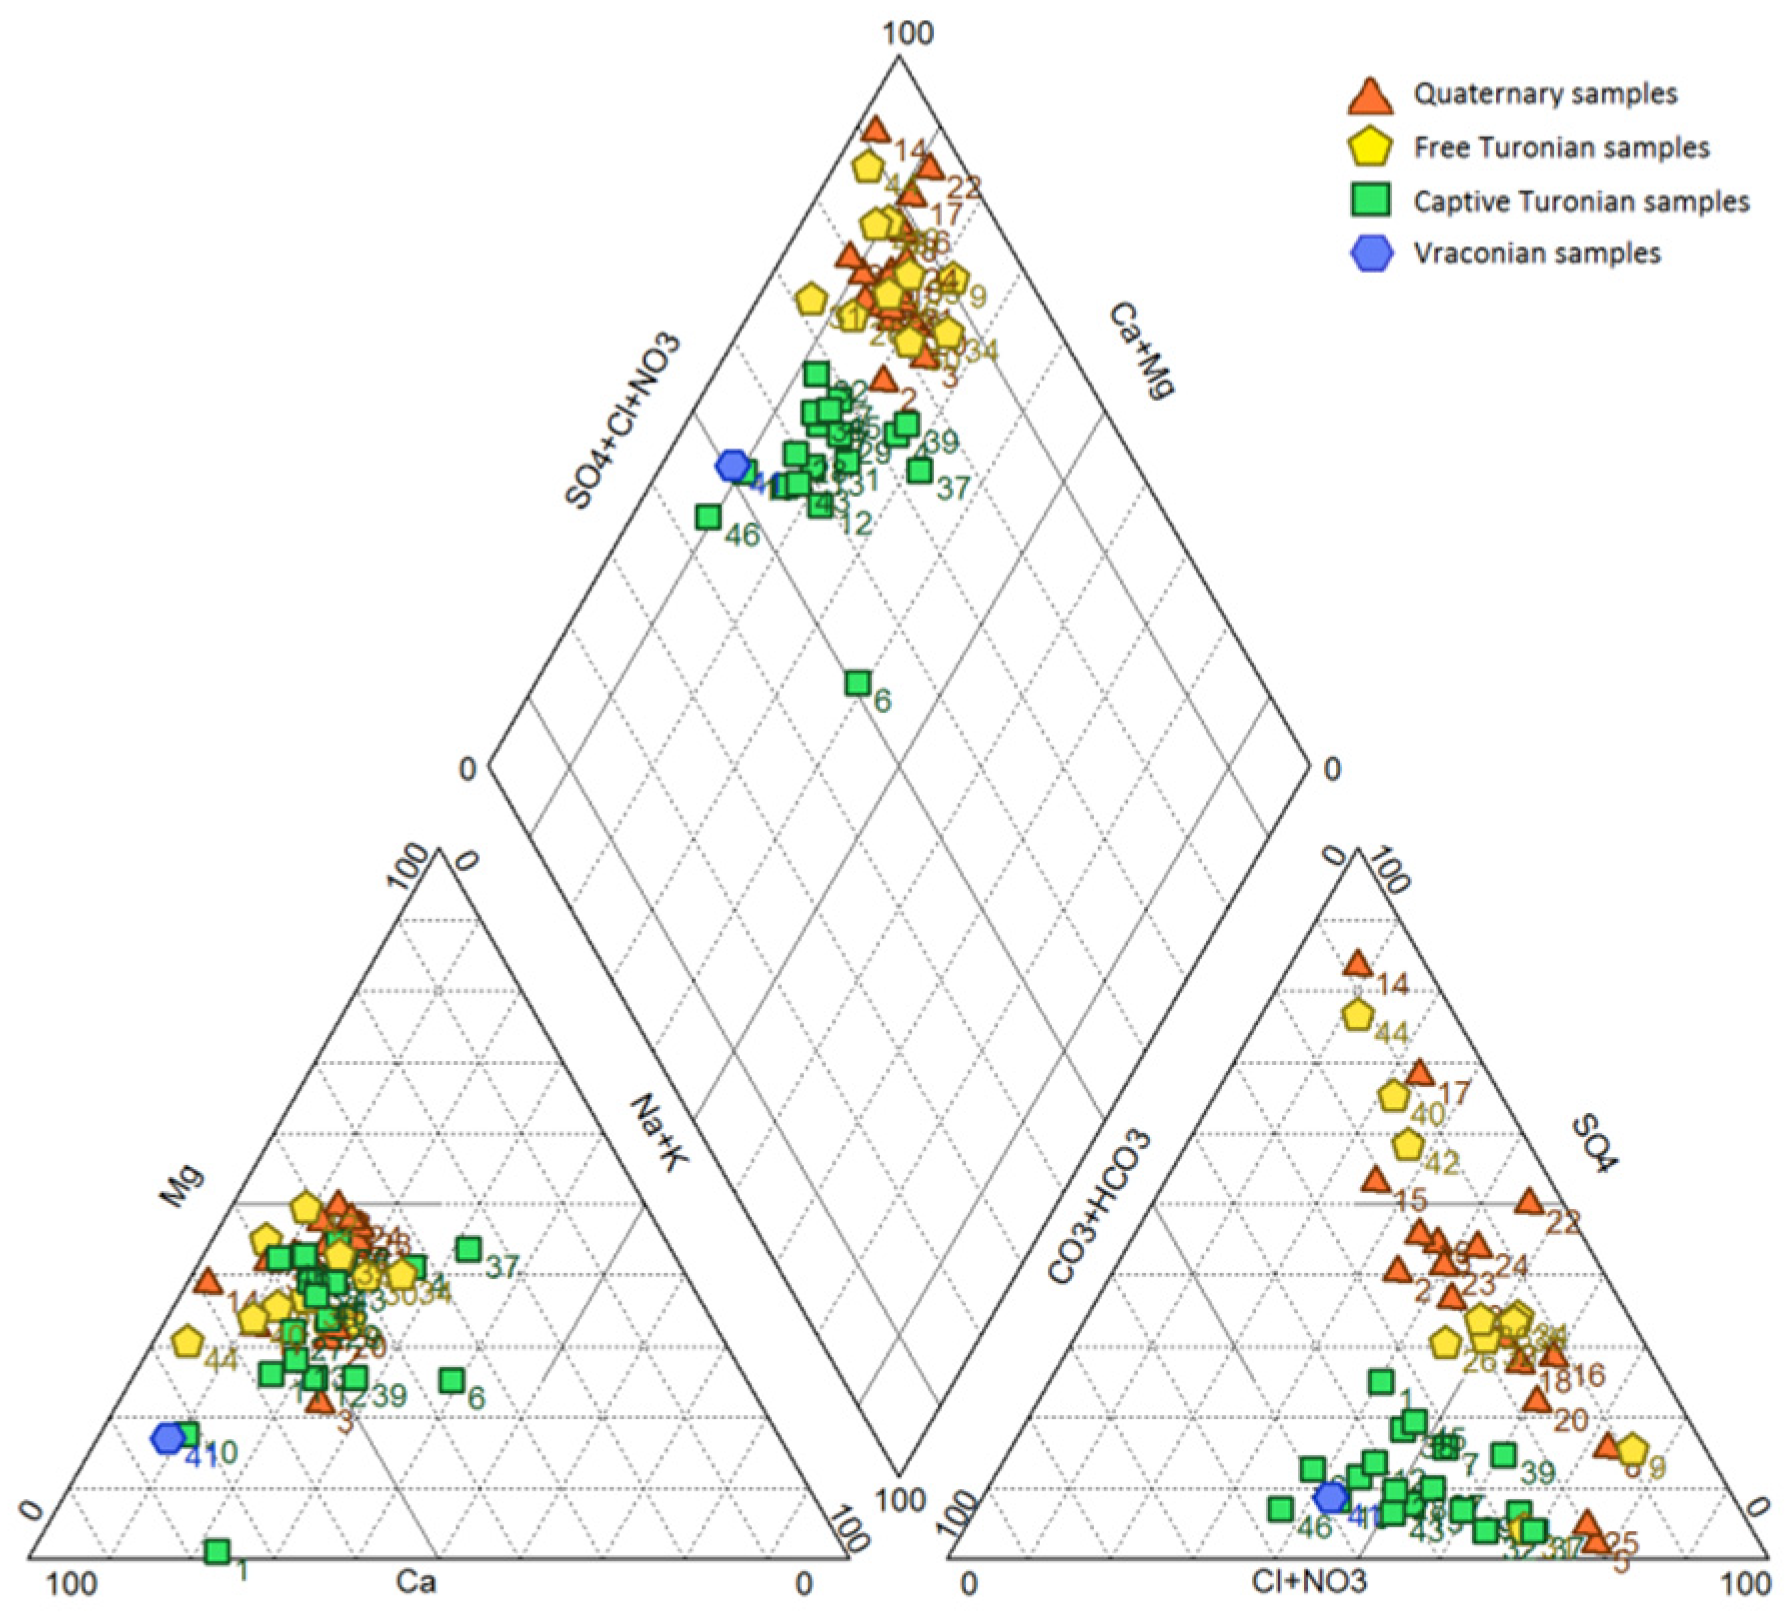
6.2. Main Ionic Character
6.3. Water Types
6.4. Isotopes
7. Discussion
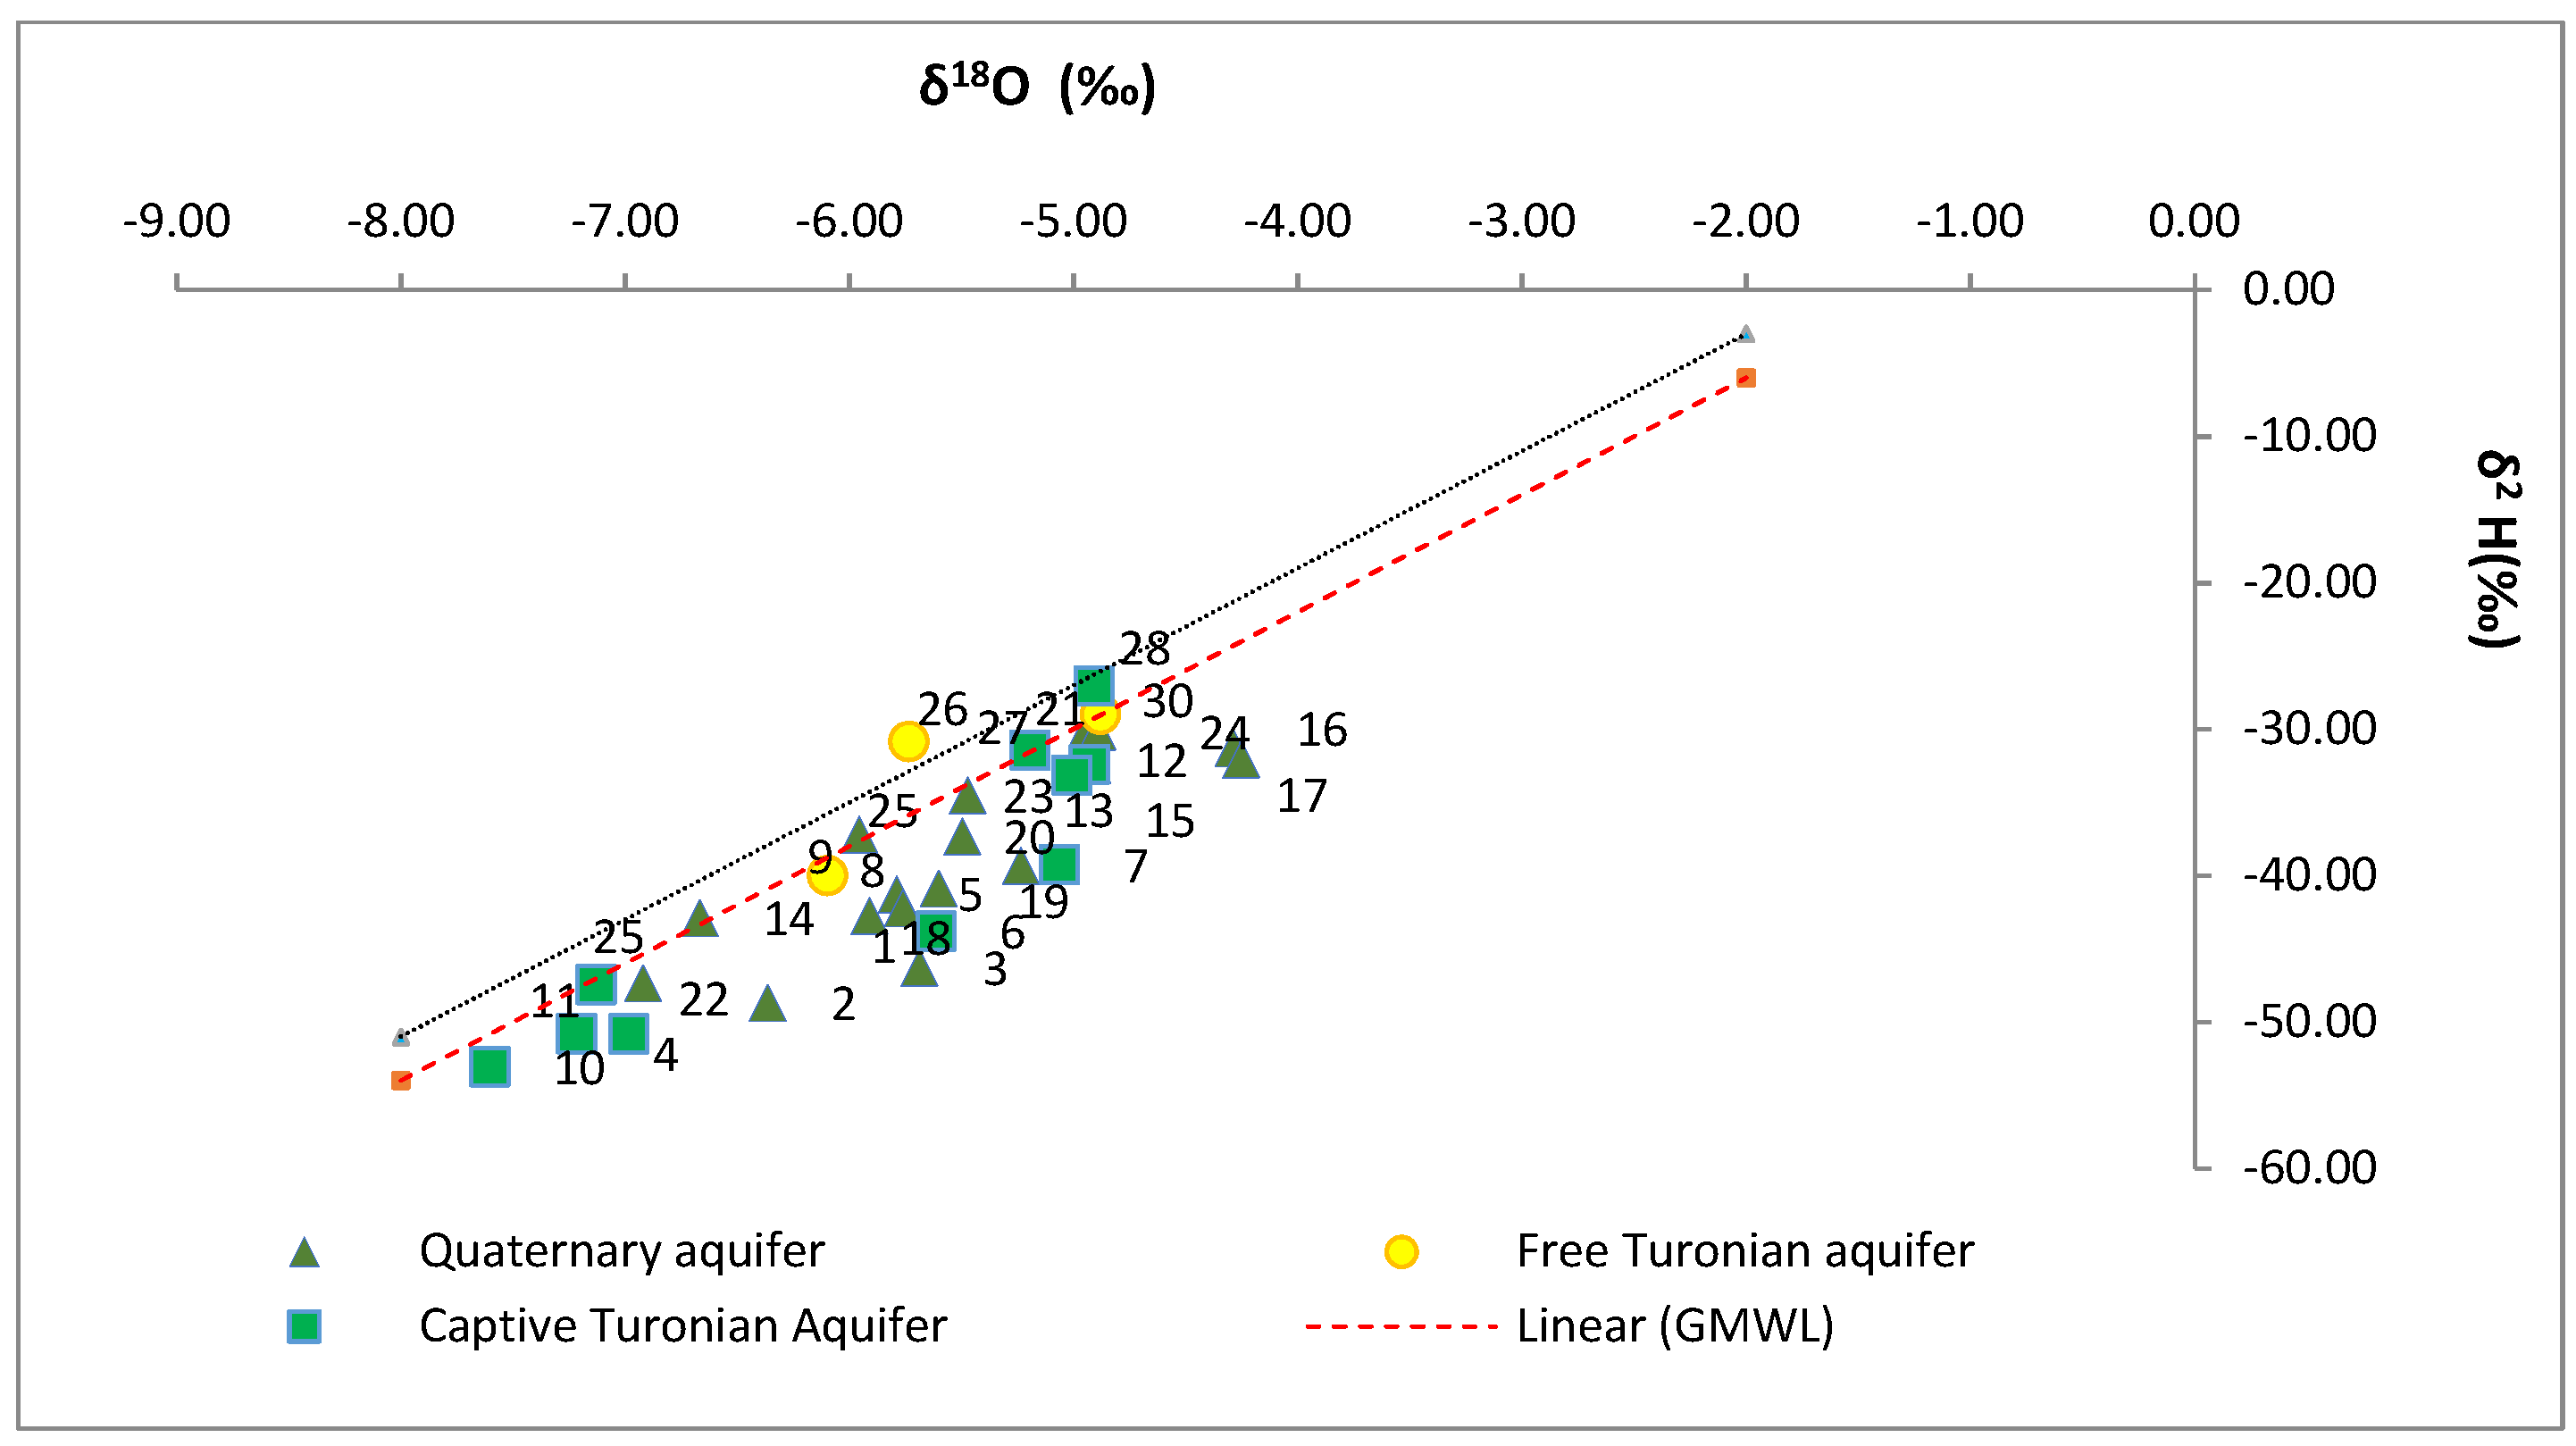
7.1. Isotopes
- The first with points 14, 21, 25, 26, 27, 28, 29, and 30 located a little above the GMWL, which may indicate that the trickled waters were not submitted to evaporation;
- The second that encloses all the remaining samples appeared below the GMWL and seems to be partitioned by evaporation.
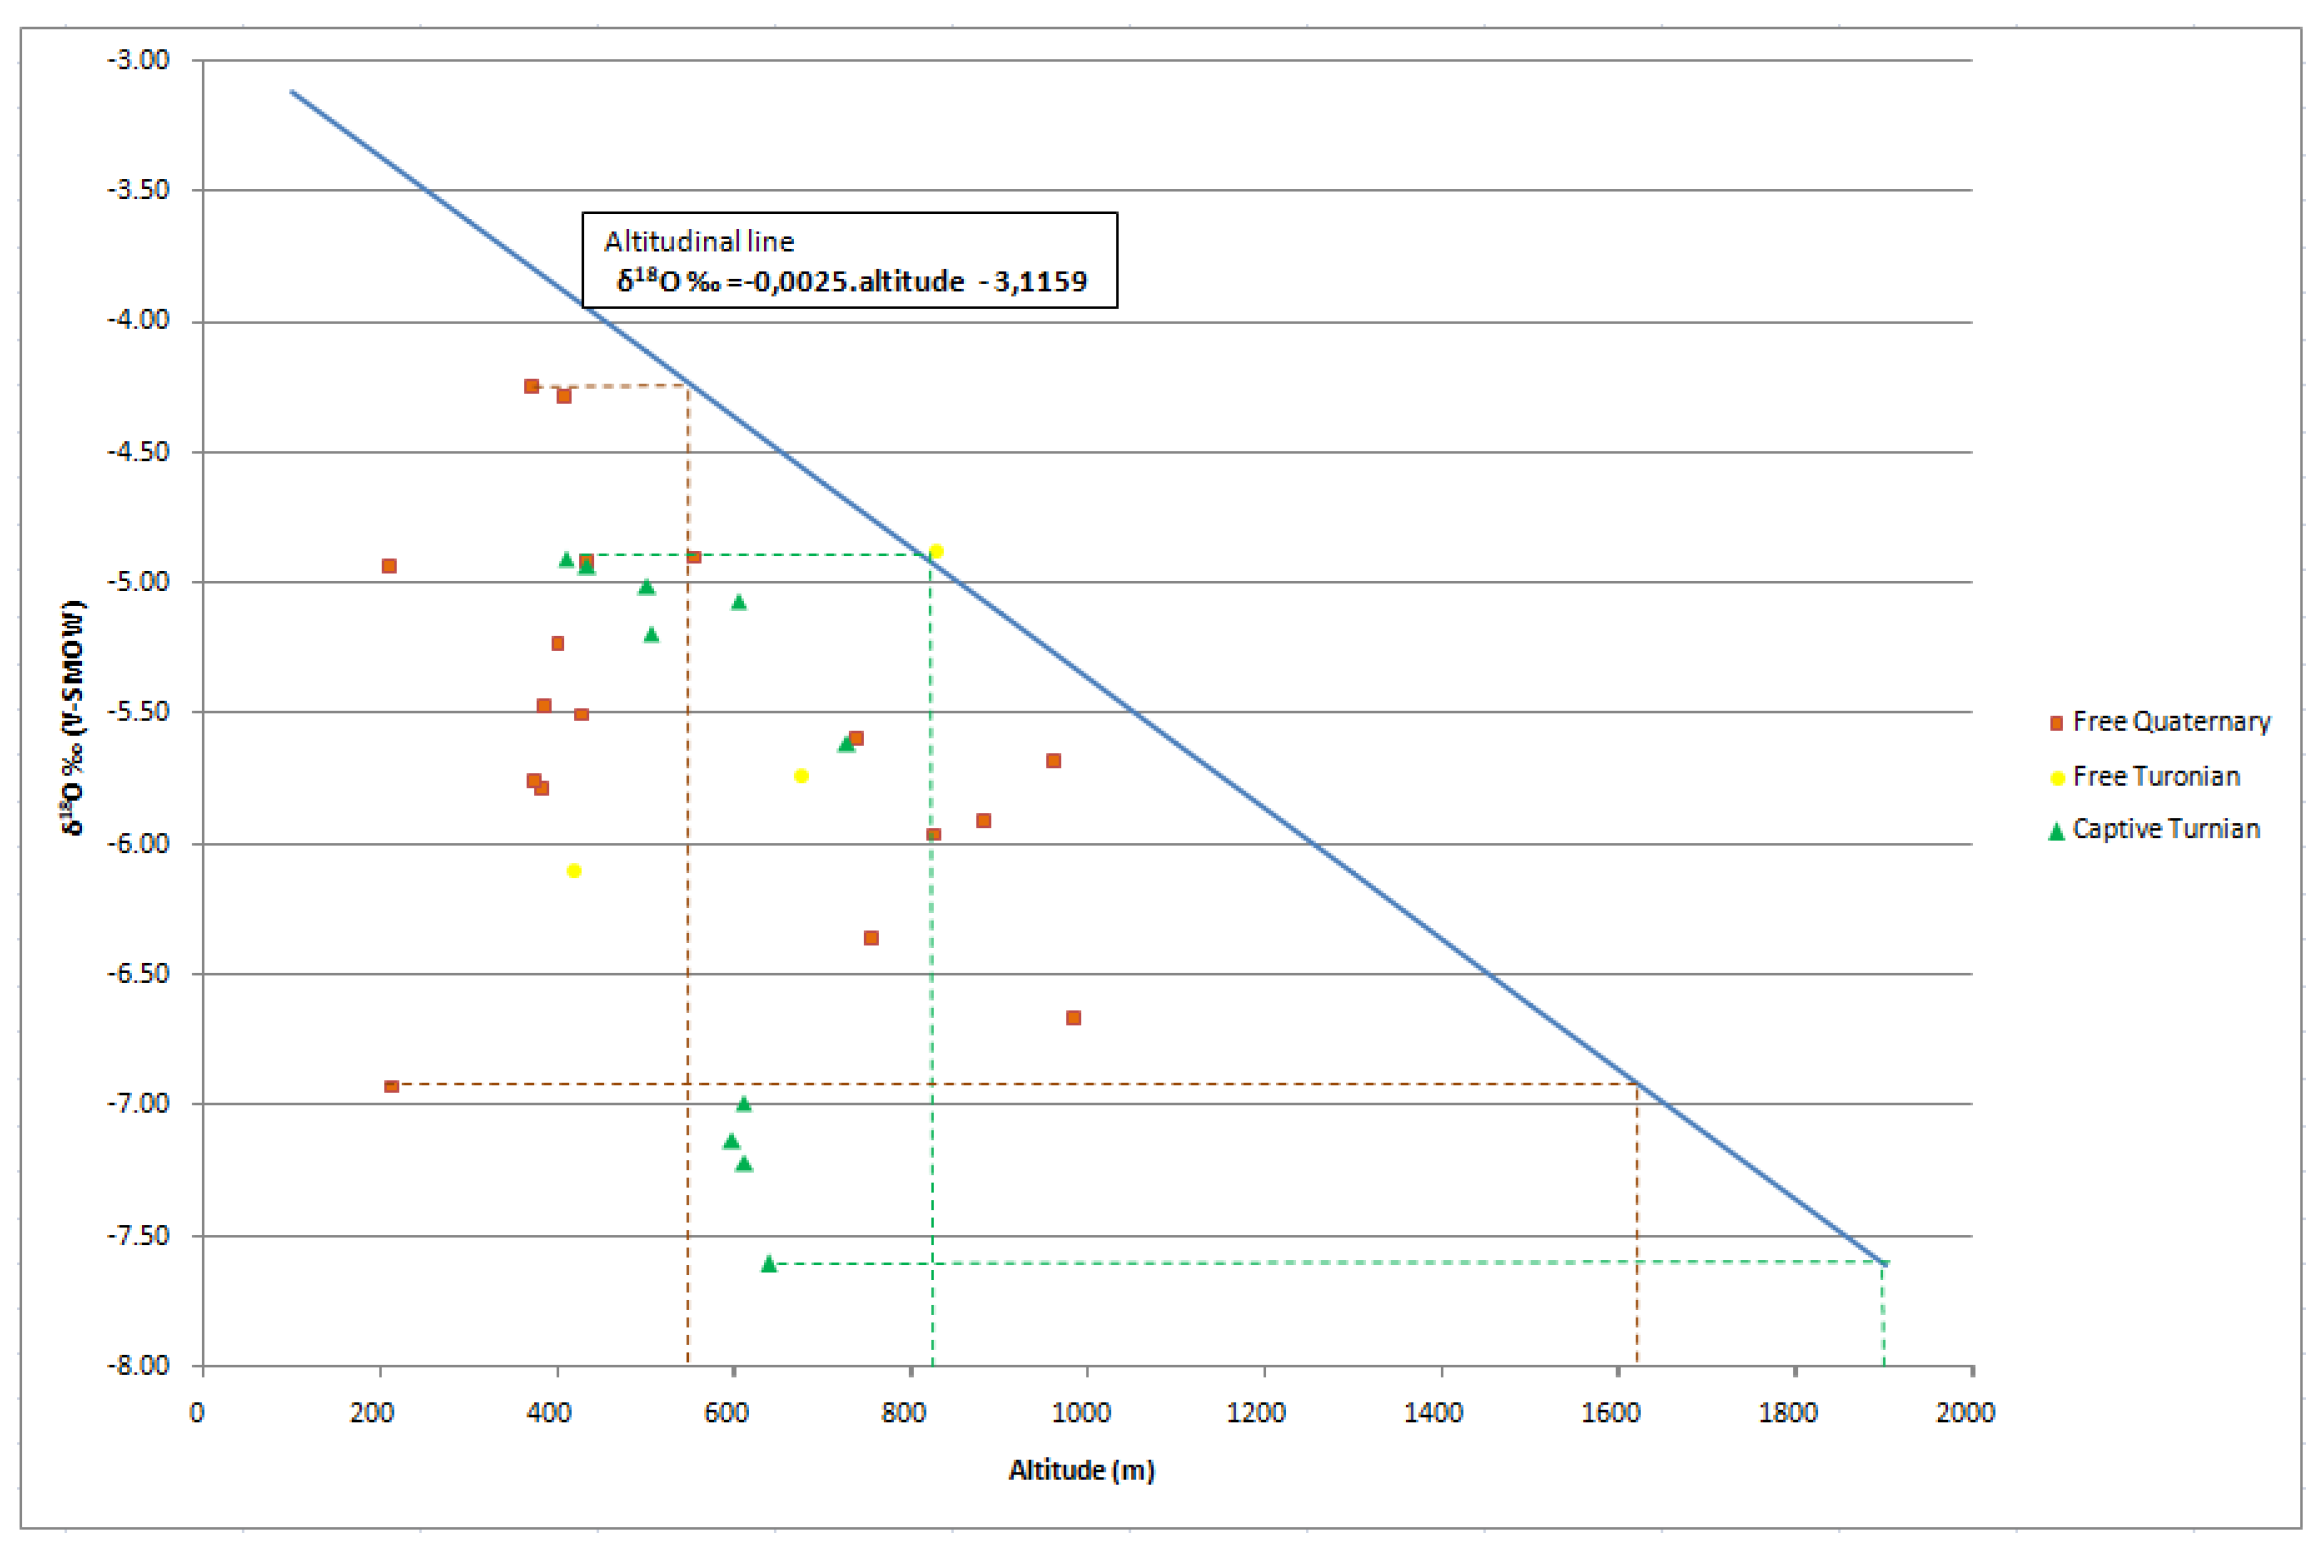
7.2. Charging Altitude
8. Conclusions
Author Contributions
Funding
Institutional Review Board Statement
Informed Consent Statement
Conflicts of Interest
References
- Hssaisoune, M.; Bouchaou, L.; Sifeddine, A.; Bouimetarhan, I.; Chehbouni, A. Moroccan Groundwater Resources and Evolution with Global Climate Changes. Geosciences 2020, 10, 81. [Google Scholar] [CrossRef] [Green Version]
- El Mandour, A.; El Yaouti, F.; Fakir, Y.; Zarhloule, Y.; Benavente, J. Evolution of groundwater salinity in the unconfined aquifer of Bou-Areg, Northeastern Mediterranean coast, Morocco. Environ. Geol. 2008, 54, 491–503. [Google Scholar] [CrossRef]
- Wen, X.H.; Wu, Y.Q.; Wu, J. Hydrochemical characteristics of groundwater in the Zhangye basin, North western China. Environ. Geol. 2008, 55, 1713–1724. [Google Scholar] [CrossRef]
- Milnes, E. Process-based groundwater salinisation risk assessment methodology: Application to the Akrotiri aquifer (Southern Cyprus). Hydrol. J. 2011, 399, 29–47. [Google Scholar] [CrossRef] [Green Version]
- Hamzaoui-Azaza, F.; Tlili-Zrelli, B.; Bouhlila, R.; Gueddari, M. An integrated statistical methods and modeling minerals-water interaction to identifying hydrochemical processes in groundwater in southern Tunisia. Chem. Speciat. Bioavailab. 2013, 25, 165–178. [Google Scholar] [CrossRef] [Green Version]
- El Alfy, M.; Lashin, A.; Al Arifi, N.; Al Bassal, A. Groundwater characteristics and pollution Assessment using integrated Hydrochemical investigations GIS and multivariate geostatistical techniques in arid area. Water Resour. Manag. 2015, 29, 5593–5612. [Google Scholar] [CrossRef]
- Fakir, Y.; Zerouali, A.; Aboufirassi, M.; Bouabdelli, M. Potential exploitation and salinity of aquifers, Chaouia coast, Atlantic shoreline, Morocco. J. Afr. Earth Sci. 2001, 32, 791–801. [Google Scholar] [CrossRef]
- Bouchaou, L.; Michelot, J.L.; Vengosh, A.; Hsissou, Y.; Qurtobi, M.; Gaye, C.B.; Bullen, T.D.; Zuppi, G.M. Application of multiple isotopic and geochemical tracers for investigation of recharge, salinization, and residence time of water in the Souss-Massa aquifer, southwest of Morocco. J. Hydrol. 2008, 352, 267–287. [Google Scholar] [CrossRef]
- El Yaouti, F.; El Mandour, A.; Khattach, D.; Benavente, J.; Kaufmann, O. Salinization processes in the unconfined aquifer of Bou-Areg (NE Morocco): A geostatistical, geochemical, and tomographic study. Appl. Geochem. 2009, 24, 16–31. [Google Scholar] [CrossRef]
- Razoki, B. Mise en Place d’un Systeme de Gestion de Base de Donnees Pour la Gestion des Ressources en Eaux Souterraines de la Nappe du Haouz. (Meseta Occidental, Maroc). Ph.D. Thesis, Cadi Ayyad University, Marrakech, Morocco, 2001; p. 6. [Google Scholar]
- Seif-Ennasr, M.; Zaaboul, R.; Hirich, A.; Caroletti, G.N.; Bouchaou, L.; El Morjani, Z.E.A.; Beraaouz, E.H.; McDonnell, R.A.; Choukr-Allah, R. Climate change and adaptive water management measures in ChtoukaAït Baha region (Morocco). Sci. Total Environ. 2016, 573, 862–875. [Google Scholar] [CrossRef]
- Milnes, E.; Perrochet, P.; Renard, P.; Cornaton, F. (Eds.) Framework for a process-based salinisation risk assessment methodology: Solute recycling versus primary groundwater salinisation. In Proceedings of the IAHR-GW2006 Meeting, Toulouse, France, 12–14 June 2006. [Google Scholar]
- Peragón, J.M.; Pérez-Latorre, F.J.; Delgado, A. A GIS-based quality assessment model for olive tree irrigation water in southern Spain. Agric. Water Manag. 2015, 148, 232–240. [Google Scholar] [CrossRef]
- Elgettafi, M.; Elmandour, A.; Himi, M.; Casas, A. The use of environmental markers to identify groundwater salinization sources in a Neogene basin, Kert aquifer case, NE Morocco. Int. J. Environ. Sci. Technol. 2013, 10, 719–728. [Google Scholar] [CrossRef] [Green Version]
- Frind, E.O.; Muhammad, D.S.; Molson, J.W. Delineation of three dimensional well capture zones for complex multiaquifer systems. Ground Water 2002, 40, 586–598. [Google Scholar] [CrossRef] [PubMed]
- Chellai, E.H. Evolution Geodynamique des Corps Sedimentairesmesoecenozoique du Haut Atlas de Marrakech. Ph.D. Thesis, Faculty of Sciences, Semlalia, Marrakech, 1995; p. 514. [Google Scholar]
- Peragón, J.M.; Delgado, A.; Rodríguez, J.A.; Pérez-Latorre, F.J. A GIS-based decision tool for reducing salinization risks in olive orchards. Agric. Water Manag. J. 2016, 166, 33–41. [Google Scholar] [CrossRef]
- Pulido-Leboeuf, P.; Pulido-Bosch, A.; Calvache, M.L.; Vallejos, A.; Andreu, J.M. Strontium, SO4/Cl and Mg/Ca2 ratios as tracers for the evolution of sea water into coastal aquifers: The example of Castell de Ferro-aquifer. C.R. Geosci. 2003, 335, 1039–1048. [Google Scholar] [CrossRef]
- Risacher, F.; Ftriz, B. Origin of salts and brine evolution of bolivian and chileansalars. Aquat. Geochem. 2009, 15, 123–157. [Google Scholar] [CrossRef]
- Lucas, Y.; Schmitt, A.D.; Clement, A.; Ftriz, B.; Elsass Ph Durand, S. Geochemical tracing and hydrogeochemical modeling of water-rock interaction during salinization of alluvial groundwater (Upper Rhine Valley, France). Appl. Geochem. J. 2010, 25, 1644–1663. [Google Scholar] [CrossRef]
- Warner, N.R.; Kresse, T.M.; Hays, P.D.; Down, A.; Karr, J.D.; Jackson, R.B.; Vengosh, A. Geochemical and isotopic variations in shallow groundwater in areas of the Fayetteville Shale development, north-central Arkansas. Appl. Geochem. 2013, 35, 207–220. [Google Scholar] [CrossRef] [Green Version]
- Rochdane, S.; El Mandour, A.; Jaffal, M.; Himi, M.; Casas, A.; Amrhar, M.; Karroum, M. Geometriedel’aquifere du Haouz oriental et Tassaout amont. Maroc occidental: Approche geophysique et hydrogeologique. Hydrol. Sci. J. 2014, 6, 33–144. [Google Scholar] [CrossRef] [Green Version]
- Ait Brahim, Y.; Benkaddour, A.; Agoussine, M.; Ait Lemkademe, A.; Al Yacoubi, L.; Bouchaou, L. Origine et salinité des eaux souterraines à partir de l’interprétation des données d’analyse dans la zone minière d’Oumjrane, sud-est du Maroc. Environ. Earth Sci. 2015, 74, 4787–4802. [Google Scholar] [CrossRef]
- Hsissou, Y.; Mudry, J.; Bouchaou, L.; Chauve, P.; Mania, J. Use of chemical tracy to study acquisition modality of mineralization and behaviour of unconfined groundwater under semi-arid climate: The case study of the Souss plain (Morocco). Environ. Geol. 2002, 42, 672–680. [Google Scholar]
- Capaccioni, B.; Didero, M.; Paletta, C.; Didero, L. Saline intrusion and refreshening in multilayer coastal aquifer in the Catania Plain (Sicily, southern Italy): Dynamics of degradation processes according to the hydrochemical characteristics of groundwaters. Hydrol. J. 2005, 307, 1–16. [Google Scholar] [CrossRef]
- De Montety, V.; Radakovitch, O.; Vallet-Coulomb, C.; Blavoux, B.; Hermitte, D.; Valles, V. Origin of groundwater salinity and hydrogeochemical processes in a confined coastal aquifer. Case of the Rhone delta (Southern France). Appl. Geochem. J. 2008, 23, 2337–2349. [Google Scholar] [CrossRef]
- Bouchaou, L.; Michelot, J.L.; Qurtobic, M. Origine et temps de séjour des eaux souterraines dans le bassin du Tadla (Maroc) à l’aide de multiples outils isotopiques et géochimiques. J. Hydrol. 2009, 379, 323–338. [Google Scholar] [CrossRef]
- Zghibi, A.; Merzougui, A.; Lahcen, Z.; Tarhouni, J. Interaction between groundwater and seawater in the coastal aquifer of Cap-Bon in the semi-arid systems (northeast of Tunisia). Carbonates Evaporites 2014, 29, 309–326. [Google Scholar] [CrossRef]
- Fadili, A.; Najib, S.; Mehdi, K.; Riss, J.; Makan, A.; Boutayed, K.; Guessir, H. Hydrochemical features and mineralization processes in coastal groundwater of Oualidia. Morroco. Afr. Earth Sci. J. 2016, 116, 233–247. [Google Scholar] [CrossRef]
- Chafouq, D.; El Mandour, A.; Elgettafi, M.; Himi, M.; Chouikri, I.; Casas, A. Hydrochemical and isotopic characterization of groundwater in the Ghis-Nekor plain (Northern Morocco). J. Afr. Earth Sci. 2017, 139, 1–13. [Google Scholar] [CrossRef]
- Zammouri, M.; Siegfried, T.; El-Fahem, T.; Kriâa, S.; Kinzelbach, W. Salinization of groundwater in the Nefzawa oases region, Tunisia: Results of a regional-scale hydrogeologic approach. Hydrogeol. J. 2007, 15, 1357–1375. [Google Scholar] [CrossRef] [Green Version]
- Boutaleb, S.; Bouchaou, L.; Mudry, J.; Hsissou, Y.; Chauve, P. Effects of lithology on quality of water resources. The case of ouedIssen (Western Upper Atlas, Morocco). Hydrogeol. J. 2000, 8, 230–238. [Google Scholar] [CrossRef]
- Al-Harbi, O.; Hussain, G.; Khan, M.M. Hydrogeochemical processes and isotopic characteristics of inland Sabkha, Saudi Arabia. Asian Earth Sci. J. 2008, 1, 16–30. [Google Scholar] [CrossRef] [Green Version]
- Farid, I.; Trabelsi, R.; Zouari, K.; Abid, K.; Ayachi, M. Hydrogeochemical processes affecting groundwater in an irrigated land in Central Tunisia. Environ. Earth Sci. 2013, 68, 1215–1231. [Google Scholar] [CrossRef]
- Bel Hadj Salem, S.; Chkir, N.; Zouari, K.; Cognard-Plancq, A.L.; Valles, V. Hydrochemical and isotope evidence of groundwater contamination of cultivated fields of semi-arid environments in Tunisia. Arid Land Manag. J. 2012, 26, 181–199. [Google Scholar] [CrossRef]
- Abourida, A.; Er-rouane, S.; Bahir, M.; da Silva, M.O.; Cheggour, A. Contribution des isotopes de l’environnement pour la compréhension du fonctionnement de l’aquifère Mio-Plioquaternaire du Haouz de Marrakech (Maroc). Estudios Geol. 2004, 60, 161–167. [Google Scholar] [CrossRef]
- Karroum, M.; El Mandour, A.; Khattach, D.; Cassas, A.; Himi, H.; Rochdane, S.; Laftouhi, N.; Khalil, N. Fonctionnement hydrogeologique du bassin de la Bahira (Maroc central): Apport de l’analyse des donneesgeologiques et grav- imetriques. Can. J. Earth Sci. 2014, 51, 517–526. [Google Scholar] [CrossRef]
- Tagma, T. Ressources en eau souterraine de l’aquifère du souss-massa: Étude de la qualité et de la vulnérabilité. PhD. Thesis, University Ibnou Zohr Faculty of Sciences of Agadir, Agadir, Morocco, 2011; 120p. [Google Scholar]
- Edmunds, W.M. Renewable and non-renewable groundwater in semi-arid and arid regions. Devel. Water Sci. 2003, 50, 265–280. [Google Scholar]
- Elmeknassi, M.; El Mandour, A.; Elgettafi, M.; Himi, M.; Tijani, R.; El Khantouri, F.A.; Casas, A. A GIS-based approach for geospatial modeling of groundwater vulnerability and pollution risk mapping in Bou-Areg and Gareb aquifers, northeastern Morocco. Environ. Sci. Pollut. Res. 2021, 28, 51612–51631. [Google Scholar] [CrossRef]
- Vengosh, A. Salinization and saline environments. In Environmental Geochemistry; Sherwood Lollar, B., Ed.; Elsevier Science: Amsterdam, The Netherlands, 2003; pp. 333–365. [Google Scholar]
- Aquilina, L.; Ladouche, B.; Doerfliger, N.; Seidel, J.L.; Bakalowicz, M.; Dupuy, C.; LeStrat, P. Origin, evolutionand residence time of saline thermal fluids (Balaruc springs, southern France): Implications for fluid transfer across thecontinental shelf. Chem. Geol. 2002, 192, 1–21. [Google Scholar] [CrossRef]
- Wang, Y.; Guo, Q. Strontium isotope characterization and major iongeochemistry of karst water flow, Shentou, northern China. J. Hydrol. 2006, 328, 592–603. [Google Scholar] [CrossRef]
- Bouchaou, L.; Chauve, P.; Mania, J.; Murdry, J.; Michelot, J.L. Apports des traçages artificiel et naturel à la connaissance des circulations et des zones de recharge en région semi-aride: Cas de l’Atlas de Béni-Mellal (Maroc). Rev. Des Sci. De L’eau 1995, 8, 43–55. [Google Scholar] [CrossRef] [Green Version]
- Mahlknecht, J.; Garfias, J.; Aravena, R.; Tesch, R. Geochemical and isotopic investigations on groundwater residence time and flow in the Independence Basin, Mexico. J. Hydrol. 2005, 324, 283–300. [Google Scholar] [CrossRef]
- Ladouche, B.; Luc, A.; Dor fliger, N. Chemical and isotopic investigation ofrainwater in Southern France (1996–2002): Potential use as input signal forkarst functioning investigation. J. Hydrol. 2009, 367, 150–164. [Google Scholar] [CrossRef]
- Bouchaou, L.; Tagma, T.; Boutaleb, S.; Hssaisoune, M.; El Morjani, Z. Climate change and its impacts on ground water resources in Morocco: The case of the Souss-Massa basin. In Climate Change Effects on Groundwater Resources: A Global Synthesis of Findings and Recommendations; International Association of Hydrogeologists: Reading, UK, 2012; Volume 27, pp. 129–144. [Google Scholar]
- Mastrocicco, M.; Vignoli, G.; Colombani, N.; Zeid, N.A. Surface electrical resistivity tomography and hydrogeological characterization to constrain groundwater flow modeling in an agricultural field site near Ferrara (Italy). Environ. Earth Sci. 2010, 61, 311–322. [Google Scholar] [CrossRef]
- Tazioli, A.; Conversini, P.; Peccerillo, A. Hydrogeological and geochemical characterization of the Rock of Orvieto. Environ. Earth Sci. 2012, 66, 55–65. [Google Scholar] [CrossRef]
- Giang, N.V.; Thanh, L.N.; Hiep, V.Q.; Hida, N. Hydrological and hydrogeological characterization of groundwater and river water in the North Hanoi industrial area. Vietnam. Environ. Earth Sci. 2014, 71, 4915–4924. [Google Scholar] [CrossRef]
- Chouikri, I.; El Mandour, A.; Jaffal, M.; Baudron, P.; García-Aróstegui, J.; Manar, A.; Casas, A. Gravimetry contributions to the study of the complex western Haouz aquifer (Morocco): Structural and hydrogeological implications. J. Afr. Earth Sci. 2015, 115, 234–245. [Google Scholar] [CrossRef]
- Bouatmani, R.; Alami, A.; Medina, F. Subsidence, évolution thermique et maturation des hydrocarbures dans le bassin d’Essaouira (Maroc): Apport de la modélisation. Bull. De L’institut Sci. Rabat Sect. Sci. De La Terre 2007, 29, 15–36. [Google Scholar]
- Sinan, M. Méthodologie D’identification, D’évaluation et de Protection des Ressources en eau des Aquifères Régionaux par la Combinaison des SIG, de la Géophysique et de la Géostatistique: Application à L’aquifère du Haouz de Marrakech (Maroc). Ph.D. Thesis, Mohammed V University, Mohammadi School of Engineering, Rabat, Morocco, 2000; 353p. [Google Scholar]
- Abourida, A. The Hydrogeological Approach of the Haouz Aquifer (Morocco) by Teledetection, Isotopy, GIS and Modelling. Ph.D. Thesis, Cadi Ayyad, Marrakech, Morocco, 2007. [Google Scholar]
- Soulaimani, A. L’evolution Structurale des Affleurementspaleozoïquesdu Haouz de Marrakech (Guemassa-Nfis)—Maroc. These3 eme Cycle; Cadi Ayyad University: Marrakech, Morocco, 1991; p. 180. [Google Scholar]
- El Mandour, A.; Khattach, D.; Boughriba, M.; Mania, J.; Aboufirrassi, M.; El Hebil, A. Comportement Bicouche du Reservoir Fissure du Massif des Jebilet (Meseta occidentale, Maroc). In Sciences et techniques de l’environnement. Mémoire hors-série; Université de Franche Comté: Besançon, France, 2001; pp. 137–140. [Google Scholar]
- Boukhari, K. La plaine de Mejjate et sa bordure occidentale: Actualisation desconnaissances hydrogéologiques et vision prospective de la mobilisation desressources en eau. Ph.D. Thesis, Université Cadi Ayyad, Marrakech, Morocco, 2008; 159p. [Google Scholar]
- Ambroggi, R.; Thuille, G. Les Plaines et les Plateaux des Domaines Marginal de l’Atlas, Haouz de Marrakech. Hydrogeologie du Maroc; Notes et memoires N120; Service Geologique: Rabat, Morocco, 1987; p. 50. [Google Scholar]
- Hydraulic Basin of Tensift Agency ABHT; Division des Ressourceseneau (DRE): Morocco, 2012.
- Hydraulic Basin of Tensift Agency ABHT. Etude de la Structure des Aquifères en Amont de Ain Abainouparméthode Electrique (Province de Chichaoua); GéoAtlas: Hendaye, France, 2009. [Google Scholar]
- Hydraulic Basin of Tensift Agency ABHT. Etude par Prospection Electrique de la Plaine d’Oulad Bou Sbaa, Province de Chichaoua; MEDITECIN: Mostná, Slovakia, 2010. [Google Scholar]
- Boumaggard, E.H.; Jourani, E.; Mchichi, M.; Griboulard, R.; Hamoumi, N.; Daoudi, L. Analyse du réseau de thalwegs comme marqueur structural: Application au gisement phosphaté des Oulad Bou Sbaa (Haut Atlas occidental, Maroc). Ann. Soc. Géol. Du Nord 2001, T8, 173–179. [Google Scholar]
- Enanaâ, N. Etude Hydroclimatologique et Hydrogéologique des Aquifères de Laplaine de Mejjate et sa Bordure Occidentale, Simulation Numérique Des Ecoulementssouterrains de la Plaine de Mejjate (Maroc). Ph.D. Thesis, Université de Tunis II, Tunis, Tunisia, 2000; 205p. [Google Scholar]
- Clark, I.; Fritz, P. Environmental Isotopes in Hydrogeology; CRC Press: Boca Raton, FL, USA, 1997. [Google Scholar]
- Chouikri, I. Contribution à l’étude des Eaux Souterraines de la Plaine du Haouz Occidental et la Plaine de Mejjate: Approche Hydrogéologique, Géophysique et Géochimique. Maroc occidental. Ph.D. Thesis, Faculté des Sciences Semlalia-Marrakech, Marrakesh, Morocco, 2017. [Google Scholar]
- Hydraulic Basin of Tensift Agency (ABHT). Etude de Révision du plan Directeur D’aménagement Intégré des Ressources en Eau Des Bassins du Tensift, Ksob et Igouzoulen; Hydraulic Basin of Tensift Agency (ABHT): Tensift, Morocco, 2014. [Google Scholar]
- Craig, H. Isotopic variation in meteoric waters. Science 1961, 133, 1702–1703. [Google Scholar] [CrossRef] [PubMed]
- El Bouqdaoui, K.; Aachib, M.; Blaghen, M.; Kholtei, S. Modélisation de la pollution par les nitrates de la nappe de Berrechid, au Maroc. Afr. Sci. 2009, 5, 99–113. [Google Scholar] [CrossRef]
- Lyakhloufi, S. Vulnerability and Pollution Risk of the Water Table of the Haouz. Ph.D. Thesis, Cadi Ayyad University, Marrakech, Morocco, 2001. [Google Scholar]
- Chaib, W.; Bouchahm, N.; Harrat, N.; Zahi, F.; Bougherira, N.; Djabri, L. Caractérisation hydrogéochimique des eaux géothermales de la nappe du continental intercalaire de la région de l’Oued Righ. J. Alg. Rég. Arid. 2013, 12, 55–64. [Google Scholar]
- Fidelibus, M.D.; Tulipano, L. Mixing phenomena owing to sea water intrusion for the interpretation of chemical and isotopic data of discharge water in the apulian coastal carbonate aquifer (Southern Italy). In Proceedings of the 9th Salt Water Intrusion Meeting, Delft, The Netherlands, 12–16 May 1986; pp. 591–600. [Google Scholar]
- Stigter, T.Y.; van Ooijen, S.P.J.; Post, V.E.A.; Appelo, C.A.J.; Dill, A.C. A hydrogeological and hydrochemical explanation of the groundwater composition under irrigated land in a Mediterranean environment, Algarve, Portugal. J. Hydrol. 1998, 208, 262–279. [Google Scholar] [CrossRef]
- Subyani, A. Hydrochemical identification and salinity problem of ground-water in Wadi Yalamlam basin, Western Saudi Arabia. J. Arid Environ. 2005, 60, 53–66. [Google Scholar] [CrossRef]
- Cidu, R.; Biddau, R.; Fanfani, L. Impact of past mining activity on the quality of groundwater in SW Sardinia (Italy). J. Geochem. Explor. 2009, 100, 125–132. [Google Scholar] [CrossRef]
- Gouaidia, L.; Nabil, D.; Noureddine, Z.; Fr, C. Origine de la mineralisation des eaux souterraines d ’un aquifere dans une zone semi-aride, cas de la nappe de la merdja, nord-est algerien. Int. J. Environ. Water 2017, 6, 104. [Google Scholar]
- Alaya, M.B.; Saidi, S.; Zemni, T. Évaluation de l’aptitude des eaux souterraines profondes à la consommation et à l’irrigation dans les aquifères de la Djeffara (nord de Gabès, sud-est de la Tunisie). Environ. Earth Sci. 2014, 71, 3387–3421. [Google Scholar] [CrossRef] [Green Version]
- Moukhchane, M. Contribution à l’étude des Réservoirs Profonds de la Bordure Nord de l’Atlas Entre Demnat et Imin’tanout (Maroc). Ph.D. Dissertation, Université de Besançon, Besançon, France, 1983. [Google Scholar]
- Mester, T.; Szabo, G.; Balla, D. Évaluation des processus de purification des eaux souterraines peu profondes après la construction d’un réseau d’égouts municipal. Eau 2021, 13, 1946. [Google Scholar] [CrossRef]
- Rochdane, S.; Reddy, D.V.; El Mandour, A. Hydrochemical and Isotopic Characterisation of Eastern Haouz Plain Groundwater, Morocco; Environmental Earth Sciences–Springer: Berlin/Heidelberg, Germany, 2014; ISSN 1866-6280. [Google Scholar] [CrossRef]
- Epstein, S.; Mayeda, T. Variation de la teneur en O18 des eaux d’origine naturelle. Geochim. Cosmochim. Acta 1953, 4, 213–224. [Google Scholar] [CrossRef]
- Ettayfi, N.; Bouchaoua, L.; Michelot, J.L. Contraintes géochimiques et isotopiques (oxygène, hydrogène, carbone, strontium) pour l’origine, la salinité et le temps de séjour des eaux souterraines d’un aquifère carbonaté dans les montagnes de l’Anti-Atlas occidental, Maroc. J. Hydrol. 2012, 438, 97–111. [Google Scholar] [CrossRef]
- El Ghali, T.; Qurtobi, M.; Marah, H.; Raibi, F.; El Mansouri, B. Caractérisation chimique et isotopique des eaux pluviales du bassin de Berrechid, Maroc. J. Water Sci. Environ. Technol. 2018, 3, 335–341. [Google Scholar]
- Giraud, G. La Théorie Des Jeux; Collection; Champs Université: Paris, France, 2000. [Google Scholar]
- Kazakis, N.; Matiatos, I.; Ntona, M.M.; Bannenberg, M.; Kalaitzidou, K.; Kaprara, E.; Mitrakas, M.; Ioannidou, A.; Vargemezis, G.; Voudouris, K. Origin, implications and management strategies for nitrate pollution in surface and ground waters of Anthemountas basin based on a δ15N-NO3− and δ18O-NO3− isotope approach. Sci. Total Environ. 2020, 724, 138211. [Google Scholar] [CrossRef]
- Mook, W.G. Environmental isotopes in the hydrological cycle, Principles and applications. In Technical Documents in Hydrology, N 39; Unesco: Paris, France, 2001; Volume 5. [Google Scholar]


| Wells ID | Depth (m) | T (°C) | pH | EC (μs/cm) | Ca (mg/L) | Mg (mg/L) | Na (mg/L) | K (mg/L) | HCO3 (mg/L) | Cl (mg/L) | SO4 (mg/L) | NO3 (mg/L) | Saturation Index | δ18O (‰) | δ3H (‰) | ||
|---|---|---|---|---|---|---|---|---|---|---|---|---|---|---|---|---|---|
| Cal | Dol | Gyp | |||||||||||||||
| 1 | 84 | 21.6 | 7.26 | 386 | 156 | 1.44 | 49.8 | 4.4 | 244 | 69.225 | 137.9 | 166.9 | 0.29 | −1.7 | −1.03 | −5.91 | −42.74 |
| 2 | 91 | 21.3 | 7.61 | 299 | 190.4 | 74.64 | 93.4 | 4.5 | 329.4 | 202.35 | 422 | 111.2 | 0.77 | 0.88 | −0.56 | −6.37 | −48.68 |
| 3 | 147 | 21.1 | 7.7 | 412 | 204 | 50.88 | 104.3 | 5.6 | 231.8 | 227.2 | 445.5 | 88 | 0.74 | 0.62 | −0.5 | −5.69 | −46.28 |
| 4 | 80 | 25.6 | 7.17 | 343 | 78 | 59.44 | 70 | 3.4 | 230 | 248.5 | 43.03 | 138.6 | −0.07 | −0.45 | −1.85 | −6.98 | −50.81 |
| 5 | 204 | 23.7 | 7.36 | 496 | 156 | 107.6 | 80.8 | 2.7 | 219.6 | 230.75 | 19.84 | 477 | 0.32 | 0.26 | −1.95 | −5.6 | −40.88 |
| 6 | 210 | 24.8 | 7.08 | 925 | 108 | 45.576 | 116.3 | 30.9 | 378.2 | 134.9 | 76.74 | 62.6 | 0.18 | −0.22 | −1.46 | −5.61 | −43.77 |
| 7 | 144 | 21.8 | 8.1 | 370 | 114.4 | 75 | 54.3 | 2.5 | 256.2 | 142 | 99.92 | 186.8 | 1 | 1.56 | −1.34 | −5.06 | −39.24 |
| 8 | 70 | 25.6 | 6.94 | 964 | 264 | 211.6 | 100.9 | 6.2 | 302 | 1042.5 | 309.3 | 44.88 | 0.2 | 0.13 | −0.63 | −5.79 | −41.25 |
| 9 | 53 | 27.2 | 6.92 | 2000 | 584 | 268.8 | 317 | 38.5 | 317.2 | 1402.25 | 422.4 | 245.5 | 0.51 | 0.52 | −0.22 | −6.1 | −40.01 |
| 10 | 120 | 23.8 | 7.49 | 231 | 97.6 | 14.4 | 15.6 | 1.4 | 207.4 | 63.9 | 28.27 | 79.6 | 0.33 | −0.39 | −1.87 | −7.6 | −53.07 |
| 11 | 160 | 24.5 | 7.51 | 372 | 104.8 | 28.8 | 33.4 | 2.1 | 268.4 | 127.8 | 55.67 | 51 | 0.47 | 0.18 | −1.58 | −7.22 | −50.8 |
| 12 | 90 | 26.2 | 7.29 | 575 | 129.6 | 38.4 | 60.5 | 3.7 | 341.6 | 177.5 | 89.39 | 69.4 | 0.45 | 0.19 | −1.31 | −4.93 | −32.39 |
| 13 | 200 | 27 | 7.29 | 420 | 122.4 | 38.88 | 47.2 | 2.2 | 305 | 216.55 | 47.24 | 33.78 | 0.39 | 0.12 | −1.6 | −5.01 | −33.15 |
| 14 | 75 | 24 | 7.57 | 1062 | 528 | 211.2 | 20.8 | 7.7 | 207.4 | 106.5 | 1651 | 25.61 | 0.89 | 1.18 | 0.33 | −6.67 | −42.87 |
| 15 | 130 | 25.5 | 7.34 | 579 | 176 | 100 | 58.3 | 2.8 | 280.6 | 181.05 | 548.8 | 27.8 | 0.46 | 0.49 | −0.48 | −4.92 | −32.46 |
| 16 | 160 | 26.2 | 7.14 | 1017 | 236 | 166.8 | 77.8 | 4.2 | 254.5 | 674.5 | 475 | 113.5 | 0.31 | 0.29 | −0.47 | −4.29 | −31.28 |
| 17 | 88 | 23.1 | 7.29 | 1000 | 528 | 187.2 | 116.1 | 12.1 | 244 | 388.725 | 1533 | 4.58 | 0.66 | 0.66 | 0.29 | −4.25 | −32.06 |
| 18 | 150 | 22.7 | 6.84 | 1045 | 212 | 136.8 | 81.2 | 6.2 | 292.8 | 568 | 390.7 | 28.23 | −0.01 | −0.45 | −0.59 | −5.76 | −42.21 |
| 19 | 40 | 24.8 | 7.11 | 956 | 328 | 153.6 | 122.1 | 3.9 | 439.2 | 422.45 | 795.4 | 40.2 | 0.61 | 0.7 | −0.13 | −5.24 | −39.32 |
| 20 | 120 | 25 | 7.39 | 1823 | 232 | 98.52 | 118.3 | 4.6 | 305 | 468.6 | 312.8 | 287.5 | 0.64 | 0.71 | −0.63 | −5.5 | −37.29 |
| 21 | 100 | 25.3 | 7.92 | 1282 | 272 | 196.8 | 145.6 | 6 | 390.4 | 639 | 563.5 | 94.8 | 1.3 | 2.27 | −0.36 | −4.94 | −29.88 |
| 22 | 120 | 21.8 | 7.88 | 1056 | 496 | 278.4 | 143.2 | 8.5 | 170.8 | 1029.5 | 1564 | 49.2 | 1.02 | 1.56 | 0.24 | −6.92 | −47.33 |
| 23 | 135.6 | 25.7 | 8.01 | 1011 | 160 | 125.6 | 85.4 | 2.6 | 305 | 284 | 525.6 | 157.9 | 1.11 | 1.94 | −0.56 | −5.47 | −34.48 |
| 24 | 240 | 26.1 | 6.95 | 503 | 100 | 78.8 | 46.4 | 3 | 122 | 163.3 | 308.6 | 103 | −0.48 | −1.24 | −0.92 | −4.9 | −30.16 |
| 25 | 80 | 25.8 | 7 | 483 | 195 | 109.2 | 52.1 | 2.9 | 300 | 550 | 55.67 | 200 | 0.21 | −0.02 | −1.42 | −5.96 | −37.18 |
| 26 | 62 | 25.2 | 8.85 | 686 | 208 | 86.4 | 56.1 | 3.8 | 317.2 | 182.825 | 316.4 | 289.8 | 2.1 | 3.62 | −0.64 | −5.74 | −30.84 |
| 27 | 90 | 24.1 | 7.5 | 591 | 144 | 54 | 51 | 2.1 | 366 | 181.05 | 80.96 | 245.5 | 0.68 | 0.72 | −1.34 | −5.19 | −31.44 |
| 28 | 106 | 23.5 | 7.93 | 555 | 124 | 84 | 54.3 | 2.2 | 439.2 | 124.25 | 80.9 | 330.4 | 1.11 | 1.82 | −1.42 | −4.91 | −27.03 |
| 29 | 165 | 23.6 | 7.99 | 471 | 120 | 52.8 | 56.5 | 2.3 | 280.6 | 184.6 | 45.1 | 176.3 | 0.99 | 1.39 | −1.65 | −7.13 | −47.43 |
| 30 | 120 | 24.6 | 7.55 | 1282 | 240 | 148.8 | 147.9 | 4.9 | 414.8 | 610.6 | 534 | 36.4 | 0.91 | 1.41 | −0.42 | −4.88 | −28.98 |
| 31 | 80 | 20.4 | 7.1 | 228 | 136 | 76 | 19.8 | 2.2 | 268.4 | 248.5 | 32.49 | 235.8 | 0.06 | −0.4 | −1.76 | ||
| 32 | 167 | 21.7 | 7.3 | 490 | 170 | 98 | 52.1 | 2.8 | 431.4 | 319.5 | 40.92 | 298.6 | 0.55 | 0.62 | −1.61 | ||
| 33 | 22 | 21.5 | 7.5 | 1260 | 232 | 118.6 | 42.2 | 4.5 | 353.8 | 355 | 502.4 | 146.5 | 0.75 | 0.96 | −0.44 | ||
| 34 | 125.5 | 24.5 | 7.9 | 3245 | 261 | 182 | 210.2 | 14.7 | 374.8 | 640 | 736.6 | 349.8 | 1.22 | 2.08 | −0.28 | ||
| 35 | 56 | 25.3 | 7.1 | 2646 | 320 | 202.2 | 146.2 | 5 | 402.6 | 674.5 | 740.6 | 322.8 | 0.54 | 0.7 | −0.19 | ||
| 36 | 120 | 25.4 | 6.9 | 1485 | 236 | 109.6 | 84.4 | 5.1 | 292.8 | 355 | 426.6 | 162 | 0.14 | −0.23 | −0.49 | ||
| 37 | 160 | 23.4 | 7.3 | 485 | 96 | 103.2 | 140 | 4 | 378.2 | 301.75 | 43.03 | 470.6 | 0.28 | 0.36 | −1.82 | ||
| 38 | 130 | 23.2 | 7.01 | 520 | 144 | 74 | 52 | 2.9 | 353.8 | 266.25 | 144.2 | 5.17 | 0.15 | −0.21 | −1.1 | ||
| 39 | 180 | 21 | 7 | 645 | 176 | 57.6 | 112 | 4.5 | 329.4 | 372.75 | 152.6 | 159.3 | 0.14 | −0.46 | −1.02 | ||
| 40 | 200 | 22.7 | 6.9 | 1152 | 365.6 | 134.88 | 76.2 | 4.8 | 231.8 | 195.25 | 911.3 | 52.18 | 0.15 | −0.37 | −0.02 | ||
| 41 | 508 | 23.8 | 7.2 | 702 | 240 | 33.6 | 30.4 | 3 | 402.6 | 159.75 | 55.6 | 73.78 | 0.64 | 0.2 | −1.28 | ||
| 42 | 22.4 | 7.3 | 711 | 248 | 178.8 | 58.9 | 5.7 | 305 | 177.5 | 951.3 | 258.9 | 0.49 | 0.61 | −0.17 | |||
| 43 | 24 | 7 | 633 | 94 | 51 | 43.3 | 1.6 | 292.8 | 92.3 | 34.6 | 196.1 | −0.07 | −0.61 | −1.85 | |||
| 44 | 24.3 | 7.9 | 431 | 408 | 115.2 | 24.7 | 6.9 | 244 | 142 | 1270 | 3.71 | 1.23 | 1.71 | 0.16 | |||
| 45 | 23.2 | 6.3 | 395 | 119.2 | 58.08 | 47.8 | 2.3 | 317.2 | 168.625 | 144.2 | 160.5 | −0.67 | −1.88 | −1.16 | |||
| 46 | 25 | 7.5 | 344 | 127.6 | 67.64 | 26.7 | 2.6 | 408.7 | 67.45 | 40.92 | 159.6 | 0.71 | 0.94 | −1.66 |
Publisher’s Note: MDPI stays neutral with regard to jurisdictional claims in published maps and institutional affiliations. |
© 2021 by the authors. Licensee MDPI, Basel, Switzerland. This article is an open access article distributed under the terms and conditions of the Creative Commons Attribution (CC BY) license (https://creativecommons.org/licenses/by/4.0/).
Share and Cite
Tijani, R.; El Mandour, A.; Chafouq, D.; Elmeknassi, M.; El Ghazali, F.E.; Bouchaou, L. Chemical and Isotopic Tracers for Characterization of the Groundwater in the Heterogeneous System: Case from Chichaoua-Imin’tanout (Morocco). Water 2022, 14, 9. https://doi.org/10.3390/w14010009
Tijani R, El Mandour A, Chafouq D, Elmeknassi M, El Ghazali FE, Bouchaou L. Chemical and Isotopic Tracers for Characterization of the Groundwater in the Heterogeneous System: Case from Chichaoua-Imin’tanout (Morocco). Water. 2022; 14(1):9. https://doi.org/10.3390/w14010009
Chicago/Turabian StyleTijani, Rim, Abdennebi El Mandour, Driss Chafouq, Malak Elmeknassi, Fatima Ezzahra El Ghazali, and Lhoussaine Bouchaou. 2022. "Chemical and Isotopic Tracers for Characterization of the Groundwater in the Heterogeneous System: Case from Chichaoua-Imin’tanout (Morocco)" Water 14, no. 1: 9. https://doi.org/10.3390/w14010009