
Flood Control and Aquifer Recharge Effects of Sponge City: A Case Study in North China


1
Laboratory of Groundwater Resources and Environment, Ministry of Education, Jilin University, Changchun 130021, China
2
College of New Energy and Environment, Jilin University, Changchun 130021, China
*
Author to whom correspondence should be addressed.
Water 2022, 14(1), 92; https://doi.org/10.3390/w14010092
Submission received: 15 November 2021
/
Revised: 26 December 2021
/
Accepted: 29 December 2021
/
Published: 4 January 2022
(This article belongs to the Special Issue Urban Runoff Control and Sponge City Construction)
Abstract
:Sponge City is an integrated urban stormwater management approach and practice to tackle waterlogging, flooding, water scarcity, and their related problems. Despite many positive effects of Sponge City on flood control that have been investigated and revealed, the effect on aquifer recharge is still less known. Considering maximizing the function of natural elements such as surface water bodies and subsurface storage space, to minimize the use of a gray drainage system, a Sponge City design was proposed to substitute the planning development scheme in the study area. The stormwater management model of SWMM (storm water management model) and the groundwater flow model of MODFlow (Modular Three-dimensional Finite-difference Groundwater Flow Model) were adopted to evaluate the flood-control effect and aquifer-recharge effect, respectively. Compared with the traditional planning scenario, the peak runoff is approximately 92% less than that under the traditional planning scenario under the condition of a 5-year return period. Due to the increase in impervious areas of urban construction, the total aquifer recharge from precipitation and surface water bodies was decreased both in the present planning scenario and the Sponge City design scenario. However, the Sponge City design has a positive impact on maintaining groundwater level stabilization and even raises the groundwater level in some specific areas where stormwater seepage infrastructure is located.
1. Introduction
With rapid urbanization and global climate change, urban flooding has become a major issue in China [1,2,3]. The government of China promoted the application of the ”Sponge City” approach to reduce urban flood risk and improve the environment in these cities [4]. The concept of “Sponge City” is closely related to stormwater management strategies and practices, such as the “Sustainable Draining System” of the United Kingdom (UK), “Best Management Practice” and “Low Impact Development” from the United States and New Zealand, and “Water Sensitive City” from Australia [2,5,6]. In addition, the idea of “Sponge City” is consistent with the strategies of flood mitigation through natural and ecological approaches, e.g., to achieve flood control and aquifer recharge by using riparian woodland planting along the riverbed in the floodplain of the UK [7]. The Sponge City concept aims to: (i) control urban peak runoff and to temporarily store, recycle and purify stormwater; (ii) to upgrade the drainage systems using more green infrastructures and (iii) to integrate natural water bodies and encourage multi-functional objectives within drainage design [2]. Thus, Sponge City is an integrated urban stormwater-management approach with multiple purposes of ecological, architectural, hydrologic, hydrogeological, and economic aspects [5,8,9]. In October 2014, following the publication of “Sponge City Construction Technology Guidelines”, the Ministries of Finance, Housing and Urban–Rural Development, and Water Resources, collectively initiated a Sponge City pilot program [10]. With the strong national policy push and huge financial investment, Sponge City construction has been widely carried out in China. There are 30 “Sponge City” pilot sites that have been developed since 2015 [11], and it was planned to refit 80% of urban areas in China by 2030 to absorb and reuse at least 70% rainwater. However, the challenges and gaps in technology, finance, management, and even the idea still exist in current urban Sponge City practices [12,13,14,15,16,17], and a more comprehensive understanding and a collaborative work platform from various professionals are needed eagerly.
Like other integrated stormwater-management approaches, such as LID (Low Impact Development) and BMPs (Best Management Practices) [18,19], it is also expected that the adoption and implementation of Sponge City will provide a large opportunity to recharge groundwater in urban aquifers [17]. Urban aquifer recharge can alleviate the pressure on sewers, urban streams, and wastewater treatment plants [20]. Hydrogeology conditions and groundwater resources in urban areas were thought of as the key influencing factors for Sponge City implementation [5,21,22,23]. Xu et al. (2018) [12] recommended that the dispersed ponds and the ditches made of durable and permeable materials in the drainage system should be adopted in Sponge City construction to increase the amount of infiltration, storage, and utilization of rainwater. Kang et al. (2019) [24] summarized the quantification methods of groundwater recharge in Sponge City construction and introduced the basic principles and application conditions of each method. Jin et al. (2021) [20] stated that the urban aquifers should be involved in the Sponge City approach and proposed hydrogeological criteria to improve the strategy. Sun et al. (2020) [25] discussed the influences of Sponge City construction on spring discharge in Jinan City of China, and the result indicated that the extent of spring discharge recovery was not evident in a short time frame based on a numerical model of groundwater flow.
However, compared with many pieces of research of Sponge Cities’ effect on control runoff and mitigation of flooding [26,27,28,29,30], less is known regarding their effects on aquifer recharge. Based on a case of Sponge City in North China, the flood control and aquifer recharge effects were analyzed, and positive effects were expected under the scientific designed Sponge City schemes.
2. Materials and Methods
2.1. Study Area
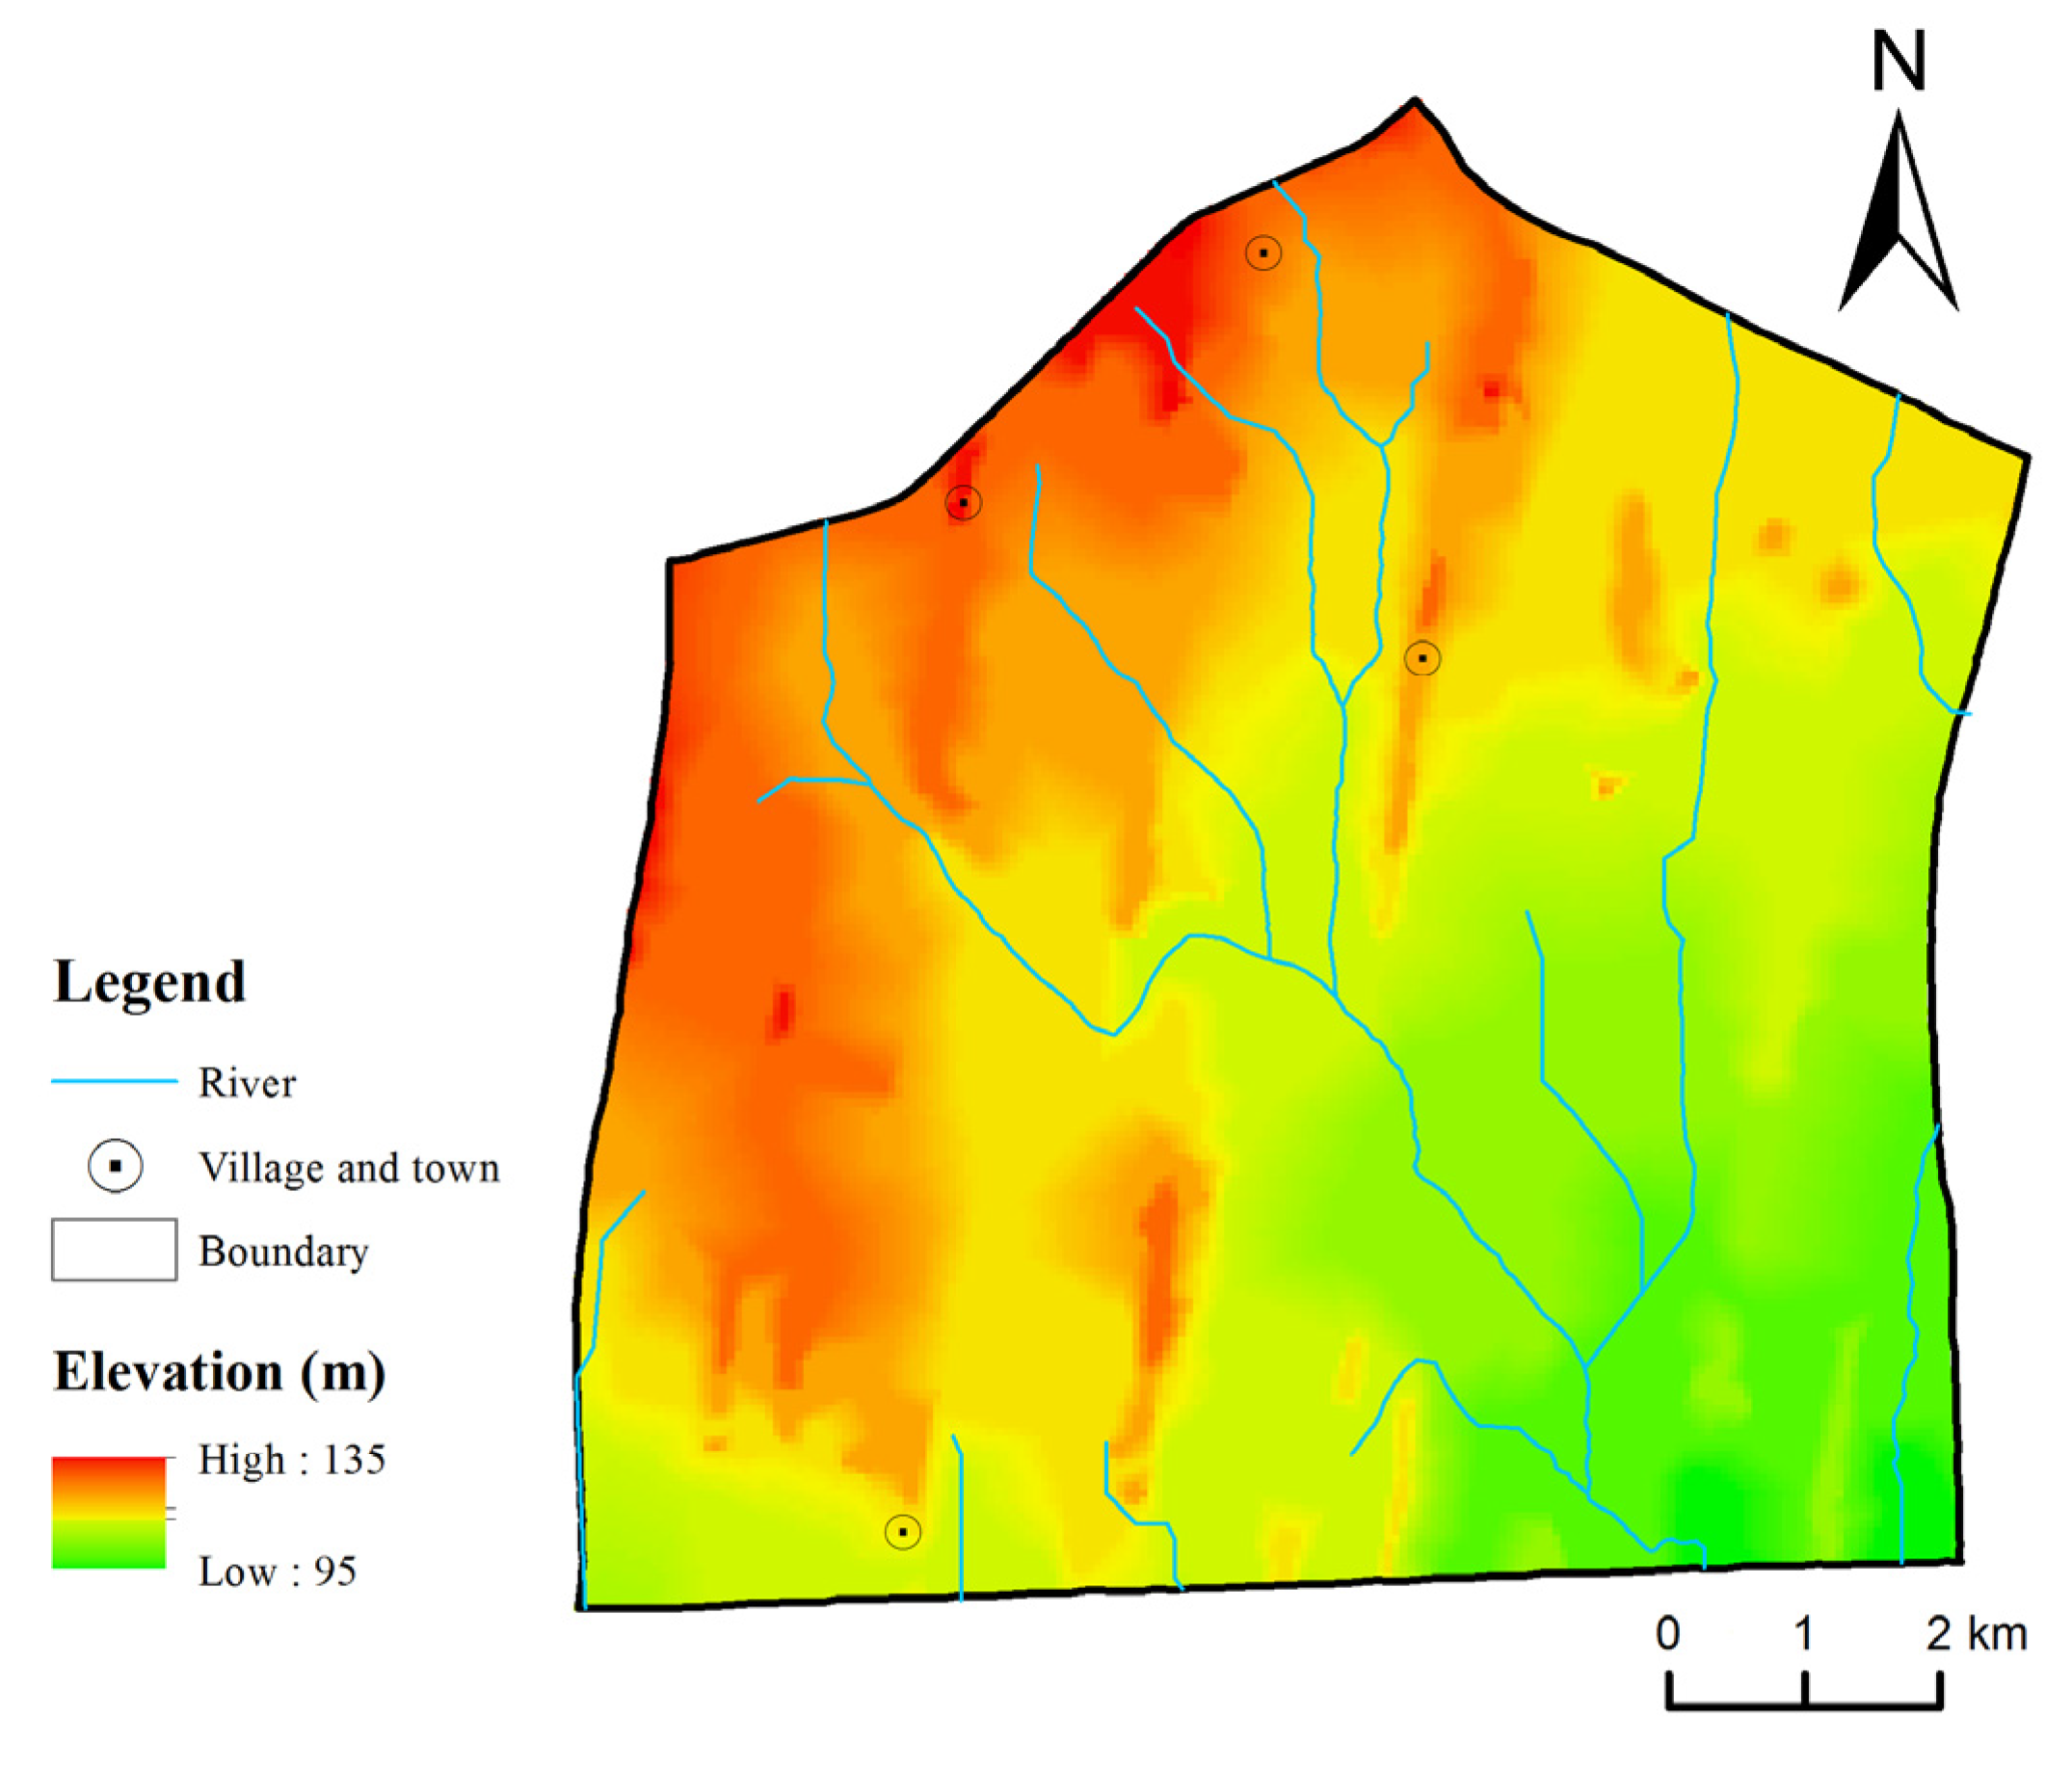
The study area is a planning urban construction area in Zhengzhou City, the capital of Henan Province in North China, with a total area of 91 km2. The study area has a warm and semi-arid climate, with obvious continental monsoon climate characteristics. The average annual precipitation is 631.76 mm, and the annual precipitation is mostly concentrated between July and September.
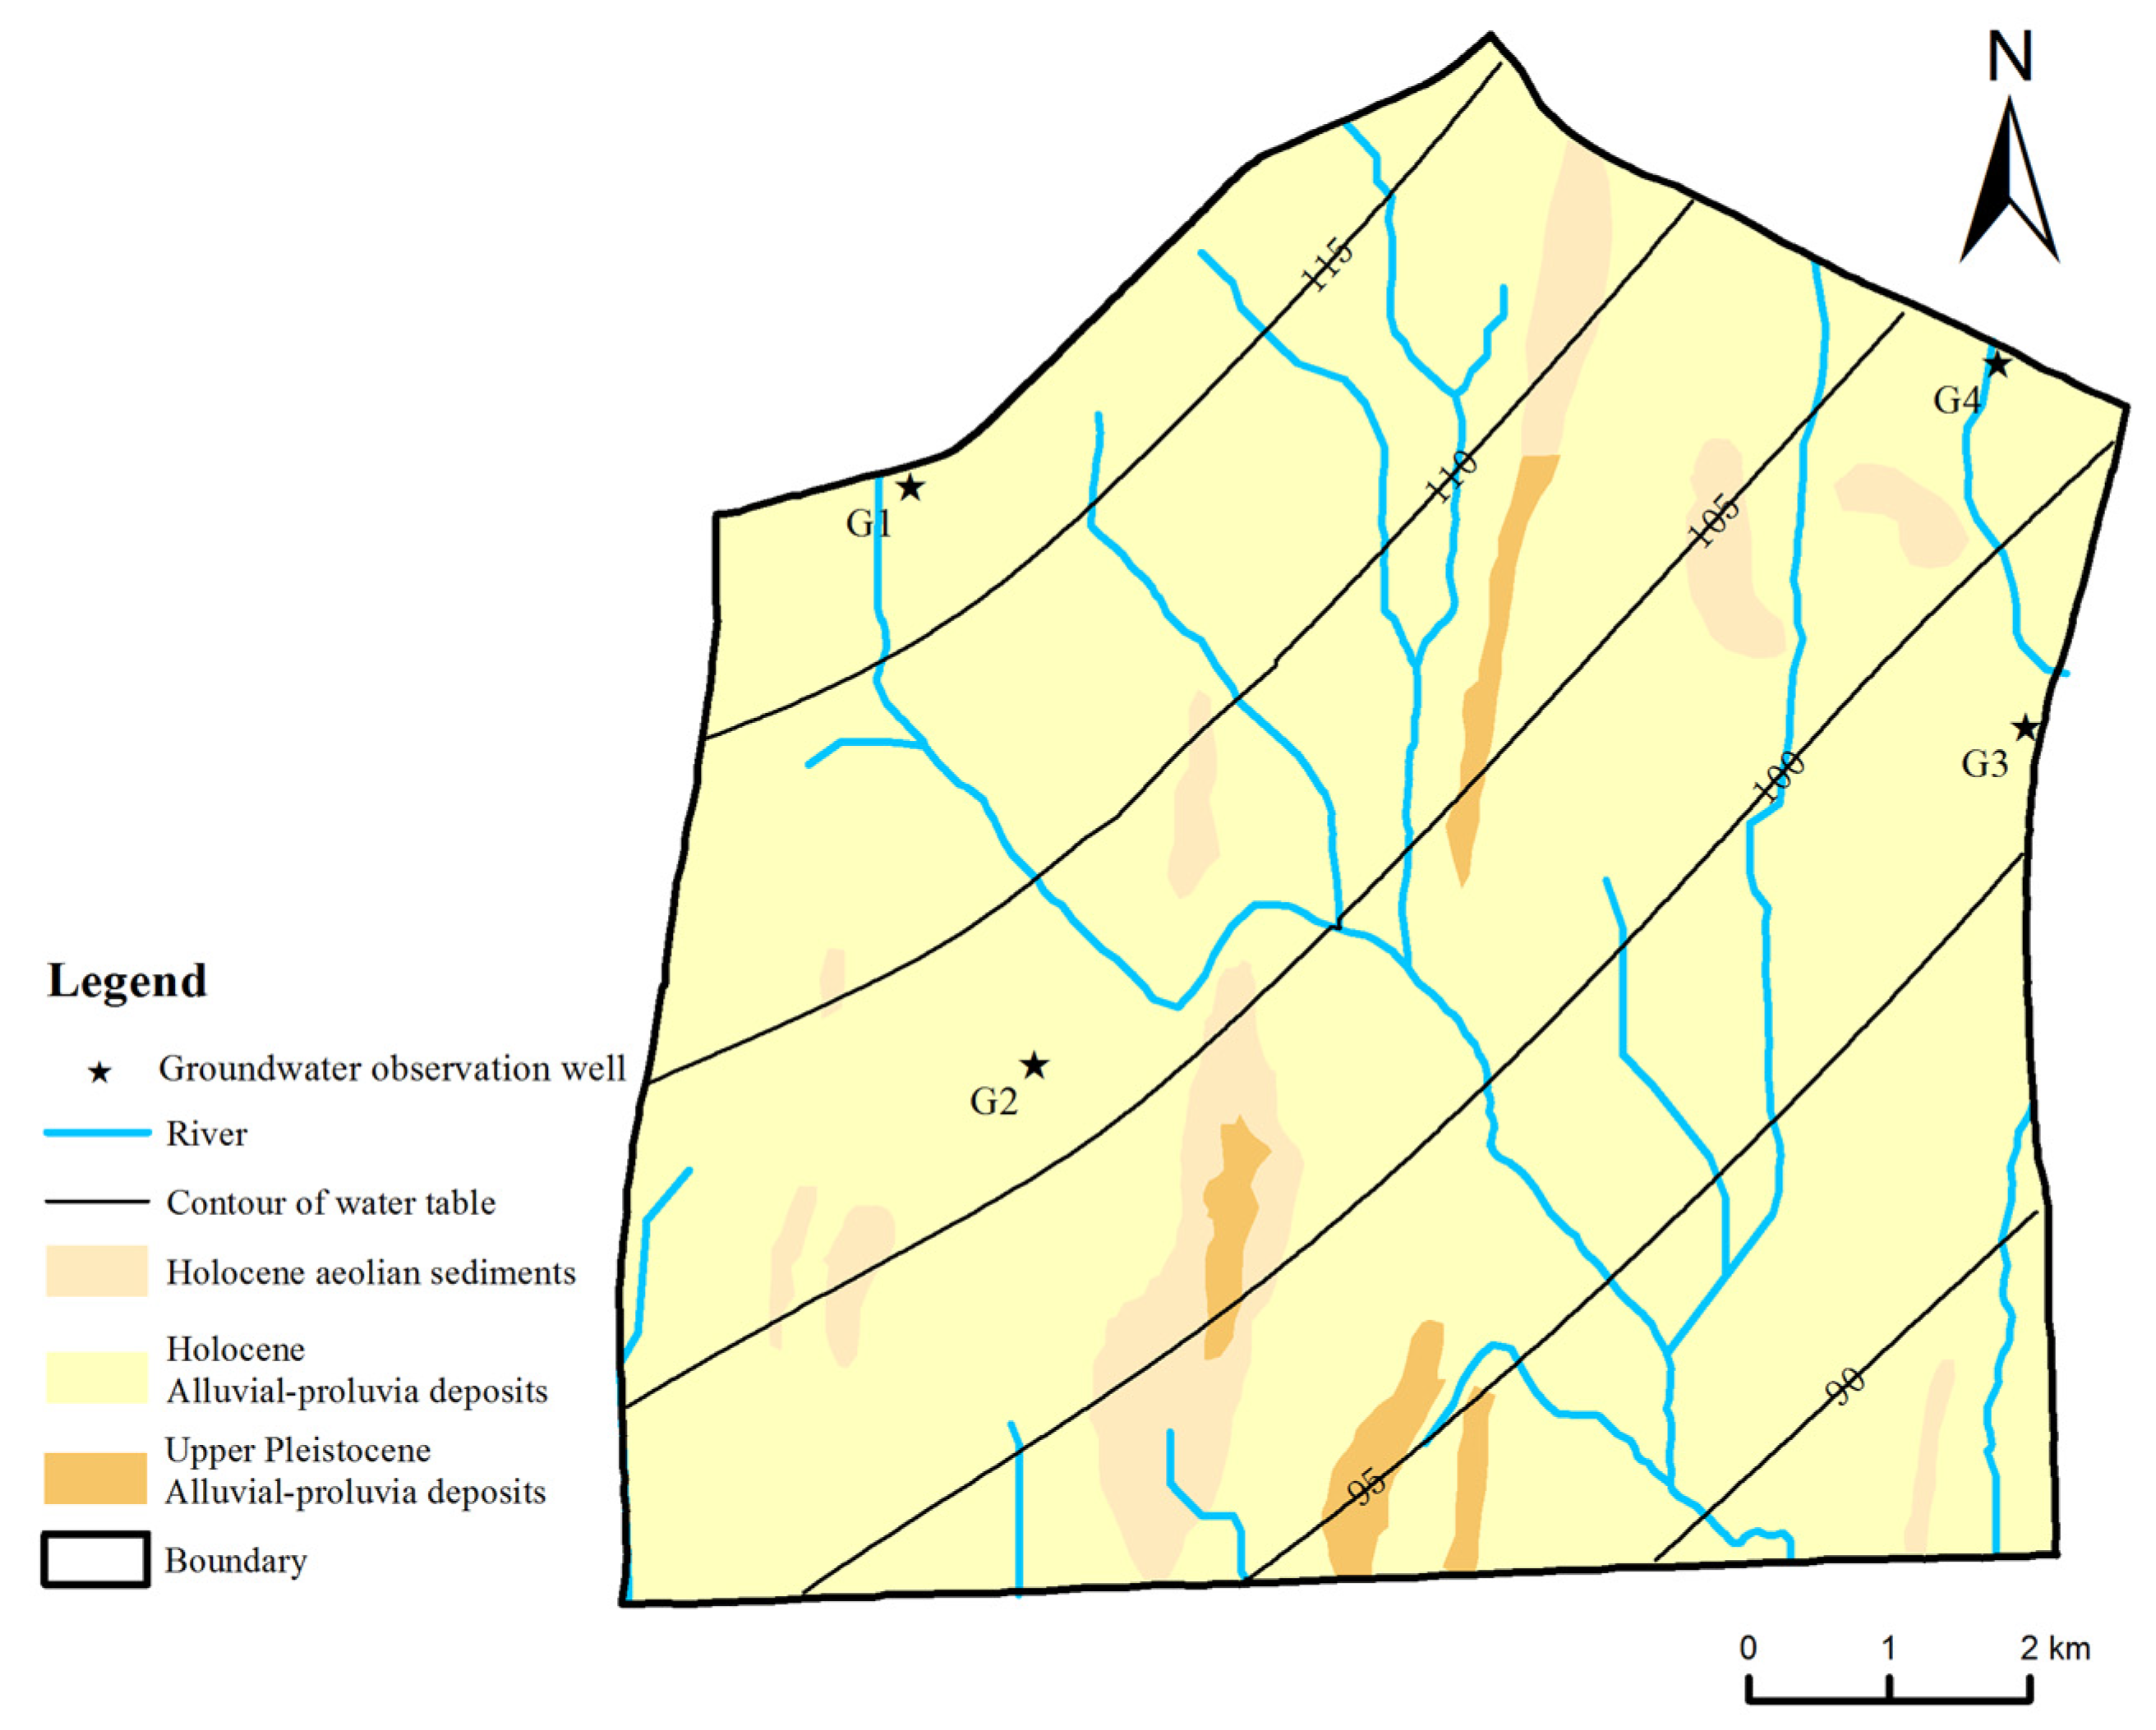
The study area belongs to the piedmont alluvial–proluvial plain (Figure 1). Since the Cenozoic era, Neogene and Quaternary strata have been successively deposited in the study area, with a thickness of more than 800 m. The surface of the study area is widely covered with Holocene light-yellow silt with a sedimentary thickness of 2.1~26.0 m (Figure 2). The aquifer is mainly composed of Quaternary Holocene, Upper Pleistocene, and Middle Pleistocene alluvium. The lithology is mainly fine sand and fine silty sand, and the groundwater type is phreatic water and weakly confined water. The groundwater depth in the area is generally more than 5 m, and groundwater evaporation is weak. The rivers in the region are seasonal tributaries with low flow and low permeability of river bed. Thus, the natural recharge of rivers to groundwater is little, which has very weak influence on the groundwater flow field in most of a year (Figure 2).
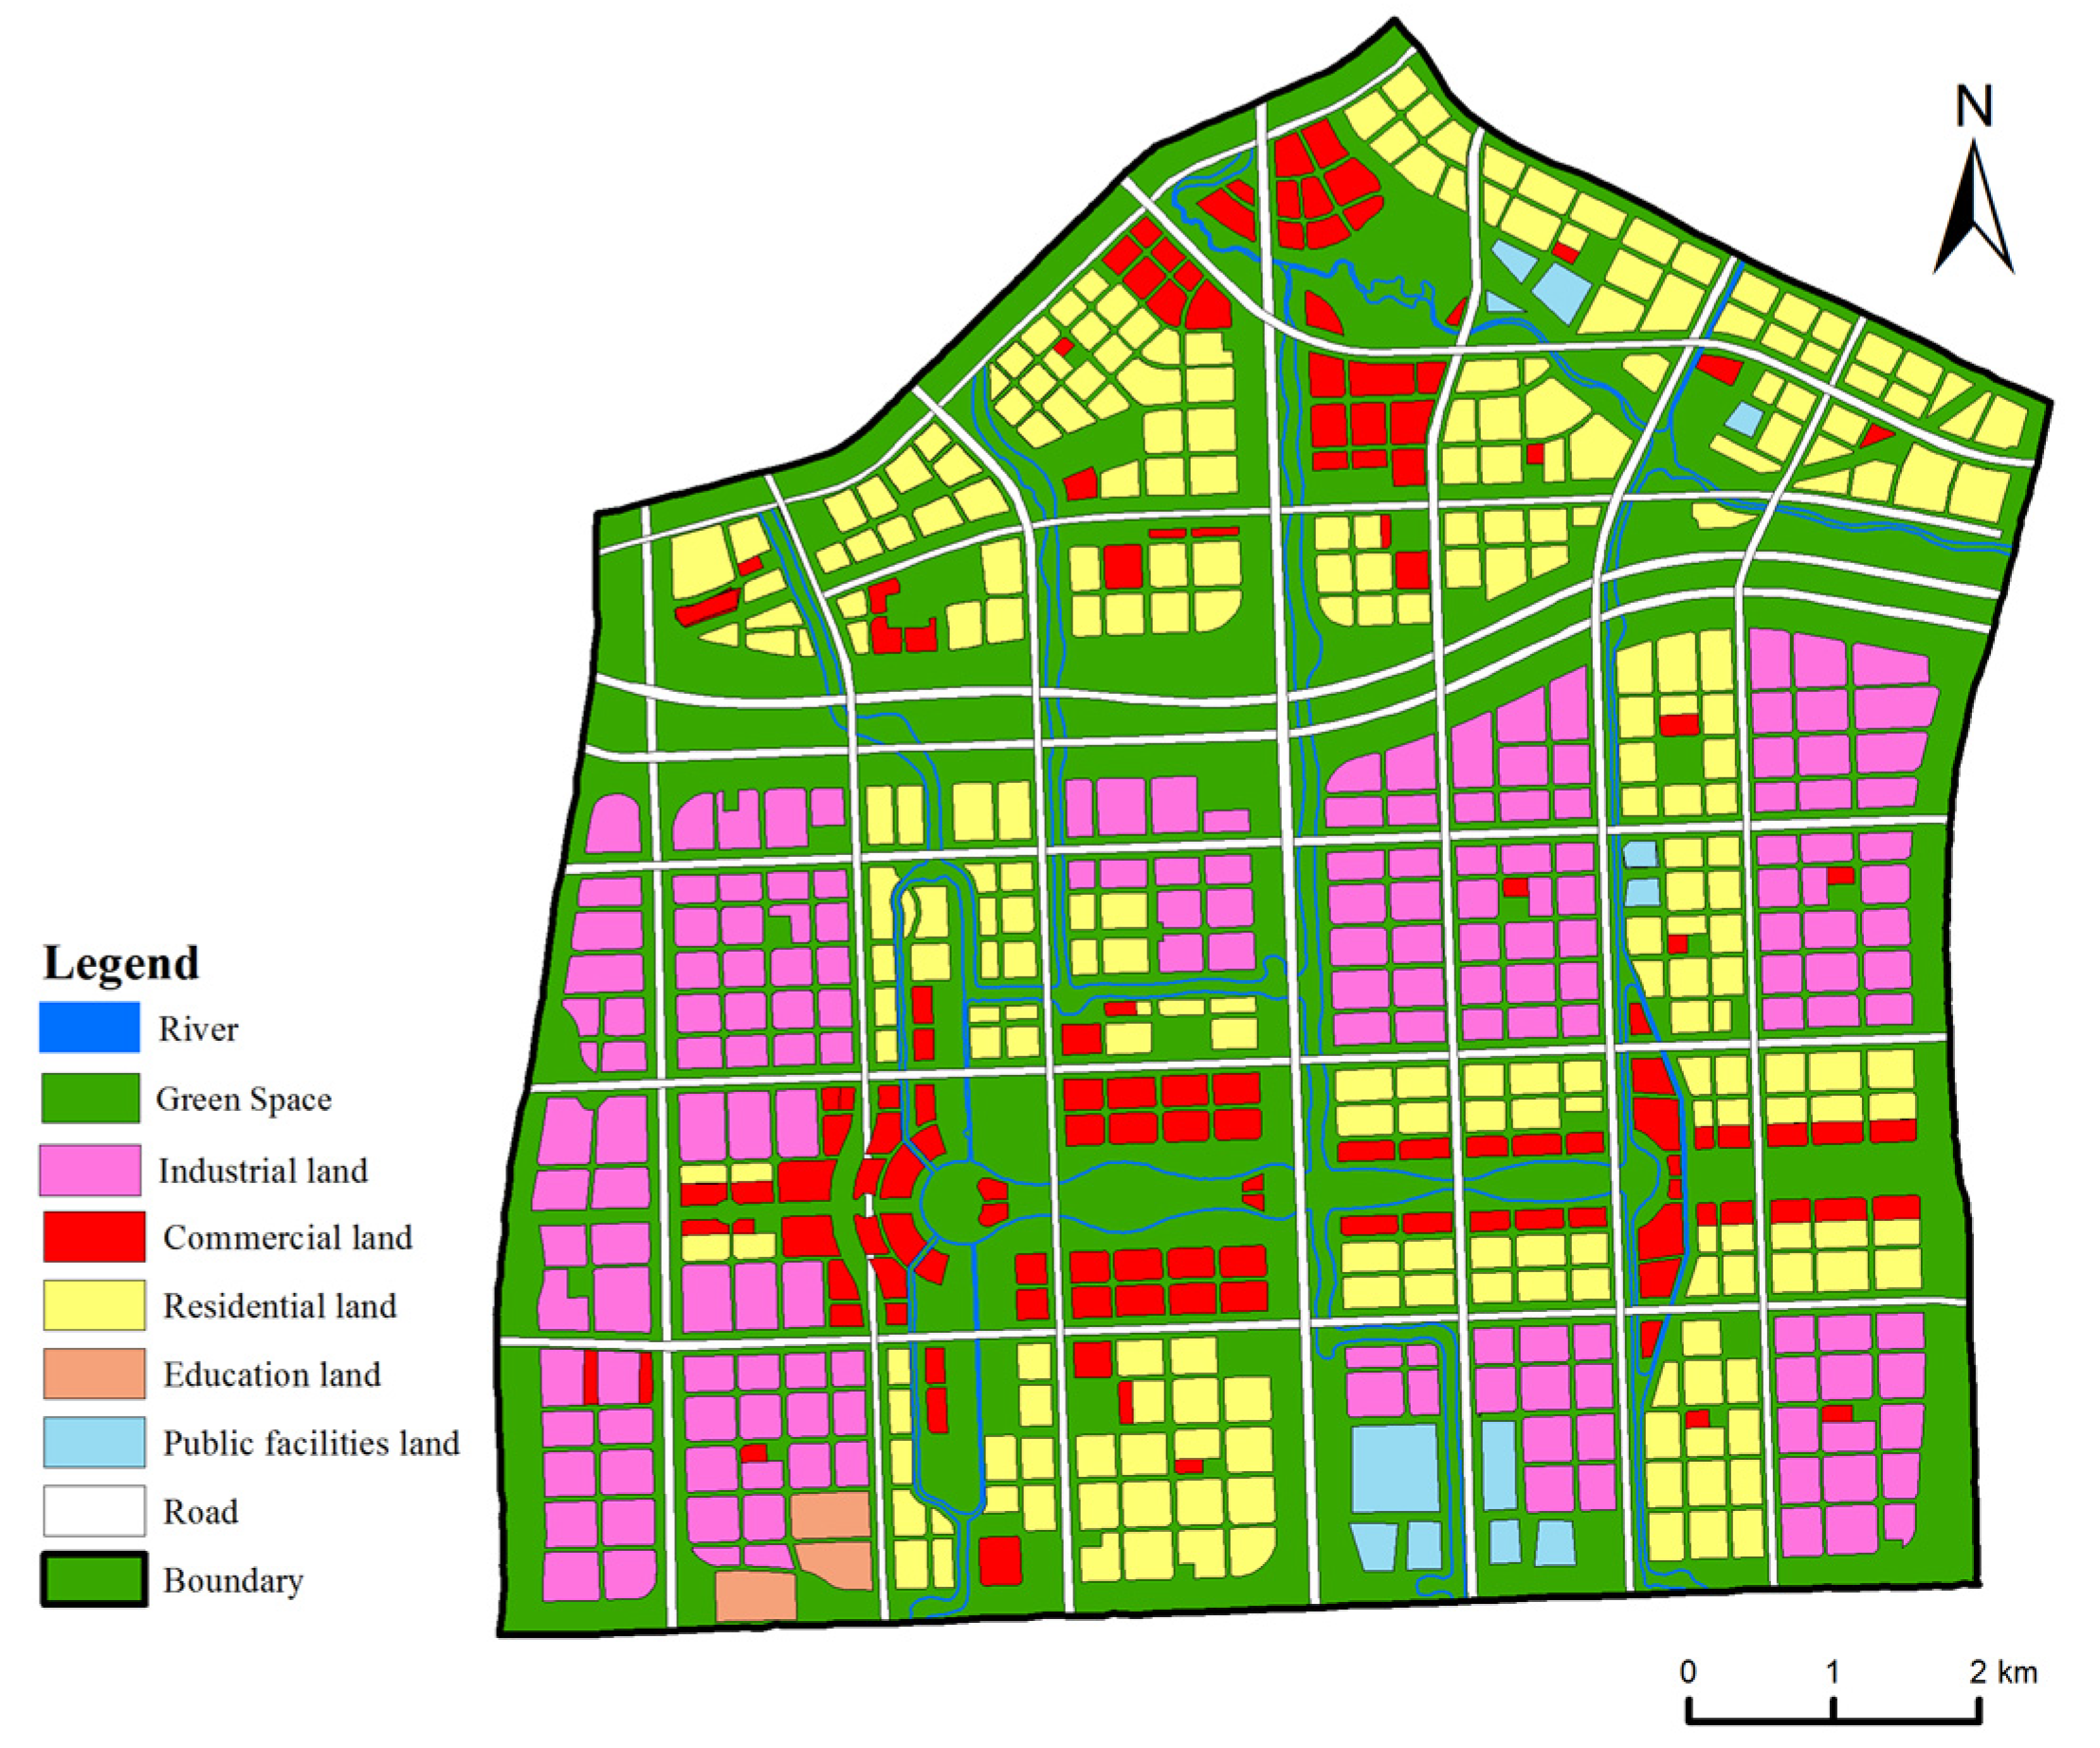
An advanced manufacturing district is planned in the study area, and the land-use types under the original planning scenario are shown in Figure 3. The design stormwater intensity was synthesized using the local rainstorm intensity formula (Equation (1)) [31]:
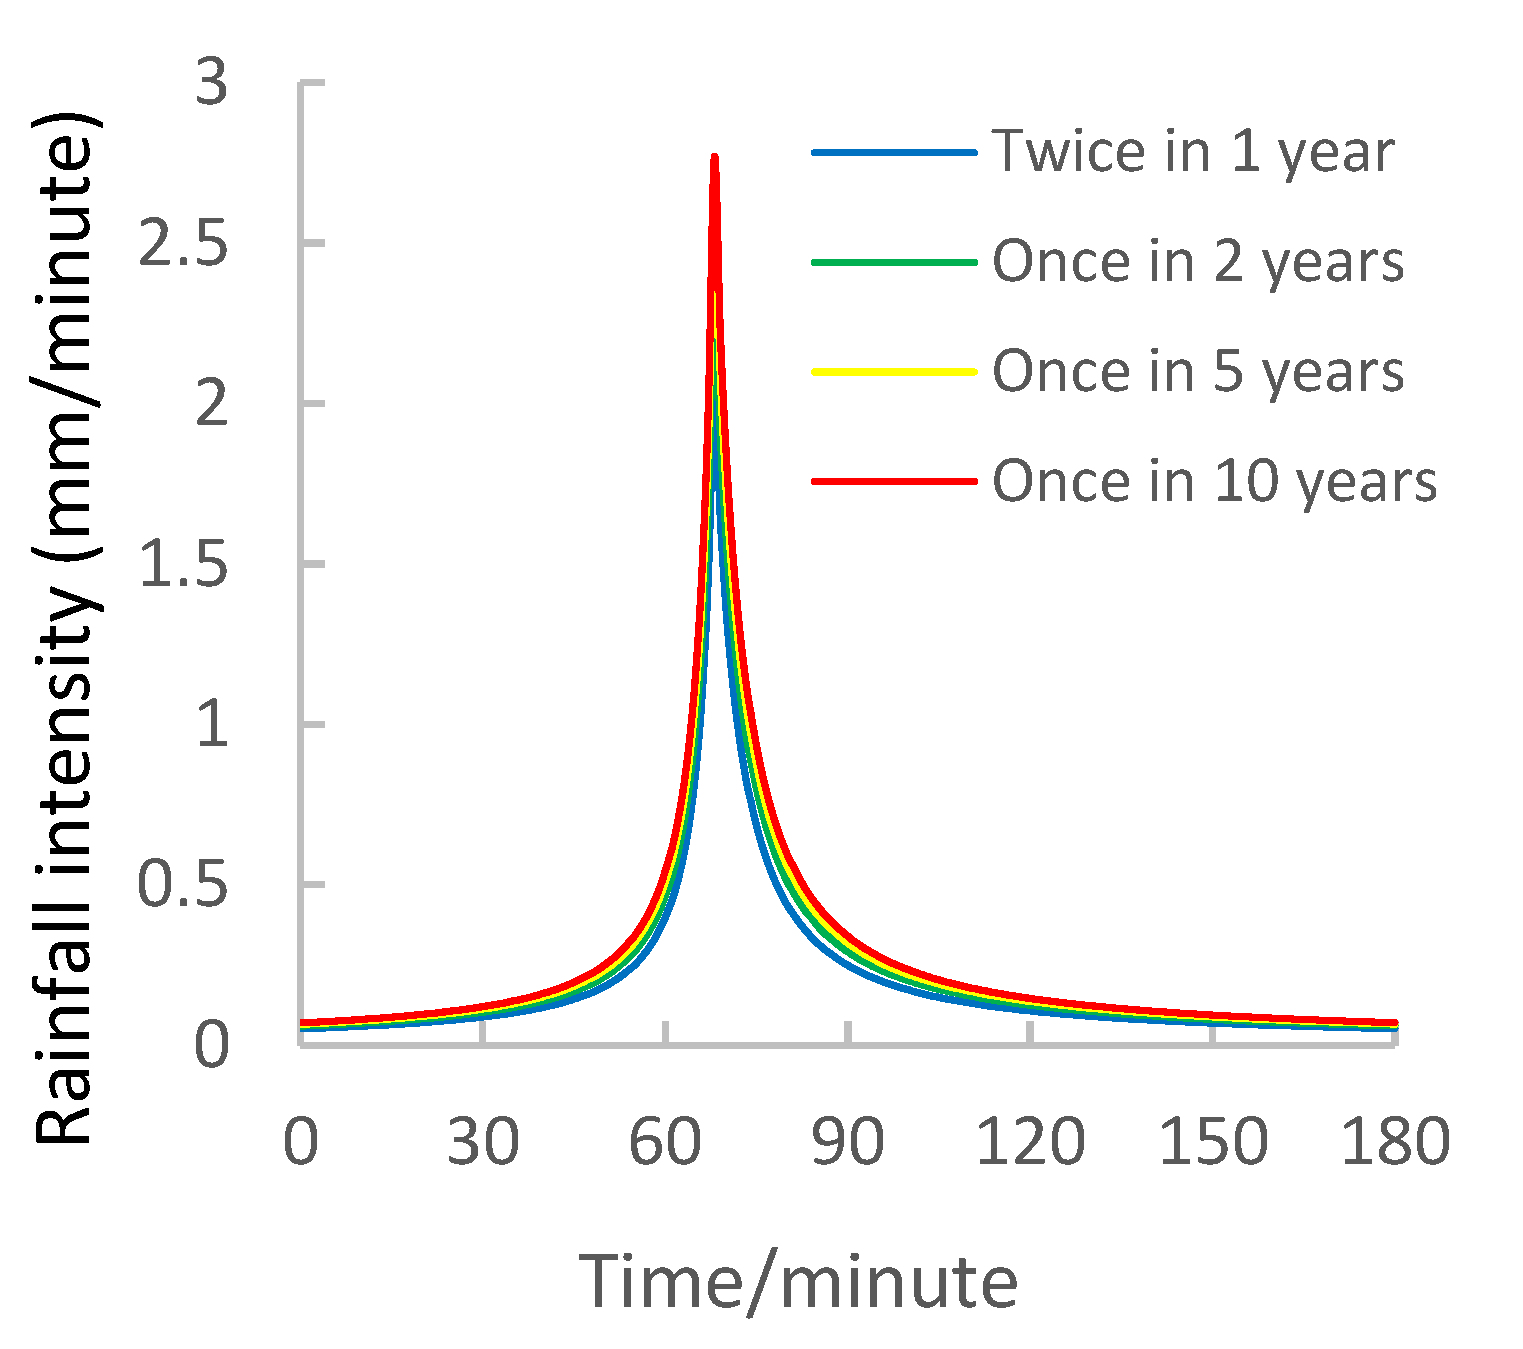
where q represents rainfall intensity (L/(s·ha)), P represents the return period (year), and t represents rainfall duration (minute). Since the Chicago storm profile can be easily adapted to China [32], it was used to develop design rainfall hyetographs for this study. Four rainfall return periods of 0.5, 2, 5, and 10 years were selected, and the rainfall lasted for 3 h. The single rainfall is 37.286, 43.531, 47.659, and 50.784 mm under 0.5-, 2-, 5-, and 10-year return periods, respectively (Figure 4).
2.2. Methods
To compare the flood-control and aquifer-recharge effects of Sponge City and the traditional city development, the Sponge City design scheme was firstly proposed by using the following principles: based on urban construction planning, retain the natural river network, plan LID facilities based on geological and hydrogeological conditions, and minimize the use of gray urban drainage system. This is a coupled Sponge City idea with natural and artificial elements to solve urban stormwater management.
2.2.1. SWMM
The Storm Water Management Model (SWMM) is a widely adopted dynamic hydrologic and hydraulic model often used to estimate runoff quantity and quality in urban drainage systems [33,34]. SWMM was adopted to simulate urban stormwater processes in study area under the present, the original planning, and the Sponge City design scenarios.
The natural catchment area divided by ArcGIS software (Version10.2) is used as the model sub-catchment area, the natural river channel is used as the drainage pipeline, and the drainage nodes are arranged on the river channels. The impermeability rate of each sub-catchment area was calculated (Equation (2)). Under the present scenario, the impermeability rate of sub-catchments is between 5% and 20%, and the average impermeability rate of the study area is 10.3%. Under the planning scenario, the maximum impermeability rate of the sub-catchment is 90%, the minimum is 10%, and the average is 56.54%. Under the design scenario, the land use of each sub-catchment area is based on the planning conditions; the maximum impermeability rate of sub-catchment is 81%, the minimum is 10%, and the average is 56.38%. The infiltration process is simulated by Horton model, the surface runoff is calculated by Manning’s formula, and the hydraulic model of discharge routing of drainage system adopts kinematic wave model. The related main hydrological parameters are set with the reference value ranges and the actual conditions (Table 1) [35]:
where represents the impermeability rate of the sub-catchment area; represents the area of land-use type in the sub-catchment area; is the impermeability rate corresponding to the land-use type; and is the total area of the sub-catchment area.
Parameter calibration method for urban rainfall-runoff model based on runoff coefficient is used to complete the calibration and verification of the model [36]. Taking the runoff coefficient as the objective function of model parameter calibration, compare the values of urban empirical comprehensive runoff coefficient and the runoff coefficient calculated by simulation (Table 2), the parameters are calibrated by using the design rainfall process with a return period of two years, and verified by using the design rainstorm process with a return period of ten years.
2.2.2. MODFlow
The groundwater flow model of the study area using Visual MODFLOW is established to evaluate the recharge effect of the Sponge City scheme on the groundwater resources.
The groundwater numerical model domain is consistent with the study area, with a total area of 91 km2. According to the hydrogeological conditions, the aquifer is divided into two layers; the 1st layer is a shallow unconfined aquifer with a thickness of 80~100 m, and the 2nd layer is a deep, confined aquifer with a thickness of about 220 m. The lithology of aquifers is mainly interbedded by fine sand, silty sand, and silty clay. The aquifers are generalized as heterogeneous and isotropy, and the hydraulic conductivity and specific yield of the 1st layer are 0.6 m/day and 0.05, respectively; the hydraulic conductivity and specific storage of the 2nd layer are 0.3 m/d and 1 × 10⁻⁵/m. There is a certain amount of water exchange inside and outside the boundary of the study area, which is generalized as the general head boundary. The groundwater is mainly recharged by precipitation. The bottom of confined water aquifer is the lower boundary of the model and generalized as no-flow boundary. The characteristics of groundwater movement are generalized as three-dimensional transient flow in accordance with Darcy’s law. According to the existing groundwater level data, the model calibration period is from 5 July 2014, to 5 January 2015, and the verification period is from 5 February 2015, to 5 June 2015.
3. Results
3.1. Sponge City Design Scheme
The Sponge City comprised three parts of the natural hydrographic network, LID facilities, and a drainage system. This scheme aims to maximize the function of the natural hydrographic network and minimize the use of the gray urban drainage system.
3.1.1. Natural Hydrographic Network Design
- River
In actual urban construction, because of the overall design of the city, the original river course is often changed or straightened. Its drainage effect and safety are far less than the natural river channel formed by the natural evolution of rainwater runoff. Based on the DEM (Digital levation Model) data generated through ArcGIS, the depression filling, flow direction analysis, and flow calculation were carried out. Then, according to the accumulated water volume of each grid, the river network is divided into four grades: IV—main stream with large flow, III—main stream, II—primary tributary, and I—secondary tributary. River Sections I-5, I-8, and I-13 need to accept the water quantity outside the study area. I-12 and I-13 are connected outside the area. I-1, II-5, I-7, and I-8 are not designed as river channels but are still reserved as drainage ditches because of the small river flow of the original water system. The main stream III-1 is divided into three catchment areas (upper, middle, and lower) due to its long length. The final designed river channels and their catchment areas are shown in Figure 5.
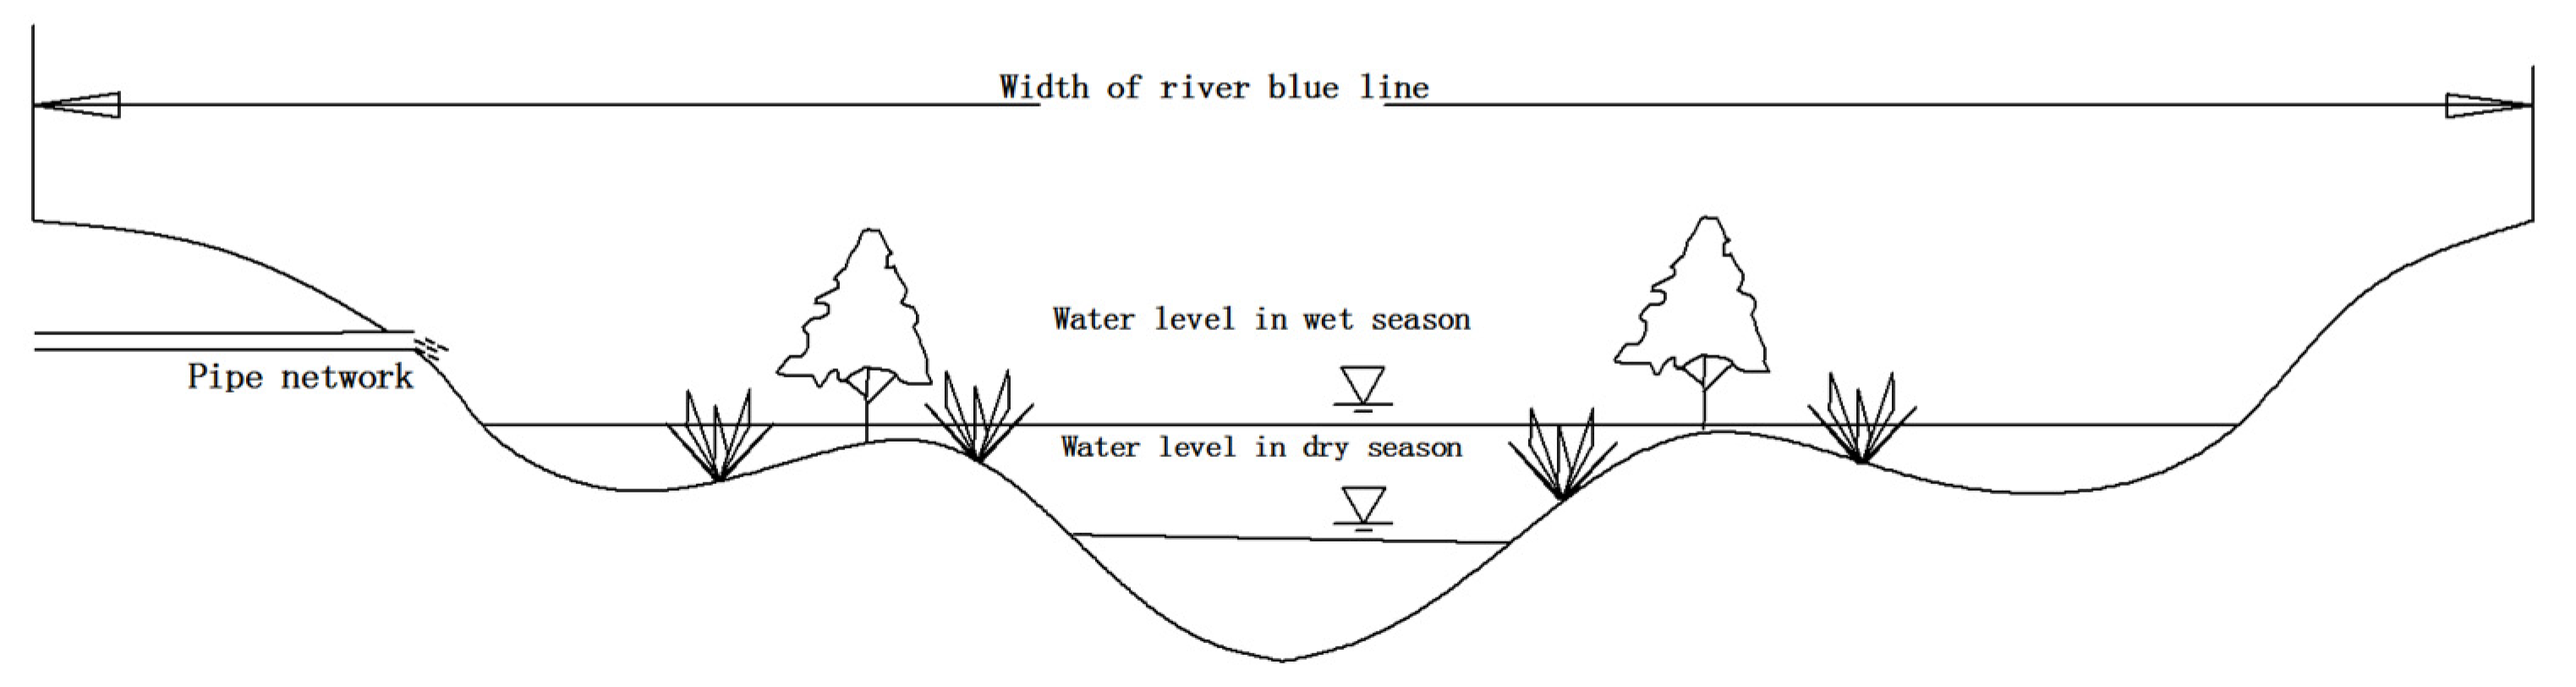
The blue line of the river is the boundary of the protection scope of river engineering areas, which include rivers, sandbars, beaches, and areas reserved for river widening, regulation, ecological landscape, greening, and other purposes. The design width of the blue line is set to 60 m for the main stream, 50 m for the primary tributary, and 30 m for the secondary tributary (Figure 6, Table 3).
- Lake and water corridor
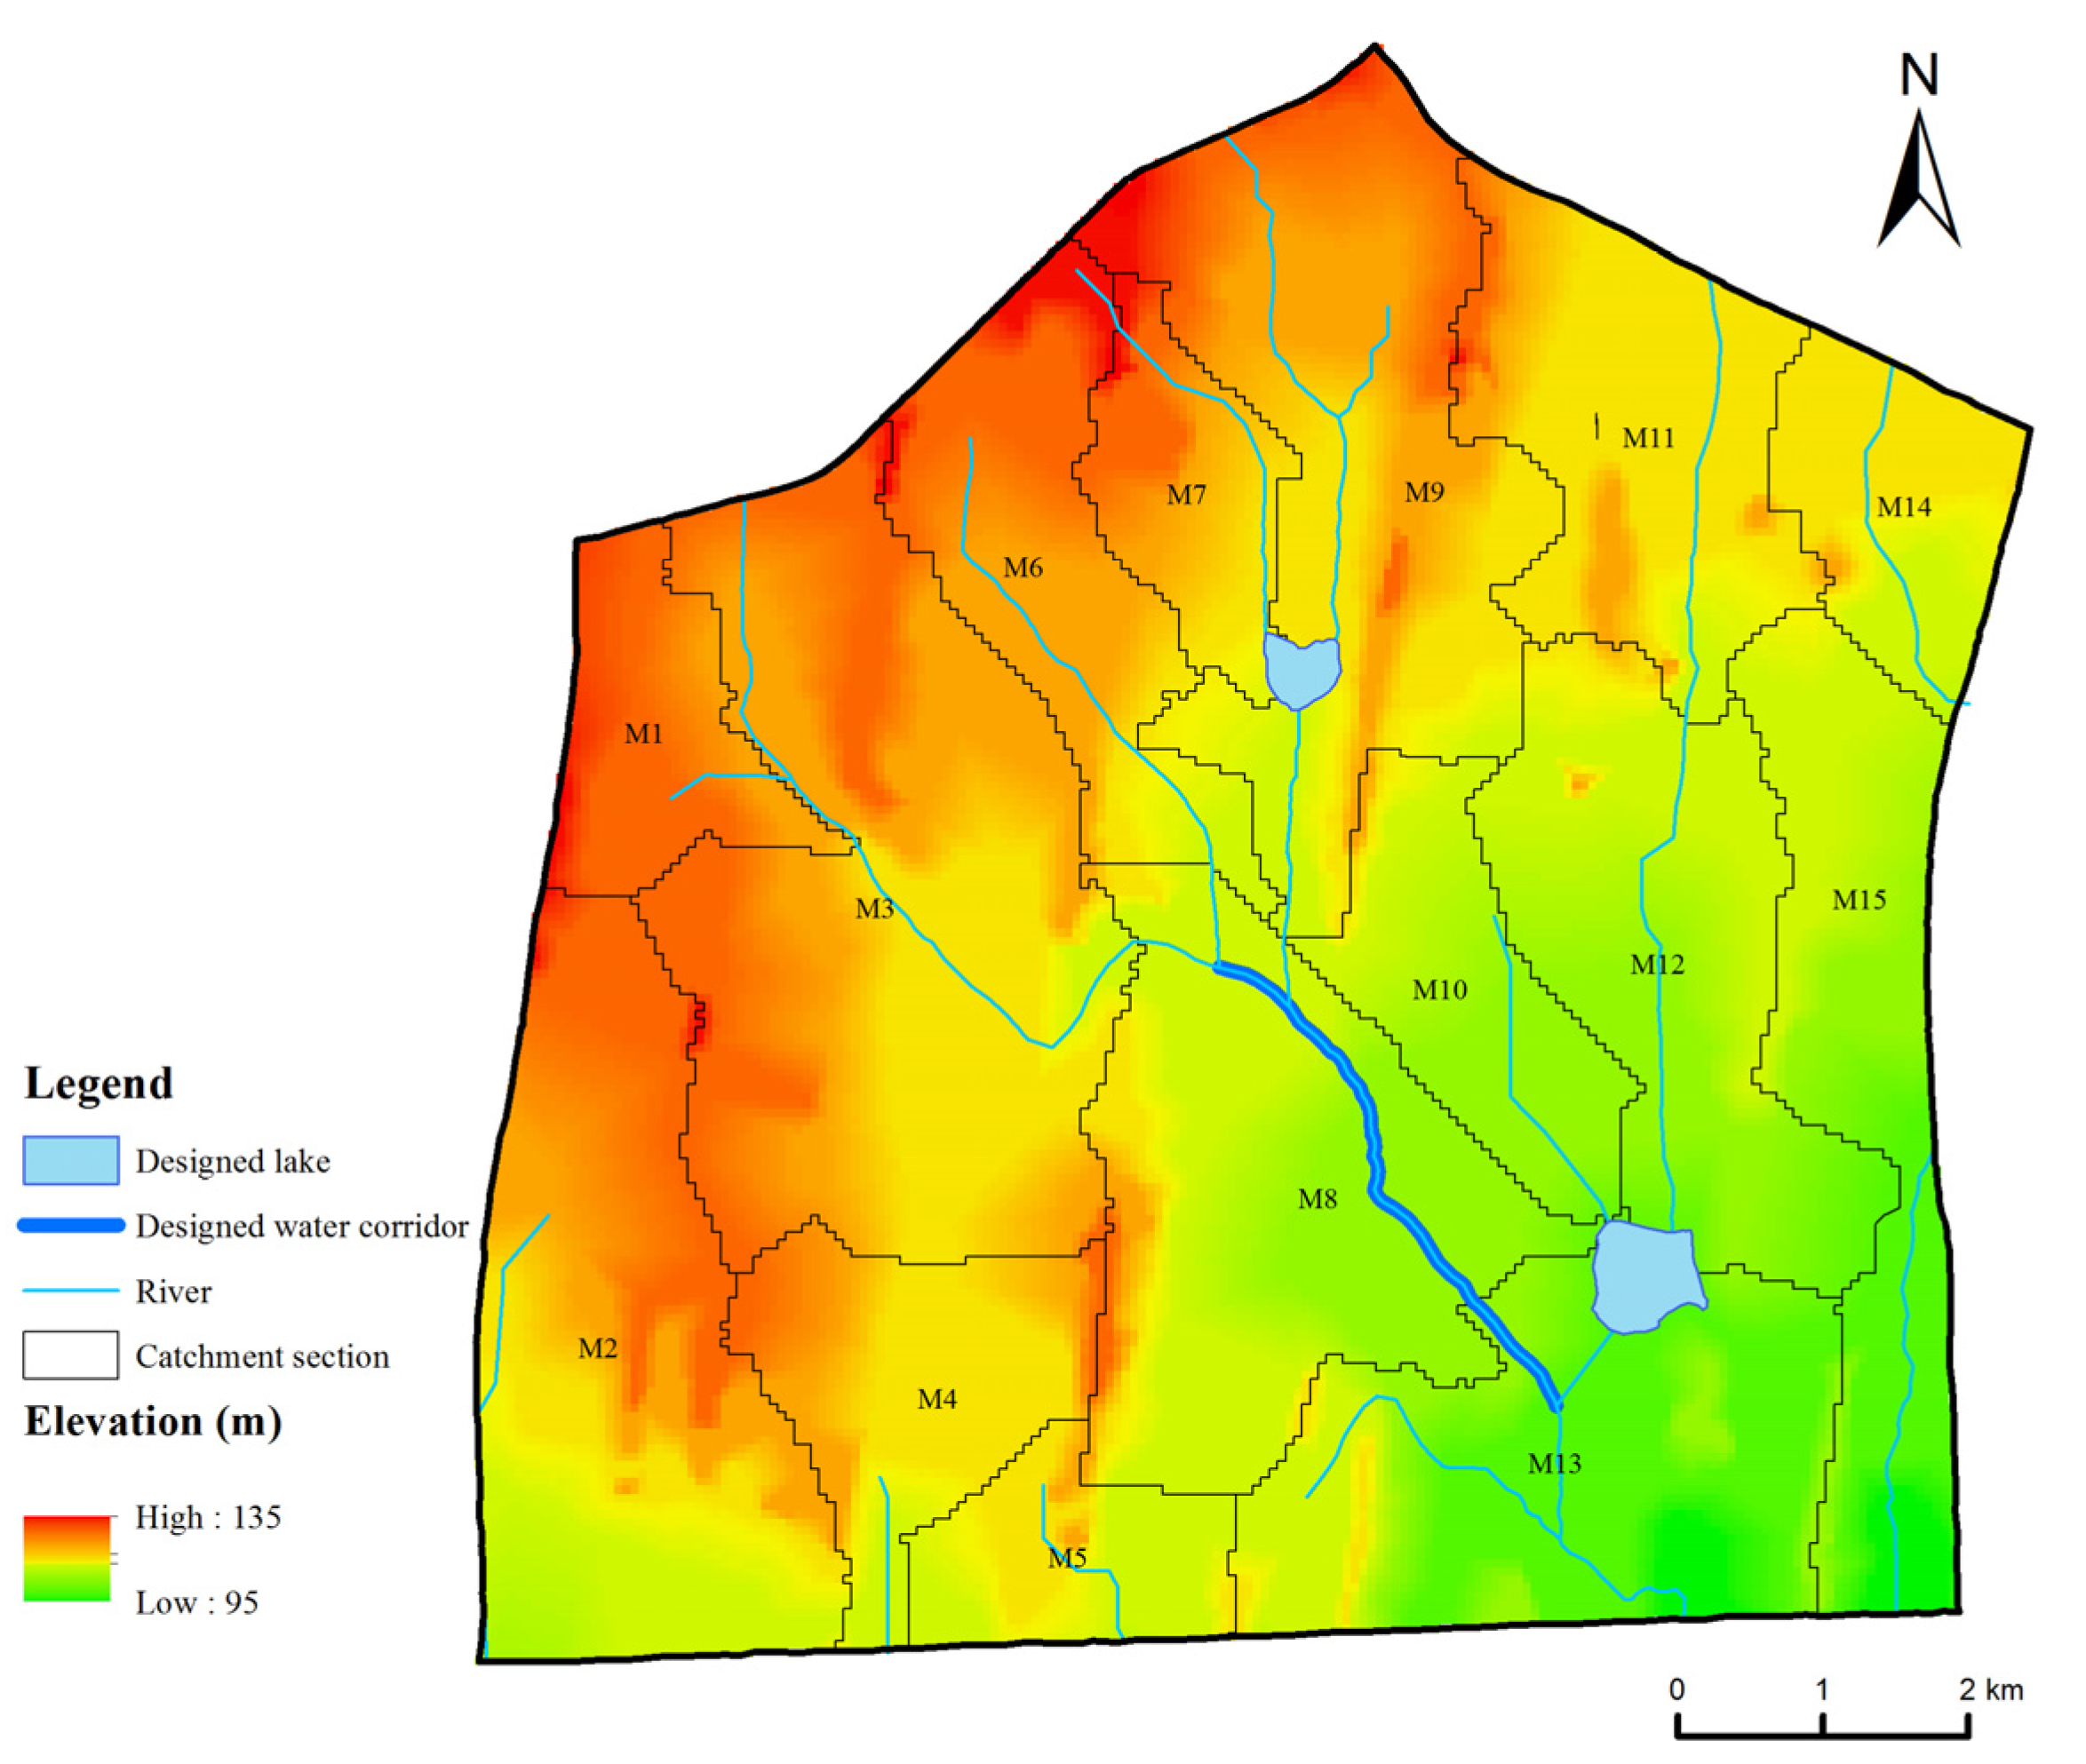
The construction of a small water reservoir has been proved to be an effective and significant measure in water management, especially for runoff control [38,39]. Considering the river network, the location where the tributary flows into the higher-grade river has larger runoff, which is the key point of runoff control. Meanwhile, III-1 is the main drainage channel of the entire area, with a large drainage pressure. Therefore, two small artificial lakes were set before the tributaries flowed into III-1, and the urban water corridor was set at the starting point where I-2 and II-2 flow into III-1. The locations of the lakes and water corridors are shown in Figure 7.
The areas of the two lakes are bounded by the topographic contour lines as 0.20 km2 and 0.46 km2. According to previous research, when the width of the water corridor is 80–100 m, the loss of sediment and the flood can be better controlled [40]. Combined with the existing design experience of a plain area [41], the average width of the designed water corridor is 90 m, the length is 4.0 km, and the area is 0.36 km2.
3.1.2. LID Facility Design
The selection of LID facilities is related with land use type, local terrain and topography, average annual rainfall, total annual rainfall volume control rate and urban development intensity, etc. [42]. Based on the geological and hydrogeological conditions of the study area, combined with land-use types, the water storage capacity of facilities required is calculated with the goal of controlling 70% of the 3-h rainfall once in five years.
The main LID facilities used are rainwater gardens, permeable pavement, and green roofs. The green roof is suitable for buildings with roof load, waterproof, the height less than 30m and roof slope less than 10°, and the buildings in the study area will be processed to meet the requirements of green roof construction. The scale of the facilities in each sub-region is shown in Table 4.
3.1.3. Drainage System Design
Part of the rainfall can be stored or infiltrated to recharge groundwater in time through surface water and LID facilities. However, there are still areas where the building density is too high, so it is difficult to build large-scale green rainwater storage and utilization facilities. It is still necessary to design an urban rainwater pipe network to ensure the discharge of rainwater runoff in these areas. The calculated rainfall flood volume of each area is less than 30% after treatment by LID facilities. However, to ensure the safety of urban drainage and improve the drainage capacity, the rainfall-control capacity of the rainwater network is 40% of the total rainfall.
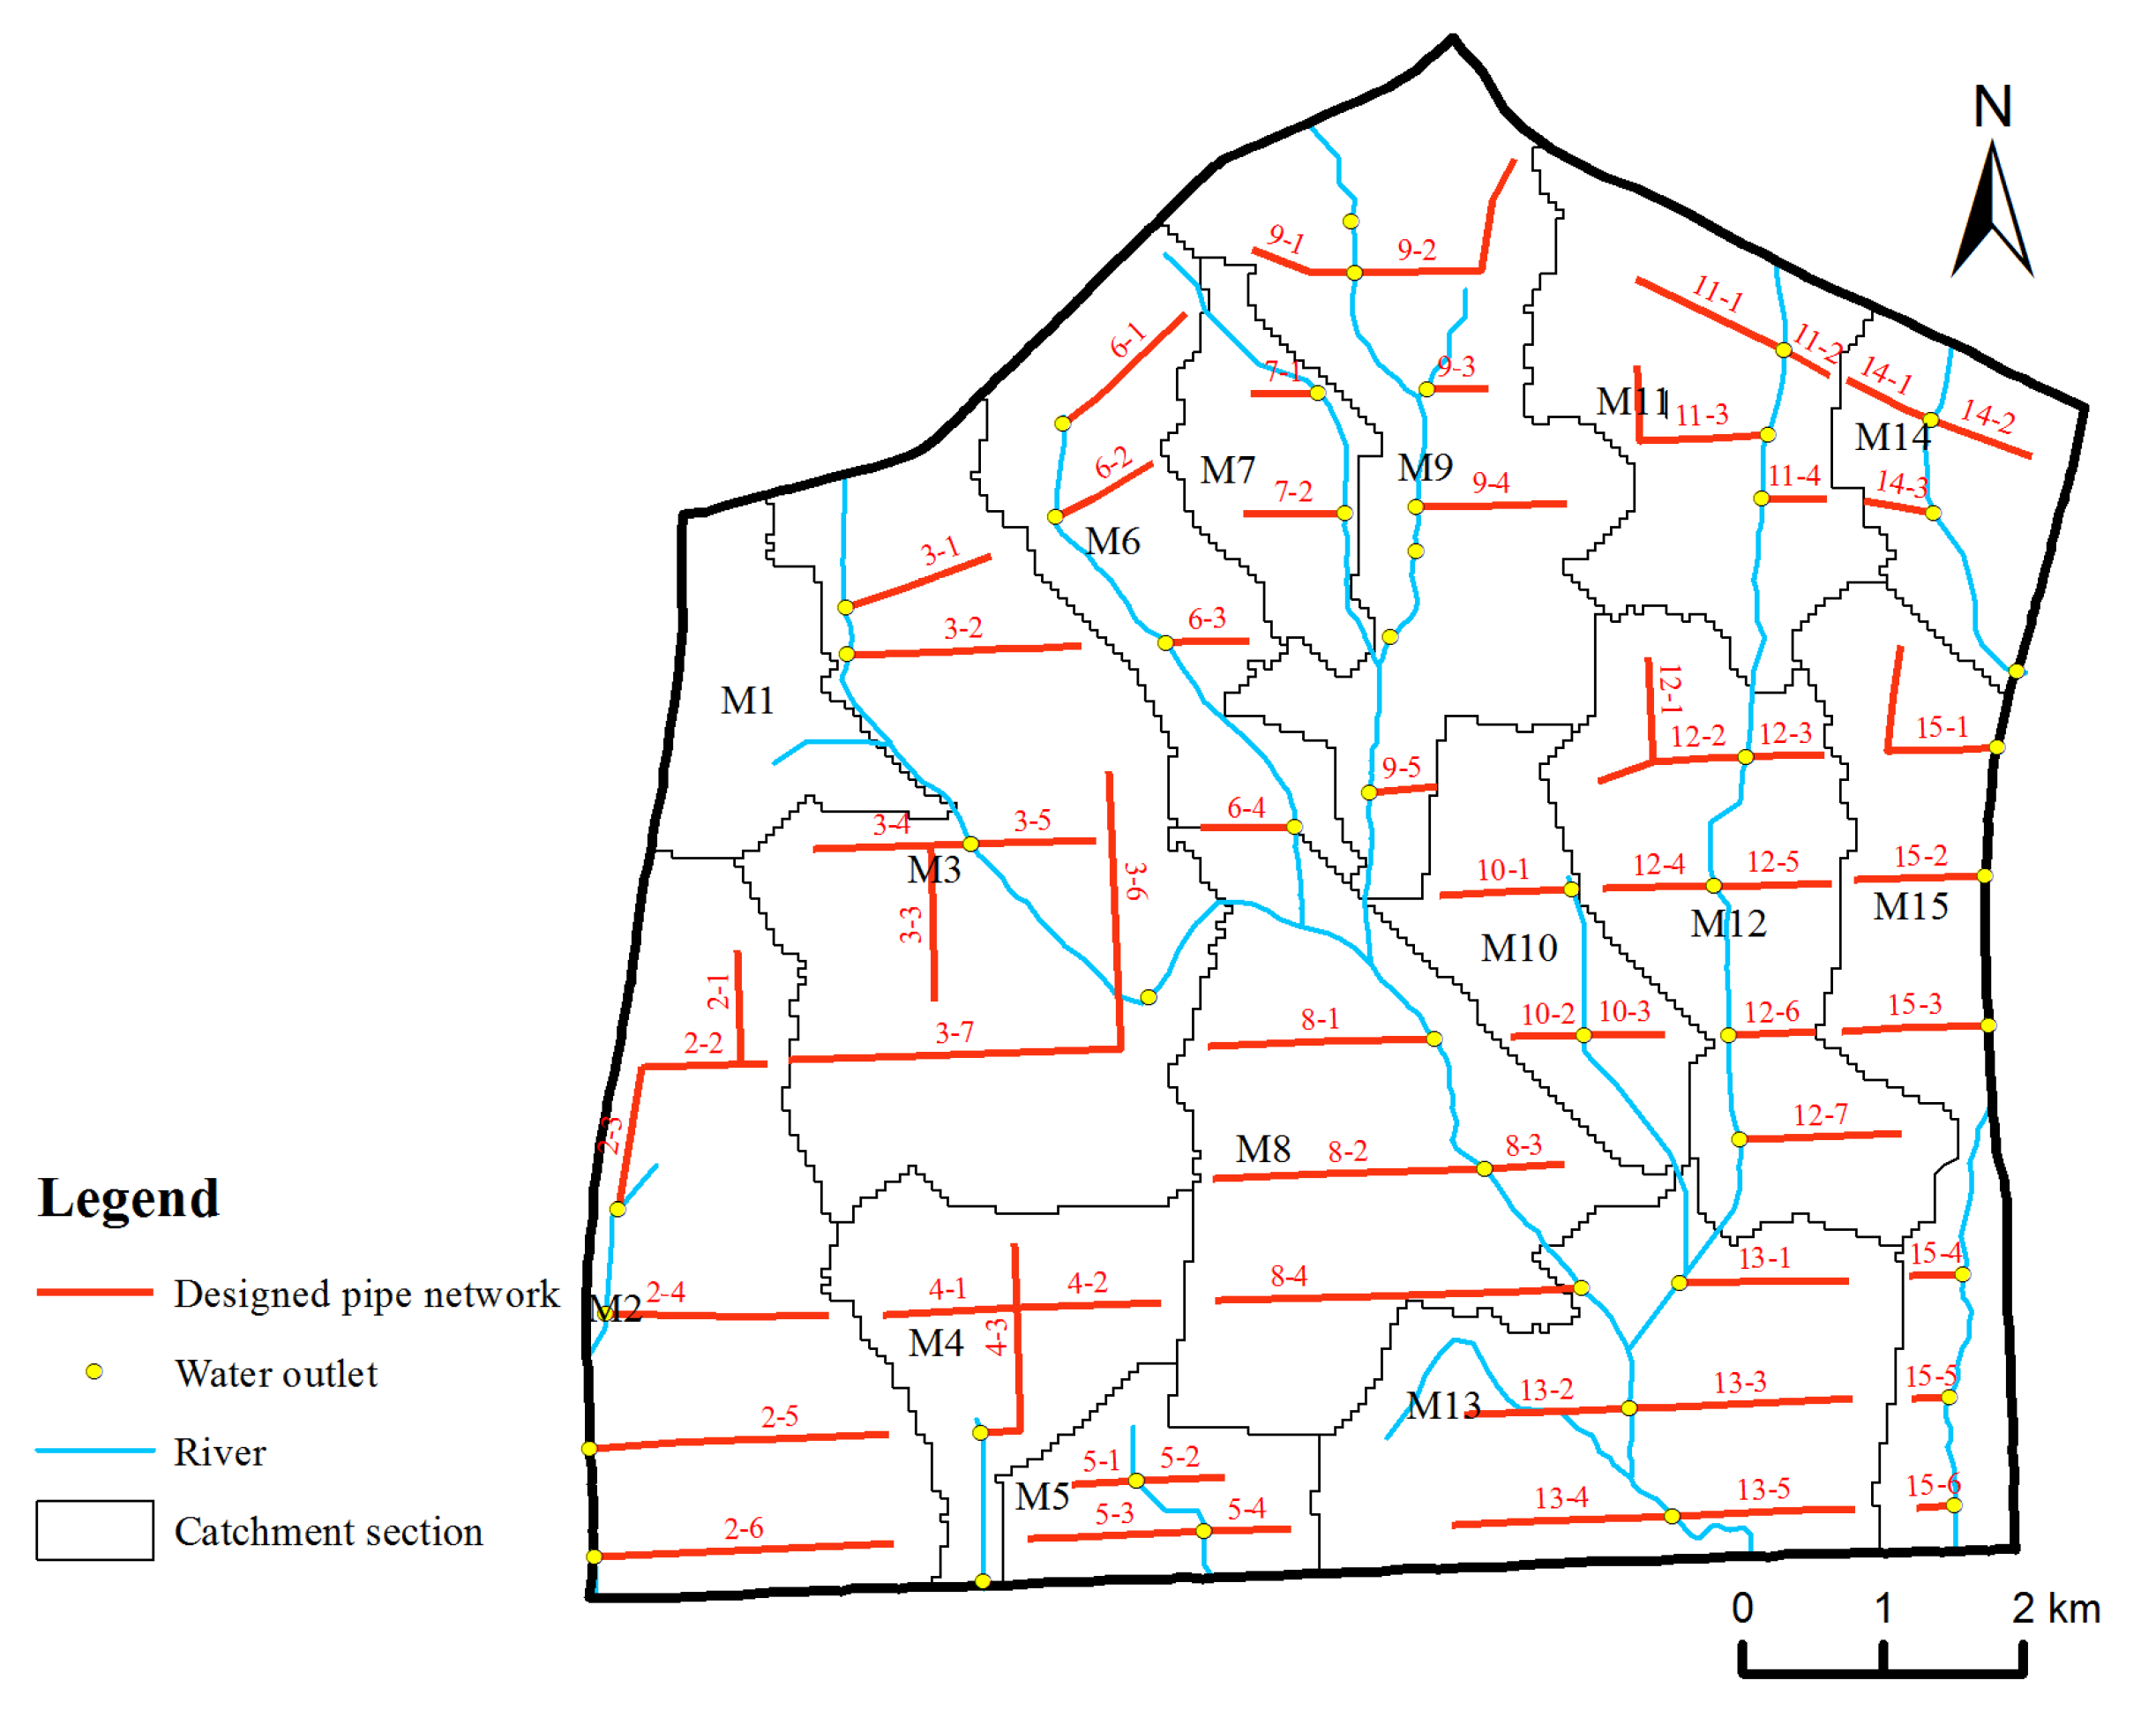
The catchment area of the river channel is the most suitable drainage area. The entire area is divided into 15 drainage areas, which are the same as the catchment areas. The layout of the rainwater pipe network is based on the urban road, combined with the location of the river channel, and arranged beside the main urban road. The rainwater in each area was discharged into the rivers through the drainage pipe network (Figure 8).
3.1.4. Sponge City Scheme
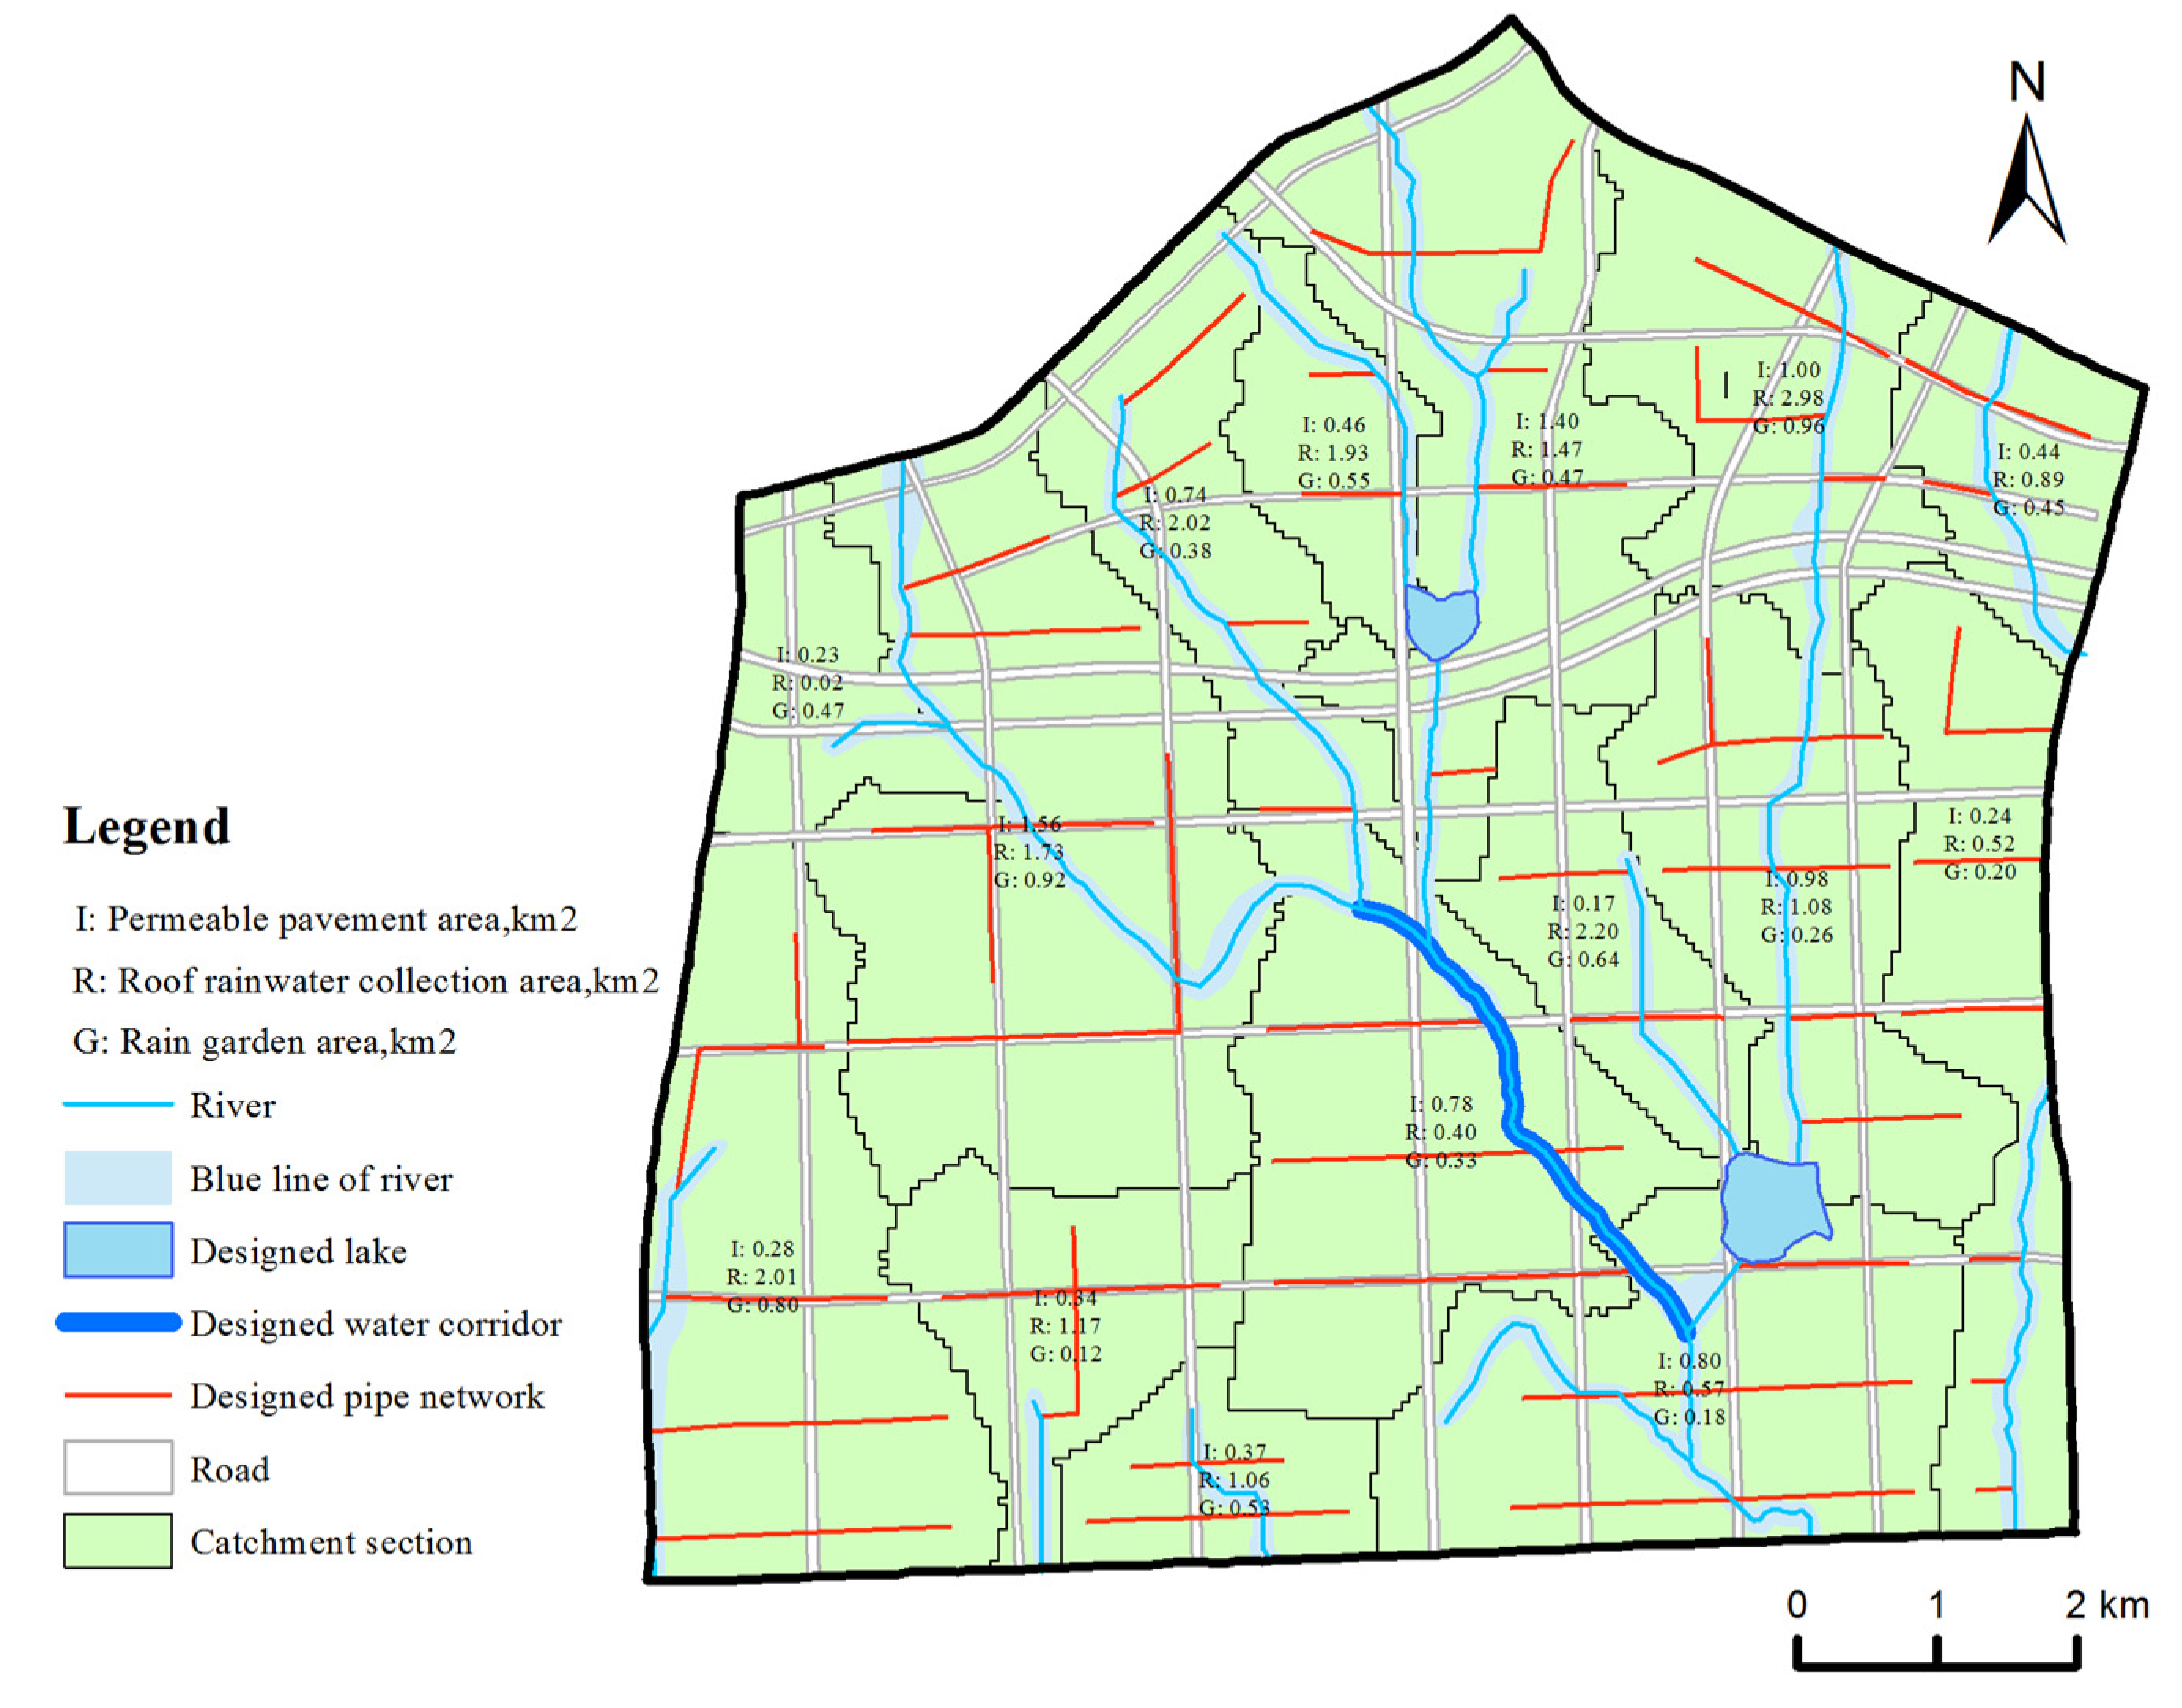
The design of rivers and lakes, LID facilities, and pipe networks are superimposed to form the overall scheme of stormwater control and utilization. In the rainfall process, LID facilities are used to store the rainwater as the bridge between rain and underground space. In the storage process, some rainwater can infiltrate locally to supplement groundwater. The rainwater that cannot be stored by LID facilities will be discharged into the urban rainwater pipe network. This ensures the safety of the city under severe stormwater conditions. Finally, the rainwater discharged by pipe network drains into rivers and lakes, which are the major drainage channels accepting rainfall and water from the urban drainage system. The comprehensive Sponge City design is shown in Figure 9.
3.2. Stormwater Control Effect
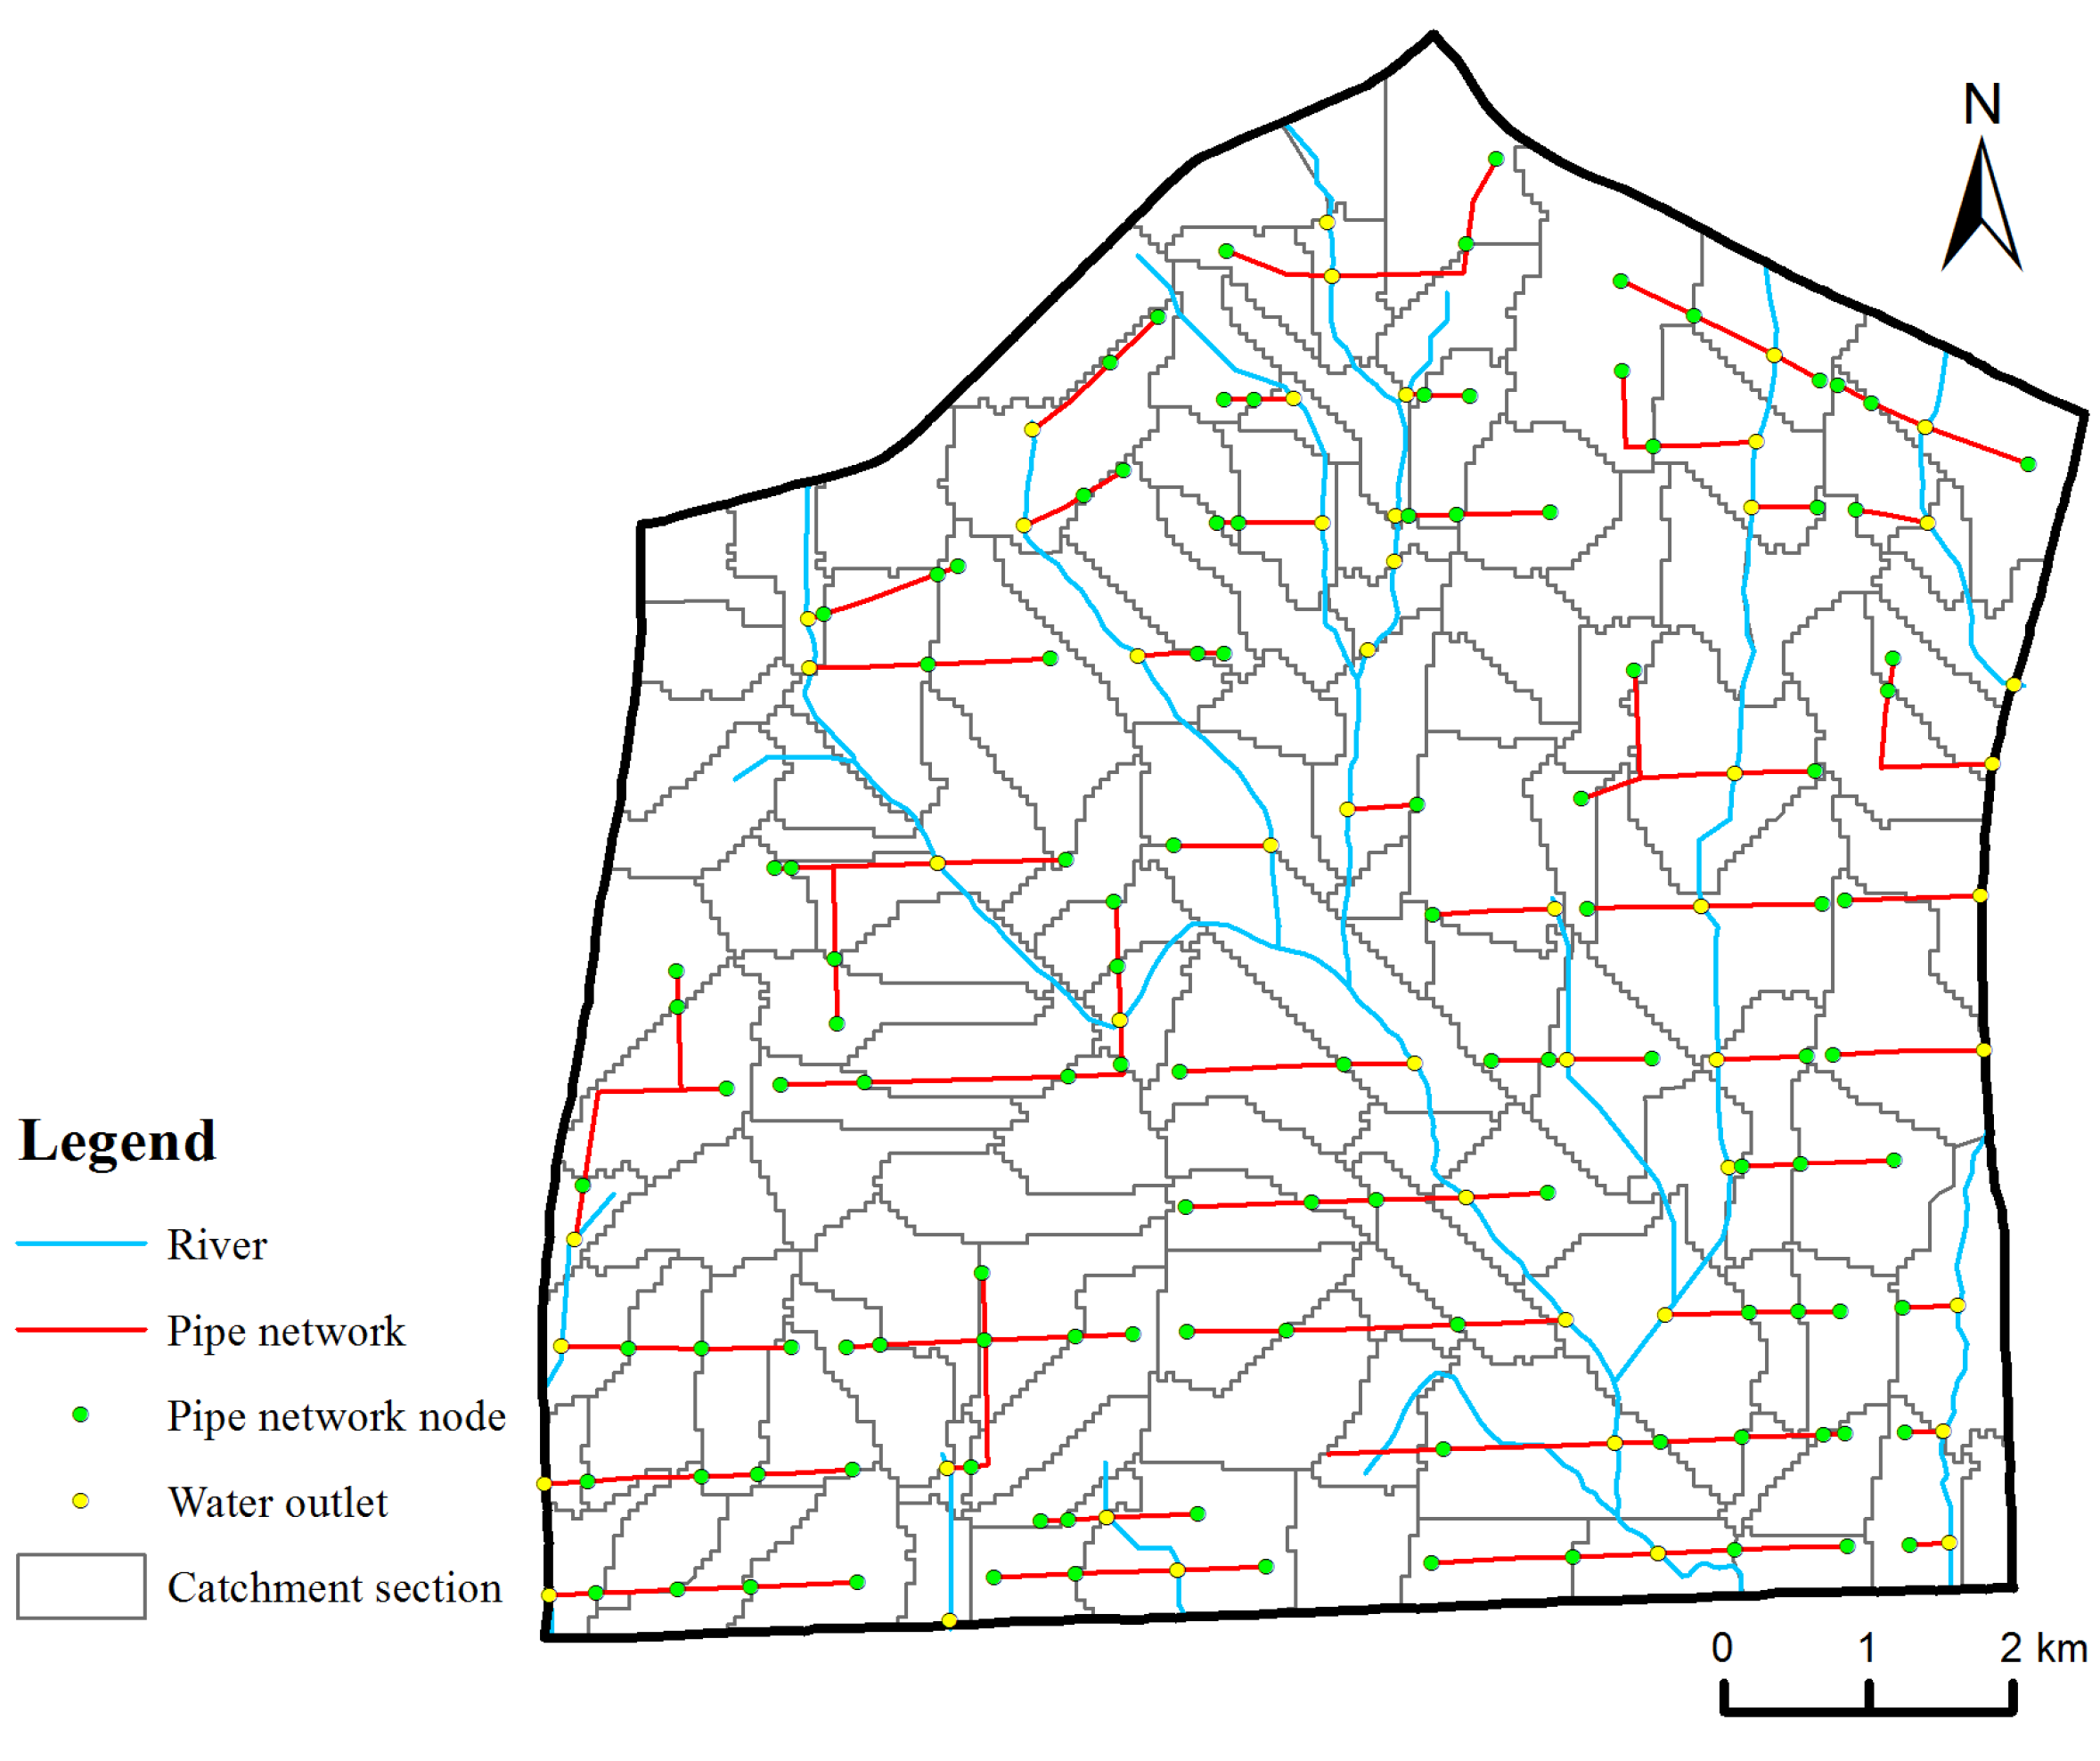
SWMM is used to evaluate the stormwater-runoff-control ability. In the scheme of stormwater control and utilization, river channels are the major drainage channels of rainwater, and the outlets of the pipe network are free of river channels. According to the design scheme, the study area is generalized into 121 sub-catchment areas, 115 pipe sections, 115 nodes, and 63 outlets, as shown in Figure 10.
The mean comprehensive runoff coefficient of different development intensity areas (Table 5) simulated by the model is within the empirical value range of urban comprehensive runoff coefficient (Table 2). Therefore, the model could reasonably simulate the surface runoff in the study area.
Under the Sponge City design scenario, the land-use situation of each sub-catchment area is based on the original planning scenario, the maximum impervious rate is 81%, the minimum is 10%, and the average is 56.38%.
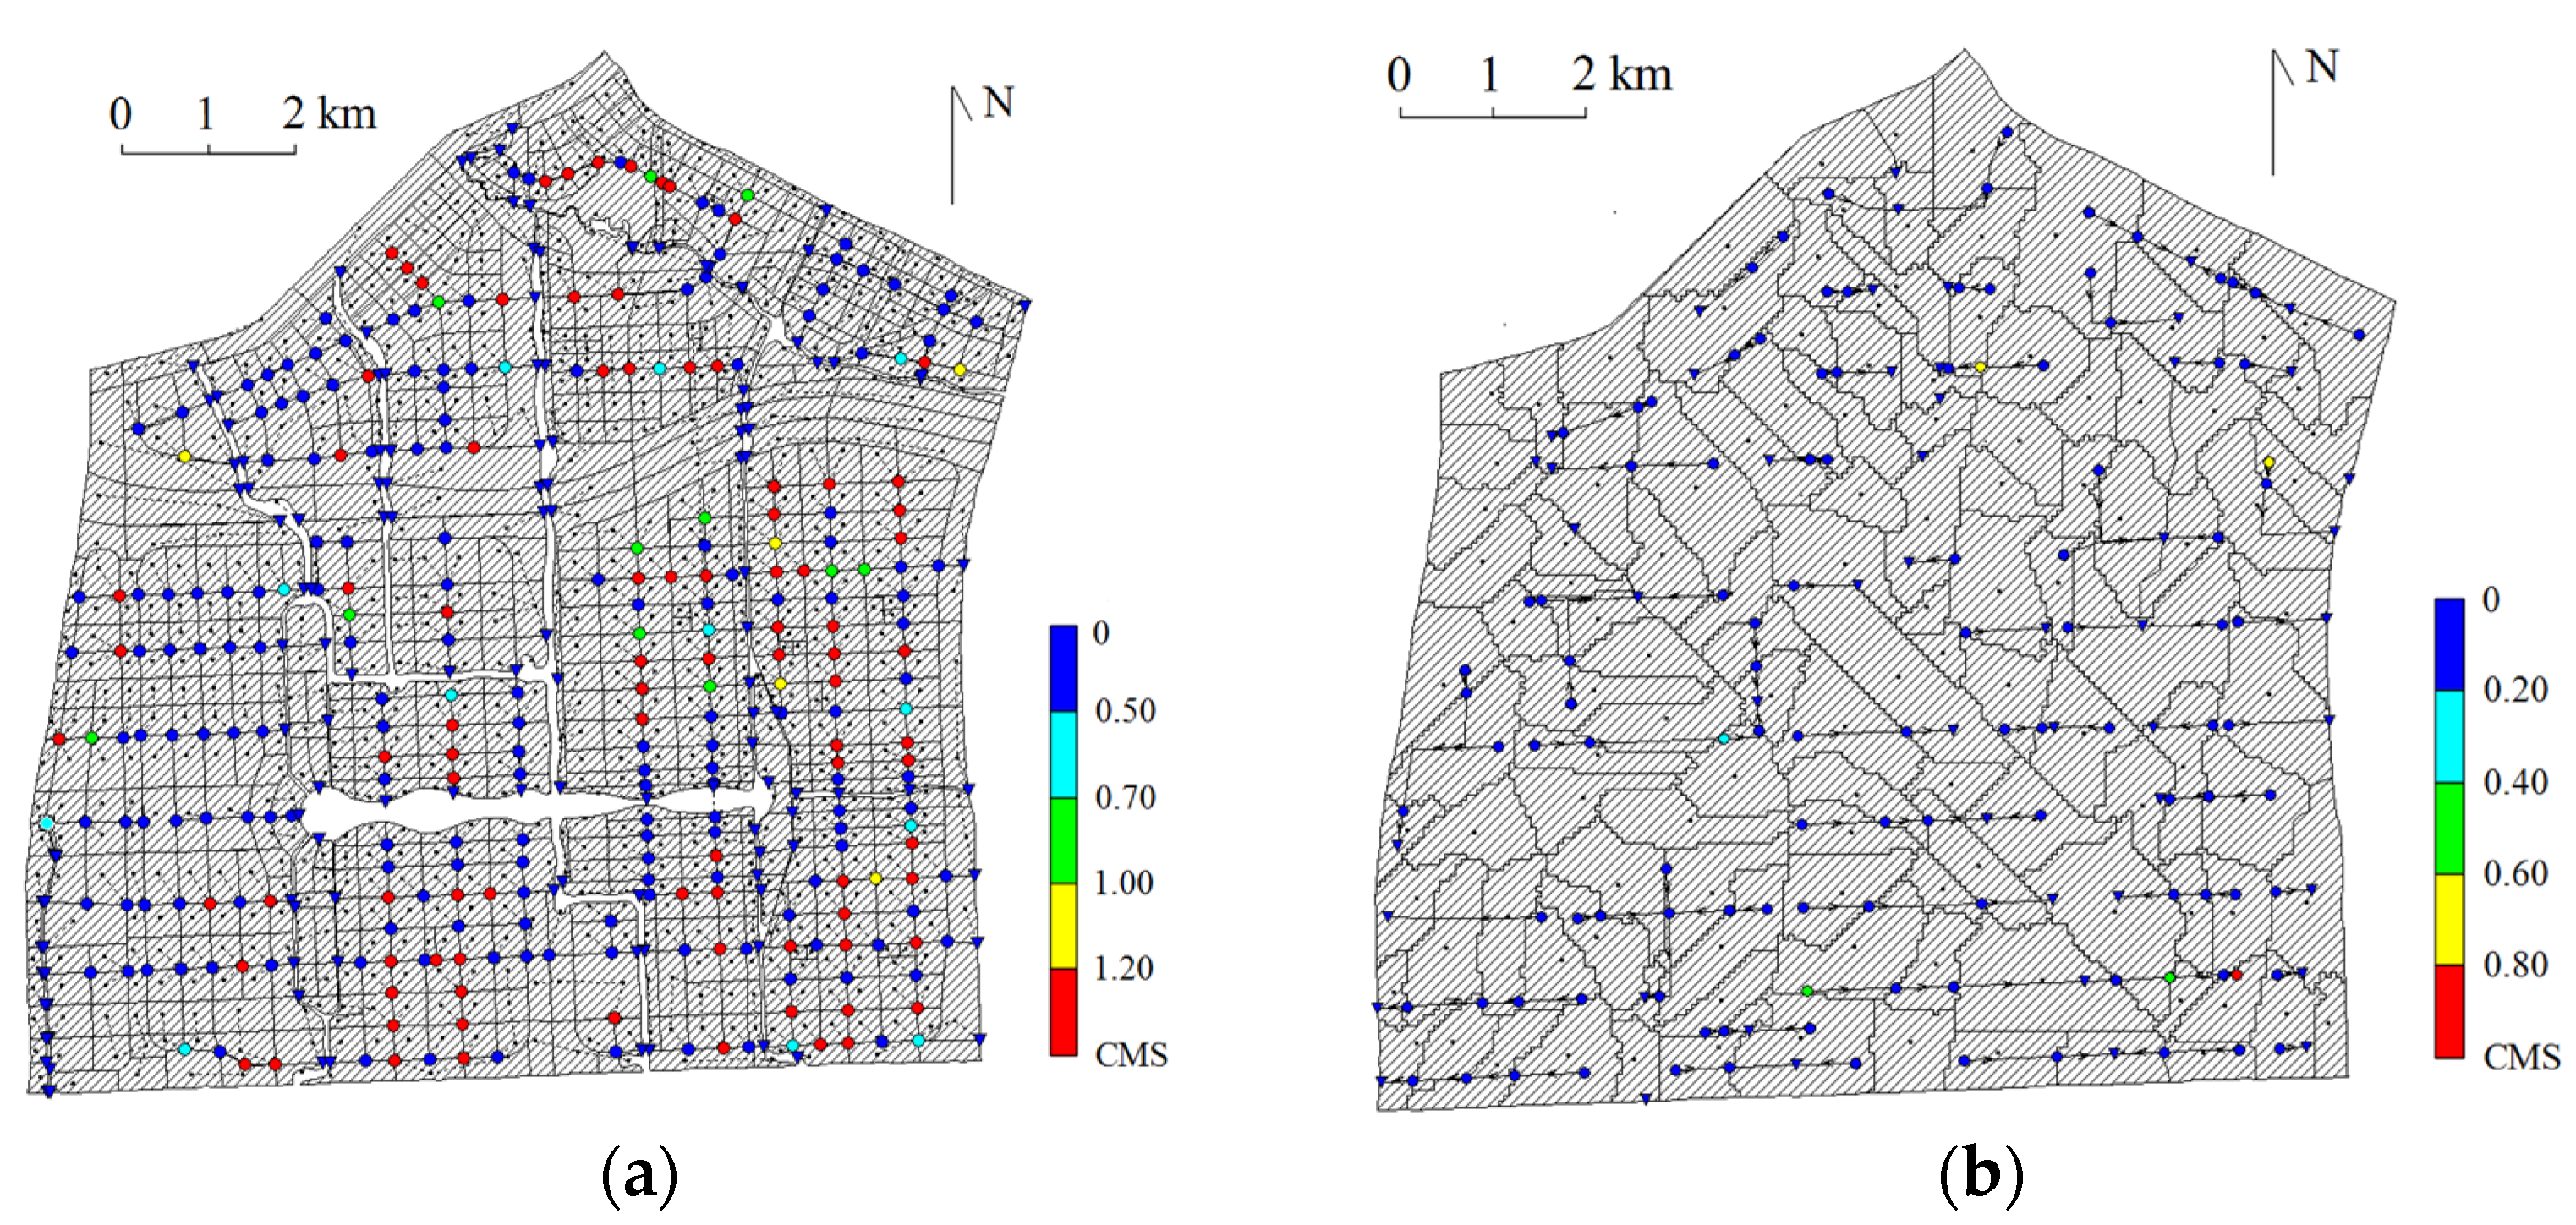
Under the five-year rainstorm condition, the maximum ponding time under the planning and design scenarios at each node is shown in Figure 11. It can be seen that under the planning scenario, the area most prone to ponding in the study area is mainly located in the plain area in the southeast. Due to the increase in the impervious area caused by urban construction in these areas, it is difficult for rainwater to infiltrate over time. Under the design conditions, there are almost no ponding points in the whole study area. Even at the maximum ponding time, there are only seven ponding nodes in the whole area, the maximum ponding is 0.87 m3/s, and the ponding risk is far lower than that in the design scenario.
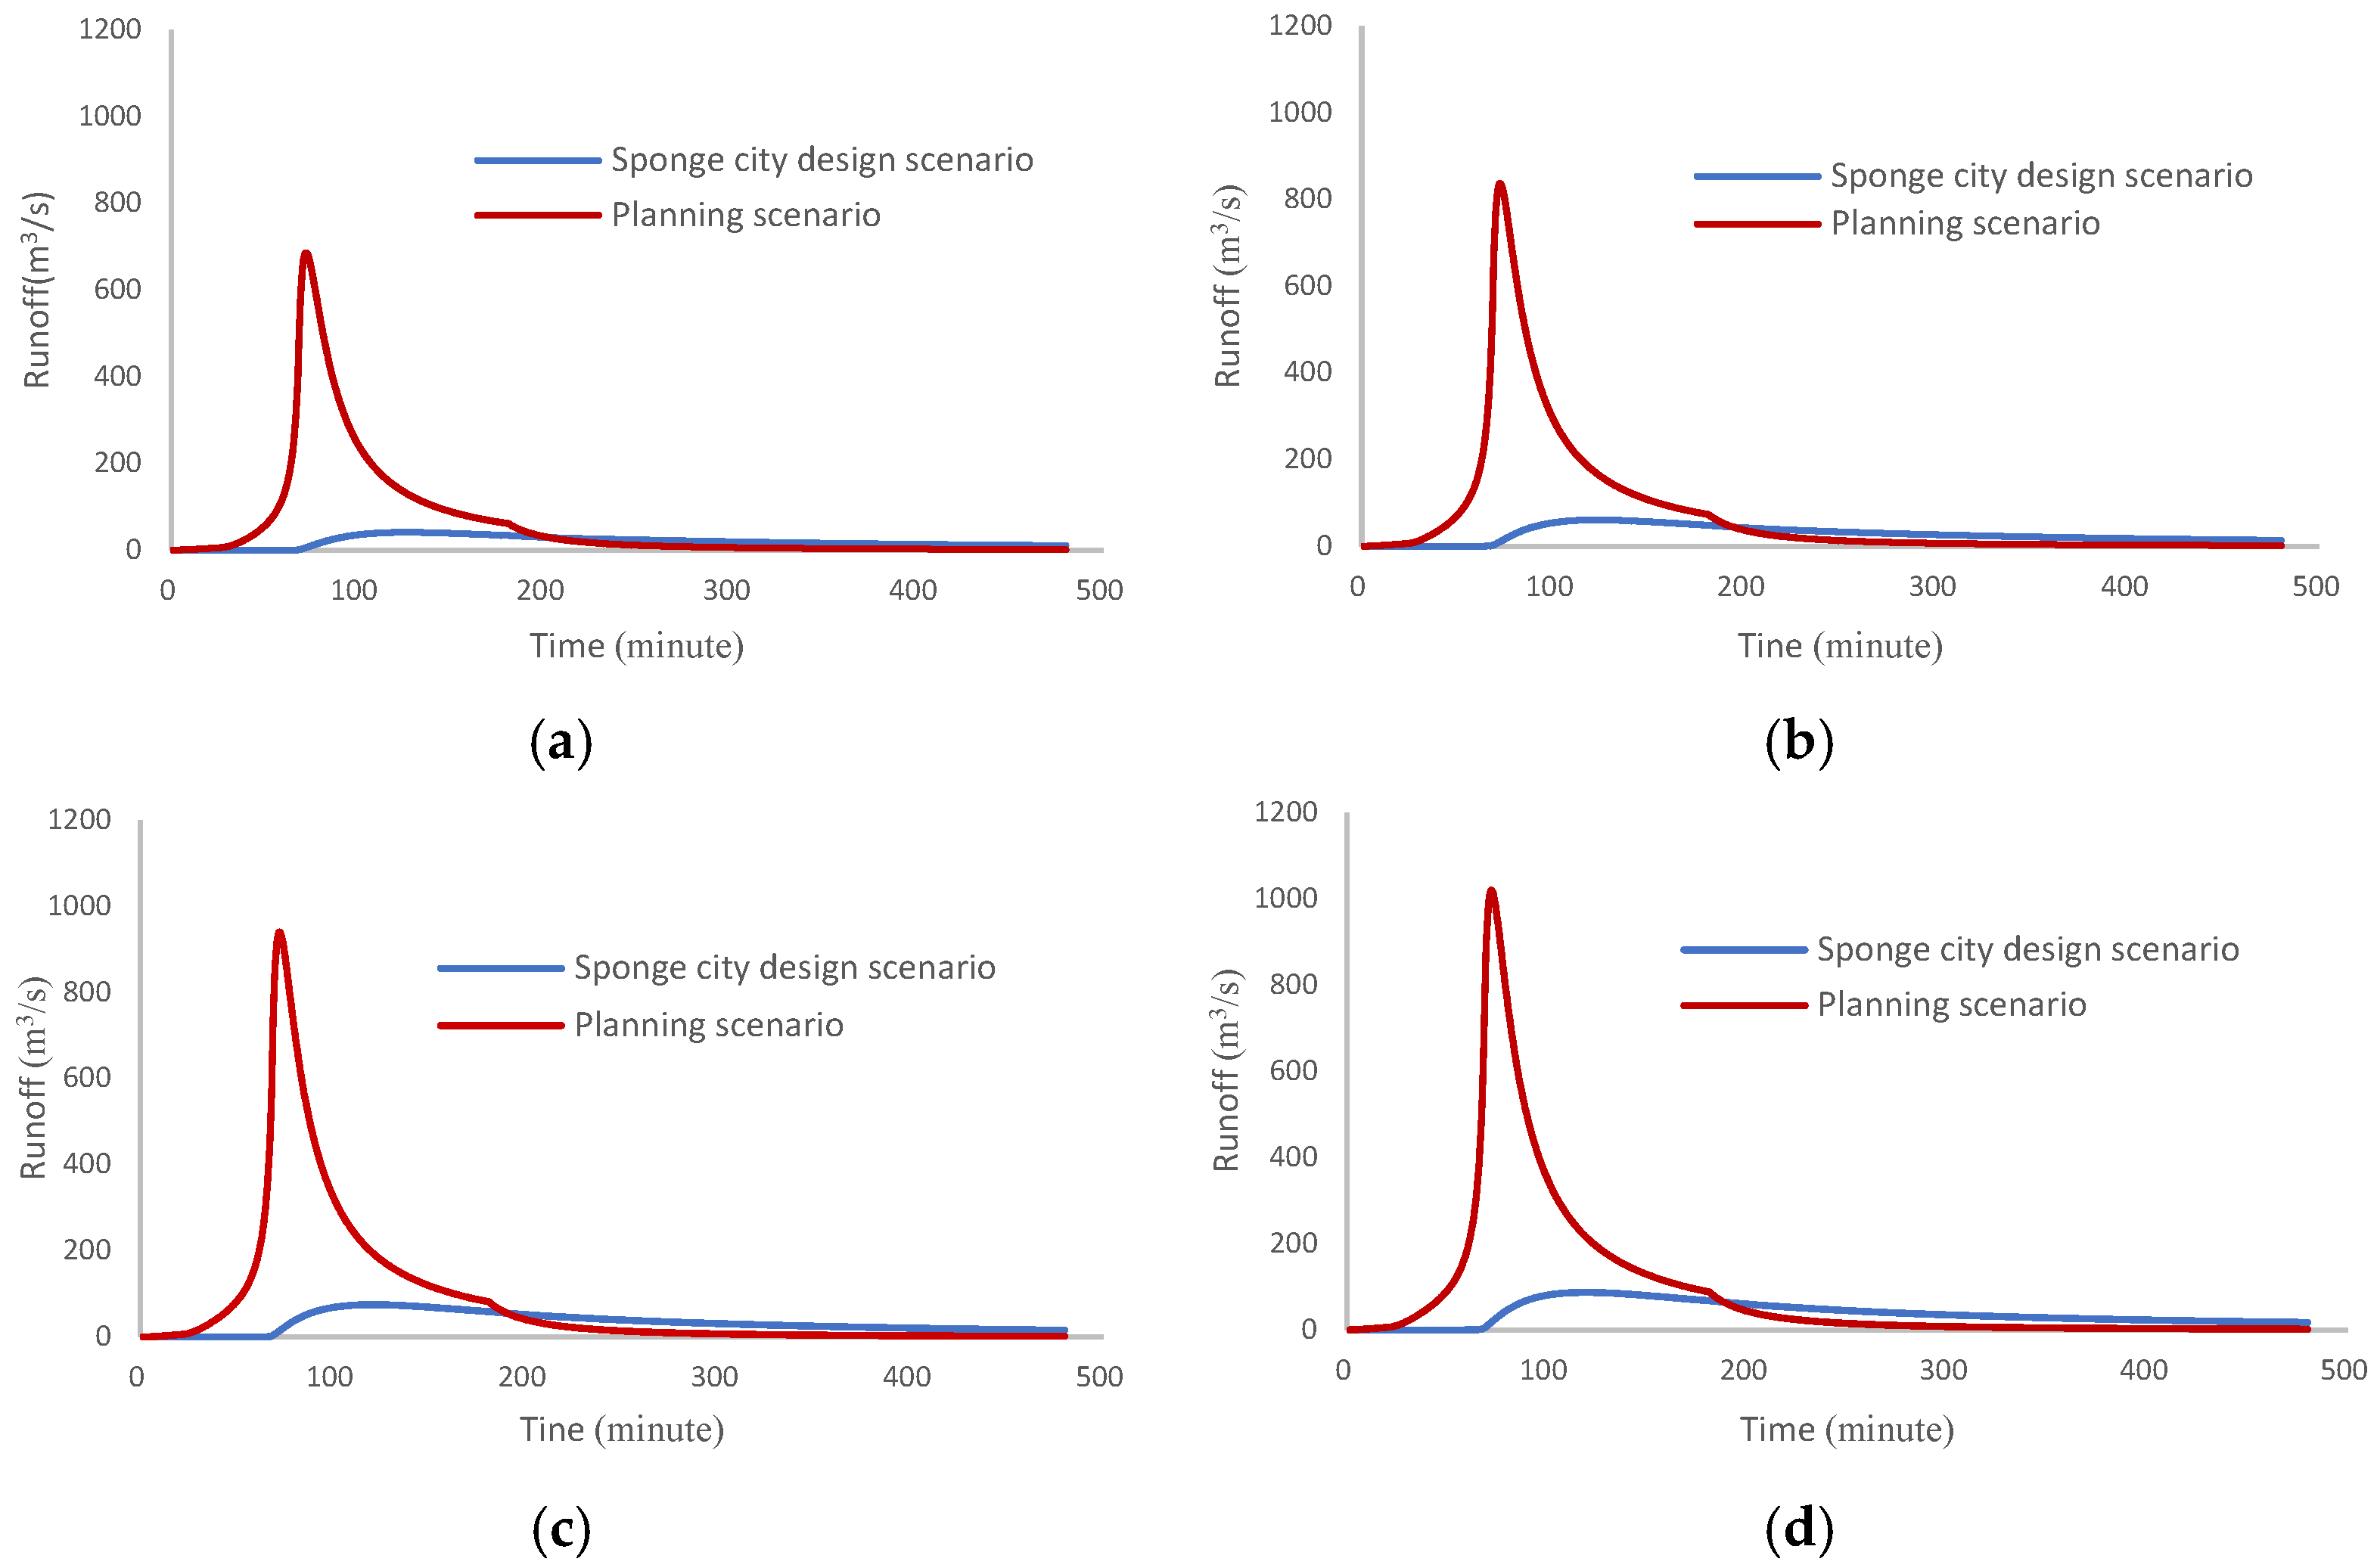
A comparison of the runoff simulation results for the planning and Sponge City design scenarios is shown in Table 6, and the runoff process under the planning and the Sponge City design scenarios for each rainfall return period is shown in Figure 12. Compared with the planning scenario, the runoff under the proposed Sponge City design scheme is significantly reduced, but the reduction shows a decreasing trend with an increase in the rainfall return period. The runoff coefficient is significantly reduced under all rainfall return periods, including the 10-year return period rainfall condition; the runoff coefficient is reduced below 0.3, and the shorter the return period, the smaller the runoff coefficient. The results show that the proposed Sponge City stormwater control and utilization scheme has an obvious effect on runoff control, which can meet the requirement of 70% rainfall utilization.
According to the runoff process curves (Figure 12), compared with the planning scenario, the peak discharge under the Sponge City design conditions was significantly reduced, and the reduction proportion decreased with an increase in the return period. Under the Sponge City design condition of 5-year return periods, the peak runoff is 75.28 m3/s, which is approximately 92% less than that under the planning scenario, indicating that the Sponge City scheme has an obvious effect on reducing the peak runoff. Compared with the planning scenario, the peak time under the Sponge City design scenario is also significantly delayed, and the delay time decreases with the increase in the rainfall period. The delay time is 48 min under the condition of a 5-year return period rainfall, which indicates that the sensitivity of the runoff response to rainfall is significantly reduced under the Sponge City design scheme.
3.3. Groundwater-Recharge Effect
The purpose of the stormwater runoff control and utilization system is not only to control surface runoff but also to restore the supplement of precipitation to groundwater under natural conditions. Visual MODFLOW is used to simulate the impact of stormwater-runoff-control and utilization schemes on the groundwater regime.
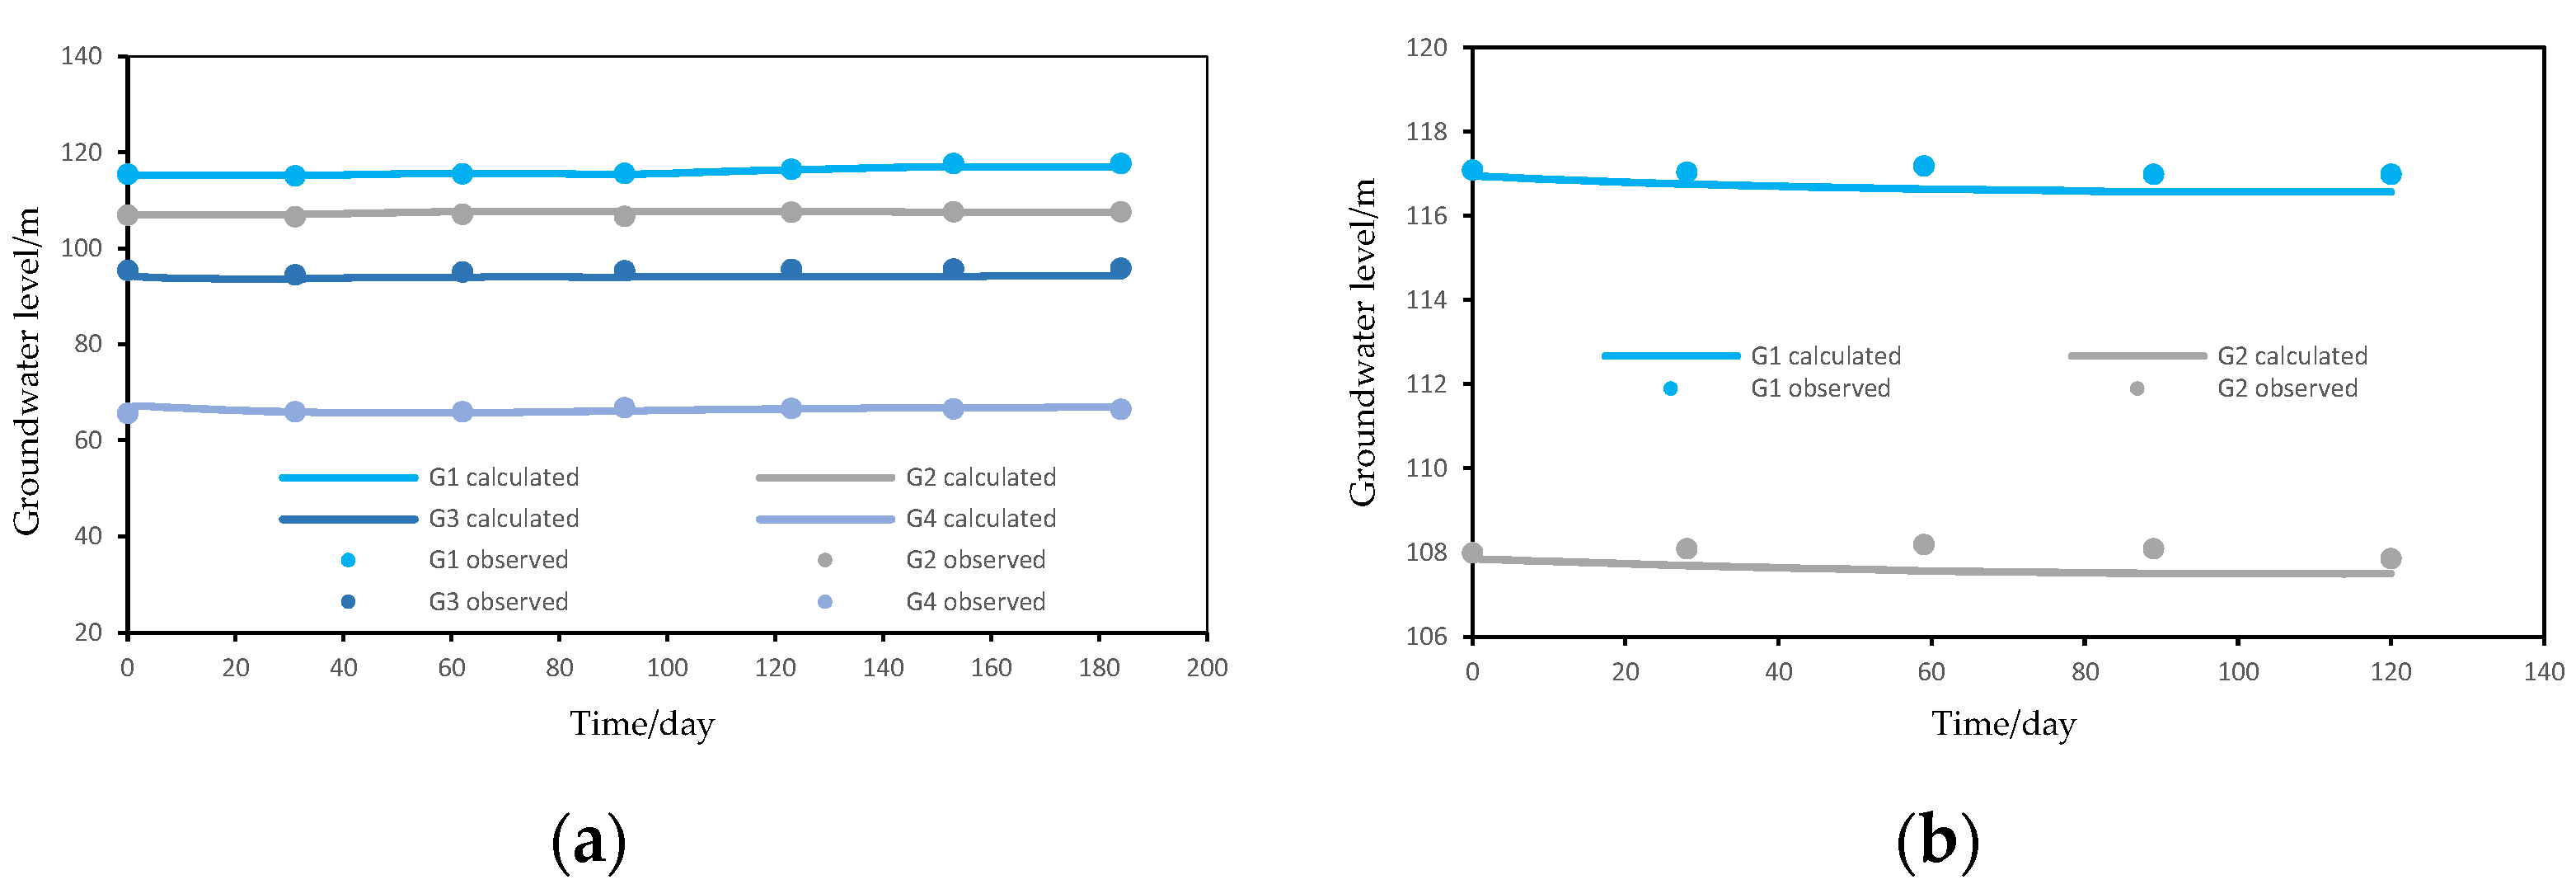
The groundwater mathematical model established in the study area has good water level fitting in the calibration and verification periods (as shown in Figure 13). The residual mean error is −0.294 m, and the absolute residual mean is 0.541 m in the calibration period. The residual mean is −0.191 m, and the absolute residual mean is 0.498 m in the verification period.
The change in groundwater level in the study area in the present scenario, planning scenario, and Sponge City design scenario in the next 10 years is predicted (Table 7).
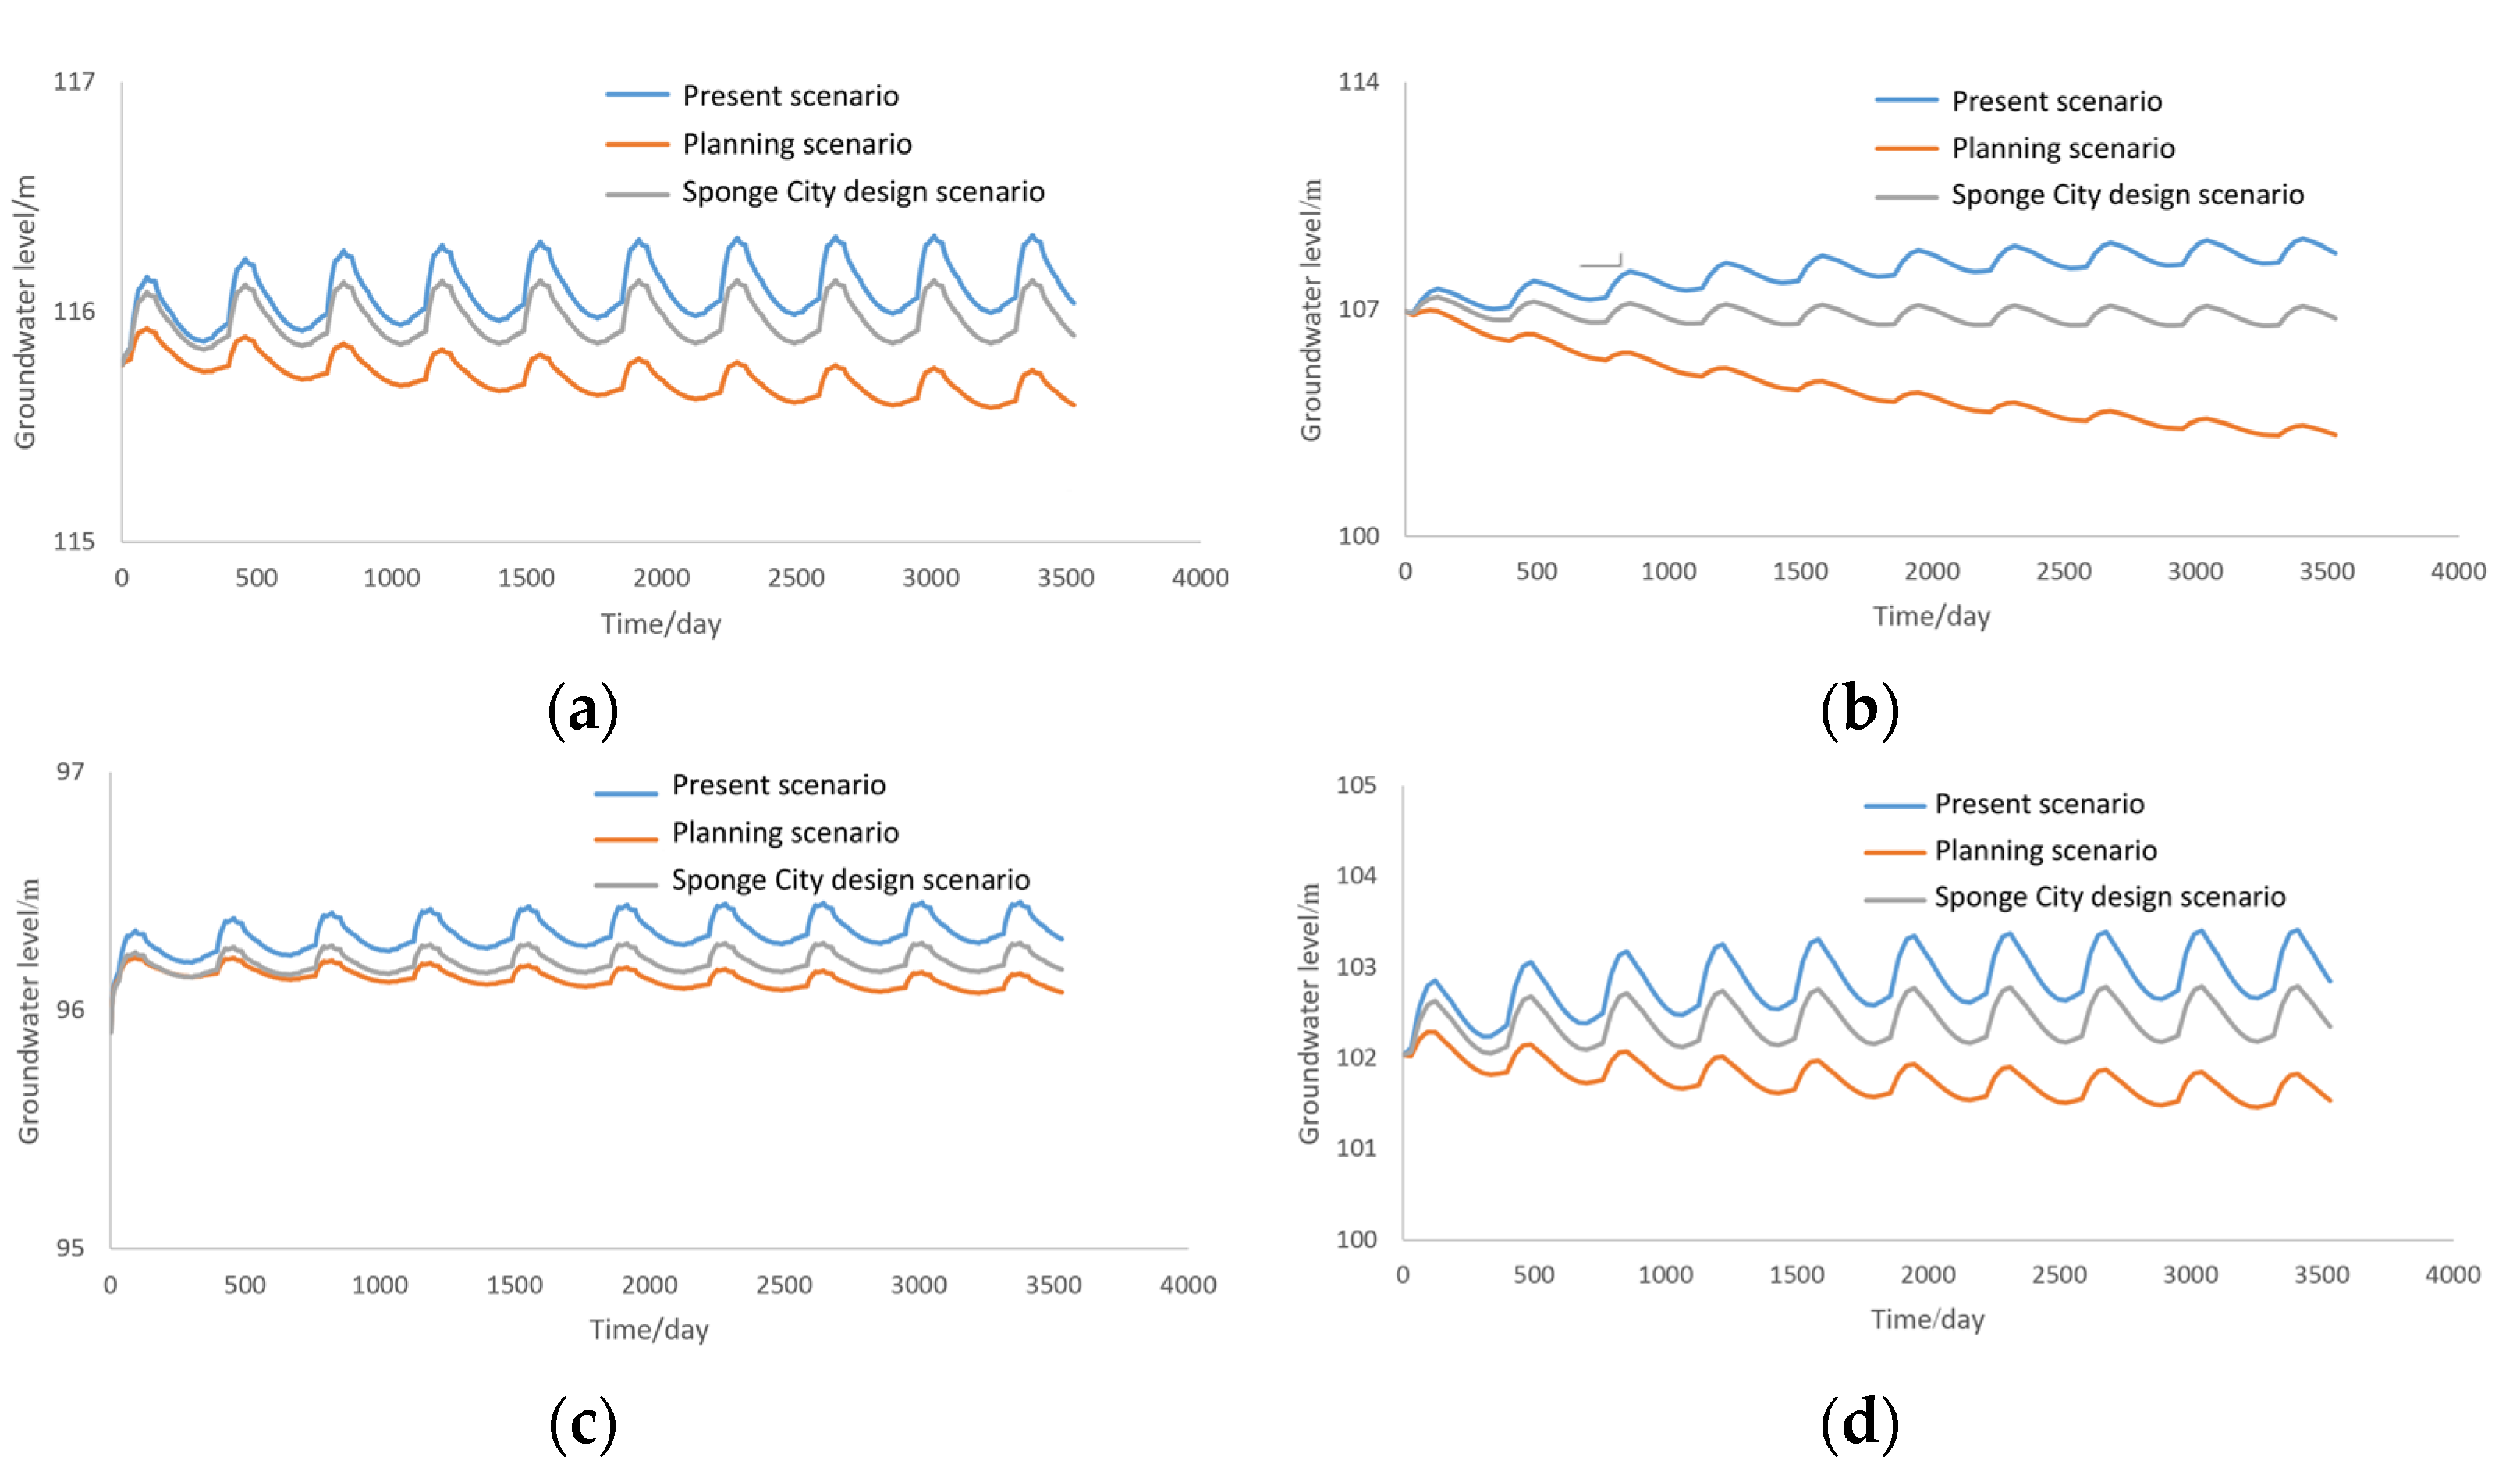
Modeling results of the three schemes (Figure 14) show that in the present scenario, the groundwater level of each observation well is increased, mainly because the average annual rainfall is greater than that of the current year.
Under the original planning scenario, due to the increase in impervious areas of urban construction, only a small amount of rainfall could replenish groundwater, and canalization of rivers led to the extinguishment of surface water recharge (Table 7). Thus, the groundwater level continues to decline, and the maximum drawdown of the observation well can reach 3.8 m. Although the groundwater level under the Sponge City design scenario is lower than that in the present scenario, it can still maintain the stable state of groundwater level because the LID facilities induced more water returning into the aquifer (Table 8). Figure 13 also revealed different changing ranges in different observation wells; the main reason was the distance to infiltration infrastructure with different types and scales. Therefore, compared with the planning conditions, the Sponge City design scheme can make more precipitation and surface water recharge the subsurface aquifer, thus having a significant positive impact on groundwater resources.
4. Conclusions
Based on the dual requirements of stormwater control and utilization in the study area, a Sponge City design scheme that takes full advantage of natural elements is proposed. Combined with the current river distribution, the main drainage channels in the study area are constructed, and the catchment areas corresponding to each drainage channel are divided; according to the geological and hydrogeological conditions of the study area, the analytic hierarchy process was used to determine the suitable types of LID facilities in different blocks of the study area. According to the rainfall and flood volume in each catchment area, the area and volume of LID facilities were calculated according to the green space area of each catchment area, with the goal of 70% of LID facilities’ consumption. To ensure the safety of urban drainage under the condition of rainfall, the municipal pipe network drainage system is constructed to discharge 40% of the rainfall. Therefore, the Sponge City scenario showed a better effect in reducing stormwater peak flow, delaying stormwater peak time, and recharging groundwater than that under the traditional city development mode.
According to this research, the coupling of SWMM and MODFlow could be an effective method to analyze and examine the function of flood control and aquifer recharge of a Sponge City. The limitations of this case study are as follows. (1) There was no validation of the hydrological model because there were no available data for the seasonal rivers; (2) the design scenario is only a brief scheme of Sponge City; there has been no assessment of the runoff quantity control and recharge quantity of groundwater in LID facilities on a community scale.
Author Contributions
Conceptualization, X.Y. and X.D.; methodology and formal analysis, M.L.; writing—original draft preparation, B.M.; writing—review and editing, X.Y. and X.D. All authors have read and agreed to the published version of the manuscript.
Funding
This research was funded by the National Natural Science Foundation of China (41672231).
Data Availability Statement
Data is contained within the article.
Conflicts of Interest
The authors declare no conflict of interest.
References
- Research Group of Control and Countermeasure of Flood. Control and countermeasure of flood in China. China Flood Drought 2014, 3, 46–48. [Google Scholar]
- Chan, F.K.S.; Griffiths, J.; Higgitt, D.; Xu, S.Y.; Zhu, F.F.; Tang, Y.T.; Xu, Y.Y.; Thorne, C. “Sponge City” in China—A breakthrough of planning and flood risk management in the urban contex. Land Use Policy 2018, 76, 772–778. [Google Scholar] [CrossRef]
- Lyu, H.M.; Sun, W.J.; Shen, S.L.; Arulrajah, A. Flood risk assessment in metro systems of mega-cities using a GIS-based modeling approach. Sci. Total Environ. 2018, 626, 1012–1015. [Google Scholar] [CrossRef]
- Zhang, S.Y.; Zevenbergen, C.; Rabe, P.; Jiang, Y. Influences of Sponge City on Property Values in Wuhan, China. Water 2018, 10, 766. [Google Scholar] [CrossRef] [Green Version]
- Lancia, M.; Zheng, C.; He, X.; Lerner, D.N.; Tian, Y. Hydrogeological constraints and opportunities for “Sponge City” development: Shenzhen, southern China. J. Hydrol. Reg. Stud. 2020, 28, 772–778. [Google Scholar] [CrossRef]
- Geiger, W.F. Sponge city and LID technology vision and tradition. Landsc. Archit. Front. 2015, 3, 10–20. [Google Scholar]
- Tazioutzios, C.; Kastridis, A. Multi-Criteria Evaluation (MCE) method for the management of woodland plantations in floodplain areas. Int. J. Geo-Inf. 2020, 9, 725. [Google Scholar] [CrossRef]
- Bertrand-Krajewski, J.L. Intergrated urban stormwater management: Evolution and multidisciplinary perspective. J. Hydro-Environ. Res. 2021, 38, 72–83. [Google Scholar] [CrossRef]
- Zhu, Y.F.; Xu, C.Q.; Yin, D.K.; Xu, J.X.; Wu, Y.Q.; Jia, H.F. Environmental and economic cost-benefit comparison of Sponge City construction in different urban functional regions. J. Environ. Manag. 2022, 304, 114230. [Google Scholar] [CrossRef]
- Tu, X.M.; Tian, T.N. Questions towards a sponge city report on power of public policy: Sponge city and the trend of landscape architecture. Landsc. Archit. Front. 2015, 3, 22–30. [Google Scholar]
- Yin, D.K.; Chen, Y.; Jia, H.F.; Wang, Q.; Chen, Z.X.; Xu, C.X.; Li, Q.; Wang, W.L.; Yang, Y.; Fu, G.T.; et al. Sponge City Practice in China: A Review of Construction, Assessment, Operational and Maintenance. J. Clean. Prod. 2021, 280, 124963. [Google Scholar] [CrossRef]
- Xu, Y.S.; Shen, S.L.; Lai, Y.; Zhou, A.N. Design of sponge city: Lessons learnt from an ancient drainage system in Ganzhou, China. J. Hydrol. 2018, 563, 900–908. [Google Scholar] [CrossRef]
- Chen, S.Y.; Van de Ven, F.H.M.; Zevenbergen, C.; Verbeeck, S.; Ye, Q.H.; Zhang, W.J.; Wei, L. Revisiting China’s Sponge City planning approach: Lessons from a case study on Qinhuai District, Nanjing. Front. Environ. Sci. 2021, 9, 748231. [Google Scholar] [CrossRef]
- Wang, Y.T.; Sun, M.X.; Song, B.M. Public perceptions of and willingness to pay for sponge city initiatives in China. Resour. Conserv. Recycl. 2017, 122, 11–20. [Google Scholar] [CrossRef]
- Xie, X.H.; Qin, S.Y.; Gou, Z.H.; Yi, M. Engaging professionals in urban stormwater management: The case of China’s Sponge City. Build. Res. Inf. 2020, 48, 719–730. [Google Scholar] [CrossRef]
- Zhang, C.H.; He, M.Y.; Zhang, Y.S. Urban sustainable development based on the framework of sponge city: 71 case study in China. Sustainability 2019, 11, 1544. [Google Scholar] [CrossRef] [Green Version]
- Yang, M.; Sang, Y.F.; Sivakumar, B.; Chan, F.K.S.; Pan, X. Challenges in urban stormwater management in Chinese cities: A hydrologic perspective. J. Hydrol. 2020, 591, 125314. [Google Scholar] [CrossRef]
- Mooers, E.W.; Jamieson, R.C.; Hayward, J.L.; Drage, J.; Lake, C.B. Low-impact development effects on aquifer recharge using coupled surface and groundwater models. J. Hydrol. Eng. 2018, 23, 04018040. [Google Scholar] [CrossRef]
- Newcomer, M.E.; Gurdak, J.J.; Sklar, L.S. Urban recharge beneath low impact development and effects of climate varibility and change. Water Resour. Res. 2014, 50, 1716–1734. [Google Scholar] [CrossRef]
- Jin, M.X.; Lancia, M.; Tian, Y.; Viaroli, S.; Andrews, C.; Liu, J.; Zheng, C. Hydrogeological criteria to improve the sponge city strategy of China. Front. Environ. Sci. 2021, 9, 700463. [Google Scholar] [CrossRef]
- Lancia, M.; Zheng, C.M.; Yi, S.P.; Lerner, D.N.; Andrews, C. Analysis of groundwater resources in densely populated urban watersheds with a complex tectonic setting: Shenzhen, southern China. Hydrogeol. J. 2019, 27, 183–194. [Google Scholar] [CrossRef] [Green Version]
- Lancia, M.; Su, H.; Tian, Y.; Xu, J.T.; Andrews, C.; Lerner, D.N.; Zheng, C.M. Hydrogeology of the Pearl River Delta, southern China. J. Maps 2020, 16, 388–395. [Google Scholar] [CrossRef]
- Su, Y.; Li, T.X.; Cheng, S.K.; Wang, X. Spatial distribution exploration and driving factor identification for soil salinisation based on geodetector models in coastal area. Ecol. Eng. 2020, 156, 105961. [Google Scholar] [CrossRef]
- Kang, H.Z.; Chen, L.; Guo, Q.Z.; Lian, J.J.; Hou, J. An overview of quantification of groundwater recharge in sponge city construction. Earth Sci. Front. 2019, 26, 58–65. [Google Scholar]
- Sun, K.N.; Hu, L.T.; Liu, X.M. The influences of sponge city construction on spring discharge in Jinan city of China. Hydrol. Res. 2020, 51, 959–975. [Google Scholar] [CrossRef]
- Ji, M.C.; Bai, X. Construction of the sponge city regulatory detailed planning index system based on the SWMM model. Environ. Technol. Innov. 2021, 23, 101645. [Google Scholar] [CrossRef]
- Zhou, J.J.; Liu, J.H.; Shao, W.W.; Yu, Y.D.; Zhang, K.; Wang, Y.; Mei, C. Effective evaluation of infiltration and storage measures in sponge city construction: A case study of Fenghuang City. Water 2018, 10, 937. [Google Scholar] [CrossRef] [Green Version]
- Zhou, Y.X.; Sharma, A.; Masud, M.; Gaba, G.S.; Dhiman, G.; Ghafoor, K.Z.; AIZain, M.A. Urban rain flood ecosystem design planning and feasibility study for the enrichment of smart cities. Sustainability 2021, 13, 5205. [Google Scholar] [CrossRef]
- Yang, Y.Y.; Li, J.; Huang, Q.; Xia, J.; Li, J.K.; Liu, D.F. Performance assessment of sponge city infrastructure on stormwater outflows using isochrone and SWMM models. J. Hydrol. 2021, 597, 126151. [Google Scholar] [CrossRef]
- Yin, D.K.; Evans, B.; Wang, Q.; Chen, Z.X.; Jia, H.F.; Chen, A.S.; Fu, G.T.; Ahmad, S.; Leng, L.Y. Integrated 1D and 2D model for better assessing runoff quantity control of low impact development facilities on community scale. Sci. Total Environ. 2020, 720, 137630. [Google Scholar] [CrossRef]
- Zhengzhou Urban and Rural Planning Bureau. Technical Provisions on Urban Management of Zhengzhou City (2018 Revised Version); Office of Zhengzhou Urban and Rural Planning Bureau: Zhengzhou, China, 2018. (In Chinese) [Google Scholar]
- Wang, Y.T.; Sun, M.X.; Song, B.M. A framework to support decision making in the selection of sustainable drainage system design alternatives. J. Environ. Manag. 2017, 201, 145–152. [Google Scholar] [CrossRef]
- Tang, S.J.; Jiang, J.; Zheng, Y.; Hong, Y.; Chung, E.S.; Shamseldin, A.Y.; Wei, Y.; Wang, X.H. Robustness analysis of storm water quality modeling with LID infrastructures from natural event-based field monitoring. Sci. Total Environ. 2020, 753, 142007. [Google Scholar] [CrossRef] [PubMed]
- Luan, Q.H.; Fu, X.R.; Song, C.P.; Wang, H.C.; Liu, J.H.; Wang, Y. Runoff Effect Evaluation of LID through SWMM in Typical Mountainous, Low-Lying Urban Areas: A Case Study in China. Water 2017, 9, 439. [Google Scholar] [CrossRef] [Green Version]
- Rossman, L.A. Storm Water Management Model User’s Manual Version 5.1; United States Environmental Protection Agency: Cincinnati, OH, USA, 2015. [Google Scholar]
- Liu, X.P. Parameter calibration method for urban rainfall-runoff model based on runoff coefficient. Water Wastewater Eng. 2009, 35, 213–217. (In Chinese) [Google Scholar]
- Beijing Municipal Design and Research Institute. Concise Drainage Design Manual; China Construction Industry Press: Beijing, China, 1990; p. 241. [Google Scholar]
- Ashraf, M.; Kahlown, M.A.; Ashfaq, A. Impact of small dams on agriculture and groundwater development: A case study from Pakistan. Agric. Water Manag. 2007, 92, 90–98. [Google Scholar] [CrossRef]
- Kastridis, A.; Stathis, D. The effect of small earth dams and reservoirs on water management in North Greece (Kerkini municipality). Silva Balc. 2015, 16, 71–84. [Google Scholar]
- Zhu, Q.; Yu, K.J.; Li, D.H. The width of ecological corridor in landscape planning. ACTA Ecol. Sin. 2005, 25, 2406–2412. (In Chinese) [Google Scholar]
- Hou, F. Research on the Urban Ecological Corridor Planning Based on Sponge City—Green Corridor of Fengxi New City as a case study. Master’s Thesis, Chang’an University, Xi’an, China, June 2017. (In Chinese). [Google Scholar]
- Xu, C.Q.; Shi, X.M.; Jia, M.Y.; Han, Y.; Zhang, R.R.; Ahmad, S.; Jia, H.F. China Sponge City database development and urban runoff source control facility configuration comparison between China and the US. J. Environ. Manag. 2022, 304, 114241. [Google Scholar] [CrossRef] [PubMed]
Figure 1.
Sketch map of the study area.

Figure 2.
Geology and groundwater flow field.

Figure 3.
The originally planned land-use types.

Figure 4.
Typical rainfall intensity curve.

Figure 5.
The river and its corresponding catchment area.

Figure 6.
Schematic diagram of the river profile.

Figure 7.
Locations of designed lakes and water corridor.

Figure 8.
Layout of rainwater pipe network.

Figure 9.
Sponge City scheme.

Figure 10.
Generalized model of surface runoff under Sponge City design scenario.

Figure 11.
Node ponding circumstances of a rainstorm once in five years under planning and Sponge city scenarios. (a) Planning scenario. (b) Sponge city design scenario.
Figure 11.
Node ponding circumstances of a rainstorm once in five years under planning and Sponge city scenarios. (a) Planning scenario. (b) Sponge city design scenario.

Figure 12.
Runoff process curves under different rainfall return periods. (a) Twice in 1 year. (b) Once in 2 years. (c) Once in 5 years. (d) Once in 10 years.
Figure 12.
Runoff process curves under different rainfall return periods. (a) Twice in 1 year. (b) Once in 2 years. (c) Once in 5 years. (d) Once in 10 years.

Figure 13.
Groundwater level fitting diagram during calibration and verification period. (a) Calibration period. (b) Verification period.
Figure 13.
Groundwater level fitting diagram during calibration and verification period. (a) Calibration period. (b) Verification period.

Figure 14.
Groundwater level prediction in the next 10 years. (a) Observation well G1. (b) Observation well G2. (c) Observation well G3. (d) Observation well G4.
Figure 14.
Groundwater level prediction in the next 10 years. (a) Observation well G1. (b) Observation well G2. (c) Observation well G3. (d) Observation well G4.


Table 1.
The hydrologic parameters.
| Manning Roughness Coefficient | Depression Storage/mm | Coefficients for Horton Formula | |||||
|---|---|---|---|---|---|---|---|
| Impervious Area | Permeable Area | River Channels | Impervious Area | Permeable Area | Infiltration Rate/mm⋅h−1 | Attenuation Coefficient/h−1 | |
| Maximum | Minimum | ||||||
| 0.015 | 0.20 | 0.02 | 2.80 | 5.10 | 14.67–193.22 | 1.22–98.44 | 3–4 |
Table 2.
Empirical value of runoff coefficient [37].
Table 2.
Empirical value of runoff coefficient [37].
| Development Intensity | Proportion of Impervious Area | Empirical Runoff Coefficient |
|---|---|---|
| Upper-middle | >70% | 0.6~0.8 |
| Middle | 50~70% | 0.5~0.7 |
| Low-middle | 30~50% | 0.4~0.6 |
| Low | <30% | 0.3~0.5 |
Table 3.
Parameters of river sections.
| River Segment | Length /km | Catchment Area /km2 | Rate of Flow /m3s−1 | Width of River Blue Line /m |
|---|---|---|---|---|
| III-1, IV | 13.33 | 30.12 | 150.23 | 60 |
| II-1 | 7.37 | 9.68 | 57.42 | 50 |
| II-2, I-4 | 7.57 | 12.38 | 69.61 | 50 |
| I-1 | 0.49 | 2.81 | 9.45 | 30 |
| I-2 | 4.32 | 4.91 | 29.96 | 30 |
| I-3 | 3.6 | 2.53 | 16.91 | 30 |
| I-6 | 3.09 | 3.99 | 23.67 | 30 |
| III-2, I-5 | 6.31 | 9.15 | 51.45 | 50 |
| II-3 | 3.22 | 8.96 | 41.92 | 30 |
| I-8 | 1.22 | 4.11 | 17.78 | 30 |
| I-9 | 1.42 | 2.51 | 13.75 | 30 |
Table 4.
LID facilities’ parameters of water catchments.
| Area /km2 | Proportion of Land Use Types/% | Green Space /km2 | Permeable Pavement /km2 | Green Roof /km2 | Rainwater Garden /km2 | Water Storage Depth /m | ||||
|---|---|---|---|---|---|---|---|---|---|---|
| Industrial | Residential | Commercial | Greenspace | |||||||
| M1 | 2.81 | 1.1 | 0.7 | 0.0 | 98.1 | 2.35 | 0.23 | 0.02 | 0.47 | 0.2 |
| M2 | 8.96 | 61.3 | 0.0 | 0.0 | 38.7 | 3.22 | 0.28 | 2.20 | 0.64 | 0.3 |
| M3 | 12.87 | 22.8 | 35.7 | 5.4 | 36.1 | 4.79 | 1.56 | 2.98 | 0.96 | 0.2 |
| M4 | 4.11 | 46.0 | 24.3 | 0.0 | 29.7 | 1.28 | 0.34 | 1.08 | 0.26 | 0.3 |
| M5 | 2.51 | 17.0 | 49.4 | 0.0 | 33.6 | 0.92 | 0.37 | 0.57 | 0.18 | 0.2 |
| M6 | 4.91 | 6.3 | 47.2 | 1.2 | 45.3 | 2.25 | 0.74 | 0.89 | 0.45 | 0.2 |
| M7 | 2.53 | 0.0 | 64.8 | 0.0 | 35.2 | 1.00 | 0.46 | 0.52 | 0.20 | 0.2 |
| M8 | 8.76 | 27.4 | 16.0 | 14.2 | 42.4 | 4.00 | 0.78 | 2.01 | 0.80 | 0.2 |
| M9 | 9.68 | 3.3 | 39.9 | 7.9 | 48.9 | 4.62 | 1.40 | 1.73 | 0.92 | 0.2 |
| M10 | 3.51 | 69.7 | 15.1 | 1.5 | 13.7 | 0.61 | 0.17 | 1.17 | 0.12 | 0.3 |
| M11 | 5.88 | 0.0 | 56.6 | 0.0 | 43.4 | 2.67 | 1.00 | 1.06 | 0.53 | 0.2 |
| M12 | 6.98 | 15.6 | 40.2 | 20.6 | 23.6 | 1.88 | 0.98 | 2.02 | 0.38 | 0.3 |
| M13 | 8.5 | 35.6 | 26.6 | 0.0 | 37.8 | 2.73 | 0.80 | 1.93 | 0.55 | 0.3 |
| M14 | 2.98 | 0.0 | 41.9 | 0.0 | 58.1 | 1.66 | 0.44 | 0.40 | 0.33 | 0.2 |
| M15 | 6.16 | 54.2 | 0.0 | 4.5 | 41.3 | 2.33 | 0.24 | 1.47 | 0.47 | 0.3 |
Table 5.
Simulated mean comprehensive runoff coefficient.
| Development Intensity | Upper-Middle | Middle | Lower-Middle | Low |
|---|---|---|---|---|
| Simulated runoff coefficient | 0.742 | 0.638 | 0.441 | 0.325 |
Table 6.
Runoff simulation results under different rainfall return periods.
| Return Period /year | Rainfall /mm | Scenario | Runoff Amount /mm | Runoff Coefficient | Runoff Reduction Rate |
|---|---|---|---|---|---|
| 0.5 | 37.286 | planning | 16.673 | 0.447 | 65.5% |
| Sponge City | 5.762 | 0.154 | |||
| 2 | 43.53 | planning | 20.111 | 0.462 | 59.5% |
| Sponge City | 8.137 | 0.187 | |||
| 5 | 47.659 | planning | 22.456 | 0.471 | 56.3% |
| Sponge City | 9.848 | 0.206 | |||
| 10 | 50.784 | planning | 24.268 | 0.478 | 54.6% |
| Sponge City | 11.209 | 0.221 |
Table 7.
Settings of model scenarios.
| Condition Setting | Present Scenario | Planning Scenario | Sponge City Design Scenario |
|---|---|---|---|
| Rainfall, evaporation | Annual average | ||
| Groundwater exploitation intensity | Present exploitation intensity | ||
| Proprotion of impermeable area (%) | 10.3 | 56.54 | 41.61 |
Table 8.
The groundwater budget under different scenarios. Unit: 108 m3.
| Groundwater Balance Items | Present Scenario | Planning Scenario | Design Scenario | |
|---|---|---|---|---|
| Discharge | Exploitation | 0.683 | 0.683 | 0.683 |
| Evaporation | 0.233 | 0.0017 | 0.2705 | |
| Lateral runoff | 0.4832 | 0.1497 | 0.3749 | |
| Recharge | Precipitation | 1.8477 | 0.5862 | 0.7007 |
| LID | 0 | 0 | 0.9764 | |
| River | 0.2104 | 0 | 0.1554 | |
| Lateral runoff | 0.0495 | 0.1471 | 0.0154 | |
| Total balance | 0.7084 | −0.1011 | 0.5195 | |
Publisher’s Note: MDPI stays neutral with regard to jurisdictional claims in published maps and institutional affiliations. |
© 2022 by the authors. Licensee MDPI, Basel, Switzerland. This article is an open access article distributed under the terms and conditions of the Creative Commons Attribution (CC BY) license (https://creativecommons.org/licenses/by/4.0/).
Share and Cite
MDPI and ACS Style
Meng, B.; Li, M.; Du, X.; Ye, X. Flood Control and Aquifer Recharge Effects of Sponge City: A Case Study in North China. Water 2022, 14, 92. https://doi.org/10.3390/w14010092
AMA Style
Meng B, Li M, Du X, Ye X. Flood Control and Aquifer Recharge Effects of Sponge City: A Case Study in North China. Water. 2022; 14(1):92. https://doi.org/10.3390/w14010092
Chicago/Turabian StyleMeng, Bo, Mingjie Li, Xinqiang Du, and Xueyan Ye. 2022. "Flood Control and Aquifer Recharge Effects of Sponge City: A Case Study in North China" Water 14, no. 1: 92. https://doi.org/10.3390/w14010092
Note that from the first issue of 2016, this journal uses article numbers instead of page numbers. See further details here.