
Accurate Storm Surge Prediction with a Parametric Cyclone and Neural Network Hybrid Model

1
Center of Excellence for Ocean Engineering, National Taiwan Ocean University, Keelung 20224, Taiwan
2
Department of Marine Environmental Informatics, National Taiwan Ocean University, Keelung 20224, Taiwan
*
Author to whom correspondence should be addressed.
Water 2022, 14(1), 96; https://doi.org/10.3390/w14010096
Submission received: 29 November 2021
/
Revised: 21 December 2021
/
Accepted: 1 January 2022
/
Published: 4 January 2022
(This article belongs to the Section Oceans and Coastal Zones)
Abstract
:Storm surges are one of the most devastating coastal disasters. Numerous efforts have continuously been made to achieve better prediction of storm surge variation. In this paper, we propose a parametric cyclone and neural network hybrid model for accurate, long lead-time storm surge prediction. The model was applied to the northeastern coastal region of Taiwan, i.e., Longdong station. A total of 14 historical typhoon events were used for model training and validation, and the results and questions associated with this hybrid approach carefully discussed. Overall, the proposed method reduced the complexity of network structure while retaining the important typhoon indicators. In particular, local pressure and winds estimated from the storm parameters through physically-based parametric cyclone models allow for inferring the possible future influence of a typhoon, unlike the simple collection and direct usage of observation data from local stations in earlier works. Meanwhile, the error-tolerance capability of the neural network alleviated some discrepancy in the model inputs and enabled good surge prediction. Further, the proposed method showed better and faster convergence thanks to the retention of storm information and the reduced dimensions of the search space. The hybrid model presented excellent performance or maintained reasonable capability for short lead-time and long lead-time storm surge prediction. Compared with the pure neural network model under the same network dimensions, the present model demonstrated great improvement in accuracy as the prediction lead time increased to 8 h, e.g., 33–40% (13–21%) and 32–37% (18–29%) RMSE and CE, respectively, in the training/validation phase.
1. Introduction
Storm surges caused by strong wind shear (i.e., wind setup) and pressure drop (i.e., pressure setup) of typhoons are one of the most devastating disasters in coastal areas [1]. As can be seen from historical records, storm surges have seriously threatened the property and lives of residents [2,3]; e.g., Hurricane Katrina invaded the city of New Orleans, U.S. in 2005 and led to 1836 deaths and USD 125 billion in economic losses and Typhoon Haiyan made landfall in the Philippines in 2013 and resulted in 6000 deaths. With rapid economic growth around the globe, the population in coastal regions worldwide is increasing and may reach upwards of 2–5 billion people by 2080 [4]. Meanwhile, under the influence of global warming and climate change, more catastrophic and hazardous coastal storm surges owing to record-breaking ‘super-typhoons’ can be expected [5,6]. Thus, numerous attempts have been made to date to accurately predict and/or assess variations in storm surges [7].
Two different types of tools are commonly used for storm surge prediction: (i) physically-based models, e.g., [8], and (ii) data-driven models, e.g., [9,10]. From the physical point of view, the hydrodynamics with their atmospheric driving forces are solved numerically in a set of computational meshes for modeling the fundamental components of storm surges [7,11,12]. Alternatively, various data-driven approaches utilize one or more parameters via empirical procedures and use those influences for efficient and accurate estimation of storm surges at a study site [9,13,14]. In particular, artificial intelligence methods which mimic biological neural cells show superior ability to learn the complicated rules and knowledge of nonlinear natural phenomena compared to conventional statistical regression [15]. For more details and excellent reviews, including the development progress and the respective advantages and disadvantages of different methods, readers may refer to the papers by Welander [8], Sheng et al. [11], Chao et al. [15], Heaps, [16], and Bode and Hardy [17]. Although several types of approaches have been applied, all previous study results indicate the key role of atmospheric forcing (i.e., wind/pressure) in successful storm surge prediction; e.g., the relative error between predicted and measured surge levels can be less than 10% or over 50% depending solely on whether the wind/pressure fields due to the magnitude or track of typhoons are described well or poorly [7,18].
In order to obtain the atmospheric conditions for storm surge modeling, three major tools are used: the real-time hurricane wind analysis system (H*Wind), numerical weather prediction models, and parametric cyclone models [19,20]. The first, combines observation data from aircraft, land/sea stations, and satellites to provide high-resolution measured wind fields for post-1996 hurricanes. However, the H*Wind system is only available for the North Atlantic [21,22,23].
The second, numerical weather prediction models operated by meteorological units, generate products of wind/pressure fields such as the NOAA/NCEP GFS (U.S. National Oceanic and Atmospheric Administration/National Center for Environmental Prediction Global Forecast System), the MM5 (Fifth-Generation Penn State/NCAR Mesoscale Model), and the ECMWF IFS (European Center for Medium-Range Weather Forecasts Integrated Forecasting System). With good accessibility and reliability, they have been widely applied to marine simulation and maritime activity as well as to safety assessments [19,24]. Nevertheless, the accuracy and uncertainty of model outputs as well as the associated computational expenses should be carefully considered before using comprehensive atmospheric information for practical applications [25,26,27].
The third tool, based upon dynamical meteorology, includes different parametric cyclone models such as the Rankine vortex model [28], sea, lake and overland surges from hurricanes (SLOSH) model [29,30], Holland model [31], and vortex simulation model [32]. The Rankine vortex model constructs the wind profile along the radius distance by specifying the maximum wind speed and the radius of the maximum wind. The Holland model is derived with the wind-pressure profile of Myers [33], with further consideration of the shape parameter [34]. Given a pressure drop between the typhoon center and ambient environment, the pressure profile presents a natural-logarithm increase along the radius distance. Accordingly, the wind profile shows a more realistic distribution. Emanuel [35] built a hurricane model using the thermal wind balance outside of the region of storm’s eyewall, convective neutrality in the vortex, and the entropy and momentum balance in the boundary layer. Overall, cyclone models specified with realistic measured storm parameters have been used to efficiently predict and hindcast storm surges [19,30,36,37,38,39,40,41], presenting comparable accuracy in their results to models obtaining driving force with full-physics atmospheric models [18,42].
Similarly, the atmospheric conditions are essential factors for data-driven storm surge prediction. For example, Lee [10] utilized artificial neural networks (ANN) to capture the nonlinear relationship between observed storm surges and local meteorological conditions with a one-hour lead time. Continuous efforts with focus on data selection (i.e., more items and length), data division (i.e., training, validation, and testing of data), network structure (i.e., number of hidden neurons), and learning parameters have been made in the attempt to achieve accurate and efficient ANN-based storm surge prediction [43,44,45,46]. Nevertheless, earlier studies have two critical issues: (i) limited lead-time, and (ii) black-box features. In general, the lead time considered in previous works was one hour. Note that the definition of so-called prediction lead-time (e.g., t + n hours) here is the time for storm surge prediction (n hour ahead) starting from the time (t) of available observation data points. If the same basis is set for comparison, the prediction lead-time for numerical modeling of storm surges would be the computational time step (with a typical value of some seconds or minutes determined by the Courant number). For the other aspect, inside the artificial neural networks complex ‘black box’ mathematical processes are often very difficult to interpret [47,48].
The two persistent puzzles mentioned above have been tackled in some recent studies. Kim et al. [49] noticed the practical demand required in the decisionmaking process and re-examined ANN approaches, successfully presenting predictions with longer lead times (e.g., 5, 12, and 24 h) for the after-runner storm surges at Tottori Coast, Japan. In particular, the ANN models learned and reproduced severe (100-year return period) surge events caused by three representative typhoons moving along a similar track. The same authors [15] later revisited the topic of storm surge prediction. In contrast to most previous works, their ANN model was constructed with effective input parameters (i.e., characteristic of typhoons) which were carefully determined by analogy to the physical modeling approach rather than conventional concepts (which are, e.g., simply based on available data items, trial and error, or correlation). Hence, the newly-developed ANN-based storm surge model showed good prediction performance for longer lead times ranging from 1 to 12 h. In addition, a knowledge extraction method was proposed to reveal the important messages inside the artificial brain through backwards tracking and forward exploration procedures, e.g., the roles and influnences of controlling parameters on storm surge. While a step forward has been made, the present study, inspired by the success of parametric cyclone models, e.g., Holland [31], suggests possible further improvements.
In this paper, the purpose is to develop a new hybrid parametric cyclone and neural network model for accurate long lead-time storm surge prediction. The basic concept is that the two components in the hybrid model, based upon different philosophies, would complement each other with respect to their inherent strengths and limitations [50,51]. With parametric cyclone models, some typhoon parameters (e.g., location, central pressure, wind speed, radius, forward speed, and direction) can be merged and transformed into fewer but more effective inputs (local pressure/wind) for better storm surge prediction. Particularly, through physically-based estimations, the complexity of the ANN structure can be reduced, giving lower dimensionality in the search space and possibly boosting the optimal solution during the training process. On the other hand, the error tolerance capability in the ANN may alleviate the estimation error and sensitivity of the parametric cyclone model. In the following, our work attempts to clarify the applicability and associated questions of this new idea, which to the best of the authors’ understanding has not yet been reported and fully discussed. In Section 2, the study site and data collection are described. Six popular parametric typhoon models along with an artificial neural network are considered and introduced in Section 3. The results and discussions of prediction performance and the improvement of different hybrid models are given in Section 4. Finally, the conclusions are presented in Section 5.
2. Description of Study Site and Data Collection
Taiwan, surrounded by the Taiwan Strait, South China Sea, Philippine Sea, and East China Sea, is an island country with a dense population and major economic activities in the coastal regions. Owing to its location (120–122° E and 21–25.5° N) in the northwest Pacific Ocean, an average of four typhoons affect Taiwan every summer and autumn season. The abnormal rise in seawater level induced by typhoons due to low central pressure and strong wind shear often occur together with abundant rainfall runoff, and may involve astronomical high tides as well. As a result, the so-called composite hazard (i.e., storm surges, coastal inundation, and mudflows) can occur, causing serious losses of life and property; e.g., losses of NTD 19.4 billion losses in agriculture, forestry, and fisheries during Typhoon Morakot in 2009, and losses of NTD 8 billion in Typhoon Sinlaku in 2008.
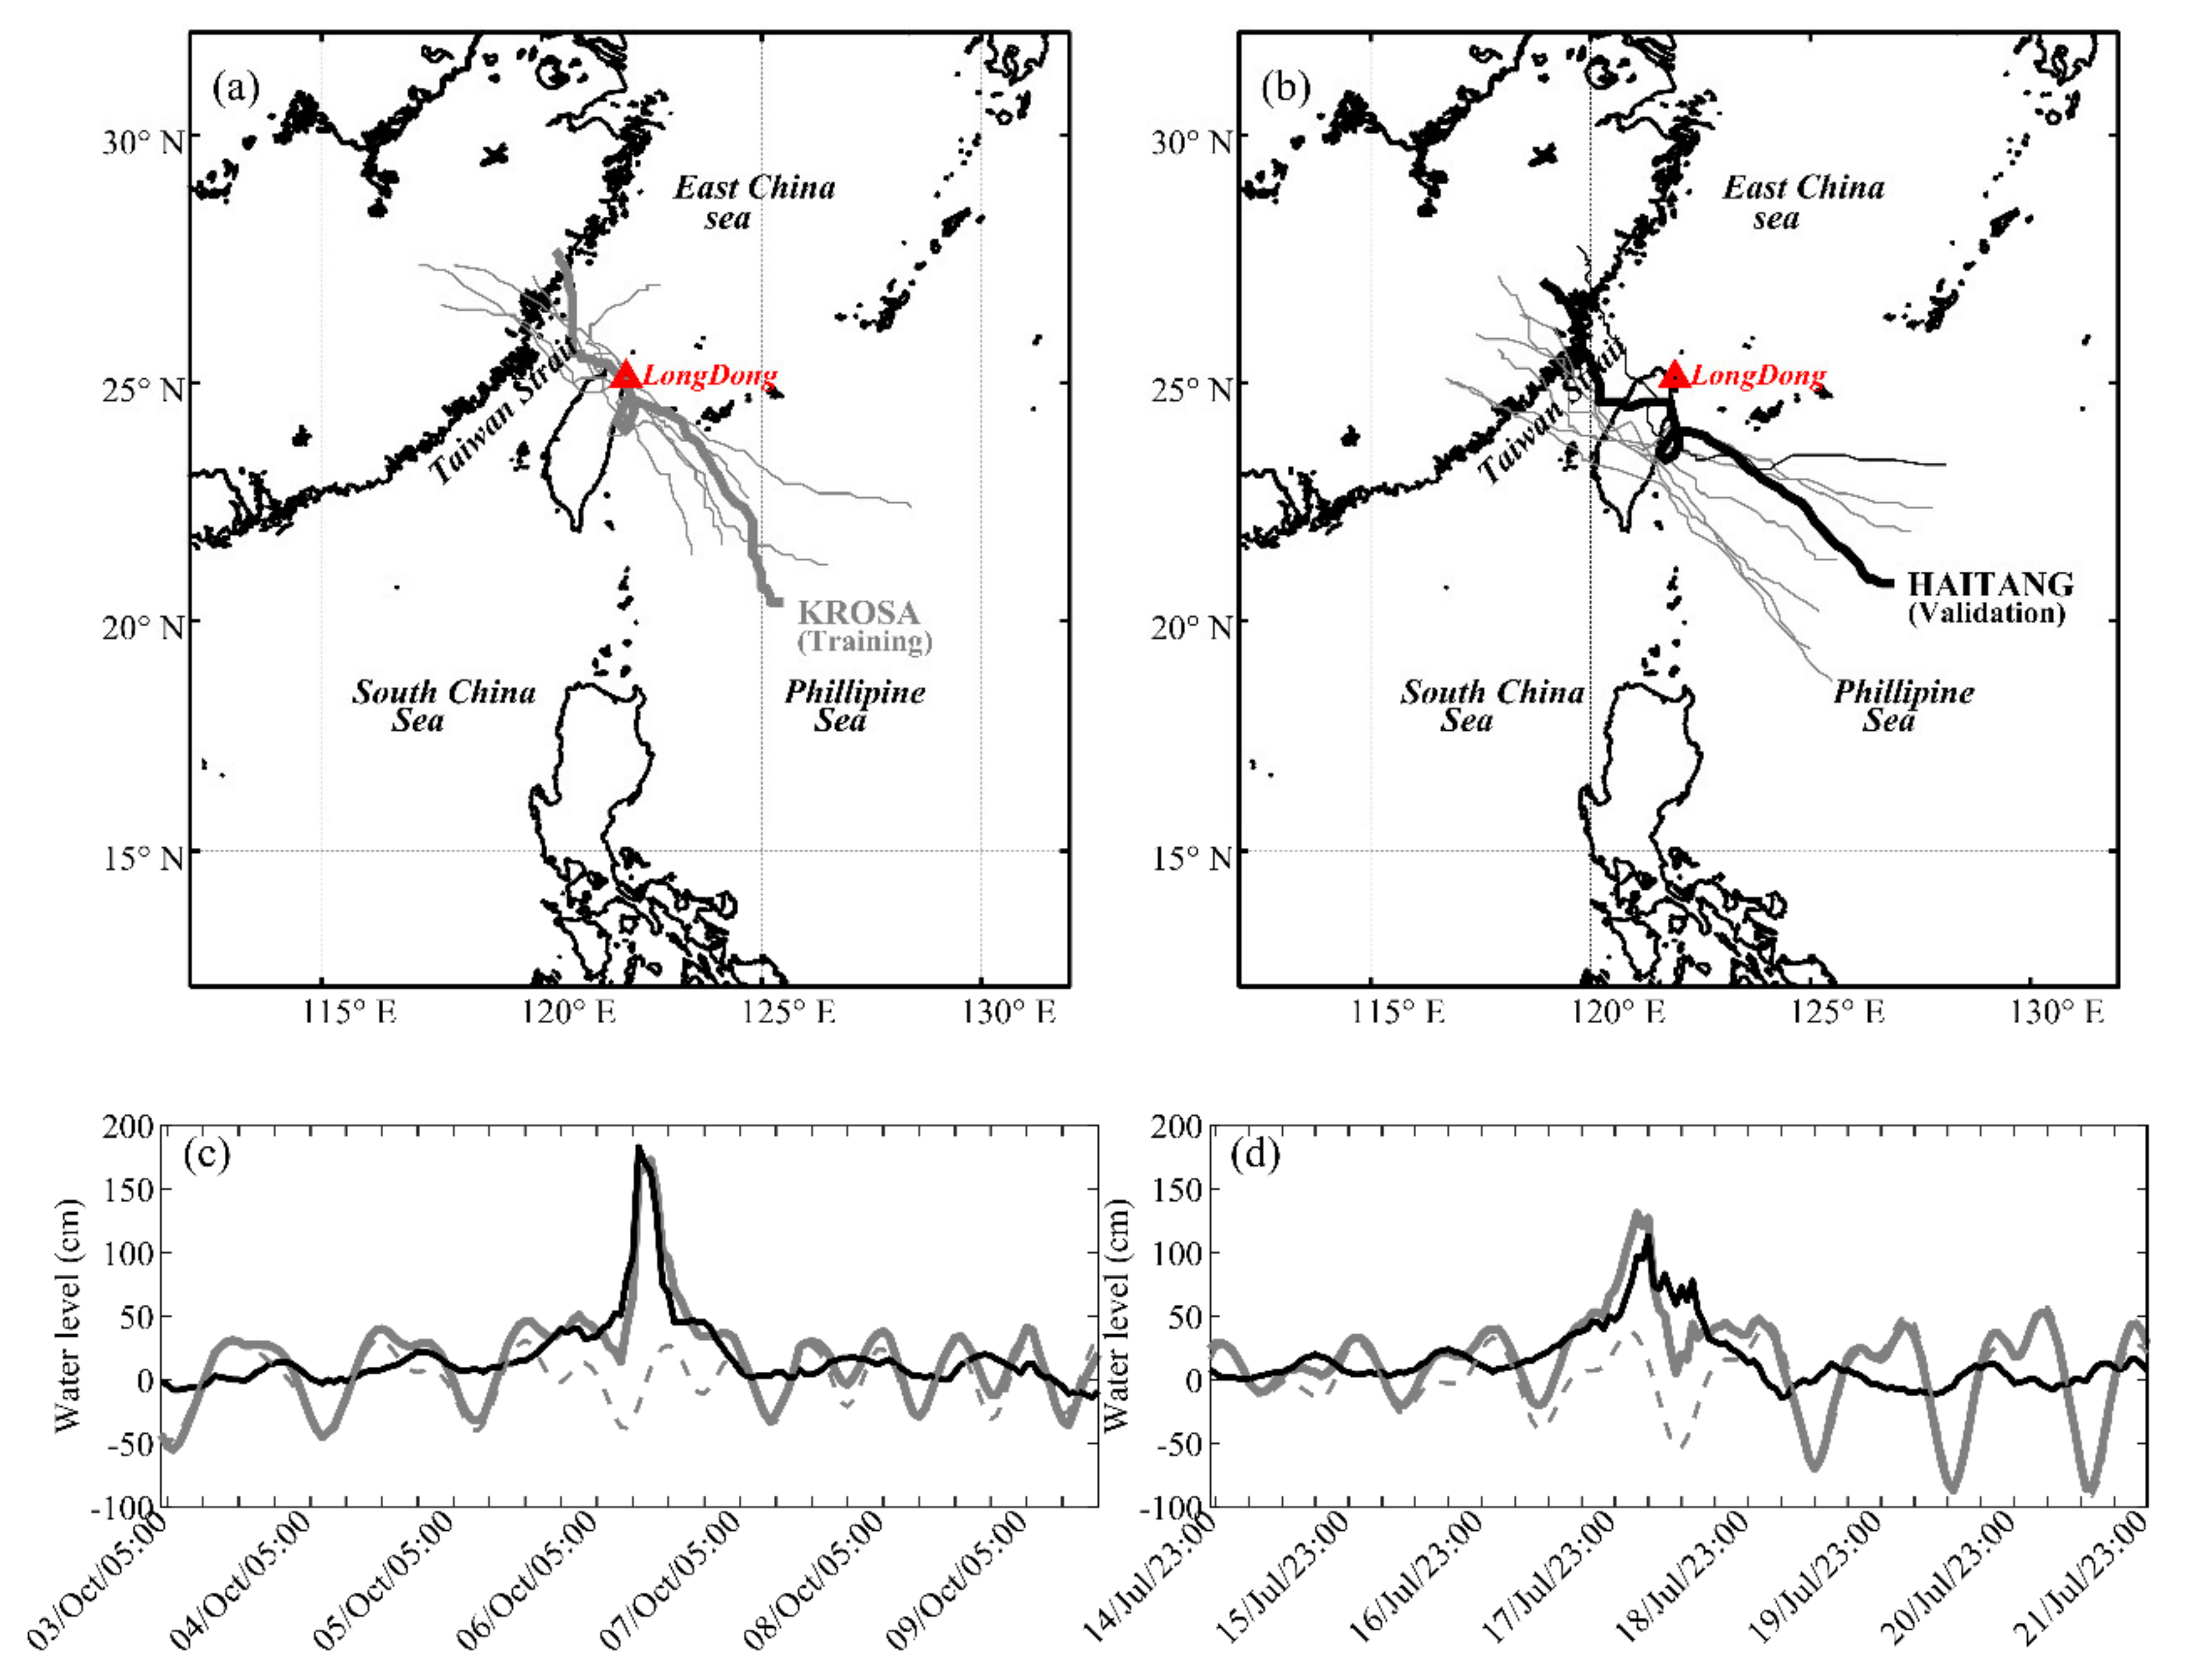
In this paper, the northeastern region of Taiwan was chosen as our study area. Several typhoons collected from Central Weather Bureau (CWB) traveling in tracks No. 2 and 3, with great impacts on storm surges in this area, were selected and are presented in Figure 1a,b, respectively. A total of 14 historical typhoon events (see Table 1) were considered, including Haitang (2005), Talim (2005), Longwang (2005), Bilis (2006), Kaemi (2006), Sepat (2007), Krosa (2007), Kalmegi (2008), Fungwong (2008), Morakot (2009), Soala (2012), Soulik (2013), and Matmo (2014). In recent years, fewer typhoons have influenced the northeastern coastal waters, possibly due to global changes in climate, and thus recent less significant typhoon events were not included in this study.
The tidal data from Longdong station (see red triangle in Figure 1) were collected from the Central Weather Bureau (CWB). Harmonic analysis [52] was utilized to separate astronomical tides from the data, providing the residual non-tidal signals against the meteorological tides (i.e., storm surges). The temporal variations in measured total water level (thick gray line) as well as the separation of the astronomical tide (thin gray line) and storm surge (black line) during Typhoon Krosa are shown in Figure 1c. Similar observation results during Typhoon Haitang are shown in Figure 1d. In summation, among several significant (i.e., surge deviation over 1 m) historical events, the largest (up to 1.8 m) was observed during Typhoon Krosa (Track No. 2, 2007). The typhoon and surge characteristics for all of the considered events are summarized in Table 1, including the central pressure (Pc), 10 min average maximum wind speed (Vc), radius of typhoon (R7), and maximum storm surge (S).
3. The Parametric Cyclone and Neural Network Hybrid Model for Storm Surge
3.1. Effective Controlling Parameter
As reported in the authors’ previous work [15], the effective controlling parameters can be selected by analogy with the physical modeling approach rather than by conventional concepts (e.g., available data items, trial and error, or correlation). From the viewpoint of hydrodynamics, storm surges are long waves which can be simulated by nonlinear shallow water equations [53]. From the algebraic point of view, numerical discretization can express water elevation η as a function of η, U, and V based on mass conservation. Similarly, through the discretized equation of motion, horizontal velocities U and V are functions of atmospheric pressure Pa and wind shear stress Fx and Fy (or wind speed components Wx and Wy) in the x- and y-directions. Therefore, after substitution, η at the next time step can be re-written as
3.2. Parametric Typhoon Model
In this study, the parametric typhoon models which consider the balance among pressure-gradient force, Coriolis force, and inertial force without friction (see Equation (2)) were considered to consolidate typhoon information for storm surge prediction:
where V represents the tangential speed of the parcel, R represents the radius of the circular path, f is the Coriolis deflection, ρ represents the density of air, and P is the pressure.
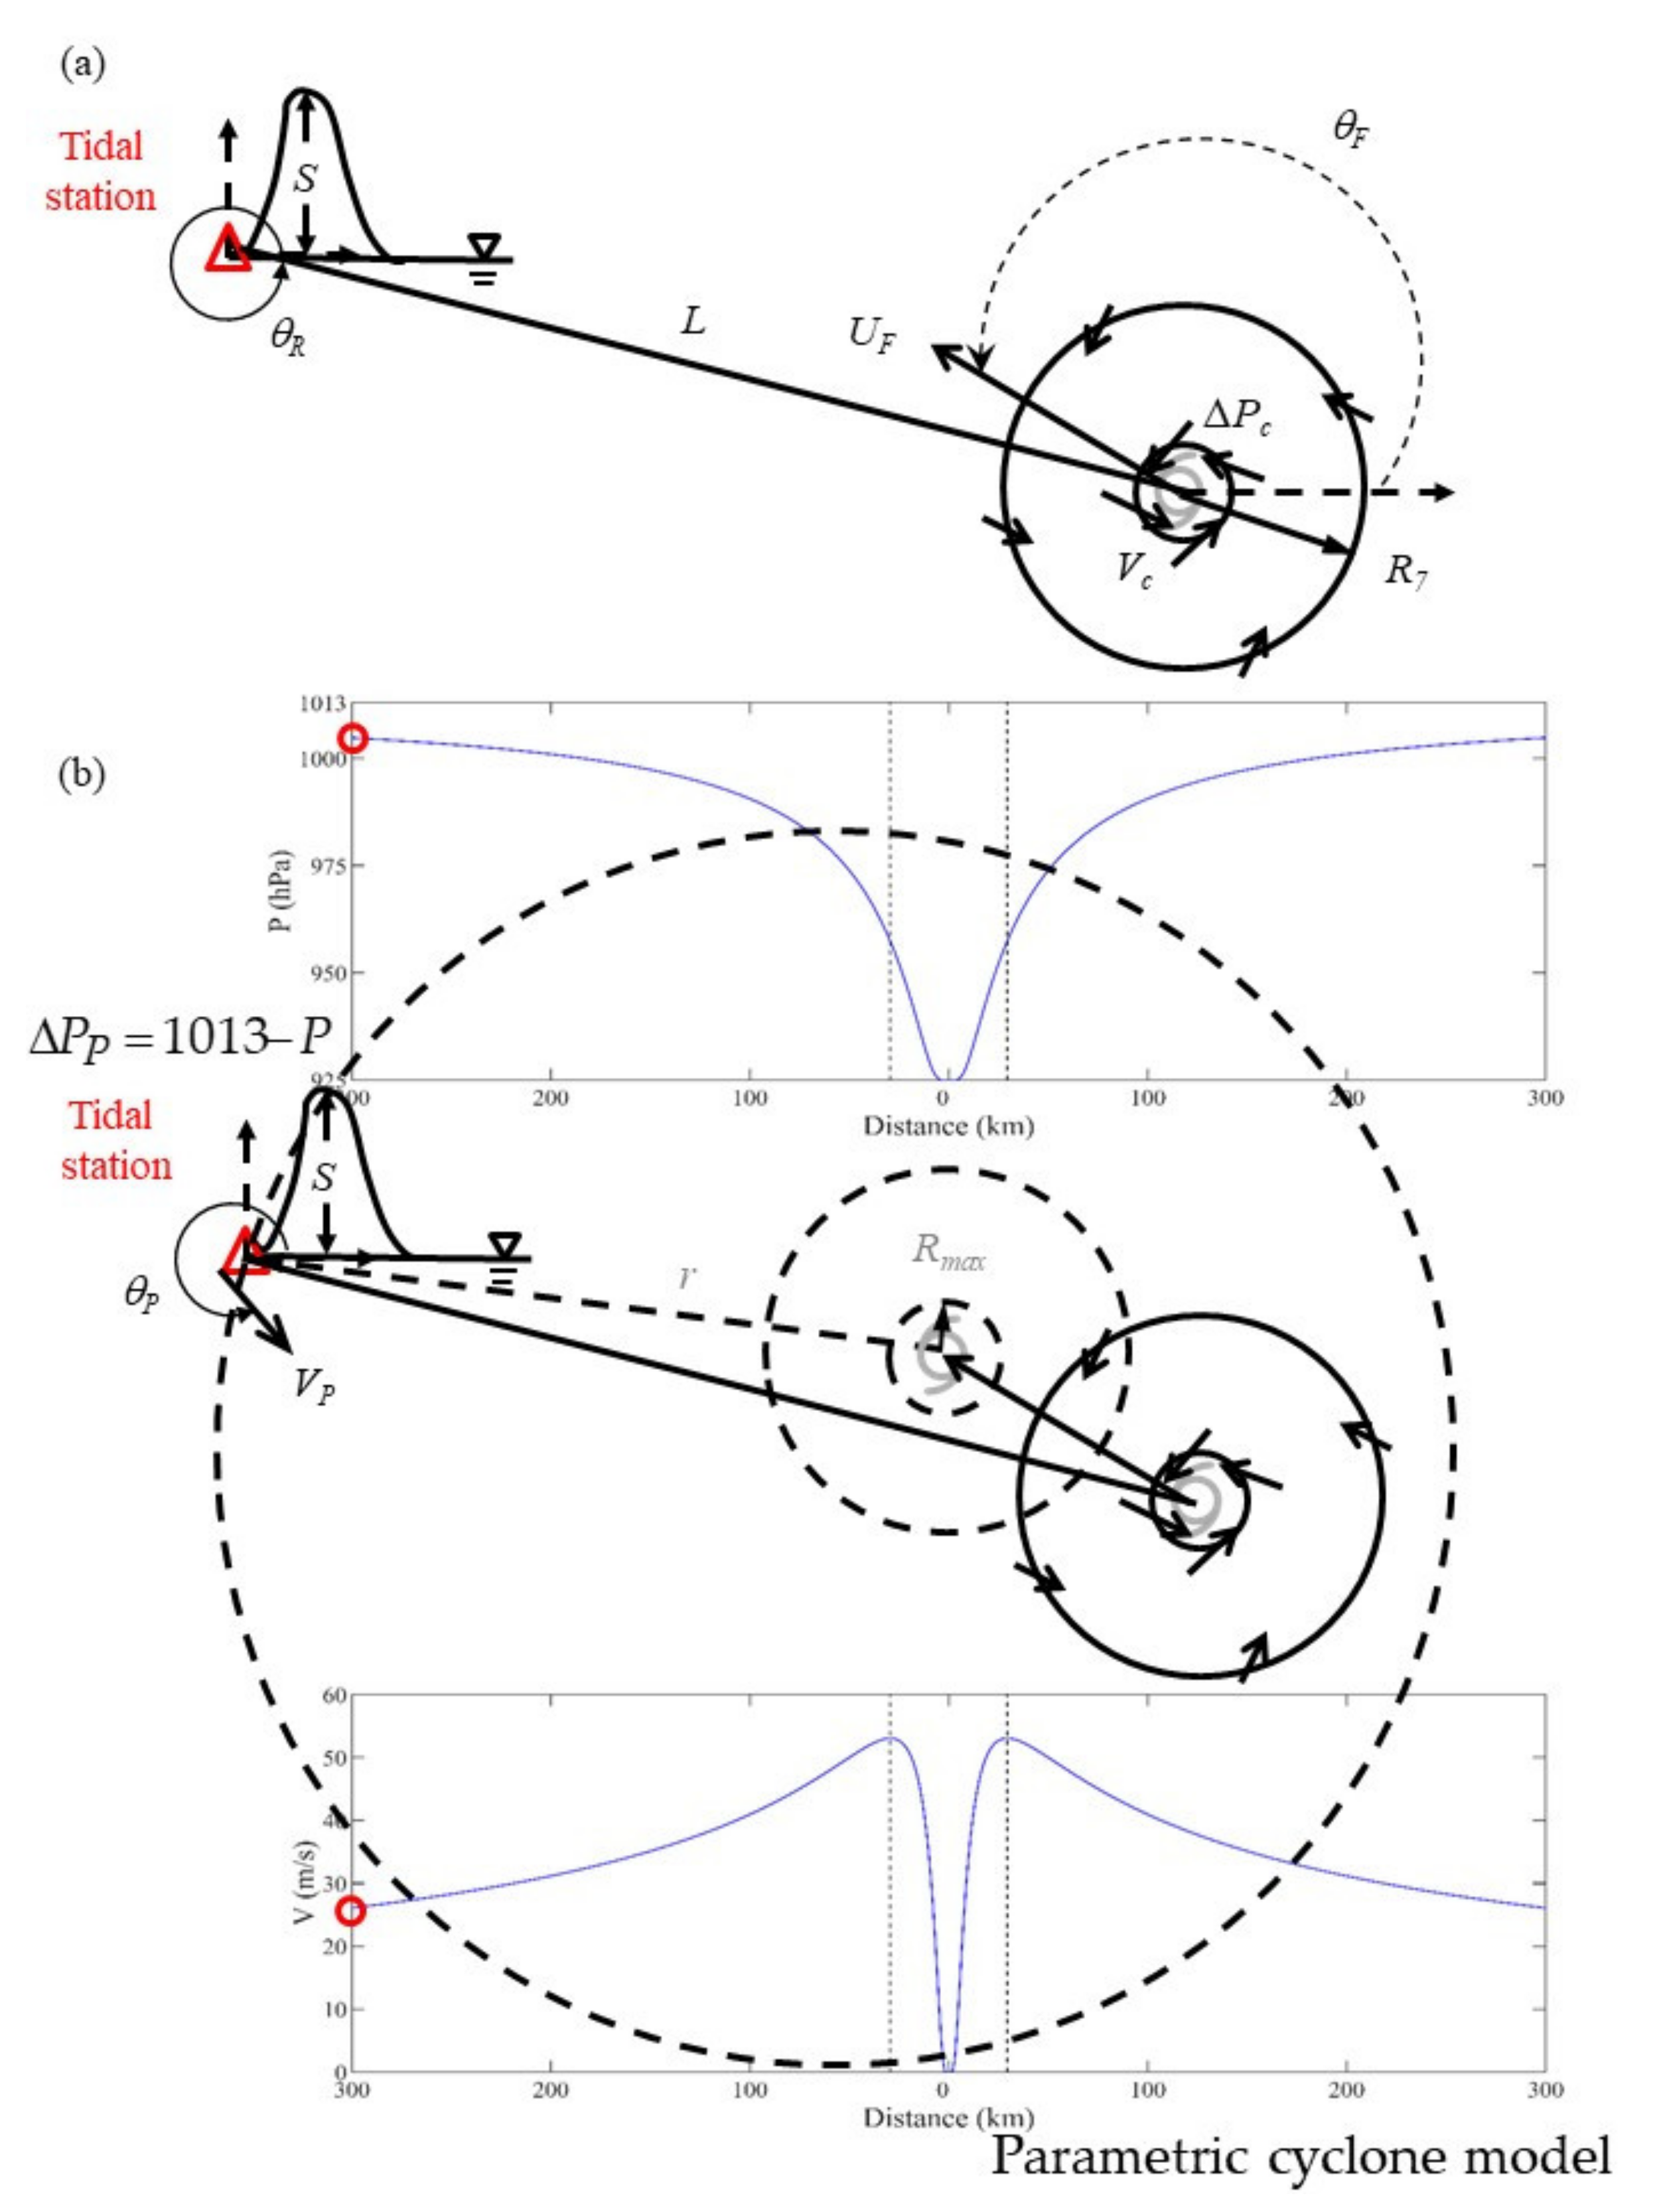
Using parametric typhoon models, the kinematic information (forward speed and direction) can be used to estimate a new typhoon center at a different lead time by a simple straight-line movement (which could be improved in a separate study), followed by the static information (e.g., central pressure and maximum wind speed) for estimation of local meteorological wind conditions, V(r). Additionally, note that the moving effect of a storm is considered to be
where Vasym is the asymmetric wind profile consisting of the gradient wind speed and progressing typhoon effect, VF is typhoon forward speed, and θc is the angle between Vasym and VF. In other words, both the static and kinematic typhoon parameters (i.e., the original eight inputs) can be combined and transformed into fewer but more effective ones, i.e., local pressure, wind speed, and wind direction together with storm surge at the tidal station (shown in Figure 2b). When only four input parameters were used, the structural complexity was reduced to enable better learning capability in lower dimensions. In the following, subsection, the six parametric cyclone models introduced and applied in this study are described.
- (1)
- Rankine Vortex Model (RM)
Depperman [54] utilized the classical Rankine vortex equation [55] to approximate tropical cyclone wind fields, i.e., the rotation of center regions such as a solid body or constant vorticity. The gradient wind distribution is described through the product of the ratio r/Rmax and Vmax, as shown in Equation (4):
where Vmax is the maximum wind speed, Rmax is the maximum radius of wind speed, r is the radial distance, and X is the scaling parameter that adjusts the velocity distribution in the radial direction [54]. As suggested by Rihel [56] and Emanuel [57], X is utilized at 0.5 in this study.
- (2)
- Holland Model (MH)
The pressure and wind speed distributions of the Holland model [23,31,58] were derived from the study of Myers [33]. The surface pressure field proposed by Schloemer [34] was improved by introducing the B parameter. The pressure and wind speed profiles are shown in Equations (5) and (6):
where ρ is the air density, f is the Coriolis parameter (f = 2Ω sinϕ, where Ω is the rotation of the Earth 7.292 × 10⁵ rad/s, and ϕ is the latitude), e is the base of the natural logarithm, and B is the shape of the parameter. Parameter B is derived from Equation (6) at the radius of the maximum gradient wind (i.e., r = Rmax and V = Vmax), as shown in the following equation [59]:
- (3)
- SLOSH Model
Houston and Powell [29] developed a wind profile for storm surge simulation using the SLOSH model. Validation of the proposed wind distribution against H*Wind analyses was carried out by Houston et al. [30]. The wind profile is shown below:
- (4)
- YSB Model
Young and Sobey [60] modified the outer part of the wind speed distribution from the Schloemer [34] profile (where r > Rmax). The equation for the wind profile was rewritten thusly:
- (5)
- Emanuel Model (E4)
Emanuel [35] built a physical tropical cyclone model based on the theoretical solution. The cyclone structure can be controlled by physical environmental parameters. Equation (10) presents the E4 wind profile:
where R0 is the outer radius at which the wind vanishes. The value of R0 can be defined as 400 km [42], ten times Rmax [61], or 1200 km [62] in different areas. In this study, R0 = 400 km was used. In addition, b, n, and m are the empirical parameters for controlling the shape of wind distribution. The commonly used values for b, n, and m are 0.25, 0.9, and 1.6, respectively [42,63].
- (6)
- Emanuel and Rotunno Model (E11)
Emanuel and Rotunno [64] proposed a constant Richard number in the storm outflow to improve the inner convective wind profile of the E4 model. The analytical gradient wind profile for V ≧ 0 was rewritten thusly:
3.3. Back-Propagation Neural Network (BPNN)
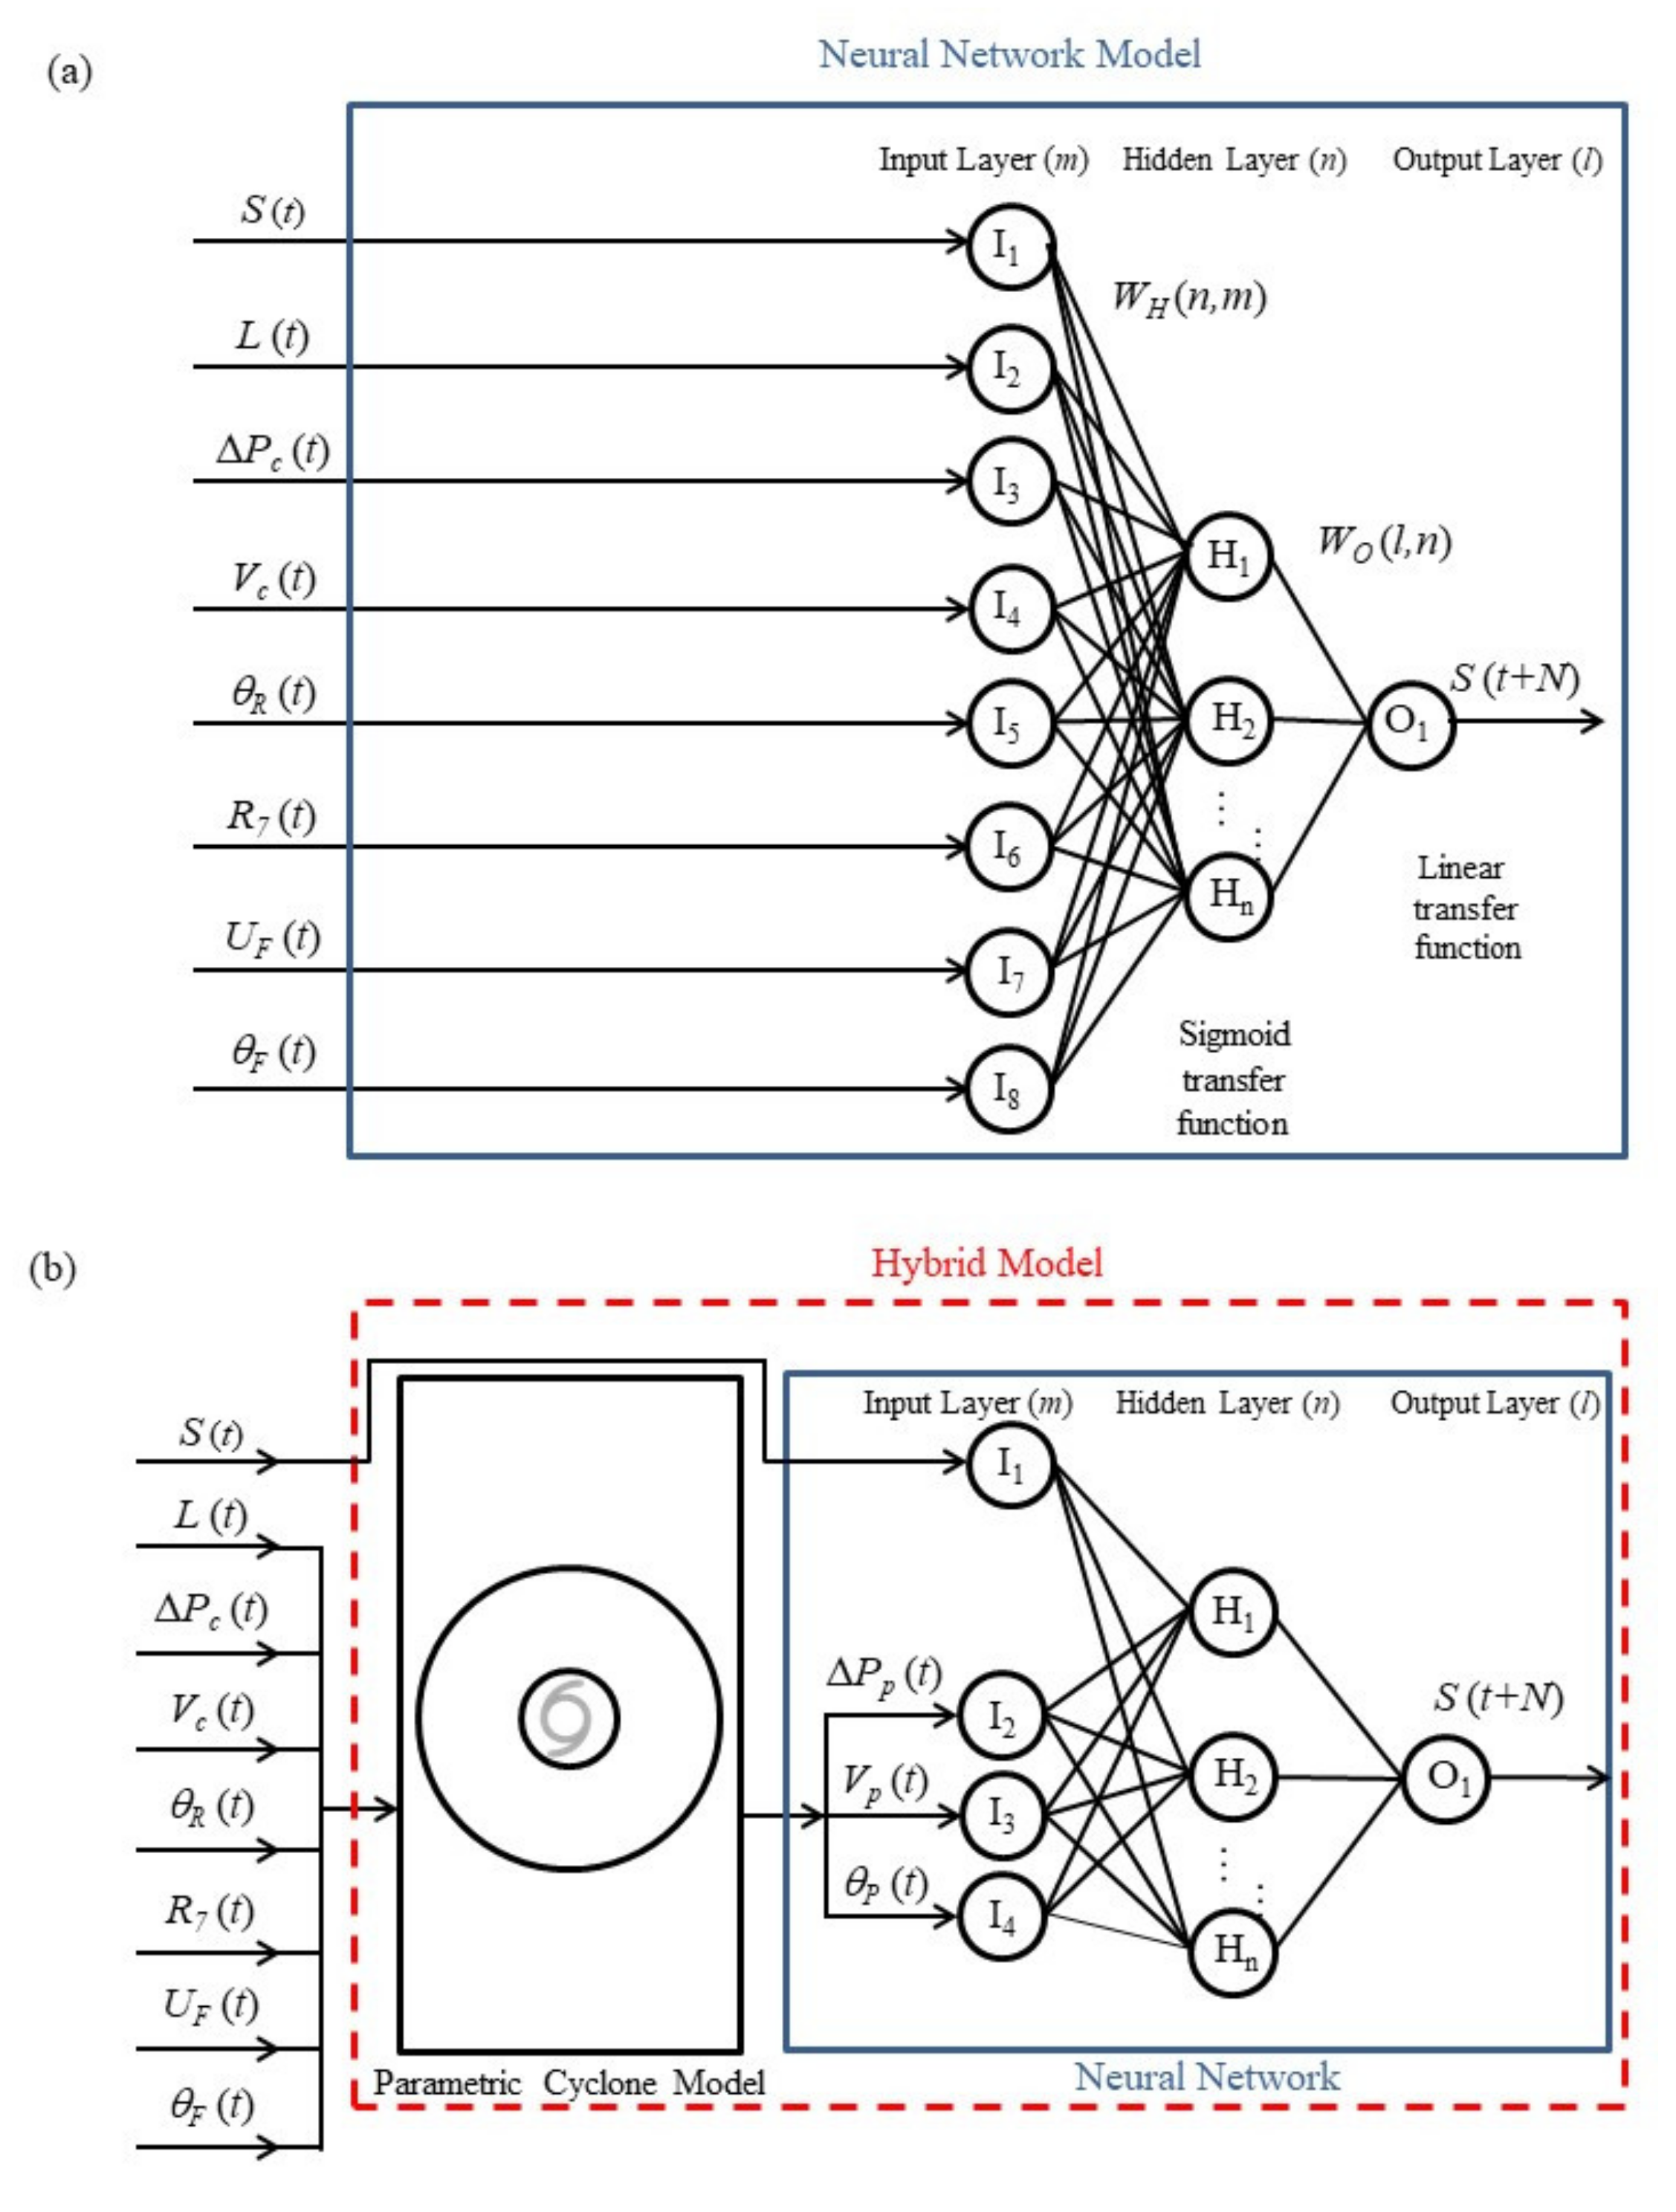
In this study, we applied a BPNN with a network consisting of input, hidden, and output layers (see Figure 3). The maximum or minimum of a given input parameter is defined as +1 and −1, respectively. The original data were normalized to correspond to this range. Subsequently, each hidden/output neuron received the weighting summation of inputs from the previous layer and transformed them into a provisional or final output signal by an activation function, i.e.,
where Im is the normalization input of neuron m, Hn is the provisional signal of neuron n, OI is the final output signal of neuron I, , , , and are the weight and bias matrices, and the hyperbolic tangential sigmoid and linear transfer functions are employed in the hidden and output layers, i.e., f (x) = [2/(1 + e−2x)] − 1 and f (x) = x.
The training process of a neural network continually updates the weights and biases to minimize the cost function, CNN (see Equation (13)) by back-propagation of error (i.e., el = Tl − Ol, where Tl is the target) until the maximum iteration or required accuracy is achieved, i.e.,
where P is the total number of inputs. The Levenberg–Marquardt learning algorithm, which combines the Gauss–Newton and steepest descent approaches, was utilized to achieve fast (second-order) convergence [65], i.e.,
where H = JT J is the approximated Hessian matrix, I is the identity matrix, G = JT e is the gradient, J is the Jacobian matrix that contains first derivatives of the network error e with respect to the weights and bias, and the parameter μ controls the magnitude and direction of each update.
The structure of the parametric cyclone and neural network hybrid model for storm surge prediction is shown in Figure 3. For the hidden layer, eight neurons were employed in all cases to achieve reasonable accuracy and avoid overfitting. As can be seen, unlike the purely data-driven neural network model in previous work [15], the dimensionality of the present approach was greatly reduced. In order to clearly evaluate prediction performance, the original model with four and eight inputs and the new hybrid models based on the inputs from various wind profiles were compared (see the summary of the input parameters of each case in Table 2). The overall flow chart of the proposed hybrid model is shown in Figure 4.
Finally, in order to assess prediction performance, the root mean square error (RMSE), coefficient of correlation (CC), and coefficient of efficiency (CE) were considered:
where N is the total number of data points, Sm and So are the modeled and observed surges, respectively, and the overbar indicates the mean value.
4. Results
Storm surge predictions for Longdong (northeast of Taiwan) based on the proposed parametric cyclone and neural network hybrid model (i.e., S, ΔPp, Vp, θp) are presented in this section. The lead time for the predictions ranges from t + 1 to t + 8 h. Note that Typhoon Haitang (2005) and Typhoon Morakot (2009), which had strong effects on storm surges, were chosen for model validation, while the others among the 14 historical typhoon events were used for training. Consideration of these cases was intended to enable the model to describe both mild and severe events. For comparison, results from the purely data-driven neural network model [15] with eight effective parameters (i.e., S, ΔPc, Vc, L, R7, θR, UF, and θF) and four effective parameters (i.e., S, ΔPc, Vc, and θR) are also included in Section 4.1; see Table 1. For the purpose of brevity, only two representative cases with severe storm surges (S > 100 cm) are shown below Typhoons Krosa (training) and Haitang (validation). In addition, the influences of the typhoon parameters and the estimated local pressure/wind can be clearly examined. Section 4.2 provides the prediction results for the proposed hybrid model; two scatter plots are used to demonstrate the prediction capability of the model for all training and validation events.
4.1. Results of the Pure Neural Network Model
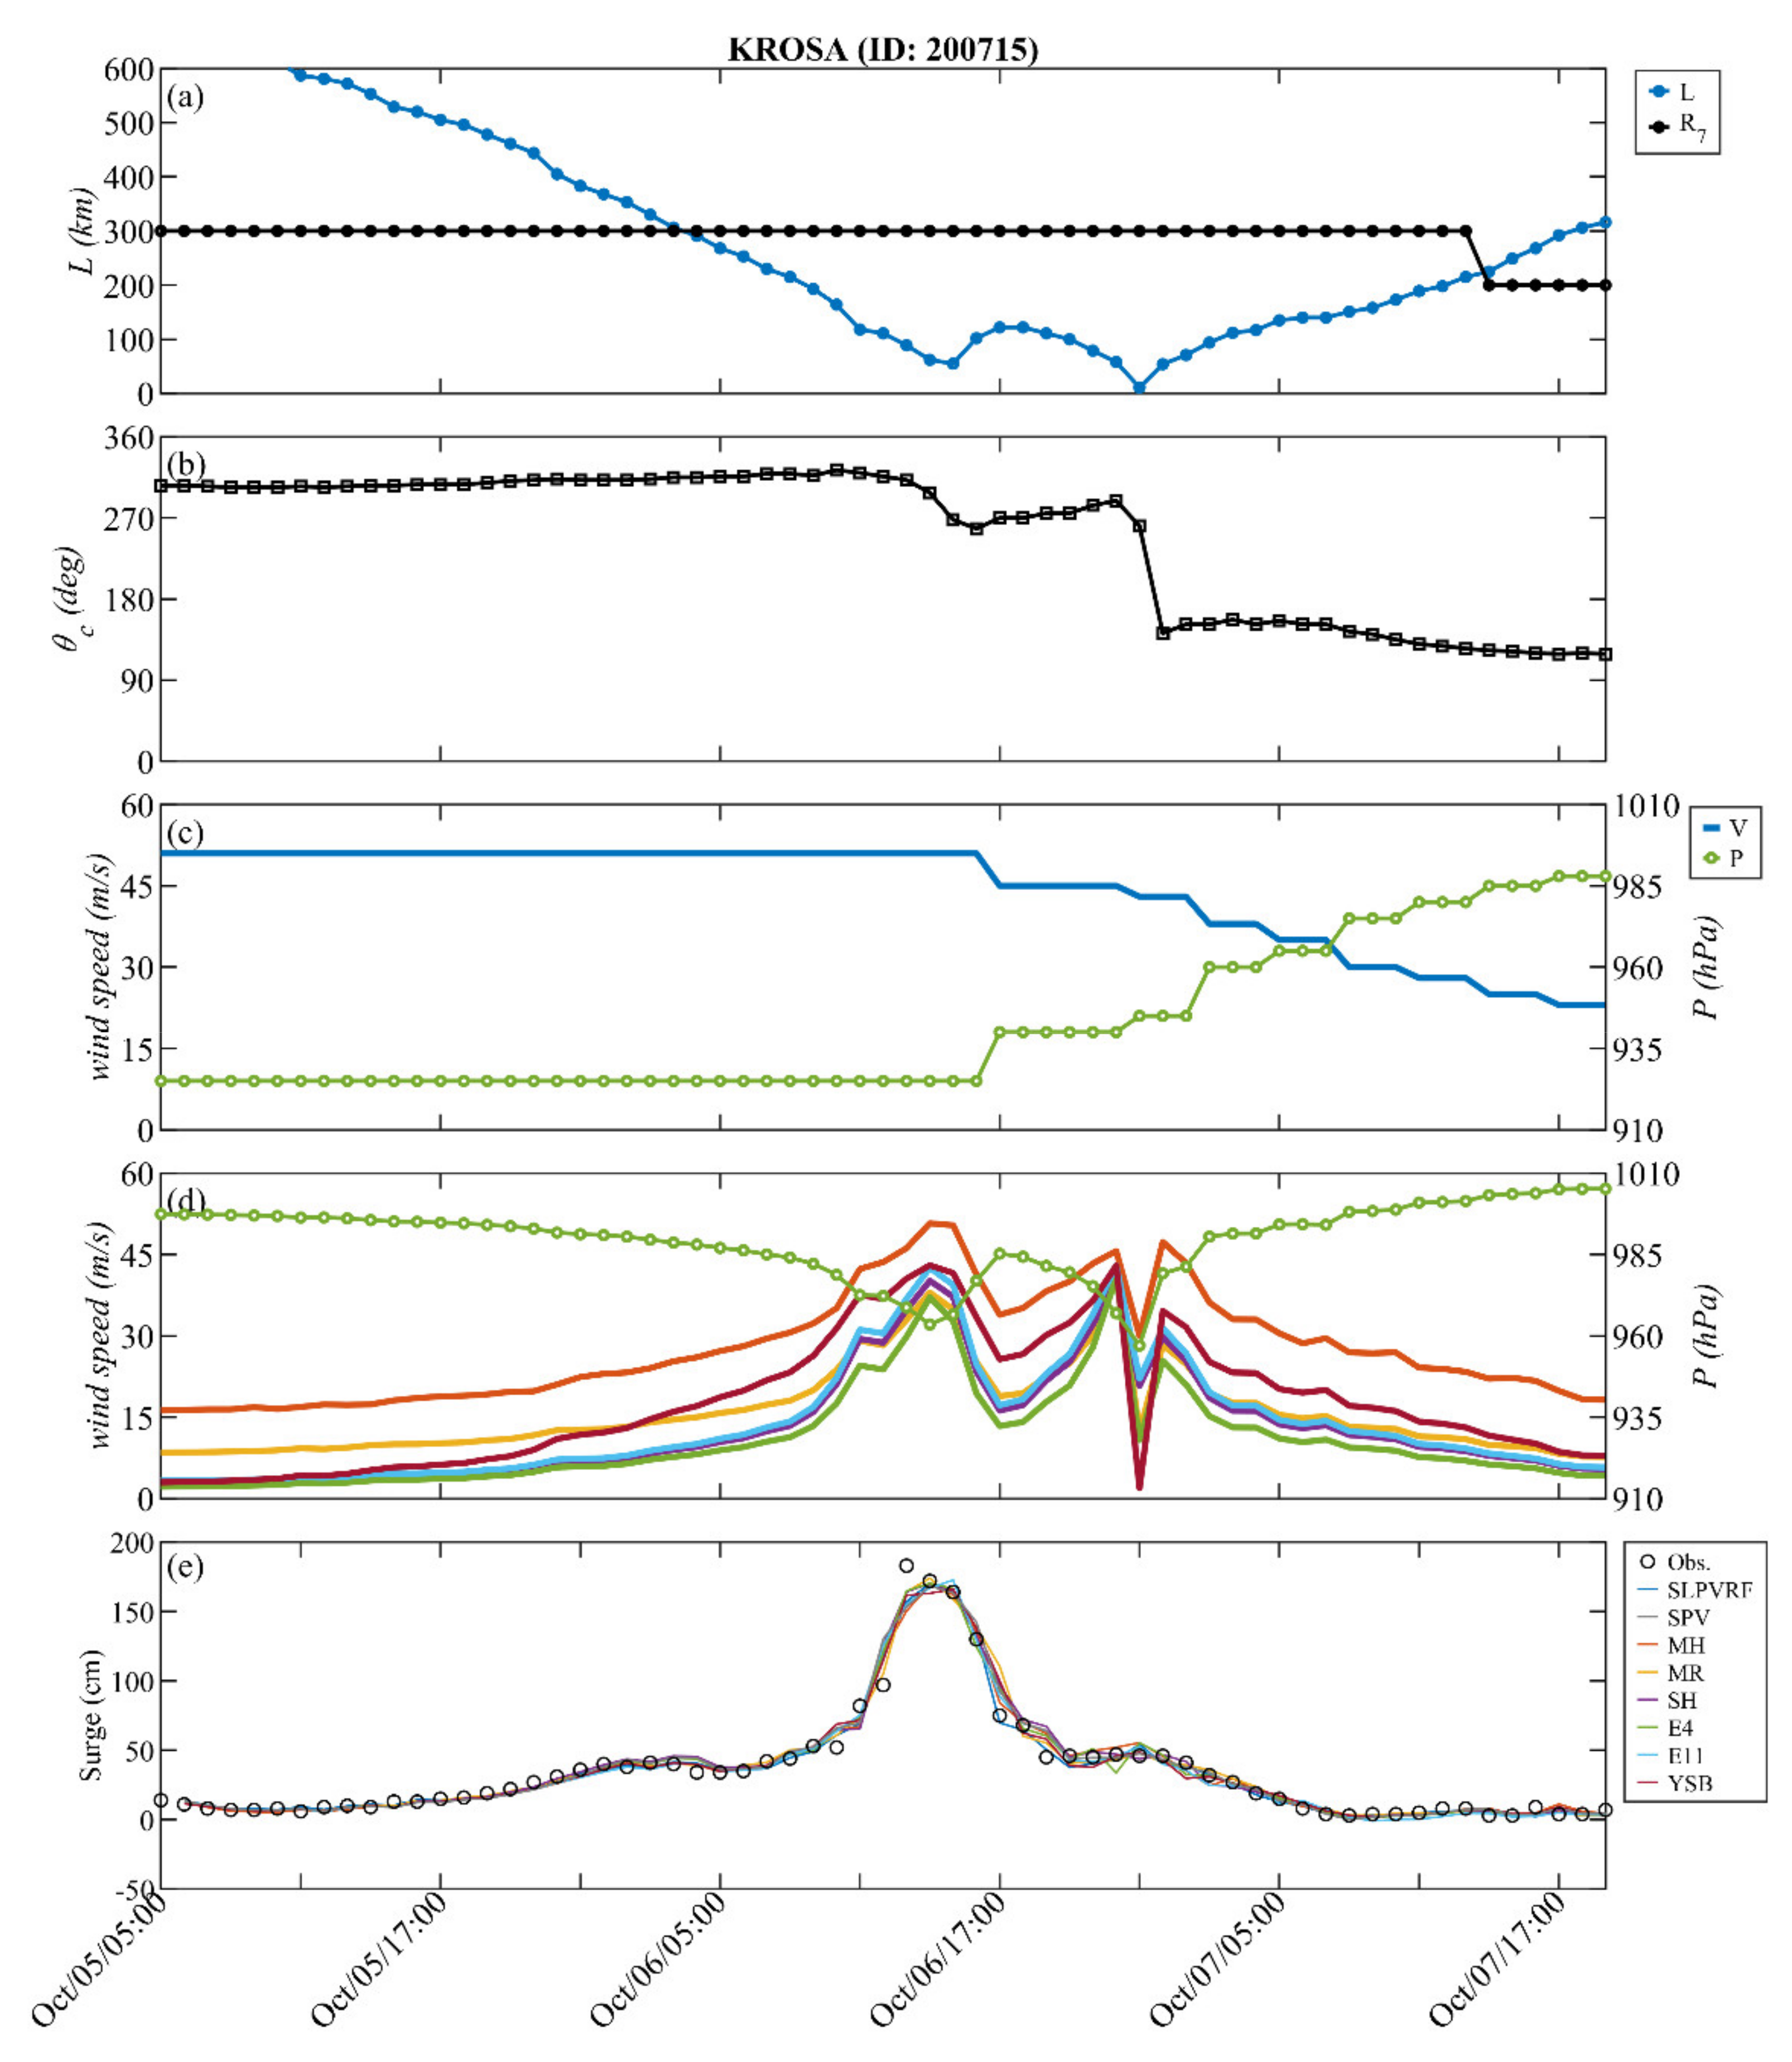
Figure 5 shows the temporal variation of storm surge deviation (e) and effective controlling parameters during Typhoon Krosa, including the relative angle (a), distance (b), radius of the storm (b), central pressure (c), and maximum wind speed (c). Forward speed and direction (not shown in Figure 5) were calculated using two successive center locations of the storm. In the beginning (see Figure 1), the typhoon was located roughly 600 km southeast of Longdong (i.e., the relative angle was ~300°). Krosa had a notably low central pressure of 925 hPa (i.e., ΔPc = 1013 − Pc = 88 hPa) and strong wind speed, up to 51 m/s, with a large storm radius of 300 km. As Krosa moved to the northwest towards Taiwan and made landfall, the track with a loop (approximately at 18:00 on 6 October 2007) can be found due to the topographic effect [66]. In this period, the structure of Krosa was destroyed, resulting in a weakened central wind speed and pressure deficit. For the storm surge, the mean water level in the coastal region was obviously affected, as the distance between the typhoon center and Longdong was smaller than the radius of storm. While Krosa was located at a distance of 50 km, near the station, a significant surge of up to 1.8 m was generated. Later, the surge deviation decreased gradually. In general, the one-hour-ahead predictions using the pure/single neural network models and observation are in excellent agreement (see Figure 5e). The models with either SLPVRF (blue line) or SPV (gray line) parameters accurately capture both the rising/falling pattern and the peak of the storm surge, with RMSE = 5.57 and 7.67 cm, CC = 0.990 and 0.982, and CE = 0.980 and 0.963, respectively; see Table 3.
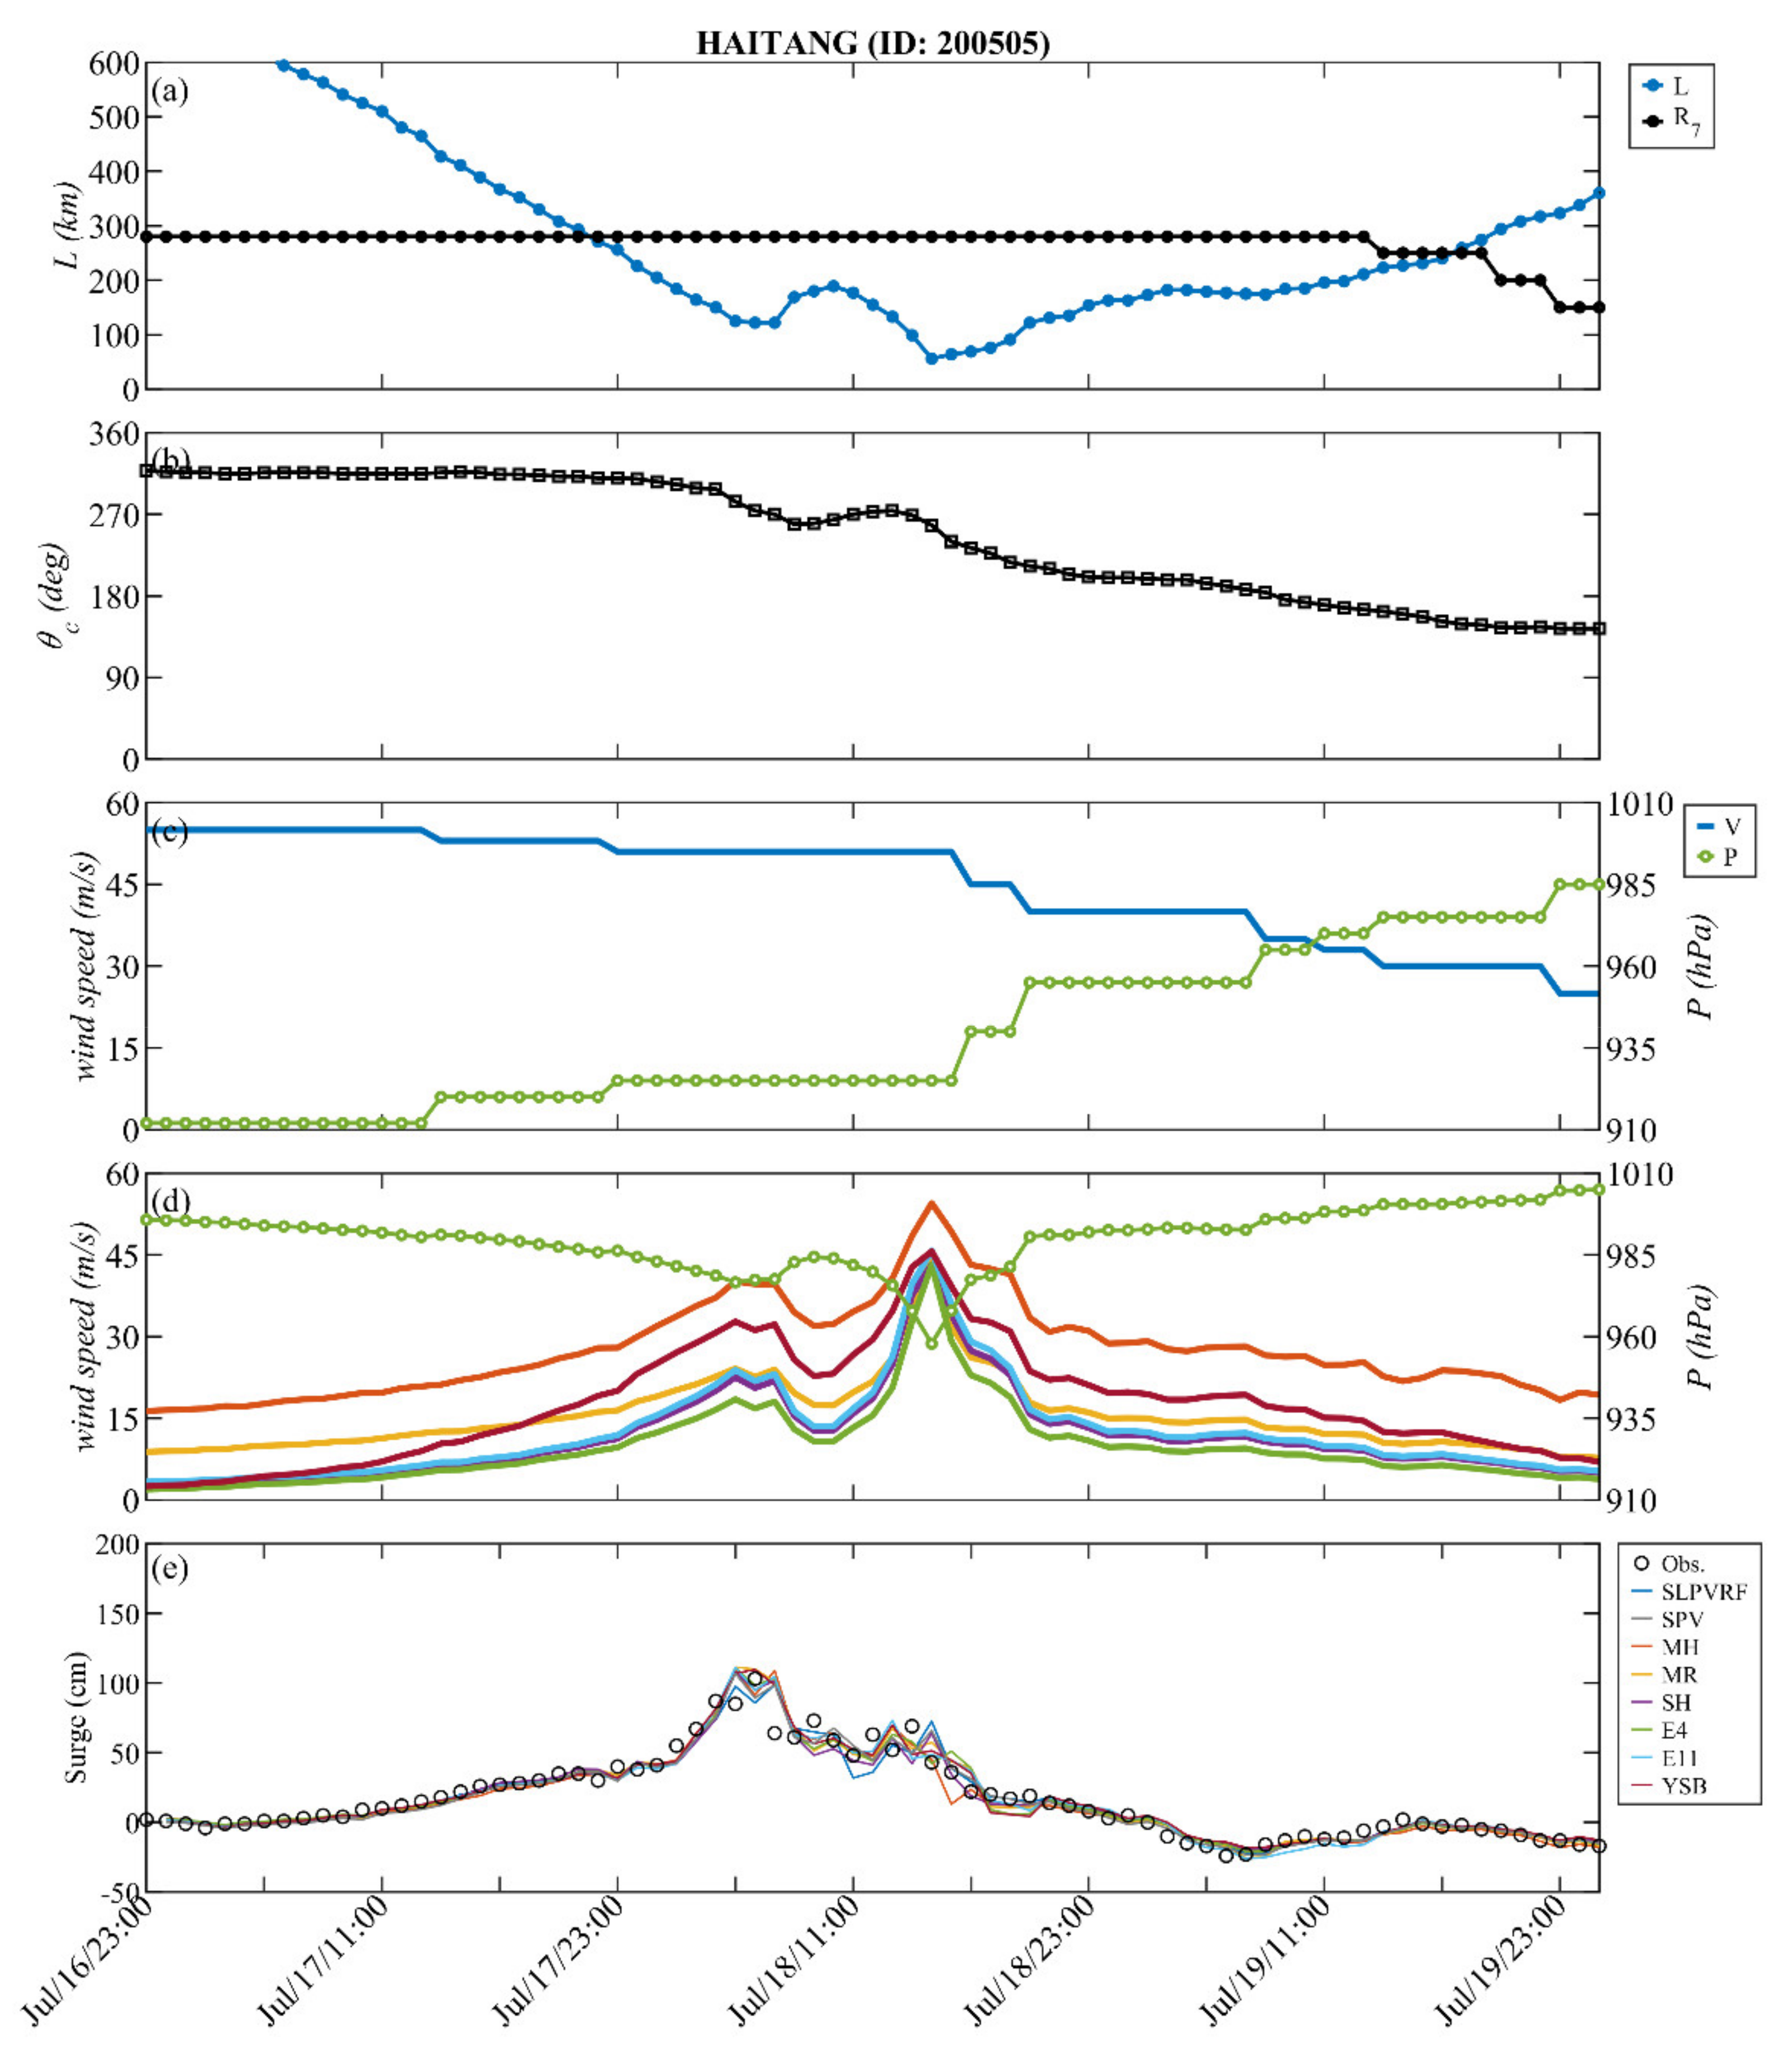
Similar results for the validation event (i.e., Typhoon Haitang) are presented in Figure 6. The central pressure, maximum wind speed, and radius of Haitang were 910 hPa, 55 m/s, and 280 km, respectively. In comparison with Krosa, Haitang had a higher intensity and induced a smaller storm surge (103 cm) at Longdong station. The reason for this was due to the much longer distance between the center location of Haitang and Longdong station. In the one-hour-ahead predictions, the fully-trained neural network models (using SLPVRF and SPV) demonstrate their good generalization capabilities, e.g., RMSE = 8.30 and 8.07 cm, CC = 0.959 and 0.964, and CE = 0.919 and 0.924, respectively; see Table 4.
Further, Figure 7 depicts storm surge predictions during Typhoon Krosa (training) with longer lead times, from t + 2 to t + 8 h. With eight effective controlling parameters (SLPVRF), the pure/single neural network model successfully predicted the peak surge caused by Krosa in four-hour-ahead prediction (see the blue lines in Figure 7c); i.e., RMSE = 11.64 cm, CC = 0.959, and CE = 0.916. Reasonable prediction accuracy was maintained as the lead time increased to 8 h, i.e., RMSE = 15.47 cm, CC = 0.927, and CE = 0.857. If a reduction in structure complexity was desired, when considering only four input parameters (i.e., storm surge, central pressure deficit, max. wind speed, and relative angle) the model (SPV) was not able to clearly describe the relationship between the typhoon characteristics and the storm surge at the tidal station. Prediction ability decreases dramatically with increased lead time. For the eight-hour-ahead prediction, poor performance was found, with the statistical indices RMSE = 24.85 cm, CC = 0.802, and CE = 0.630; see Table 3.
Figure 8 shows the long lead-time prediction results for Typhoon Haitang (validation). The single neural network model with full consideration of the effective controlling parameters (SLPVRF) was able to capture the peak value and overall variation of storm surge fairly well (see blue lines), even in longer lead time conditions (e.g., 8 h). The statistical indices, RMSE, CC, and CE, were 15.81 cm, 0.850, and 0.725, respectively; see Table 4. With a less complicated network structure, SPV, the model was reasonably able to describe the gradual variation of the storm surge in the four-hour-ahead prediction, unlike the false predicted humps during the rapidly rising period (e.g., 05:00 on 6 October 2007) present for the Krosa event. Overall, the statistical indices of prediction performance were RMSE = 16.47 cm, CC = 0.852, and CE = 0.690. As the lead time increased to 8 h, the prediction capability of the SPV model decreased to RMSE = 19.74 cm, CC = 0.847, and CE = 0.570.
4.2. Results of the Parametric Cyclone and Neural Network Hybrid Model
Figure 5 presents the results obtained with the proposed hybrid model. The estimated pressure and winds at the local station for storm surge prediction with the parametric cyclone models can be seen in Figure 5d. In terms of space, the pressure deficit and wind speed are inversely proportional to the relative distance. For temporal variation Figure 5d), therefore, the local pressure was close to the ambient pressure, and was gradually influenced by Krosa. Similarly, the wind speed at Longdong was quite low, then increased when typhoon Krosa moved near the station to a distance of 55 km. The estimated wind speed, 45 m/s, was in reasonable agreement with the observed data; see 6 October 15:00. Note that sharp variations in wind speed, e.g., from 45 m/s down to almost 0 m/s, were due to the looped track and passage of storm center. Overall, good consistency among various parametric cyclone models was found, with the exception of the MH model (orange lines), which showed a noticeably different magnitude and patterns, mainly due to the effects of the shape parameter. Although there was discrepancy in the model inputs, interestingly, the proposed approach with error-tolerance ability in the neural network enables good one-hour-ahead predictions, i.e., RMSE = 6.35–7.06 cm, CC = 0.984–0.987, and CE = 0.969–0.974; see Table 3. Similar results for the validation event (Typhoon Haitang) are presented in Figure 6. The estimated local wind speed showed a smaller first peak at 05:00 and a larger second peak at 15:00 on 18 July. The water level rose in response to 103 cm, while decreasing to 50 cm owing to the directional effects of the wind (i.e., onshore or offshore wind). In the validation phase, excellent one-hour-ahead prediction results were again obtained, with RMSE = 8.03–8.67 cm, CC = 0.955–0.964, and CE = 0.911–0.924, respectivelya as shown in Table 5. Overall, the parametric cyclone models provided reasonable estimations of local pressure and wind, which had a good relation to the storm surge.
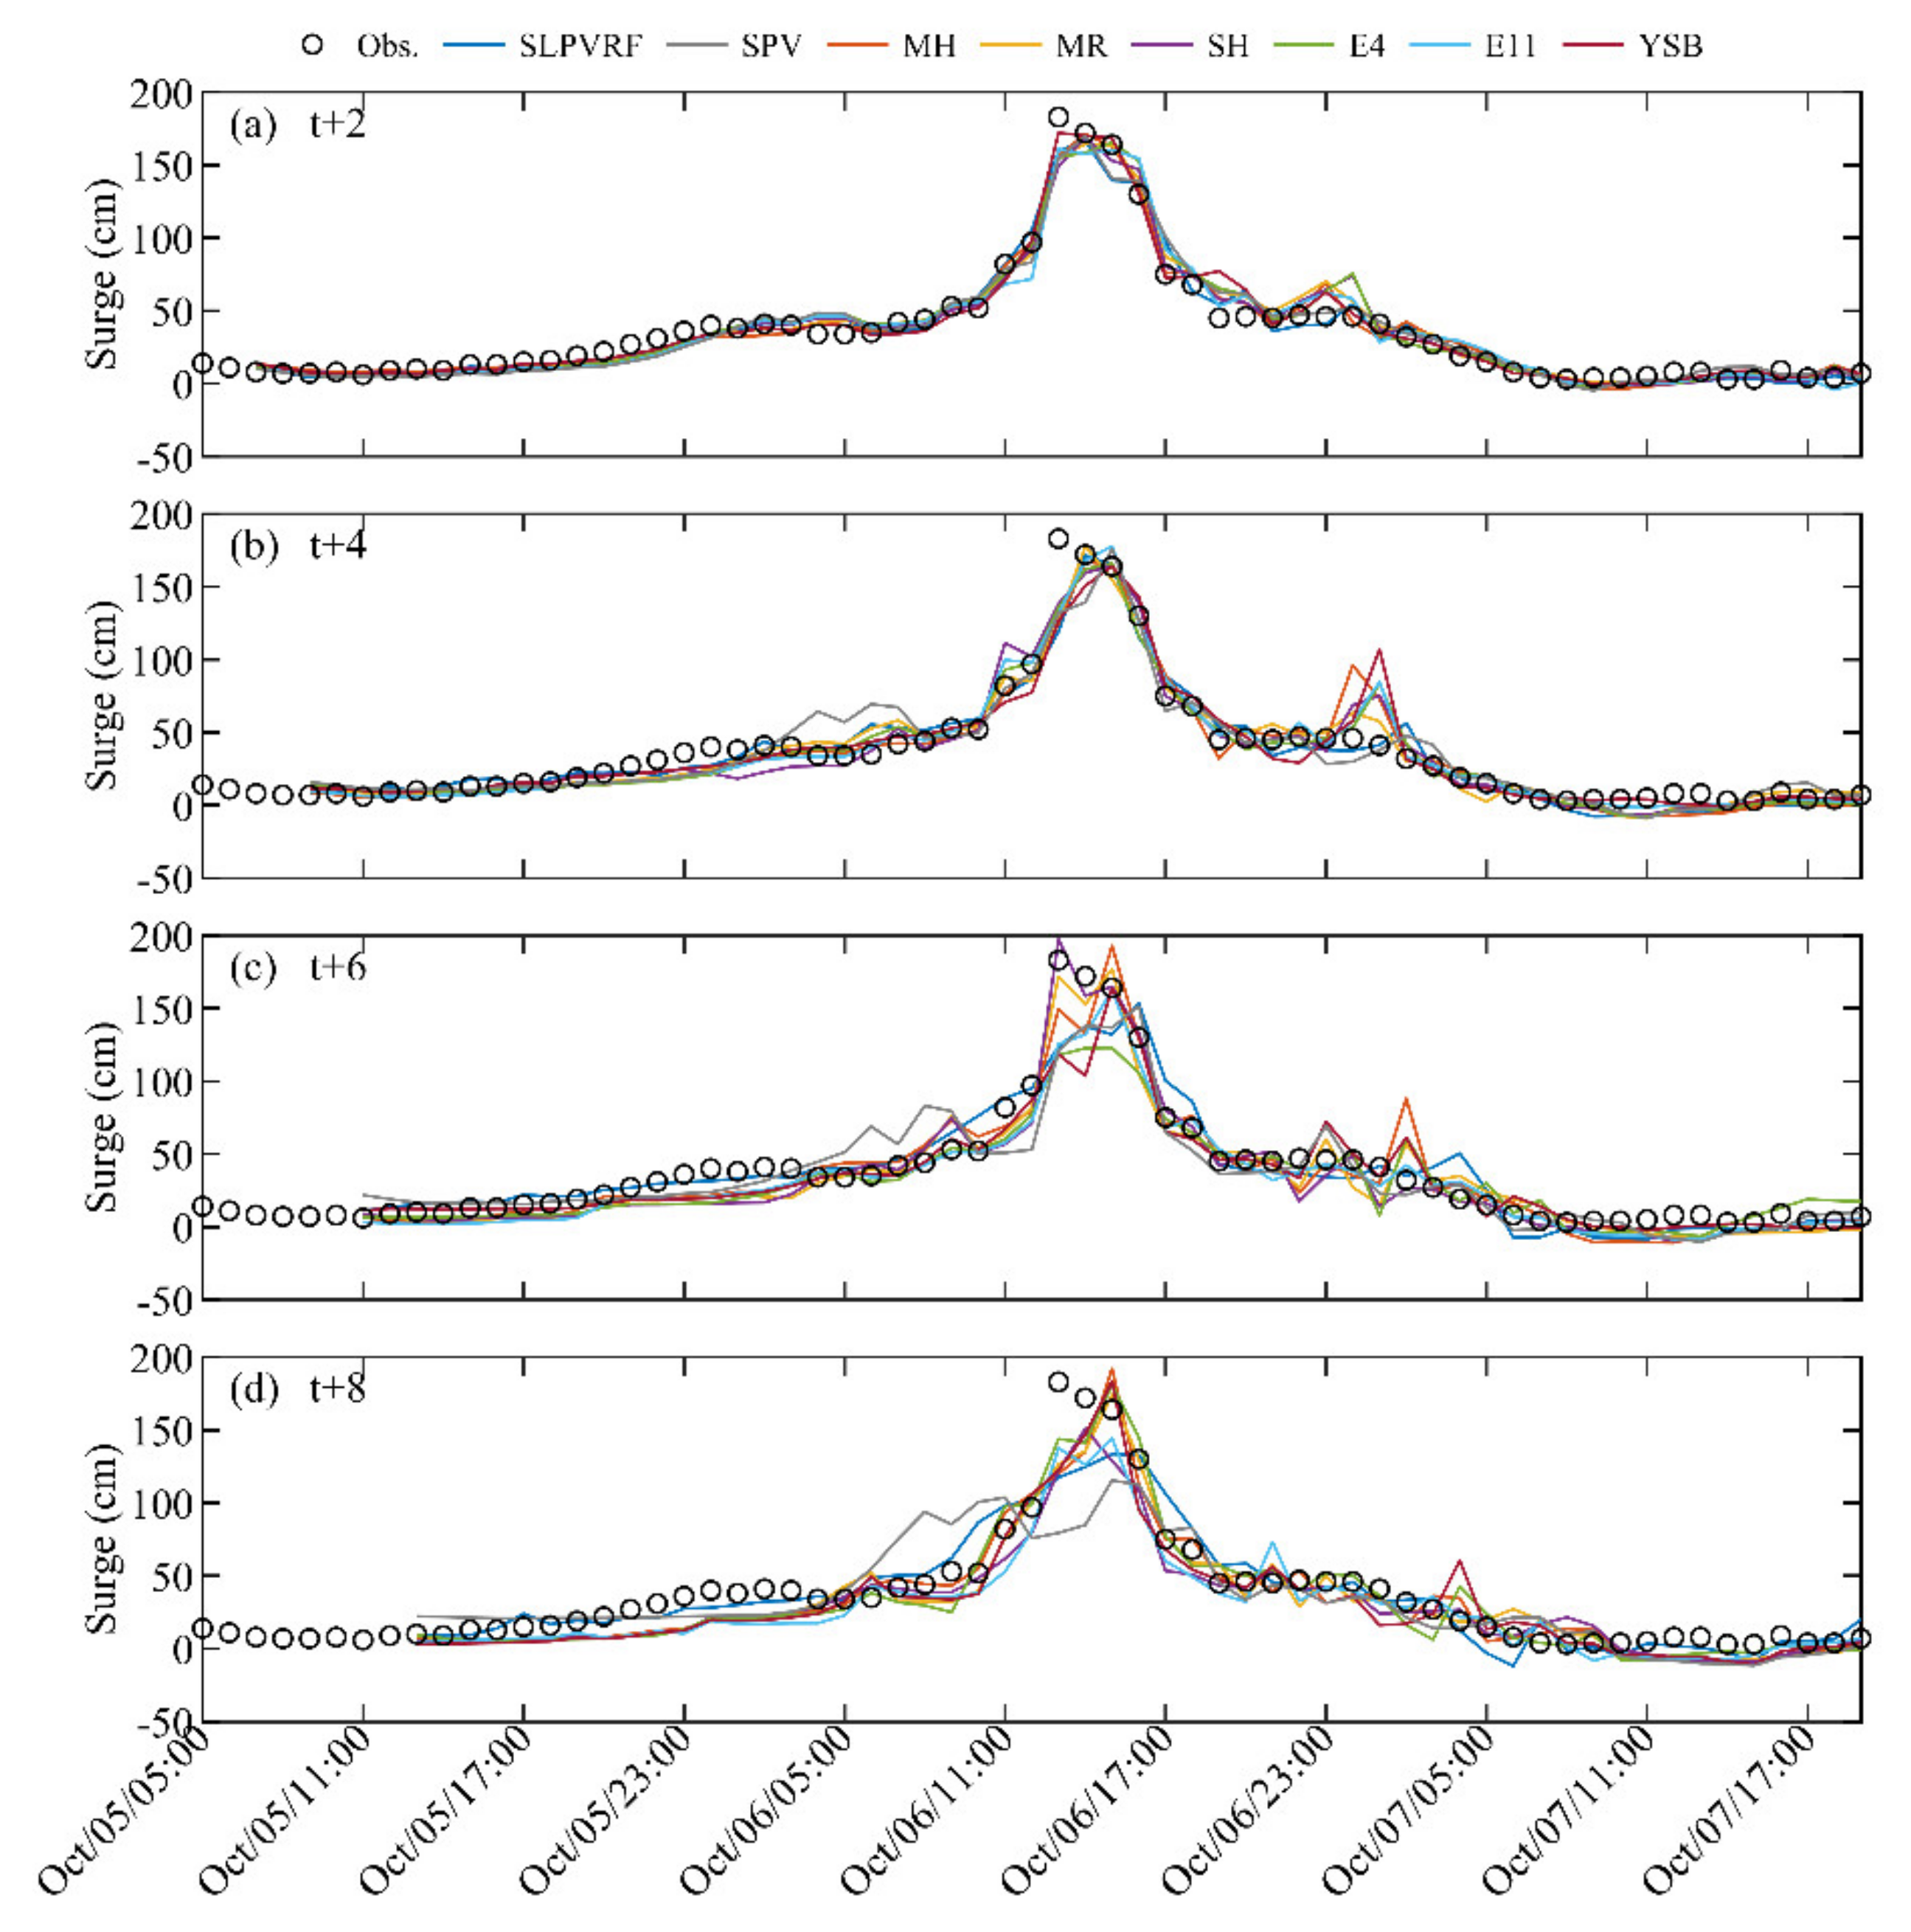
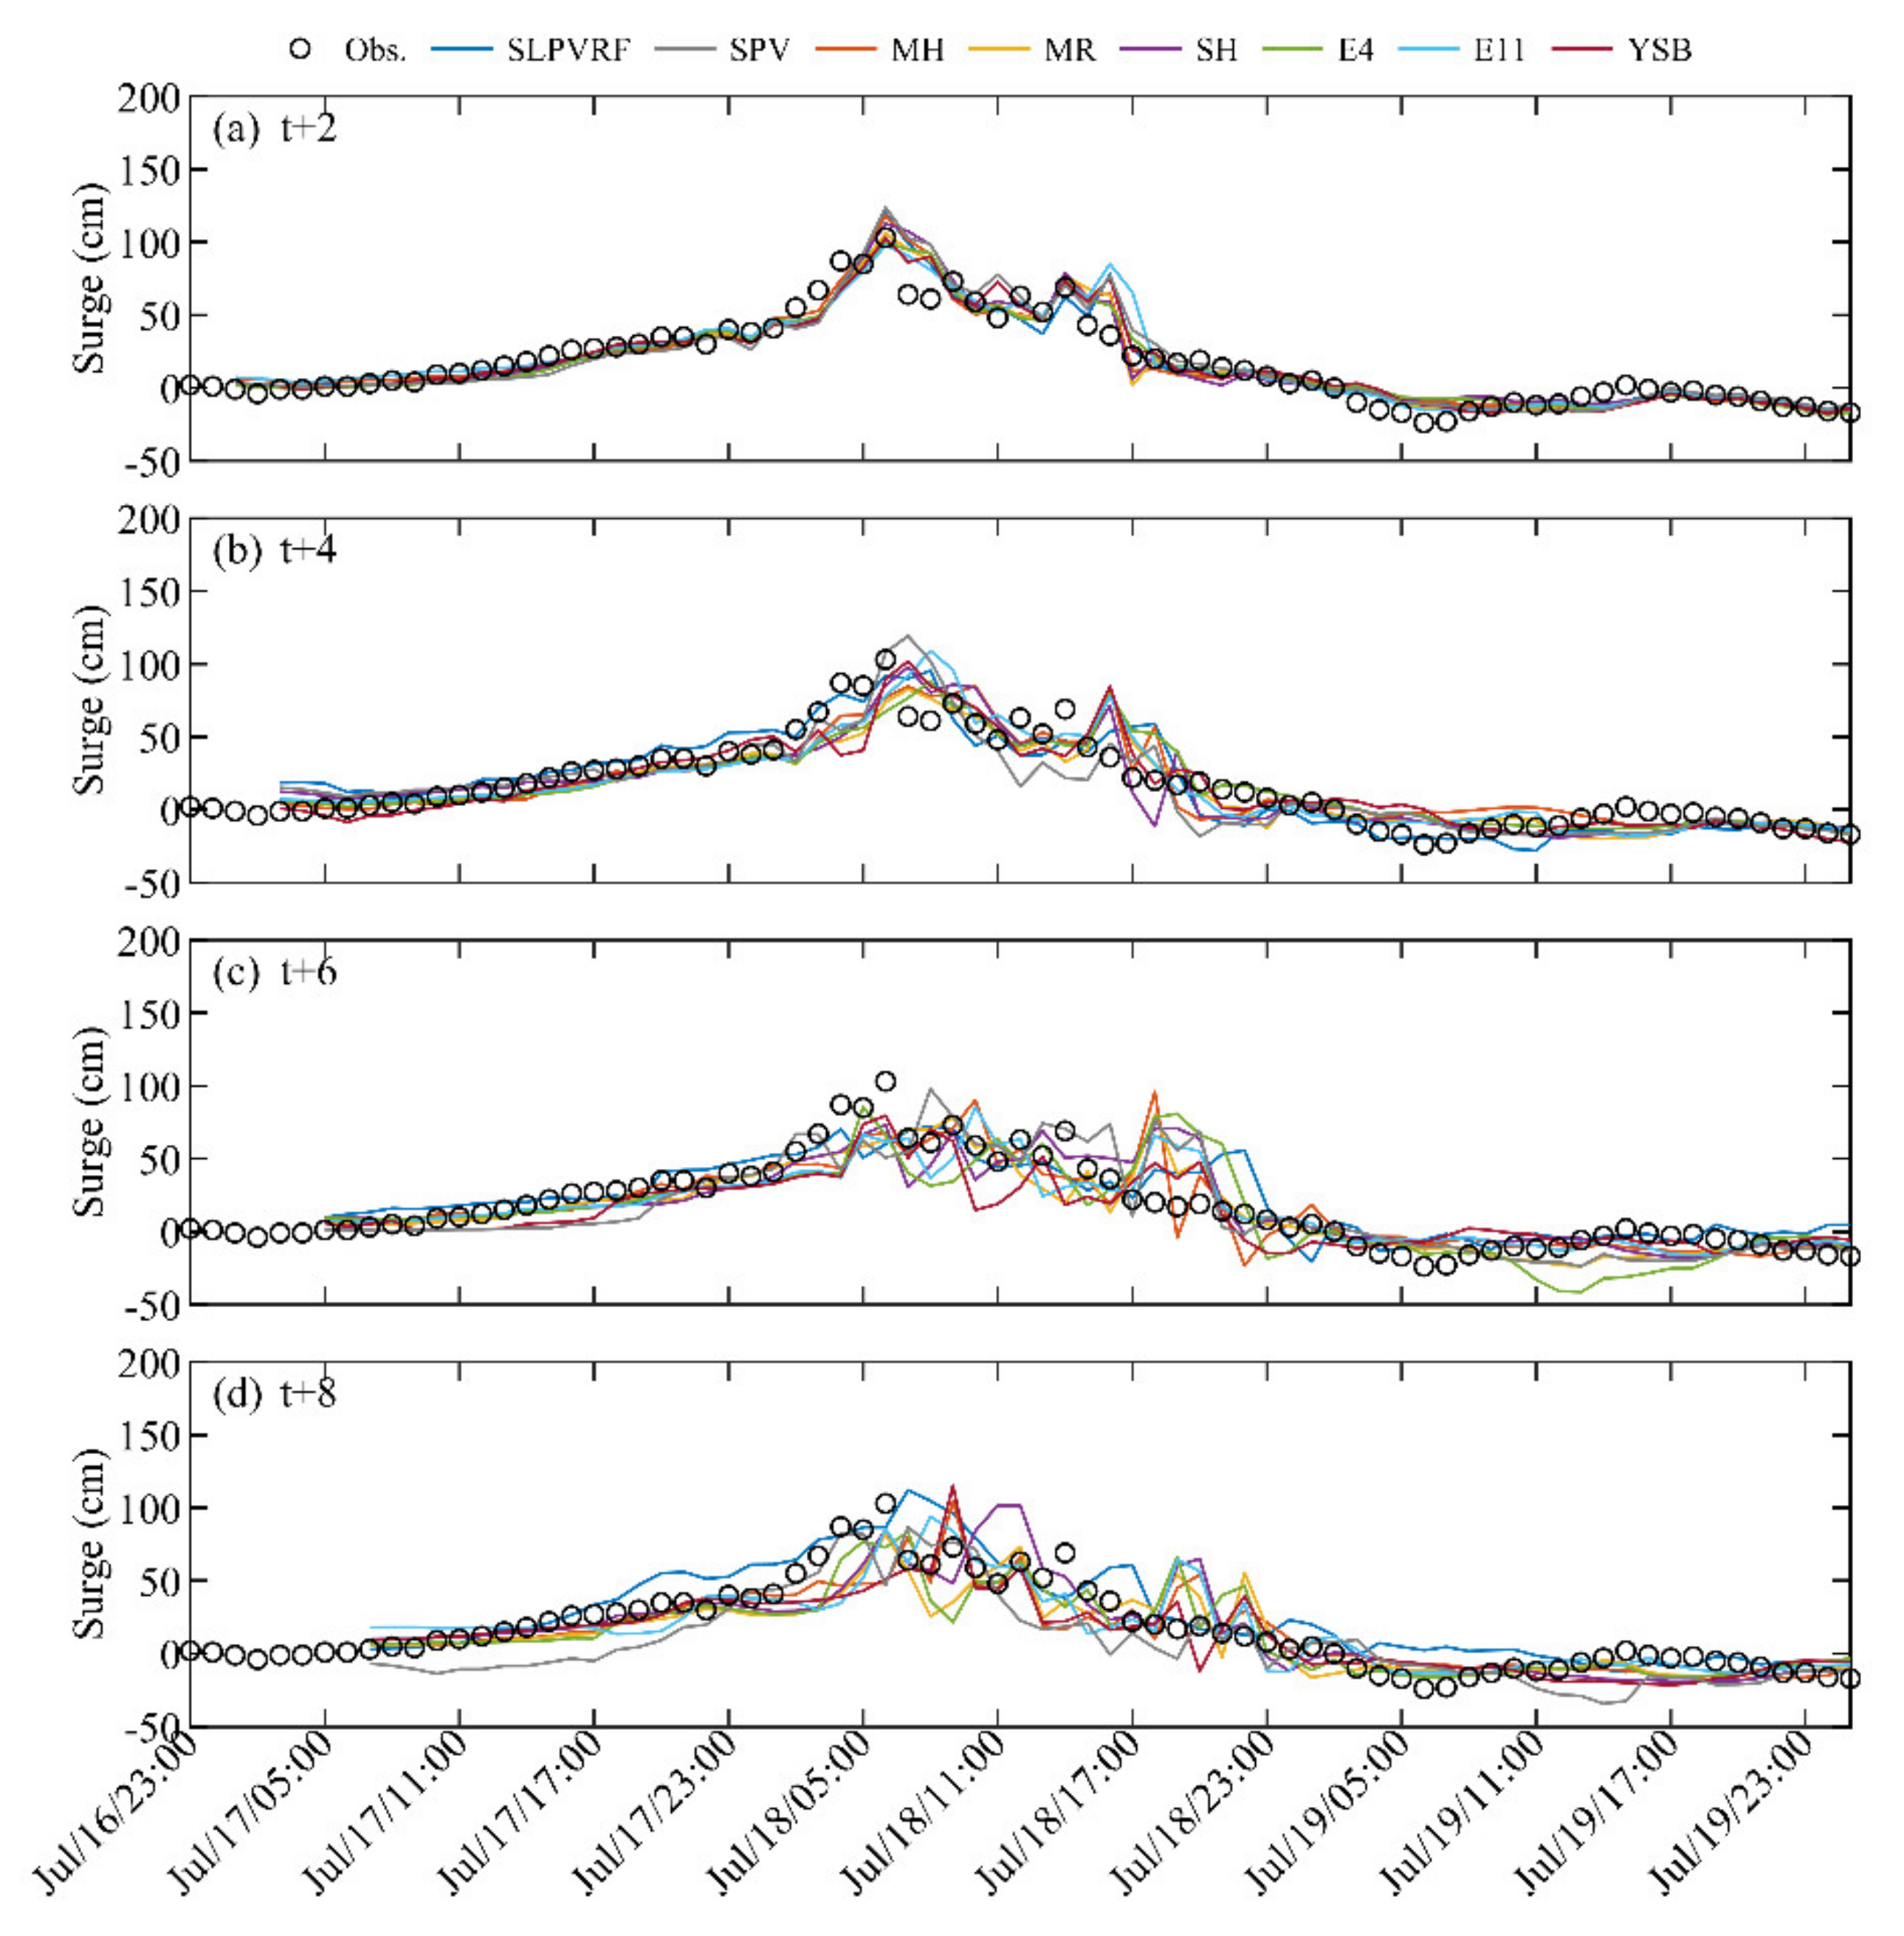
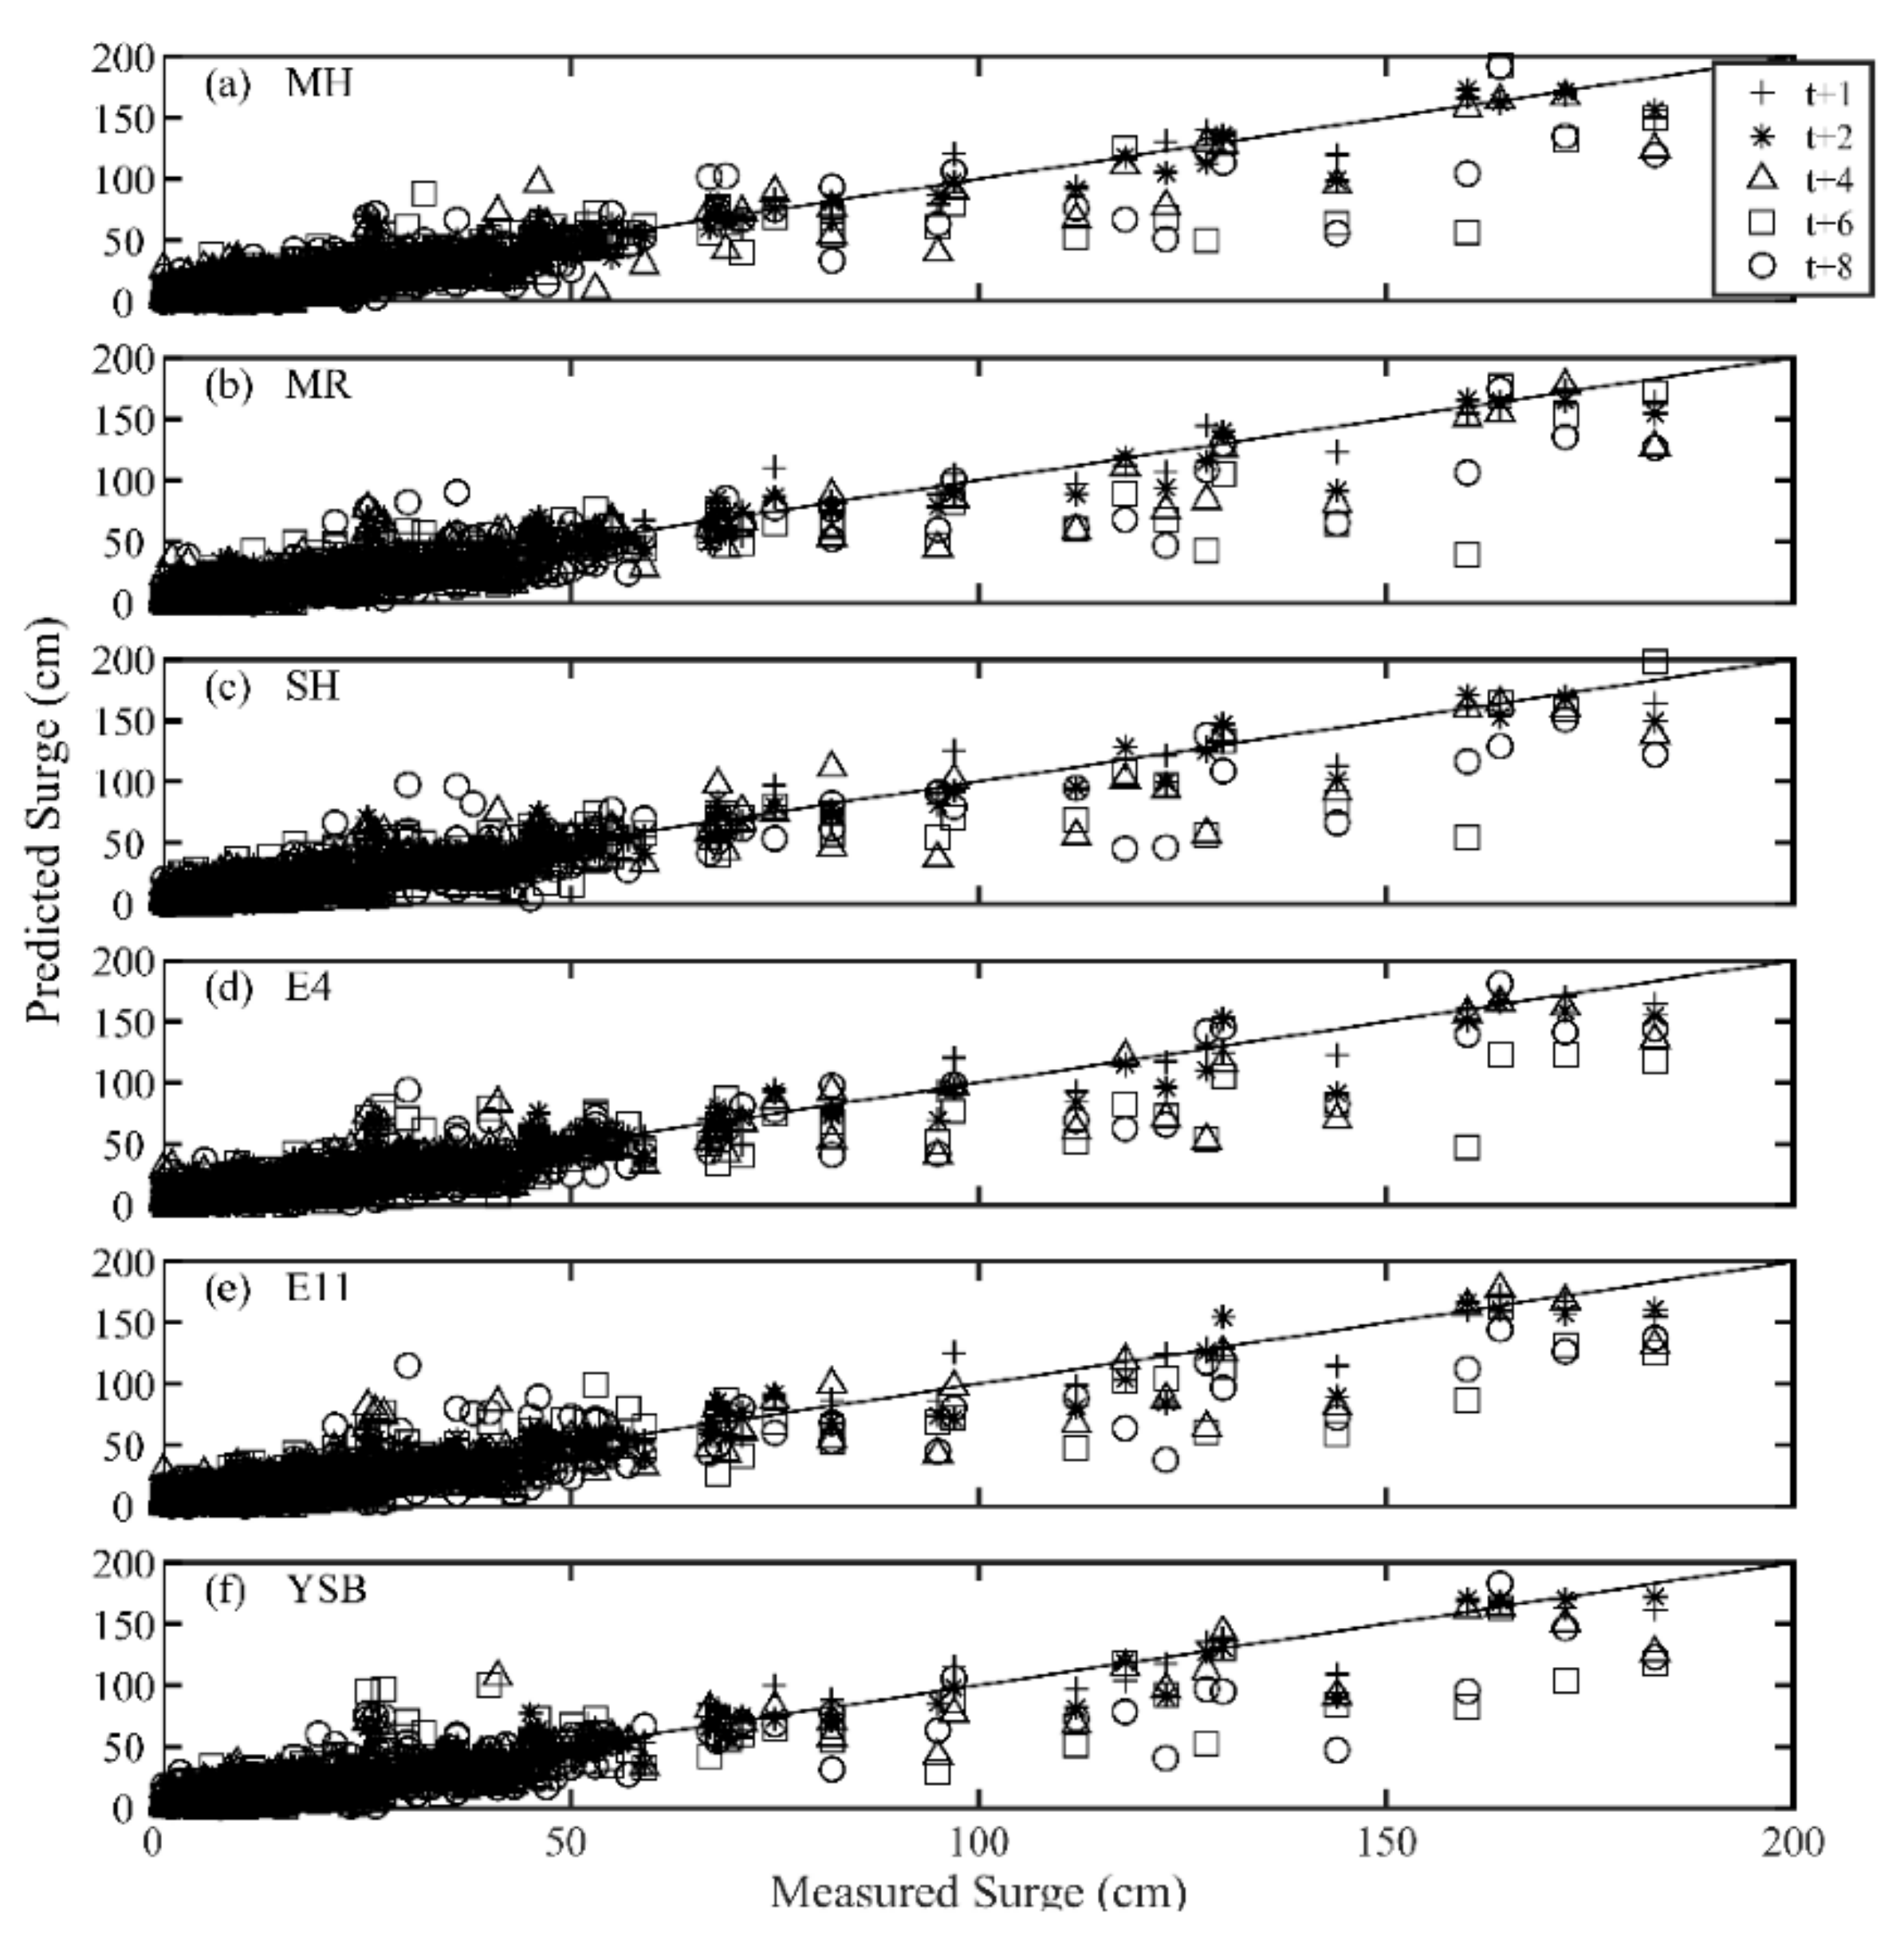
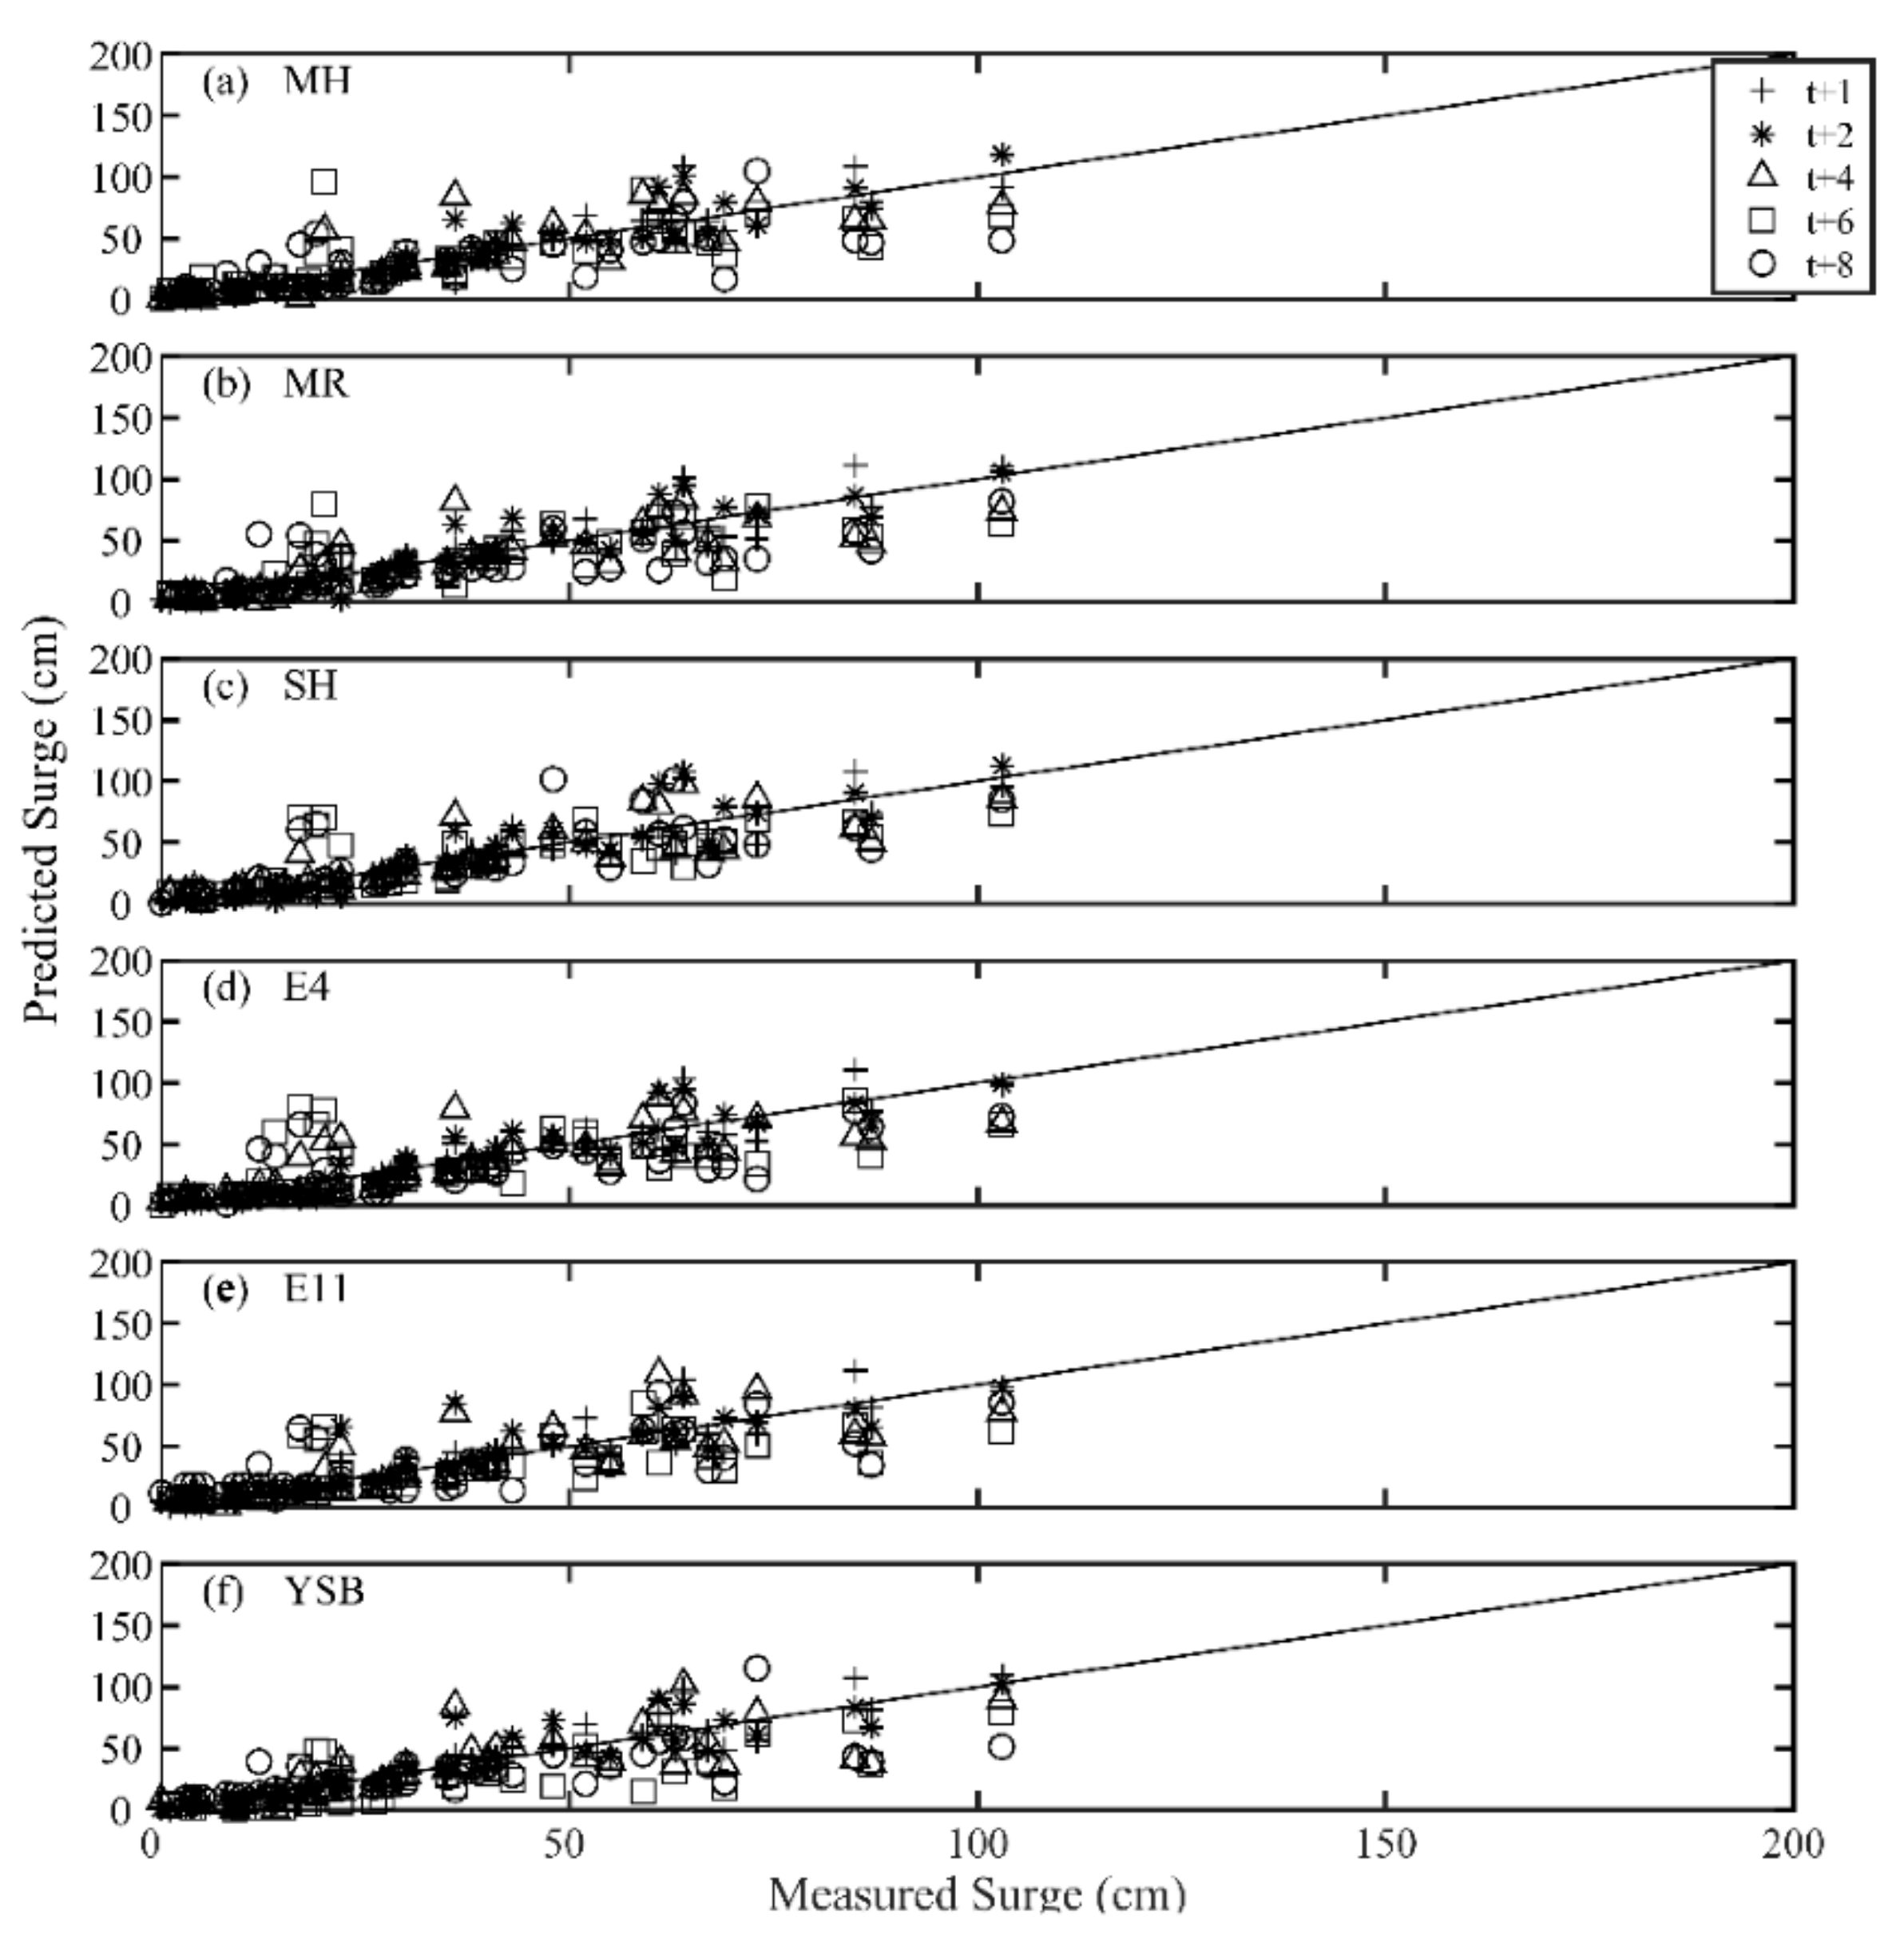
Long lead-time storm surge predictions using the parametric cyclone and neural network hybrid model are shown in Figure 7 and Figure 8 for the training and validation events, respectively. In addition, the scatter plots in Figure 9 and Figure 10 are used to better demonstrate the prediction performances for all the training and validation cases. As can be seen, a wider range of storm surge variation was considered in the training phase in order to ensure good generalization capability for both mild and severe events in the validation phase. In addition, and consistent with the scatter plots (i.e., the distance between the symbols and the identity line), the statistical results in terms of RMSE (m) are summarized in Table 5. While the average accuracy was confirmed (see Table 5), we continued to focus on the event-based evaluation for the significant cases. For four-hour-ahead prediction, the proposed method with various parametric cyclone models fully described the storm surge, with good agreement between the predicted results and the observed data, with statistical indices of RMSE = 10.75–13.30 cm, CC = 0.944–0.966, and CE = 0.890–0.929 for training and RMSE = 13.70–14.69 cm, CC = 0.878–0.895, and CE = 0.753–0.786 for validation. As the lead time increased, the prediction performance in both phases gradually decreased; see the symbols under the 1:1 identity line in Figure 9 and Figure 10. Accuracy and applicability of a parametric cyclone model (e.g., E4) appears to play a role in storm surge prediction. The hybrid model with E4 (dark green line in Figure 7) estimated the variation and peak of the storm surge well. With E11 (light blue line), the hybrid model captured the overall surge pattern. Based on MH (orange line) or RM (yellow line), however, the hybrid model predicted the peak surge with an obvious time lag of about 2 h. For eight-hour-ahead predictions, the hybrid model embedding E4 or E11 maintained reasonable accuracy, with performance slightly better than or comparable to that of the high-dimensional SLPVRF neural network model (blue lines), especially in the validation event. As shown in Table 3, the statistical indices for the training event were RMSE = 13.78–16.33 cm, CC = 0.941–0.960, and CE = 0.840–0.844. For the validation event, the statistic indices can be found in Table 4: RMSE = 15.73–16.12 cm, CC = 0.847–0.863, and CE = 0.714–0.734.
5. Discussion of Prediction Performance Improvement
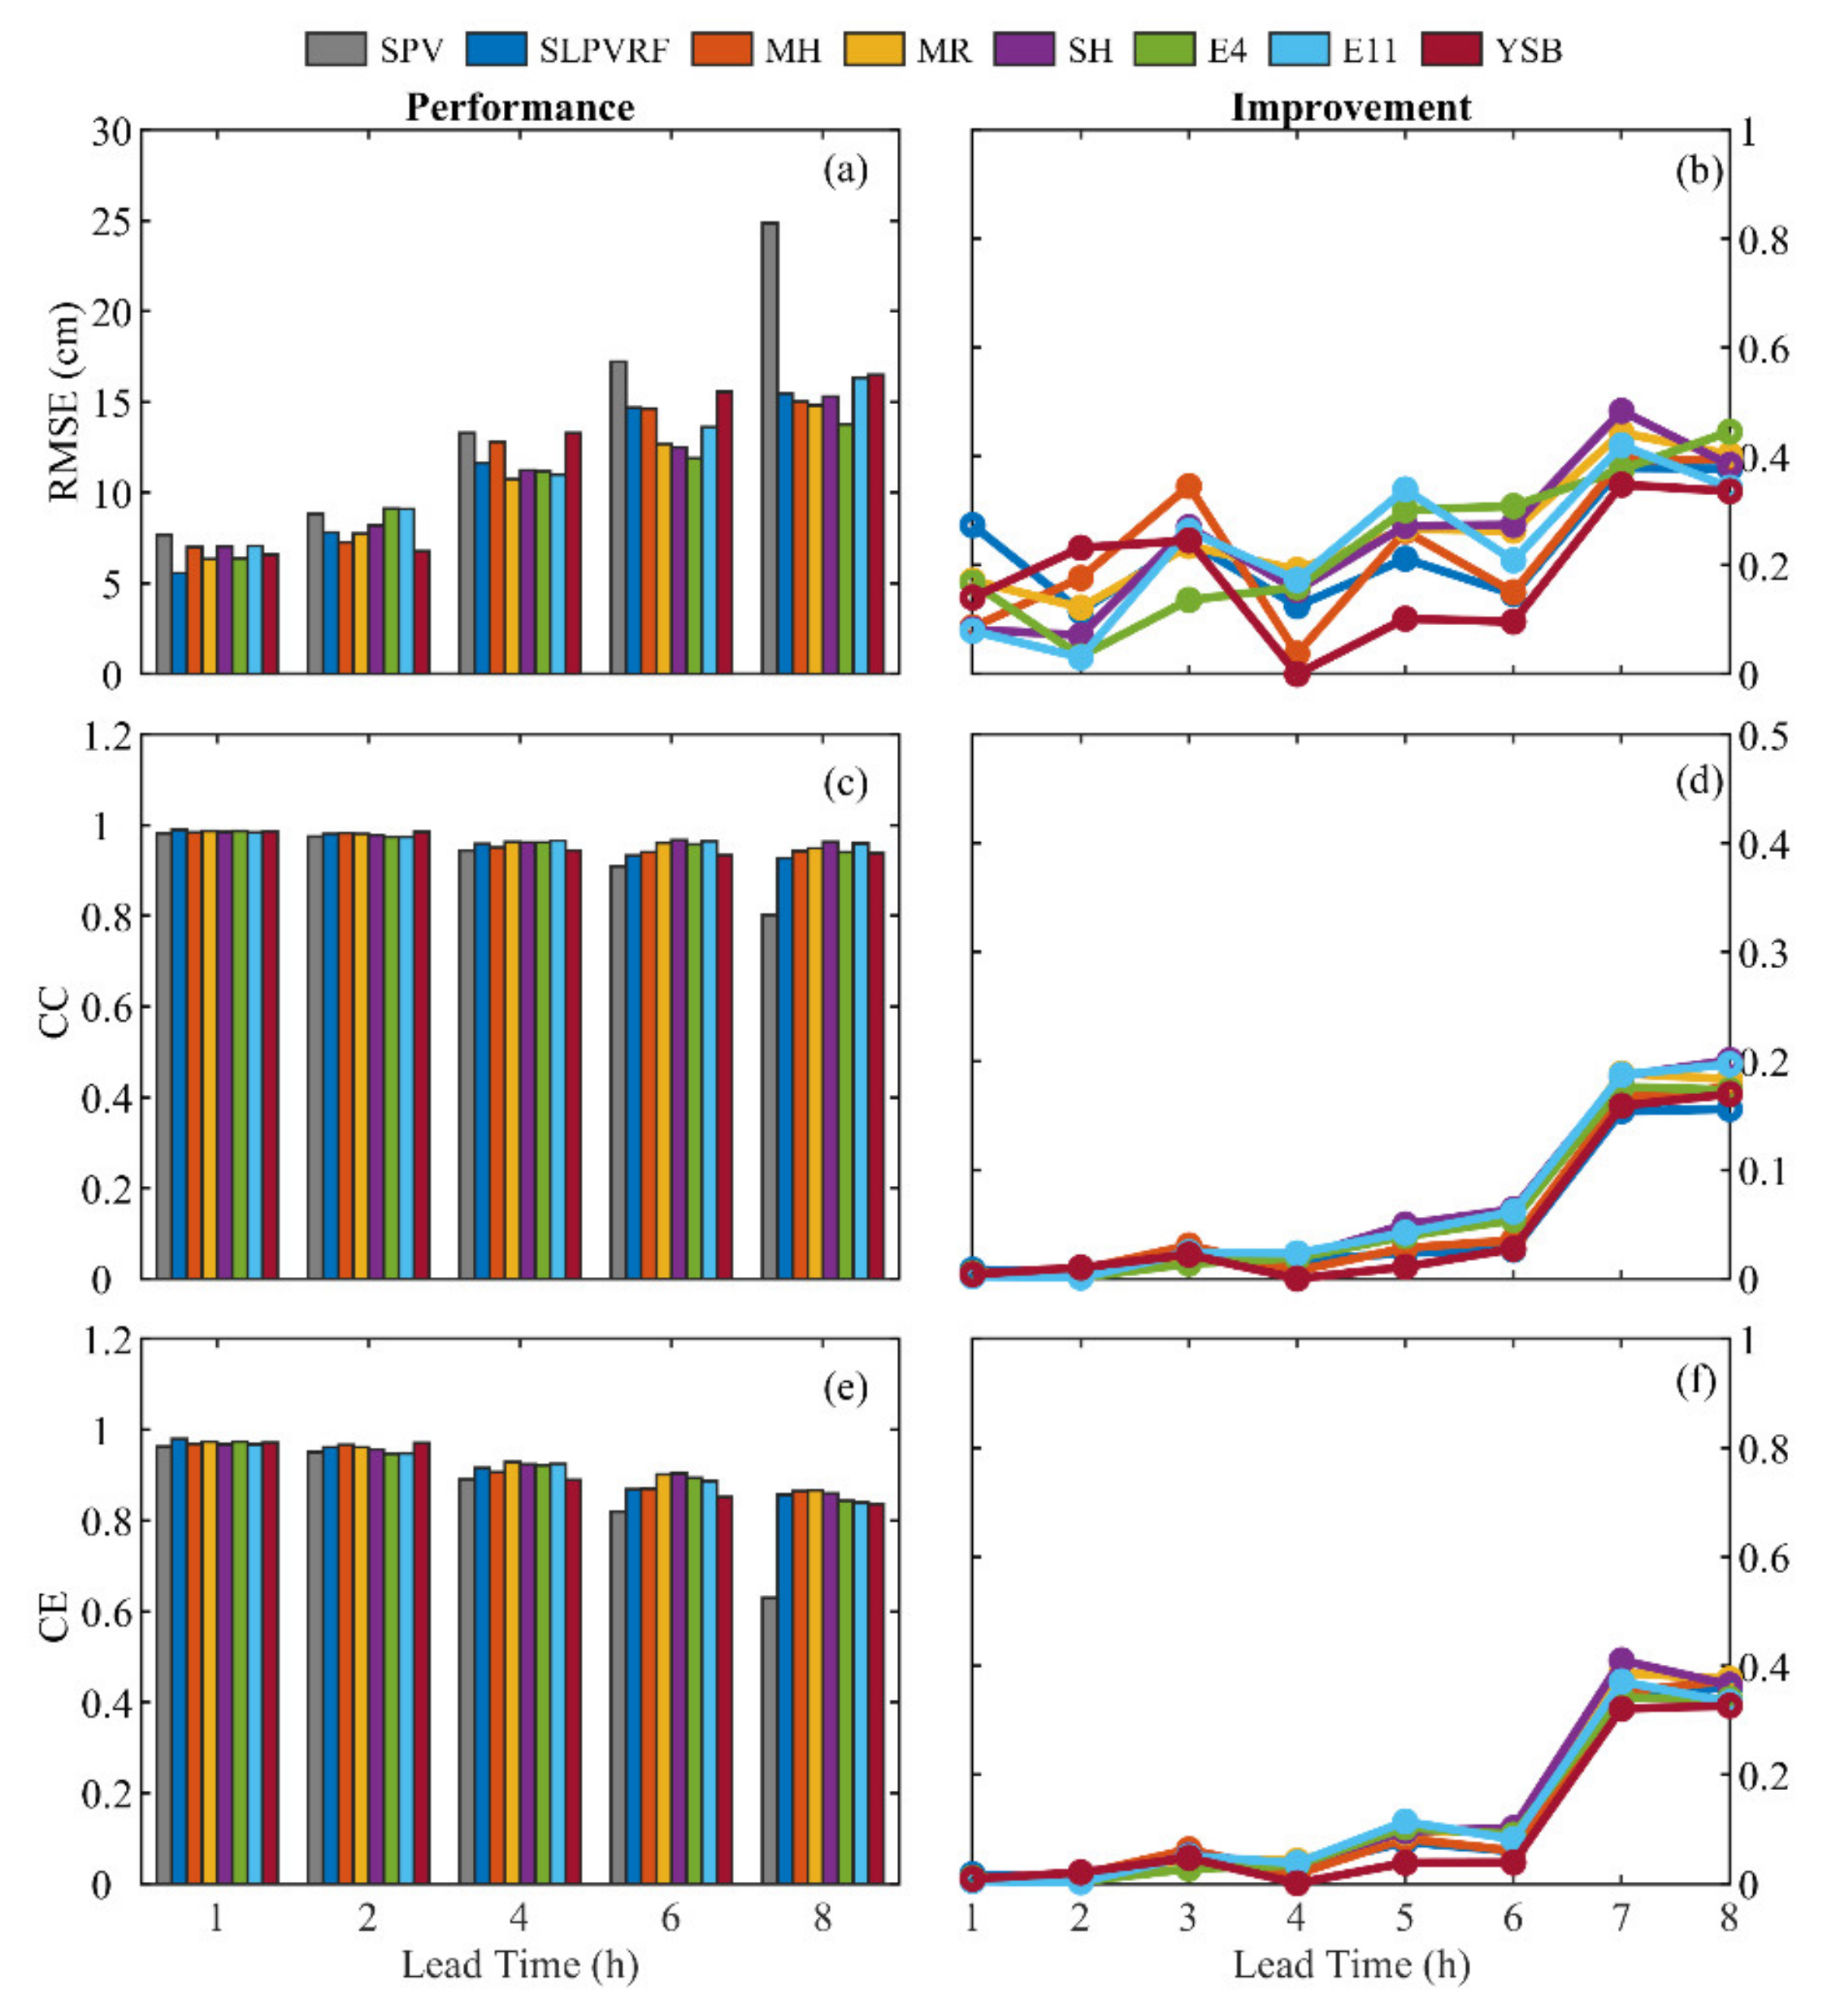
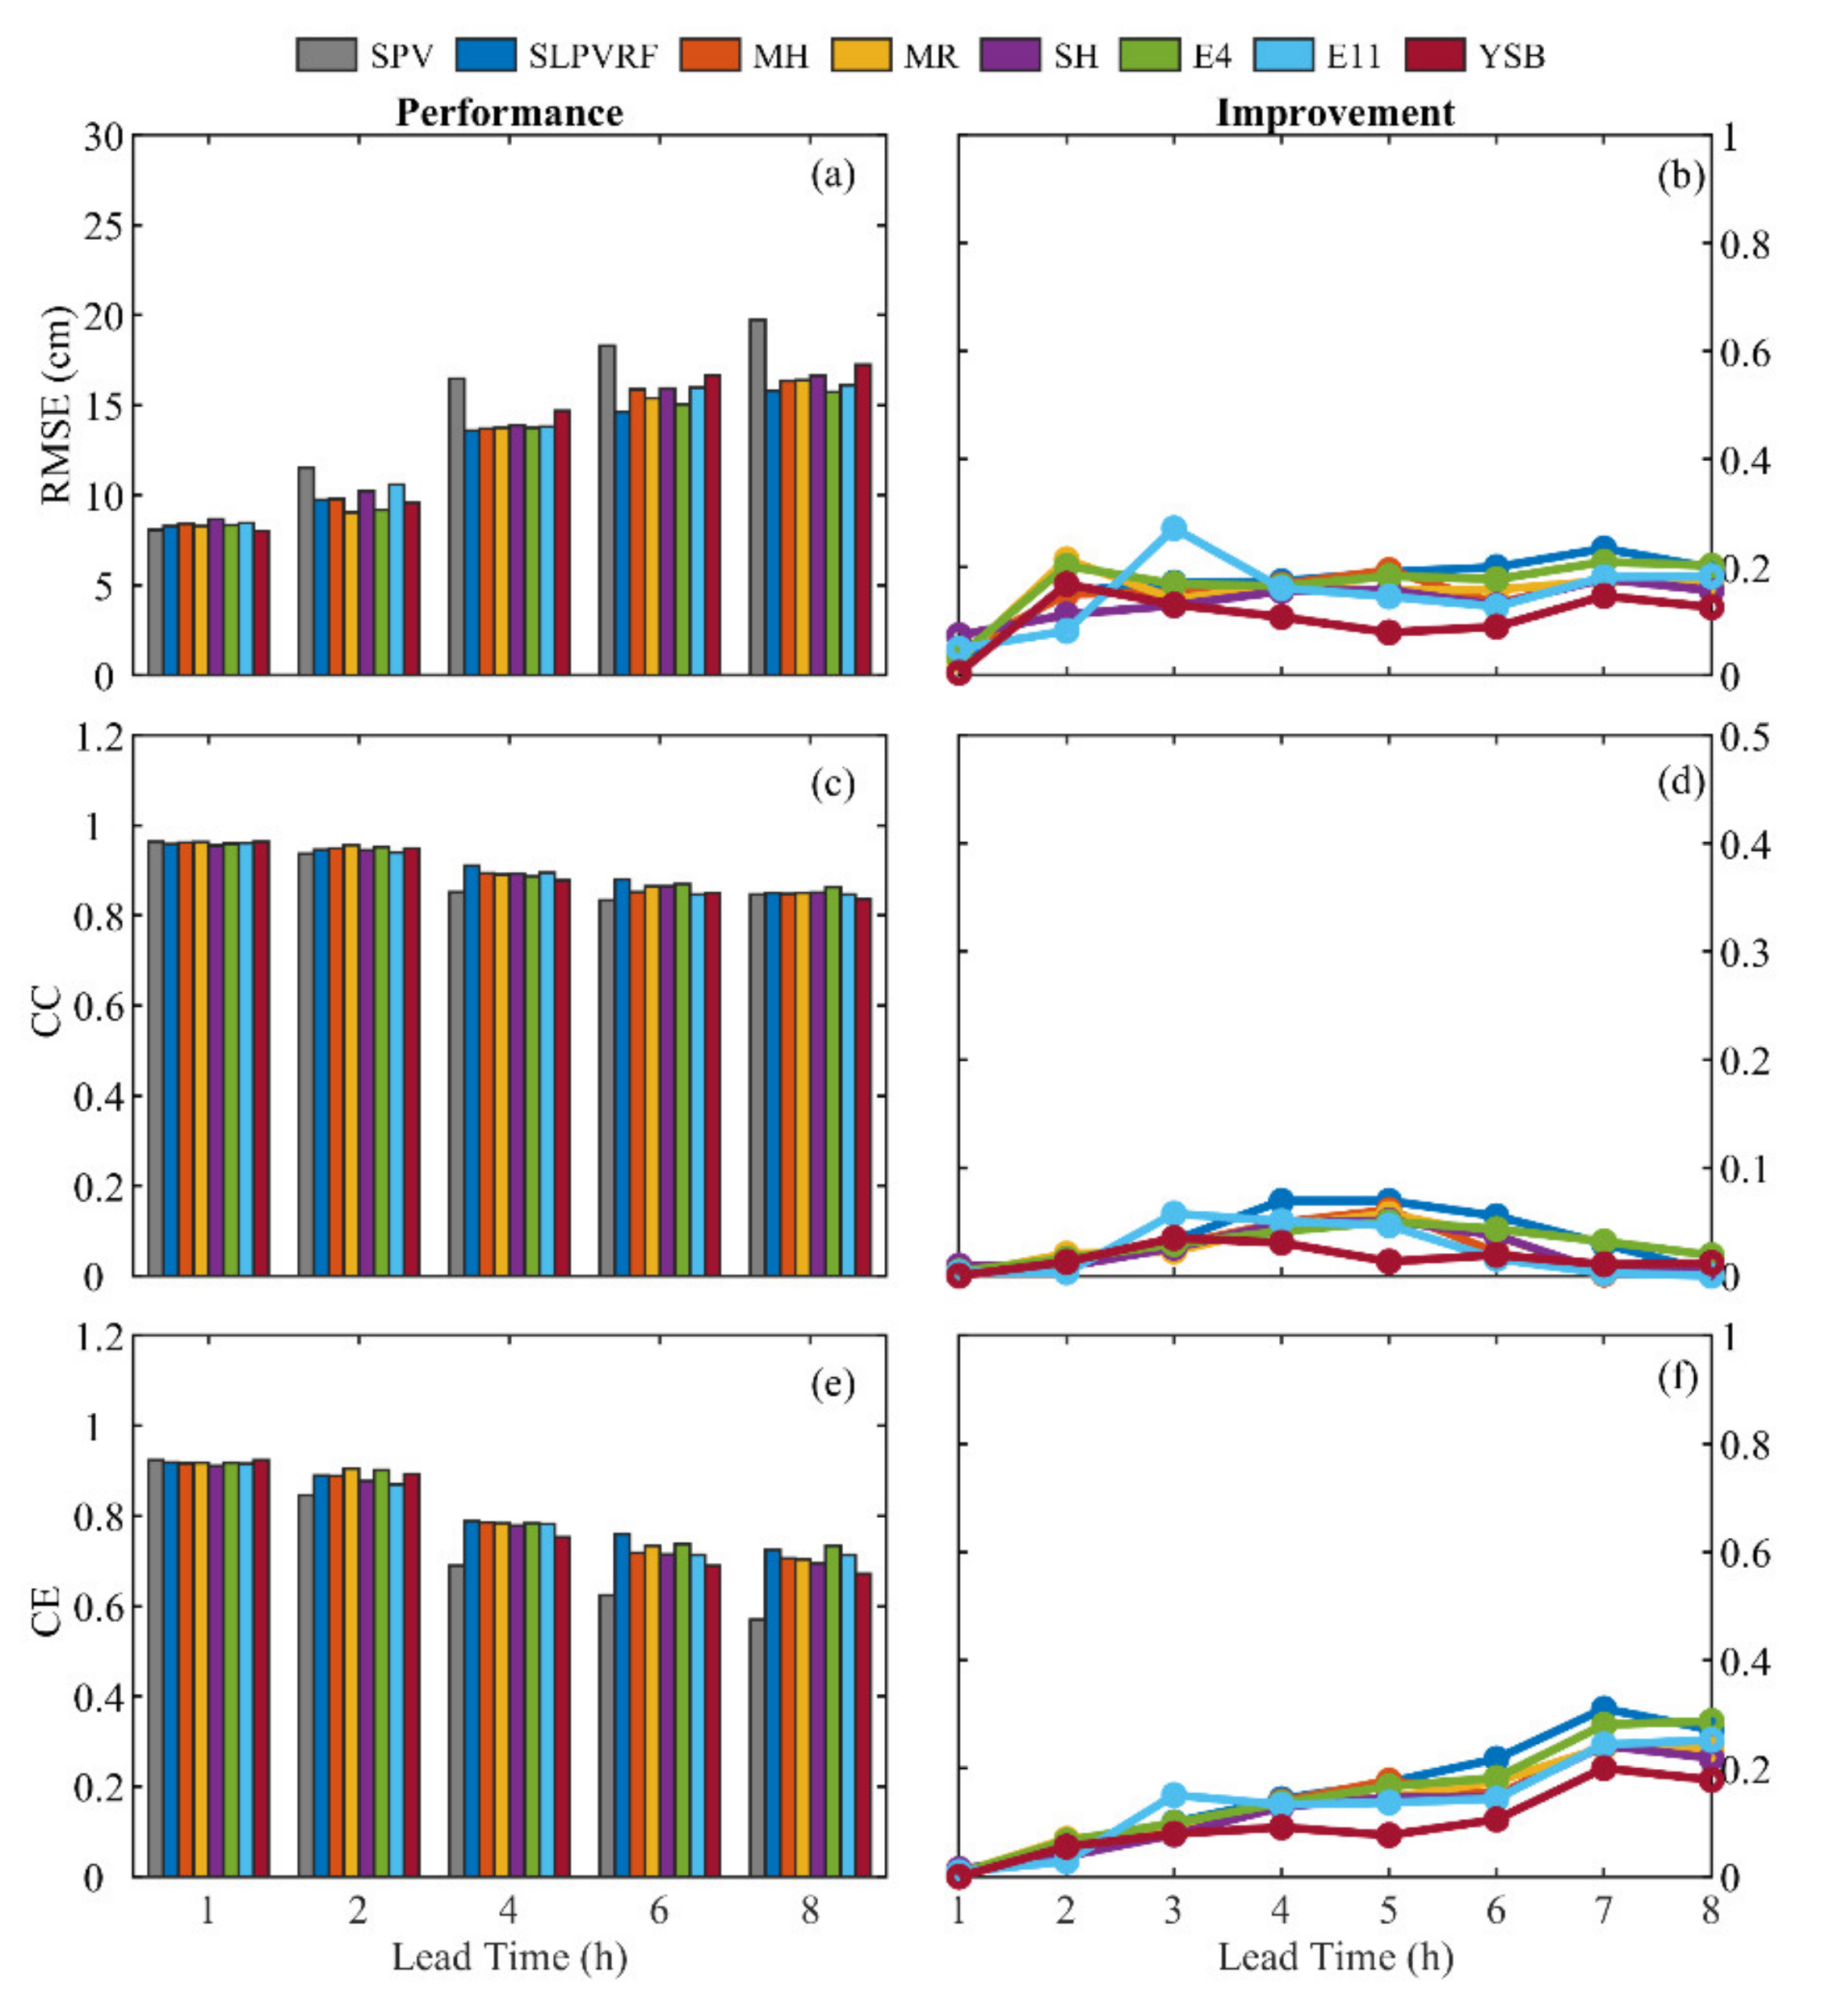
Here, the performance and improvement of storm surge prediction in both the training and validation phases (see Figure 11 and Figure 12) with the parametric cyclone and neural network hybrid models are discussed. The pure neural network model (SPV) with four effective typhoon parameters (S, ΔPc, Vc, and θR) was set as the basis for comparison (grey column) because the same dimension of network structure was employed. In the training and validation events, the prediction performance of the SPV model dramatically decreases as lead time increases, e.g., RMSE can be seen to decrease from 7.67 cm to 24.85 cm in Figure 11a, and from 8.07 cm to 19.74 cm in Figure 12a. The accuracy is limited to a relatively short lead time, consistent with several previous works [10] in which observation data from local tidal and meteorological stations were used. Storm surge predictions using the proposed hybrid models demonstrate great improvement as lead time extends to 8 h, e.g., an RMSE of 33–40% and 13–21%, and a CE of 32–37% and 18–29%, respectively, for the training and validation phases.
Additionally, Figure 11 and Figure 12 clearly indicate that the way to achieve better long lead-time storm surge prediction is a full consideration of effective controlling parameters, e.g., the SLPVRF model (blue column) developed in our previous work [15]. However, the network dimension was substantially increased, e.g., from four inputs × eight hidden neurons to eight inputs × eight hidden neurons. In this paper, using the physically-based parametric cyclone models, the proposed hybrid approach can reduce the complexity of the network structure while retaining the important input indicators of a typhoon. In particular, such a treatment can transform storm parameters into local pressure and winds, inferring the possible future influence of the typhoon, unlike the simple collection and direct usage of local observation data in earlier works [10].
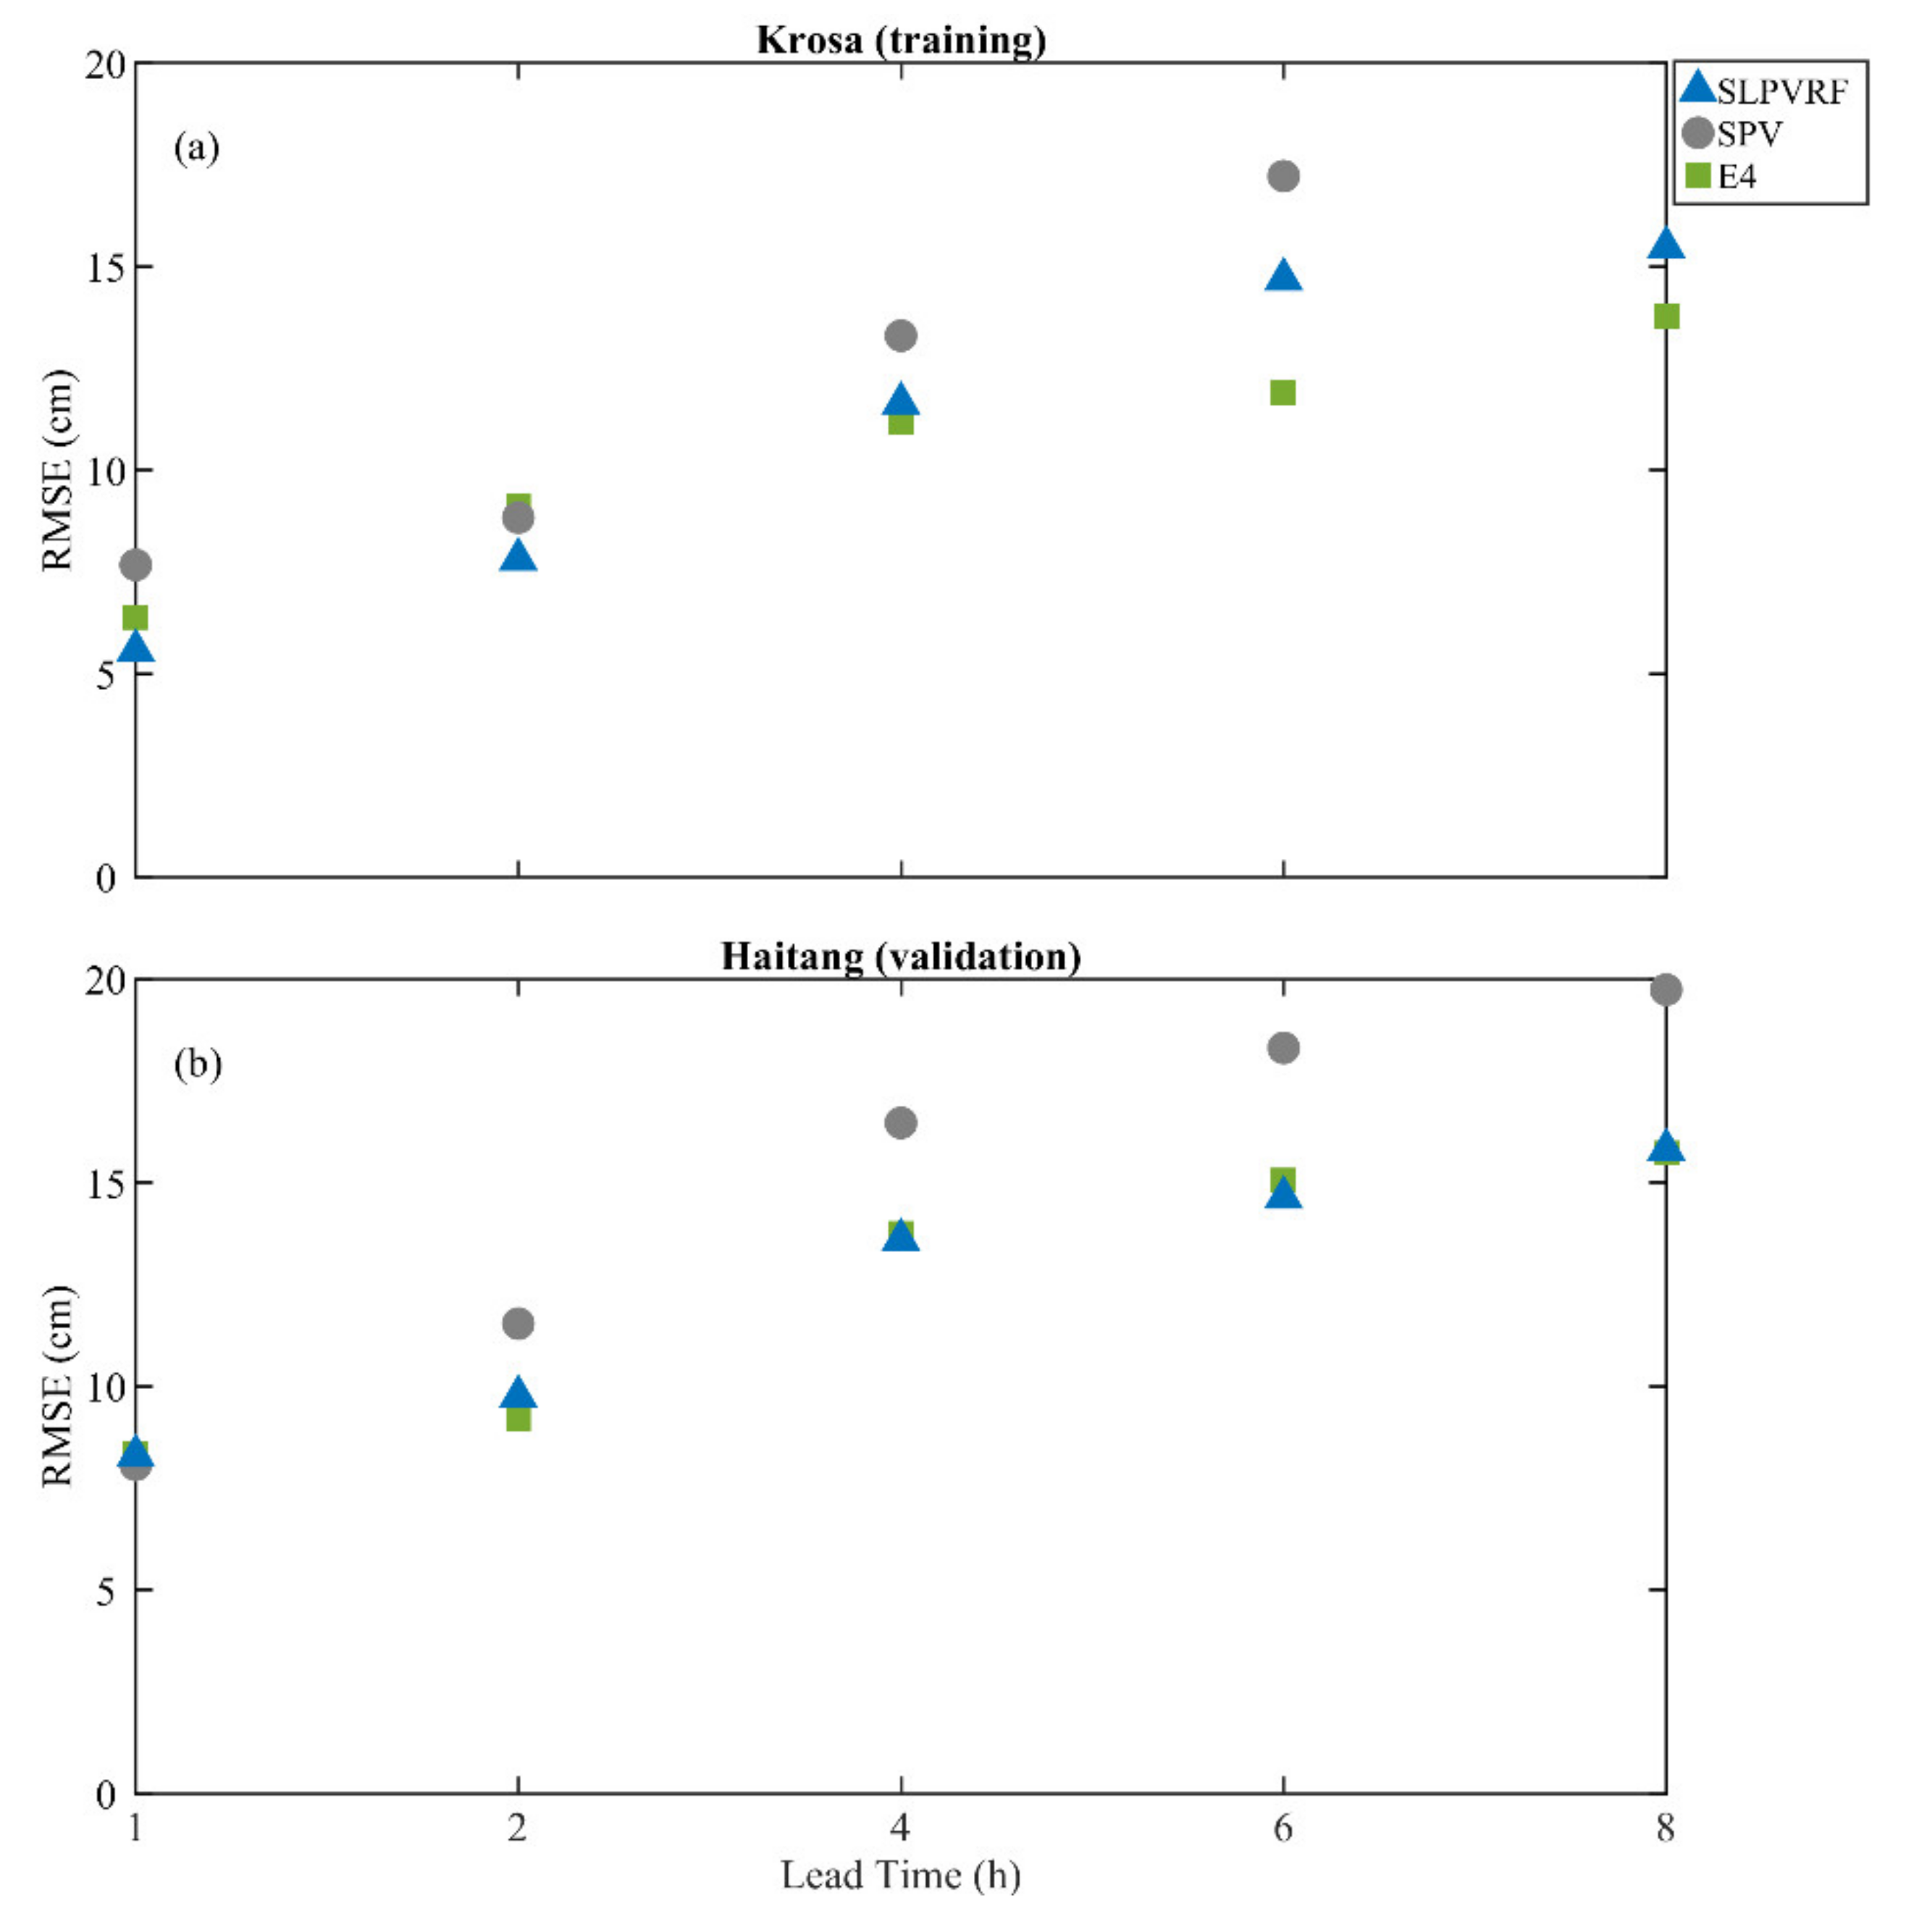
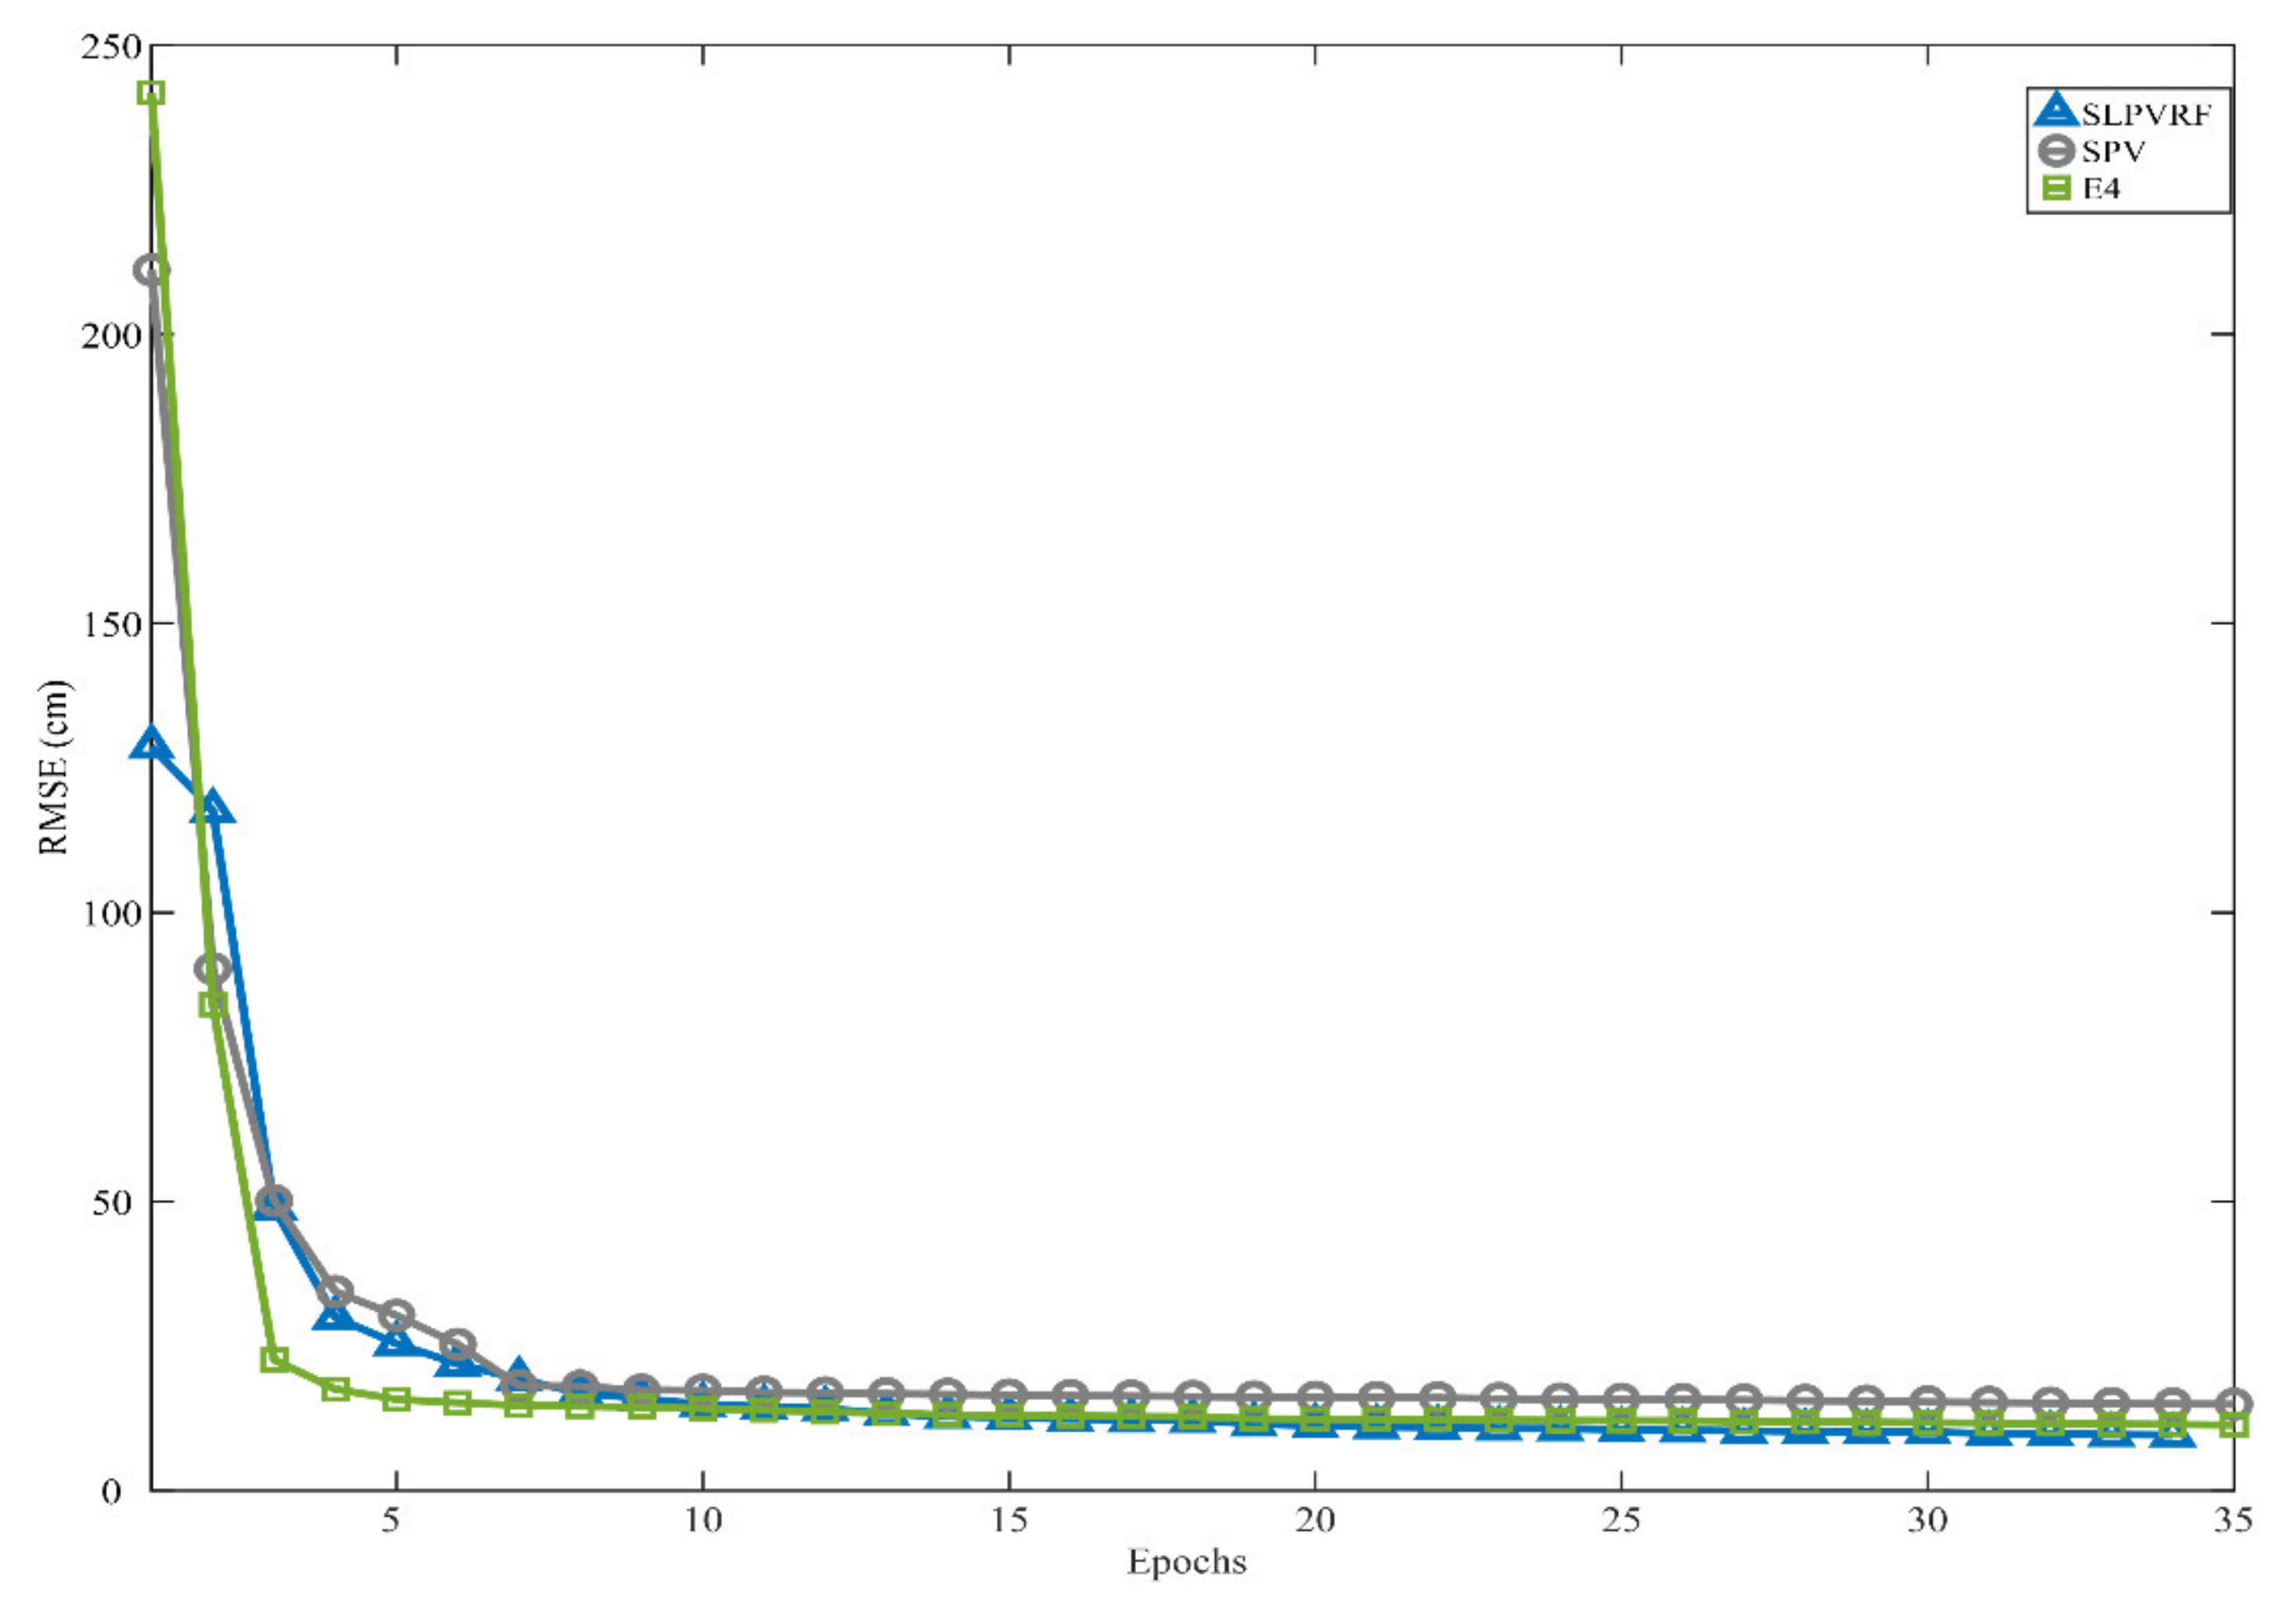
Differences between the pure neural network model, SLPVRF [15], and the proposed hybrid model are further discussed below. Figure 13 shows the prediction performances for the SLPVRF and hybrid models in terms of RMSE. The accuracy of both models is much better than that of the SPV model. In addition, the hybrid model (green lines) performs slightly better than the high-dimensional SLPVRF neural network model (blue lines) as the lead time increases over 4 h. Notice that the same or even slightly better accuracy has been achieved by a low-dimensional neural network in the present framework. Figure 14 compares the convergence of RMSE during the training of long lead-time (i.e., 8 h) prediction. In contrast to the SLPVRF (SPV) neural network model, which presents good, though slower (or faster and worse) convergence, the proposed method (e.g., with the E4 cyclone model) shows faster and better results (green line) due to the retained storm information and reduced dimensionality of the search space (i.e., four inputs × eight hidden neurons). Additionally, our hybrid storm surge prediction model demonstrates its superior capability (see Table 3 and Table 4) over the neural network models in earlier works [10,14,46]. For example, Lee [10] presented a prediction model for Taiwanese coastal waters with good performance (e.g., CC = 0.986) for a limited lead time (e.g., only one hour). Tseng et al. [46] reported acceptable results for three-hour-ahead prediction (e.g., CC = 0.834) using an artificial neural network that considered eighteen input parameters, including local meteorological information and typhoon characteristics.
Overall, the proposed hybrid model based on the E4 cyclone model can provide accurate and efficient long lead-time storm surge prediction. Additionally, unlike modeling results with uncertainty issues due to the atmospheric forcing specified in numerical weather prediction models [7,18], the present hybrid model using true observation data, parametric cyclone theory, and a neural network can provide reliable and robust prediction results. Note that estimation of a new storm center with simple straight-line movement has been assumed in this paper. Future work which attempts a coupled neural network model for storm track and magnitude is ongoing, and upcoming results on this topic will be reported at a later date.
6. Conclusions
Storm surges induced by the wind shear and pressure drop of severe typhoons [1] are one of the most devastating coastal disasters. To date, a great deal of effort has continuously been made to achieve better prediction of storm surge variation [7]. In general, two different kinds of tools have been applied for storm surge prediction: (i) physically-based models (e.g., [8]) and (ii) data-driven models (e.g., [9,10]). For accurate prediction all previous works have indicated the critical role of atmospheric forcing (wind/pressure), which can be obtained through the real-time hurricane wind analysis system (H*Wind), numerical weather prediction models, and parametric cyclone models [19,20]. Recognizing the practical demand and unresolved issues on this topic, the authors [15] recently revisited the topic of storm surge prediction and developed an ANN-based storm surge model. In particular, by analogy with the physical modeling approach, the so-called effective typhoon parameters were examined and carefully selected. Good prediction performances were obtained with longer lead times.
In this paper, inspiration from the success of parametric cyclone models (e.g., [31]) motivated this study to pursue possible further improvement. We proposed a parametric cyclone and neural network hybrid model for accurate long lead-time storm surge prediction. The essential concept is that the two components in the hybrid model, being based on different philosophies, would complement each other with respect to their inherent strengths and limitations [50,51]. The parametric cyclone models derived from meteorology dynamics can be utilized to transform typhoon parameters into both fewer and more effective inputs; thus, the complexity of ANN structure (i.e., the dimensionality of the search space) can be reduced, boosting the optimal solution or avoiding local minima during the training process. On the other hand, the ANN, with its error tolerance capability, can alleviate the sensitivity of parametric cyclone models due, for instance, to the shape parameter. To avoid any misunderstanding, the so-called prediction lead time (e.g., t + n hours) was clearly defined: the time for storm surge prediction (n hour ahead) started from the time (t) of an available observation data point. For case application, the northeastern coastal region (Longdong station) of Taiwan was chosen as the study area. A total of 14 historical typhoon events from 2005 to 2014 were collected for model training and validation. Applicability and some associated questions involving this new idea were carefully discussed. In the following conclusions, several findings as well as suggestions for future work are summarized.
- The pure neural network model using SPV or SLPVRF parameters demonstrated accurate one-hour-ahead predictions, in excellent agreement with the observation data (i.e., CE = 0.963 and 0.980 for the training and validation events). With eight effective controlling parameters (SLPVRF), reasonable prediction accuracy can still be maintained as the lead time increases up to 8 h; i.e., RMSE = 15.47 and 15.81 cm, CC = 0.927 and 0.850, and CE = 0.857 and 0.725, respectively, for training and validation. If a reduction in structural complexity was desired, however, the model (SPV) was unable to describe the relationship between typhoon characteristics and the resulting storm surge.
- The parametric cyclone and neural network hybrid model estimated pressure and winds at a local station for storm surge prediction. The estimated local pressure and wind revealed a good relation to the storm surge. In particular, the transformation of storm parameters to local pressure and winds with such a treatment can imply the possible future influence of the typhoon, unlike the simple collection and direct usage of local observation data in earlier works [10]. Overall, good consistency among various parametric cyclone models was found, with the exception of the MH model, which showed a noticeably different pattern due mainly to the effects of the shape parameter.
- Although discrepancy existed in the model inputs, interestingly, the proposed approach with error-tolerance capability from neural network enabled good one-hour-ahead predictions, i.e., RMSE = 6.35–7.06 cm, CC = 0.984–0.987, and CE = 0.969–0.974. Similar results were found for the validation event: RMSE = 8.03–8.67 cm, CC = 0.955–0.964, and CE = 0.911–0.924. As the lead time increased, the accuracy of the different parametric cyclone models appeared to play a role in storm surge prediction. The hybrid models with E4 and E11 estimated the variation of storm surge well. Based on MH or RM, however, the hybrid model predicted the peak surge with an obvious time lag of 2 h. For eight-hour-ahead prediction, the hybrid model embedding E4 or E11 maintained reasonable accuracy, with RMSE = 16.10–16.33 and 15.50–16.12 cm, CC = 0.941–0.960 and 0.847–0.863, and CE = 0.840–0.844 and 0.714–0.734, respectively, for the training and validation events.
- For performance and improvement of storm surge prediction, the pure neural network model (SPV) with four effective typhoon parameters (S, ΔPc, Vc, and θR) was set as the basis for comparison because the same dimension of network structure was employed. With the physically-based parametric cyclone models, the proposed hybrid approach reduced the complexity of network structure while retaining the important typhoon indicators, demonstrating great improvement as the lead time was extended to 8 h: 33–40% and 13–21% for RMSE and 32–37% and 18–29%) for CE, respectively, in the training and validation phases.
- It is clear that the way to achieve better long lead-time storm surge prediction is the full consideration of effective controlling parameters. Both the SLPVRF model [15] and the hybrid model show much better accuracy than the SPV model. Additionally, the hybrid model performs slightly better than the high-dimensional SLPVRF neural network model as the lead time increases over 4 h. In convergence analysis, compared to the SLPVRF (SPV) neural network model, the proposed method using the E4 cyclone model provides faster and better results due to the retained storm information and reduced number of dimensions in the search space.
- The proposed hybrid model based on the E4 cyclone model can provide accurate and efficient long lead-time storm surge prediction. In particular, the present model can use true observation data, parametric cyclone theory, and neural network to provide reliable and robust prediction results, unlike those modeling results with uncertainty issues due to the atmospheric forcing specified by numerical weather prediction models [7,18]. Furthermore, the model demonstrates its superior capability compared to the neural network models in earlier works [10,14,46].
- Estimation of a new storm center with simple straight-line movement was assumed in this paper. Future work which attempts a coupled neural network model for accurate prediction of storm track and magnitude is ongoing, and upcoming results will be reported at a later date.
- Similar or slightly better accuracy has been achieved in the present framework using a low-dimensional neural network. In addition to prediction performance, the further value of this study lies in the demonstration of a hybrid concept (in this case the combination of physically-based and data-driven models) that can be applied to various complicated problems in different research fields.
Author Contributions
Conceptualization, W.-T.C. and C.-C.Y.; methodology, W.-T.C. and C.-C.Y.; validation, W.-T.C.; formal analysis, W.-T.C. and C.-C.Y.; investigation, W.-T.C., and C.-C.Y.; resources, C.-C.Y.; writing—original draft preparation, W.-T.C. and C.-C.Y.; writing—review and editing, W.-T.C. and C.-C.Y.; visualization, W.-T.C.; supervision, C.-C.Y.; project administration, W.-T.C. and C.-C.Y.; funding acquisition, C.-C.Y. All authors have read and agreed to the published version of the manuscript.
Funding
This research was funded by Ministry of Science and Technology, Taiwan, under grant number 107-2221-E-019-010-MY3 and 110-2221-E-019-030-.
Institutional Review Board Statement
Not applicable.
Informed Consent Statement
Not applicable.
Data Availability Statement
Contact the correspondence author for data.
Acknowledgments
This study was provided by the Ministry of Science and Technology (MOST) and Ministry of Education (MoE), Taiwan.
Conflicts of Interest
The authors declare no conflict of interest.
References
- Flather, R.A. Storm surges. In Encyclopaedia of Ocean Science, 1st ed.; Steele, J., Thorpe, S., Turekian, K., Eds.; Academia: San Diego, CA, USA, 2001; pp. 2882–2892. [Google Scholar]
- Pielke, R.A., Jr.; Gratz, J.; Landsea, C.W.; Collins, D.; Saunders, M.A.; Musulin, R. Normalized hurricane damage in the United States: 1900–2005. Nat. Hazards Rev. 2008, 9, 29–42. [Google Scholar] [CrossRef]
- You, S.H.; Seo, J.W. Storm surge prediction using an artificial neural network model and cluster analysis. Nat. Hazards 2009, 51, 97–114. [Google Scholar] [CrossRef]
- IPCC. Climate Change 2007: Impacts, Adaptation and Vulnerability. Contribution of Working Group II to the Fourth Assessment Report of the Intergovernmental Panel on Climate Change; Parry, M.L., Canziani, O.F., Palutikof, J.P., van der Linden, P.J., Hanson, C.E., Eds.; Cambridge University Press: Cambridge, UK, 2007; p. 976. [Google Scholar]
- Webster, P.J.; Holland, G.J.; Curry, J.A.; Chang, H.R. Changes in tropical cyclone number, duration, and intensity in a warming environment. Science 2005, 309, 1844–1846. [Google Scholar] [CrossRef] [Green Version]
- Emanuel, K.A. Increasing destructiveness of tropical cyclones over the past 30 years. Nature 2005, 436, 686–688. [Google Scholar] [CrossRef]
- Torres, M.J.; Hashemi, M.R.; Hayward, S.; Spaulding, M.; Ginis, I.; Grilli, S.T. Role of Hurricane Wind Models in Accurate Simulation of Storm Surge and Waves. J. Waterw. Port Coast. Ocean. Eng. 2019, 145, 04018039. [Google Scholar] [CrossRef]
- Wolf, J.; Flather, R.A. Modelling waves and surges during the 1953 storm. Philos. Trans. R. Soc. A Math. Phys. Eng. Sci. 2005, 363, 1359–1375. [Google Scholar] [CrossRef]
- Conner, W.C.; Kraft, K.H.; Harris, D.L. Empirical methods for forecasting the maximum storm tide due to hurricanes and other tropical storms. Mon. Weather. Rev. 1957, 85, 113–116. [Google Scholar] [CrossRef]
- Lee, T.L. Neural network prediction of a storm surge. Ocean. Eng. 2006, 33, 483–494. [Google Scholar] [CrossRef]
- Sheng, Y.P., Jr.; Davis, R.; Figueiredo, B.; Liu, H.; Liu, R.; Luettuch, V.A.; Paramygin, R.; Weaver, R.; Weisberg, L.; Xie, L.; et al. A regional testbed for storm surge and coastal inundation models—An Overview. Estuar. Coast. Modeling 2012, 476–495. [Google Scholar]
- Wu, G.; Shi, F.; Kirby, J.T.; Liang, B.; Shi, J. Modeling wave effects on storm surge and coastal inundation. Coast. Eng. 2018, 140, 371–382. [Google Scholar] [CrossRef]
- Divoky, D.; Battalio, R.; Dean, B.; Collins, I.; Hatheway, D.; Scheffner, N. Storm Meteorology. FEMA Coastal Flood Hazard Analysis and Mapping Guidelines, Focused Study Report; Technical Report, FEMA Technical Report; Federal Emergency Management Agency: Washington, DC, USA, 2005.
- Tsai, C.P.; You, C.Y. Development of models for maximum and time variation of storm surges at the Tanshui estuary. Nat. Hazards Earth Syst. Sci. 2014, 14, 2313–2320. [Google Scholar] [CrossRef] [Green Version]
- Chao, W.T.; Young, C.C.; Hsu, T.W.; Liu, C.C.; Liu, C.Y. Long-Lead-Time Prediction of Storm Surge Using Artificial Neural Networks and Effective Typhoon Parameters: Revisit and Deeper Insight. Water 2020, 12, 2394. [Google Scholar] [CrossRef]
- Heaps, N.S. A two-dimensional numerical sea model. Phil. Trans. R. Soc. A 1969, 265, 93–137. [Google Scholar]
- Bode, L.; Hardy, T.A. Progress and recent developments in storm surge modeling. J. Hydraul. Eng. 1997, 123, 315–331. [Google Scholar] [CrossRef]
- Dietrich, J.C.; Muhammad, A.; Curcic, M.; Fathi, A.; Dawson, C.N.; Chen, S.S.; Luettich, R.A. Sensitivity of storm surge predictions to atmospheric forcing during Hurricane Isaac. J. Waterw. Port Coast. Ocean. Eng. 2018, 144, 04017035. [Google Scholar] [CrossRef]
- Murty, P.L.N.; Srinivas, K.; Pattabhi Rama Rao, E.; Bhaskaran, P.K.; Shenoi, S.S.C.; Padmanabham, J. Improved cyclonic wind fields over the Bay of Bengal and their applications in storm surge and wave computation. Appl. Ocean. Res. 2020, 95, 102048. [Google Scholar] [CrossRef]
- Wang, S.; Yang, X.; Li, H.; Ren, K.; Yin, X.; Hu, D.; Du, Y. An improved asymmetric hurricane parametric model based on cross-polarization SAR observations. IEEE J. Sel. Top. Appl. Earth Obs. Remote Sens. 2021, 14, 1411–1422. [Google Scholar] [CrossRef]
- Powell, M.D.; Houston, S.H.; Amat, L.R.; Morisseau-Leroy, N. The HRD real-time hurricane wind analysis system. J. Wind Eng. Ind. Aerodyn. 1998, 77, 53–64. [Google Scholar] [CrossRef]
- Powell, M.D.; Murillo, S.; Dodge, P.; Uhlhorn, E.; Gamache, J.; Cardone, V.; Cox, A.; Otero, S.; Carrasco, N.; Annane, B. Reconstruction of Hurricane Katrina’s wind fields for storm surge and wave hindcasting. Ocean. Eng. 2010, 37, 26–36. [Google Scholar] [CrossRef]
- Ruiz-salcines, P.; Salles, P.; Robles-Díaz, L.; Gabriel, D.-H.; Torres-Freyermuth, A.; Appendini, C.M. On the Use of Parametric Wind Models for Wind Wave Modeling under Tropical Cyclones. Water 2019, 11, 2044. [Google Scholar] [CrossRef] [Green Version]
- Shao, Z.X.; Liang, B.C.; Li, H.J.; Wu, Z.H. Blended wind fields for wave modeling of tropical cyclones in the South China Sea and East China Sea. Appl. Ocean. Res. 2018, 71, 20–33. [Google Scholar] [CrossRef]
- Chang, H.K.; Chien, W.A. A fuzzy-neural hybrid system of simulating typhoon waves. Coast. Eng. 2006, 53, 737–748. [Google Scholar] [CrossRef]
- Tsai, C.C.; Wei, C.C.; Hou, T.H.; Hsu, T.W. Artificial neural network for forecasting wave heights along a ship’s route during hurricanes. J. Waterw. Port Coast. Ocean. Eng. 2018, 144, 04017042. [Google Scholar] [CrossRef]
- Kim, S.; Pan, S.; Mase, H. Artificial neural network-based storm surge forecast model: Practical application to Sakai Minato, Japan. Appl. Ocean. Res. 2019, 91, 101871. [Google Scholar] [CrossRef]
- Phadke, A.C.; Martino, C.D.; Cheung, K.F.; Houston, S.H. Modeling of tropical cyclone winds and waves for emergency management. Ocean. Eng. 2003, 30, 553–578. [Google Scholar] [CrossRef]
- Houston, S.H.; Powell, M.D. Observed and modeled wind and water-level response from tropical storm Marco (1990). Weather Forecast. 1994, 9, 427–439. [Google Scholar] [CrossRef] [Green Version]
- Houston, S.H.; Shaffer, W.A.; Powell, M.D.; Chen, J. Comparisons of HRD and SLOSH surface wind fields in hurricanes: Implications for storm surge modeling. Weather Forecast. 1999, 14, 671–686. [Google Scholar] [CrossRef] [Green Version]
- Holland, G.J. An analytic model of the wind and pressure profiles in hurricanes. Mon. Weather Rev. 1980, 108, 1212–1218. [Google Scholar] [CrossRef]
- DeMaria, M.; Aberson, S.; Ooyama, K.V.; Load, S.J. A nested spectral model for hurricane track forecasting. Mon. Weather Rev. 1992, 120, 1628–1643. [Google Scholar] [CrossRef] [Green Version]
- Myers, V.A. Maximum hurricane winds. Bull. Am. Meteorol. Soc. 1957, 38, 227–228. [Google Scholar]
- Schloemer, R.W. Analysis and synthesis of hurricane wind patterns over Lake Okechobee, Florida. In Hydromet Report, NO. 31; Govt Print Office: Washington, DC, USA, 1954; p. 49. [Google Scholar]
- Emanuel, K. Tropical Cyclone Energetics and Structure. In Atmospheric Turbulence and Mesoscale Meteorology; Fedorovich, E., Rotunno, R., Stevens, B., Eds.; Cambridge University Press: Cambridge, UK, 2004; p. 280. [Google Scholar]
- Jelesnianski, C.P. A numerical calculation of storm tides induced by a tropical storm impinging on a continental shelf. Mon. Weather Rev. 1965, 93, 343–358. [Google Scholar] [CrossRef] [Green Version]
- Jelesnianski, C.P.; Chen, J.; Shaffer, W.A. SLOSH: Sea, Lake, and Overland Surges from Hurricanes; NOAA Technical Report NWS 48; National Oceanic and Atmospheric Administration, U.S. Department of Commerce: Silver Spring, MD, USA, 1992; pp. 1–71.
- Knaff, J.A.; Sampson, C.R.; DeMaria, M.; Marchock, T.P.; Gross, J.M.; McAdie, C.J. Statistical tropical cyclone wind radii prediction using climatology and persistence. Weather Forecast. 2007, 22, 781–791. [Google Scholar] [CrossRef]
- Chen, W.B.; Liu, W.C.; Hsu, M.H. Predicting typhoon-induced storm surge tide with a two-dimensional hydrodynamic model and artificial neural network model. Nat. Hazards Earth Syst. Sci. 2012, 12, 3799–3809. [Google Scholar] [CrossRef]
- Wijnands, J.S.; Qian, G.; Kuleshov, Y. Spline-based modelling of near-surface wind speeds in tropical cyclones. Appl. Math. Model 2016, 40, 8685–8707. [Google Scholar] [CrossRef]
- Olfatech, M.; Callaghan, D.P.; Nielsen, P.; Baldock, T.E. Tropical cyclone wind field asymmetry-development and evaluation of a new parametric model. J. Geophys. Res. 2017, 122, 458–469. [Google Scholar] [CrossRef]
- Lin, N.; Chavas, D. On hurricane parametric wind and applications in storm surge modeling. J. Geophys. Res. 2012, 117, D09120. [Google Scholar] [CrossRef]
- Sztobryn, M. Forecast of storm surge by means of artificial neural network. J. Sea Res. 2003, 49, 317–322. [Google Scholar] [CrossRef]
- Lee, T.L. Back-propagation neural network for the prediction on the short-term storm surge in Taichung harbor, Taiwan. Eng. Appl. Artif. Intell. 2008, 21, 63–72. [Google Scholar] [CrossRef]
- Lee, T.L. Predictions of typhoon storm surge in Taiwan using artificial neural networks. Adv. Eng. Softw. 2009, 40, 1200–1206. [Google Scholar] [CrossRef]
- Tseng, C.M.; Jan, C.D.; Wang, J.S.; Wang, C.M. Application of artificial neural networks in typhoon surge forecasting. Ocean. Eng. 2007, 34, 1757–1768. [Google Scholar] [CrossRef]
- Benitez, J.M.; Castro, J.L.; Requena, I. Are artificial neural networks black boxes? IEEE Trans. Neural Netw. 1997, 8, 1156–1164. [Google Scholar] [CrossRef]
- Zhang, Q.; Yang, Y.; Liu, Y.; Wu, Y.N.; Zhu, S.C. Unsupervised learning of neural networks to explain neural networks. arXiv 2018, arXiv:1805.07468. [Google Scholar]
- Kim, S.; Matsumi, Y.; Pan, S.; Mase, H. A real-time forecast model using artificial neural network for after runner storm surges on the Tottori coast, Japan. Ocean Eng. 2016, 122, 44–53. [Google Scholar] [CrossRef]
- Young, C.C.; Liu, W.C.; Wu, M.C. A physically based and machine learning hybrid approach for accurate rainfall-runoff modeling during extreme typhoon events. Appl. Soft Comput. 2017, 53, 205–216. [Google Scholar] [CrossRef]
- Young, C.C.; Liu, W.C. Prediction and modelling of rainfall–runoff during typhoon events using a physically-based and artificial neural network hybrid model. Hydrol. Sci. J. 2015, 60, 2102–2116. [Google Scholar] [CrossRef]
- Pawlowicz, R.; Beardsley, B.; Lentz, S. Classical tidal harmonic analysis including error estimates in MATLAB using T_TIDE. Comput. Geosci. 2002, 28, 929–937. [Google Scholar] [CrossRef]
- Welander, P. Numerical predictions of storm surges. Adv. Geophys. 1961, 8, 315–379. [Google Scholar]
- Depperman, C.E. Notes on the origin and structure of Phillipine typhoons. Bull. Am. Meteorol. Soc. 1947, 28, 399–404. [Google Scholar] [CrossRef] [Green Version]
- Rankine, W.J.M. A Manual of Applied Physics; Charles Griffin & Co.: London, UK, 1882. [Google Scholar]
- Rihel, H. Some relationships between wind and thermal structure of steady state hurricanes. J. Atmos. Sci. 1963, 20, 276–287. [Google Scholar] [CrossRef] [Green Version]
- Emanuel, K.A. An air-sea interaction theory for tropical cyclones. Part I: Steady-State Maintenance. J. Atmos. Sci. 1986, 43, 585–605. [Google Scholar] [CrossRef]
- Holland, G.J.; Belanger, J.I.; Fritz, A. A Revised Model for Radial Profiles of Hurricane Winds. Mon. Weather Rev. 2010, 138, 4393–4401. [Google Scholar] [CrossRef]
- Levinson, D.H.; Vickery, P.J.; Resio, D.T. A review of the climatological characteristics of landfalling Gulf hurricanes for wind, wave, and surge hazard estimation. Ocean Eng. 2010, 37, 13–25. [Google Scholar] [CrossRef]
- Young, I.; Sobey, R. The Numerical Prediction of Tropical Cyclone Wind-Waves; Department of Civil & Systems Engineering, James Cook University of North Queensland: Townsville, Australia, 1981. [Google Scholar]
- Chavas, D.R.; Emanuel, K.A. A QuikSCAT climatology of tropical cyclone size. Geophys. Res. Lett. 2010, 37, 10–13. [Google Scholar] [CrossRef] [Green Version]
- Emanuel, K.; Ravela, S. Synthetic Storm Simulation for Wind Risk Assessment. In Storm Surge Barriers to Protect New York City Against the Deluge, 1st ed.; American Society of Civil Engineers: Reston, VA, USA, 2012; pp. 15–36. [Google Scholar]
- Emanuel, K.; Ravela, S.; Vivant, E.; Risi, C. A statistical deterministic approach to hurricane risk assessment. Bull. Am. Meteorol. Soc. 2006, 87, 299–314. [Google Scholar] [CrossRef]
- Emanuel, K.; Rotunno, R. Self-Stratification of Tropical Cyclone Outflow. Part I: Implications for Storm Structure. J. Atmos. Sci. 2011, 68, 2236–2249. [Google Scholar] [CrossRef]
- Hagan, M.T.; Menhaj, M. Training feedforward networks with the Marquardt algorithm. IEEE Trans. Neural Netw. 1994, 5, 989–993. [Google Scholar] [CrossRef]
- Huang, Y.H.; Wu, C.C.; Wang, Y. The influence of island topography on typhoon track deflection. Mon. Weather Rev. 2011, 139, 1708–1727. [Google Scholar] [CrossRef]
Figure 1.
Selected historical typhoon events (2005-2014) along tracks (a) No. 2 and (b) No. 3, along with total water level, astronomical tide, and storm surge at Longdong station (red triangle) during (c) Typhoon Krosa and (d) Typhoon Haitang.
Figure 1.
Selected historical typhoon events (2005-2014) along tracks (a) No. 2 and (b) No. 3, along with total water level, astronomical tide, and storm surge at Longdong station (red triangle) during (c) Typhoon Krosa and (d) Typhoon Haitang.

Figure 2.
Sketch of effective controlling parameters for storm surge prediction in (a) the pure neural network model and (b) the parametric cyclone and neural network hybrid model.
Figure 2.
Sketch of effective controlling parameters for storm surge prediction in (a) the pure neural network model and (b) the parametric cyclone and neural network hybrid model.

Figure 3.
Architectures of (a) the pure neural network model and (b) the parametric cyclone and neural network hybrid model.
Figure 3.
Architectures of (a) the pure neural network model and (b) the parametric cyclone and neural network hybrid model.

Figure 4.
Flow chart of the proposed parametric cyclone and neural network hybrid model.

Figure 5.
Temporal variations in typhoon parameters and storm surge at Longdong during Krosa event (training): (a) the distance between the typhoon center and tidal station (blue) and radius of the storm (black); (b) the relative angle (black); (c) the observed central pressure (green) and wind speed (blue); (d) estimated local pressure (green) and winds from MH (orange), MR (yellow), SH (purple), E4 (green), E11 (light blue), and YSB (brown); (e) storm surge observation (circles) and predictions by MH (orange), MR (yellow), SH (purple), E4 (green), E11 (light blue), and YSB (brown).

Figure 6.
Temporal variations in typhoon parameters and storm surge at Longdong during Haitang event (validation): (a) the distance between the typhoon center and tidal station (blue) and radius of the storm (black); (b) the relative angle (black); (c) the observed central pressure (green) and wind speed (blue); (d) estimated local pressure (green) and winds from MH (orange), MR (yellow), SH (purple), E4 (green), E11 (light blue), and YSB (brown); (e) storm surge observation (circles) and predictions by MH (orange), MR (yellow), SH (purple), E4 (green), E11 (light blue), and YSB (brown).

Figure 7.
Long lead-time storm surge predictions by the proposed hybrid approach with different parametric cyclone models for the Krosa event (training): (a) t + 2; (b) t + 4; (c) t + 6; (d) t + 8.
Figure 7.
Long lead-time storm surge predictions by the proposed hybrid approach with different parametric cyclone models for the Krosa event (training): (a) t + 2; (b) t + 4; (c) t + 6; (d) t + 8.

Figure 8.
Long lead-time storm surge predictions by the proposed hybrid approach with different parametric cyclone models for the Haitang event (validation): (a) t + 2; (b) t + 4; (c) t + 6; (d) t + 8.
Figure 8.
Long lead-time storm surge predictions by the proposed hybrid approach with different parametric cyclone models for the Haitang event (validation): (a) t + 2; (b) t + 4; (c) t + 6; (d) t + 8.

Figure 9.
Scatter plots for the measured and predicted storm surges in all training events: the proposed hybrid approach using the different parametric cyclone models (a) MH, (b) MR, (c) SH, (d) E4, (e) E11 and (f) YSB (from top to bottom) and different prediction lead times (various symbols).
Figure 9.
Scatter plots for the measured and predicted storm surges in all training events: the proposed hybrid approach using the different parametric cyclone models (a) MH, (b) MR, (c) SH, (d) E4, (e) E11 and (f) YSB (from top to bottom) and different prediction lead times (various symbols).

Figure 10.
Scatter plots for the measured and predicted storm surges in all validation events: the proposed hybrid approach using the different parametric cyclone models (a) MH, (b) MR, (c) SH, (d) E4, (e) E11, and (f) YSB (from top to bottom) and different prediction lead times (various symbols).
Figure 10.
Scatter plots for the measured and predicted storm surges in all validation events: the proposed hybrid approach using the different parametric cyclone models (a) MH, (b) MR, (c) SH, (d) E4, (e) E11, and (f) YSB (from top to bottom) and different prediction lead times (various symbols).

Figure 11.
Prediction performance (a,c,e) and relative improvement (b,d,f) in terms of RMSE, CC, and CE for all training events.
Figure 11.
Prediction performance (a,c,e) and relative improvement (b,d,f) in terms of RMSE, CC, and CE for all training events.

Figure 12.
Prediction performance (a,c,e) and relative improvement (b,d,f) in terms of RMSE, CC, and CE for all validation events.
Figure 12.
Prediction performance (a,c,e) and relative improvement (b,d,f) in terms of RMSE, CC, and CE for all validation events.

Figure 13.
Prediction performances of the SLPVRF, SPV, and hybrid models (E4) in terms of RMSE for (a) Krosa and (b) Haitang events.
Figure 13.
Prediction performances of the SLPVRF, SPV, and hybrid models (E4) in terms of RMSE for (a) Krosa and (b) Haitang events.

Figure 14.
Comparison the convergence of RMSE during training for the SLPVRF, SPV, and hybrid models (E4) in eight-hour-ahead prediction.
Figure 14.
Comparison the convergence of RMSE during training for the SLPVRF, SPV, and hybrid models (E4) in eight-hour-ahead prediction.


Table 1.
Central pressure (Pc), maximum wind speed (Vc), and radius (R7) of typhoons as well as maximum surge (S) in historical events.
Table 1.
Central pressure (Pc), maximum wind speed (Vc), and radius (R7) of typhoons as well as maximum surge (S) in historical events.
| Name | Year | Track | Pc (hPa), | Vc (m/s), | R7 (km) | Max. S (cm) |
|---|---|---|---|---|---|---|
| Haitang * | 2005 | 3 | 912 | 55 | 280 | 103 |
| Talim | 3 | 920 | 53 | 250 | 144 | |
| Longwang | 3 | 925 | 51 | 200 | 44 | |
| Bilis | 2006 | 2 | 978 | 25 | 300 | 41 |
| Kaemi | 3 | 960 | 38 | 200 | 15 | |
| Sepat | 2007 | 3 | 920 | 53 | 250 | 20 |
| Krosa | 2 | 925 | 51 | 300 | 183 | |
| Kalmaegi | 2008 | 2 | 970 | 33 | 120 | 23 |
| Fungwong | 3 | 948 | 43 | 220 | 43 | |
| Sinlaku | 2 | 925 | 53 | 280 | 53 | |
| Morakot * | 2009 | 3 | 955 | 40 | 250 | 71 |
| Saola | 2012 | 2 | 960 | 38 | 220 | 39 |
| Soulik | 2013 | 2 | 925 | 51 | 280 | 160 |
| Matmo | 2014 | 3 | 960 | 38 | 200 | 11 |
Note(s): * indicates validation events.
Table 2.
Input parameters used in our previous work [15] and in the present study for storm surge prediction.
Table 2.
Input parameters used in our previous work [15] and in the present study for storm surge prediction.
| Type | Input Parameters |
|---|---|
| SPV | S(t), ∆Pc(t), Vc (t), θR (t) |
| SPVLRF | S(t), L(t), ∆Pc(t), Vc (t), θR (t), R7(t), UF(t), θF(t) |
| Parametric cyclone models | S(t), ∆Pp(t), Vp (t), θP * (t) |
Note(s): * θP is wind direction as estimated from the parametric cyclone models.
Table 3.
Assessment of different lead-time surge predictions during Krosa event (training).
| Lead Time (h) | |||||||||||||||
|---|---|---|---|---|---|---|---|---|---|---|---|---|---|---|---|
| 1 | 2 | 4 | 6 | 8 | |||||||||||
| RMSE | CC | CE | RMSE | CC | CE | RMSE | CC | CE | RMSE | CC | CE | RMSE | CC | CE | |
| SLPVRF | 5.57 | 0.990 | 0.980 | 7.81 | 0.981 | 0.962 | 11.64 | 0.959 | 0.916 | 14.69 | 0.933 | 0.869 | 15.47 | 0.927 | 0.857 |
| SPV | 7.67 | 0.982 | 0.963 | 8.83 | 0.975 | 0.951 | 13.30 | 0.944 | 0.891 | 17.22 | 0.909 | 0.820 | 24.85 | 0.802 | 0.630 |
| MH | 7.01 | 0.984 | 0.969 | 7.27 | 0.983 | 0.967 | 12.80 | 0.951 | 0.907 | 14.63 | 0.941 | 0.870 | 15.03 | 0.943 | 0.865 |
| MR | 6.35 | 0.987 | 0.974 | 7.75 | 0.981 | 0.962 | 10.75 | 0.963 | 0.929 | 12.68 | 0.961 | 0.902 | 14.82 | 0.949 | 0.867 |
| SH | 7.04 | 0.985 | 0.968 | 8.20 | 0.978 | 0.957 | 11.25 | 0.962 | 0.924 | 12.50 | 0.967 | 0.904 | 15.30 | 0.963 | 0.860 |
| EM04 | 6.38 | 0.987 | 0.974 | 9.12 | 0.974 | 0.947 | 11.18 | 0.962 | 0.922 | 11.90 | 0.958 | 0.894 | 13.78 | 0.941 | 0.844 |
| EM11 | 7.06 | 0.984 | 0.968 | 9.10 | 0.974 | 0.948 | 11.00 | 0.966 | 0.925 | 13.62 | 0.965 | 0.887 | 16.33 | 0.960 | 0.840 |
| YSB | 6.59 | 0.986 | 0.972 | 6.78 | 0.986 | 0.972 | 13.30 | 0.944 | 0.890 | 15.56 | 0.934 | 0.852 | 16.50 | 0.938 | 0.836 |
Table 4.
Assessment of different lead-time surge predictions during Haitang event (validation).
| Lead Time (h) | |||||||||||||||
|---|---|---|---|---|---|---|---|---|---|---|---|---|---|---|---|
| 1 | 2 | 4 | 6 | 8 | |||||||||||
| RMSE | CC | CE | RMSE | CC | CE | RMSE | CC | CE | RMSE | CC | CE | RMSE | CC | CE | |
| SLPVRF | 8.07 | 0.964 | 0.924 | 11.54 | 0.937 | 0.846 | 16.47 | 0.852 | 0.690 | 18.31 | 0.834 | 0.624 | 19.74 | 0.847 | 0.570 |
| SPV | 8.30 | 0.959 | 0.919 | 9.75 | 0.946 | 0.890 | 13.60 | 0.911 | 0.789 | 14.64 | 0.880 | 0.760 | 15.81 | 0.850 | 0.725 |
| MH | 8.42 | 0.962 | 0.917 | 9.80 | 0.949 | 0.889 | 13.70 | 0.894 | 0.786 | 15.88 | 0.852 | 0.718 | 16.35 | 0.848 | 0.706 |
| MR | 8.30 | 0.963 | 0.918 | 9.06 | 0.956 | 0.905 | 13.75 | 0.891 | 0.784 | 15.40 | 0.865 | 0.734 | 16.40 | 0.850 | 0.704 |
| SH | 8.67 | 0.955 | 0.911 | 10.24 | 0.945 | 0..878 | 13.90 | 0.893 | 0.779 | 15.93 | 0.865 | 0.715 | 16.64 | 0.851 | 0.695 |
| EM04 | 8.35 | 0.960 | 0.918 | 9.20 | 0.952 | 0.902 | 13.75 | 0.887 | 0.784 | 15.05 | 0.870 | 0.738 | 15.73 | 0.863 | 0.734 |
| EM11 | 8.47 | 0.961 | 0.916 | 10.59 | 0.940 | 0.870 | 13.81 | 0.895 | 0.782 | 15.98 | 0.847 | 0.714 | 16.12 | 0.847 | 0.714 |
| YSB | 8.03 | 0.964 | 0.924 | 9.59 | 0.949 | 0.893 | 14.69 | 0.878 | 0.753 | 16.66 | 0.850 | 0.690 | 17.25 | 0.837 | 0.672 |
Table 5.
Assessment of different lead-time surge predictions in terms of RMSE (m) for all the training and validation events.
Table 5.
Assessment of different lead-time surge predictions in terms of RMSE (m) for all the training and validation events.
| RMSE (cm) | ||||||||||
|---|---|---|---|---|---|---|---|---|---|---|
| Training Cases | Validation Cases | |||||||||
| Lead Time (h) | 1 | 2 | 4 | 6 | 8 | 1 | 2 | 4 | 6 | 8 |
| SLPVRF | 4.02 | 6.24 | 8.12 | 8.72 | 11.18 | 7.76 | 9.01 | 13.32 | 16.09 | 16.50 |
| SPV | 4.57 | 6.86 | 8.66 | 9.66 | 11.95 | 7.24 | 11.42 | 15.19 | 17.35 | 17.40 |
| MH | 4.41 | 6.28 | 9.48 | 10.76 | 11.22 | 7.97 | 9.61 | 13.62 | 15.31 | 15.70 |
| MR | 4.35 | 6.61 | 9.67 | 11.18 | 11.78 | 7.28 | 9.05 | 12.56 | 13.63 | 15.01 |
| SH | 4.34 | 6.56 | 9.60 | 10.3 | 11.31 | 7.41 | 9.06 | 13.64 | 16.72 | 16.75 |
| EM04 | 4.28 | 6.82 | 9.74 | 10.55 | 11.27 | 7.23 | 8.89 | 12.91 | 16.36 | 16.48 |
| EM11 | 4.41 | 6.96 | 9.30 | 11.16 | 11.63 | 7.42 | 9.72 | 14.71 | 15.41 | 16.36 |
| YSB | 4.47 | 6.29 | 8.99 | 11.4 | 11.67 | 7.10 | 10.02 | 13.68 | 15.63 | 16.90 |
Publisher’s Note: MDPI stays neutral with regard to jurisdictional claims in published maps and institutional affiliations. |
© 2022 by the authors. Licensee MDPI, Basel, Switzerland. This article is an open access article distributed under the terms and conditions of the Creative Commons Attribution (CC BY) license (https://creativecommons.org/licenses/by/4.0/).
Share and Cite
MDPI and ACS Style
Chao, W.-T.; Young, C.-C. Accurate Storm Surge Prediction with a Parametric Cyclone and Neural Network Hybrid Model. Water 2022, 14, 96. https://doi.org/10.3390/w14010096
AMA Style
Chao W-T, Young C-C. Accurate Storm Surge Prediction with a Parametric Cyclone and Neural Network Hybrid Model. Water. 2022; 14(1):96. https://doi.org/10.3390/w14010096
Chicago/Turabian StyleChao, Wei-Ting, and Chih-Chieh Young. 2022. "Accurate Storm Surge Prediction with a Parametric Cyclone and Neural Network Hybrid Model" Water 14, no. 1: 96. https://doi.org/10.3390/w14010096
Note that from the first issue of 2016, this journal uses article numbers instead of page numbers. See further details here.