Review

Mesilla/Conejos-Médanos Basin: U.S.-Mexico Transboundary Water Resources

by
Andrew J. Robertson
1,*,
Anne-Marie Matherne
1,
Jeff D. Pepin
1,
Andre B. Ritchie
1,
Donald S. Sweetkind
2,
Andrew P. Teeple
3,
Alfredo Granados-Olivas
4,
Ana Cristina García-Vásquez
5,
Kenneth C. Carroll
6,
Erek H. Fuchs
7 and
Amy E. Galanter
1
1
U.S. Geological Survey, New Mexico Water Science Center, Albuquerque, NM 87113, USA
2
U.S. Geological Survey, Geosciences and Environmental Change Science Center, Denver, CO 80225, USA
3
U.S. Geological Survey, Oklahoma-Texas Water Science Center, Austin, TX 78754, USA
4
Instituto de Ingeniería y Tecnología, Ciudad Juárez, Universidad Autónoma de Ciudad Juárez, Ciudad Juárez 32500, Mexico
5
Water Science & Management, New Mexico State University, Las Cruces, NM 88003, USA
6
Plant & Environmental Sciences Department, New Mexico State University, Las Cruces, NM 88003, USA
7
Elephant Butte Irrigation District, Las Cruces, NM 88005, USA
*
Author to whom correspondence should be addressed.
Water 2022, 14(2), 134; https://doi.org/10.3390/w14020134
Submission received: 31 August 2021 / Revised: 11 December 2021 / Accepted: 18 December 2021 / Published: 6 January 2022
(This article belongs to the Special Issue Advances in Transboundary Aquifer Assessment)

Abstract

:
Synthesizing binational data to characterize shared water resources is critical to informing binational management. This work uses binational hydrogeology and water resource data in the Mesilla/Conejos-Médanos Basin (Basin) to describe the hydrologic conceptual model and identify potential research that could help inform sustainable management. The Basin aquifer is primarily composed of continuous basin-fill Santa Fe Group sediments, allowing for transboundary throughflow. Groundwater flow, however, may be partially or fully restricted by intrabasin uplifts and limited recharge. The shallow groundwater in the Rio Grande alluvium receives recharge from the Rio Grande and responds to changes in water supply and demand. About 11% of Rio Grande alluvial groundwater volume is recharged annually, an amount that is less than recent withdrawals. Potentially recoverable fresh to slightly brackish groundwater was estimated at 82,600 cubic hectometers in the U.S. portion of the Basin and 69,100 cubic hectometers in the Mexican portion. Alluvial groundwater geochemistry is governed by the evaporative concentration of the Rio Grande and agricultural diversions, whereas deeper groundwater geochemistry is governed by mixing and geochemical processes. Continued refinements to storage estimates, the water budget, and deep groundwater extent and geochemistry can improve estimates of sustainable use and inform alternative water sources.

1. Introduction

As in many arid regions, increasing water demand due to increasing population and agricultural uses within the Mesilla/Conejos-Médanos Basin (Basin), combined with multi-year drought conditions [1], has resulted in diminished surface-water supplies and increased reliance on groundwater withdrawals. The Basin, which is largely defined by the presence of basin-fill sediments and bounding uplifts, is home to a regionally important transboundary aquifer underlying portions of Texas and New Mexico (U.S.), as well as Chihuahua (Mexico) (Figure 1). The Rio Grande, which flows through the northeastern portion of the Basin (Figure 1), along with groundwater, provides water for the residents and industries of Las Cruces, New Mexico; El Paso, Texas; and Ciudad Juárez, Chihuahua, along with numerous smaller communities. The Basin is also home to one of the largest agricultural producing regions in the state of New Mexico [2]. The high demands on the water resources, coupled with decades of reduced streamflow, are resulting in reduced groundwater supplies. The New Mexico Universities Working Group on Water Supply Vulnerabilities (2015) reports that the groundwater resources in the Basin “…may no longer have the capacity to provide a reliable, supplemental supply during extended drought conditions and with the current levels of intensive use of groundwater.” [3].
The transboundary and interstate nature of the Basin aquifer adds to the complexity of resolving competing demands. The research needs for a scarce conjunctive-use resource that is managed by multiple governments benefits from not only understanding of the physical characteristics and limits of the resource but cooperation and common objectives of stakeholders. Surface water of the Rio Grande (known as the Rio Bravo in Mexico) is allocated according to a series of legal agreements, including the tri-state (Colorado, New Mexico, and Texas) Rio Grande Compact, the federal Rio Grande Project, and the 1906 U.S.-Mexico treaty. In contrast to the complex legal structures apportioning surface water, there are no state compacts or binational treaties to govern the apportionment of groundwater. Pending (2022) lawsuits (State of Texas v. State of New Mexico and State of Colorado [No. 141, Orig.] and the Rio Grande adjudication, New Mexico v. Elephant Butte Irrigation District, et al. [No. CV 96-888]) add uncertainty to the existing legal framework and future allocation of the limited resources, putting increased emphasis and importance on the Basin and resource characterization to support sound management decisions.
The objective of this work is to summarize the state of the hydrologic science in the Basin, describe the working hydrologic conceptual model and water budget, and identify potential research that would add key information to assist sustainable binational management. The U.S. portion of the Basin is often referred to as the Mesilla Basin and will be referred to as the Mesilla portion of the Basin in this report. The Mexican portion of the Basin is often referred to as the Conejos-Médanos aquifer and will be referred to as the Conejos-Médanos portion of the Basin in this report. Much of the work in the Basin has focused on either the U.S. or Mexican portion, and interpretative study areas generally do not extend across the international border. Most of the published work available and cited in this article is from the U.S. side of the Basin and primarily focuses on the Mesilla Valley (Figure 1). This work seeks to synthesize that research and describe it in the context of the international resource. Specifically, Basin characteristics, surface water, groundwater, and water-chemistry information are used to (1) determine the extent of the regional aquifer and estimate the amount of groundwater exchange between Mesilla and Conejos-Médanos portions of the aquifer; (2) evaluate prior estimates of groundwater storage in the regional aquifer and develop a revised estimate using updated information, (3) determine the extent and amount of present-day recharge, and (4) summarize the source and mechanisms of salinity near Paso del Norte, where the Rio Grande and groundwater flow out of the Basin.
To bridge the disparate research and gain a more complete understanding of the regional aquifer system, new estimates of storage and water-budget components are introduced, as well as a binational water-level map. This work introduces new storage estimates for the Mesilla portion of the Basin using a newly constructed digital hydrogeologic framework [7], as well as for the Conejos-Médanos portion of the Basin, for which storage has not been previously estimated. An international water-level map that combines groundwater elevation data from both sides of the international border was developed in order to visualize potential groundwater flow through the Basin. Finally, a water-budget approach is presented that includes a new estimate of groundwater flow across the international border. Three versions of the water budget are developed under different assumptions by using data for the period of record, a dry period, and a wet period to compare differences resulting from surface-water availability.
This paper is organized into conventional water resource assessment sections, and the following narrative provides a roadmap for how each these sections address the objective and research objectives listed above. To quantify the amount of water available in the Basin, Section 3 summarizes the hydrogeology of the Basin sediments that make up the aquifer and bounding features, along with descriptions of faults and sub-basins that may affect groundwater flow. Streamflow characteristics and variability are described in Section 4.1. Estimates of the aquifer dimensions and hydrologic properties are then combined with groundwater levels in Section 4.2 to estimate the amount of groundwater in storage in the Basin. Using the supporting evidence of groundwater fluctuations in Section 4.2 and water chemistry in Section 5, the extent and fraction of present-day recharge from surface water is estimated in the water budgets presented in Section 6. Potential contributors to salinity and their extent are introduced in Section 4 and further developed in Section 5. Uncertainty and gaps in data and understanding are noted throughout the paper and are summarized in Section 7.

2. Materials and Methods

The information and research summarized in this paper were gathered from published data and interpretations. Several previous and current federal, state, and local programs are responsible for the large body of work contributing to our understanding of the Basin. Key works used in this paper to estimate groundwater storage and to delineate groundwater flow direction include previous descriptions of geologic structure, basin-fill sediments, and bounding features by Hawley and Kennedy (2004) [8] and Sweetkind (2017) [7] for the Mesilla portion of the Basin, as well as Jimenez and Keller (2000) [9] and Servicio Geológico Mexicano (SGM) (2011) [10] for the Conejos-Médanos portion of the Basin. Previous storage estimates are limited to the Mesilla portion of the Basin and have been reported by Hawley and Kennedy (2004) [8], Wilson and colleagues (1981) [11], and Balleau (1999) [12]. Water-chemistry data reported by numerous authors, but primarily Witcher and colleagues (2004) [13] and Teeple (2017) [5], were used to describe the extent of recharge and groundwater flow, as well as salinity increases at the terminus of the Basin, near Paso del Norte (Figure 1). To understand the extent and quantity of present-day recharge as a contribution to the water budget, data were compiled from Wilson et al. (1981) [11], the numerical modeling efforts of Frenzel and Kaehler (1992) [14] and S.S. Papadopulos and Associates, Inc. (SSPA; 2007) [15], from Hanson and colleagues (2020) [16], and the associated data release by Ritchie et al. (2018) [17]. Interpretation of the present groundwater/surface-water interactions was supported with long-term data-collection records available from the U.S. Geological Survey (USGS; 2021) [18].
The total volume of groundwater stored in the aquifer system of the Mesilla portion of the Basin and a small part of the Conejos-Médanos portion was estimated using the method documented by the Texas Water Development Board (TWDB), which differentiates between groundwater storage in unconfined and confined aquifers [19,20]. Groundwater storage for unconfined aquifers (Su) is equal to the volume of water that would be released by dewatering the entire saturated thickness of the aquifer and is calculated as follows:
S u = A   ( b s )   S y
where A is the area of the saturated aquifer, bs is the saturated thickness (equal to the groundwater elevation minus the elevation of the bottom of aquifer), and Sy is the specific yield. Specific yield is the ratio of the volume of water that drains from a saturated rock by gravity to the total volume of the saturated aquifer.
Groundwater storage in confined aquifers (Sc) consists of the volume of water that would be released by dewatering the entire aquifer and the elastic properties of the aquifer (expansion of water and deformation of aquifer solids), calculated as:
S c = [ A   ( b s )   S y ] + [ A   ( h )   Ss   ( b a ) ]
where ba is the aquifer thickness (equal to the elevation of the top of the aquifer minus the elevation of the bottom of aquifer), h is the hydraulic head (equal to the groundwater elevation minus the elevation of the top of the aquifer), and Ss is the specific storage. Specific storage is the amount of water released from or taken into storage per unit volume of a porous medium per unit change in hydraulic head. Other terms are as defined for Equation (1).
The elevations of the top and bottom of the aquifer units were estimated by using the three-dimensional hydrogeologic framework model developed by Sweetkind (2017) [7]. Sweetkind (2017) assigned a thickness of about 1.5 meters (m)to a hydrogeologic framework model unit where it was absent within the stratigraphic sequence [7]; these areas were excluded from the total volume estimates. The groundwater elevation was estimated from the groundwater-elevation surface presented in Section 4. Equation (1) was used to calculate the Su where the groundwater elevation was equal to or below the top of the aquifer unit, and Equation (2) was used to calculate the Sc where the groundwater elevation was above the top of the aquifer unit. An Sy of 0.1 and an Ss of 0.00001 per foot were assumed for all aquifer units. These values were chosen to be consistent with reported values and previous storage estimates [8].
The three-dimensional hydrogeologic framework model used to estimate the volume of the Mesilla portion of the Basin represents about 45% of the total area of the Mesilla/Conejos-Médanos Basin, as depicted in Teeple (2017) [5] (Figure 1). Thus, only a small portion the northern part of the Conejos-Médanos portion of the Basin, roughly corresponding to the southernmost active extent of the Rio Grande Transboundary Integrated Hydrologic Model [16], was included in the volume estimates for the Mesilla portion of the Basin. In addition, areas with a high standard error from kriging the groundwater elevations were excluded from the total volume estimates.
Different spatial resolutions were used for the three-dimensional hydrogeologic framework model, a 200-m grid-cell size, and for the groundwater-elevation surface, a 23-m grid-cell size. To combine the different spatial resolutions, the ArcGIS Zonal Statistics tool [21] was used to calculate the mean groundwater elevation within each hydrogeologic framework model grid.
A binational water-level map was constructed by interpolating median groundwater-elevation data from measurements made in 2010 within the basin-fill sediments [10,18]. Measurements made in Mexico and reported in the National Geodetic American Vertical Datum of 1929 were converted to reference the North American Vertical Datum of 1988 (NAVD88) by using the correction factors from Carrera-Hernández (2020) [22] so that measurements within both countries were relative to a common datum. Data that were not measured within the basin-fill sediments or that were noted as being affected by nearby pumping, surface water, or other factors were omitted from the analysis. The final dataset included a total of 217 measurement locations, with 108 in Mexico and 109 in the United States [23]. Median values from these locations were contoured by using universal kriging interpolation techniques in R (version 3.5.3), an open-source programming language [24,25]. The kriging configuration used a 2nd-order trend with an interaction term, a spherical variogram model (range = 61,134 m; sill = 592 square meters (m2); nugget = 0 m2), and a 23-m grid-cell size. Portions of the map that were associated with relatively high interpolation uncertainty, as determined by the kriging standard error and largely due to sparce data coverage, were omitted from the final map [23]. Elevations referenced throughout this paper are reported relative to the NAVD88.

3. Geologic Setting and Hydrogeology

The semiarid Mesilla/Conejos-Médanos Basin (Basin) covers 8290 square kilometers (km2), of which about 5960 km2 are in Chihuahua, Mexico [8,10]. Physiographically, the Mesilla portion of the Basin can be divided into the West Mesa, the incised Mesilla Valley that contains the Rio Grande and associated sediments, and the East Bench (Figure 1). The Conejos-Médanos portion of the Basin is divided into the lowlands and dunes of Laguna El Barreal to the southwest and the mesa features that may be considered as the southern extension of the West Mesa in New Mexico (Figure 1). Basin elevations range from about 1100 m near the Paso del Norte to greater than 2700 m in the Organ Mountains east of Las Cruces (Figure 1) [16]. Average annual precipitation in Las Cruces, New Mexico is about 21.3 centimeters (cm) per year [26], and average annual precipitation from four climate stations in and near the Conejos-Médanos portion of the Basin is about 16.8 cm per year [27]. The average annual estimated reference evapotranspiration ranges from about 187 cm/year along the Rio Grande Valley to about 79 cm/year in the surrounding mountains [16]. The Rio Grande is an important surface-water feature flowing through the northern Mesilla portion of the Basin, whereas ephemeral surface waters in the Conejos-Médanos portion of the Basin are considered to be in closed basins and not connected to the Rio Grande.

3.1. Geologic Setting

The Basin is located in the southern part of the Rio Grande rift, a tectonic feature that is characterized by a series of generally north-south-trending structural extensional basins. The still-active Rio Grande rift has been evolving for more than 25 million years through episodic crustal extension and basin subsidence [8]. The Basin is bound by volcanic highlands and fault-block (horst) ranges that expose tilted Paleozoic and Early Cretaceous carbonate and siliciclastic rocks and include some Tertiary igneous intrusions [8,28,29,30]. The eastern margin of the Mesilla portion of the Basin is bound by the Organ and Franklin Mountains, and the western margin by fault blocks and volcanic uplands of the East Potrillo Mountains and West Potrillo Mountains. The Robledo and Doña Ana Mountains define the northern end of the Basin, except in the northeast, where it transitions to the Jornada del Muerto Basin (Figure 1) and where interbasin groundwater flow is reported to occur [5,8]. The Conejos-Médanos portion of the Basin is bound to the east by low-elevation (<1490 m) mountains and hills, including Sierra de Juárez, Cerro El Picacho, and Sierra de Samalayuca; to the south by the Cenozoic outcrops around Sierra La Candelaria; and to the southwest by the hills and mountains west of Laguna El Barreal, such as Sierra El Malpais and Sierra La Nariz [31].
Tectonic deformation and faulting within the Basin formed a series of structural sub-basins and uplifts (Figure 2) [7,8,30,32]. These interbasin and intrabasin structures play a major role in groundwater flow. The Mesilla portion of the Basin is divided into sub-basins by a normal-fault bounded horst block, the Mid-Basin Uplift. The Mid-Basin Uplift does not extend through the entire saturated thickness but may result in the division of deeper groundwater flow [8]. To the north, the entire saturated thickness of the southern portion of the Jornada Del Muerto Basin (Figure 2) is separated from the Basin by sub-crops resulting from a complex series of faults [7,8]. In the Conejos-Médanos portion of the Basin, a series of northwest—southeast trending sub-basins, Los Muertos, El Parabien, and Southcentral (or Conejos-Médanos), are defined by mostly buried uplifts [9,33]. Previous groundwater-level maps indicate the potential for groundwater throughout the Conejos-Médanos portion of the Basin to flow north [10,27]; however, these buried uplifts may restrict northerly groundwater flow to only a small portion near the international border.

3.2. Hydrogeology

Aquifers in the Rio Grande rift, like the Basin, are made up of saturated recent valley -fill deposits and older thick intermontane sedimentary basin-fill deposits. While climate regimes influenced the geomorphology of the fluvial deposits in the Basin, tectonics were—and are—the primary controls for the aggradation from the Rio Grande [35,36]. The Basin aquifer system is made up of as much as 900 m of partially consolidated eolian, alluvial, lacustrine, and fluvial (ancestral Rio Grande) deposits that comprise the Pliocene to Pleistocene Santa Fe Group [7,8,10]. A thin layer (<25 m) of unconsolidated Quaternary alluvial and fluvial deposits, known as the Rio Grande alluvium, overlies the Santa Fe Group [8]. The Santa Fe Group unconformably overlies a succession of older consolidated basement rocks that include, in descending order: lower-to-middle Tertiary and volcaniclastic rocks [7]; up to 760 m of Upper Cretaceous marine and non-marine sandstone and shale; 900 m to over 1500 m of Paleozoic dolomite, limestone, and sandstone with interbedded shale and gypsum beds [8,10]; and a complex of Proterozoic granite and metamorphic rocks.
The Santa Fe Group is often divided into three hydrostratigraphic units that roughly correspond to the stages of basin filling: the upper Santa Fe, the middle Santa Fe, and the lower Santa Fe hydrostratigraphic units (Figure 3), which are correlative with the Camp Rice and Palomas, the Rincon Valley, and the Hayner Ranch formations, respectively [7,8]. Deposition of the lower Santa Fe unit occurred between 10 and 25 million years ago (Ma) in a broad, shallow basin that predated the uplifts of the flanking mountain blocks [8]. The lower Santa Fe unit is primarily fine-grained and partly consolidated with some calcium-sulfate and sodium-sulfate evaporites and cementation, which was deposited in a closed basin. The middle Santa Fe unit is composed of eolian dune sequences up to 610 m thick that intertongue with alluvial deposits near the bounding mountains and fluvial and playa-lake deposits in the inner Basin [8]. The middle Santa Fe unit was deposited about 4 to 10 Ma, when rift tectonics were most active. Rapid aggradation in the Basin during this time, caused by subsidence of the central basin blocks relative to the surrounding uplifts [8], resulted in deposition of coarse clastic alluvial deposits derived from the uplift of the ranges bounding both sides of the basin [8]. The upper Santa Fe unit is about 3 to 4 Ma and consists of fluvial deposits from a large, braided river of the ancestral Rio Grande, with channel sands and gravels from as far north as the mountains in southern Colorado and alluvial fan deposits derived from basin-bounding highlands (Figure 1) [8]. The fluvial system discharged into the playa-lake plains of the eastern Hueco Bolson and the southern Conejos-Médanos portion of the Basin.
The Quaternary Rio Grande alluvium and upper Santa Fe unit were deposited by the through-flowing Rio Grande [16]. The alluvial sequence was produced by multiple episodes of valley entrenchment during glacial stages and aggradation during interglacial (interpluvial) stages. The Rio Grande alluvium is composed of river-channel and overbank depositional facies ranging in texture from sand and gravel to silt and clay that are generally 15 to 38 m thick, respectively [11]. A basal-channel gravel and sand layer, up to 9 to 12 m thick, was deposited during the interval of maximum valley incision near the end of the late Pleistocene ice age [37].
Deposition of basin-fill sediments as a result of both tectonics and varying climate regimes has produced the sediment fill structure that has affected groundwater conditions through time. Prior to incision by the Rio Grande, starting about 700,000 years ago, the Basin was a broad plain with water tables in the West Mesa portion of the Basin up to 110 m above present-day (2022) groundwater levels [8]. The lacustrine deposits of the ancestral Lake Palomas in the Conejos-Médanos portion of the Basin indicate lake levels were about 60 m above present-day (2022) groundwater levels [8]. Geologic evidence indicates that the Rio Grande once flowed through what is now the Jornada del Muerto Basin and discharged to the Hueco Bolson through Filmore Pass [35], indicating the potential for past and present interbasin groundwater flow. The present course of the Rio Grande probably did not become established until the middle Pliocene [35], allowing lacustrine deposits to form in the southern portions of the Basin [8].
Groundwater in the Santa Fe Group generally occurs under leaky-confined conditions as a result of interbedded clays. These clay layers result in horizontal conductivity exceeding vertical conductivity [11]. Hydraulic conductivities generally decrease with depth and with increasing distance from the source of sediments [8]. The fluvial sediments of the Rio Grande alluvium and Santa Fe Group generally represent a fining-upward sequence of sediments [16]. A broad range of aquifer-specific capacity, transmissivity, and hydraulic-conductivity values have been estimated for this aquifer system, as supported by the observed and inferred lithofacies [8]. Specific capacities of 2 to 45 liters per second per meter (L/s/m) are reported for the coarse-grained deposits in the upper Santa Fe unit and Rio Grande alluvium, but specific capacity estimates of the middle Santa Fe are usually less than 8 L/s/m and between 0.2 to 2 L/s/m for the lower Santa Fe [8]. Based on aquifer tests of about 50 wells and test holes completed in the Santa Fe Group, the average well yield is about 95 L/s [11]. Transmissivities of the upper 300 m of the aquifer in the West Mesa average around 0.01 square meters per second (m2/s) and range from 0.01 to 0.04 m2/s in the Mesilla Valley [8,11] Transmissivities in the Conejos-Médanos portion of the Basin range from about 0.002 to 0.004 m2/s [10]. Vertical hydraulic conductivity measured in West Mesa wells ranged from about 10−6 to 10−5 m per second (m/s) for the entire thickness of confining layers [14]. The storage coefficients from aquifer tests range from 0.001 to 0.00003 [11,38]. The horizontal-to-vertical hydraulic conductivity anisotropy ratio of basin-fill aquifer systems in the Rio Grande rift may range from 200:1 to 1000:1 [8]. Horizontal hydraulic conductivities of the Rio Grande alluvium range from about 4 × 10⁻⁴ to 1.2 × 10⁻³ m/s, and the average estimated specific yield is 0.2 [37], with reported estimates ranging from 0.1 to 0.3 [39,40,41].
Faults throughout the Basin may allow upward leakage of saline water from older Mesozoic units into the Santa Fe Group and downward or lateral leakage of fresher water from the Rio Grande valley fill into the Santa Fe Group [34,42]. Cross faults, not mapped in the Texas portion of the Basin, have been interpreted from geophysical investigations and may produce sharp divides between deep and shallow basin structures in addition to the upflow zones [43]. Differences in thickness and lithology of the Basin sediments are observed across certain faults. For example, the Santa Fe Group on the horst near the Robledo Mountains (Figure 2) is reported to be mainly composed of clay facies, in contrast to alternating layers of sands, gravels, and clays in the graben to the south. The high groundwater gradient, lithologic data, and water-yield data associated with the horst are indicative of low transmissivity values relative to other portions of the Basin [44]. The Santa Fe Group in this area is also thinner, with Permian bedrock units found at depths as shallow as 350 m, whereas thickness of the Santa Fe Group to the south has been observed at over 730 m [11]. The West Mesa (Figure 1) also contains numerous volcanic features, including a line of cinder cones, lava flows, and a series of maars. Igneous dikes associated with these centers are often aligned with groups of faults [7]. Several wells have encountered basaltic rock at depth [8], with reports of varying degrees of groundwater productivity.

4. Water Availability

Water resources in the Mesilla/Conejos-Médanos Basin (Basin) occur both as surface water and groundwater in the U.S. portion of the Basin, whereas the Mexican portion of the Basin relies entirely on groundwater. Both comprise a substantial source of water for the semiarid region, but drought and increasing demands are reducing water availability.

4.1. Surface Water

The Rio Grande enters the Basin through Selden Canyon (about 1210 m elevation) and leaves through a gap known as Paso del Norte (about 1130 m elevation) that separates the Franklin Mountains from Sierra de Juárez to the south near El Paso, Texas (Figure 1). The Upper Rio Grande Impact Assessment [45] reports that supplies from all native water sources to the Rio Grande are projected to decrease, on average, by one third overall by the end of the of the 21st century. Other projections indicate increased variability in monthly and annual flows, and climate change modeling for the region indicates earlier snowmelt runoff and warmer average temperatures, leading to increased variability in the magnitude, timing, and spatial distribution of streamflow [45].

4.1.1. Streamflow

Except for a few perennial seeps and springs that flow for short distances in the surrounding mountains, the Rio Grande is the only perennial surface-water body in the Basin. The Rio Grande’s drainage basin above Caballo Dam is about 71,700 km2 (Figure 1), and about 60 to 75% of Rio Grande streamflow is derived from seasonal snowpack in the high-elevation headwaters [46,47]. While surface-water availability in the Rio Grande is largely driven by regional climate and landscape patterns and upstream water use, the local climate can affect both supply and demand in the Basin [16].
Streamflow in the Rio Grande through the Basin is controlled by Rio Grande Project (Project) demands. Surface water in the Rio Grande is apportioned by the 1906 international treaty, which apportions 74.0 cubic hectometers per year (hm3/year) to Mexico, as well as the 1938 Rio Grande Compact that divides streamflow among the states of Colorado, New Mexico, and Texas based on measured streamflow. The Project releases water from the upstream Elephant Butte and Caballo Reservoirs (Figure 1) during the growing season (irrigation season) to provide water to the Elephant Butte Irrigation District (EBID) in New Mexico, the El Paso County Water Improvement District No. 1 (EP No. 1) in Texas, and the Juárez Valley Irrigation District 009 in Mexico. During the winter season, when no dam releases occur (non-irrigation season), the riverbed is often dry for long stretches within the Basin [6]. However, this is not only a recent phenomenon. Conover (1954) [39] reported that even prior to construction of Elephant Butte Dam, the river would sometimes dry for months at a time. Recent (2022) surface-water conditions in the Basin represent a reduced supply that has persisted since about 2000 [16]. Average annual streamflow for 1940 to 2018 from releases out of Caballo Reservoir was approximately 791 hm3/year (standard deviation 316 hm3/year) or about 25 m3/s (Figure 4) [16]. In contrast, the average annual streamflow during the period of persistent drought from 2000 to 2018 was only about 663 hm3/year (standard deviation 221 hm3/year) or 21 m3/s [47]. At El Paso (the outlet of the Basin), the average annual streamflow between 1940 and 2018 was 487 hm3/year [17].
Based on precipitation and geologic records, Rio Grande streamflow in the Pleistocene would have been far greater than present (2022) [8,35]. Flood flows during that time likely covered the floodplain for weeks at a time [11]. In the decades since agricultural development in the Mesilla Valley, upstream reservoirs have greatly reduced flood flows. Following the construction of Elephant Butte Dam in 1915 and the controlled releases beginning in 1916, there was a substantial drop in peak streamflow [5]. For example, annual peak flows of 280 m3/s, including several annual peak flows of more than 430 m3/s, were recorded before 1915, but since 1915, the annual peak flow has not exceeded 260 m3/s [5]. Where the Rio Grande leaves the Basin, a flow of 680 m3/s was measured at El Paso during a flood in 1905, but no flow over 230 m3/s has been measured since [8].
As a primary source of recharge to the groundwater, the Rio Grande, through much of its 100-km length in the Basin, loses water by seepage to the aquifer [49,50,51,52,53]. When the river has water in it, seepage to the aquifer can maintain groundwater levels. However, when the river is dry, the water table may drop below the riverbed. When streamflow commences, the initial seepage rate is believed to be equal to the infiltration rate of the riverbed. After several weeks of streamflow, the groundwater levels rebound, and the Rio Grande hydraulically reconnects to the water table; seepage rates are then proportional to the hydraulic conductivity of the aquifer and the hydraulic gradient between the river (surface-water elevation) and the water table [38].

4.1.2. Irrigated Agriculture

Elephant Butte Dam was completed in 1916, and Caballo Dam was completed in 1938 in order to provide a more predictable supply of irrigation water to downstream users [16]. Elephant Butte Reservoir is the primary means of storage for the Project, and Caballo Reservoir, located immediately downstream from Elephant Butte on the Rio Grande, serves to regulate Project seasonal releases and electricity generation. There is about 370 km2 of farmland in the Mesilla Valley, but currently (2022) only about 300 km2 is in active cultivation in New Mexico and about 50 km2 in Texas (out of about 450 km2 of total valley area) [48,54]. A full annual allotment of water for EBID irrigators is about 338 hm3, or about 0.9 hm3/km2, and was delivered each year, on a pro rata basis, between 1979 and 2002 [55]. However, drought conditions starting in the late 1990s have reduced surface-water availability in the Rio Grande and therefore reduced irrigation deliveries in the first two decades of the 21st century. As a conjunctively managed system, irrigators in the Basin offset surface-water deficits with groundwater pumping, resulting in increased pumping when surface-water supplies are limited. Starting in the early 1950s, because of drought and reduced surface-water availability, irrigators in the Mesilla Valley began rapidly developing the groundwater resources [11]. This was limited primarily to the shallow alluvium during early development but has since expanded to include many wells completed in the deeper Santa Fe Group. Municipal, industrial, and domestic dependence on groundwater also expanded during this time, but irrigation remains the dominant use of groundwater [56].
Water released from Project reservoirs first flows thorough the Palomas Basin, where some water is diverted to irrigate fields. Water for irrigation in the Mesilla Valley is diverted from the Rio Grande at Leasburg Dam near the mouth of Selden Canyon and at the Mesilla Dam south of Las Cruces (Figure 1). The diverted water then enters a network of irrigation canals and laterals that convey and deliver surface water to farm headgates for irrigation use. Historically, the canals and laterals were unlined earthen structures, but an increasing number have been lined or converted to pipe to reduce conveyance and evaporative losses [16].
Agriculture is both the primary user of surface water and a substantial contributor to groundwater recharge. Groundwater recharge from irrigated agriculture occurs as deep percolation (water that infiltrates below the root zone) because of the infiltration of applied water on crop lands and infiltration through the conveyance structures [14,15]. Historically, about 40 to 50% of the headgate diversions made it to the fields [11], but that percentage has increased with efficiencies in operations and canal improvements. Operational and measurement errors, noted in the past, have been minimized in part because drought conditions have sensitized the farming community to the value of water and because operational and maintenance programs and engineering design improvements have evolved substantially. The losses in the system can include unintended discharge back to the river following diversion into the canal system, ditch breaks, and evaporation and transpiration. Losses also occur as channel seepage into the groundwater [57]. In order to reduce water-table elevations from channel seepage and deep percolation following an increase in irrigation, drains were constructed in the 1910s and 1920s. Approximately 320 km of drains were constructed to maintain optimal growing conditions by preventing waterlogged soils [16,39]. The drains remove excess irrigation water from the groundwater and return it to the Rio Grande at various locations. During surface-water shortfalls, groundwater levels may fall below the drain elevation and reduce or eliminate flows [14]. Based on average annual discharges in selected drains in the Mesilla Valley, Wilson and others (1981) estimated the discharge from these drains to the Rio Grande at just under 123 hm3/year [11]. Presently (2022), however, the average water-table elevation throughout most of the Mesilla Valley has fallen below the design grade of the drains, rendering most of the drains dry.

4.1.3. Salinity

Water-quality impairment can lead to reduced water availability. A major source of water-quality impairment is salinity, often expressed as the concentration of dissolved solids (DS) [58]. Salinization of aquifers and surface water in arid regions is a growing concern because of increasing water use resulting from population growth and increasing agricultural demands [59]. The Rio Grande has been shown to have experienced substantial increases in salinity as it flows from north to south, in particular at the terminuses of the rift basins [60,61,62,63,64,65,66]. In the Basin, salinity increases in the Rio Grande have been documented by numerous researchers, and the source of the salinity has been the subject of multiple works [5,6,13,42,59,63,64,67]. Major salinity sources have been attributed to irrigation [68], evaporite mineral dissolution [67], and shallow evaporite brines [65,66]. Some have also suggested that topographically driven groundwater flow, a concept originally described by Toth [69], is responsible for the higher-salinity groundwater located near the Paso del Norte [8,13,63,64,70]. Topographically driven groundwater flow has also been shown in other Rio Grande rift basins where terminal bedrock constrictions force deep groundwater upward toward the surface and into the Rio Grande [64,70].
The two major sources of salinity increases in the Rio Grande are likely the leaching of salts from soils by irrigation and a deep, higher-salinity groundwater source discharging to the river [5]. Increased irrigation in the late 1910s resulted in more irrigation water recharging the shallow groundwater system, causing the water table to rise and salts to accumulate in the soils [14]. As these salts were leached from the soils by the application of irrigation water that seeped past the root zone, the salinity in the shallow groundwater system increased [71]. Wilson and others (1981) and Phillips and others (2003) indicated that increasing DS concentrations from Caballo Dam to El Paso are primarily due to evapotranspiration of irrigation water that percolated to the water table and is removed as drain flow [11,70]. As added evidence, they also reported that during irrigation season, the salinity of drain flow can be two to three times greater than salinity in the river [11,70]. Szynkiewicz and colleagues (2011) used sulfur isotopes to conclude that sulfate concentrations in the Rio Grande were consistent with fertilizers and not a geologic evaporite source [59]. However, the sulfate ratios in the groundwater in the Mesilla Valley indicate multiple sources of sulfate. Bedrock dissolution was a more likely source of sulfate in deeper portions of the aquifer and in groundwater near Paso del Norte. In later work, Szynkiewicz and others (2015) attributed up to 60% of the non-irrigation sulfate concentrations in the Rio Grande near Paso de Norte to evaporative brines, which was reduced to about 20% of the sulfate concentrations during the irrigation season [65,66].
Other investigations have focused on natural processes of salinity increases, such as groundwater recharge associated with Paleozoic sedimentary rocks, the upwelling of deep basinal waters, and geothermal outflows [13,62,63,64,70,71]. Based on the mass-balance modeling of Mills (2003) [61] and an isotopic mixing model by Hogan and colleagues (2007) [63], groundwater near Paso del Norte has been estimated to contribute approximately 6500 to 9750 tons of chloride per year to the Rio Grande, or between 10 to 15% of the annual chloride load in the Rio Grande at El Paso. Helicopter frequency-domain electromagnetic data showed a marked decrease in relative resistivity in the middle of the Mesilla Valley, near Fillmore Pass (Figure 2) [5]. This resistivity change, along with DS concentrations from groundwater wells, indicates a sharp increase in the spatial distribution of DS concentrations in the groundwater and a potential source of salinity for the Rio Grande [5]. Hawley and Kennedy (2004) suggested the possibility of preferential pathways for deeply circulating fluids in the Paleozoic and Cretaceous carbonates that are exposed and shallowly buried near Paso del Norte [8]. This suggestion is supported by the presence of extensive fractures associated with fault zones and observed dissolution features in outcrops. Higher salinity in shallow groundwater and the Rio Grande near Paso del Norte is also reported to be caused by structurally forced upwelling of brackish and saline water from deep groundwater and by the upflow of geothermal water from shallow bedrock structures and bedrock boundaries [13,42]. Teeple (2017) reported lower resistivity at depth, indicating saline water upwelling though fractures in the bedrock [5].

4.2. Groundwater

The Mesilla portion of the Mesilla/Conejos-Médanos Basin (Basin) has been reported to host up to an estimated 80,200 hm3 of recoverable fresh and moderately brackish water (<3000 milligrams per liter of dissolved solids) [8]. However, most of that groundwater was recharged tens of thousands of years ago during the cooler and wetter parts of the Pleistocene [8]. In this section, groundwater flow patterns, revised storage estimates, and long-term groundwater levels are described to identify potential recharge sources and to estimate the amount of groundwater potentially available.

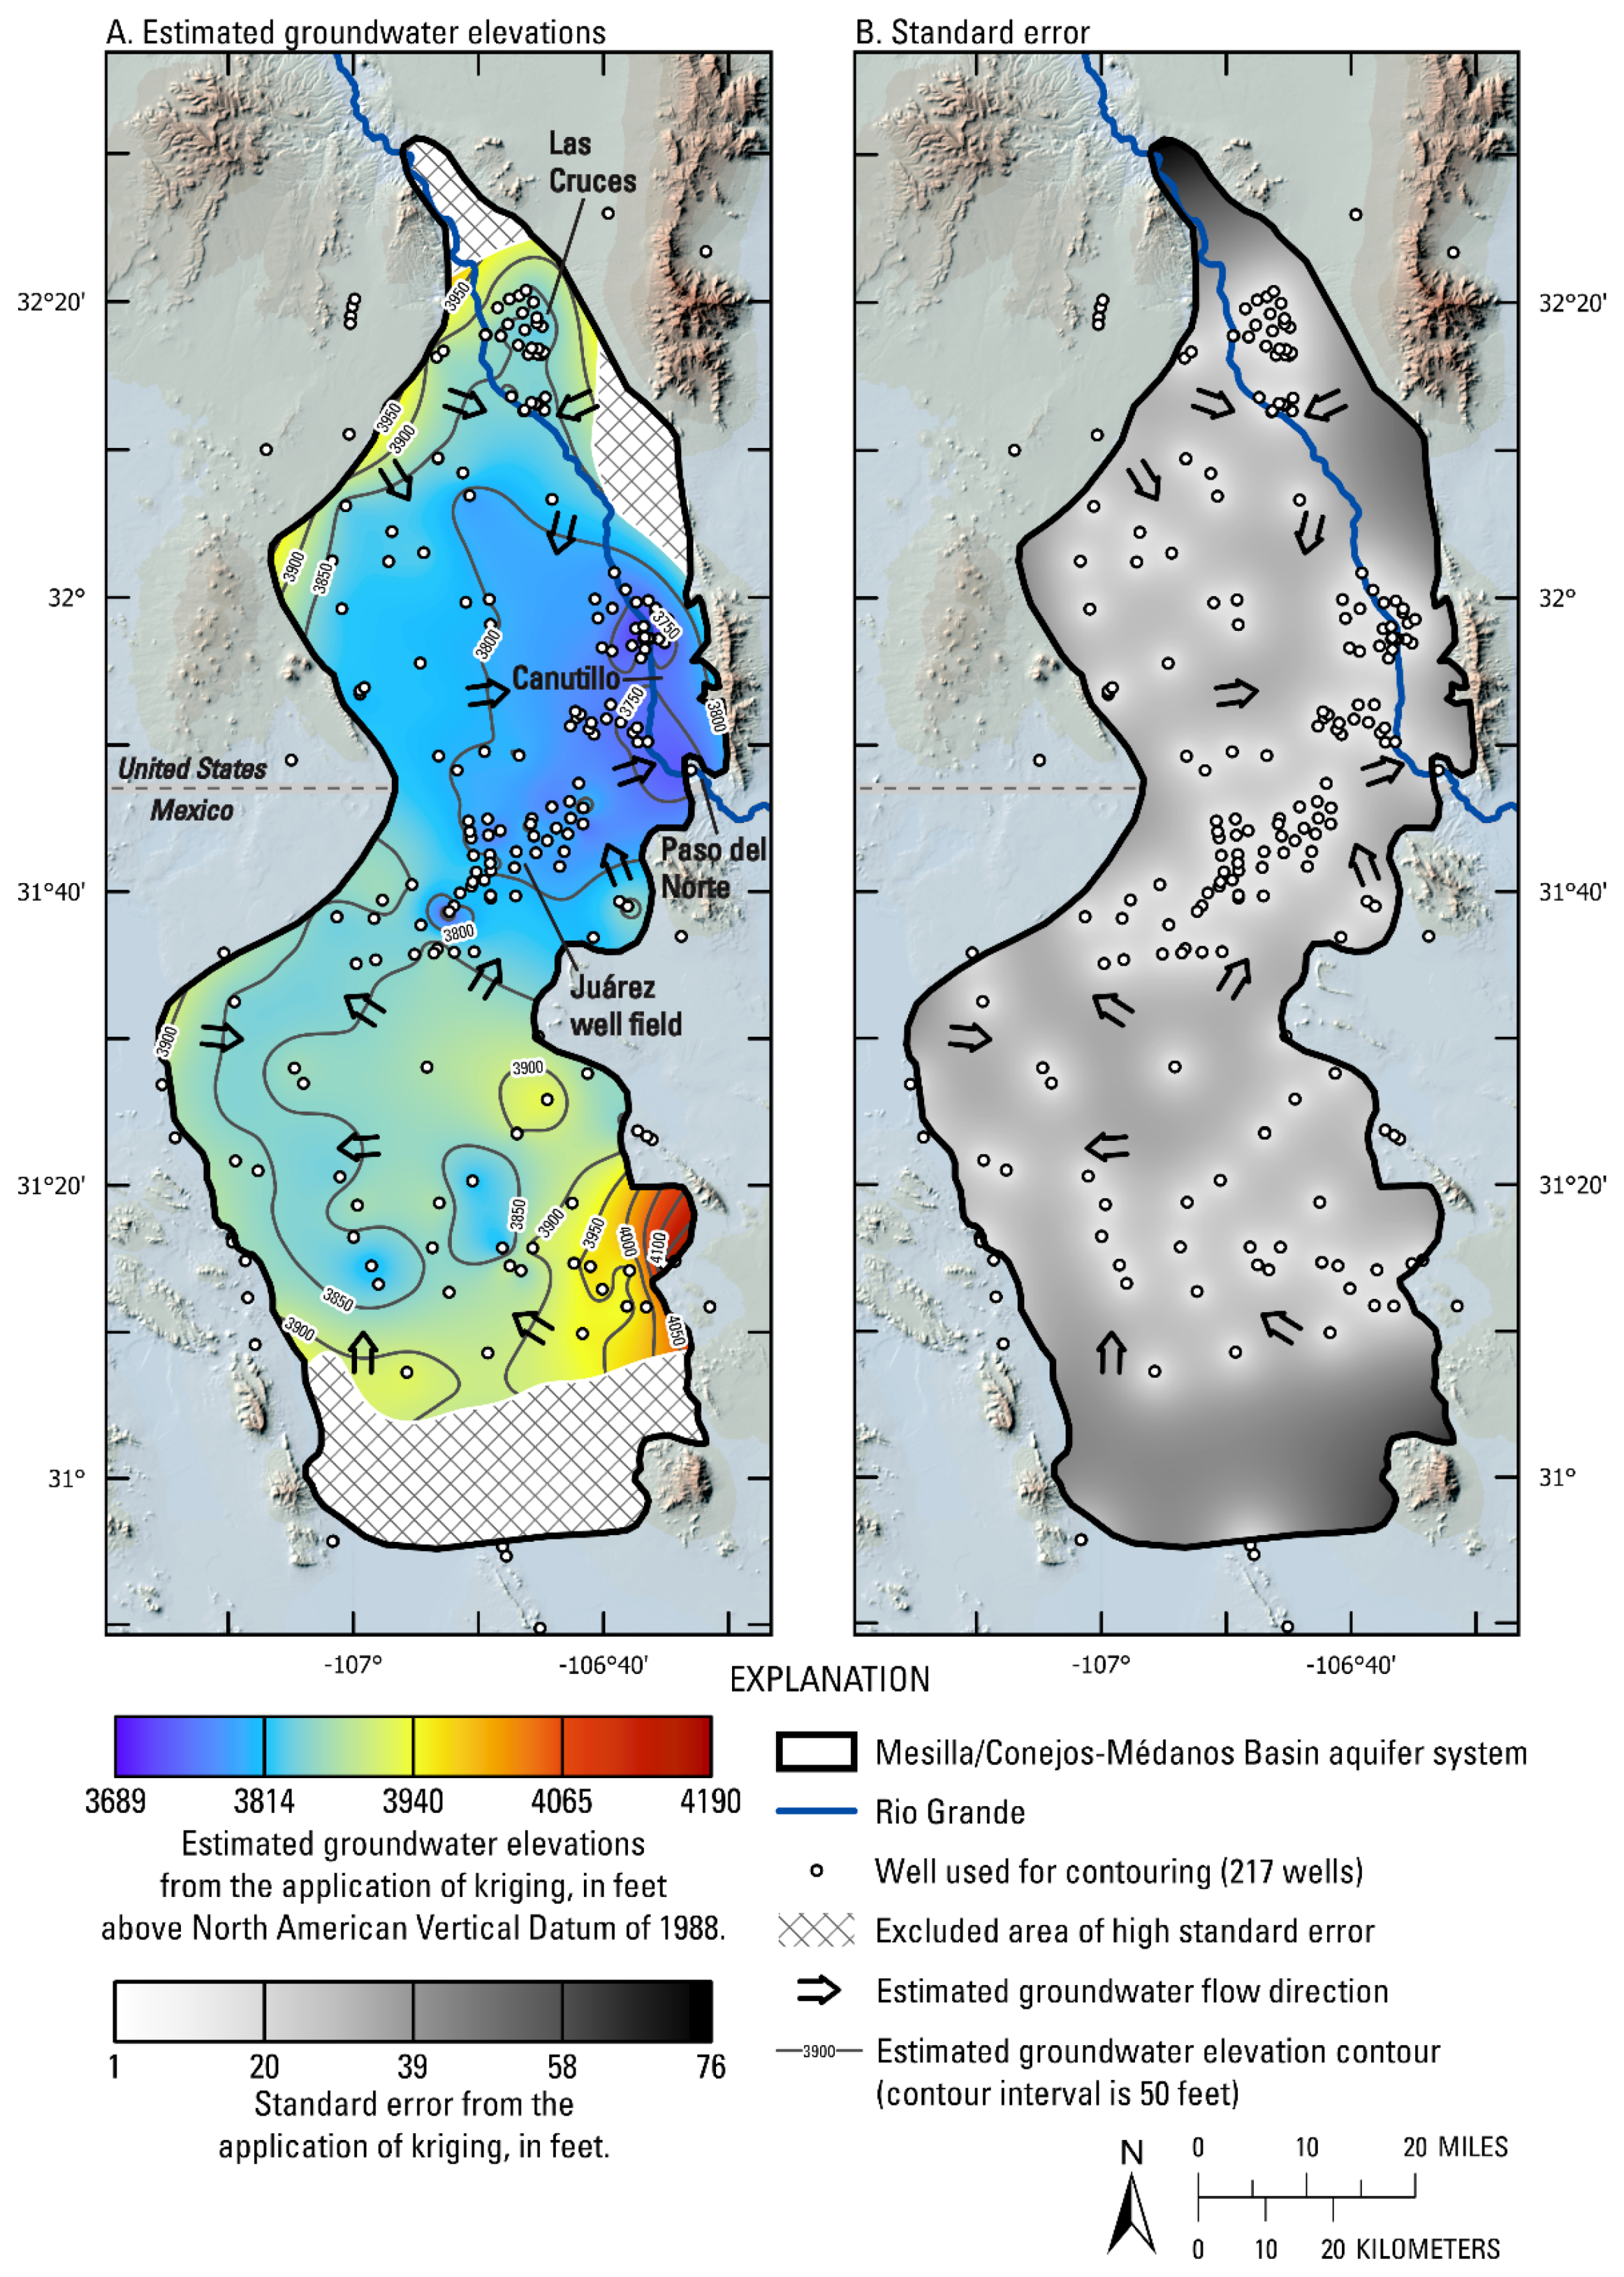
4.2.1. Groundwater Flow

The distribution of the groundwater resources in the Basin is controlled by the location of recharge and discharge, aquifer properties, and hydraulic gradient and may be interrupted by local gradient changes and hydraulic barriers, such as faulting and subcropping bedrock highs. Groundwater levels in the Rio Grande alluvium are shallow and unconfined and generally decrease from north to south at an average gradient of about 0.8 to 1.1 m/km [38], closely following the topographic gradient. Groundwater flow directions are influenced locally by hydraulic stresses, such as leakage to or from the Rio Grande, drains and canals, groundwater pumping, and infiltration from heavily irrigated fields [5,37]. Groundwater elevations within the Santa Fe Group decrease from the Basin margins to the Basin outlet at the Paso del Norte (Figure 2 and Figure 5). The hydraulic gradient in the Santa Fe Group ranges from about 19 m/km in the northwestern part of the Basin (near the Robledo Mountains) to less than 0.4 m/km near Paso del Norte [38]. Overall groundwater flow in the Mesilla portion of the Basin is southeasterly, toward the Paso del Norte (Figure 5), and may be partially restricted by the Mid-Basin Uplift [5]. The general groundwater flow direction in the Conejos-Médanos portion of the Basin is north and northeast (Figure 5) [10]. Groundwater pumping locally alters groundwater flow by creating cones of depression in the central parts of the Mesilla Basin near Las Cruces, New Mexico and Cañutillo, Texas, as well as at the Juárez well field (which supplies water to Ciudad Juárez, Chihuahua) near the international border [5,10] (Figure 5). Groundwater flow may also be affected by faults in the area, but 2010 (Figure 5) and previous groundwater-elevation maps have not indicated substantial gradient changes across mapped faults except where they are associated with large topographic uplifts. Water-level elevations also indicate hydraulic connection between the saturated sediments underlying the West Mesa and those in the Mesilla Valley [8,11]. Water-level contours interpreted by SGM in 2007 [10] and those presented here (Figure 5) indicate largely uninterrupted groundwater flow over the entire Conejos-Médanos portion of the Basin. However, the presence of intrabasin uplifts between structural sub-basins [9] and the lack of substantial recent recharge [8] could interrupt groundwater flow in the Santa Fe Group between the Conejos-Médanos sub-basins.
Despite reports of groundwater mixing [5,13,72] and lack of a single direction of flow (Figure 5), the groundwater system along the Mesilla Valley appears to be adequately characterized by an active shallow system, up to about 30 m deep, primarily in the Rio Grande alluvium, as well as long flow paths in the deeper Santa Fe Group. The shallow groundwater flows occur as relatively fast flow paths (<5 years), as evidenced by seasonal and annual groundwater-level fluctuations and age-dating tracers [5,14,38]. Deep groundwater elevations do not notably change in response to seasonal or annual climate or surface-water changes (except near production wells) [14]. Outside the Mesilla Valley, the Basin structure and groundwater elevations indicate a groundwater system in which recharge occurs primarily as mountain-front recharge and flows are at depth, with mixing occurring only with other deep groundwater flow paths and geothermal upwelling. Most groundwater naturally discharges through hydraulic upwelling to the river and shallow groundwater system and is lost to evaporation and transpiration near Paso del Norte at the southern end of the Mesilla Valley, where a thin alluvial veneer overlies a bedrock high [11].

Groundwater Recharge

Groundwater flow can occur when recharge at a location increases groundwater elevations, creating a hydraulic gradient. Previous studies have identified multiple sources of recharge; however, all conclude that the predominant source of recharge is water from the Rio Grande. Investigations into recharge include evaluations of groundwater gradients, seepage measurements, water-budget estimates, water chemistry (in particular the stable isotopes of water), and seasonal groundwater fluctuations.
Many studies conclude that the Basin groundwater in the Mesilla Valley is recharged from surface water associated with Rio Grande streamflow and irrigated agriculture [5,8,11,13,14,16,38,53]. Infiltration of the Rio Grande to the aquifer can exceed evapotranspiration. As a result, recharge for the Basin primarily occurs as vertical flow from the surface-water system (the Rio Grande, canals, laterals, drains, and irrigated cropland [11]. Previous seepage investigations conducted during steady, low-flow conditions indicate that the Rio Grande is often a losing stream along most of the 100-km reach in the Mesilla Valley but with gains documented at the mouth of Selden Canyon and near the Paso del Norte [38,53]. Surface-water seepage measurements from the Rio Grande have typically been collected in the winter and range from about 0.2 to 1.4 m3/s between Selden Canyon and Paso del Norte [11,15,39,49,50,51,52]. Increases in streamflow in the Rio Grande are rapidly followed by increases in groundwater elevations in the shallow subsurface near the Rio Grande, and recent groundwater declines throughout the shallow aquifer are closely related to reductions in surface-water availability [11]. In addition to channel seepage, much of the streamflow through the Basin is diverted for use in irrigated agriculture, and recharge results from both the direct application of water to fields and seepage from the valley-wide irrigation conveyance system (laterals and canals). Stable isotopes of water measured along the Rio Grande and irrigation structures were observed to become increasingly enriched in the heavier hydrogen and oxygen isotopes in the direction of flow, indicating the cumulative effects of evaporation [70]. Subsequent research has shown that shallow groundwater in much of the Rio Grande alluvium has isotopic signatures that are similar to surface water in the Rio Grande, enriched by evaporation, indicating a large component of recent Rio Grande recharge [5,13,42]. In contrast, the stable isotope compositions of water measured in deeper wells in the Basin are more depleted than in the shallower wells, indicating a large component of recharge from the Rio Grande that occurred during the cooler periods of the Pleistocene [5,13,42].
Despite the large surface area underlain by the Basin aquifer system, evaporation and transpiration by desert vegetation creates large negative soil pressures that prevent the deep percolation of precipitation beneath the root zone over most of the Basin [14]. Near-surface caliche deposits also limit the potential recharge from precipitation [10,38]. For these reasons, recharge in arid lands is often the result of focused recharge from ephemeral streams or ponded water [73]. Estimates of recharge from precipitation on the West Mesa range from 0 to 0.34 hm3/year [14,15] and up to 3.0 hm3/year for the Conejos-Médanos portion of the Basin [10,14]. Although recharge from precipitation over much of the Basin may be considered negligible [38], several models have simulated the effective precipitation for agriculture and concluded that amount of deep percolation to be between 5 and 64 hm3/year (about 6 to 10% of the total amount of water applied) [14,15].
Higher groundwater elevations at the boundaries of the Basin indicate that mountain-front recharge is a source of groundwater inflow (Figure 5) [11]. Based on a geochemical analysis, Teeple (2017) identified groundwater at the margins of the Basin as having a substantial amount of mountain-front recharge because the water-chemistry characteristics were distinct from other groundwater types [5]. The age-dating tracers associated with those samples indicate, however, that mountain-front recharge flows slowly along deeper flow paths in the aquifer. Most estimates of mountain-front recharge assume that 2% of the annual precipitation infiltrates to the aquifer over the area of the uplands [8,13]. Frenzel and Kaehler (1992) estimated that mountain-front recharge accounts for about 12 hm3/year to the Mesilla portion of the Basin [14], whereas Hanson and colleagues (2020) estimate about half that amount using the basin characterization model [16,74]. A majority of the mountain-front recharge in the Mesilla portion of the Basin is thought to originate from the Organ and Franklin Mountains, while a smaller portion is thought to originate from the East and West Potrillo Mountains [14,15]. Groundwater elevations in the Conejos-Médanos portion of the Basin also indicate recharge is occurring in the surrounding highlands (Figure 5). The Comisión Nacional del Agua (CONAGUA) (2020) estimates this mountain-front recharge to be about 5.2 hm3/year [27]. Stable isotopes of water measured in Organ Mountain springs [75], high-elevation bedrock wells in the San Andres Mountains [76], and wells in the Jornada del Muerto (Jornada) Basin [77] represent mountain-front recharge and plot close to the Global Meteoric Water Line [78], indicating minimal evaporation. Mountain-front recharge is also reported as the primary recharge source of the adjacent Jornada Basin [77,79], and in work in the neighboring Hueco Bolson, Eastoe and colleagues (2008) reported similar stable isotope compositions in a group they characterized as the “Organ and Franklin Mountain group” [80]. With a few exceptions near the boundaries of the Basin, however, these isotopic compositions are not evident in groundwater samples within the Basin.
The extent of interbasin flow is unknown, but groundwater discharge into or out of the Basin is limited by the surrounding uplifts. Interbasin flow has been estimated, or speculated, between the Basin and the Palomas Basin to the north, the Jornada Basin to the north and northeast, and the Hueco Bolson at Fillmore Pass and Paso Del Norte (Figure 1). The thin alluvial sediments in Selden Canyon limit the groundwater inflow from the Palomas Basin to the Mesilla [38]. Recharge to the Basin is also reported to occur from the southern Jornada Basin, where remnants of the ancestral Rio Grande fluvial plain exist [5,8]. The previously hypothesized flow paths in the Santa Fe Group sediments overlying the bedrock high are possible [5,8], but work by Langman and Ellis (2013) [77] and Witcher and colleagues (2004) [13] indicates that most, if not all, of the Jornada Basin groundwater entering the Mesilla portion of the Basin travels through deeper and more tortuous flow paths within the buried Tertiary intrusions that divide the two basins. These deeper flow paths are present likely because of the prevalent faults in the area. In these deeper flow paths, the composition of Jornada Basin groundwater is altered because of the local geothermal effect [77]. Interbasin flow has also been speculated between the Mesilla portion of the Basin and Hueco Bolson through Fillmore Pass (Figure 2). Fillmore Pass once hosted an ancestral Rio Grande channel and has been reported to still be a potential route for interbasin flow. In a numerical model of the Hueco Bolson, Orr and Risser (1992) assigned a constant flux of about 0.32 hm3/year into the Hueco Bolson from the Basin [81]. However, hydraulic gradients between the Mesilla Basin and Hueco Bolson provide little evidence of interbasin fluxes [8,11,14,18]. CONAGUA (2020) and SGM (2011) report interbasin flow to the Conejos-Médanos portion of the Basin primarily from the Laguna de Santa Maria aquifer in the south (Figure 1) and estimate inflow to be about 11 hm3/year [10,27].
Historical and modern water levels indicate that groundwater moves from the Conejos-Médanos portion of the Basin into the Mesilla portion of the Basin as throughflow. Based on mapped lacustrine-sediment elevations and paleo-groundwater elevations, there was reportedly a substantial (but unquantified) amount of “paleo-groundwater flux” originating from the pluvial Lake Palomas in the Conejos-Médanos portion of the Basin, moving north to the Mesilla portion of the Basin [8]. Present groundwater elevations (Figure 5) provide evidence that groundwater continues this throughflow. Based on area estimates from cross sections developed by Hawley and Kennedy (2004) [8], hydraulic conductivity estimates by Frenzel and Kaehler (1992) [14], and groundwater hydraulic gradients developed herein (Figure 5), the median estimate of throughflow from the Conejos-Médanos portion of the Basin to the Mesilla portion of the Basin is about 22.8 hm3/year, with a minimum discharge estimated to be about 4.7 hm3/year and a maximum discharge of about 82.5 hm3/year (Table 1). These estimates represent about 30%, 140%, and 520% of the estimated total annual recharge (15.8 hm3/year) to the Conejos-Médanos portion of the Basin, respectively [27]. This northerly groundwater flow is supported by stable isotope compositions of water measured in groundwater samples collected from the Juárez well field, which indicates a distinct isotopic signature from Rio Grande, mountain-front, or geothermal waters [82] that is also present in some groundwater samples collected near the U.S./Mexico border.
Geothermal waters that are associated with the region’s known geothermal systems upwell from depths of greater than 1 km to recharge shallower groundwater supplies. The brackish (1800 to more than 4800 milligrams per liter (mg/L) DS concentrations) waters are evidence of deep groundwater circulation and ascend in the northernmost portion of the Basin at Radium Springs, in the west near the East Potrillo Mountains, and along the East Bench along the eastern border zone of the Mesilla Valley [83,84]. Discharge estimates for the East Bench range from 0.01 to 19 hm3/year and between 0.5 and 1.6 hm3/year for the East Potrillo Mountains [83,84,85]. No estimates are available for the Radium Springs system [83]. These inflows represent localized upflow within the geothermal systems and tend to be focused along faults, uplifted bedrock horst blocks, and fractured igneous intrusions [83].

Vertical Groundwater Flow

Groundwater in the Rio Grande alluvium generally occurs under unconfined conditions, while groundwater in the Santa Fe Group is typically semi-confined [38]. Due to the presence of interbedded gravels, sands, and clays in the alluvium, horizontal permeability usually exceeds vertical permeability by several orders of magnitude [38]. The vertical gradient potential is generally downward in shallower wells (<150 m) but becomes smaller and, at some locations, reverses with depth, potentially allowing for mixing of deep waters where clay layers may be discontinuous [11,17]. This condition is evident in several nested wells in the Mesilla Valley and in two paired deep wells on the West Mesa (Figure 2). Locations where upward vertical gradients are persistent and throughout the water column [5,17] are near the U.S./Mexico border, where groundwater gradients (Figure 5) indicate a confluence of horizontal flow directions where several faults occur (Figure 2) [60,84]. The location of the upward gradients may also result from the thinning aquifer (Figure 3), in contrast to farther south, where vertical gradients are neutral and the aquifer thickness remains relatively uniform (Figure 3) [17,72]. Large production well fields, like the one near Cañutillo, Texas (Figure 2), can also induce large changes in the vertical gradient by locally lowering groundwater elevations in vertically adjacent aquifer units.

Groundwater Age

Age-dating tracers (tritium and carbon-14) in samples collected from groundwater wells in the Basin generally indicate increasing age of residence with depth, from modern waters near the surface to older waters with increasing depth. Indications of age from carbon-14 analysis in samples from the Basin groundwater tend to be grouped into modern (near 100 percent modern carbon; pmc), moderately old (between 50 and 100 pmc), and old (<17 pmc) [5]. Age-dating tracers also indicate that recent recharge in quantities large enough to dilute older groundwater is occurring primarily in the Rio Grande alluvium [5,13]; however, Teeple (2017) identified a few locations where modern recharge may be mixing with older waters in the Santa Fe Group [5]. Two of those locations are near production wells that have been documented to create cones of depression, and the third is near the terminus of the Basin, where the aquifer thins. These findings support the conceptual model of groundwater flow in which there are locally nested flow systems in the Mesilla Valley that overlie more extensive and deep flow paths throughout the Basin.

Groundwater Discharge

Most of the discharge from the Rio Grande alluvium occurs through pumping for irrigation and seepage of shallow groundwater to the surface-water drain system [16,37]. Discharge from the deeper Santa Fe hydrostratigraphic units is primarily through groundwater pumping for municipal and industrial use, a small amount of upward leakage [37], and a small amount of groundwater discharge to the neighboring Hueco Bolson through the Paso del Norte, as indicated by groundwater elevations (Figure 5).
Groundwater is withdrawn for agricultural, municipal, industrial, and domestic uses. Except for the Juárez well field, located just south of the U.S./Mexico border, the majority of irrigation and municipal pumping occurs in the Mesilla Valley. Before 1951, the number of agricultural withdrawals from groundwater was small due to adequate surface-water supplies [41]. However, in 1964, when there was a record low surface-water allotment of only 0.10 hm3/km2, Richardson and others (1972) estimated that irrigation pumpage exceeded 255 hm3/year [57]. During the wet years of the 1980s, groundwater withdrawals for irrigation in Doña Ana County decreased to about 70 hm3/year [16]. Drought conditions returned during the late 1990s and early 2000s, and agricultural pumping in Doña Ana County increased to about 120 hm3/year [16]. In recent years (2016–2019), agricultural pumping in the Mesilla Valley has ranged from about 150 to 210 hm3/year [86,87,88].
The largest municipal users of groundwater in the Basin are the cities of Las Cruces, New Mexico; El Paso, Texas; Ciudad Juárez, Chihuahua; and the Camino Real Regional Utility Authority (CRRUA), which supplies Santa Teresa and Sunland Park, New Mexico (Figure 2) [15]. The population of these communities has grown rapidly in the last 60 years. For example, the population of the city of Las Cruces has grown from 12,300 in 1950 to about 104,100 in 2021, and the Ciudad Juárez/El Paso urban center has grown from a population of about 255,000 to over 2.2 million over that same time [89]. Las Cruces Utilities began supplying water to Las Cruces through a series of groundwater wells in the 1920s [15,90]. In recent years (2016–2019), municipal pumping for the City of Las Cruces has ranged from about 25 to 27 hm3/year [86,87,88]. El Paso Water Utility operates a well field in Cañutillo, Texas, which began production in the 1950s [15,91]. Annual groundwater pumping at the Cañutillo well field increased steadily, starting from 3.7 hm3/year in 1952 and recently supplying El Paso with between 31 and 43 hm3/year [16,91,92,93]. Developments in Santa Teresa and Sunland Park along the New Mexico/Texas border rely on groundwater supply from the CRRUA through a network of groundwater wells that were drilled in the early 1970s [15]. Annual groundwater withdrawal from these wells has increased steadily, from 2.5 hm3 in 1973 to more than 6.9 hm3 in 2003 [15]. In 2007, water withdrawal from the Conejos-Médanos portion of the Basin was about 1.6 hm3, mainly for domestic and livestock use [10]. However, in 2010, in order to meet growing demand in Ciudad Juárez and the increasing stress on the Hueco Bolson aquifer, the city began supplementing municipal water with about 31 hm3/year of groundwater extracted from 23 wells located near the international border (Figure 5) [10].

4.2.2. Storage

Changes in groundwater storage can occur year to year, depending on land use, pumping, and climatic conditions [16]. Using an integrated hydrologic model, Hanson and colleagues (2020) showed interannual variability in depletion and replenishment of groundwater storage within the Mesilla portion of the Basin and that the largest annual groundwater storage depletions corresponded to increased groundwater pumping [16]. Inflows to the groundwater system, predominately recharge from the Rio Grande and infiltration of irrigation water, resulted in groundwater storage replenishment in portions of the aquifer in years with decreased groundwater pumping.

Previous Groundwater Storage Estimates

Previous estimates of groundwater storage are limited to parts of the Mesilla portion of the Basin. The approximate thickness of saturated freshwater sediments ranges from 120 m in the north and south to almost 910 m in the central portion of the Basin [8,11]. The thickest saturated sediments containing freshwater generally coincide with the present course of the Rio Grande. Wilson and colleagues (1981) estimated that there is approximately 24,700 hm3 of recoverable freshwater in the Rio Grande alluvium and Santa Fe Group sediments underlying the Mesilla Valley north of Cañutillo, Texas, based on a specific yield (Sy) of 15% and assuming that 60% of the sediments are sands and gravels [11]. Wilson and others (1981) also estimated the freshwater storage beneath the West Mesa to be about 41,900 hm3 [11]. Hawley and Kennedy (2004) estimated the “most productive” portion of the aquifer system (the Rio Grande alluvium, upper Santa Fe unit, and middle Santa Fe unit) to hold about 17,300 hm3 of available freshwater (<1000 mg/L DS) [8]. This estimate was made using an average saturated thickness of 61 m over a 2600 km2 area and an Sy of 0.1. This is similar but not spatially exclusive to the 16,000 hm3 estimated for the West Mesa area by Balleau (1999) [12]. Hawley and Kennedy (2004) went on to estimate that there could be as much as 61,700 hm3 of fresh to slightly brackish (1000 to 3000 mg/L DS) water in the deeper parts of the Basin, by assuming a thickness of about 300 m over 1940 km2 and an Sy of 0.1 [8]. There are no reported estimates of the storage beneath the Conejos-Médanos portion of the Basin.

New Estimates of Groundwater Storage

The recent construction of a digital hydrogeologic framework [7] allows for a new estimate of groundwater storage using a more detailed aquifer volume. From Equations (1) and (2) (in Section 2), the estimates presented herein are derived using values of Sy and specific storage; we will therefore refer to the estimated volume as “potentially recoverable groundwater.” We define this term as the volume of groundwater that could potentially be removed by pumping to completely drain the aquifer and excepting the groundwater retained by capillary forces. The Rio Grande alluvium fills the incised Rio Grande Valley floodplain (Figure 1), which, in places, is as much as 8-km wide. In the digital hydrogeologic framework model for the Basin, the base of the Rio Grande alluvium was defined as 24 m below land surface [7]. Using this assumption, the total volume of saturated sediments in the Rio Grande alluvium (equivalent to the river-channel hydrostratigraphic unit of Sweetkind (2017) [7]) was estimated to be 8600 hm3. Assuming an Sy of 0.1, the volume of potentially recoverable water calculated using Equation (1) is about 860 hm3. Within the portions of the Basin included in this analysis, the total volume of saturated sediment in the upper Santa Fe unit was estimated to be about 333,000 hm3, the total volume of saturated sediments in the middle Santa Fe unit was estimated to be about 456,000 hm3, and the total volume of saturated sediments in the lower Santa Fe unit was estimated to be about 530,000 hm3. Using Equation (2) and assuming an Sy of 0.1 and an Ss of 0.00001 per foot, the total volumes of potentially recoverable groundwater in the upper, middle, and lower Santa Fe units were estimated to be about 33,300, 48,100, and 58,000 hm3, respectively. The total storage estimate of 141,000 hm3 is almost double the Hawley and Kennedy (2004) estimated volume of about 80,200 hm3 [8]. However, this estimate includes all of the lower Santa Fe unit, whereas Hawley and Kennedy [8] used a lower cutoff depth of about 300 m, and therefore, their estimate does not include most of the lower Santa Fe unit. Based on reports of low yields and higher salinities of water from the lower Santa Fe unit relative to the upper units, we believe that a more realistic estimate of recoverable groundwater is limited to the Rio Grande alluvium and the upper and middle Santa Fe units. Removing the lower Santa Fe unit volume yields an estimate of recoverable groundwater of 82,600 hm3.
In order to estimate the amount of groundwater in storage in the Conejos-Médanos portion of the Basin, we assume the same Sy as Hawley and Kennedy (2004) [8] (0.1) and calculate an aquifer volume by using 87% of the reported area, 5180 of the 5960 km2, and a uniform saturated thickness of 133 m. The smaller area accounts for the thinning aquifer at the margins of the Basin and several igneous intrusions that likely reduce the amount of aquifer sediments. The saturated thickness is assumed from reported thicknesses of fresh and slightly brackish groundwater cited in SGM (2011) [10] and interpreted from several geoelectric units (geologic units with similar electrical properties) that were grouped into three horizons: 20–40 m of low-permeability sediments with freshwater, 40–150 m of slightly brackish water, and a deeper unit with higher salinity [10]. Based on these assumptions, the amount of recoverable fresh or slightly brackish water stored in the Conejos-Médanos portion of the Basin is estimated to be about 69,100 hm3.

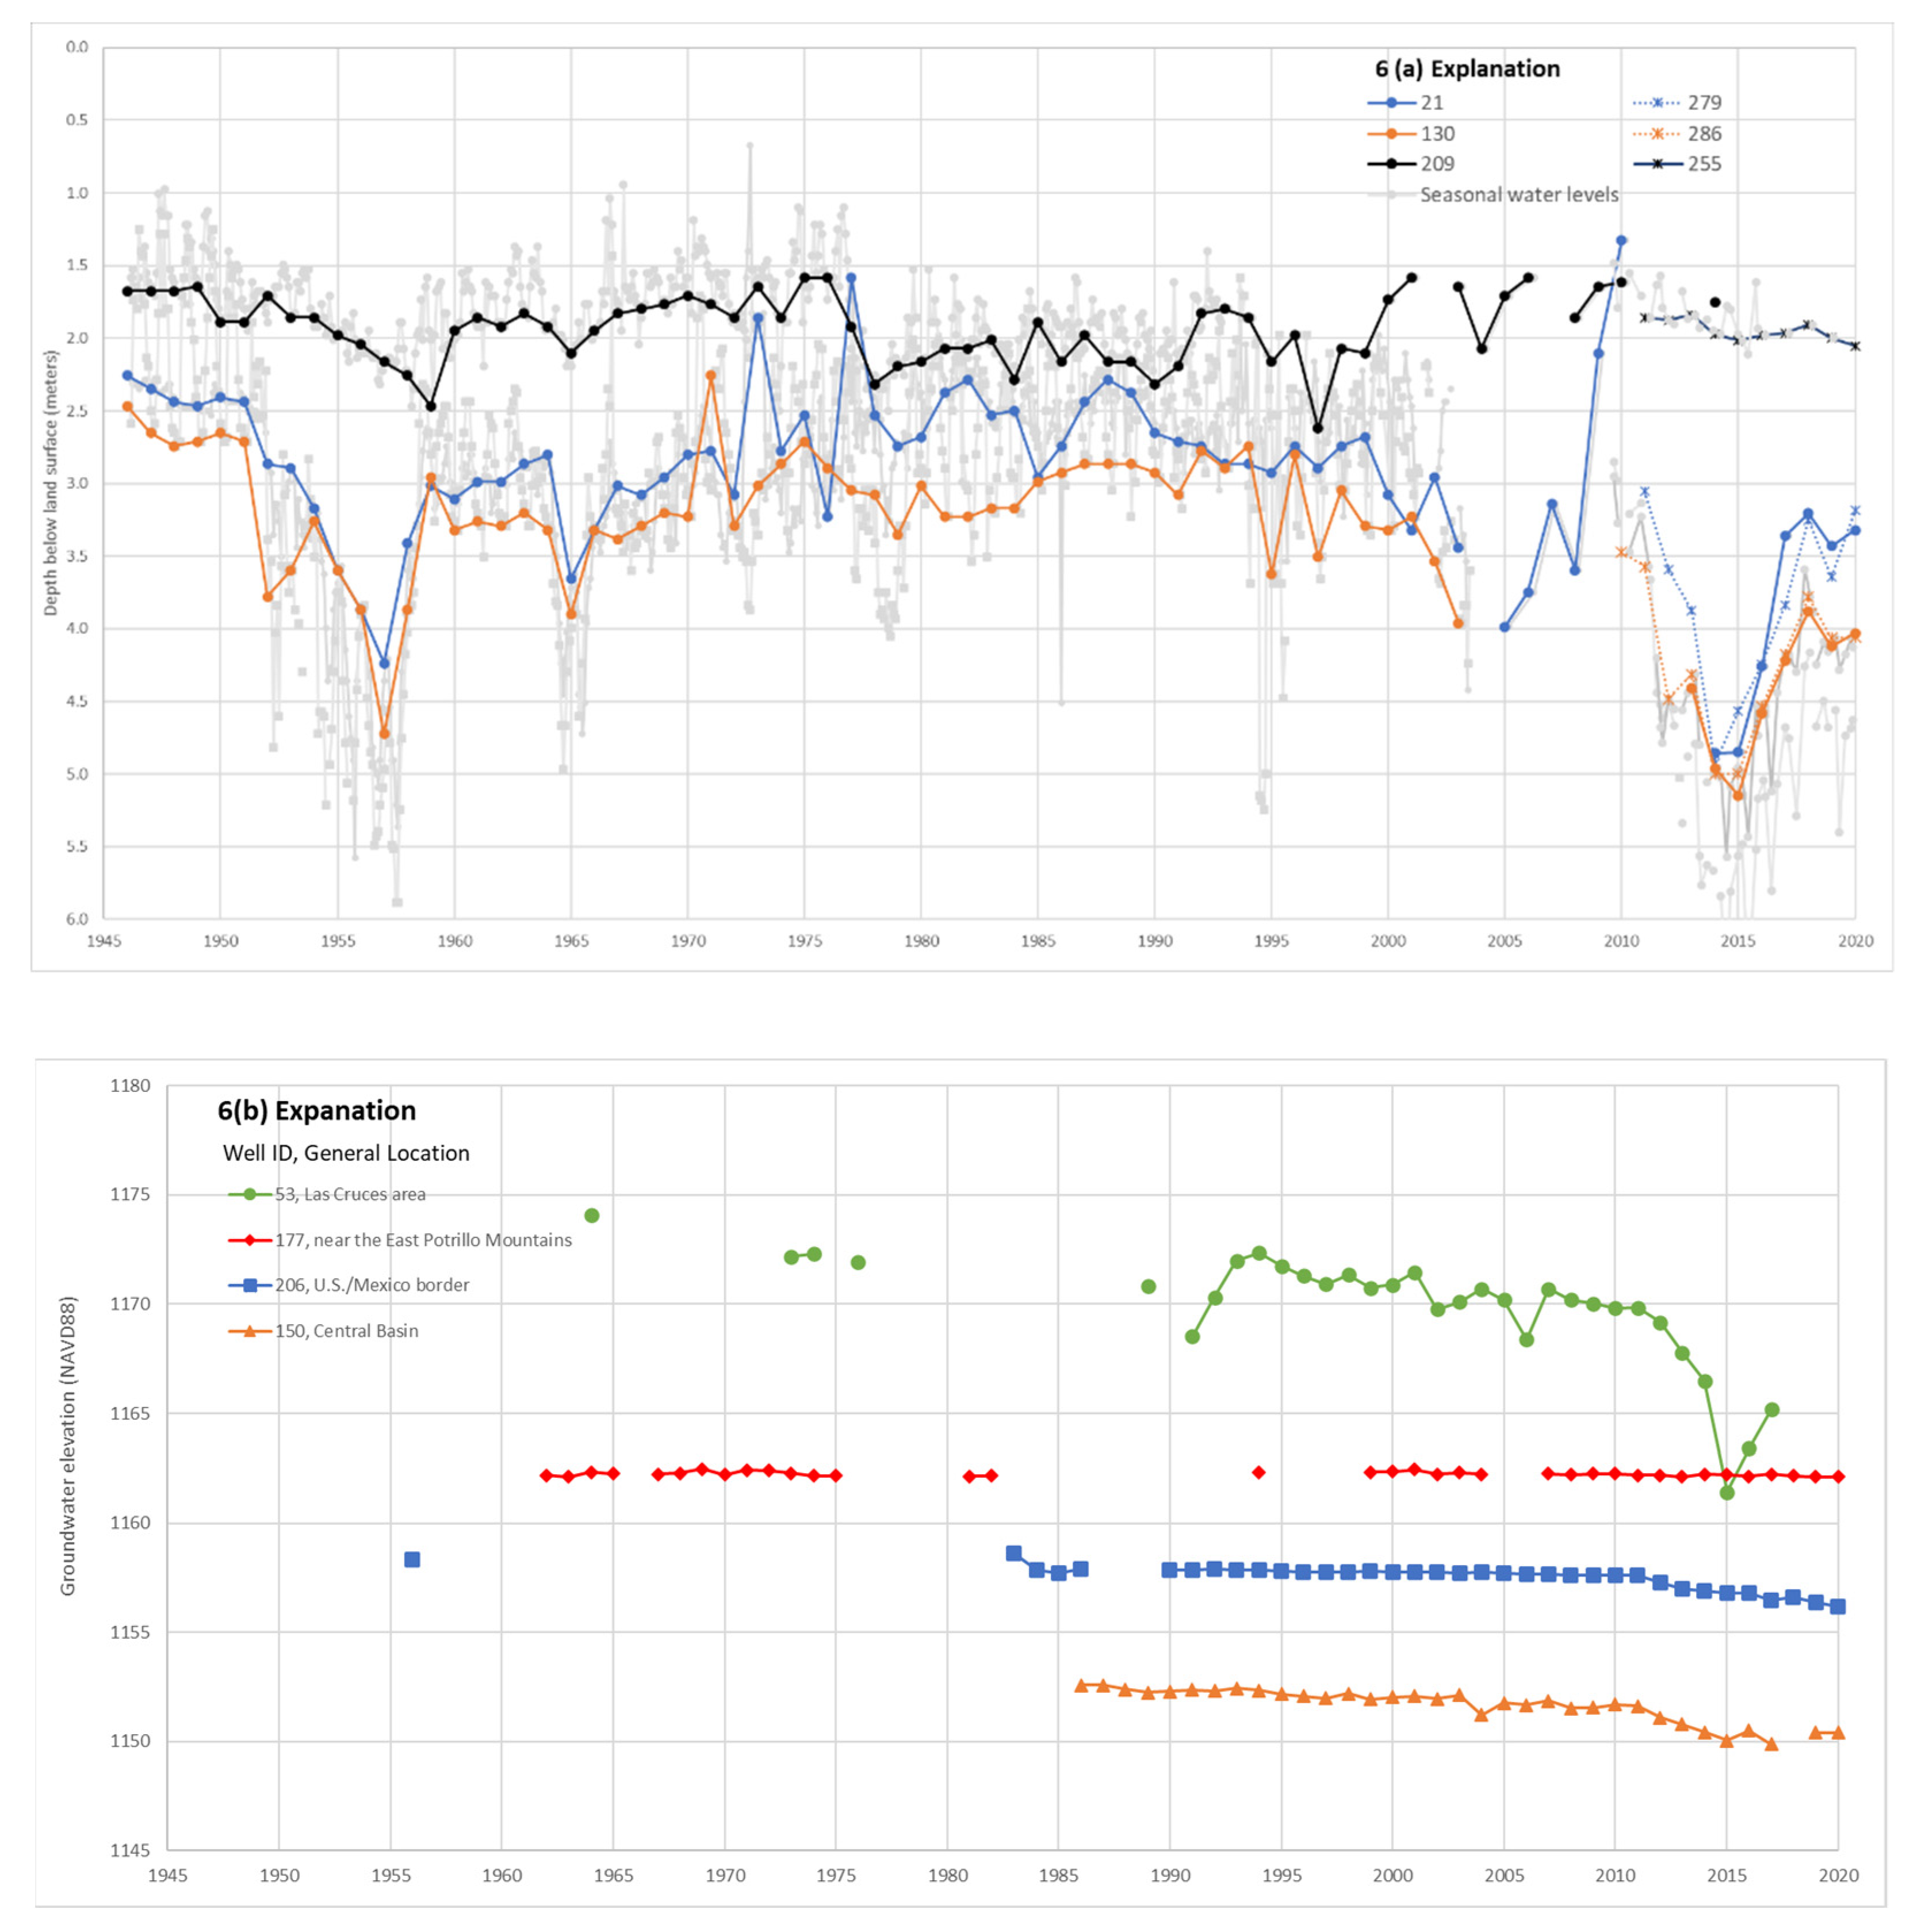
4.2.3. Aquifer Dynamics

Seasonal and annual recharge and discharge in the shallow Rio Grande alluvial aquifer and long flow paths in the deeper Santa Fe Group aquifer are recorded by changes in groundwater levels [16]. Hydrographs from selected wells with long-term records in the Basin are displayed in Figure 6, using winter measurements to reduce the effect of seasonal pumping on the record. Well locations are shown in Figure 2. Data from nearby wells with similar screen depths are included to add to, and in some cases extend, the period of record for a given well. Figure 6a shows depths to water for Rio Grande alluvial wells. The full dataset is included in the background (gray shaded points and lines) to show the seasonality in alluvial-well groundwater levels. Figure 6b shows groundwater elevations in wells screened in the Santa Fe Group sediments to show hydrographs and groundwater levels in relation to one another.
The shallow alluvial wells include, in downstream order, 21 (USGS Site ID 321853106504001), 130 (USGS Site ID 320403106390401) and 209 (USGS Site ID 314817106325801) (and their associated nearby wells, 279 [USGS Site ID 321859106503101], 286 [USGS Site ID 320404106385801], and 255 [USGS Site ID 314854106340101], respectively) (Figure 2) [18]. Fluctuations in shallow groundwater levels indicate a dynamic surface-water/groundwater interaction in the northern portion of the Basin [6,38]. Smaller groundwater level variations near wells 209 and 255 compared to other wells for the same point in time (Figure 6a) are consistent with previous indications of a reduction in vertical gradients near the terminus of the Basin (Paso del Norte). Long-term groundwater-level data in wells 21, 279, 130, and 286 show multiyear declines in the Rio Grande alluvium during the drought of the 1950s and the current (2022) drought, starting around 2000 (Figure 6a). These declines are far less discernable in the more southerly wells, 209 and 255. Reductions in streamflow due to drought not only limit the amount of surface water available for irrigation and recharge but also lead to an increase in groundwater withdrawals [16]. The transition to groundwater pumping, reflected in multiyear declines in the depth to water, reflects the reduced availability of surface water in the Basin.
Annual groundwater elevations in the Santa Fe Group sediments typically vary by less than 15 cm per year unless they are near areas of large extractions [15] (Figure 6b). The hydrograph of well 53 (USGS Site ID 321650106451201), located in Las Cruces, New Mexico, for example, shows the largest annual changes and a steady decline in groundwater elevations due to groundwater pumping. The highest groundwater elevation (1174.1 m) in well 53 was measured in 1964, and the lowest (1161.4 m) was in 2015. Well 177 (USGS Site ID 315349106585701), located away from any large pumping areas, has varied by just over 30 cm since measurements began in 1962. Groundwater elevations in well 206 (USGS Site ID 314810106513601), near the U.S./Mexico border, have typically varied by only about 3 to 6 cm per year between 1983 and 2010. However, a decline of almost 1.37 m occurred between 2010 and 2020, likely resulting from the start of pumping at the Juárez well field in 2010 (Figure 6b). Groundwater elevations in the Conejos-Médanos portion of the Basin did not change substantially between 1987 and 2007 [10], prior to pumping in the Juárez well field. The decline in groundwater elevations in well 206 following the start of pumping also coincides with water-level declines in alluvial wells (for example, wells 21, 279, 130, and 286) that can be attributed to reduced surface-water availability, and therefore, care is warranted when attributing the groundwater elevation declines. A similar decline is observed in the central Basin at well 150 (USGS Site ID 315720106415601).

5. Water Chemistry

Spatial patterns and relations between water chemical and isotopic data are useful for determining recharge sources, direction of flow, and geochemical processes [5,13]. As stated previously, much of the recharge in the Basin originates from the Rio Grande and, to a lesser extent, local precipitation. Once the surface water has infiltrated, water-rock interactions and groundwater mixing can change the chemical composition of the water [93]. The geochemistry of shallow groundwater throughout the Basin is governed primarily by the evaporative concentration of solutes in Rio Grande streamflow and agricultural diversions, while deeper groundwater geochemistry results from multiple processes, including mixing between geothermal and nongeothermal groundwater, dissolution and mineral precipitation reactions, and ion exchange [13].

5.1. Groundwater Chemistry

Water chemistry in the Rio Grande alluvium generally reflects the chemistry of the surface-water system, whereas water chemistry in the Santa Fe Group depends on the source and time of recharge and water-rock interactions along the flow path. Although groundwater chemistry varies greatly with location, Wilson and colleagues (1981), examining specific conductance data between 1953 and 1976, reported that groundwater chemistry changed little over time in the wells they sampled [11].

5.1.1. Dissolved Solids

Dissolved solids (DS) concentration is a measure of the mineral content of water and is a conservative property, meaning that concentration is not expected to change as water moves downgradient unless it mixes with water from a different source or interacts with a different rock or sediment type [94]. Because of this property, DS can be used to identify areas of similar water types and can provide evidence of groundwater flow and mixing [5]. The mineral content in the Basin groundwater is extremely variable. Land (2016) reports DS concentrations ranging from 234 to 30,800 milligrams per liter (mg/L) from 408 records in New Mexico [95], Teeple (2017) reports a range of 161 to 31,000 mg/L from 239 wells along the Texas/New Mexico border [5], and SGM (2011) reports a range of 72 to 11,370 mg/L from 91 wells in the Conejos-Médanos portion of the Basin [10]. The average DS concentrations for these datasets are similar but reflect increasing salinity from north to south, with average values of just over 1200 mg/L from Land (2016) [95], 1500 mg/L from Teeple, (2017) [5], and 1700 mg/L from SGM (2011) [10]. These average values are skewed by the presence of samples with high mineral content. This bias is reflected in median DS concentrations of 693 mg/L [95], 857 mg/L [5], and 817 mg/L [10], which are lower than their respective mean concentrations. For comparison, DS concentrations in the Rio Grande are reported to range from 400 to 1200 mg/L, with higher concentrations observed in the downstream part of the river [96].
Water chemistry in the upper Santa Fe unit is similar to water chemistry of the shallow Rio Grande alluvium. Wells less than 30-m deep in the Mesilla Valley that are farther from the Rio Grande have slightly brackish water (DS concentrations 1000 to 2000 mg/L), with predominant ions of calcium, sodium, and sulfate [11,38]. This relation is consistent throughout the Mesilla Valley and has been attributed to the effects of surface-irrigation practices and evapotranspiration [11]. Individual wells with high salinity or iron concentrations may tap abandoned river channels or ancestral swamp or bog deposits [43]. Wells slightly deeper (between 45 and 245 m) are typically fresh (DS concentrations < 1000 mg/L) and are not characterized by specific dominant ions. Groundwater in the middle Santa Fe hydrostratigraphic unit typically has lower DS concentrations than in the overlying units, and the DS concentrations tend to be greater in groundwater samples from wells screened in the lower Santa Fe unit. The presence of fresher water between the upper Santa Fe unit and the lower Santa Fe unit throughout most of the Basin supports the conceptual flow model in which the deep and shallow groundwater have limited interactions [5].
Spatial variability of water chemistry throughout the Mesilla portion of the Basin may result from numerous factors, such as the source of recharge, groundwater mixing, presence of evaporites, and geothermal inputs. Groundwater in the northern part of the Basin is generally fresher, with concentrations of trace elements that are less than regulatory water quality criteria. In contrast, water from wells on the east side of the Mesilla Valley and near Paso del Norte often have DS concentrations greater than 1000 mg/L. The DS concentrations in West Mesa wells become more brackish at shallower depths farther west and south, with increases in the relative amounts of chloride and sulfate [38]. Similar major ion concentrations indicate good connection between groundwater from wells on the west side of the Mesilla Valley and groundwater from the West Mesa. At the southern end of the Mesilla Valley, however, DS concentrations can exceed 10,000 mg/L [37].
Several drilling records note increased DS concentrations near the bottom of the borehole [97], but data are too sparse to determine the extent of brackish water in the deep lower Santa Fe unit. Similarly, there are very few reports of wells screened in the underlying consolidated bedrock. Leggatt and others (1963) described one bedrock well that “flowed salty water,” whereas the description from a well screened in Cretaceous rocks is that of “moderate supply and satisfactory for industrial use” [41].

5.1.2. Temperature

The average temperature from 154 groundwater wells in the Basin was about 26 degrees Celsius (°C; median was also 26 °C) and ranged from 14 to 37 °C [5,10,13]. Groundwater temperatures generally increase with depth at a rate of about 35 °C per km in the Basin but can be affected by groundwater advection in places [98]. For example, temperature gradients are much higher within known geothermal areas, where waters ascend from depths of over 1 km (e.g., East Bench, East Potrillo Mountains, and Radium Springs) (Figure 1) [83,84]. Localized groundwater upflow zones within these geothermal areas can have temperatures exceeding 55 °C, and geothermal waters at Radium Springs are close to 100 °C [83,99]. Temperature gradients are sometimes lower or negative within the Mesilla Valley, where surface-water recharge or horizontal groundwater flow affect temperatures [83].

5.1.3. Major Ions

The majority of the groundwater in the Mesilla portion of the Basin is sodium-cation-dominant and a chloride-sulfate-anion type [5]. The dominant water type measured in the Conejos-Médanos portion of the Basin is sodium-bicarbonate-sulfate, with increasing chloride as groundwater flows north [10]. Except for calcium, all the major ions increase as DS concentrations increase [5], indicating that general mineral dissolution and cation exchange processes are occurring. Many studies report that there is an evolution of calcium-dominated water to sodium-dominated water [5,13] and a general shift from bicarbonate recharge waters toward chloride and sulfate waters in the direction of flow in the southern Mesilla Valley. The transition in water types occurring along a given flow path indicates increased influence from evaporite dissolution and cation exchange on groundwater chemistry [42]. Evaporite minerals (halite, gypsum, and anhydrite) are present in sediments in parts of the aquifer and contribute sodium, chloride, sulfate, and calcium into solution [67]. Isometric log plots [100] of Mesilla Valley groundwater provide supporting evidence of this and tend toward equilibrium with evaporite minerals as the DS concentrations increase, particularly halite in the southern Mesilla Valley [42]. However, most samples were enriched with sodium relative to halite dissolution, indicating additional processes, such as the dissolution of silicate minerals, calcite dissolution, cation-exchange, or a combination of each, are occurring [5,13,42].

5.2. End Members

Geochemical and isotopic attributes are commonly used by researchers to classify groundwater [5,13,94]. Several studies have identified distinct geochemical water types in the Basin’s groundwater to answer a variety of hydrologic questions [5,13,63,64,76]. The conceptual model of the Basin characteristics, such as groundwater flow, sources of salinity, and geochemical evolution, are supported and further developed using these tracers [5,13,42]. Based on characterizations by Teeple (2017), we describe four groundwater end members that have distinct geochemical and isotopic compositions that can be attributed to different sources and water-rock interactions [5]. We acknowledge the presence of other groundwater types and groundwater that contains a mixture of different end members; however, by focusing on the most prevalent types, we believe we can adequately describe the prevailing processes that influence groundwater geochemical attributes. The end members include (1) ancestral Rio Grande (pre-Holocene) geochemical group, (2) modern Rio Grande geochemical group, (3) mountain-front geochemical group, and (4) deep-groundwater upwelling geochemical group. The groups identified include freshwater likely sourced from the ancestral Rio Grande, as well as younger groundwater from the modern Rio Grande seepage, older groundwater near the western highlands sourced from mountain-front recharge, and brackish to saline water from deeper sources.

5.2.1. Ancestral Rio Grande (Pre-Holocene)

Groundwater belonging to this end member is postulated to have recharged into the system as seepage from the ancestral Rio Grande. This ancestral Rio Grande groundwater type occurs throughout the Basin and is found primarily in the middle Santa Fe unit. Based on overall groundwater flow patterns, groundwater of this geochemical group is moving south and southeast, before flowing laterally east toward the Paso del Norte (Figure 5). Modern-day flow for this paleo-recharged groundwater is likely driven by small amounts of recharge at the Basin margins and by withdrawals at large groundwater pumping centers. This geochemical group is characterized by low DS concentrations (average = 415 mg/L; median = 360 mg/L), low amounts of radiocarbon, and depleted stable isotopes of water [5]. Despite the long flow path, the small gains in DS concentrations along the flow path of this groundwater type indicate that the aquifer lacks large amounts of soluble minerals, possibly because of the depositional environment, as well as being depleted in soluble minerals by large volumes of groundwater flow in the past. The general geochemical evolution along the flow path is from a calcium-sodium-bicarbonate to a sodium-sulfate-bicarbonate water type. The low radiocarbon and depleted stable isotope composition reflect the recharge conditions before the Holocene.

5.2.2. Modern Rio Grande (Holocene)

Groundwater belonging to this geochemical group is found primarily in the Rio Grande alluvium and, to a smaller extent, the upper Santa Fe unit in the Mesilla Valley. High concentrations of age-dating tracers, tritium, and carbon-14 indicate that shallow groundwater was recharged from the Rio Grande and agricultural infrastructure within the past 100 years [5]. When there are ample surface-water supplies, water may enter and leave the groundwater system within a season, as occurs with water conveyed by the drains. Stable isotope compositions [5,13] support evaporated Rio Grande water as the source of this groundwater group, with sample results plotting on the Rio Grande evaporation line developed by Phillips and others (2003) [70]. Groundwater temperatures also indicate rapid recharge of surface water, with groundwater temperatures (averaging about 19 °C) near the average annual temperature in Las Cruces (11 °C) [5,13]. This end member ranges from calcium-sulfate water type in the northern Mesilla Valley to sodium-chloride-sulfate water type in the southern Mesilla Valley [5]. DS concentrations in the shallow alluvium average about 1950 mg/L (the median is about 1600 mg/L). Evaporative processes can lead to elevated DS concentrations (>2000 mg/L) along agricultural drains, and recharge from these drains often leads to elevated concentrations of dissolved ions in the shallow subsurface [13,72].

5.2.3. Mountain-Front Recharge

In mountain-front recharge areas, precipitation and high-elevation springs and wells are characterized by low DS concentrations (<250 mg/L) and typically have dominant ions of calcium, magnesium, and bicarbonate [13,75,76]. The stable isotope composition of these epigenic waters plot on or near the Global Meteoric Water Line [78], unlike the stable isotope composition of Rio Grande water. Groundwater sampled near the boundaries of the Basin show mixing patterns between the epigenic sources and several different endogenic sources. The lack of samples with a large epigenic component from large portions of the Basin aquifer supports previous assertions that mountain-front recharge is presently a minor component of recharge to the Basin aquifer [14,16]. Wells near the Basin boundaries that are considered to have a substantial component of mountain-front recharge generally have low concentrations of age-dating tracers, indicating that the water likely recharged under wetter and cooler conditions than at present (2022). Water belonging to this group is somewhat mineralized, with average DS concentrations around 780 mg/L (median of about 710 mg/L) [5].

5.2.4. Deep Upwelling Groundwater

The presence of high-temperature groundwater, faults, and highly mineralized water indicates that groundwater from depth is upwelling to shallower zones in portions of the aquifer [83,101,102]. Vertical leakage from deep-seated regional groundwater flow systems, including geothermal systems, may also be a substantial source for salinity increases in the shallow aquifers and the Rio Grande near Paso del Norte [13,70,83]. Waters with elevated concentrations of trace ions are observed in wells on the West Mesa, near the East Potrillo Mountains, at Radium Springs, and on the East Bench (Figure 1 and Figure 2) [5,13,71,94]. The deep upwelling groundwater has been characterized as having high concentrations of chloride, arsenic, potassium, silica, aluminum, iron, and lithium and may be originating from the Paleozoic and Cretaceous carbonate bedrock [5,42]. Szynkiewicz and colleagues (2011), using sulfate isotopes and principal component analysis, concluded that a substantial amount of major ion concentrations in the groundwater could be attributed to groundwater flow from the bedrock [59]. The original source of this deep groundwater is unknown but may include paleo-mountain-front recharge in the southern and western portions of the Basin and interbasin flow from the Jornada Basin along the East Bench [13,14,77]. Temperature analyses indicate that geothermal waters in the Mesilla portion of the Basin ascend from depths of at least 1 km, with geothermal waters at Radium Springs coming from depths upwards of 2 km [83].

6. Water Budget

The water budget for the Mesilla portion of the Basin is approached by balancing inflows and outflows between three interrelated components of water supply and use: surface water, groundwater, and agriculture. Only the Mesilla portion of the Basin was selected because of the available data and the presence of the Rio Grande. This budget relies on the throughflow estimates from the Conejos-Médanos portion of the Basin made in Section 4.2.1. The budget terms were considered and refined by compiling the available estimates for three periods: the entire time period for which there are reliable and publicly available data (generally 1940 to 2014), the dry period between 1950 and 1969, and a wetter period between 1980 and 1999. Dry periods and wetter periods were classified by Hanson and colleagues (2020) [16].
The surface-water component of the water-budget estimate includes only the Rio Grande and the water that flows into or is diverted from it. Between 1940 and 2014 the flow measured entering the Basin above Leasburg Dam averaged about 759 hm3/year (+/− 310 hm3/year; median value 772 hm3/year), and streamflow measured leaving the Basin averaged about 491 hm3/year (+/− 279 hm3/year; median value 465 hm3/year) [17]. The difference indicates that, on average, there was about 268 hm3/year of water lost from the Rio Grande in the Basin. As the largest of the inflows and outflows, these budget terms agree well with other reported estimates and provide a solid starting point for adding other budget items [11,14,15]. The largest diversions of surface water in the Basin are made for irrigating crops. Between 1940 and 2014 the average amount of water diverted in the Basin was 433 hm3/year (+/− 152 hm3/year; median value 461 hm3/year) or about 57% of the Rio Grande inflow at Leasburg Dam and ranged from about 60 hm3/year in 2012 to almost 680 hm3/year in 1945 [17]. These diversions are measured, and the values considered reliable within appropriate gaging errors. The amount of water returned to the Rio Grande from canal return flow is estimated to be about 10% of the diversions [11,17,39], and return flow from the drains was typically about 33% of the diversions for the available data between 1940 and 1978 [11,17]. The total return flow over that period ranged from 9% to 56% of the diversions [11,17]. Between 1940 and 1992, drain flows varied from just under 5.6 hm3/year in 1956 to a little over 310 hm3/year in 1944 and averaged about 143 hm3/year (+/− 80 hm3/year; median value 148 hm3/year) [17]. Wastewater returns to the Rio Grande increased from about 6.2 to 15 hm3/year between 1976 and 2014, and the average was about 12 hm3/year [17]. Based on the average precipitation in the area (21 cm) and the estimated surface area of the Rio Grande (7.8 km2), the average amount of precipitation falling directly on the river is about 1.6 hm3/year. The annual evaporation from the river surface was estimated to be 13 hm3/year by Frenzel and Kaehler (1992) [14] and was used for this budget term. Finally, surface-water seepage measurements from the Rio Grande have typically been collected in the winter and range from about 1.2 to 80 hm3/year [11,15,39,49,50,51,52]. A value of 31 hm3/year was selected to balance the annual surface-water budget for the three periods and the selection of that value is supported by the frequency of seepage measurements that were reported close to that value. For comparison the simulated stream seepage at the end of the Frenzel and Kaehler (1992) model was about 68 hm3/year [14].
The groundwater component of the water budget consists of the entire aquifer and does not differentiate between geologic units. The largest depletion of groundwater is by pumping and is distinguished between municipal and industrial pumping and agricultural pumping. Groundwater for municipal use is metered and has generally increased in the Basin through time [15,16]. Estimates of municipal and industrial water use have ranged from about 49 hm3/year in 1975 [11,14] to 86 hm3/year in 2005 [15]. For this water-budget component, we assigned the low estimate of 49 hm3/year to the early (1950 to 1969) period and the high estimate of 86 hm3/year for the later period (1980 to 1999). Hanson and colleagues’ (2019) estimate of 67 hm3/year [16] was used for the period of record. Metered agricultural groundwater withdrawals have only recently become available, and groundwater withdrawals for irrigated agriculture have been estimated using a variety of techniques. Because of the conjunctive use of water for irrigation, agricultural pumping amounts vary dramatically year to year, with annual estimates ranging from less than 12 hm3/year to over 370 hm3/year [15,16,47]. Previously reported average agricultural pumping estimates cover different time periods and often include areas outside the Mesilla Valley [14,15,16]. For this analysis, the period of record average annual pumping rate of 110 hm3/year was selected from estimates by Frenzel and Kaehler (1992) and SSPA (2007) [14,15]. However, because those pumping estimates include the Palomas Basin, the estimate was reduced by using the fraction of total irrigated lands that are farmed in the Mesilla Valley (about 84%) [48] to 94 hm3/year. In recent years (2010–2018), agricultural pumping to supplement reduced surface-water deliveries has exceeded municipal and industrial pumping by about 3:1, withdrawing over 250 hm3/year [47]. Sources of recharge include deep percolation of applied irrigation water as a fraction of diversions, seepage from the Rio Grande (31 hm3/year), and mountain-front recharge (14 hm3/year). The majority of recharge to the aquifer since the 1940s is estimated to be from the infiltration of water through the irrigation conveyance system and the surface application of irrigation water [8,11,38]. The amount of groundwater recharge through deep percolation was estimated to be 13% of the total applied water (both surface water and groundwater), which is lower than the 39% of applied water estimated by SSPA (2007) and 24% by Hanson and colleagues (2020) [15,16]. This discrepancy is because the models route this groundwater to both groundwater recharge and drain flow, while this estimate assumes all deep percolation goes to recharge and the drain flow is a separate function of the applied water. Mountain-front recharge was estimated to be about 14 hm3/year based on previous estimates, which have ranged from about 1.2 to 17 hm3/year [14,15,17]. Groundwater flow from the Conejos-Médanos Basin towards the Basin outlet was estimated in the previous section to be about 23 hm3/year. Finally, Slichter (1905) estimated groundwater flow from the Mesilla portion of the Basin to the Hueco Bolson at Paso del Norte to be about 3 L/s, or about 0.1 hm3/year [103].
The agricultural component of the water budget includes the diversions, conveyance structures, fields, and drains of the EBID in New Mexico, as well as EP No. 1 in Texas. The primary inflow to agriculture is the surface water diverted from the Rio Grande. As reported above, the average amount of water diverted in the Basin was about 433 hm3/year. The effective precipitation falling on agricultural lands in the Basin has been estimated to be between 50% [15] and 90% [14]. For this budget estimate, 50% of the average annual precipitation (21 cm) was applied over 330 km2 of irrigated lands to yield about 36 hm3/year of precipitation available for agriculture. Water leaving the system includes return flow through canals and drains, which are estimated as a percentage of surface-water diversions (about 10% and 33%, respectively). Evapotranspiration from irrigated fields in the Basin has been estimated to be about 10 m3 per km2 for lower water-use crops, such as cotton, and about 20 m3 per km2 for higher water-use crops, such as pecans. While more acreage is being converted to higher water-use crops [15,16], for this estimate, 15 m3/km2 over 330 km2 of irrigated lands was used to estimate the water use by crops at 308 hm3/year, which is similar to previous estimates of about 302 hm3/year by Frenzel and Kaehler (1992) and 305 hm3/year by SSPA (2007) [14,15]. Groundwater pumping generally increases with reductions in surface-water deliveries, although historical pumping records are sparse. Estimated groundwater pumping for agricultural use is described above.
Several items can be noted from these water-budget estimates (Table 2). The first is that present-day average groundwater recharge from the Rio Grande and irrigated agriculture accounts for about 73% of the recharge to the Mesilla portion of the Basin and 66% of the recharge to the entire Basin (15.8 hm3/year of recharge reported for the Conejos-Médanos portion of the Basin [27]). Additionally, present-day recharge accounts for about 11% of Rio Grande alluvium groundwater volume annually, an amount that is lower than recent withdrawals. Second, for the period of record, the total loss from storage is estimated to be about 24.8 hm3/year. This estimate is substantially lower than the 53 hm3/year estimated by Hanson and colleagues (2020), and the difference may be due to the fact that their estimate includes both the Palomas Basin and the Mesilla portion of the Basin, as well as different estimates of throughflow from the Conejos-Médanos portion of the Basin [16]. While the estimates presented in this report may provide an estimate of the magnitude of the total loss over the period of record, it can be noted that much of the variability in the system is lost by selecting single values and percentages in order to simplify the computations. The average values and unadjusted percentages are sure to include biases and therefore warrant using with caution and will be increasingly less reliable for shorter time periods.

7. Potential Future Research Directions

The research needs for a scarce conjunctive-use resource that is managed by multiple governments would benefit from not only understanding of the physical characteristics and limits of the resource but cooperation and common objectives of stakeholders. This discussion is provided as a starting point to acknowledge the existing data gaps and to provide strategies for how to fill gaps. Perhaps the most important concern facing managers of any finite resource is the sustainability and resiliency of the resource and a management strategy that reduces uncertainty. To help address this concern, several data gaps were identified in this work that may benefit from future research, including (1) high-resolution storage, inflow, and use estimates; and (2) expanded water-chemistry data.

7.1. High-Resolution Water Storage, Inflow, and Use Estimates

Groundwater storage estimates provide an understanding of the water available at a given time and allow for estimates of resource capacity under different withdrawal scenarios. Storage is estimated from the volume and capacity of the aquifer. These values are highly variable and often generated from point data, where data density may be reasonably high or sparingly low, particularly at depth. Continued refinement of the underlying geology and aquifer properties of the Basin would allow for more accurate estimates of the amount of groundwater while also providing a better understanding of its distribution. Added drilling and geophysical data could provide better estimates of the aquifer thicknesses under the West Mesa and in the Conejos-Médanos portion of the Basin. Aquifer tests and geophysical methods for determining aquifer characteristics could improve understanding, particularly in the lower Santa Fe unit and throughout the Conejos-Médanos portion of the Basin. In addition, quantification of the changes in hydraulic gradients with continuous monitoring between parts of the West Mesa and the Conejos-Médanos portion of the Basin to the Mesilla Valley would provide a better understanding of the effect that pumping in the Mesilla Valley may have on groundwater flow and support improved resource-management decisions.
Groundwater storage allows managers to maintain use of water resources in times of supply shortages, but sustainable use would require that withdrawals not exceed inputs over the long-term. Therefore, additional refinements of the inflow and use estimates would be useful to determine withdrawal thresholds and associated effects on the inflow and outflow balance. New agricultural groundwater metering would be valuable to get better estimates of agricultural extractions, delivery and on-farm efficiencies, and recharge. Analysis of the reported data trends following multiple years of collection could define patterns and trends in water use. Continued collection of streamflow data at Leasburg and El Paso, along with upgraded gage sites to provide a higher-quality record, would allow managers to monitor surface-water trends within the Mesilla portion of the Basin. Water-level contours interpreted by SGM (2011) [10] and those presented here (Figure 5) indicate connected groundwater flow over the entire Conejos-Médanos portion of the Basin. However, the presence of intrabasin uplifts between structural sub-basins and the lack of substantial recent recharge indicates that groundwater flow in large areas of the Conejos-Médanos portion of the Basin may be disconnected. Additional groundwater-elevation, geochemical and isotopic data around the Los Muertos sub-basin, particularly near the northern extent, would provide further evidence as to whether groundwater in the southern Conejos-Médanos portion of the Basin is flowing northward. Additional flux estimates for groundwater throughflow between the Conejos-Médanos portion and the Mesilla portion of the Basin would help to refine the recharge estimates in the Conejos-Médanos portion of the Basin, the overall water budget for groundwater in the Basin, and the quantity and limitations of the brackish groundwater resource. This could be addressed by installation of nested wells and perhaps flux-meter installations. Finally, by incorporating and validating groundwater flow models with geochemical and isotopic tracers, inflow estimates (such as mountain-front recharge and deep upwelling) could be further supported and refined.
Refinement of the Basin water budget would allow managers to quantify threshold values and make management decisions to maintain the resource for multiple uses. Actionable limits could include maximum drawdown thresholds to prevent irreversible subsidence, decreased well performance, water-quality degradation, or a combination of these factors.

7.2. Water Chemistry

The amount of available water is also dependent on the quality of the water. The quality of the water is important not only for determining the amount of water available for consumption without treatment but also for the feasibility of treating brackish water to use-specified standards. In order to understand the potential for further salinization of the resource and, if needed, its mitigation, future research could include drilling several deeper wells (screened in the bedrock) near the Paso del Norte to improve current understanding of the bedrock-groundwater contribution to groundwater flow and salinity. If groundwater was derived from these bedrock units along a regional flow path, an upwelling geothermal signature would likely be observed in these deeper wells. Additional research may also improve current understanding of the relation between groundwater-age signatures and groundwater flow paths. Such research could improve our current understanding of the relation between groundwater age and salinity in the Mesilla Valley, which appears to be correlated in certain circumstances [5,42]. Furthermore, given that most of the drains throughout the Mesilla Valley have not been functioning over the last decade, future research could be beneficial to determine whether flushing thresholds exist at which salt accumulations at damaging levels may be reached in farm fields.
In order to deal with a persistent lack of sufficient water, researchers have looked to the potential of brackish groundwater as a resource. Concerns unique to inland desalination projects include uncertainty regarding the size of the resource, issues relating to water treatment for constituents in groundwater, such as silica, and disposal of brine concentrate [104]. Previous works [37,105] have suggested that substantial resources of slightly brackish water are present in the Mesilla Basin. However, there are limited records for the deeper portions of the Basin, with an average well depth in the Basin of only 100 m [95]. In addition to mapping the quantity of the brackish resource, a geochemical characterization of the reservoir would be useful to further assess desalination favorability.

8. Summary

The Mesilla/Conejos-Médanos Basin (Basin) is located in the southern part of the Rio Grande rift, a tectonic feature that is characterized by generally north-south-trending structural extensional basins. The Basin’s aquifer is composed of the basin-fill sediments of the Santa Fe Group within the Basin-bounding uplifts. Interbasin uplifts and subcrops separating the sub-basins within the Basin likely restrict deeper flow in the Mesilla portion of the Basin and may restrict all flow between the Los Muertos and El Parabien sub-basins in the Conejos-Médanos portion of the Basin.
Using a newly developed hydrogeologic framework, a new international water-level map, and previously reported aquifer property assumptions, the amount of potentially recoverable fresh to slightly brackish groundwater in the Mesilla portion of the Basin is estimated to be about 82,600 hm3. This new estimate is largely in agreement with previous estimates. A new estimate of storage for the Conejos-Médanos portion of the Basin is also presented in this work. Based on areal-extent and saturated-thickness assumptions, the amount of recoverable fresh or slightly brackish water stored in the Conejos-Médanos portion of the Basin is estimated to be about 69,100 hm3. The majority of groundwater stored in the Basin is thousands to tens of thousands of years old and was recharged during cooler and wetter parts of Quaternary glacial-pluvial cycles [8,106,107]. This water is very slowly being displaced at the boundaries by mountain-front recharge and near pumping centers, where vertical gradients are increased by large withdrawals from groundwater pumping.
The Rio Grande flows through the Mesilla Valley in the Mesilla portion of the Basin, which contains recent deposits of the Rio Grande alluvium. Relatively dynamic surface-water/groundwater interactions in the Mesilla Valley between the Rio Grande and the Rio Grande alluvium result in groundwater levels that are responsive to annual and seasonal changes in water supply and demand, in contrast to the deeper groundwater levels that remain stable or show a gradual response. This concept of groundwater movement that includes short groundwater flow paths in the shallow aquifer and groundwater flow paths that increase in length with depth is supported by the hydrologic and water-chemistry data presented in this report. Based on evidence presented in various sections of this report, the Rio Grande alluvium is the only unit currently receiving substantial amounts of recharge from the Rio Grande, and the amount of groundwater in the Rio Grande alluvium represents a little less than 0.6% of the entire regional aquifer. Approximately 11% of the volume of the Rio Grande alluvium is estimated to be recharged annually from Rio Grande seepage and deep percolation of agricultural water, but that amount is often offset by pumping.
The geochemistry of shallow groundwaters in the Mesilla Valley portion of the Basin is governed by the evaporative concentration of Rio Grande streamflow and agricultural diversions, while deeper groundwater geochemistry results from multiple processes, including the mixing of geothermal and non-geothermal groundwater, dissolution and precipitation reactions, and ion exchange [13]. As such, water chemistry in the Rio Grande alluvium generally reflects the chemistry of the surface-water system, with DS concentrations ranging from about 500 to over 1000 mg/L, whereas water chemistry in the Santa Fe Group depends on the source and time of recharge and the water-rock interactions along the flow path. Generally, groundwater in the middle Santa Fe unit has some of the lowest DS concentrations in the Basin, perhaps indicating large groundwater recharge and fluxes in pre-Holocene time, reducing the amount of soluble minerals in the solid matrix. DS concentrations are reported to increase in the lower Santa Fe unit and, in particular, at the basement rock contact. Brackish and saline groundwater in the Mesilla portion of the Basin are reported, where upflow areas associated with faults and bedrock features are most common. The extent of brackish groundwater in the Conejos-Médanos portion of the Basin is not known, but records of lacustrine evaporites and increasing salinity with depth indicate a substantial brackish reservoir.
Continued refinements to the storage estimates and water-budget items with well installation, geophysics, and monitoring would allow for better estimates of sustainable use limits. Further characterization of the deep groundwater extent and geochemistry would inform development of alternative water sources, such as desalination.

Author Contributions

Conceptualization, A.J.R. and A.-M.M.; methodology, A.J.R., J.D.P. and A.B.R.; software, A.J.R. and A.B.R.; validation, A.J.R., J.D.P., A.B.R., E.H.F. and A.E.G.; formal analysis, A.J.R., J.D.P. and A.B.R.; investigation, A.J.R., A.-M.M., J.D.P., A.B.R. and D.S.S.; resources, A.J.R.; data curation. A.J.R., J.D.P. and A.E.G.; writing—original draft preparation, A.J.R.; writing—review and editing, A.J.R., A.-M.M., J.D.P., A.B.R., D.S.S., A.P.T., A.G.-O., A.C.G.-V., K.C.C., E.H.F. and A.E.G.; visualization, A.J.R. and J.D.P.; supervision, A.J.R.; project administration, A.J.R. and A.-M.M.; funding acquisition, A.J.R. and A.-M.M. All authors have read and agreed to the published version of the manuscript.

Funding

This work was partially funded by the U.S. Geological Survey (funding authorized by P.L. 109–448) for the Transboundary Aquifer Assessment Program.

Data Availability Statement

Groundwater elevations used in the construction of the groundwater contour map are available in the following data release: Pepin, J.D., and Robertson, A.J., 2021, Estimated groundwater elevations and standard errors from the application of kriging to median groundwater elevation data from 2010 in the Mesilla/Conejos-Médanos Basin, United States and Mexico: U.S. Geological Survey data release, https://doi.org/10.5066/P98Z25JG accessed on 16 December 2021.

Acknowledgments

This product has been peer-reviewed and approved for publication consistent with U.S. Geological Survey Fundamental Science Practices (https://pubs.usgs.gov/circ/1367/, accessed on 16 December 2021). Any use of trade, firm, or product names is for descriptive purposes only and does not imply endorsement by the U.S. Government. Writings prepared by U.S. Government employees as part of their official duties, including this paper, cannot be copyrighted and are in the public domain.

Conflicts of Interest

The authors declare no conflict of interest. The funders had no role in the design of the study; in the collection, analyses, or interpretation of data; in the writing of the manuscript, or in the decision to publish the results.

References

  1. National Drought Mitigation Center United States Drought Monitor. New Mexico Tabular Data Archive. Available online: http://droughtmonitor.unl.edu/Data/DataTables.aspx (accessed on 7 June 2019).
  2. U.S. Department of Agriculture. 2012 Census of Agriculture, United States Summary and State Data; U.S. Department of Agriculture: North Bend, WA, USA, 2014; Volume 1, 586p. [Google Scholar]
  3. New Mexico Universities Working Group on Water Supply Vulnerabilities. Final report to the Interim Committee on Water and Natural Resources, 2015. In New Mexico Bureau of Geology and Mineral Resources Open File Report; New Mexico Geological Society: Socorro, NM, USA, 2015; Volume 577, p. 22. [Google Scholar]
  4. U.S. Geological Survey, The National Map. Available online: https://www.usgs.gov/core-science-systems/national-geospatial-program/national-map (accessed on 30 June 2021).
  5. Teeple, A.P. Geophysics- and geochemistry-based assessment of the geochemical characteristics and groundwater-flow system of the U.S. part of the Mesilla Basin/Conejos-Médanos aquifer system in Doña Ana County, New Mexico, and El Paso County, Texas, 2010–2012. In U.S. Geological Survey Scientific Investigations Report 2017–5028; U.S. Department of the Interior: Washington, DC, USA; U.S. Geological Survey: Reston, VA, USA, 2017; 183p. [Google Scholar] [CrossRef]
  6. Driscoll, J.M.; Sherson, L.R. Variability of surface-water quantity and quality and shallow groundwater levels and quality within the Rio Grande Project area, New Mexico and Texas, 2009–2013. In U.S. Geological Survey Scientific Investigations Report 2016–5006; U.S. Geological Survey: Reston, VA, USA, 2016. [Google Scholar]
  7. Sweetkind, D.S. Three-dimensional hydrogeologic framework model of the Rio Grande transboundary region of New Mexico and Texas, USA, and northern Chihuahua, Mexico. In U.S. Geological Survey Scientific Investigations Report 2017-5060; U.S. Geological Survey: Reston, VA, USA, 2017. [Google Scholar] [CrossRef] [Green Version]
  8. Hawley, J.W.; Kennedy, J.F. Creation of a digital hydrogeologic framework model of the Mesilla Basin and Southern Jornada del Muerto Basin. In WRRI Technical Completion Report; New Mexico Water Resources Research Institute, New Mexico State University: Las Cruces, NM, USA, 2004. [Google Scholar]
  9. Jimenez, A.J.; Keller, G.R. Rift Basin structure in the border region of Northern Chihuahua. In New Mexico Geological Society, 51st Annual Field Conference Guidebook; New Mexico Geological Society: Socorro, NM, USA, 2000; pp. 79–83. [Google Scholar]
  10. Servicio Geológico Mexicano. Hydrogeological Activities in the Conejos-Médanos Aquifer, State of Chihuahua, Phase I; International Boundary and Water Commission: El Paso, TX, USA, 2011; Volume 1, 109p, Available online: https://nmwrri.nmsu.edu/wp-content/uploads/2015/publish/TAAP/Final_report_English_Mesilla_ConejosMedanos_Study.pdf (accessed on 16 December 2021).
  11. Wilson, C.A.; White, R.R.; Orr, B.R.; Roybal, R.G. Water resources of the Rincon and Mesilla Valleys and adjacent areas, New Mexico. In New Mexico State Engineer Technical Report 43; New Mexico State Engineer: Santa Fe, NM, USA, 1981; 514p. [Google Scholar]
  12. Balleau, W.P. Groundwater modeling in the lower Rio Grande. In Proceedings of the 43rd Annual New Mexico Water Conference: Water Challenges on the Lower Rio Grande, Las Cruces, NM, USA, 22–23 October 1998; Ortega Klett, C.T., Ed.; New Mexico Water Resources Research Institute: Las Cruces, NM, USA, 1999. Report No. 310. pp. 38–46. [Google Scholar]
  13. Witcher, J.C.; King, J.P.; Hawley, J.W.; Kennedy, J.F.; Williams, J.; Cleary, M.; Bothern, L.R. Sources of salinity in the Rio Grande and Mesilla Basin groundwater. In New Mexico Water Resources Research Institute Technical Completion Report; New Mexico State University: Las Cruces, NM, USA, 2004; no. 330. [Google Scholar]
  14. Frenzel, P.F.; Kaehler, C.A. Geohydrology and simulation of ground-water flow in the Mesilla Basin, Doña Ana County, New Mexico, and El Paso County, Texas. In US Geological Survey Professional Paper 1407-C; US Government Printing Office: Washington, DC, USA, 1992. [Google Scholar] [CrossRef]
  15. S.S. Papadopulos and Associates, Inc. (SSPA). Draft—Groundwater flow model for administration and management in the Lower Rio Grande Basin. In Draft Reports for the New Mexico Office of the State Engineer; S.S. Papadopulos and Associates, Inc.: Rockville, MD, USA, 2007; 58p. [Google Scholar]
  16. Hanson, R.T.; Ritchie, A.B.; Boyce, S.E.; Galanter, A.E.; Ferguson, I.A.; Flint, L.E.; Henson, W.R. Rio Grande transboundary integrated hydrologic model and water-availability analysis, New Mexico and Texas, United States, and Northern Chihuahua, Mexico. In US Geological Survey Scientific Investigations Report 2019-5120; U.S. Geological Survey: Reston, VA, USA, 2020. [Google Scholar] [CrossRef] [Green Version]
  17. Ritchie, A.B.; Hanson, R.T.; Galanter, A.E.; Boyce, S.E.; Damar, N.A.; Shephard, Z.M.; Tillman, F.D. Digital hydrologic and geospatial data for the Rio Grande transboundary integrated hydrologic model and water-availability analysis, New Mexico and Texas, United States, and Northern Chihuahua, Mexico. In U.S. Geological Survey Data Release; U.S. Geological Survey: Reston, VA, USA, 2018. [Google Scholar] [CrossRef]
  18. U.S. Geological Survey. USGS water data for the Nation. In U.S. Geological Survey National Water Information System Database; U.S. Geological Survey: Reston, VA, USA, 2020. [Google Scholar] [CrossRef]
  19. Kohlrenken, W. GAM Task 15-006: Total estimated recoverable storage for aquifers in Groundwater Management Area 1. Texas Water Development Board. 2015. Available online: https://www.twdb.texas.gov/groundwater/docs/GAMruns/Task15-006.pdf (accessed on 2 June 2021).
  20. Thompson, J.C.; Kreitler, C.W.; Young, M.H. Exploring groundwater recoverability in Texas, maximum economically recoverable storage. Texas Water J. 2020, 11, 152–171. [Google Scholar] [CrossRef]
  21. ArcGIS Pro Zonal Statistics (Spatial Analyst). Available online: https://pro.arcgis.com/en/pro-app/latest/tool-reference/spatial-analyst/zonal-statistics.htm (accessed on 16 March 2021).
  22. Carrera-Hernández, J.J. Vertical datum transformation grids for Mexico. Sci. Data 2020, 7, 10. [Google Scholar] [CrossRef]
  23. Pepin, J.D.; Robertson, A.J. Estimated groundwater elevations and standard errors from the application of kriging to median groundwater elevation data from 2010 in the Mesilla/Conejos-Médanos Basin, United States and Mexico. In U.S. Geological Survey Data Release; U.S. Geological Survey: Reston, VA, USA, 2021. [Google Scholar] [CrossRef]
  24. Fisher, J.C. Optimization of water-level monitoring networks in the eastern Snake River Plain aquifer using a kriging-based genetic algorithm method. In U.S. Geological Survey Scientific Investigations Report 2013-5120; U.S. Geological Survey: Reston, VA, USA, 2013; 74p. [Google Scholar] [CrossRef]
  25. R Core Team. R: A Language and Environment for Statistical Computing. In R Foundation for Statistical Computing; R Core Team: Vienna, Austria, 2019; Available online: https://www.R-project.org/ (accessed on 1 June 2021).
  26. Western Regional Climate Center. Annual Totals from State University, NM (290131). Available online: https://wrcc.dri.edu/cgi-bin/cliMAIN.pl?nm0131 (accessed on 12 February 2021).
  27. CONAGUA. Actualization de la Disponibilidad Media Anual de Agua en el Acuifero Conejos-Medanos (0823) Estado de Chihuahua. In Subdireccion General Tecnica Gerencia de Aguas Subterraneas; Comisión Nacional del Agua: Mexico City, Mexico, 2020; 36p, Available online: https://sigagis.conagua.gob.mx/gas1/Edos_Acuiferos_18/chihuahua/DR_0823.pdf (accessed on 1 July 2021).
  28. Chapin, C.E.; Seager, W.R. Evolution of the Rio Grande rift in the Socorro and Las Cruces areas. In New Mexico Geological Society, 26th Annual Field Conference Guidebook; Seager, W.R., Clemons, R.E., Callender, J.F., Eds.; NM Bureau of Geology & Mineral Resources: Socorro, NM, USA, 1975; pp. 297–321. [Google Scholar]
  29. Hawley, J.W. Guidebook to the Rio Grande Rift in New Mexico and Colorado. In New Mexico Bureau of Mines and Mineral Resources Circular 163, 1st ed.; New Mexico Bureau of Geology & Mineral Resources: Socorro, NM, USA, 1978; 241p. [Google Scholar]
  30. Chapin, C.E.; Cather, S.M. Tectonic setting of the axial basins of the northern and central Rio Grande Basin, New Mexico. In Basins of the Rio Grande Rift—Structure, Stratigraphy, and Tectonic Setting; Keller, G.R., Cather, S.M., Eds.; Geological Society of America: McLean, VA, USA, 1994; pp. 5–25. [Google Scholar]
  31. Instituto Nacional de Estadística. Geografía e Informática. Ciudad Juarez, 1:250000, H 13-1. 1983. Available online: https://www.inegi.org.mx/contenidos/productos/prod_serv/contenidos/espanol/bvinegi/productos/geografia/tematicas/Geologia_hist/1_250_000/702825675530.pdf (accessed on 16 December 2021).
  32. Sellepack, B.P. The Stratigraphy of the Pliocene–Pleistocene Santa Fe Group in the Southern Mesilla Basin. Master’s Thesis, University of Texas at El Paso, El Paso, TX, USA, 2003; 268p. [Google Scholar]
  33. Khatun, S.; Doser, D.I.; Imana, E.C.; Keller, G.R. Locating faults in the southern Mesilla bolson, West Texas and southern New Mexico, using 3-D modeling of precision gravity data. J. Environ. Eng. Geophys. 2007, 12, 149–161. [Google Scholar] [CrossRef]
  34. Kelley, R. New Mexico Geothermal Play Fairway Analysis from LANL. In Geothermal Data Repository; Los Alamos National Laboratory: Los Alamos, NM, USA, 2015; Available online: https://gdr.openei.org/submissions/597 (accessed on 29 April 2021).
  35. Mack, G.H.; Seager, W.R.; Leeder, M.R.; Perez-Arlucea, M.; Salyards, S.L. Pliocene and Quaternary history of the Rio Grande, the axial river of the southern Rio Grande rift, New Mexico, USA. Earth-Sci. Rev. 2006, 79, 141–162. [Google Scholar] [CrossRef]
  36. Seager, W.R.; Morgan, P. Rio Grande rift in southern New Mexico, west Texas, and northern Chihuahua. In Rio Grande Rift: Tectonics and Magnetism; Riecker, R.E., Ed.; American Geophysical Union: Washington, DC, USA, 1979; pp. 87–106. [Google Scholar]
  37. Hawley, J.W.; Kennedy, J.F.; Creel, B.J. The Mesilla Basin Aquifer System of New Mexico, West Texas, and Chihuahua—An overview of its hydrogeologic framework and related aspects of groundwater flow and chemistry. In Aquifers of West Texas; Mace, R.E., Mullican, W.F., III, Angle, E.S., Eds.; Texas Water Development Board: Austin, TX, USA, 2001; pp. 76–94. [Google Scholar]
  38. Nickerson, E.L.; Myers, R.G. Geohydrology of the Mesilla ground-water Basin, Doña Ana County, New Mexico, and El Paso County, Texas. In U.S. Geological Survey Water-Resources Investigations Report 92-4156; U.S. Geological Survey: Reston, VA, USA, 1993; p. 23. [Google Scholar]
  39. Conover, C.S. Ground-water conditions in the Rincon and Mesilla Valleys and adjacent areas in New Mexico. In U.S. Geological Survey Water-Supply Paper 1230; U.S. Geological Survey: Reston, VA, USA, 1954; 200p. [Google Scholar]
  40. Gates, J.S.; White, D.E.; Leggat, E.R. Preliminary study of the aquifers of the Lower Mesilla Valley in Texas and New Mexico by model simulation. In U.S. Geological Survey Water-Resources Investigations Report 84-4317; U.S. Geological Survey: Reston, VA, USA, 1984. [Google Scholar] [CrossRef]
  41. Leggat, E.R.; Lowry, M.E.; Hood, J.W. Ground-water resources of the lower Mesilla Valley Texas and New Mexico. In U.S. Geological Survey Water-Supply Paper 1669-AA; U.S. Geological Survey: Reston, VA, USA, 1963. [Google Scholar] [CrossRef]
  42. Kubicki, C.; Carroll, K.C.; Witcher, J.C.; Robertson, A.J. An integrated geochemical approach for defining sources of groundwater salinity in the southern Rio Grande Valley of the Mesilla Basin, New Mexico. In New Mexico Water Resources Research Institute Technical Completion Report; New Mexico State University: Las Cruces, NM, USA, 2021; 40p. [Google Scholar]
  43. Arunshankar, B.N. Use of Earth Resistivity Method for Monitoring Saline Groundwater Movement in Aquifers. Master’s Thesis, University of Texas at El Paso, El Paso, TX, USA, 1993; 79p. [Google Scholar]
  44. Myers, R.G.; Orr, B.R. Geohydrology of the aquifer in the Santa Fe Group, northern West Mesa of the Mesilla Basin near Las Cruces, New Mexico. In U.S. Geological Survey, Water-Resources Investigations Report 84-4190; U.S. Geological Survey: Reston, VA, USA, 1986; 37p. [Google Scholar]
  45. Llewellyn, D.; Vaddey, S. West-Wide Climate Risk Assessment: Upper Rio Grande Impact Assessment; U.S. Bureau Reclamation, Upper Colorado Region: Albuquerque, NM, USA, 2013; 138p. [Google Scholar]
  46. Rango, A. Snow: The Real Water Supply for the Rio Grande Basin: New Mexico. J. Sci. 2006, 44, 99–118. Available online: https://jornada.nmsu.edu/files/bibliography/06-035.pdf (accessed on 16 December 2021).
  47. New Mexico State Office of the Engineer, Lower Rio Grande Water Master Reports. Available online: https://www.ose.state.nm.us/WM/WMdistrict4.php (accessed on 3 February 2021).
  48. Bureau of Reclamation, Supplemental Environmental Assessment—Implementation of Rio Grande Project Operating Procedures, New Mexico and Texas: Bureau of Reclamation. 2013. Available online: https://www.usbr.gov/uc/albuq/envdocs/ea/riogrande/op-Proced/Supplemental/Final-SuppEA.pdf (accessed on 10 April 2021).
  49. Crilley, D.M.; Matherne, A.M.; Thomas, N.; Falk, S.E. Seepage investigations of the Rio Grande from below Leasburg Dam, Leasburg, New Mexico, to above American Dam, El Paso, Texas, 2006–2013. In Geological Survey Open-File Report 2013-1233; U.S. Geological Survey: Reston, VA, USA, 2013. Available online: http://pubs.usgs.gov/of/2013/1233/ (accessed on 16 December 2021).
  50. Briody, A.C.; Robertson, A.J.; Thomas, N. Seepage Investigation of the Rio Grande From below Leasburg Dam, Leasburg, New Mexico, to above American Dam, El Paso, Texas, 2015. In U.S. Geological Survey Scientific Investigations Report 2016-5011; U.S. Geological Survey: Reston, VA, USA, 2016. [Google Scholar] [CrossRef] [Green Version]
  51. Briody, A.C.; Robertson, A.J.; Thomas, N. Seepage Investigation of the Rio Grande From Below Leasburg Dam, Leasburg, New Mexico, to Above American Dam, El Paso, Texas, 2014. In U.S. Geological Survey Scientific Investigations Report 2016-5010; U.S. Geological Survey: Reston, VA, USA, 2016. [Google Scholar] [CrossRef] [Green Version]
  52. Ball, G.P.; Robertson, A.J.; Medina Morales, K. Seepage investigation of the Rio Grande from below Leasburg Dam, Leasburg, New Mexico, to above El Paso, Texas, 2018. In U.S. Geological Survey Scientific Investigations Report 2019–5140; U.S. Geological Survey: Reston, VA, USA, 2020. [Google Scholar] [CrossRef] [Green Version]
  53. Ikard, S.; Teeple, A.; Humberson, D. Gradient self-potential logging in the Rio Grande to identify gaining and losing reaches across the Mesilla Valley. Water 2021, 13, 1331. [Google Scholar] [CrossRef]
  54. Fuchs, E.H.; King, J.P.; Carroll, K.C. Quantifying disconnection of groundwater from managed-ephemeral surface water during drought and conjunctive agricultural use. Water Resour. Res. 2019, 55, 5871–5890. [Google Scholar] [CrossRef] [Green Version]
  55. King, P. Balancing Agricultural Use of Surface Water and Groundwater Along the Rio Grande. In Proceedings of the Abstract for the 60th Annual New Mexico Water Conference, Taos, NM, USA, 23 September 2015; Available online: https://nmwrri.nmsu.edu/wp-content/uploads/Conference60/SpeakerAbstracts/King.pdf (accessed on 5 February 2021).
  56. New Mexico Water Rights Reporting System: New Mexico Office of the State Engineer. Available online: http://nmwrrs.ose.state.nm.us/nmwrrs/index.html (accessed on 1 June 2021).
  57. Richardson, G.L.; Gebhard, T.G., Jr.; Brutsaert, W.F. Water table investigation in the Mesilla Valley. In New Mexico State University Engineering Experiment Station Technical Report; Engineering Experiment Station, New Mexico State University: Las Cruces, NM, USA, 1972; Volume 76. [Google Scholar]
  58. U.S. Geological Survey, Chloride, Salinity, and Dissolved Solids. Available online: https://www.usgs.gov/mission-areas/water-resources/science/chloride-salinity-and-dissolved-solids?qt-science_center_objects=0#qt-science_center_objects (accessed on 5 May 2021).
  59. Szynkiewicz, A.; Witcher, J.C.; Modelska, M.; Borrok, D.M.; Pratt, L.M. Anthropogenic sulfate loads in the Rio Grande, New Mexico (USA). Chem. Geol. 2011, 283, 194–209. [Google Scholar] [CrossRef]
  60. Bexfield, L.M.; Anderholm, S.K. Water-quality assessment of the Rio Grande Valley, Colorado, New Mexico, and Texas—ground-water quality in the Rio Grande flood plain, Cochiti Lake, New Mexico, to El Paso, Texas, 1995. In U.S. Geological Survey Water-Resources Investigations Report; U.S. Geological Survey: Reston, VA, USA, 1997; Volume 93, pp. 96–4249. [Google Scholar]
  61. Mills, S.K. Quantifying Salinization of the Rio Grande Using Environmental Tracers. Master’s Thesis, New Mexico Institute of Mining and Technology, Socorro, NM, USA, 2003. [Google Scholar]
  62. Hibbs, B.; Merino, M. Discovering a geologic salinity source in the Rio Grande aquifer. Southwest Hydrol. 2007, 6, 20–23. [Google Scholar]
  63. Hogan, J.F.; Phillips, F.M.; Mills, S.K.; Hendrickx, J.M.H.; Ruiz, J.; Chelsey, J.T.; Asmerom, Y. Geologic origins of salinization in a semiarid river—The role of sedimentary basin brines. Geology 2007, 35, 1063–1066. [Google Scholar] [CrossRef]
  64. Moore, S.J.; Bassett, R.L.; Liu, B.; Wolf, C.P.; Doremus, D. Geochemical tracers to evaluate hydrogeologic controls on river salinization. Ground Water 2008, 46, 489–501. [Google Scholar] [CrossRef]
  65. Szynkiewicz, A.; Borrok, D.M.; Skrzypek, G.; Rearick, M.S. Isotopic studies of the Upper and Middle Rio Grande. Part 1—Importance of sulfide weathering in the riverine sulfate budget. Chem. Geol. 2015, 411, 323–335. [Google Scholar] [CrossRef] [Green Version]
  66. Szynkiewicz, A.; Borrok, D.M.; Ganjegunte, G.K.; Skrzypek, G.; Ma, L.; Rearick, M.S.; Perkins, G.B. Isotopic studies of the Upper and Middle Rio Grande. Part 2—Salt loads and human impacts in south New Mexico and west Texas. Chem. Geol. 2015, 411, 336–350. [Google Scholar] [CrossRef] [Green Version]
  67. Hiebing, M.; Doser, D.I.; Avila, V.M.; Ma, L. Geophysical studies of fault and bedrock control on groundwater geochemistry within the southern Mesilla Basin, western Texas and southern New Mexico. Geosphere 2018, 14, 1912–1934. [Google Scholar] [CrossRef]
  68. Sheng, Z.; Darr, M.; King, J.P.; Bumgarner, J.; Michelsen, A. Mesilla Basin/Conejos-Médanos section of the Transboundary Aquifer Assessment Program, in Five-year interim report of the United States-Mexico transboundary aquifer assessment program—2007–2012. In U.S. Geological Survey Open-File Report 2013–1059; Alley, W.M., Ed.; U.S. Geological Survey: Reston, VA, USA, 2013. [Google Scholar] [CrossRef]
  69. Toth, J. A theoretical analysis of groundwater flow in small drainage basins. J. Geophys. Res. 1963, 68, 4795–4812. [Google Scholar] [CrossRef]
  70. Phillips, F.M.; Hogan, J.F.; Mills, S.K.; Hendrickx, J.M.H. Environmental tracers applied to quantifying causes of salinity in arid-region rivers: Results from the Rio Grande Basin, Southwestern USA. Dev. Water Sci. 2003, 50, 327–334. [Google Scholar]
  71. Anderholm, S.K. Water quality and geochemistry of the Mesilla Basin. In Geohydrology and Simulation of Ground-Water Flow in the Mesilla Basin, Doña Ana County, New Mexico, and El Paso County, Texas; Frenzel, P.F., Kaehler, C.A., Eds.; U.S. Geological Survey: Denver, CO, USA, 1992; Volume 1407–C, pp. 64–75. [Google Scholar]
  72. CH2MHill, Distal Mesilla conceptual model. In Technical Report to the U.S. Army Corps of Engineers; U.S. Army Engineer: Washington, DC, USA, 2013; 224p.
  73. Cuthbert, M.O.; Acworth, R.I.; Andersen, M.S.; Larsen, J.R.; McCallum, A.M.; Rau, G.C.; Tellam, J.H. Understanding and quantifying focused, indirect groundwater recharge from ephemeral streams using water table fluctuations. Water Resour. Res. 2016, 52, 827–840. [Google Scholar] [CrossRef]
  74. Flint, L.E.; Flint, A.L. California Basin Characterization Model: A dataset of historical and future hydrologic response to climate change. In U.S. Geological Survey Data Release; U.S. Geological Survey: Reston, VA, USA, 2014; Volume 1. [Google Scholar] [CrossRef]
  75. Gross, J. A Hydrogeological Investigation of the Las Cruces Geothermal Field. Master’s Thesis, New Mexico State University, Las Cruces, NM, USA, 1988. [Google Scholar]
  76. Langman, J.B.; Robertson, A.J.; Bynum, J.; Gebhardt, F.E. Geochemical trends and natural attenuation of RDX, nitrate, and perchlorate in the Hazardous Test Area fractured-granite aquifer, White Sands Missile Range, New Mexico, 1996–2006. In U.S. Geological Survey Scientific Investigations Report; U.S. Geological Survey: Reston, VA, USA, 2008; Volume 5157. [Google Scholar]
  77. Langman, J.B.; Ellis, A.S. Geochemical indicators of interbasin groundwater flow within the southern Rio Grande Valley, southwestern USA. Environ. Earth Sci. 2013, 68, 1285–1303. [Google Scholar] [CrossRef]
  78. Harmon, C. Isotopic variations in meteoric waters. Science 1961, 133, 1702–1703. [Google Scholar]
  79. Hibbs, B. Hydrogeologic and water quality issues along the El Paso/ Juárez corridor. Environ. Eng. Geosci. 1999, 1, 27–39. [Google Scholar] [CrossRef]
  80. Eastoe, C.J.; Hibbs, B.J.; Olivas, A.G.; Hogan, J.F.; Hawley, J.; Hutchinson, W.R. Isotopes in the Hueco Bolson aquifer, Texas (USA) and Chihuahua (Mexico)—Local and general implications for recharge sources in alluvial basins. Hydrogeol. J. 2008, 16, 737–747. [Google Scholar] [CrossRef]
  81. Orr, B.R.; Risser, D.W. Geohydrology and potential effects of development of freshwater resources in the northern part of the Hueco Bolson, Doña and Otero Counties, New Mexico, and El Paso County, Texas. In U.S. Geological Survey Water-Resources Investigations Report 91-4082; U.S. Geological Survey: Reston, VA, USA, 1992. [Google Scholar] [CrossRef]
  82. Garcia-Vasquez, A.C. Caracterización Hidrogeoquímica e Isotópica del acuífero de Conejos-Médanos, Ciudad Juárez, Chihuahua. Master’s Thesis, Universidad Autónoma de Ciudad Juárez, Juárez, Chihuahua, Mexico, 2017. [Google Scholar]
  83. Pepin, J.D.; Robertson, A.J.; Kelley, S.A. Salinity contributions from geothermal waters to the Rio Grande and shallow aquifer system in the transboundary Mesilla Basin (United States)/Conejos-Médanos (Mexico). Water 2021, 14, 33. [Google Scholar] [CrossRef]
  84. Witcher, J.C. A Geothermal Resource Data Base—New Mexico; Southwest Technology Development Institute, New Mexico State University: Las Cruces, NM, USA, 1995. [Google Scholar] [CrossRef]
  85. Snyder, J.T. Heat Flow in the Southern Mesilla Basin with an Analysis of the East Potrillo Geothermal System, Doña Ana County, New Mexico. Master’s Thesis, New Mexico State University, Las Cruces, NM, USA, May 1986. [Google Scholar]
  86. Serrano, R.J. Lower Rio Grande Water Master Annual Report 2016 Accounting Year. State of New Mexico Office of the State Engineer. 2016. Available online: https://www.ose.state.nm.us/WM/LRG/Reports/2016%20LRG%20WM%20REPORT.pdf (accessed on 17 March 2021).
  87. Serrano, R.J. Lower Rio Grande Water Master Annual Report 2017 Accounting Year. State of New Mexico Office of the State Engineer. 2017. Available online: https://www.ose.state.nm.us/WM/LRG/Reports/2017%20WM%20REPORT%20-%20FINAL%20DRAFT.pdf (accessed on 17 March 2021).
  88. Serrano, R.J. Lower Rio Grande Water Master Annual Report 2019 Accounting Year. State of New Mexico Office of the State Engineer. 2019. Available online: https://www.ose.state.nm.us/WM/LRG/Reports/2019%20WM%20REPORT%20-%20FINAL.pdf (accessed on 17 March 2021).
  89. World Population Review. Available online: https://worldpopulationreview.com/world-cities (accessed on 11 June 2021).
  90. Petronis, L.H.; Finch, S.T., Jr.; Shomaker, J.W. Ground-Water Flow and Solute Transport Model for the Griggs and Walnut Superfund Site; Albuquerque, N. Mex., John Shomaker and Associates, Inc.: Las Cruces, NM, USA, 2006; 53p, Available online: https://donaanacounty.org/sites/default/files/pages/FSRappendixA.pdf (accessed on 16 December 2021).
  91. Hutchison, W.R. Conceptual Evaluation of Surface Water Storage in El Paso County—Final Report. El Paso Water Utilities Hydrogeology Report 08–02. 2008. Available online: https://www.twdb.texas.gov/publications/reports/contracted_reports/doc/0704830690_RegionE/SurfaceWaterStorage-EPCounty-revisedfinal.pdf (accessed on 16 December 2021).
  92. White, D.E. Summary of hydrologic information in the El Paso, Texas area, with emphasis on ground-water studies, 1903–1980. In U.S. Geological Survey Open-File Report 83–775; U.S. Geological Survey: Reston, VA, USA, 1983. [Google Scholar] [CrossRef]
  93. Faure, G. Principles of Isotope Geology, 2nd ed.; Wiley: New York, NY, USA, 1986. [Google Scholar]
  94. Plummer, L.N.; Bexfield, L.M.; Anderholm, S.K.; Sanford, W.E.; Busenberg, E. Geochemical characterization of ground-water flow in the Santa Fe Group aquifer system, Middle Rio Grande Basin, New Mexico. In U.S. Geological Survey Water-Resources Investigation Report 03–4131; U.S. Geological Survey: Reston, VA, USA, 2004; 414p. [Google Scholar] [CrossRef]
  95. Land, L. Overview of Fresh and Brackish Water Quality in New Mexico. In New Mexico Bureau of Geology and Mineral Resources Open-File Report; New Mexico Bureau of Geology & Mineral Resources: Socorro, NM, USA, 2016; p. 583. [Google Scholar]
  96. Moyer, D.L.; Anderholm, S.K.; Hogan, J.F.; Phillips, F.M.; Hibbs, B.J.; Witcher, J.C.; Matherne, A.M.; Falk, S.E. Knowledge and understanding of dissolved solids in the Rio Grande–San Acacia, New Mexico, to Fort Quitman, Texas, and plan for future studies and monitoring. In U.S. Geological Survey Open-File Report 2013–1190; U.S. Geological Survey: Reston, VA, USA, 2013. Available online: http://pubs.usgs.gov/of/2013/1190/ (accessed on 16 December 2021).
  97. Nickerson, E.L. Selected geohydrologic data for the Mesilla ground-water basin, 1987 through 1992 water years, Doña Ana County, New Mexico and El Paso County, Texas. In U.S. Geological Survey Open-File Report; U.S. Geological Survey: Reston, VA, USA, 1995; Volume 111. [Google Scholar]
  98. Reiter, M.; Eggleston, R.E.; Broadwell, B.R.; Minier, J. Estimates of terrestrial heat flow from deep petroleum tests along the Rio Grande rift in Central and Southern New Mexico. J. Geophys. Res. 1986, 91, 6225–6245. [Google Scholar] [CrossRef]
  99. Witcher, J.C.; Lund, J.W. Masson Radium Springs Farm. GHC Bull. 2002, 23, 42–44. Available online: https://www.osti.gov/servlets/purl/1209492 (accessed on 1 May 2021).
  100. Engle, M.A.; Rowan, E.L. Interpretation of Na–Cl–Br systematics in sedimentary basin brines: Comparison of concentration, element ratio, and isometric log-ratio approaches. Math. Geosci. 2012, 45, 87–101. [Google Scholar] [CrossRef]
  101. Swanberg, C.A. Detection of geothermal components in groundwaters of Doña Ana County, southern Rio Grande rift, New Mexico. In 26th Annual Field Conference Guidebook; Seager, W.R., Clemons, R.E., Callender, J.F., Eds.; New Mexico Geological Society: Socorro, NM, USA, 1975; pp. 175–180. [Google Scholar]
  102. Decker, E.R.; Cook, F.A.; Ramberg, I.B.; Smithson, S.B. Significance of geothermal and gravity studies in the Las Cruces area. In 26th Annual Field Conference Guidebook; Seager, W.R., Clemons, R.E., Callender, J.F., Eds.; New Mexico Geological Society: Socorro, NM, USA, 1975; pp. 251–259. [Google Scholar]
  103. Slichter, C.S. Observations on groundwater of the Rio Grande valley. In U.S. Geological Survey Water-Supply Paper; U.S. Geological Survey: Reston, VA, USA, 1905; Volume 141. [Google Scholar] [CrossRef]
  104. Scruggs, C.E.; Thomson, B.M. Opportunities and Challenges for Direct Potable Water Reuse in Arid Inland Communities. J. Water Resour. Plan. Manag. 2017, 143, 4017064. [Google Scholar] [CrossRef]
  105. Hawley, J.W. Challenges and opportunities for brackish groundwater resource development in New Mexico–prediction hydro-science from an octogenarian hydrogeologist’s perspective. In Proceedings of the Urban Land Institute-New Mexico Section, Albuquerque, NM, USA, 28 April 2016; Available online: https://aquadoc.typepad.com/files/uli-nm_whitepaper.pdf (accessed on 28 April 2016).
  106. Plummer, L.N.; Bexfield, L.M.; Anderholm, S.K.; Sanford, W.E.; Busenberg, E. Geologic and hydrologic framework: C. Geochemical characterization of groundwater flow in parts of the Santa Fe Group aquifer system, Middle Rio Grande Basin, New Mexico. In U.S. Geological Survey Middle Rio Grande Basin Study—Proceedings of the Fourth Annual Workshop, Albuquerque, NM, USA, 15–16 February 2000; U.S. Geological Survey Open File Report; Cole, J.C., Ed.; U.S. Geological Survey: Denver, CO, USA, 2000; Volume 00-488, pp. 7–12. [Google Scholar] [CrossRef] [Green Version]
  107. Scanlon, B.R.; Darling, B.K.; Mullican, W.F., III. Evaluation of groundwater recharge in basins of Trans-Pecos Texas. In Aquifers of West Texas; Mace, R.E., Mullican, W.F., III, Angle, E.S., Eds.; Texas Water Development Board: Austin, TX, USA, 2001; Volume 356, pp. 26–40. [Google Scholar]
Figure 1. Location of the Mesilla/Conejos-Médanos Basin in Texas and New Mexico (U.S.), as well as Chihuahua (Mexico). Base terrain and geographic references from U.S. Geological Survey (2021) [4], Teeple (2017) [5] and Driscoll and Sherson (2016) [6]. The geographic coordinate system is the North American Datum of 1983.
Water 14 00134 g001
Figure 2. Major faults and structural features of the Mesilla/Conejos-Médanos Basin. Also included are the locations of nested wells, where vertical gradients have been determined, and select deep and shallow wells with long-term groundwater-level records. Base terrain and geographic references are from [5,6,34]. Coordinates are the geographic coordinate system relative to the North American Datum of 1983.
Water 14 00134 g002
Figure 3. Cross sections showing the hydrostratigraphic units of the Mesilla/Conejos-Médanos Basin (adapted from [16]). Location of cross sections shown in Figure 2.
Water 14 00134 g003
Figure 4. Annual Rio Grande streamflow below Caballo Reservoir from 1940 to 2018 [18,48], average annual streamflow for the period of record, decadal average streamflow, annual precipitation from 1940 to 2019 at the New Mexico State University COOP station [26], and average precipitation for that period of record.
Water 14 00134 g004
Figure 5. Estimated groundwater elevations (A) and standard error values (B) from application of kriging in the Mesilla/Conejos Médanos Basin [23]. Base terrain and geographic references are from [5,6,34]. Coordinates are the geographic coordinate system relative to the North American Datum of 1983.
Water 14 00134 g005
Figure 6. Groundwater levels, 1945–2020. (a) Depth to water measured in piezometers screened in the Rio Grande alluvium; (b) groundwater elevation measured in wells screened in the Santa Fe Group sediments at depths greater than 90 m below land surface. Well locations are shown in Figure 2. Data from USGS (2021) [18].
Water 14 00134 g006
Table 1. Values used in groundwater throughflow estimates between the Conejos-Médanos portion of the Mesilla/Conejos Médanos Basin (Basin), moving north to the Mesilla portion of the Basin. Area estimates are determined from cross-section K-K’ by Hawley and Kennedy (2004) [8], hydraulic conductivities are reported values from Frenzel and Kaehler (1992) [14], and hydraulic gradients are estimated from Figure 5. [m2, square meters; m/day, meters per day; m/m, meters per meter; m3/day, cubic meters per day; hm3/yr, cubic hectometers per year; USF, upper Santa Fe unit; MSF, middle Santa Fe unit; LSF, lower Santa Fe unit].
FormationArea EstimatesHydraulic Conductivities (m/Day)Hydraulic Gradients (m/m)
(m2)MinimumMaximumMedianMinimumMaximumMedian
USF3,252,0001334211.89 × 10−49.47 × 10−44.73 × 10−4
MSF7,860,0002.7136.71.89 × 10−49.47 × 10−44.73 × 10−4
LSF6,190,0000.614.31.51.89 × 10−49.47 × 10−44.73 × 10−4
FormationDischarge (m3/Day)Discharge (hm3/Year)
MinimumMaximumMedianMinimumMaximumMedian
USF8100103,00032,9002.9637.6012.01
MSF410098,00025,0001.5035.779.13
LSF70025,00045000.269.131.64
Sum12,900226,00062,4004.7182.4922.78
Table 2. Water-budget components (in cubic hectometers) and the sum of inflows and outflows for the Mesilla portion of the Basin for three time periods. Parentheses and red font used in the table for negative numbers.
Budget ItemsAverage Amounts for the Period of Record (1940 to 2014)Average Amounts for the Dry Period 1950 to 1969Average Amounts for the Wet Period 1980 to 1999
Surface WaterGround-WaterAgri-CultureSurface WaterGround-WaterAgri-CultureSurface WaterGround-WaterAgri-Culture
Rio Grande inflow Leasburg Dam759 586 944
Irrigation diversions(433) 433(384) 384(516) 516
Precipitation1.6 361.6 361.6 36
Return flow (canals)43 (43)38 (38)52 (52)
Drain return flow143 (143)127 (127)170 (170)
Deep percolation 68(68) 66(66) 74(74)
Wastewater returns12 3.7 12
Evapotranspiration(13) (308)(13) (308)(13) (308)
Agricultural pumping (94)94 (121)121 (53)53
Municipal and industrial pumping (67) (49) (86)
Groundwater outflow near El Paso (0.1) (0.1) (0.1)
Rio Grande seepage(31)31 (31)31 (31)31
Conejos-Médanos throughflow 23 23 23
Mountain-front recharge 14 14 14
Rio Grande outflow at El Paso(491) (319) (617)
Inflows9581365627561335411179141604
Outflows(968)(160)(563)(748)(170)(539)(1,176)(139)(604)
Balance(9.41)(24.9)(0.79)8.86(37.6)1.382.441.540.16
Basin surface water loss268 266 327
Total agricultural use 527 505 569
Publisher’s Note: MDPI stays neutral with regard to jurisdictional claims in published maps and institutional affiliations.

