
Research on Seepage Control of Jurong Pumped Storage Hydroelectric Power Station


1
School of Earth Sciences and Engineering, Hohai University, Nanjing 210098, China
2
Huadong Engineering (Fujian) Corporation Limited, Fuzhou 350003, China
*
Author to whom correspondence should be addressed.
Water 2022, 14(2), 141; https://doi.org/10.3390/w14020141
Submission received: 10 November 2021
/
Revised: 30 December 2021
/
Accepted: 4 January 2022
/
Published: 6 January 2022
(This article belongs to the Section Hydraulics and Hydrodynamics)
Abstract
:Based on the geological and hydrogeological conditions of the Jurong Pumped Storage Hydroelectric Power Station (JPSHP), a 3D groundwater flow model was developed in the power station area, which took into account the heterogeneity and anisotropy of fractured rocks. A control inversion method for fractured rock structural planes was proposed, where larger-scale fractures were used as water-conducting media and the relatively intact rock matrix was used as water-storage media. A statistical method was used to obtain the geometric parameter values of the structural planes, so as to obtain the hydraulic conductivity tensor of the fractured rocks. Combining the impermeable drainage systems of the upper storage reservoir, underground powerhouse and lower storage reservoir, the 3D groundwater seepage field in the study area was predicted using the calibrated model. The leakage amounts of the upper storage reservoir, powerhouse and lower storage reservoir were 710.48 m3/d, 969.95 m3/d and 1657.55 m3/d, respectively. The leakage changes of the upper storage reservoir, powerhouse and lower storage reservoir were discussed under the partial and full failure of the anti-seepage system. The research results provide a scientific basis for the seepage control of the power station, and it is recommended to strengthen the seepage control of the upper and lower storage reservoirs and the underground powerhouse to avoid excessive leakage and affect the efficiency of the reservoir operation.
1. Introduction
In recent years, with the increase in water conservancy and hydropower projects, seepage problems have attracted widespread attention. When there are problems with seepage control, the efficiency of the project can be affected and even cause safety and stability problems such as landslides, submersion and permeability failure. An example of this is the famous French Malpasset dam failure. Some researchers have studied the cause of the incident. They found that the presence of fractures and the permeability of the rock mass eventually led to the collapse of the Malpasset dam, which also reflects the necessity of paying attention to fractures when conducting seepage control in water conservancy and hydropower projects [1,2]. The hydraulic conductivity or hydraulic conductivity tensor of a fractured rock is an important hydrogeological parameter when studying the movement of groundwater in a rock mass [3].
The field hydrogeological test is a quick method used to understand the permeability characteristics of fractured rock in the field, which mainly includes a drainage test [4], piezometric test [5,6,7], pumping test [8] and micro-water test [9]. The above methods mainly include test principles and methods, equipment development, test procedure improvement, test data processing and interpretation, error analysis, influence factors, numerical simulation and validation, and other steps [10,11]. Although field hydrogeological tests are simple and quick, they are usually time-consuming and expensive. Due to the complexity and scale effect of fractured rock in the field [12,13], the applicability of field hydrogeological tests is poor, and it is difficult to ensure the accuracy of hydraulic conductivity for fractured rock.
Geological factors, such as the development of fractures, influence the permeability of fractured rock masses [14,15]. The method of establishing a link between geological indicators and the permeability properties of fractured rock, which can estimate hydraulic conductivity, has been widely used in the engineering field. Many researchers have found that the hydraulic conductivity of fractured rock has a certain relationship with the burial depth [16,17,18]. In addition, the hydraulic conductivity of fractures can be estimated by constructing models based on parameter indicators such as the rock quality index (RQD), the rock integrity index (RID) and the filler index (FSD) as well [19,20,21,22]. Since the parameter selection of this method is not flexible enough and has some limitations, a model for predicting hydraulic conductivity based on positive and negative correlation parameters affecting the permeability of fractured rock was proposed [23]. Due to the high water pressure environments for subsurface fractured rock mass, some researchers proposed formulas for estimating hydraulic conductivity based on different water pressures [24,25].
The fracture sample and inverse analysis methods are also commonly used to evaluate the permeability of fractured rock masses. The fracture sample method uses statistical methods to obtain data such as fracture aperture and spacing and estimates the hydraulic conductivity tensor of fractured rock masses [26,27]. The inverse analysis method is based on the measured data of long-term groundwater level and flow to determine the hydraulic conductivity tensor of a fractured rock mass [28,29].
Considering the complexity of fractured rock masses, groundwater seepage is affected by the heterogeneity, anisotropy and size effect of fractures, etc., and it is difficult to determine the permeability characteristics of fractured rock masses [30,31]. Combined with the JPSHP project, according to the hydrogeological conditions of the site, this paper establishes a 3D groundwater flow model in the power station area, puts forward the structural plane control inversion method, makes mathematical statistics on geometric parameter values such as the groups, apertures, dip direction and angles of structural surfaces and performs the reverse hydraulic conductivity tensor. The corrected model is used to calculate the leakage of the upper reservoir, the underground powerhouse and the lower reservoir, and the effect of anti-seepage system on anti-seepage is discussed, which provides guidance for the anti-seepage control of pumped storage power station.
2. Overview of the Study Area
2.1. Project Overview
The JPSHP is located in Jurong City, Jiangsu Province, China, 65 km from Nanjing City, 36 km from Zhenjiang City and 26 km from Jurong City (Figure 1). The main buildings of the power station key project consist of the upper storage reservoir, water convey system, underground powerhouse and lower storage reservoir, with an installed capacity of 1350 MW.
The upper storage reservoir is located in the southwest valley of the main peak of Lunshan, with a watershed area of about 0.63 km2, enclosed by the main dam, the secondary dam and the mountain ridge around the reservoir. The normal storage level is 267 m, and the dead water level is 239 m with a total storage capacity of 17.48 million m3. Both the main and secondary dams are concrete panel rockfill dams with a top elevation of 271.80 m. The maximum height of main dam is 181.70 m, and the top length of the dam is 811.22 m. The maximum height of the secondary dam is 36 m, and the top length of the dam is 176.18 m. The bottom of the reservoir is excavated at an elevation of 237 m. After excavation, the bank of the reservoir adopts reinforced concrete panels for seepage control, and the bottom of the reservoir adopts a geomembrane for seepage control. A reservoir road is set up along the perimeter of the upper storage reservoir with an elevation of 271.80 m.
The water convey system is located in the main peak of Lunshan mountain with a total length of 1327.89–1363.72 m (from the inlet and outlet of the upper storage reservoir to the inlet and outlet of the lower storage reservoir) (Figure 2). It includes the inlet and outlet of the upper storage reservoir, the upper flat section of the diversion, the diversion pressure chamber, the diversion shaft, the lower flat section of the diversion, the diversion steel fork pipe and the branch pipe before the underground powerhouse, the tailwater tunnel and the inlet and outlet of the lower storage reservoir. The inlet and outlet of the upper storage reservoir is located on the left bank with a floor elevation of 220 m. The diversion system adopts a three-hole and six-machine shaft arrangement. The inlet and outlet of the lower storage reservoir are located at a small ridge on the right bank with a floor elevation of 50 m. The size of the underground powerhouse is 246.5 m × 25.5 m × 57.55 m, and the size of the main transformer cavern is 242.35 m × 18 m × 25.50 m. The lower storage reservoir is located in the river section between Sister Bridge Creek, Gaojiabian Village and Shangmeng Village, with a watershed area of 7.75 km2 and a length of about 2 km. The normal storage level is 81 m, and the dead water level is 65 m with a total storage capacity of 20.43 million m3. The dam is a concrete panel rockfill dam with a crest elevation of 86.70 m. The maximum height of dam is 37.10 m with a length of 670 m and a width of 8 m. The spillway is located on the right shoulder of the dam, with a length of 266.72 m and a top elevation of 81 m.
The climate of Jurong is a north subtropical monsoon climate. There are high temperatures and rain in summer, warm and humid winters, high rainfall and abundant water resources. The annual average temperature is 17.1 °C, and the annual average precipitation is 1222.3 mm.
2.2. Geological Overview
2.2.1. Terrain and Landforms
The reservoir area is located in the south of the Yangtze River and the north of Taihu Lake. The site is located in the Guanyin and Lunshan mountain ranges on the south of the middle section of the Ningzhen mountain range, which runs from northeast to southwest, and is a low mountainous terrain with high terrain in the west and low terrain in the east. The south of the site is the Jurong Basin, and its ground elevation is mostly 35–50 m. The top elevation is 50–80 m and has the typical characteristics of riverbed phase and river floodplain phase, which is situated in Class I and Class II base terraces. The south-east is the Gao Li Mountain range with a summit elevation of 425 m, with the Lun Shui reservoir sandwiched between it and the Lun Shan Mountain range. The north-east and north of the Lun Shan Mountain consist of low hills, the summits of which are mostly between 115 and 200 m in elevation. The study area spans the main peak of Lunshan from west to east. The summit of Lunshan is 400.4 m in elevation. The ridge generally extends from west to east and is about 1.8 km long with an elevation of 60–400 m. The northwest of Lunshan is the recently exploited Jurong Forestry Quarry.
The upper storage reservoir is located on the southwest of Lunsan Mountain in a large sentinel ditch. The ditch flows to the southeast with a short extension and a narrow ditch bottom. The ground elevation is 90–110 m. The ditch at the dam site is an asymmetrical V shape, and the reservoir is basin-shaped. The ditch is surrounded by ridges to the east, north and southwest in a near circle, consisting of peaks and passes. The highest point around the reservoir is at the northeast corner of the reservoir, which is the main peak of Lunshan. The peak on the west is 375.1 m, and the ground elevation of the pass is 288.30–313.60 m. The mouth of the ditch is located in the south-east. The overall slope of the bank is 25–40°. There are a number of small shallow erosion gullies and an uneven terrain in the reservoir basin with an elevation of 100–140 m.
The lower storage reservoir is located on the northeast of Lunshan Mountain, and the natural reservoir basin is composed of the Sister Bridge Ditch and a small washout ditch on its north side. The Sister Bridge Ditch flows in a south-easterly direction, and the bottom of the ditch is flat with a ground elevation of 56–82 m. The south bank, or right bank, is Lunshan Mountain. The north bank, or left bank, has wide and gentle hills with a small topographic slope and a summit elevation of 150–226 m. These small ridges are mostly in the direction of SN to NWW. The largest branch ditch is the Tiger Dam Ditch in front of the dam, which meanders from north to south to the dam site and joins the Sister Bridge Ditch at the dam site into Lunshan Reservoir. The left bank of the Laohu Dam ditch is the head of the left dam with a ridge elevation of 134 m. The gully outside the reservoir is well developed.
The water transmission and power generation system is buried within the Lunshan Mountain, crossing the main peak of Lunshan Mountain from south-west to north-east with the ground elevation ranging from 70 to 400 m. The highest peak is the main peak of Lunshan Mountain. The ridge of Lunshan Mountain is gentle, and the branch ditches along both sides are undeveloped and shallowly cut. The slope of inlet and outlet for the upper storage reservoir is slightly steeper, with a slope of 30–35°. The inlet and outlet of the lower storage reservoir is gentler. The overlying rock thickness of the upper flat section is 65–160 m. The overlying rock thickness of the lower flat section is 180–270 m. It is 95–180 m thickness in the underground powerhouse.
2.2.2. Stratigraphic Lithology
The stratigraphy exposed in the study area is classified from old to new as:
- (1)
- The stratum of the Sinian Dengying Formation (Z2dn) is mainly gray-white, medium–thick-layered fine-crystalline dolomite, which is mainly distributed in the middle of the main underground powerhouse, the secondary underground powerhouse and the main transformer cave. At an elevation of 51.5 m, this type of rock accounts for 59% of the underground powerhouse rock, 85% of the main change cave and 95% of the busbar cave. At an elevation of 37 m, this type of rock accounts for 85% of the underground powerhouse rock and 100% of the main change cave.
- (2)
- The upper part of the Mufushan Formation (∈1m2) contains phosphorous siliceous rock, phosphorous dolomite and phosphorite, which are gray and dark gray thin to thick layered, partially intercalated with argillaceous dolomite and intermittent banded flint. Strips are distributed in the power station area. According to the analysis of the horizon-slice map, at an elevation of 51.5 m, this type of rock mass accounts for about 39% of the powerhouse rock mass, about 15% of the main transformer cave rock mass and about 5% of the busbar cave. At an elevation of 37 m, this type of rock mass accounts for about 15% of the powerhouse rock mass, and the main transformer caves and busbar caves are not distributed.
- (3)
- The stratum of the Paotaishan Formation (∈1p) is argillaceous dolomite, siliceous dolomite and fragmented dolomite. The argillaceous dolomite is thin layered, and the surface is strongly weathered. Muddy filling is more common in contact zones and layers, which is a soft interbedded layer. The contact surface is dominated by cuttings with mud. It is distributed in strips. According to the analysis of the horizon-slice map, at an elevation of 51.5 m, this rock mass is mainly distributed on the right end wall of the powerhouse, accounting for about 2% of the powerhouse rock mass, and the main transformer caves and busbar cave are not distributed. At an elevation of 37 m, this rock mass is distributed outside the power station area.
2.2.3. Geological Structure
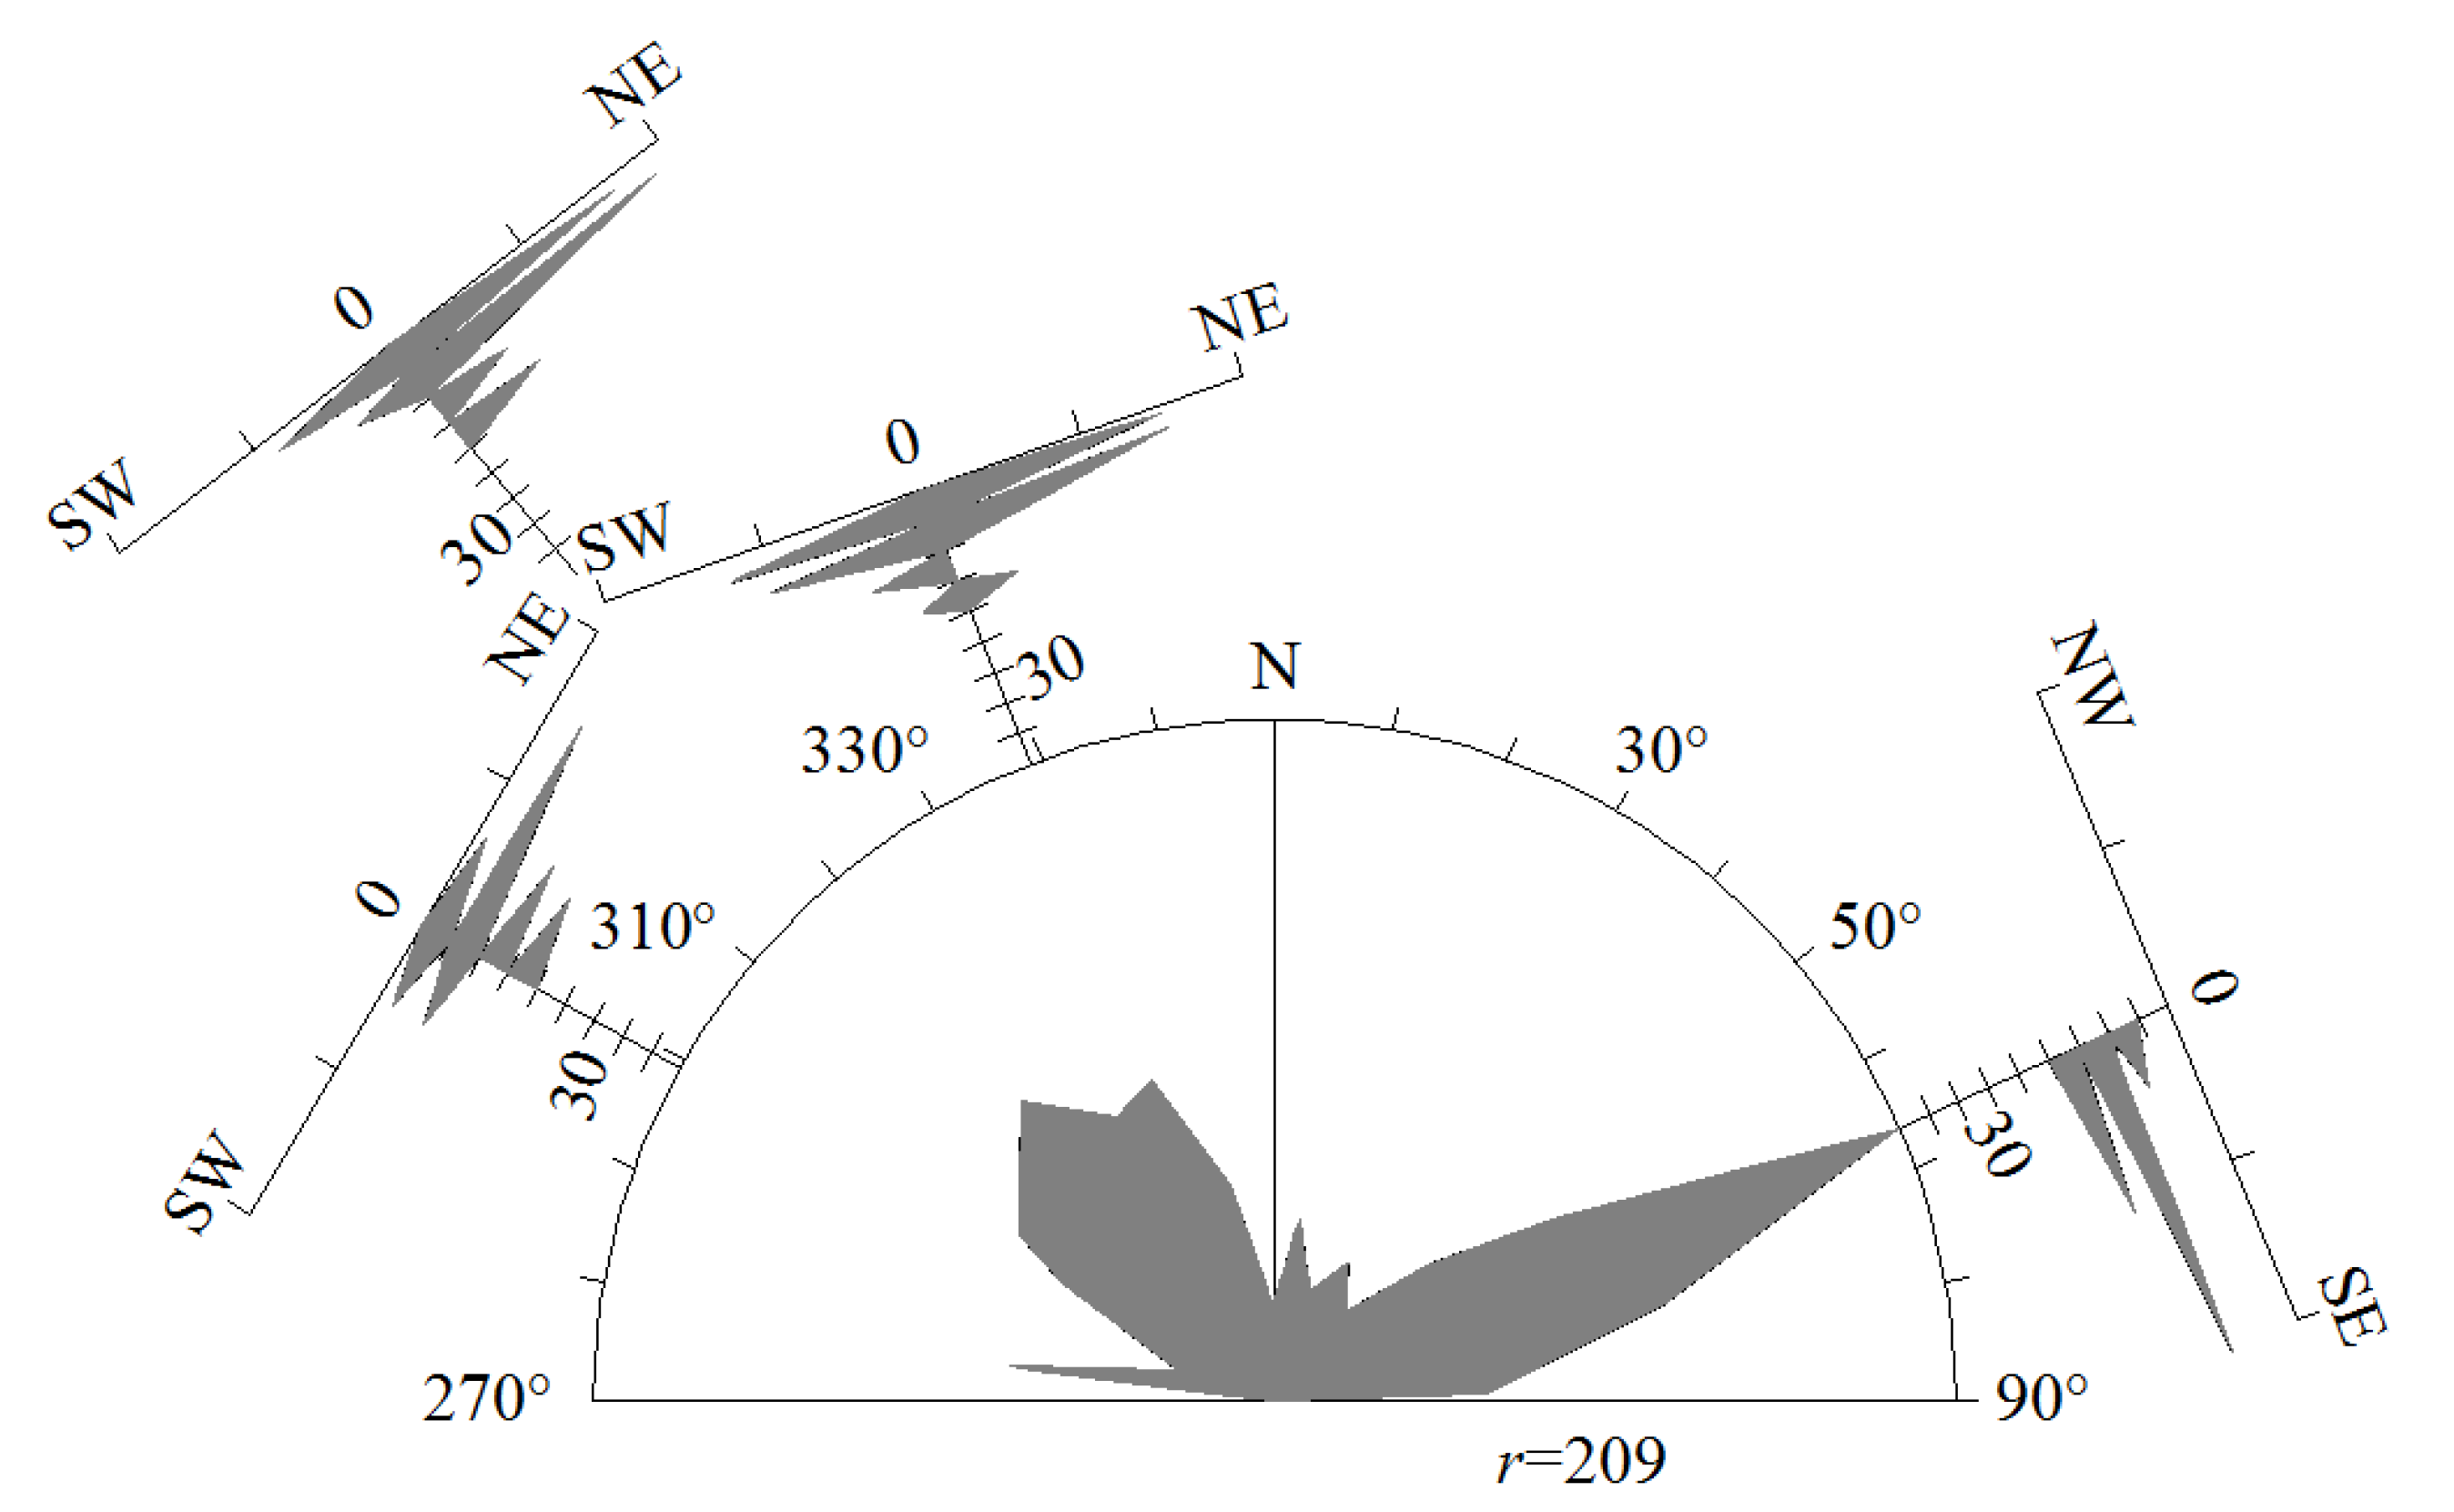
The geological structure of the study area is complex. Folding is not developed. The stratigraphy is monoclinic. The main tectonic traces are mainly faults, joints and fractures. According to the attitude of structural planes, the first type is in the NW direction, such as F6 and F8. The width is 0.5–2 m. The lithology is tectonic conglomerate and fractured rock. The contact zone is mostly seen as dissolution fractures. The second type is in the NWW direction with the width of 0.5–2 m. The lithology is tectonic conglomerate and fractured rock. The contact zone is mostly seen as dissolution fractures. The third type is in the NNW direction, such as F7 and F11. The width is 1–3 m. The lithology is tectonic conglomerate and fractured rock. The fractures are mostly filled by the intrusion of rock veins. The fourth type is in the NE direction with the width of 2–3 m, such as F2 and F3. The lithology is tectonic conglomerate and fractured rock with minor fragmented chalk and faulted mud. The last one is in the NEE direction with the width of 0.1–0.5 m. The main adit, PD02, in the underground powerhouse reveals 47 faults. The strike is N 40–60° W with a dip direction of NE and a dip angle of 70–80°. The width ranges from 0.15 to 5.0 m. These faults are mostly intruded by amphibolite and calcite veins. The contact surfaces are corroded and filled with red clay. The branch hole, PD02-1, reveals 14 faults. The strike is N 60–80° E with a dip direction of NW and a dip angle of 65–80°. The width ranges from 0.05 to 2 m. The contact surfaces are corroded and filled with crushed chalk, massive fractured rock, fault mud, red clay and calcite. The branch hole, PD02-2, reveals seven faults. The strike is N 20–30° W with a dip direction of NE and a dip angle of 80–85°. The width ranges from 0.3 to 3 m. The contact surfaces are corroded and filled with fragmented chalk, fault mud, red clay and sphalerite. According to the standard of rock structure plane in the Code for Geological Investigation of Hydropower Projects (GB50287-2006), the structure planes are divided into five grades. There are 22 Grade II structural planes with a width of 2–38 m and strong penetration. They are mainly composed of breccia, fragmented rock and cataclastic rock. Some of them contain broken silt and fault gouge. In the later period, the structure planes are mostly filled by diorite porphyrite veins. There are 64 Grade III structural planes, generally 0.3–0.7 m wide, that contain small faults, mainly composed of breccia and crushed rock. The contact surfaces are filled with secondary mud and intruded by part of the diorite porphyrite veins, quartz, and calcite and fine veins. There are six Grade IV structural planes, generally 0.05–0.1 m wide, mainly composed of breccia and clastic rock, with quartz or calcite fine veins intrusive. Most of the joints are grade V structural planes, and NEE is the most developed direction. In addition, there are three group joints in the NW, NNW and NWW directions with steep angles; the distribution has a certain degree of randomness, generally a slightly open or closed rigid structure plane (Figure 3).
2.3. Hydrogeological Conditions
- (1)
- Permeability of rock mass
The statistical results of conventional water pressure tests show that 54.6% of the rock mass is slightly permeable, 29.5% is weakly permeable rock mass, 10.2% is weakly permeable rock mass and 5.6% is moderately permeable rock mass. The permeability of the various sets of strata is basically similar. Among them, the Qixia Formation, the Qinglong Formation, the Zhouchong Village, the Longtan Formation, the Shangdang Formation, the Mufushan Formation and the Paotaishan Formation are relatively weak in water permeability, with slightly permeable rock mass accounting for more than 60%. The weakly permeable formations of the Lunshan Formation, the Honghuayuan Formation, the Dengying Formation and the Guanyintai Group reach 46–49%, and the slightly permeable rocks make up less than 50%. The permeability of non-soluble rock in Yangchong Formation is mainly weak and slightly permeable, very small and moderately permeable, without strong permeable rock mass. The impure carbonate rock mass is mainly weak to slightly permeable, and there is no rock mass with medium or above permeability. The medium and above permeable rock mass in the carbonate rock contains caves or wide fractures, dissolution fissures, etc. According to the relationship between flow rate and pressure, the fracture state did not change during the water pressure test. At the same time, two sets of high water pressure tests were carried out in the underground powerhouse area, and the maximum water permeability was 2.95 Lu, which indicated that the rock mass of the underground powerhouse is weakly to slightly permeable.
- (2)
- Groundwater types
There are three main groundwater types in the study area: pore water, fracture water and karst water, with fracture–karst water being the main type.
- Fracture water
Fracture water is mainly found in bedrock fractures and fault zones. It is divided into two categories: tectonic fracture water and weathered fracture water. The thickness of the aquifer is large, recharged by atmospheric precipitation, drained in the form of springs, controlled by faults and fractures and affected by karsts. It is mainly distributed in veins and bands, especially at the low groundwater level in the Lunshan Mountains. Dripping and seepage along faults, fractures and karsts are more common. The degree of development of tectonic fracture water is determined by the mechanical properties and shale content of the rock. Strata dominated by quartz sandstones are brittle, and the fractures are developed under the action of structure, and the water richness is good. Strata dominated by siltstone are soft, with a high argillaceous content, undeveloped fractures, which are easily filled and closed, and poor water content. Weathered fracture water generally decreases with the increase in depth. It is widely distributed on the plane. The shallow fractures are connected in a network. Due to the influence of topography, stratum lithology, geological structure, surface water and groundwater, it varies from place to place. The groundwater in the weathered zone mainly recharges by the fracture water in the hills, and has weak pressure bearing capacity, and the water inflow of a single well is less than 10 m3/d.
- Karst water
Karst is the main water-bearing space where groundwater occurs in carbonate strata, and it occupies a major position in the study area. The study area is characterized by weak to moderately strong karst strata, surface erosion recesses, surface erosion fractures, solution channels and small solution holes. Drill holes and exploration caves revealed the presence of karst fractures and caves at certain depths. Intermittent water gushing in the fault zone and tracer test results in the borehole show that there are crevices or local pipeline flows in the Lunshan rock mass. Therefore, the karst water in the study area is diverse, including karst–fracture water, pore–fracture water and crevice–fissure–pipe water, etc. It is the main type of groundwater migration in the study area, and atmospheric precipitation is the main recharge source. Water and ditch water are also sources of low-elevation karst water, which are discharged in the form of karst springs or crevice water. According to the outcropping conditions, lithological characteristics, geological structure and topography of carbonate rock formations, combined with regional hydrogeological data and spring water outcrops, water richness is divided into two levels: formations with strong water richness and formations with weak water richness.
- (3)
- Groundwater dynamic characteristics
Twenty-five long-term observation boreholes were set up around the reservoir, in the basin and at the dam site to measure groundwater levels from March 2011 to April 2012. The observation results show that the maximum buried depth of groundwater level in the ridge of Lunshan Mountain is 256 m with an elevation of 67 m. The buried depth in the ridge around the upper storage reservoir and on both sides of the dam site is 114–133 m, while the basin and the middle and lower part of the dam site are mainly between 30 and 70 m. The lower storage reservoir is mostly within 30 m, except for the left dam, where the buried depth reaches 56 m. There is a certain regularity in the distribution of groundwater levels in elevation. The lowest groundwater level of the upper storage reservoir and the reservoir basin is mainly distributed in the elevation 155–190 m, while the dam site area and the bottom of the ditch are distributed in the elevation 75–95 m, which basically flows along the tendency of the rock layer. The lower storage reservoir and the water convey system are distributed in the elevation 60–90 m, and the groundwater level in the Lunshan Mountain is basically the same as that of the lower storage reservoir and slightly lower than that of the bottom of the upper storage reservoir and the dam site area.
The lowest groundwater level in the upper storage reservoir is 25.48–132.76 m, with the largest depth of 114–133 m at the ridge of the reservoir bank and the head of the left and right dams. The depth of groundwater in most boreholes is 25–40 m. The lowest water level is 67.17–228.78 m. The groundwater level elevation in the densely developed diorite porphyry dike area on the west bank of the reservoir is above 190 m. The water level near the F9 fault zone at the bottom of the ditch is low, generally below 90 m. The variation of groundwater level ranges from 3.4 to 77.94 m with a general variation of 10–25 m, and the maximum change at the left dam head (ZK1) is up to 78 m.
In the water transmission and generation systems, an underground cavern is situated within the Lunshan Mountain. The adit PD1 is relatively dry, with a small amount of water dripping from fractures. According to the groundwater levels revealed by the surrounding boreholes ZK16, ZK34 and ZK1, the deepest groundwater level near the inlet and outlet in the upper storage reservoir is approximately 119.7 m with an elevation of 158.69–181.60 m. ZK21, situated in the middle of the water pipeline, reveals a low groundwater level with a minimum depth of 255.81 m and an elevation of 66.72 m. The lowest water level in the borehole from adit PD2 of the underground powerhouse is 0–22.5 m with an elevation of 67.47–86.73 m.
In the lower storage reservoir, five long groundwater level observation boreholes were arranged in the dam site. The lowest water level on the left bank is 9.50–21.40 m with an elevation of 74.26–79.40 m. The lowest water level on the right bank is 27.5–56.3 m with an elevation of 65.0–93.1 m. Eight groundwater observation boreholes were arranged in the south bank of the reservoir. Among them, ZK110 is a horizontal hole with a flow rate of 0–28 L/min, and ZK145 is an oblique hole with a flow rate of 0–18 L/min. The burial depth of other boreholes is 5.3–27.5 m with an elevation of 63.21–82.47 m.
- (4)
- Conditions of groundwater recharge, runoff and discharge
The topography of the study area is large undulations, and rainfall is the main source for groundwater recharge. In the exposed bedrock mountains, groundwater recharge sources are dominated by depressions, caves and vertically dispersed infiltration from surface solution gaps, fractures and gullies. The variation of groundwater level is closely related to the amount of rainfall. Groundwater runoff is mainly controlled by topography and tectonics, especially the control of bedding fissures, water-resistant rock veins and fractures, forming spring areas. Groundwater in the gullies is constrained by topographic and hydrological conditions and drains to the Gangwash and gully runoff. From the analysis of the topography, geological conditions and the distribution of spring outcrops, the short runoff pathway and local recharge and discharge is one of the main characteristics of bedrock groundwater transport in the area.
Discharge conditions are dominated by evaporation, springs and inter-stratigraphic drainage, which are the main modes of groundwater discharge in the study area. There are deep wells for groundwater extraction in Judong farm and the army at the western end of Guanyintai Mountain, and shallow wells for mining shallow pore water on farms such as Zimeiqiao and Shangmeng. The terrain in the mountains is steep. The rock outcrops receive infiltration recharge from rainfall, and groundwater runoff circulation conditions are well established, with short pathways and fast flow rates, so that groundwater discharge in the form of springs from bedrock is extremely common, especially for karst water. In the contact zone between soluble and non-soluble rocks, controlled by tectonic and topographic cutting conditions, springs are frequently exposed, with a maximum flow of over 1000 m3/d for Xianren Cave Spring. These springs are controlled by NNW-, NNE- and NWW-oriented fractures and veins. This makes the bedrock groundwater show a certain vein-like flow or strip-like flow of runoff and discharge pattern. Evaporation from low-lying gully and valley areas and the extraction of folk wells are also groundwater drainage routes. In addition, the infiltration of groundwater along the water barrier in mountainous areas is also a means of drainage. There is a weak runoff discharge to the deeper and eastern parts along the Sister Bridge fracture zone.
3. Methods
3.1. Mathematical Model of Rock Seepage and Its Solution
There is some karst in the JPSHP, but its connectivity is generally poor and no obvious karst pipes are formed, so the influence of rock fractures is mainly considered. When studying the groundwater movement of rock in the area of a hydraulic building, the water-bearing medium can be studied as a continuous medium if the ratio of the average spacing of fractures in the reservoir area to the minimum size of the building is less than 1:20. The ratio of the average spacing of the fractures in the JPSHP to the minimum size of the building is much less than 1:20, thus the mathematical model of a continuous medium can be used to simulate and calculate the seepage field. Consider the following assumptions: (i) the water is incompressible; (ii) the aquifer material is incompressible; (iii) external loads (e.g., atmospheric pressure, overburden) on the aquifer are constant; (iv) the groundwater is flowing slowly (Reynolds number is less than unity). The 3D movement of groundwater satisfies the following control equation:
where is the Hamilton operator, K is the hydraulic conductivity tensor, H is the hydraulic head at any point in the seepage field [L], is the storage coefficient [1/L], t is time [T]. The governing Equation (1) for groundwater movement in a rock mass is solved by the following initial and boundary conditions:
Initial conditions can be given as
First boundary conditions or Dirichlet conditions are
Second boundary conditions or Neumann conditions can be expressed as
where is the hydraulic head at any point (x, y, z) in the region at some time t [L], , and are known functions and n is the direction of the outer normal to the boundary . Using the Garlerkin finite unit method, the final algebraic equation for the entire seepage problem is solved by
where {H} is the unknown nodal hydraulic head array, {F} is the known right end term and [G] is the overall penetration matrix or conduction matrix. dH/dt can be approximated with the finite difference formula based on the Forward Euler method [32]:
The equation can be rewritten as using the implicit differential format:
That is,
3.2. Drainage Hole Simulation and Cross-Sectional Flow Rate Determination
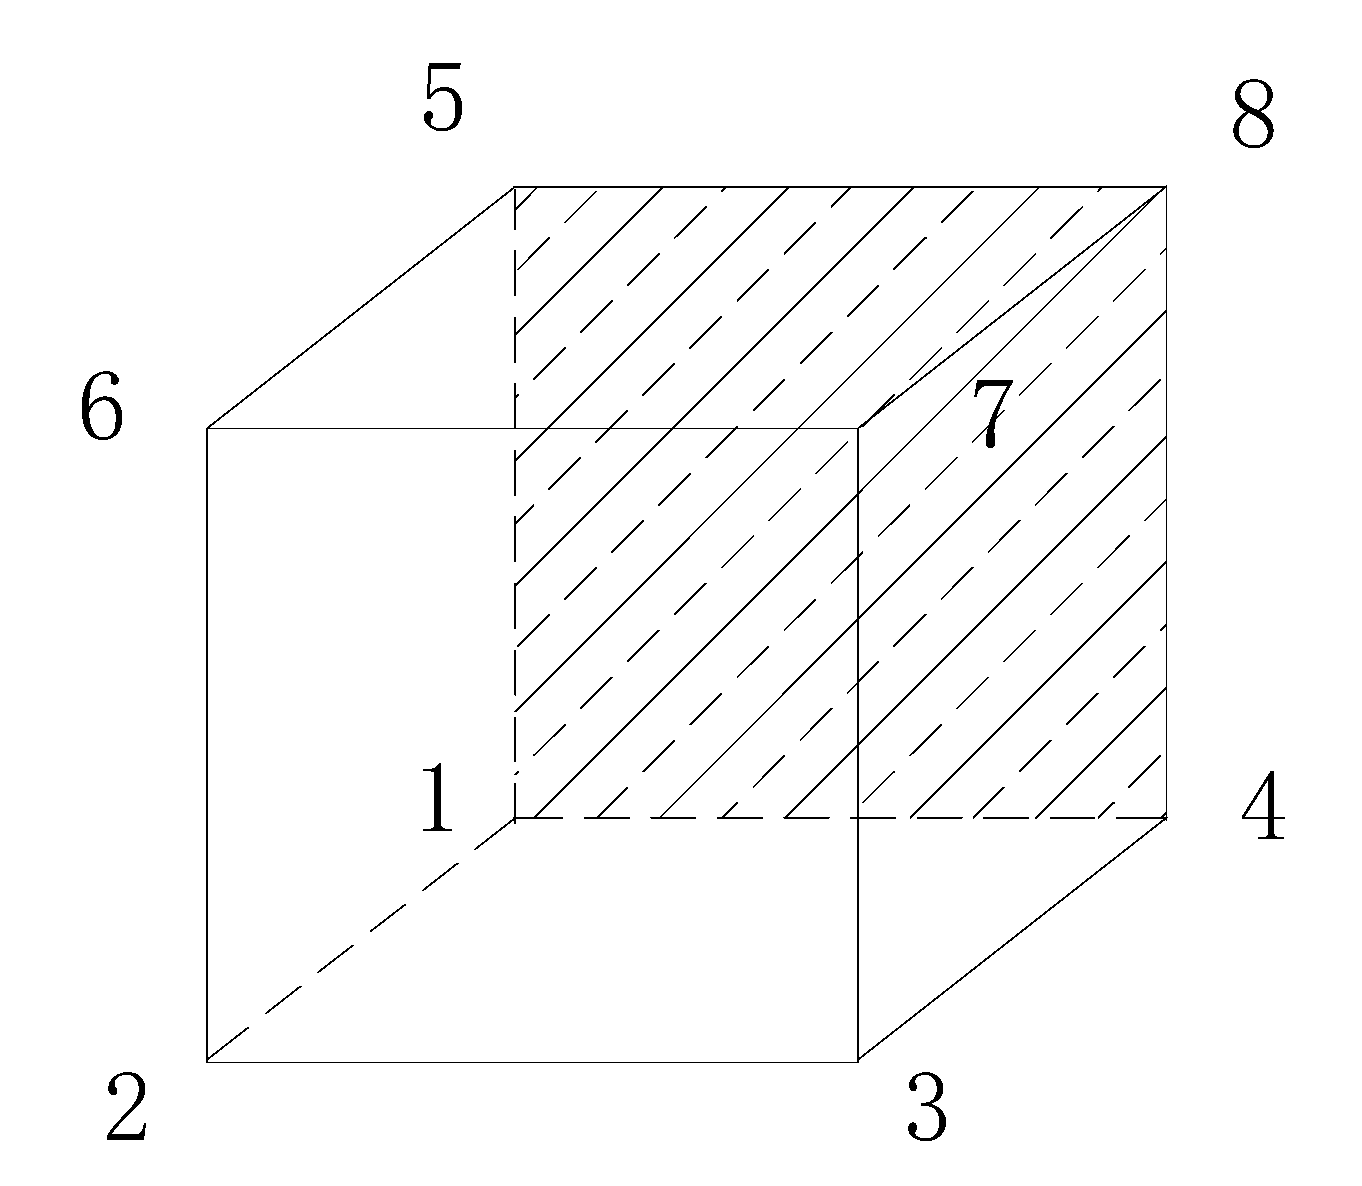
The JPSHP has four drainage corridors and holes, including the top, upper, middle and bottom levels. A rod unit is used to deal with these drainage holes, and the method is illustrated with a typical unit. For the hexahedral unit (Figure 4), it is assumed that the node 1485 is the profile where the drainage holes are located. The rod unit penetration matrix is assigned as
that is, add or subtract ps to the diagonal elements a11, a44, a88 and a55 of the permeability matrix of a typical unit, respectively.
where b is the well spacing, γω is the well radius, K is the hydraulic conductivity, K1, K2 and K3 are the three main hydraulic conductivities of the rock mass and ΔF is the area of the unit profile where the hole is located.
By solving Equation (8), the seepage field over the entire seepage area can be obtained. As the partial derivative of the hydraulic head on the unit nodes with respect to the coordinates cannot be obtained directly when solving the seepage field using the finite element method, the intermediate section method is used when calculating the section flow (Figure 5). Using the node 8 flow element as an example, the equation for the seepage through a section S is given as
where S is the overflow section and n is the unit vector in the direction of the positive normal to the overflow section.
For any eight-node hexahedral isoparametric element, the midsection abcd is chosen as the overflow section S and S is projected onto the yoz, zox, and xoy planes, noted as Sx, Sy, and Sz, respectively; then, the seepage through the midsection of the element is given as
3.3. Parameter Inversion Method
- (1)
- Inversion method based on structural surface control
Based on the error between the observed and calculated hydraulic heads at a number of known coordinate positions in the study seepage area, the least squares method is used to establish an objective function:
where is the coefficient, the superscript i indicates the i-th subzone according to the rock permeability, i = I, II,…, NK, NK is the total number of subzones, the subscript j denotes the j-th coefficient in the i-th subzone, j = 1, 2,…, MK, MK is the total number of parameters for a subzone and is the weight function for the k-th head observation point; it satisfies , M is the total number of observation points in the area, is the calculated groundwater level at the k-th observation point in the area [L] and is the observed groundwater level at the k-th observation point in the region. Obviously, a set of parameters reflecting the objective fractured rock seepage pattern, , needs to be configured such that the objective function E tends to a minimum. Considering the actual field work, the structural plane attitudes are represented by the strike, dip direction and dip angle of the structural planes. For a 3D seepage problem, if the x, y and z axes are chosen to be east, north and vertical, respectively, the expression for the permeability tensor in a Cartesian coordinate system can be rewritten as
where and are the dip direction and dip angle of the structural planes in group j of the rock mass, respectively, is the equivalent hydraulic conductivity [L/T] for the j-th group of fractures and M is the number of structural plane groups in the rock mass that control groundwater seepage. From tectonic geology, the development and distribution of fracture planes in a given area is regular and is developed in groups. Therefore, statistical methods can be used to firstly count the development and distribution patterns of structural planes in the study area, so that the distribution function of the structure planes and the statistical values of the geometric parameters are obtained. In this way, the matrix in the tensor expression can be uniquely determined and the unknowns are only the coefficients, . If the hydraulic conductivity can be back-calculated for each group of fractures, then the permeability tensor can be uniquely determined from the tensor expressions. Among the subzones with a total number of NK, the hydraulic conductivity of the j-th group of fractures in the i-th subzone can be expressed as , and
As the correlation between the objective function E and the independent variable cannot be described by an explicit expression, it is easier to solve the inverse problem using an optimal method. Each step of this method can be solved in a similar way to the positive problem, initially using the 3D finite element method to find the approximate distribution of the hydraulic head based on a set of trial solutions . The parameters are then substituted with the most recently obtained parameters and continuously tuned so that the calculated groundwater levels gradually approximate the observed values, that is, E tends to a minimum.
- (2)
- Treatment of groundwater levels in observation holes
If an observation hole is drilled in a water-bearing rock, water can enter the hole across the thickness of the rock through which the observation hole is drilled. Therefore, the observed groundwater level, Ho, is not the true groundwater level at a particular point, but rather the average value at each point on the section of the water-bearing rock uncovered by the borehole in the observation hole:
where L is the thickness of the water-bearing rock uncovered by the observation hole [L]; H is the water level at different depths (locations) in the observation hole [L].
When calculating with the finite element method, the local coordinates of the observation hole in a typical element are first generated from the overall coordinates. Then, according to the interpolation formula, the water level at a point in the borehole in the vertical direction is calculated. In this way, the accumulative value of the water level of the borehole in the typical element can be approximated as
The calculated water level, Hc, in the entire observation hole is
where H+ and H− are the groundwater levels at the top and bottom for the i-th typical element disclosed by the observation hole, respectively. is the vertical length [L] of the i-th element uncovered by the observation hole, n is the total number of elements and L can be expressed as
- (3)
- Determination of the weight function ω
There is a certain amount of error between the calculated and observed water levels at the position corresponding to the observation hole. Additionally, there are various reasons for this error, including errors in the numerical calculation itself, errors in the simplification of the model, errors in the formation of the observation hole, errors in observation, etc. Theoretically, if the mathematical model established to describe groundwater movement is identical to the actual groundwater movement and the observed groundwater level is not disturbed in any way, the calculated and observed water levels should be equal at the same point, excluding the numerical errors in the numerical calculation itself. However, due to the complexity of the geological body and the randomness of the water control structure, although the overall view of groundwater movement basically conforms to the established mathematical model, but specifically to a certain borehole and a certain local point, the actual groundwater level is not necessarily equal to the calculated value, so that there is an inherent error between the calculated and observed water levels, which cannot be eliminated by improving the calculation method and adjusting the model. Therefore, in order to correctly simulate the spatial distribution of the actual groundwater movement from a macroscopic perspective and the flow field as a whole, and to eliminate the accuracy of the entire calculation result caused by the error of individual points, the difference between the water level of each observation hole and the calculated water level is multiplied by the weight function, so that the calculation as a whole meets the control accuracy requirements.
Suppose there are n observation holes in the study area, the observed water level of the i-th observation hole is and the corresponding calculated water level is . Define the weight function:
The n weight functions are arranged in order from largest to smallest, while the water level error is arranged in order from smallest to largest, and the renumbered weight functions and water level error are brought into the objective function Equation (12), which can be solved to obtain the objective function value. Because the size of this weight function (k = 1,2,…, n) and its arrangement is with the parameter inversion process and the water level error dynamic self-adjustment, the difference between the observation and calculated water levels multiplied by the weight function can automatically and effectively eliminate the error of individual points, so that the calculation in the overall control accuracy can achieve the requirements.
4. Results and Discussion
4.1. Results of Parameter Inversion
The computational domain is bounded by the upper and lower storage reservoirs. Both sides are taken to the watershed and the model depth is taken as the elevation of −30 m. The upper storage reservoir treats the water level of the observation hole as the first type of boundary condition (Dirichlet condition). The lower storage reservoir treats the ditch water as the first type of boundary condition (Dirichlet condition). Both sides and the bottom of the model are treated as no flow boundary conditions (Neumann conditions) (Figure 6). The calculated area is bounded by the upper and lower storage reservoirs. Both sides are taken to the watershed, and the model depth is taken as the elevation of −30 m. The upper storage reservoir treats the water level of the observation hole as the first type of boundary condition. The lower storage reservoir treats the ditch water as the first type of boundary condition, and both sides and the bottom of the model are treated as no flow boundary conditions. The permeability of the rock in the JPSHP area is mainly controlled by the structural planes, and several groups of faults and fractures are developed. In the inversion, the faults and four groups of joints and fractures, which have a controlling effect on the permeability of the underground numbers, are mainly considered. The fracture statistics are shown in Table 1. According to the weathering characteristics and structural plane development in the power station area, the study area is divided into three different permeability zones in the profile, (I) strong–moderate weathering zone, (II) weak weathering zone and (III) slightly weathered zone.
There are 25 long-term observation holes for groundwater level in the study area, and the locations of some observation holes are shown in Figure 6. The groundwater levels of eight observation holes were selected to invert the model parameters, including four in the upper reservoir and its surroundings, two in the vicinity of the diversion tunnel and underground powerhouse and two in the lower reservoir, basically covering the entire study area.
According to the established groundwater flow model, the finite element method was used for calculation. The calculated values in the observed borehole were obtained corresponding to 12 January 2004 (Table 2). The objective function value, E, was 0.48, corresponding to the optimized solution of the hydrogeological parameters. The calculated water level of each borehole and the corresponding weight function value, measured value and the error between the calculated and measured values are shown in Table 2. It can be seen from Table 2 that the fitting errors between the observed and calculated water levels are generally small, most of the boreholes have high calculation accuracy and only a few points have large errors. Additionally, the largest errors are found in ZK7 and ZK14, where the calculated values are almost 2 m lower than the observed values. Due to the strongly heterogeneous anisotropy of the fractured rock, there are some errors between the calculated and observed values. The main values of the hydraulic conductivity tensor, the main directions and the inversion values of the average permeability coefficient in each permeability zone are shown in Table 3. The calculation results of permeability tensor, the main value of the tensor and the average value show that the trend of the parameter magnitudes in each permeability partition is basically consistent with the weathering of the fractured rock mass and the hydrogeological characteristics. Overall, the permeability parameters of the rock masses gradually decrease with increasing depth. The average hydraulic conductivity ranges from 0.308 m/d in the strongly and moderately weathered zone to 0.062 m/d in the slightly weathered rock mass.
In order to verify the correctness of the inversion model, the long-observed water levels of the borehole for a total of 12 time periods from December 2003 to April 2004 were selected and fitted to the calculated water levels. The permeability tensor obtained from the inversion was used to calculate the groundwater levels for each time period. Using time t as the horizontal coordinate and hydraulic head as the vertical coordinate, the observed water level Ho and the calculated water level Hc for the same observation hole were plotted on the graph to obtain a fitted graph (Figure 7). From the fitted graphs, it can be seen that the calculated water levels in each borehole fit well with the observed water levels. It shows that the inversion model can well reflect the actual conditions in the study area and that the values of the hydrogeological parameters obtained from the inversion are reasonable.
4.2. Simulation of 3D Groundwate Seepage in the Powerstation Area
- (1)
- Calculation range
The study area mainly comprises the upper storage reservoir, underground powerhouse and lower storage reservoir, extending to the watershed on both sides and to a depth of −30 m elevation. Based on the permeability zoning of the rock in the study area and the setting of impermeable curtains during the reservoir operation period, the study area was divided into four zones according to permeability, namely a strong–moderate weathering zone, weak weathering zone, slightly weathered zone, the upper and lower storage reservoir and underground powerhouse impermeable curtains. The hydraulic conductivity of the geotextile at the bottom of the upper storage reservoir is 1 × 10⁻¹¹ cm/s. The hydraulic conductivity of the reinforced concrete panel around the reservoir is 1 × 10⁻⁷ cm/s. The hydraulic conductivity of the clay cover of the lower storage reservoir is taken as 1 × 10⁻⁷ cm/s. The hydraulic conductivity values of the other three divisions are taken as shown in Table 3. Considering the topography, the arrangement of hydraulic buildings and the arrangement of drainage holes, etc., the study area was divided into a total of 1603 super units. Due to the different calculation accuracies required for different engineering parts, the super units were dissected with unequal density, with a total of 19,409 nodes and 17,100 units, and the mesh map is shown in Figure 8. Taking the south side of the area as the origin of the coordinates, the coordinate system with the x-axis pointing to true east, the y-axis pointing to true north and the z-axis pointing vertically upward was used as the calculation coordinate system.
- (2)
- Calculation schemes
In order to know the groundwater movement pattern in the power station area during the operation period, the groundwater seepage field during the operation period was simulated. Considering the failure of the curtain due to chemical and physical effects during the operation period of the reservoir and the drainage of the underground powerhouse, simulations were made to calculate the failure of the impermeable curtain in the upper storage reservoir, the underground powerhouse and the lower storage reservoir during the operation period, and the specific calculation conditions and schemes are shown in Table 4.
4.3. Seepage Field Calculations and Evaluation of Results
- (1)
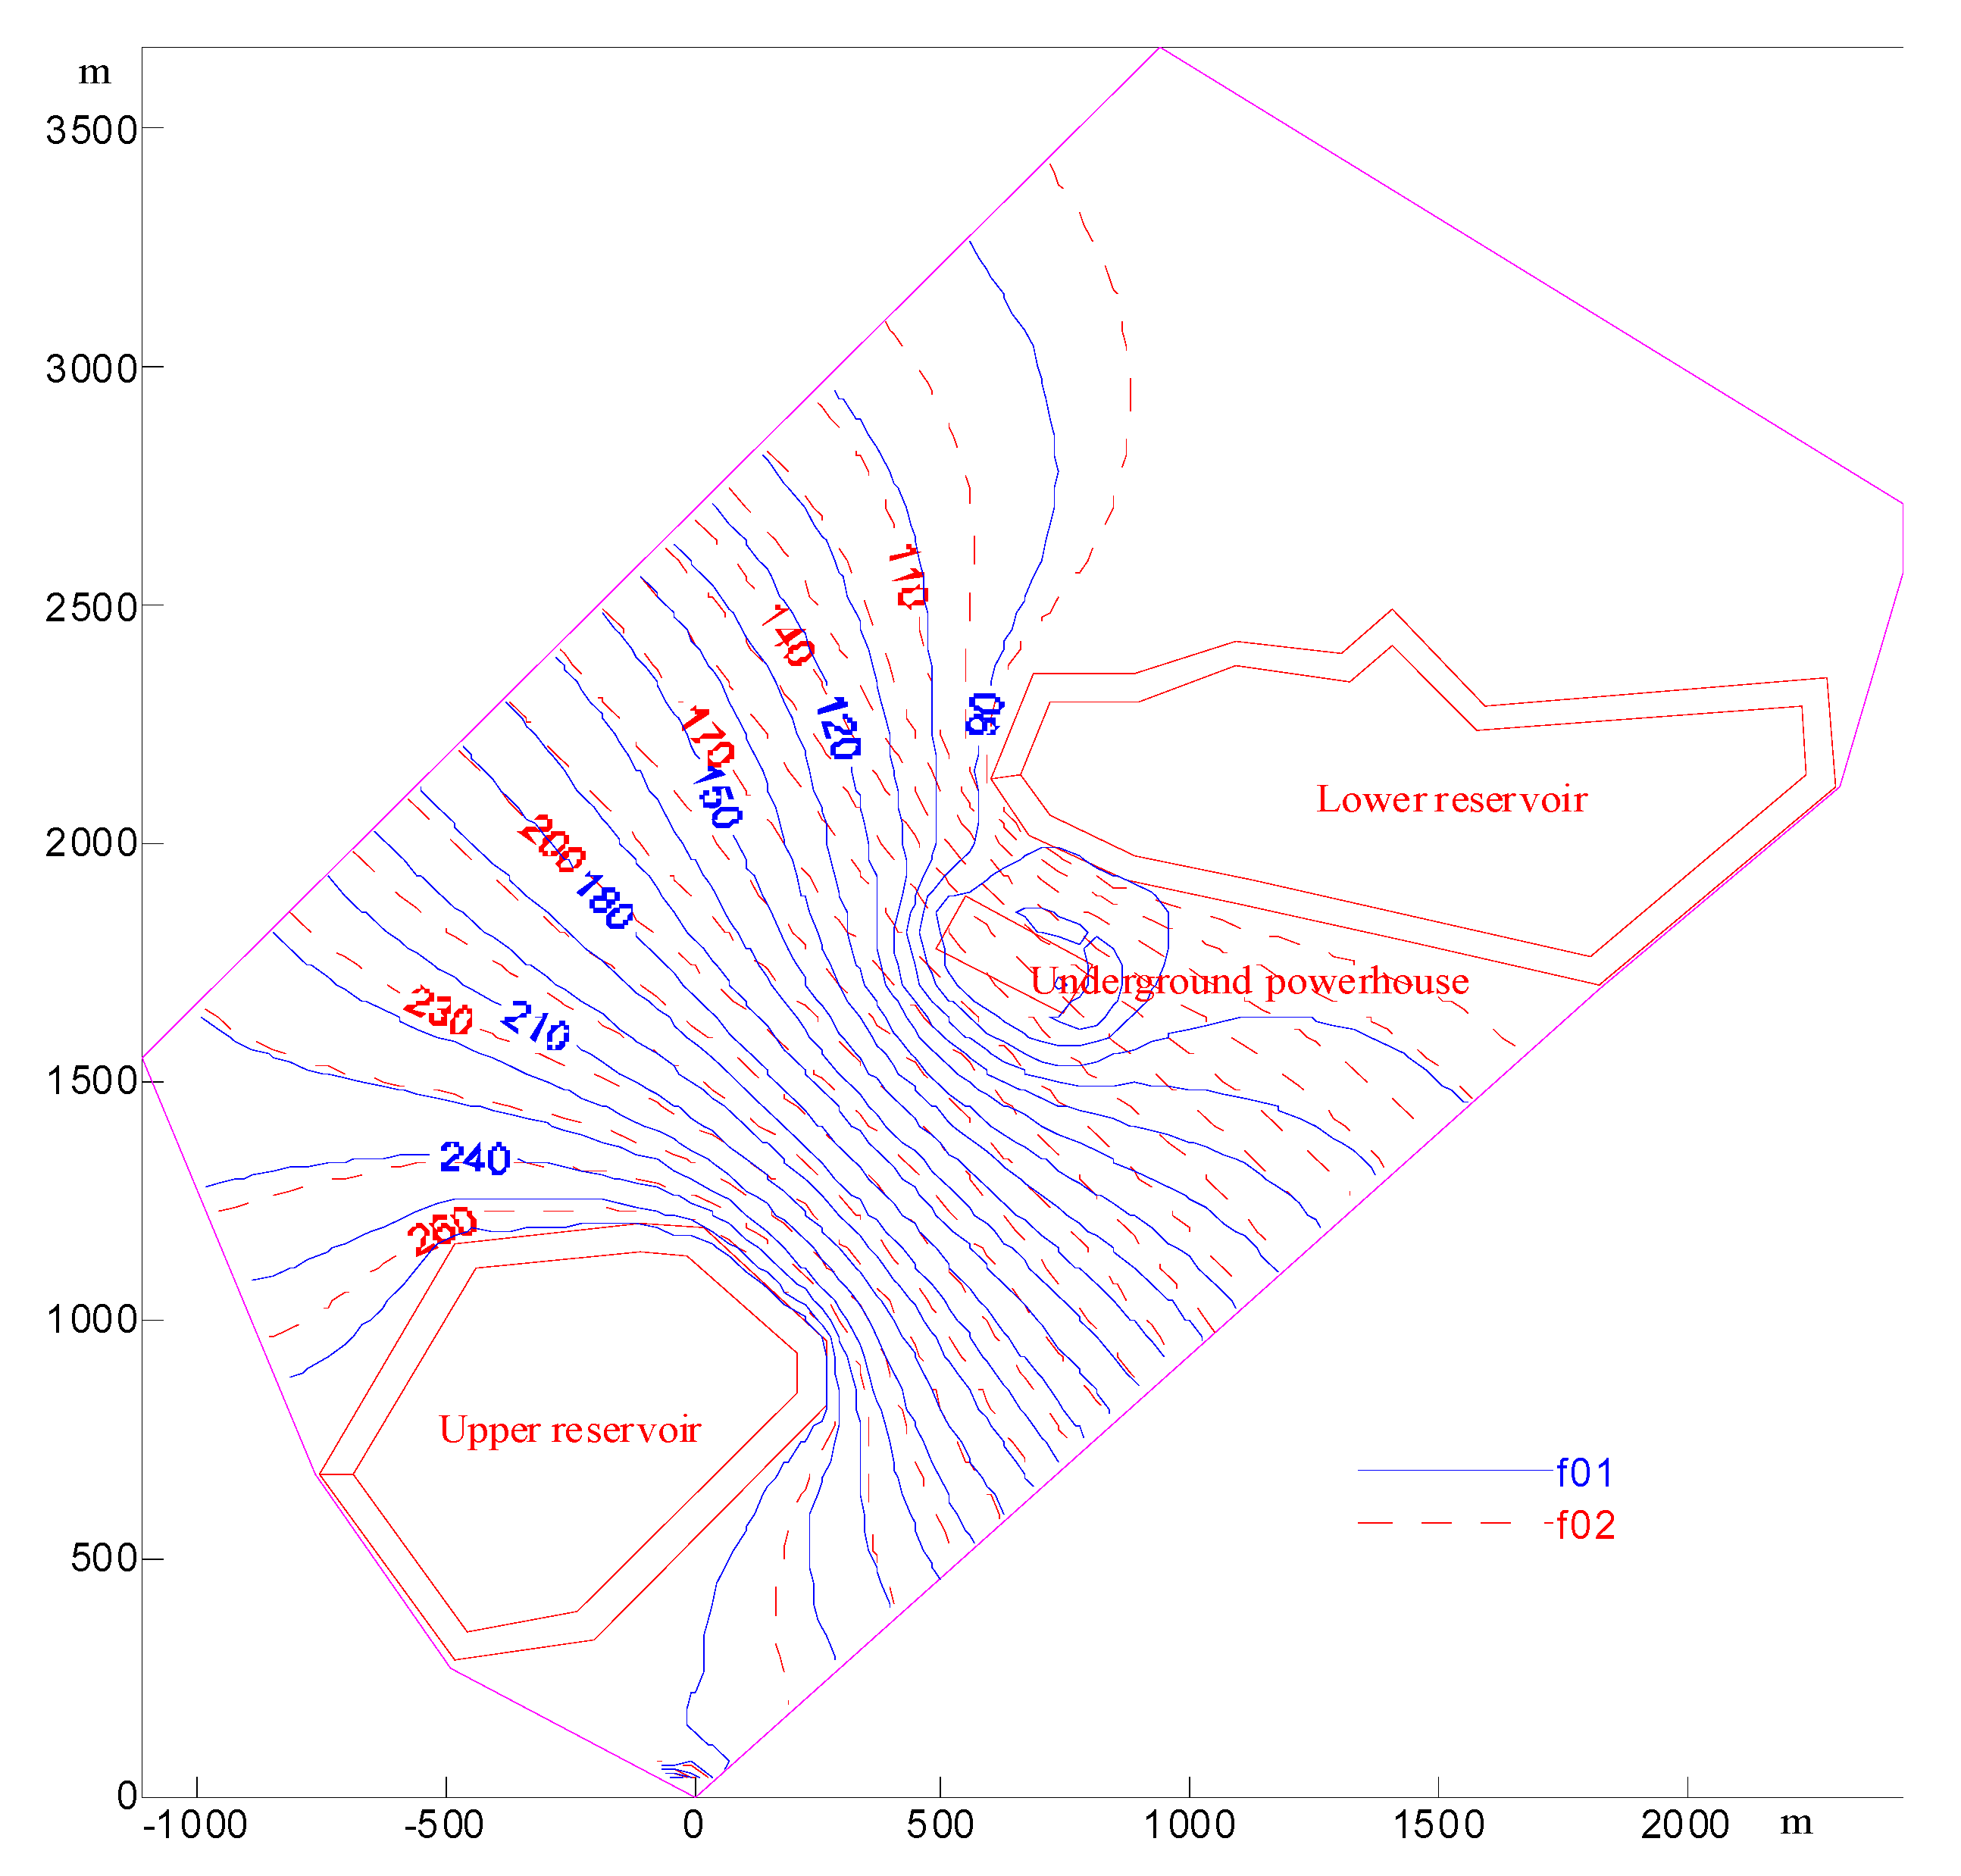
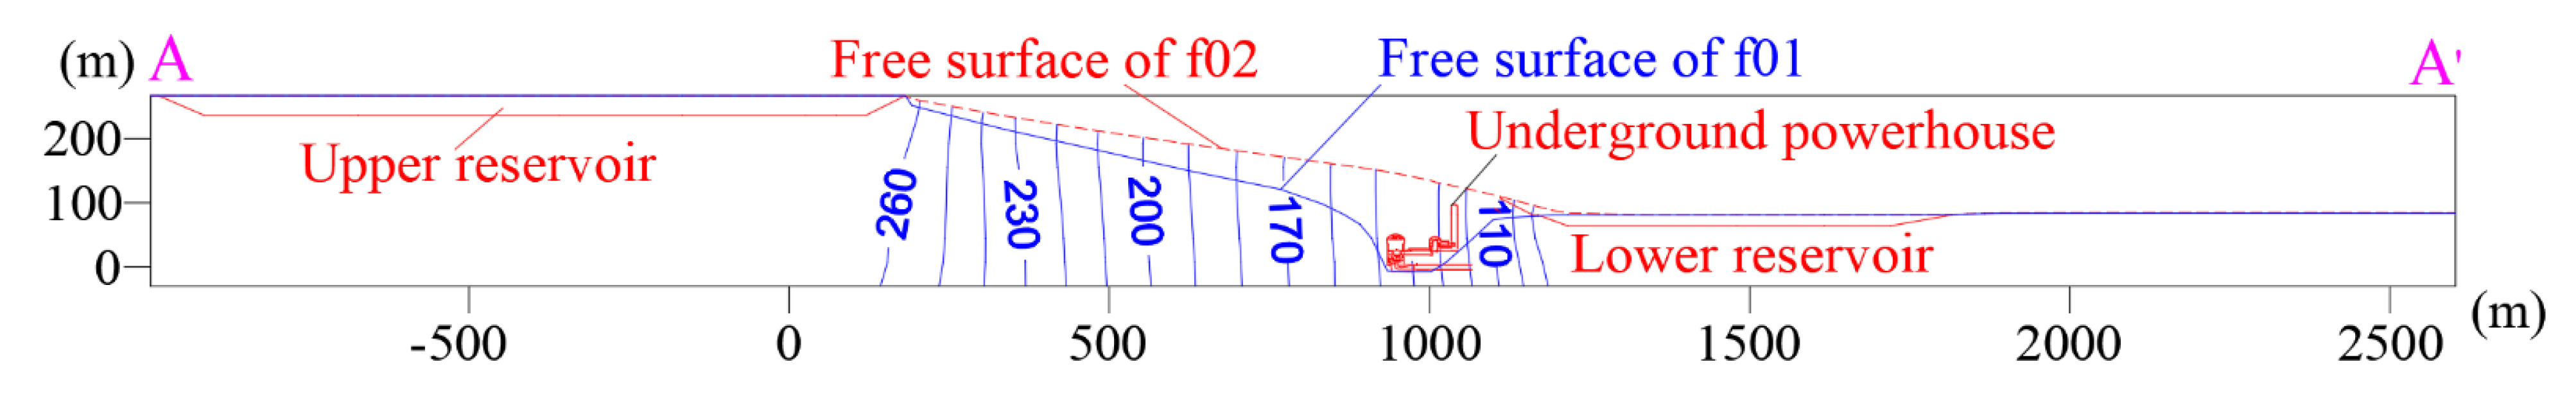
- Comparison of seepage fields in normal and natural conditions
Scheme f01 is the normal reservoir operation and effective anti-seepage of the upper and lower storage reservoirs and underground powerhouse as well as drainage. Scheme f02 does not consider any form of anti-seepage and drainage. It can be seen in Figure 9 that the groundwater level in front of the underground powerhouse under scheme f02 is about 130–160 m, about 80 m higher than under the drainage condition of scheme f01. In the underground powerhouse, the free surface of groundwater decreases globally due to the drainage of the underground powerhouse. The groundwater level is basically the same as the elevation of the bottom in the underground powerhouse (Figure 10) and shows that the drainage system of the underground powerhouse is effective. The hydraulic gradients for the upper and lower storage reservoirs and the underground powerhouse are calculated separately in Table 5. For scheme f02, the average hydraulic gradients are 0.0015, 0.1476 and 0.0036 for the upper storage reservoir, underground powerhouse and lower storage reservoir, respectively. For scheme f01, the hydraulic gradients are 0.2032, 0.3308 and 0.0019, respectively, with an increase in the hydraulic gradient due to the presence of the underground powerhouse drainage holes. It can be seen in Table 5 that the underground powerhouse has the largest hydraulic gradient, followed by the upper storage reservoir, and the lower storage reservoir has the smallest hydraulic gradient. Generally, the allowable hydraulic gradient of RCC dams is 1.5–2.5, and the allowable hydraulic gradient of the anti-seepage curtain can reach 3–4. It can be seen from Table 5 that the calculated maximum hydraulic gradient does not exceed 1, which indicates that during the operation of the reservoir, the seepage prevention curtain will not be damaged. These values are acceptable.
- (2)
- Leakage analysis
The leakage was calculated for the upper storage reservoir, underground powerhouse and lower storage reservoir under various schemes. The results are shown in Table 6. During normal operation of the reservoir, scheme f01, the leakage from the upper, underground powerhouse and lower storage reservoirs are 710.48 m3/d, 969.95 m3/d and 1657.55 m3/d, respectively. The underground powerhouse anti-seepage fails, that is, when the hydraulic conductivity of the impermeable curtain is taken to be the hydraulic conductivity of the underground powerhouse surrounding rock, the underground powerhouse leakage is 8571.72 m3/d, approximately 8.84 times that under normal anti-seepage conditions, indicating that the underground powerhouse anti-seepage system can effectively reduce the drainage of the underground powerhouse. If the leakage is too large, it will seriously affect the benefits of reservoir power generation, especially pumped storage power stations. The water in the upper reservoir is extremely precious, and an appropriate leakage is acceptable. For example, the leakage in the upper reservoir is 710.48 m3/d for f01; the leakage accounts for 0.4 ten thousandth of the total storage capacity in the upper reservoir, which is less than one ten thousandth, indicating that the leakage value of the upper reservoir is acceptable.
The failure of the underground powerhouse anti-seepage has no effect on the upper storage reservoir. The leakage of the lower storage reservoir slightly increases, mainly due to the drainage system of the lower reservoir being very close to the underground powerhouse. The failure of the upper storage reservoir anti-seepage, scheme f04, results in a larger increase in leakage from the upper storage reservoir, greater than 35.65 times that of the normal condition. Leakage in the underground powerhouse increases by 2 times, and leakage in the lower storage reservoir has basically no effect. When the lower storage reservoir anti-seepage fails, scheme f05, the leakage in the lower storage reservoir increases by 11.5 times, and the leakage in the underground powerhouse increases by approximately three times. The upper storage reservoir has basically no effect. Obviously, the anti-seepage of the lower storage reservoir has a greater impact on the leakage of the underground powerhouse than the upper storage reservoir.
When the upper storage reservoir is at a dead level of 239 m, the leakage in the upper storage reservoir is 241.03 m3/d, which is about three times less than when the storage level is 267 m. The leakage from the reservoir is positively correlated with the reservoir level, but the change in the upper storage reservoir level has little effect on the leakage in the underground powerhouse and lower storage reservoir. Therefore, even taking into account the failure of the anti-seepage, the change in water level in the upper storage reservoir mainly affects the leakage in the upper storage reservoir and has very little effect on the leakage in the underground powerhouse and lower storage reservoir. When the water level of the lower storage reservoir is the dead level of 65 m, the leakage of the lower storage reservoir is 1023.18 m3/d, reducing the leakage by about 640 m3/d, which is about 66.67% of the normal storage level of 81 m of scheme f01. Similarly, changes in the level of the lower storage reservoir have little effect on the leakage from the upper storage reservoir and the underground powerhouse, mainly affecting the leakage in the lower storage reservoir. Therefore, the impact of leakage in the underground powerhouse mainly comes from the upper storage reservoir, the lower storage reservoir and the underground powerhouse impermeable system, while changes in water levels in the upper and lower storage reservoirs have a minimal impact on the leakage in the underground powerhouse.
- (3)
- Curtain failure and parameter sensitivity analysis
The calculation schemes consider the failure of the impermeable curtain for the upper storage reservoir, the underground powerhouse and the lower storage reservoir separately, as well as simultaneous failures, mainly at 100%. It is impossible that the curtain will fail 100% during actual reservoir operation, so we also calculated a partial failure of the curtain, with the failure of hydraulic conductivity for the curtain calculated by the following equation:
where w% is the percentage of curtain failure. Curtain failures of 100%, 80%, 50%, 30%, 10% and 0% were considered. It can be seen from the phreatic water contour diagram that the seepage field remains largely unchanged compared to normal operating conditions after the partial or complete failure of the curtain in the underground powerhouse area, but the hydraulic gradient before and after the curtain decreases with curtain failure. Since the hydraulic head of water behind the curtain is mainly controlled by the drainage holes, even if the curtain fails, the seepage field will not change much, but the amount of water discharged through the drainage hole will increase greatly (Table 6). When the curtain of the upper reservoir fails by 30%, the flow rate increases by 94.5%, and when the curtain fails by 50%, the flow rate increases by 212.9%. When the underground powerhouse curtain fails by 30%, the flow rate increases by 79.7%, and when the curtain fails by 50%, the flow rate increases by 163.7%. When the curtain of the lower reservoir fails by 30%, the flow rate increases by 84%, and when the curtain fails by 50%, the flow rate increases by 177.1%. It can be seen that the curtain plays a very important role in reducing the flow into the drainage hole.
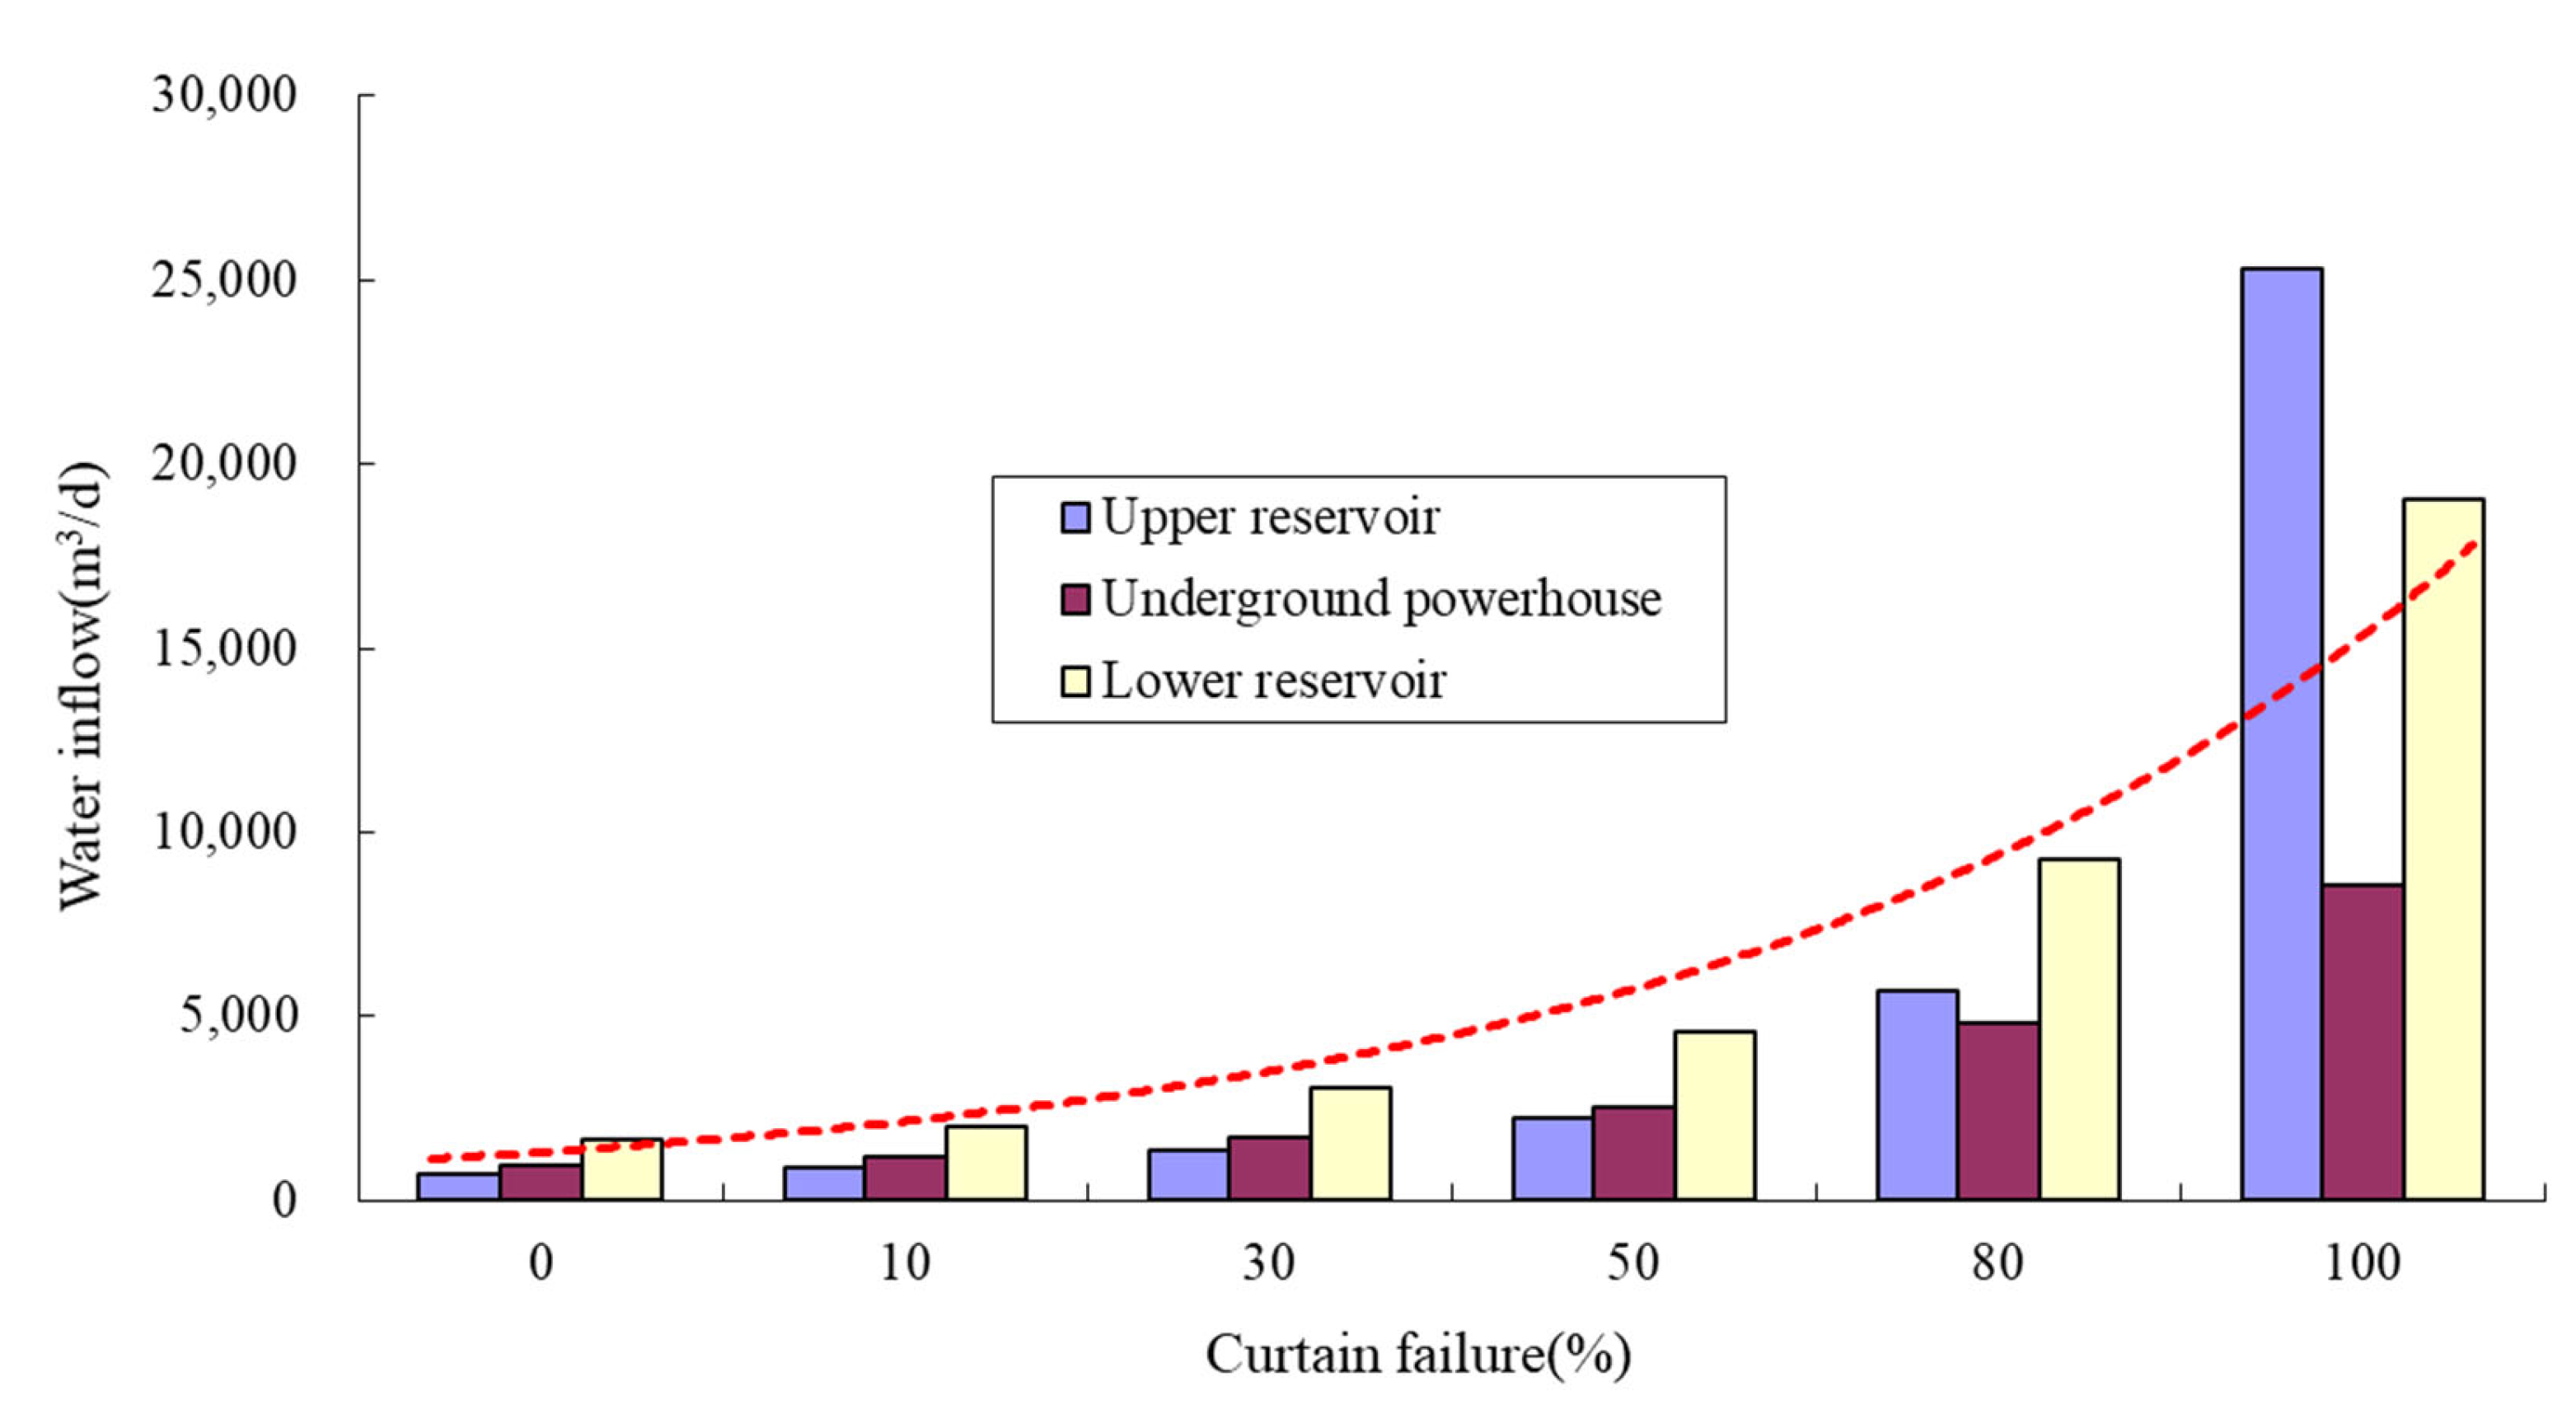
In addition, the leakage at the percentage of curtain failure was calculated (Figure 11). It can be seen from the figure that as the percentage of curtain failure increases, the leakage increases gradually, but not linearly, because the size of the curtain changes the size of the water level and thus affects the hydraulic gradient. For example, when the curtain of the underground powerhouse fails, the hydraulic gradient increases due to the presence of drainage. When the gradient of water flow in the upper and lower storage reservoirs decreases, the multiple of decrease of the hydraulic gradient is less than the multiple of increase in the curtain permeability coefficient. Therefore, the leakage increased. When the curtain fails by 10%, 30%, 50%, 80% and 100%, for the upper reservoir, the leakage increase is 1.24, 1.95, 3.13, 7.98 and 35.65 times, respectively. The leakage increase from the powerhouse is 1.22, 1.80, 2.64, 4.95 and 8.84 times, respectively. The increase in leakage of the lower reservoir is 1.22, 1.84, 2.77, 5.60 and 11.50 times, respectively. Owing to the important role of the anti-seepage curtain, during the construction of the hydropower station, it is recommended to strengthen the anti-seepage of each engineering site and conduct regular inspections to reinforce the failed anti-seepage curtain in time.
5. Conclusions
Through the analysis of hydrogeological conditions in the JPSHP and the results of 3D finite element simulation calculations of the seepage field, the following conclusions can be drawn:
- (1)
- The geological and hydrogeological conditions of the JPSHP determine that the permeability of the rock mass is macroscopically heterogeneous and anisotropic. The existence of carbonate and non-carbonate constitutes the heterogeneity of the medium. The coexistence of karst and fracture leads to the obvious anisotropy of the medium, and the weathering effect exacerbates the degree and complexity of the heterogeneous anisotropy of the medium. The rock is cut by faults and fractures to form an uneven fracture–karst aquifer. The permeability of the rock decreases with the increasing depth of burial and is stronger at the weathered and unloaded parts of the rock. The permeability of the rock is mainly controlled by the structural plane, and the vertical water permeability generally tends to be stronger than the horizontal water permeability. The fractures play the role of water conduction, and the joints in the lightly weathered and fresh rock mass mainly play the role of water storage.
- (2)
- A control inversion method for the structural plane of fractured rock mass is proposed. For the fractured rock mass, the larger scale faults and fractures are used as water-conducting media, and a relatively complete rock matrix is used as water-storage media. The statistical method is used to obtain the distribution function of the structural plane of the fractured rock mass in the study area and the statistical values of the spatial geometric parameters, so as to obtain the hydraulic conductivity tensor of the fractured rock mass.
- (3)
- The inversion results of the hydrogeological parameters of the JPSHP area reflect the characteristics of anisotropic permeability of the rock mass. The main permeability coefficient Kzz is the largest, followed by Kyy, and Kxx is the smallest, that is, the rock mass is permeable in the vertical direction. The permeability is obviously greater than the horizontal permeability, mainly because the dip angle of the structural plane is relatively steep, which is basically greater than the steep dip angle of 60°. The results of the parameter inversion are basically consistent with the structure of the rock mass and the development of structural planes in the power station area. Under the normal operating conditions of the reservoir, the leakage of the upper storage reservoir, underground powerhouse and lower storage reservoir were 710.48 m3/d, 969.95 m3/d and 1657.55 m3/d, respectively. When the powerhouse anti-seepage system fails, the powerhouse leakage rate is 8571.72 m3/d, which is about 8.84 times that of normal anti-seepage conditions, indicating that the powerhouse’s anti-seepage system can effectively reduce the powerhouse’s drainage volume. The calculation results show that the leakage of the powerhouse is mainly affected by the upper reservoir, the lower reservoir and the powerhouse’s anti-seepage system, while the change in the water level in the upper and lower reservoirs has little effect on the leakage of the underground powerhouse.
- (4)
- As the percentage of curtain failure increases, the leakage gradually increases. When the curtain fails by 10%, 30%, 50%, 80% and 100%, the increase in leakage in the upper storage reservoir is 1.24, 1.95, 3.13, 7.98 and 35.65 times, respectively. The increase in leakage in the underground powerhouse is 1.22, 1.80, 2.64, 4.95 and 8.84 times, respectively. The increase in leakage in the lower storage reservoir is 1.22, 1.84, 2.77, 5.60 and 11.50 times, respectively. Therefore, the seepage control of the upper and lower storage reservoirs and the underground powerhouse should be strengthened to avoid excessive leakage and to avoid affecting the operational efficiency of the reservoir.
Author Contributions
Conceptualization, K.M., Z.B. and Y.H. (Yong Huang); methodology, K.M. and Y.H. (Yong Huang); software, K.M. and Z.B.; validation, K.M. and Y.H. (Yong Huang); formal analysis, Y.H. (Yunlong Huang); investigation, Y.S.; resources, K.M. and Y.H. (Yunlong Huang); data curation, K.M.; writing—original draft preparation, K.M. and Z.B.; writing—review and editing, K.M.; visualization, K.M. and Y.H. (Yong Huang); supervision, Z.B.; project administration, Y.H. (Yong Huang); funding acquisition, Y.S. All authors have read and agreed to the published version of the manuscript.
Funding
This study was financially supported by the National Natural Science Foundation of China (Grant No. 41772235).
Institutional Review Board Statement
Not applicable.
Informed Consent Statement
Not applicable.
Data Availability Statement
The data that support the findings of this study are available on request from the corresponding author.
Conflicts of Interest
The authors declare no conflict of interest.
References
- Duffaut, P.; Larouzee, J. Geology, Engineering & Humanities: 3 sciences behind the Malpasset dam failure (France, 2 December 1959). Q. J. Eng. Geol. Hydrogeol. 2019, 52, 445–458. [Google Scholar]
- Duffaut, P. What modern rock mechanics owe to the Malpasset arch dam failure. In Proceedings of the 12th ISRM International Congress on Rock Mechanics, Beijing, China, 18–21 October 2011. [Google Scholar]
- Ma, J.; Lu, C.H.; Wu, J.C.; Luo, J. A method for improving the fresh groundwater storage of oceanic islands. Hydrogeol. Eng. Geol. 2020, 47, 1–7. [Google Scholar]
- Xu, J.P.; Chen, M.Y.; Hong, H.; Xu, X.Q.; Liu, B. Differences of hydraulic conductivities from pumping and draining tests with intensity effects. J. Hydrol. 2019, 579, 124165. [Google Scholar] [CrossRef]
- Zhang, B.C.; Hu, C.; Chen, G.; Zhang, X.; Duan, D.D. Method of evaluating the permeability of rock mass by the combination of packer test and flowing fluid electrical conductivity log. Hydrogeol. Eng. Geol. 2019, 46, 62–69. [Google Scholar]
- Chen, Y.F.; Hu, S.H.; Hu, R.; Zhou, C.B. Estimating hydraulic conductivity of fractured rocks from high-pressure packer tests with an Izbash’s law-based empirical model. Water Resour. Res. 2015, 51, 2096–2118. [Google Scholar] [CrossRef]
- Chen, Y.F.; Liu, M.M.; Hu, S.H.; Zhou, C.B. Non-Darcy’s law-based analytical models for data interpretation of high-pressure packer tests in fractured rocks. Eng. Geol. 2015, 199, 91–106. [Google Scholar] [CrossRef]
- Du, X.; Zeng, Y.W.; Tang, D.Y. Research on permeability coefficient of rockmass based on underwater pumping test and its application. Chin. J. Rock Mech. Eng. 2010, 29, 3542–3548. [Google Scholar]
- Quinn, P.M.; Parker, B.L.; Cherry, J.A. Using constant head step tests to determine hydraulic apertures in fractured rock. J. Contam. Hydrol. 2011, 126, 85–99. [Google Scholar] [CrossRef] [PubMed]
- Sun, J.P.; Zhao, Z.Y. Effects of anisotropic permeability of fractured rock masses on underground oil storage caverns. Tunn. Undergr. Space Technol. 2010, 25, 629–637. [Google Scholar] [CrossRef]
- Hu, C.; Chen, H.L.; Chen, G.; Liu, J.H. Detection of low-efficiency zones of water curtain system for underground LPG storage by a discrete fracture network model. Environ. Earth Sci. 2019, 78, 11. [Google Scholar] [CrossRef]
- Fan, G.C.; Zhong, D.H.; Ren, B.Y.; Wu, H.; Li, X.C. Research on the relationship between cement take and transmissivity of fractured rocks under dam foundation based on fractal theory. J. Hydraul. Eng. 2017, 48, 576–587. [Google Scholar]
- Illman, W.A. Strong field evidence of directional permeability scale effect in fractured rock. J. Hydrol. 2006, 319, 227–236. [Google Scholar] [CrossRef]
- Achtziger-Zupančič, P.; Loew, S.; Mariéthoz, G. A new global database to improve predictions of permeability distribution in crystalline rocks at site scale. J. Geophys. Res. Solid Earth. 2017, 122, 3513–3539. [Google Scholar] [CrossRef]
- Zhou, J.Q.; Wang, M.; Wang, L.C.; Chen, Y.F.; Zhou, C.B. Emergence of Nonlinear Laminar Flow in Fractures during Shear. Rock Mech. Rock Eng. 2018, 51, 3635–3643. [Google Scholar] [CrossRef]
- Black, J.H. Flow and flow mechanisms in crystalline rock. Geol. Soc. 1987, 34, 185–200. [Google Scholar] [CrossRef]
- Wei, Z.Q.; Egger, P.; Descoeudres, F. Permeability predictions for jointed rock masses. Int. J. Rock Mech. Min. Sci. 1995, 32, 251–261. [Google Scholar] [CrossRef]
- Chen, Y.F.; Ling, X.M.; Liu, M.M.; Hu, R.; Yang, Z.B. Statistical distribution of hydraulic conductivity of rocks in deep-incised valleys, Southwest China. J. Hydrol. 2018, 566, 216–226. [Google Scholar] [CrossRef]
- Hsu, S.M.; Chung, M.C.; Cheng, Y.k. A rock mass classification scheme for estimating hydraulic conductivity of fractured rocks. In Proceedings of the Characterization, Monitoring, and Modeling of GeoSystems, New Orleans, LA, USA, 9–12 March 2008. [Google Scholar]
- Ku, C.Y.; Hsu, S.M.; Chiou, L.B.; Lin, G.F. An empirical model for estimating hydraulic conductivity of highly disturbed clastic sedimentary rocks in Taiwan. Eng. Geol. 2009, 109, 213–223. [Google Scholar] [CrossRef]
- Song, K.; Yan, E.C.; Chen, G. Hydraulic conductivity estimation of rockmass in water sealed underground storage caverns. Chin. J. Rock Mech. Eng. 2014, 33, 575–580. [Google Scholar]
- Chen, J.; Liu, M.M.; Li, X.; Chen, Y.F.; Zhou, C.B. A geological indexes-based empirical model for estimation of permeability coefficient in fractured rock mass. Rock Soil Mech. 2016, 37, 1706–1714. [Google Scholar]
- Wang, W.; Qian, J.Z.; Ma, L.; Wang, D.J.; Ma, H.C.; Zhao, W.D. A model for estimating hydraulic conductivity of fractured rock mass based on correlation indexes. Hydrogeol. Eng. Geol. 2021, 48, 82–89. [Google Scholar]
- Du, Z.L.; Lin, F.; Sun, C.; Li, J.; Su, L.J. Experimental study on failure mechanism of marble under high water pressure. J. Eng. Geol. 2015, 23, 695–699. [Google Scholar]
- Huang, Y.; Zhou, Z.F.; Fu, S.; Hu, D.K.; Li, S.G. Study on variation of rock mass permeability with high pressure permeability test. J. Eng. Geol. 2013, 21, 828–834. [Google Scholar]
- Wu, J.L.; He, J.; Chen, S.H. Estimation of representative elementary and three-dimensional permeability tensor for fractured rock masses. Chin. J. Rock Mech. Eng. 2014, 33, 309–316. [Google Scholar]
- Rong, G.; Zhou, C.B.; Wang, E.Z. Preliminary study on permeability tensor calculation of fractured rock mass and its representative elementary volume. Chin. J. Rock Mech. Eng. 2007, 26, 740–746. [Google Scholar]
- Chen, Y.F.; Hong, J.M.; Zheng, H.K.; Li, Y.; Hu, R.; Zhou, C.B. Evaluation of Groundwater Leakage into a Drainage Tunnel in Jinping-I Arch Dam Foundation in Southwestern China: A Case Study. Rock Mech. Rock Eng. 2016, 49, 961–979. [Google Scholar] [CrossRef]
- Wang, Y.; Liu, J. Inverse analysis fully coupled dynamic water flow and stress in fractured rock masses. Chin. J. Rock Mech. Eng. 2008, 27, 1652–1658. [Google Scholar]
- Neuman, S.P. Trends, prospects and challenges in quantifying flow and transport through fractured rocks. Hydrogeol. J. 2005, 13, 124–147. [Google Scholar] [CrossRef]
- Allen, D.M.; Michel, F.A. Evaluation of multi-well test data in a faulted aquifer using linear and radial flow models. Groundwater 1998, 36, 938–948. [Google Scholar] [CrossRef]
- Ioannis, K.; James, M.; Christopher, R. Fundamentals of Finite Element Analysis: Linear Finite Element Analysis, 1st ed.; John Wiley & Sons Ltd.: Hoboken, NJ, USA, 2018; p. 209. [Google Scholar]
Figure 1.
Location of study area.

Figure 2.
Water convey system.

Figure 3.
Rose diagram of discontinuous surfaces in study area.

Figure 4.
Typical unit diagram of drainage hole treatment.

Figure 5.
Simplified diagram of cross-section flow calculation.

Figure 6.
Diagram of computational domain and boundary conditions.

Figure 7.
Fitting curves between observed and calculated groundwater levels. (a) ZK1 and ZK2. (b) ZK7 and ZK11. (c) ZK14 and ZK19.
Figure 7.
Fitting curves between observed and calculated groundwater levels. (a) ZK1 and ZK2. (b) ZK7 and ZK11. (c) ZK14 and ZK19.


Figure 8.
Mesh map of the study area.

Figure 9.
Contrast of groundwater level contours for schemes f01 and f02.

Figure 10.
Contrast of free surface contours for schemes f01 and f02.

Figure 11.
Relationships between water flow of the upper, lower storage reservoirs and powerhouses with the change of the curtain failure.
Figure 11.
Relationships between water flow of the upper, lower storage reservoirs and powerhouses with the change of the curtain failure.


Table 1.
Statistical average values of structural plane in JPSHP.
| Fracture Groups | Fracture Orientation | Strike (°) | Dip Direction (°) | Dip Angle (°) |
|---|---|---|---|---|
| 1 | NEE | 68 | 158 | 60 |
| 2 | NNW | 338 | 68 | 75 |
| 3 | NW | 320 | 50 | 78 |
| 4 | NWW | 298 | 28 | 82 |
Table 2.
Fitting parameters for the observed and calculated water levels in boreholes on 12 January 2004.
Table 2.
Fitting parameters for the observed and calculated water levels in boreholes on 12 January 2004.
| Serial Number | Hole Number | Calculated Water Level (m) | Observed Water Level (m) | Relative Error Value (%) | Weight Function Value |
|---|---|---|---|---|---|
| Hc | Ho | DH = (Ho − Hc)/Ho | ωk | ||
| 1 | ZK1 | 232.5 | 232.25 | −0.11 | 0.173 |
| 2 | ZK2 | 144.01 | 143.93 | −0.06 | 0.376 |
| 3 | ZK7 | 165.64 | 167.72 | 1.24 | 0.118 |
| 4 | ZK11 | 105.53 | 107.20 | 1.56 | 0.046 |
| 5 | ZK14 | 130.25 | 132.23 | 1.50 | 0.036 |
| 6 | ZK19 | 182.26 | 181.19 | −0.59 | 0.063 |
| 7 | ZK23 | 91.62 | 92.35 | 0.79 | 0.115 |
| 8 | ZK24 | 73.62 | 74.62 | 1.34 | 0.073 |
Table 3.
Inverse values of main hydraulic conductivity and main direction of rock mass.
| Rock Partitions or Zones | I | II | III | |||||||
|---|---|---|---|---|---|---|---|---|---|---|
| Main Hydraulic Conductivity (m/d) | Kxx | Kyy | Kzz | Kxx | Kyy | Kzz | Kxx | Kyy | Kzz | |
| 0.153 | 0.369 | 0.514 | 0.082 | 0.020 | 0.274 | 0.031 | 0.074 | 0.103 | ||
| Main direction | cosα1 | 0.59 | −0.80 | −0.12 | 0.90 | −0.43 | 0.05 | 0.96 | −0.06 | 0.28 |
| cosα2 | 0.74 | 0.46 | 0.49 | 0.34 | 0.78 | 0.53 | −0.04 | 0.95 | 0.33 | |
| cosα3 | −0.34 | −0.38 | 0.86 | −0.026 | −0.46 | 0.85 | −0.29 | −0.32 | 0.90 | |
| Mean (m/d) | 0.308 | 0.164 | 0.062 | |||||||
Table 4.
Calculation schemes for groundwater 3D seepage field.
| Reservoir Levels | Schemes | Brief Description of Working Conditions | Anti-Seepage of the Upper Storage Reservoir | Anti-Seepage of Underground Powerhouse | Drainage System of Underground Powerhouse | Anti-Seepage of the Lower Storage Reservoir |
|---|---|---|---|---|---|---|
| Storage level of the upper reservoir: 267 m Storage level of the lower reservoir: 81 m | f01 | Normal operation | Normal | Normal | Normal | Normal |
| f02 | Natural condition | Not considered | Not considered | Not considered | Not considered | |
| f03 | Anti-seepage failure of underground powerhouse | Normal | Failure | Normal | Normal | |
| f04 | Anti-seepage failure of the upper storage reservoir | Failure | Normal | Normal | Normal | |
| f05 | Anti-seepage failure of the lower storage reservoir | Normal | Normal | Normal | Failure | |
| f06 | Anti-seepage failure at all parts | Failure | Failure | Normal | Failure |
Table 5.
Statistical results of hydraulic gradient.
| Reservoir Levels | Schemes | Brief Description of Working Conditions | Average Hydraulic Gradient of the Upper Storage Reservoir | Average Hydraulic Gradient of Underground Powerhouse | Average Hydraulic Gradient of the Lower Storage Reservoir |
|---|---|---|---|---|---|
| Storage level of the upper reservoir: 267 m Storage level of the lower reservoir: 81 m | f01 | Normal operation | 0.2032 | 0.3308 | 0.0019 |
| f02 | Natural condition | 0.0015 | 0.1476 | 0.0036 | |
| f03 | Anti-seepage failure of underground powerhouse | 0.2031 | 0.7437 | 0.0022 | |
| f04 | Anti-seepage failure of the upper storage reservoir | 0.0021 | 0.3327 | 0.0019 | |
| f05 | Anti-seepage failure of the lower storage reservoir | 0.2032 | 0.3380 | 0.0009 | |
| f06 | Anti-seepage failure at all parts | 0.0022 | 0.7509 | 0.0011 |
Table 6.
Statistical results of leakage calculation.
| Reservoir Levels | Schemes | Brief Description of Working Conditions | Leakage of the Upper Storage Reservoir (m3/d) | Leakage of Underground Powerhouse (m3/d) | Leakage of the Lower Storage Reservoir Leakage (m3/d) |
|---|---|---|---|---|---|
| Storage level of the upper reservoir: 267 m Storage level of the lower reservoir: 81 m | f01 | Normal operation | 710.48 | 969.95 | 1657.55 |
| f02 | Natural condition | — | — | — | |
| f03 | Anti-seepage failure of underground powerhouse | 710.15 | 8571.72 | 1724.44 | |
| f04 | Anti-seepage failure of the upper storage reservoir | 25,289.55 | 1912.99 | 1717.60 | |
| f05 | Anti-seepage failure of the lower storage reservoir | 710.45 | 2582.71 | 19,061.83 | |
| f06 | Anti-seepage failure at all parts | 25,289.55 | 11,127.52 | 19,061.83 |
Publisher’s Note: MDPI stays neutral with regard to jurisdictional claims in published maps and institutional affiliations. |
© 2022 by the authors. Licensee MDPI, Basel, Switzerland. This article is an open access article distributed under the terms and conditions of the Creative Commons Attribution (CC BY) license (https://creativecommons.org/licenses/by/4.0/).
Share and Cite
MDPI and ACS Style
Miao, K.; Bai, Z.; Huang, Y.; Huang, Y.; Su, Y. Research on Seepage Control of Jurong Pumped Storage Hydroelectric Power Station. Water 2022, 14, 141. https://doi.org/10.3390/w14020141
AMA Style
Miao K, Bai Z, Huang Y, Huang Y, Su Y. Research on Seepage Control of Jurong Pumped Storage Hydroelectric Power Station. Water. 2022; 14(2):141. https://doi.org/10.3390/w14020141
Chicago/Turabian StyleMiao, Kehan, Zhenglin Bai, Yong Huang, Yunlong Huang, and Yue Su. 2022. "Research on Seepage Control of Jurong Pumped Storage Hydroelectric Power Station" Water 14, no. 2: 141. https://doi.org/10.3390/w14020141
Note that from the first issue of 2016, this journal uses article numbers instead of page numbers. See further details here.