Article

Assessment of PERSIANN-CCS, PERSIANN-CDR, SM2RAIN-ASCAT, and CHIRPS-2.0 Rainfall Products over a Semi-Arid Subtropical Climatic Region

by
Muhammad Naveed Anjum
1,2,
Muhammad Irfan
3,
Muhammad Waseem
4,
Megersa Kebede Leta
5,*,
Usama Muhammad Niazi
6,
Saif ur Rahman
3,
Abdulnoor Ghanim
7,
Muhammad Ahsan Mukhtar
8 and
Muhammad Umer Nadeem
1
1
Department of Land and Water Conservation Engineering, Faculty of Agricultural Engineering and Technology, PMAS-Arid Agriculture University, Rawalpindi 46000, Pakistan
2
Data Driven Smart Decision Platform, PMAS-Arid Agriculture University, Rawalpindi 46000, Pakistan
3
Electrical Engineering Department, College of Engineering, Najran University Saudi Arabia, Najran 61441, Saudi Arabia
4
Department of Civil Engineering, Ghulam Ishaq Khan Institute of Engineering and Technology, Topi 23460, Pakistan
5
Faculty of Agriculture and Environmental Sciences, University of Rostock, 18059 Rostock, Germany
6
Department of Mechanical Engineering Technology, National Skills University, Islamabad 44000, Pakistan
7
Department of Civil Engineering, College of Engineering, Najran University Saudi Arabia, Najran 61441, Saudi Arabia
8
Northwest Institute of Eco-Environment and Resources, Chinese Academy of Sciences, Lanzhou 730000, China
*
Author to whom correspondence should be addressed.
Water 2022, 14(2), 147; https://doi.org/10.3390/w14020147
Submission received: 7 November 2021 / Revised: 19 December 2021 / Accepted: 31 December 2021 / Published: 7 January 2022
(This article belongs to the Section Hydrology)

Abstract

:
This study compares the performance of four satellite-based rainfall products (SRPs) (PERSIANN-CCS, PERSIANN-CDR, SM2RAIN-ASCAT, and CHIRPS-2.0) in a semi-arid subtropical region. As a case study, Punjab Province of Pakistan was considered for this assessment. Using observations from in-situ meteorological stations, the uncertainty in daily, monthly, seasonal, and annual rainfall estimates of SRPs at pixel and regional scales during 2010–2018 were examined. Several evaluation indices (Correlation Coefficient (CC), Root Mean Square Error (RMSE), Bias, and relative Bias (rBias), as well as categorical indices (Probability of Detection (POD), Critical Success Index (CSI), and False Alarm Ration (FAR)) were used to assess the performance of the SRPs. The following findings were found: (1) CHIRPS-2.0 and SM2RAIN-ASCAT products were capable of tracking the spatiotemporal variability of observed rainfall, (2) all SRPs had higher overall performances in the northwestern parts of the province than the other parts, (3) all SRP estimates were in better agreement with ground-based monthly observations than daily records, and (4) on the seasonal scale, CHIRPS-2.0 and SM2RAIN-ASCAT were better than PERSIANN-CCS and PERSIANN. In all seasons, CHIRPS-2.0 and SM2RAIN-ASCAT outperformed PERSIANN-CCS and PERSIANN-CDR. Based on our findings, we recommend that hydrometeorological investigations in Pakistan’s Punjab Province employ monthly estimates of CHIRPS-2.0 and SM2RAIN-ASCAT products.

1. Introduction

Rainfall is critical for dryland agriculture, domestic water supply, groundwater recharge, and the overall health of the ecosystem of any region. As a consequence of the ongoing global warming, the amount, intensity, and spatial–temporal rainfall patterns have all changed worldwide [1,2]. In turn, these shifts have had altered the water budgets of various geographical regions. The availability of accurate rainfall records is essential for researchers and other data users who need to quantify global and regional variations in rainfall and a variety of different uses. Generally, ground-based rainfall measurement instruments such as rain gauges and radars are considered as reliable data sources for rainfall estimation [3,4,5]. Although ground-based instruments are available in certain developed countries, their unavailability or scarcity in developing countries causes ambiguities in the measurements of rainfall quantities and intensities.
Recent advancements in satellite-mounted rainfall detection sensors and data retrieval algorithms have enabled researchers and other data users to utilize rainfall data at fine spatial and temporal scales. The satellite-based rainfall products (SRPs) can provide continuous information on rainfall’s occurrence, intensity, and quantity [6,7]. Generally, these SRPs provide rainfall estimates based on data from passive microwave (MW) sensors, infrared (IR) sensors, or a combination of the two datasets. The satellite-based data retrieval algorithms can estimate the amount of rainfall using cloud top temperature data and the atmosphere’s moisture content. The data is acquired by infrared sensors mounted on the satellites in the GEO (geosynchronous orbit). The algorithms used to retrieve rainfall rates from satellites in low Earth Orbit (LEO) can estimate rainfall rates based on the atmospheric constituent and cloud profiles information obtained from the passive microwave sensors mounted on the satellites. It is common practice to combine the estimates acquired from the IR sensors (which have fine spatial and temporal resolutions) and MW sensors (which have higher precision and have a good association with rainfall rates) to provide more accurate information about rainfall events. Many SRPs have been developed as a result of the combination of datasets obtained from the infrared and microwave sensors. Such products include Precipitation Estimation from Remotely Sensed Information using Artificial Neural Networks (PERSIANN), Climate Hazards Group Infra Red Precipitation with Station data (CHIRPS), Soil Moisture to Rain from the Advanced SCATterometer (ASCAT), Climate Prediction Center Morphing (CMORPH), and Multi-satellitE Retrievals for Global Precipitation Measurement (IMERG).
SM2Rain-ASCAT is a latest global precipitation product created using the SM2RAIN algorithm and Advanced SCATterometer (ASCAT) satellite soil moisture data (Brocca et al. 2019). Since 2006, ASCAT has been onboard the Metop satellite, which functions in the C-band (5.255 GHz). This sensor’s soil moisture values are associated with a depth of approximately 2cm of soil and obtained using the change detection method proposed by Bartalis et al. [8]. Brocca et al. [9] proposed the SM2RAIN algorithm, which is based on the inverse solution of the soil water balance equation and allows rainfall to be calculated using in situ or satellite-based soil moisture as input. The primary premise of this method is that precipitation is measured using the soil as a natural rain gauge. CHIRPS (Climate Hazards Group Infra Red Precipitation with Station data) is a product of the Climate Hazards Group at the University of California, Berkeley, USA. The estimations for CHIRPS were derived from the combination of three forms of information: satellite estimates, global climatology, and gauge data. From 1981 to the present, CHIRPS offers precipitation records with a spatial resolution of 0.05°. This quasi-global rainfall product is based on infrared estimates that have been rectified with 5-day gauge information. PERSIANN-CCS and PERSIANN-CDR provide near real-time and post real-time precipitation estimations, respectively. Both products have been freely available since 2003 and since 1983, respectively. The uses of these two types of datasets are quite distinct from one another. Rainfall products that are provided in near real time are intended to fulfill the demands of decision-makers, and they are frequently used in hydrological modeling and drought monitoring [10]. As opposed to near-real-time precipitation products, post-real-time precipitation products are designed to be used in hydrological and climate studies that require long-term consistent data, such as trend or risk analysis [11].
Despite the fact that these most recent global SRPs are freely available at precise spatial and temporal resolutions, their performance differs from one location to the next across the globe [12,13]. The literature review revealed that the performance evaluation of SRPs is essential before their direct application in any region [7,14,15,16]. In this regard, several researchers have evaluated the accuracy of different SRPs in several countries—for instance, in America [17], Brazil [18], China [19,20,21], Italy [22], Iran [23], Malaysia [24], Pakistan [14], Taiwan [25], and Saudi Arabia [26]. Huang et al. [25] assessed the error characteristics of PERSIANN family products in the whole of Taiwan and concluded that all products underestimated the rainfall amount over most parts of the country. On the other hand, Mosaffa et al. [27] advised that the PERSIANN product could be used to better understand the spatial and temporal variabilities of rainfall in Iran. Hamza et al. [14] analyzed the accuracy of IMERG-V06 and TRMM-3B42V7 products and recommended the use of IMERG product for understanding the spatial and temporal variabilities of monthly rainfall over the mountainous regions of Pakistan. Although there have been some studies that have assessed the accuracies of TRMM, IMERG, PERSIANN, SM2Rain, and CMORPH products in Pakistan, recently developed SRPs (PERSIANN-CCS, PERSIANN-CDR, SM2Rain-ASCAT, and CHIRPS-2.0) have not yet been evaluated in terms of error characteristics and accuracy, particularly in the fertile plains of Punjab Province. Based on a thorough review of the available literature, it was discovered that the shortage of on-site meteorological stations in the Punjab Province of Pakistan made it difficult to use their data for a variety of agricultural, hydrometeorological, and ecological purposes [1,28]. Therefore, this study was conducted to analyze and compare the error characteristics of recently developed SRPs (CHIRPS-2.0, PERSIANN-CCS, PERSIANN-CDR, and SM2RAIN-ASCAT) using observations from weather stations in Pakistan’s Punjab Province. This is the first systematic examination of considered SRPs over the Punjab plains, and it makes use of all accessible in situ gauges data. The present study’s findings will be useful to algorithm developers for the satellite products under consideration and data consumers of SRPs.

2. Materials and Methods
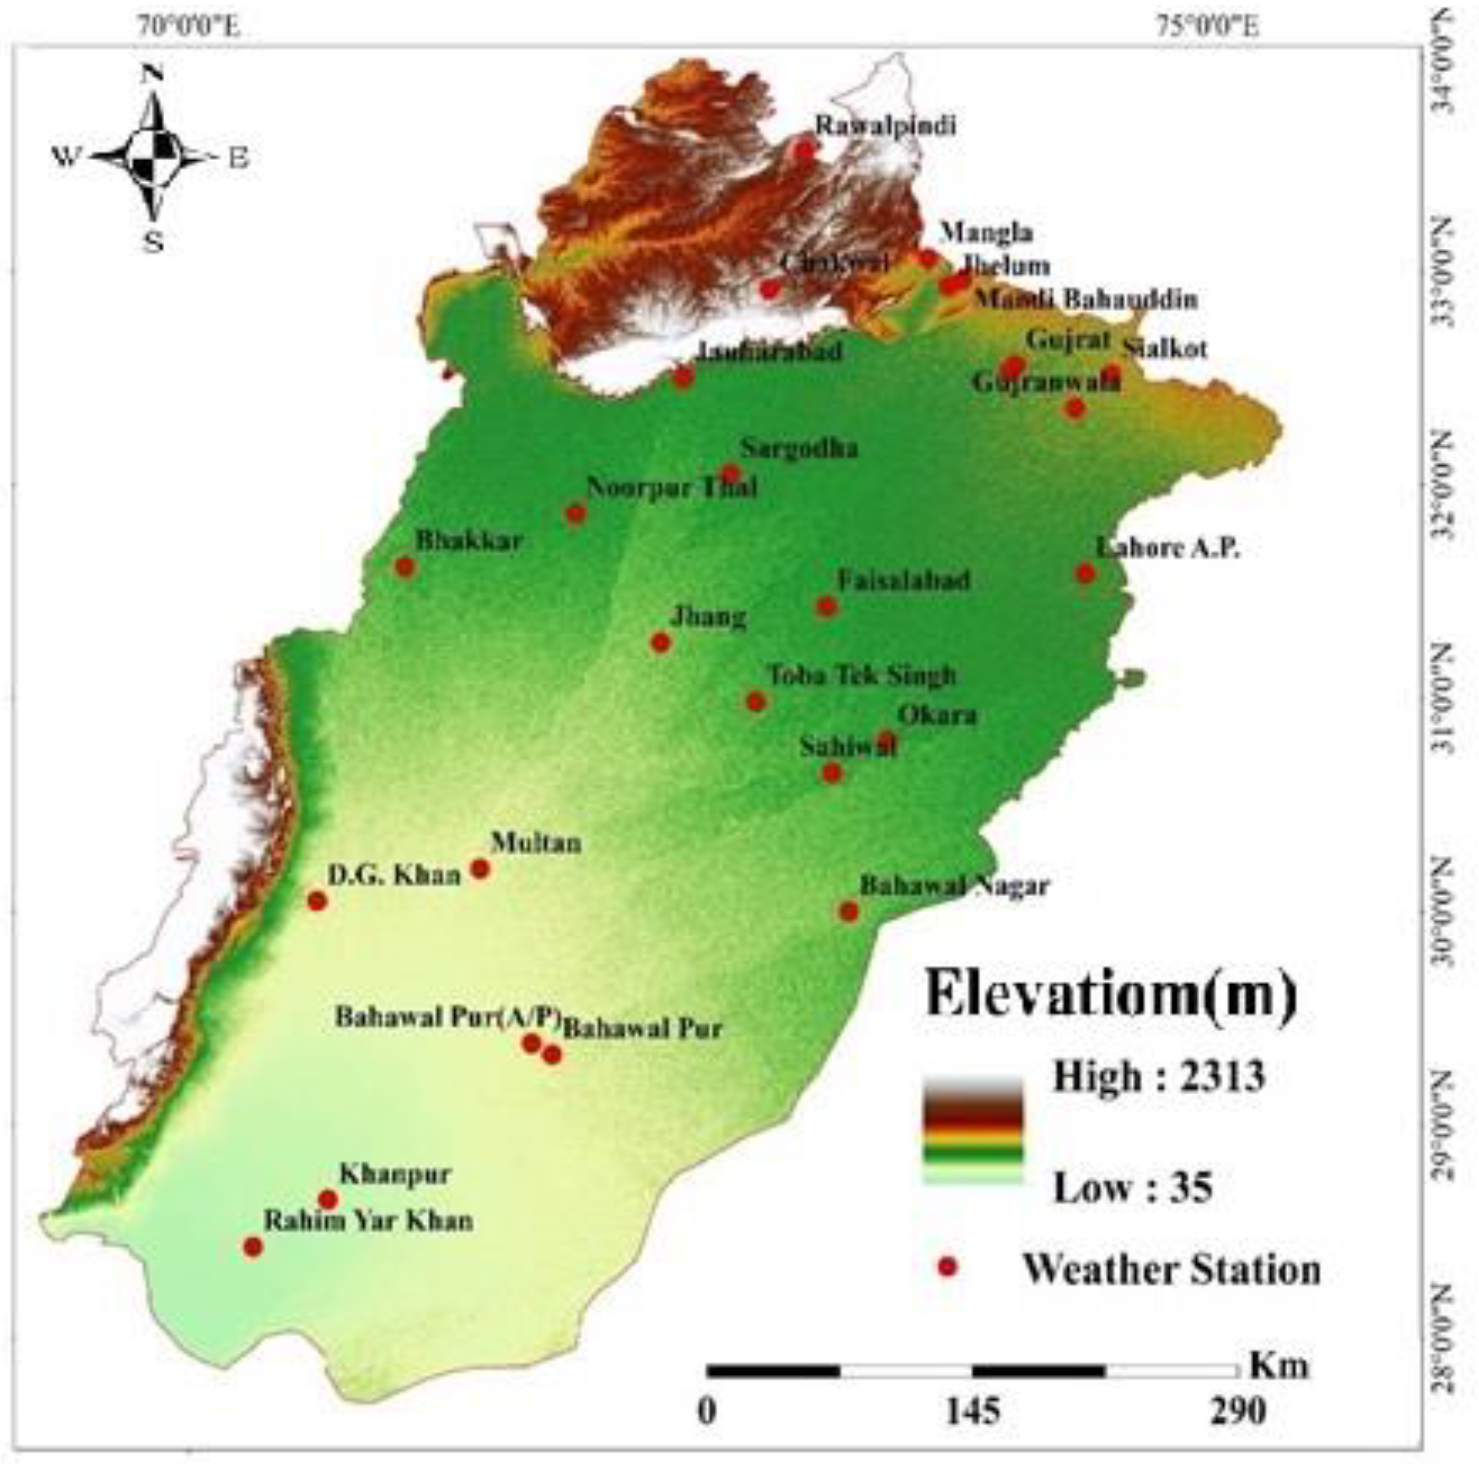
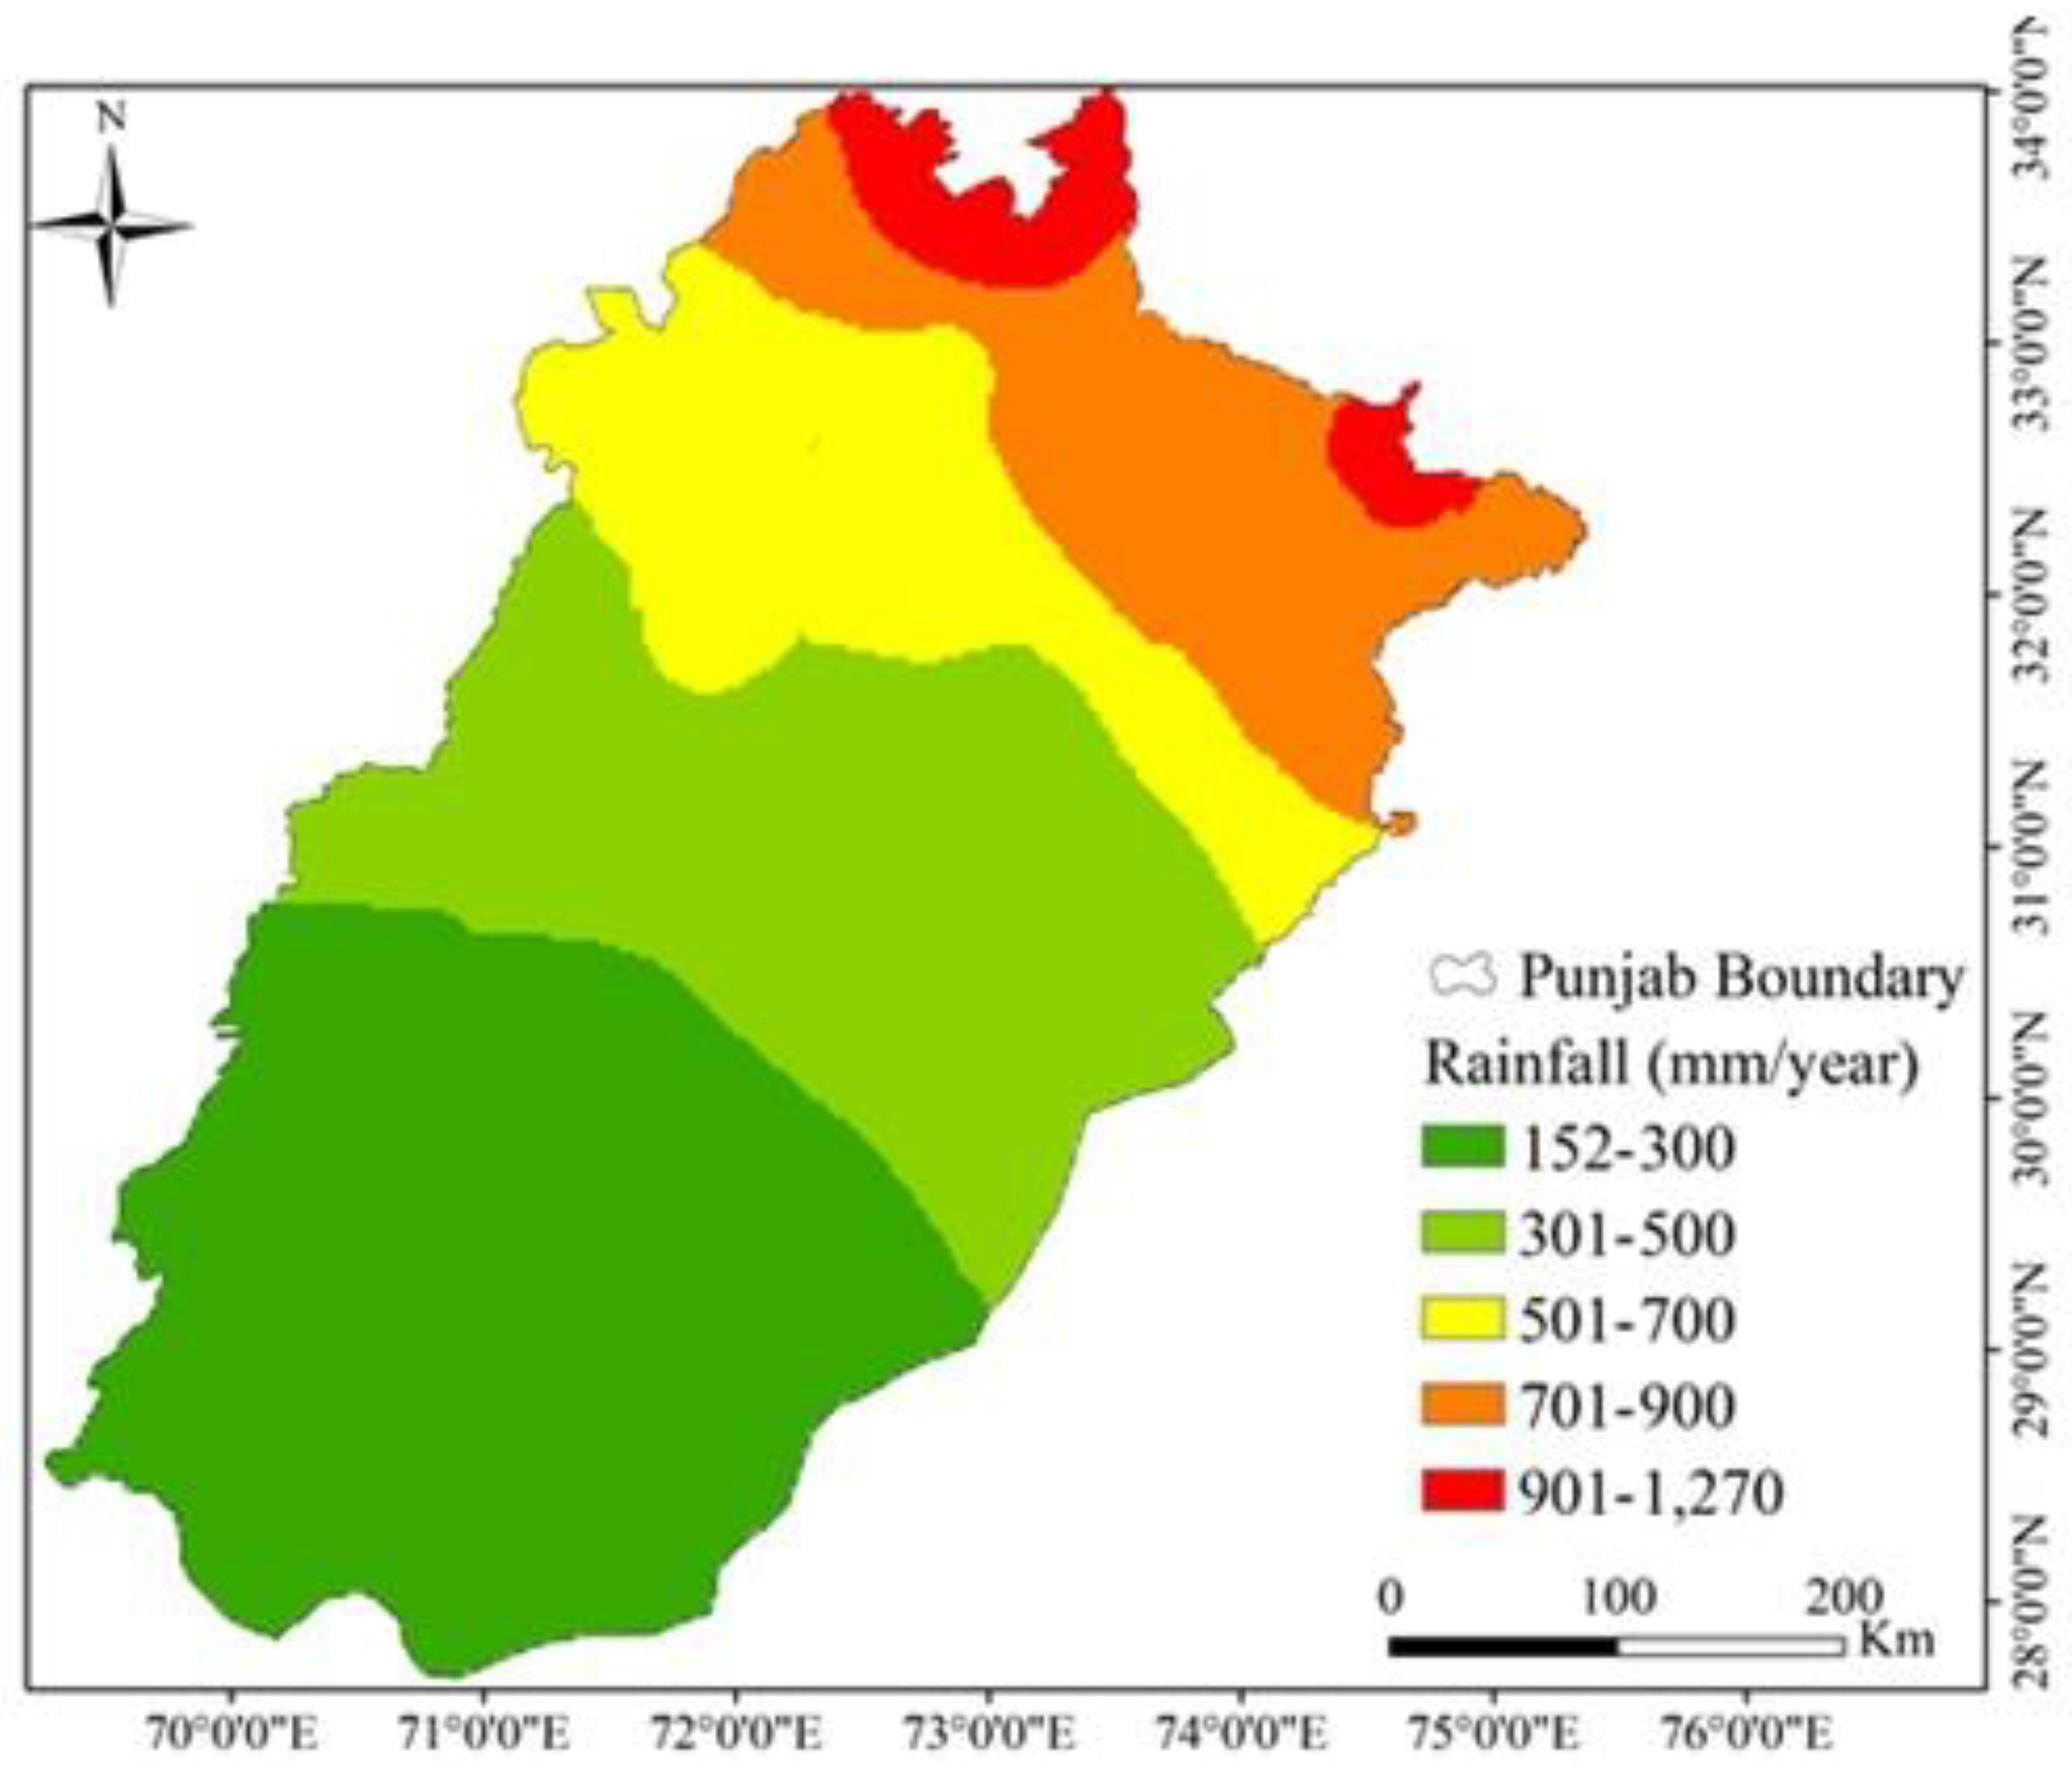
2.1. Study Area

The Punjab Province of Pakistan is situated on the northwest margin of the continental Indian plate in South-central Asia (31.17040° N, 72.70970° E) and spans a total area of 205,344 km2. The location map of the province is shown in Figure 1. This province has 56% of Pakistan’s total population and covers 26% of the country’s entire territory, accounting for 25.8% of the country’s total landmass. Punjab is primarily a fertile region along the river basins, whereas Cholistan’s deserts in the south part are a barren wasteland. The province’s topography is among the world’s most highly irrigated, with canals running across it. The Jhelum, Chenab, Ravi, and Sutlej Rivers, which span Punjab north to south, are primarily lush alluvial plains of the Indus River and its four major tributaries. Punjab is located in the tropical continental zone, with temperatures ranging from 4 °C to 47 °C, with an average annual rainfall of 550 mm. The province’s elevation ranges from 2313 m to 35 m above the mean sea level (Figure 1). The pixels of SRPs that include one or more reference weather stations were solely evaluated in the current evaluation, which was carried out according to the guidelines provided by Reference [20].

2.2. Datasets

The daily rainfall records of 26 weather stations from 2010 to 2018 were acquired from the Pakistan Meteorological Department (PMD). Figure 1 depicts the geographic locations of weather stations. PMD assured the quality of the daily rainfall observations. Moreover, daily datasets of all considered weather stations have been used in several previous hydroclimatic studies [28,29,30]. Appendix A presents the salient attributes of the considered weather stations, whereas the locations of all the weather stations are shown in Figure 1.
For the entire study period (2010–2018), the daily rainfall estimates of SM2Rain-ASCAT at 12.5-km pixels were downloaded from “http://hydrology.irpi.cnr.it/download-area/sm2rain-datasets/ (accessed on 7 December 2020)”. Daily rainfall estimates of both PERSIANN products (PERSIANN-CCS and PERSIANN-CDR) at a 0.25° pixel scale for the entire study duration were obtained from https://chrsdata.eng.uci.edu/ (accessed on 23 December 2020). Estimates of the CHIRPS-2.0 product were obtained from https://data.chc.ussb.edu/products/CHIRPS-2.0/ (accessed on 4 January 2021). Daily datasets of all sources (weather stations and SRPs) were used to obtain monthly, seasonal, and annual time series.

2.3. Methods

The performances of four satellite-based products (CHIRPS-2.0, PERSIANN-CCS, PERSIANN-CDR, and SM2Rain-ASCAT) were evaluated with reference to the observations of weather stations. The accuracies of all satellite products were evaluated at different spatial (point-to-pixel and entire domain) and temporal (daily, monthly, seasonal, and annual) scales against the observations of considered weather stations. Kriging, a widely used geostatistical spatial interpolation technique, was used to develop map of spatial variability of average annual rainfall over the entire province (as shown in Appendix B). This interpolation was used to show the spatial pattern of rainfall using the values and locations of available weather stations within the study domain. Kriging estimates the value of a variable over a wide spatial domain using a small number of observed data points. However, it differs from other geostatistical techniques such as Inverse Distance Weighted (IDW) Interpolation, Linear Regression (LR), or Gaussian decays, because it makes use of spatial correlation between measurement points to interpolate values in the spatial field rather than a presumed model of spatial distribution Baccou and Liandrat [31]. Li and Heap [32] compared the performance of Kriging technique with 32 different interpolation techniques and found that Kriging outperformed all other techniques in large areas with less sampling points. They recommended the use of Kriging interpolation for spatial analysis with less numbers of measurements. Considering their recommendation, we used this technique for the interpolation of observations of in situ weather stations. In this study, an ordinary Kriging method with a spherical semi-variogram model was used.
The abilities of considered SRPs to replicate the spatial distribution of the observed rainfall over the Punjab Province of Pakistan were evaluated. The accuracies of four SRPs were evaluated using the most commonly used assessment indices (Bias, relative Bias (rBias), correlation coefficients (CC), and Root Mean Square Error (RMSE)), as well as categorical indices (Critical Success Index (CSI), False Alarm Ratio (FAR), and Probability of Detection (POD). Several researchers have recommended the use of these assessment indices and categorical indices to assess the performances of SRPs in different geographic, topographic, and climatic regions. The abilities of SRPs to represent the temporal variability of rainfall over the entire province were also analyzed by comparing the temporal variability of reference data with the estimates of SRPs.
The correlation coefficients (CC) were calculated to quantify the linear relationship between the in situ observations and estimates of SRPs. The BIAS (mm/time) was calculated to measure the over-or underestimation of the rainfall amount by the SRPs. To determine the relative difference between the reference observations and the estimates of SRPs, we estimated the rBias (percent) of the observations. The root mean square error (RMSE) was used to determine the average degree of error (mm/time) in the estimates of SRPs when compared to the in situ observations. The assessment indices were estimated using the following equations:
CC = i = 1 n ( Gi G ) ( Si S ) i = 1 n ( Gi G ) 2 × i = 1 n ( Si S ) 2
BIAS = i = 1 n ( Si Gi ) n
rBIAS = i = 1 n ( Si Gi ) i = 1 n Gi × 100
RMSE = 1 n i = 1 n ( Si Gi ) 2
where Gi indicates the ground-based data, G denotes the mean of ground-based data, Si and S represent the SRP-based data and mean of the SRP data, respectively, and n denotes the total observations. If the calculated value of CC is 1 and the values of Bias and RMSE are zero, then the SRP is considered as a perfect product. Generally, any SRP is considered to be an acceptable proxy for ground-based data if the estimated value of the rBias is within ±10% and the estimated value of CC is ≥0.70 [27].
The Critical Success Index (CSI), False Alarm Ratio (FAR), and Probability of Detection (POD) were calculated to evaluate how well SRPs detect rainfall when compared to the ground-based data. High CSI values indicate a high ratio of rainfall events identified by SRP. In contrast, high FAR values suggest that many rainfall events sensed by SRP were incorrect, and high POD scores indicate that SRP captured most of the rainfall events. One millimeter per day was chosen as the CSI, FAR, and POD threshold value. The following formulae were used to calculate these categorical matrixes:
POD = H H + M
FAR = F H + F
CSI = H H + M + F
where H denotes rainfall events that weather stations and SRPs reported, F denotes rainfall events that were recorded by SRPs but not reported by weather stations, and M denotes rainfall events that were observed by weather stations but not detected by SRPs. POD, FAR, and CSI have perfect scores of 1, 0, and 1, respectively.

3. Results

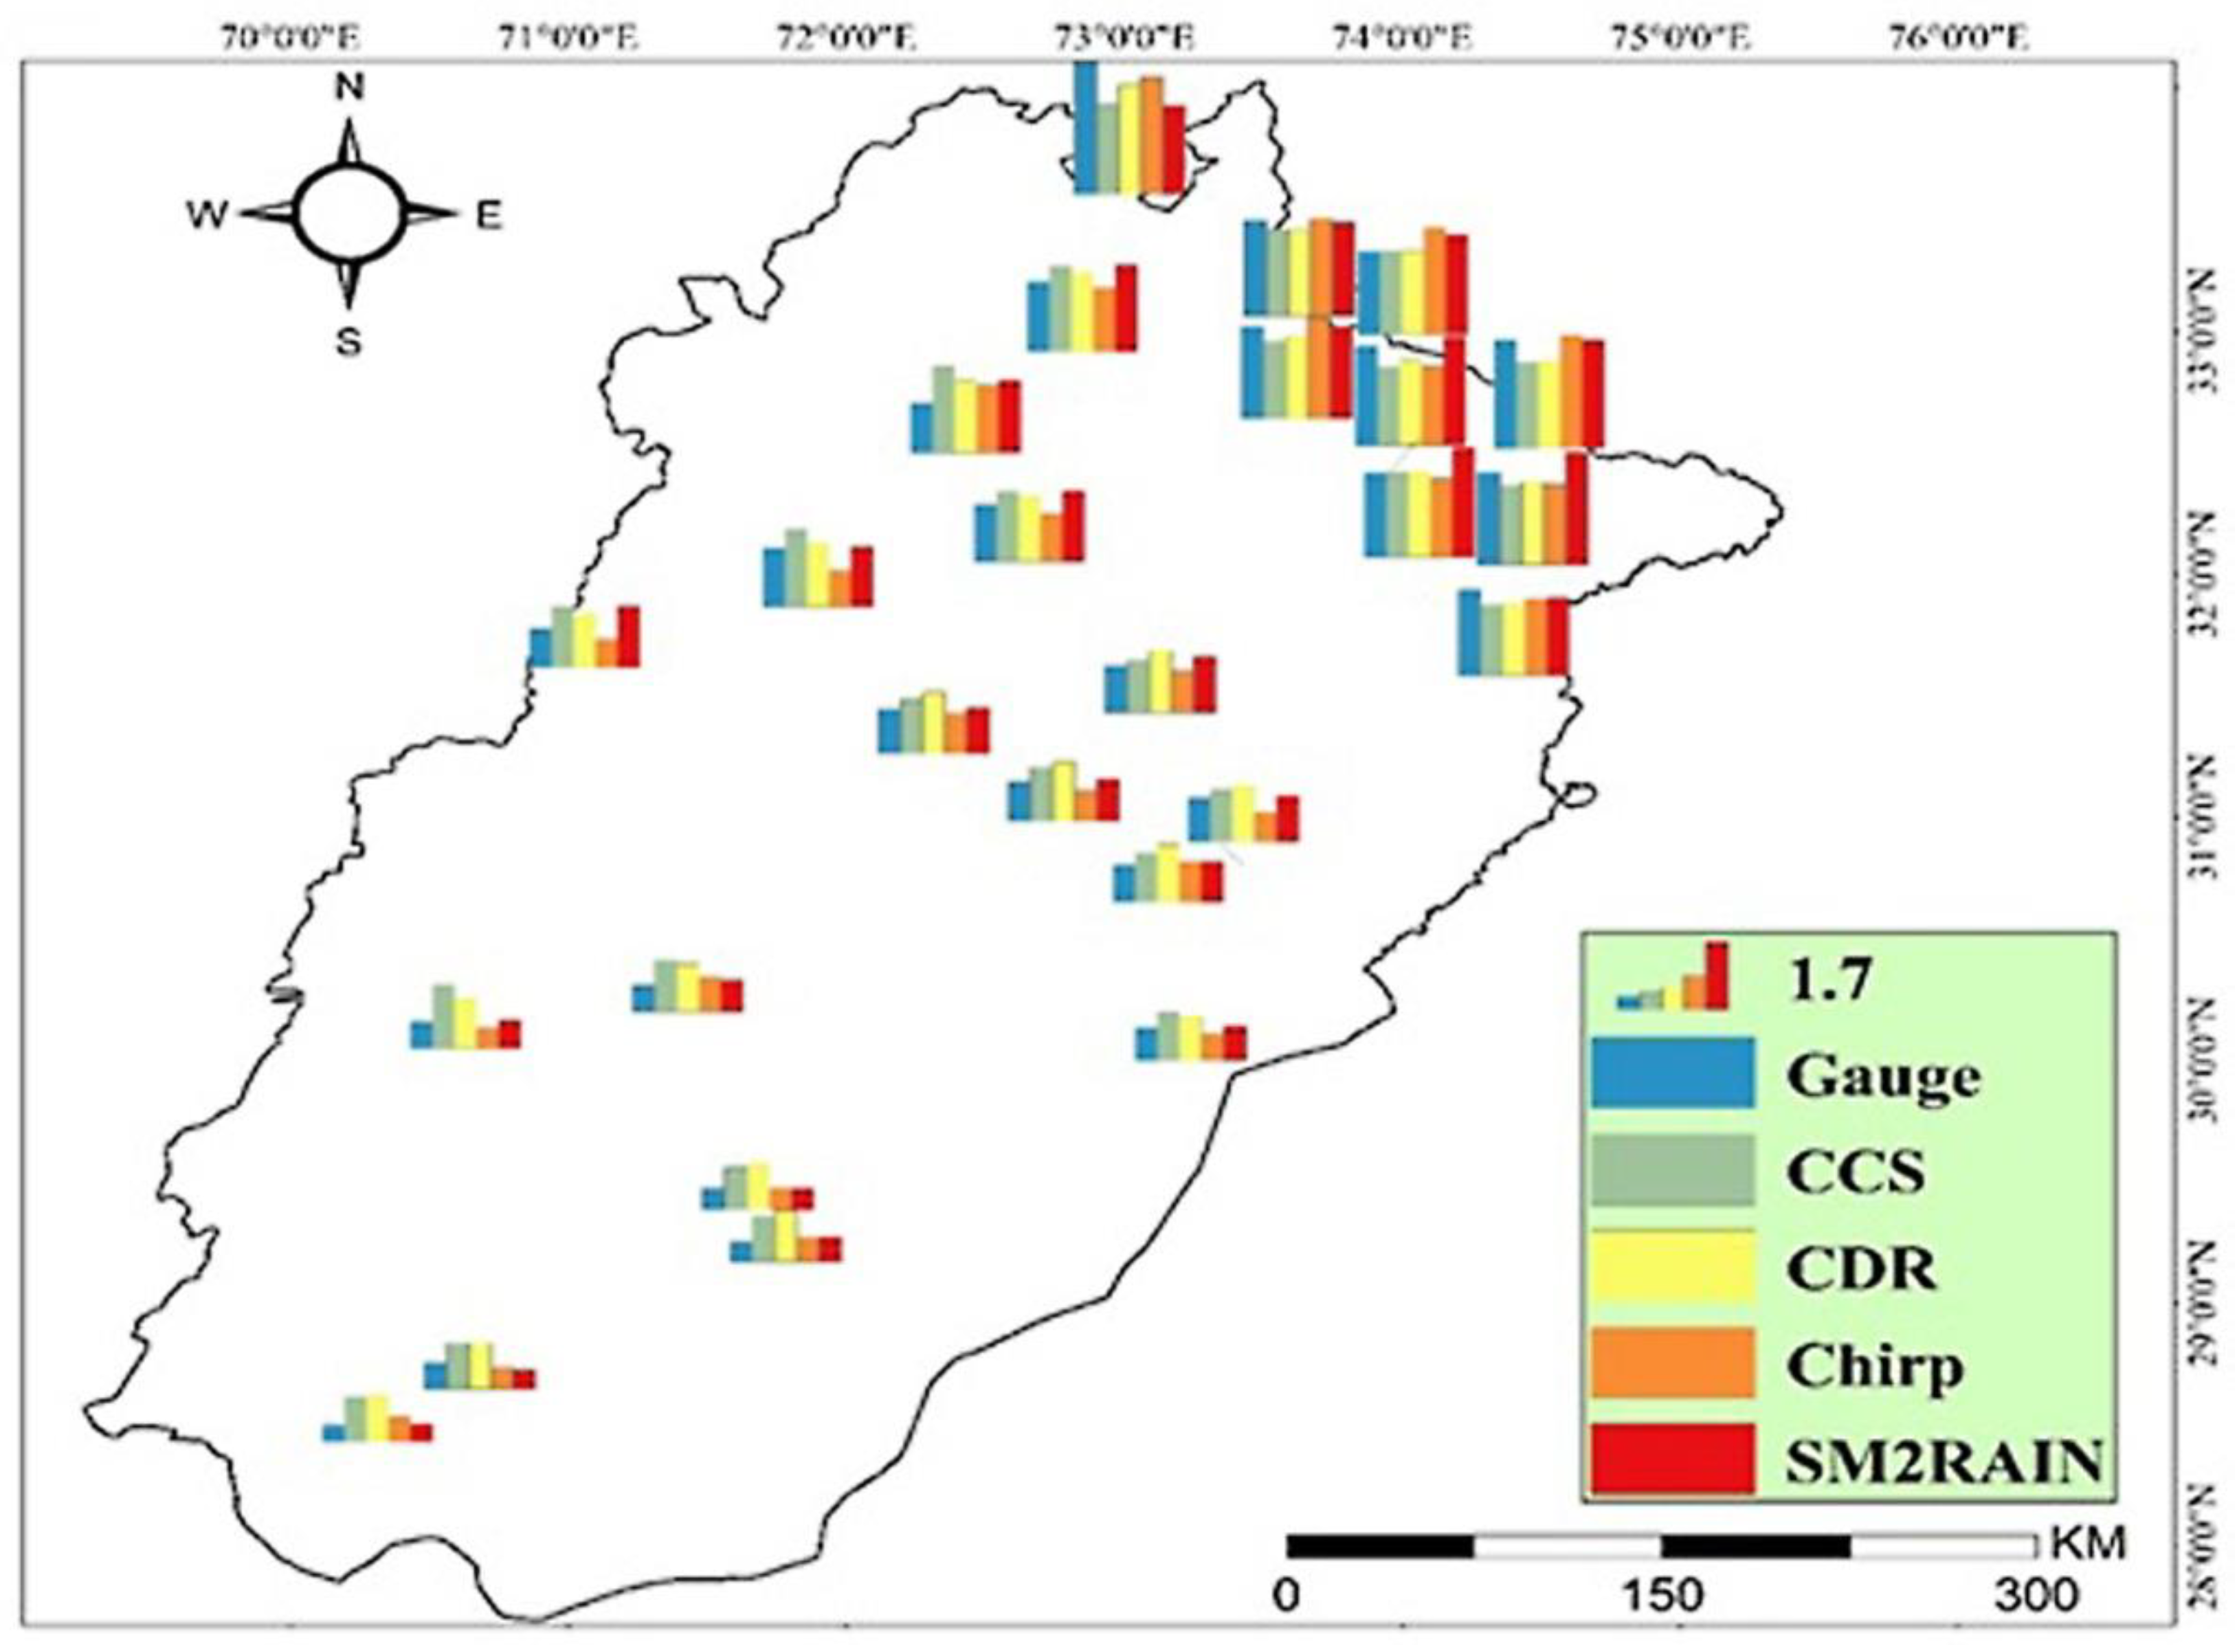
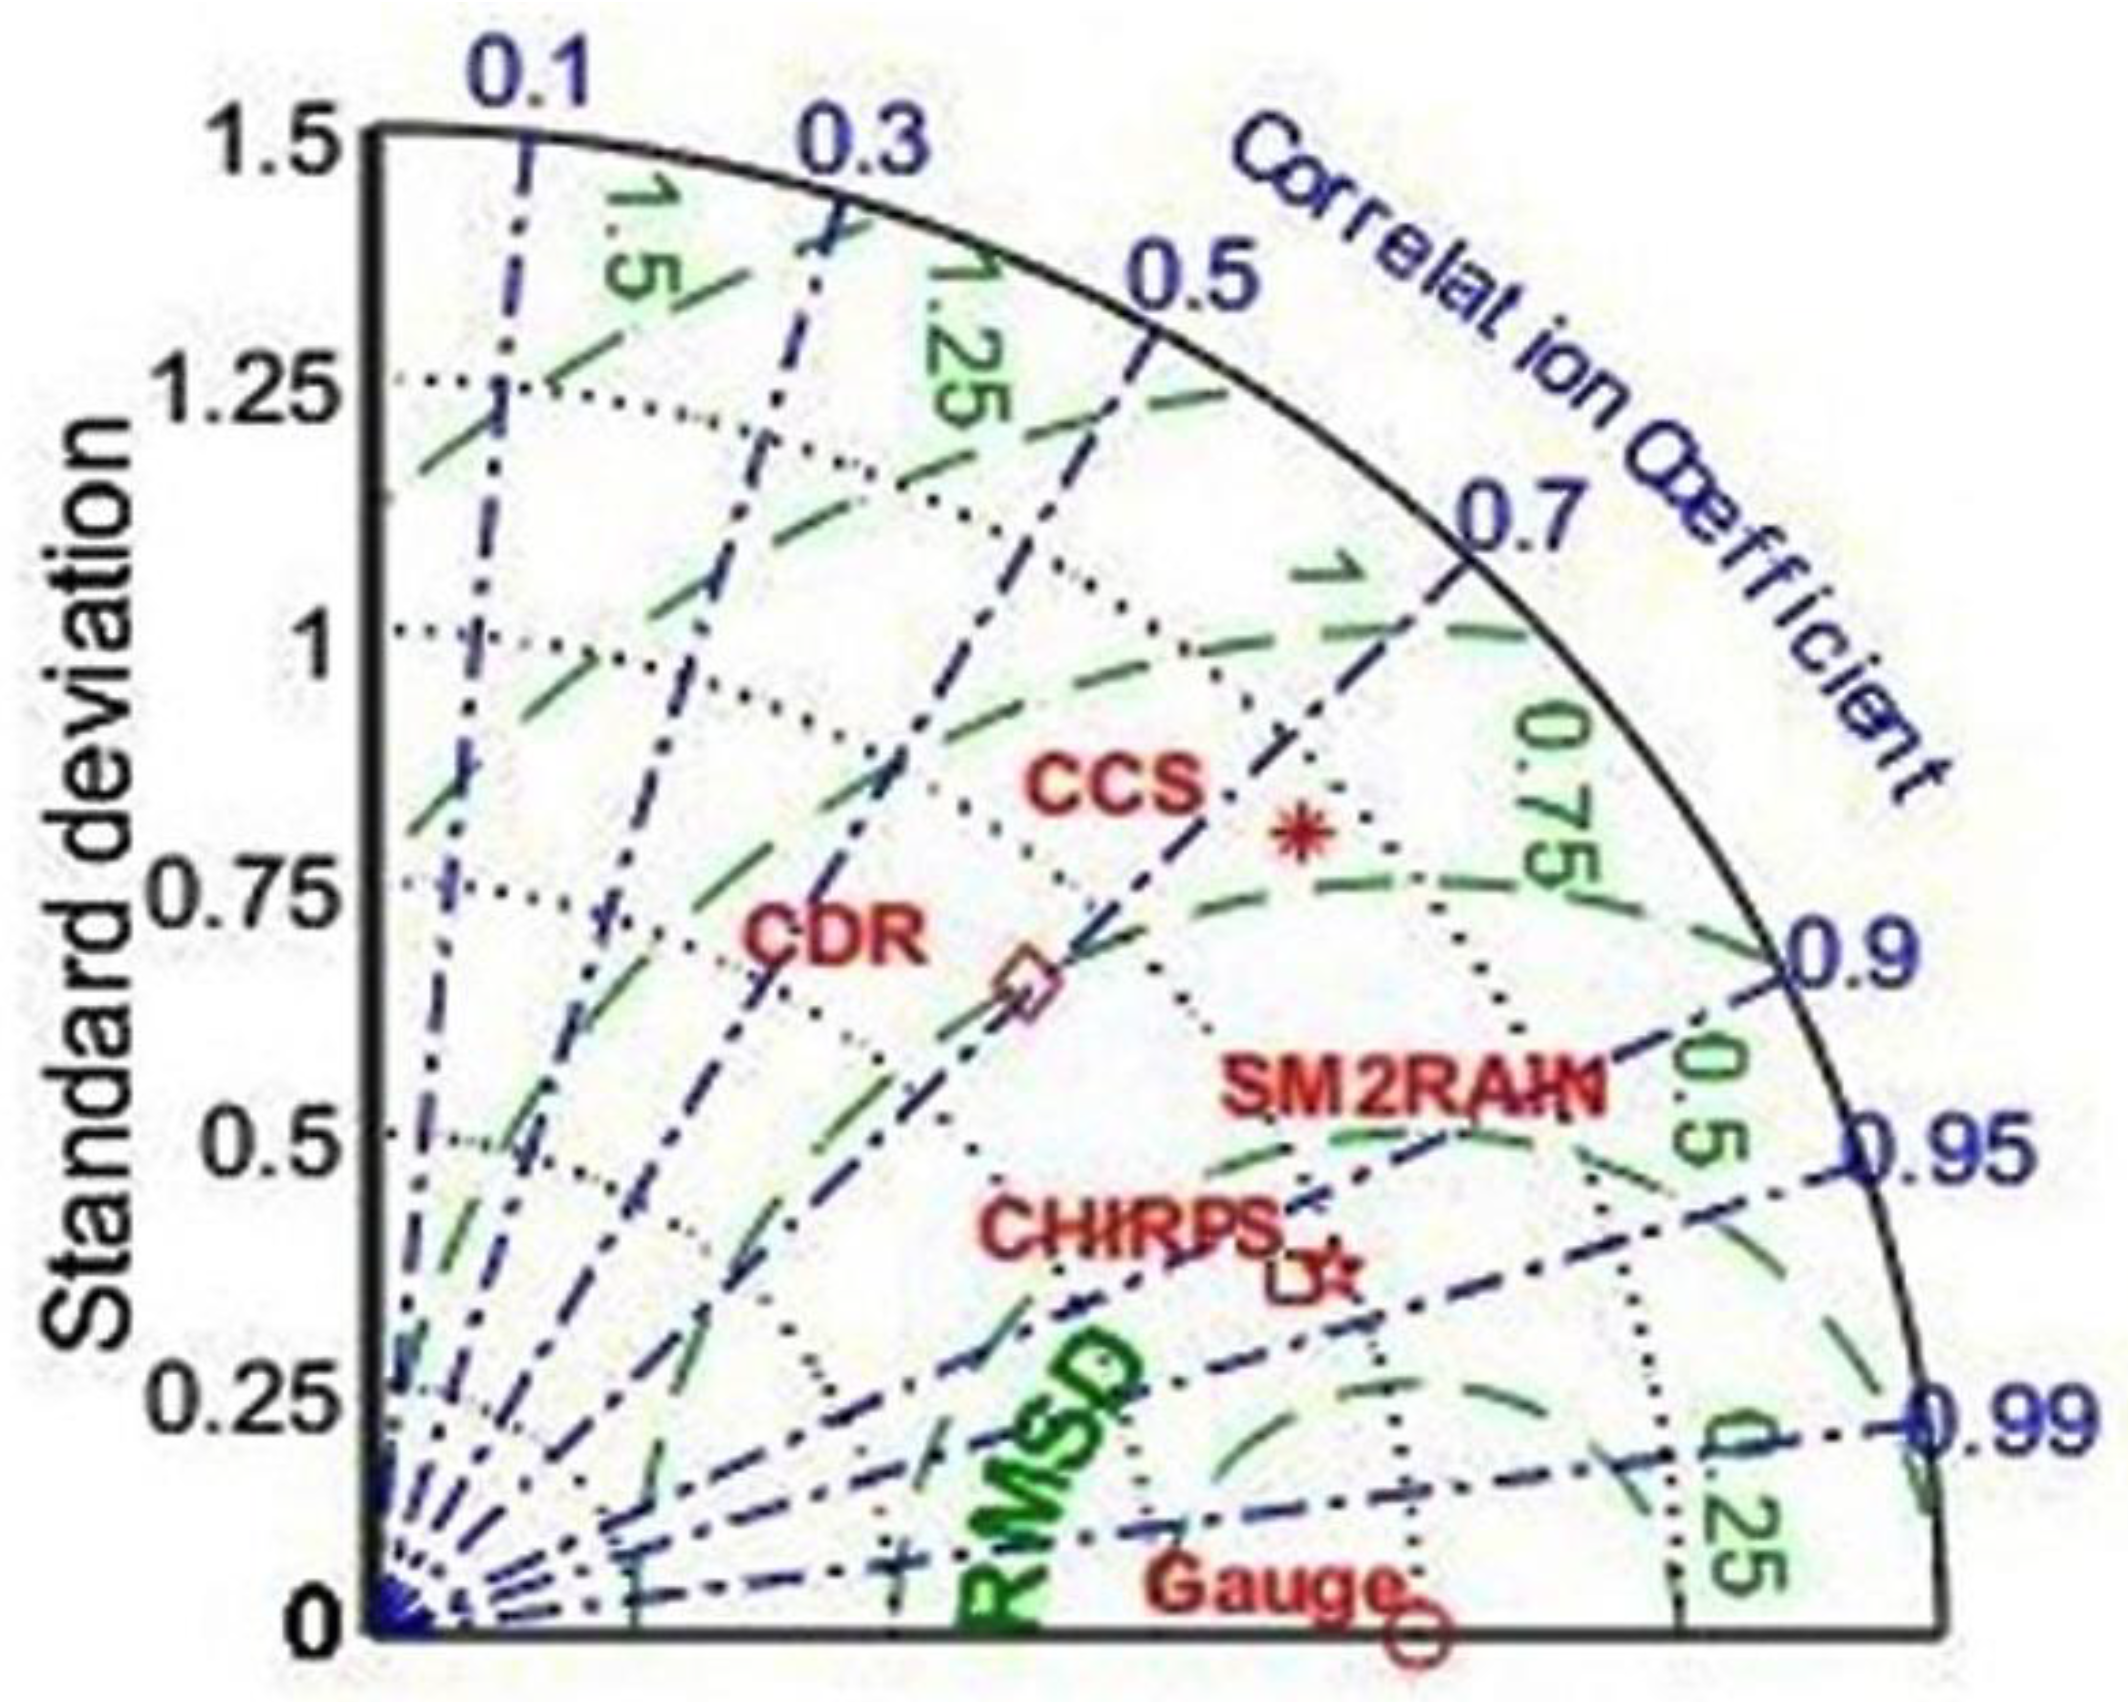
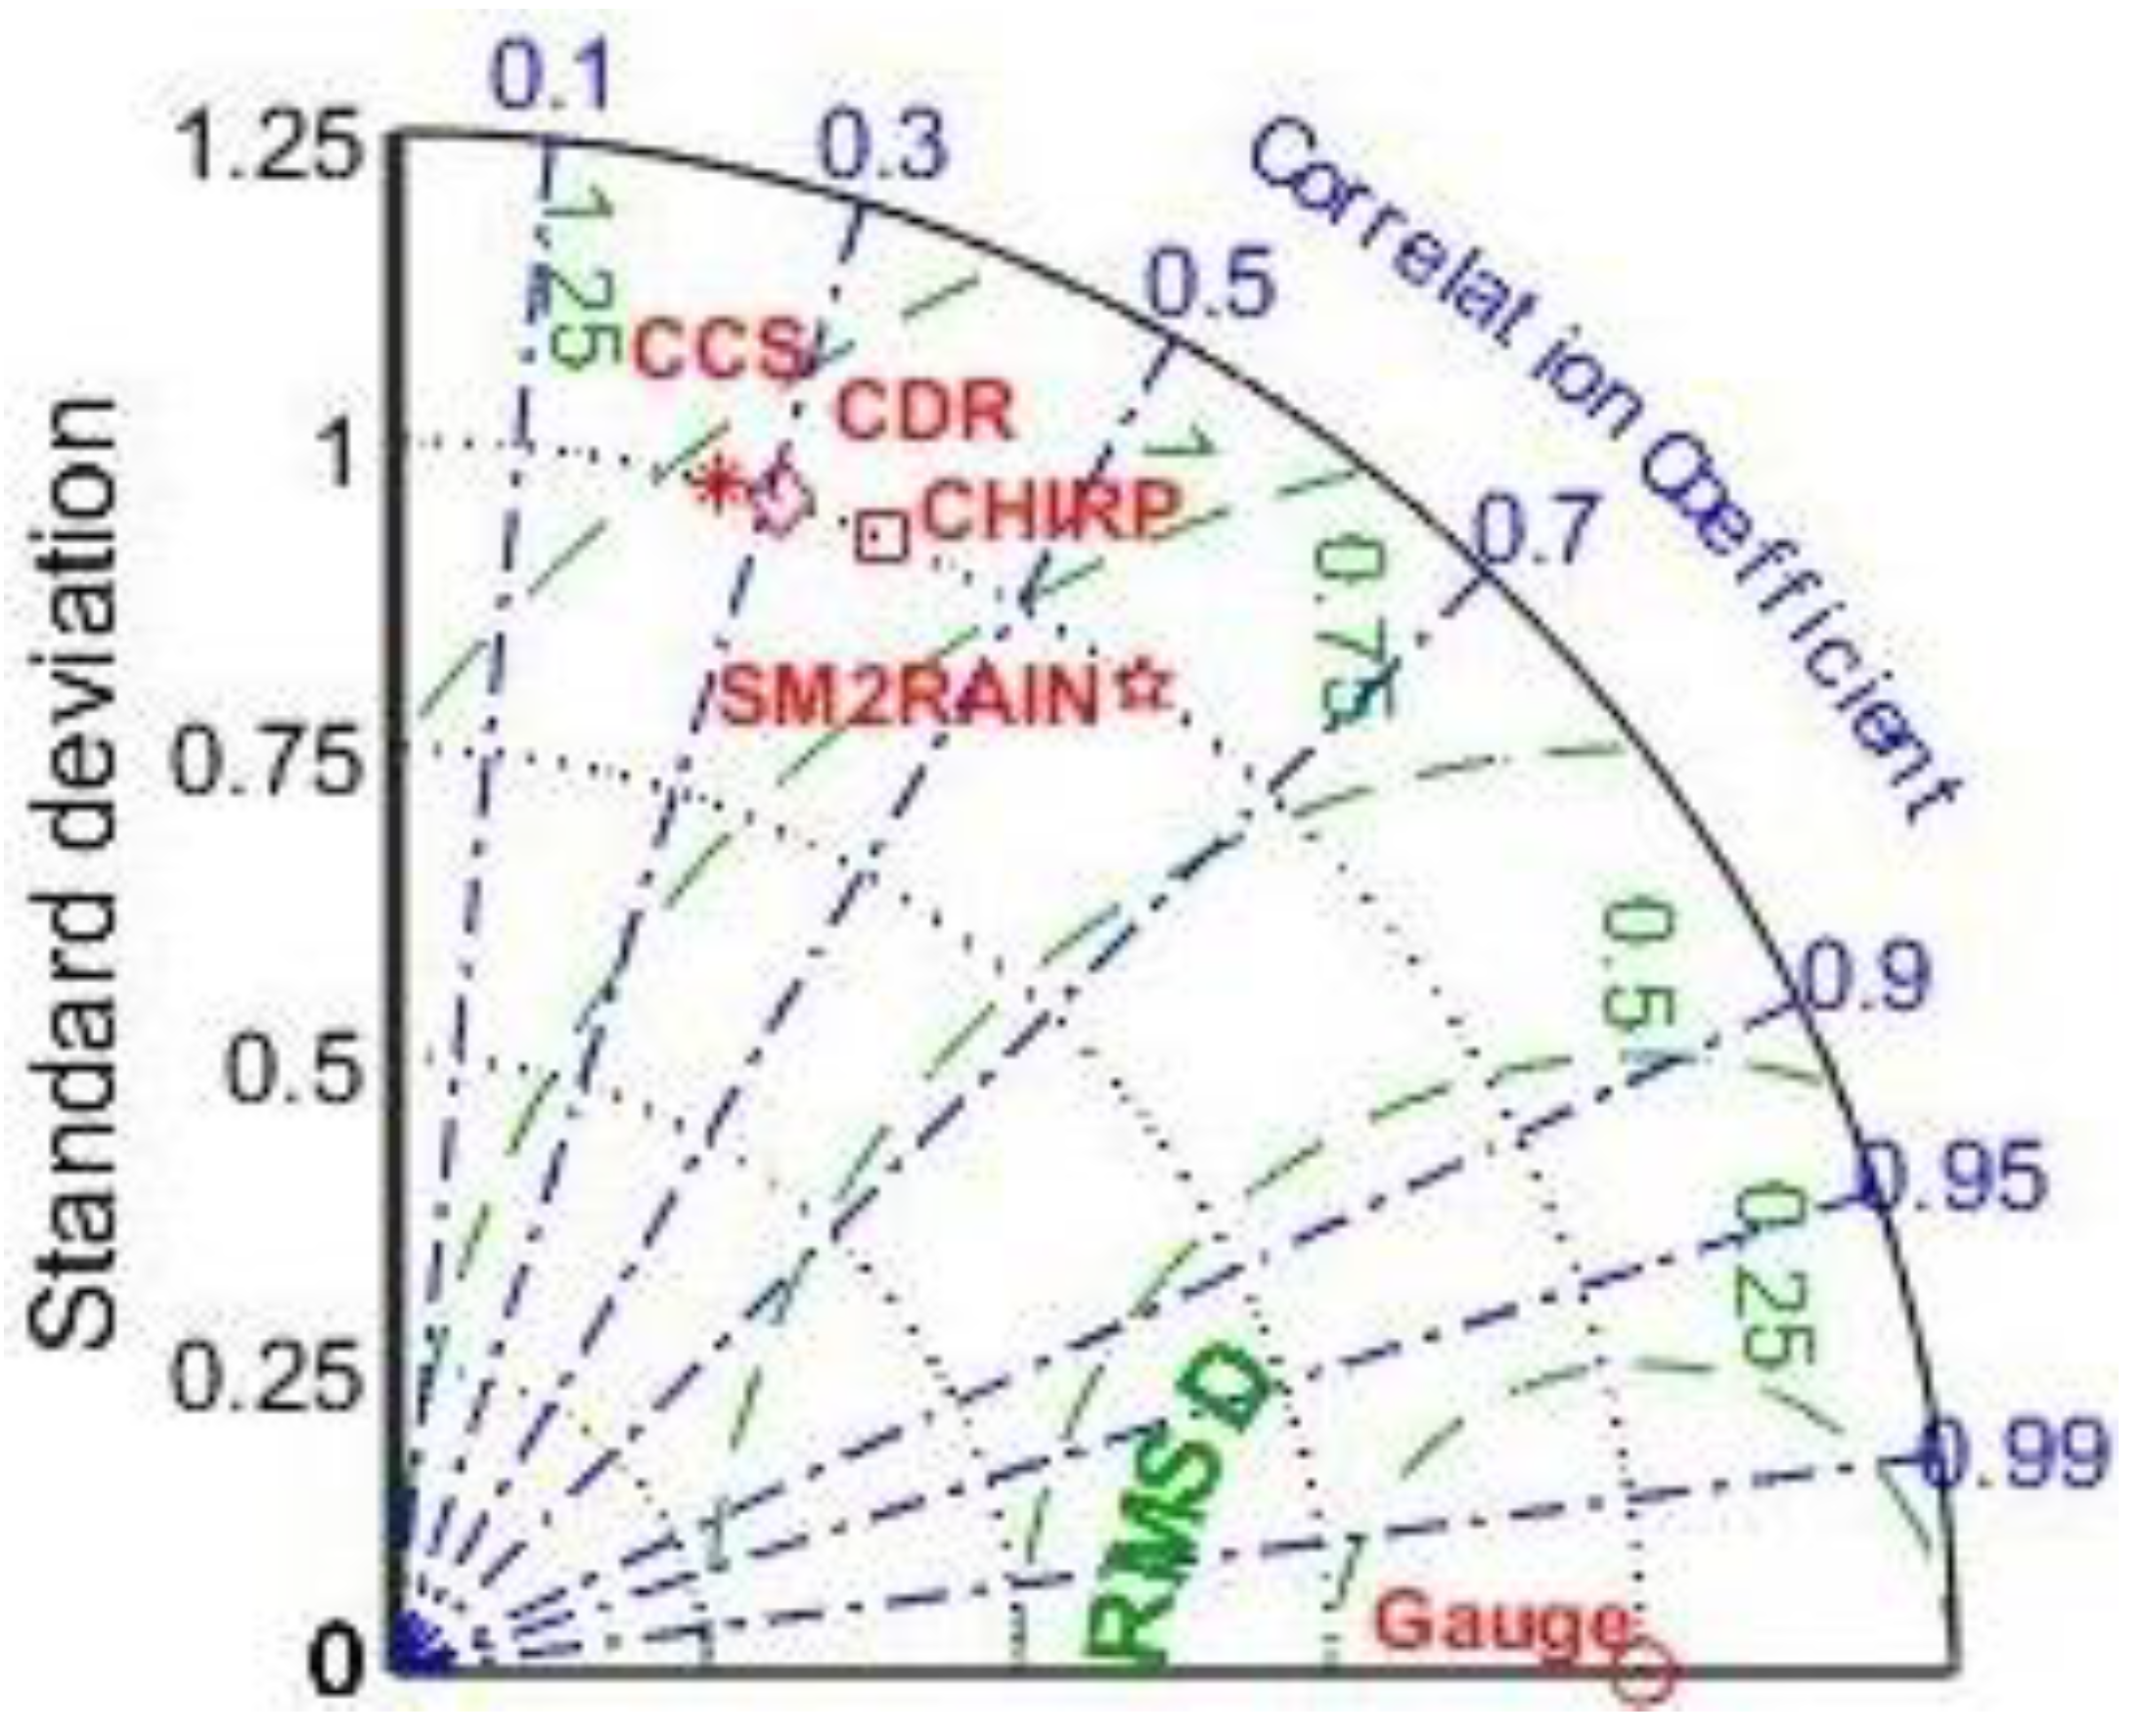
3.1. Ability of SRPs to Represent the Spatiotemporal Distribution of Rainfall

The spatial variability of the average daily rainfall acquired from in situ weather stations and considered SRPs in the province is depicted in Figure 2. The amount of rainfall varied significantly across the province, indicating a high degree of geographical variability. In general, rainfall amounts were higher in the northern parts of the province, particularly in the northeastern parts, as observed by in situ meteorological stations and estimated by all SRPs. Low rainfall amounts were recorded by weather stations in the province’s southern regions.
The results showed that PERSIANN-CCS slightly overestimated the rainfall amount over the southwestern parts and underestimated the amount over the northeastern parts. PERSIANN-CDR slightly overestimated the rainfall amounts in the southwest while underestimating the rainfall amounts in the northeast. Both PERSIANN products performed better in the province’s northeastern region. The CHIRPS product slightly underestimated the rainfall amount over both the northeastern and southwestern parts. The SM2Rain-ASCAT product slightly overestimated the rainfall amount over the northeastern parts and underestimated the rainfall amount over the southwestern parts. In general, the SM2Rain-ASCAT product performed better than other products in representing the spatial variations of the observed rainfall over the central and southern parts of the research area. However, it was difficult for it to report rainfall amounts in the northern parts accurately. Despite the fact that the SM2RAIN-ASCAT and CHIRPS products over- and underestimated the rainfall quantities at specific weather stations, both products outperformed the PERSIANN products in terms of the ability to accurately represent the spatial distribution of the recorded rainfall amounts.
Figure 3 depicts the temporal variability of average daily rainfall quantities derived from ground-based stations compared to four satellite-based products, with the ground-based stations showing the greatest variability. For the period 2010–2018, timeseries of rainfall were created by using the moving average of daily data from reference stations and the SRPs under consideration. Due to the westerlies and monsoon circulation systems, the Punjab Province receives a lot of rain in two seasons: winter and summer. Figure 4 shows two peaks of rainfall in a year based on reference (ground-based) data. The CHIRPS and SM2RAIN products were able to monitor the temporal variability of the observed rainfall over the research domain compared to reference data and estimates from satellite-based products. The average daily rainfall measured at the reference sites was 0.65 millimeters per day, with a range of 0.0–10.3 mm per day. PERSIANN-CCS, CHIRPS, PERSIANN-CDR, and SM2RAIN-ASCAT, on the other hand, measured average daily rainfall amounts that ranged between 0.0 and 11.3 mm/day, 0.0 and 10.9 mm/day, 0.0 and 9.8 mm/day, and 0.0 and 9.0, respectively. The PERSIANN-CCS product overestimated the amount of rainfall in the winter season and underestimated the amount of rainfall in the summer season, whereas the PERSIANN-CDR product overestimated the magnitude of rainfall in the winter season while underestimating the magnitude of rainfall in the summer season. Overall, PERSIANN-CCS failed to capture both peaks of rainfall. Comparatively, CHIRPS and SM2RAIN showed better performances than both PERSIANN products (CCS and CDR) in terms of the ability to monitor the temporal variability of the daily rainfall.

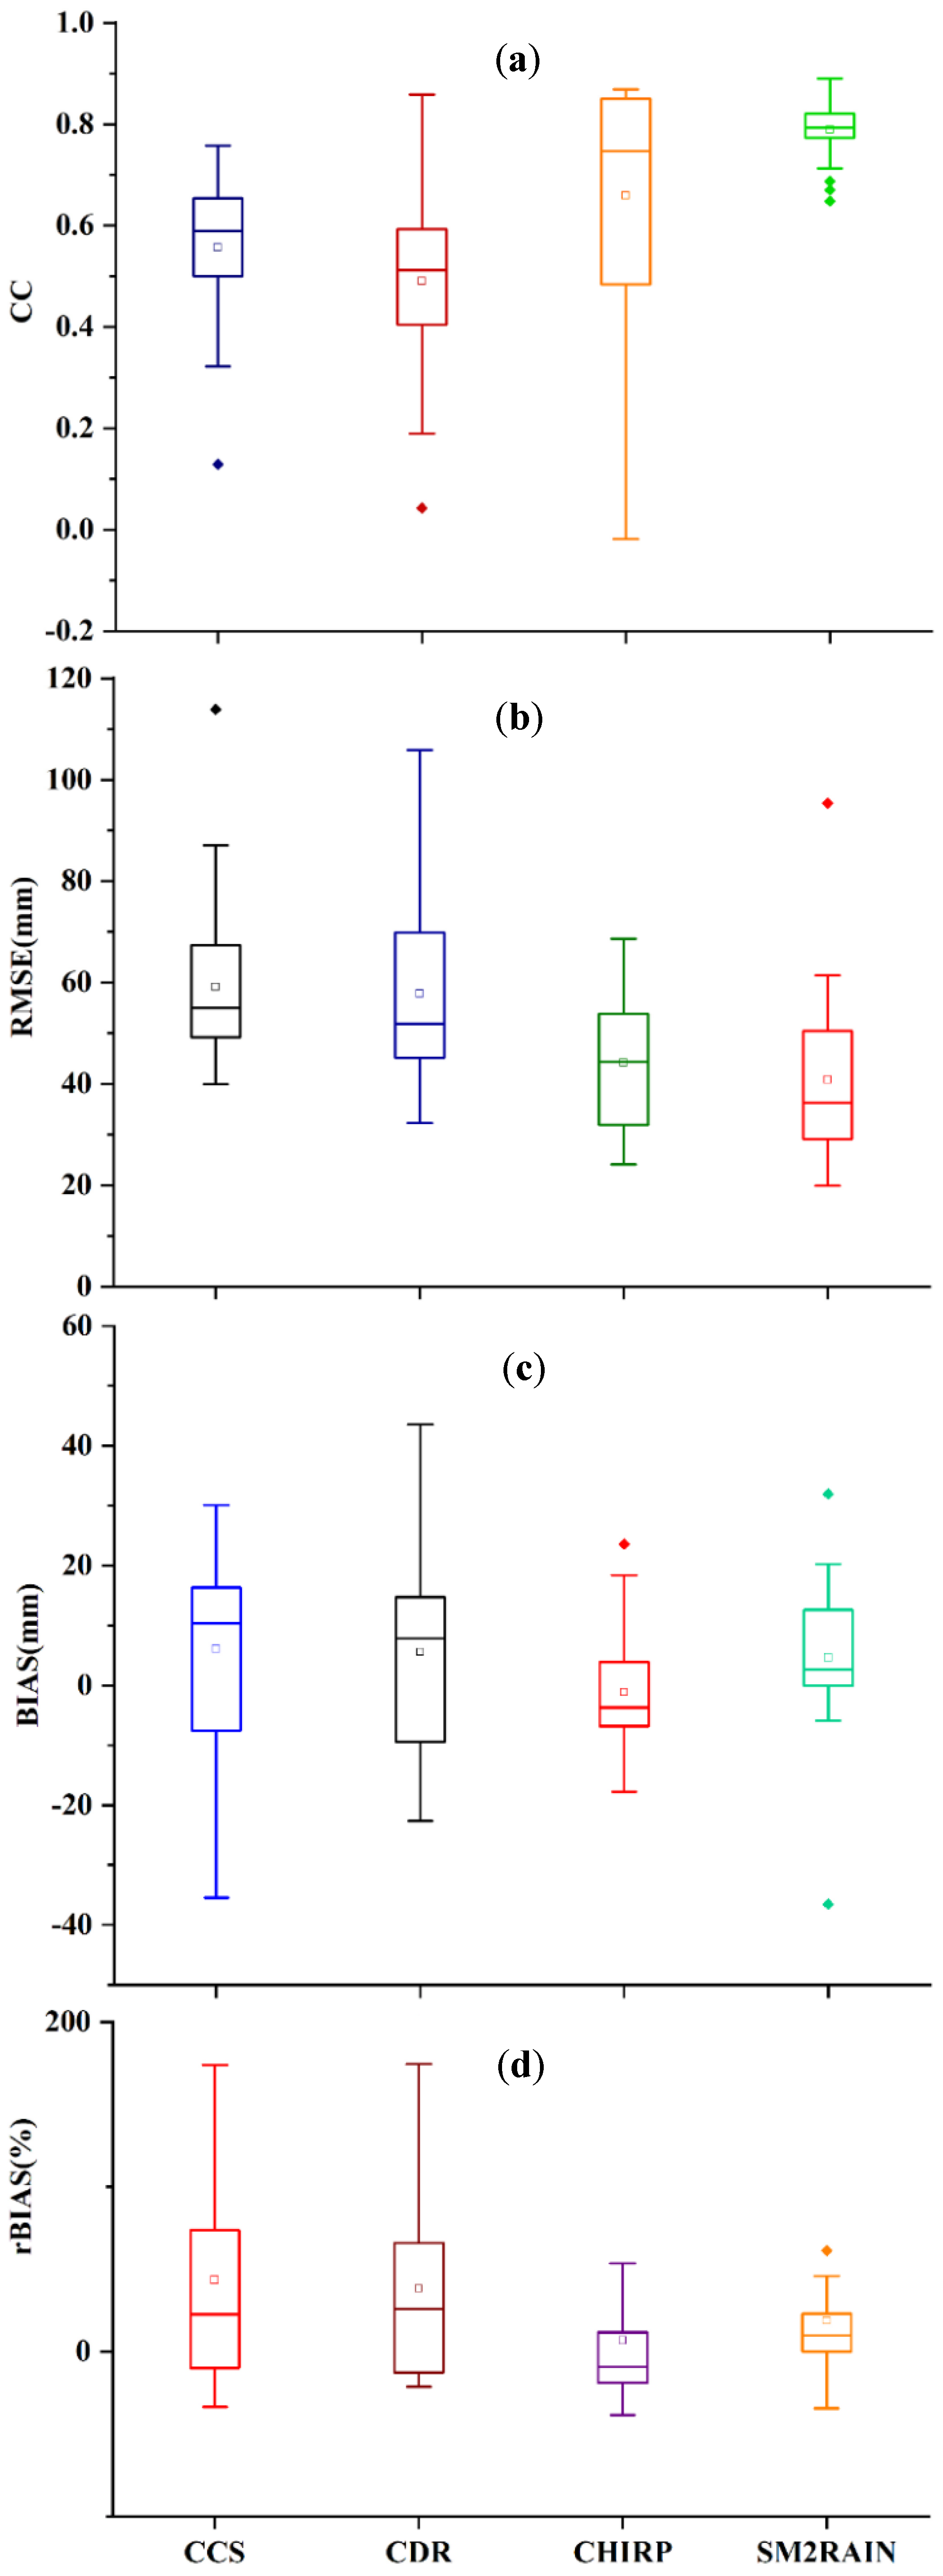
3.2. Performances of SRPs at the Monthly Scale

The performances of monthly products from four SRPs (PERSIANN-CCS, PERSIANN-CDR, CHIRPS-2.0, and SM2RAIN-ASCAT) are summarized in a Taylor diagram (see Figure 4). The Taylor diagram was developed using the normalized areal average data of all data sources (weather stations and satellite products). Generally, CHIRPS-2.0 and SM2RAIN-ASCAT indicated better linear relationships with the monthly reference data than the PERSIANN-CCS and PERSIANN-CDR products. The CC values for the monthly reference observations and the data of CHIRPS and SM2RAIN products were >0.90. However, the values of CC for both PERSIANN products were ≥0.70. The calculated values of the RMSE for CHIRPS and SM2RAIN were <0.50, whereas the RMSE values for both PERSIANN products were >0.5, which suggested a more significant error in the monthly PERSIANN CCS and PERSIANN CDR products in Punjab Province.
Figure 5 shows the variations in the calculated values of the CC, RMSE, BIAS, and rBIAS for the PERSIANN-CCS, PERSIANN-CDR, CHIRPS, and SM2RAIN products at each weather station. A substantial range was seen in the box lengths of the CC (Figure 5a), indicating that the computed values of the CC for the CHIRPS product were inconsistent. In contrast, the length of the box of the CC for the SM2Rain product revealed the lowest variation in its correlations with the reference monthly data. The variations in the values of the RMSE were highest for the PERSIANN-CDR product as compared with the other products (Figure 5b). The box charts of the BIAS and rBIAS showed that the CHIRPS and SM2RAIN products had lower variations than the PERSIANN products.

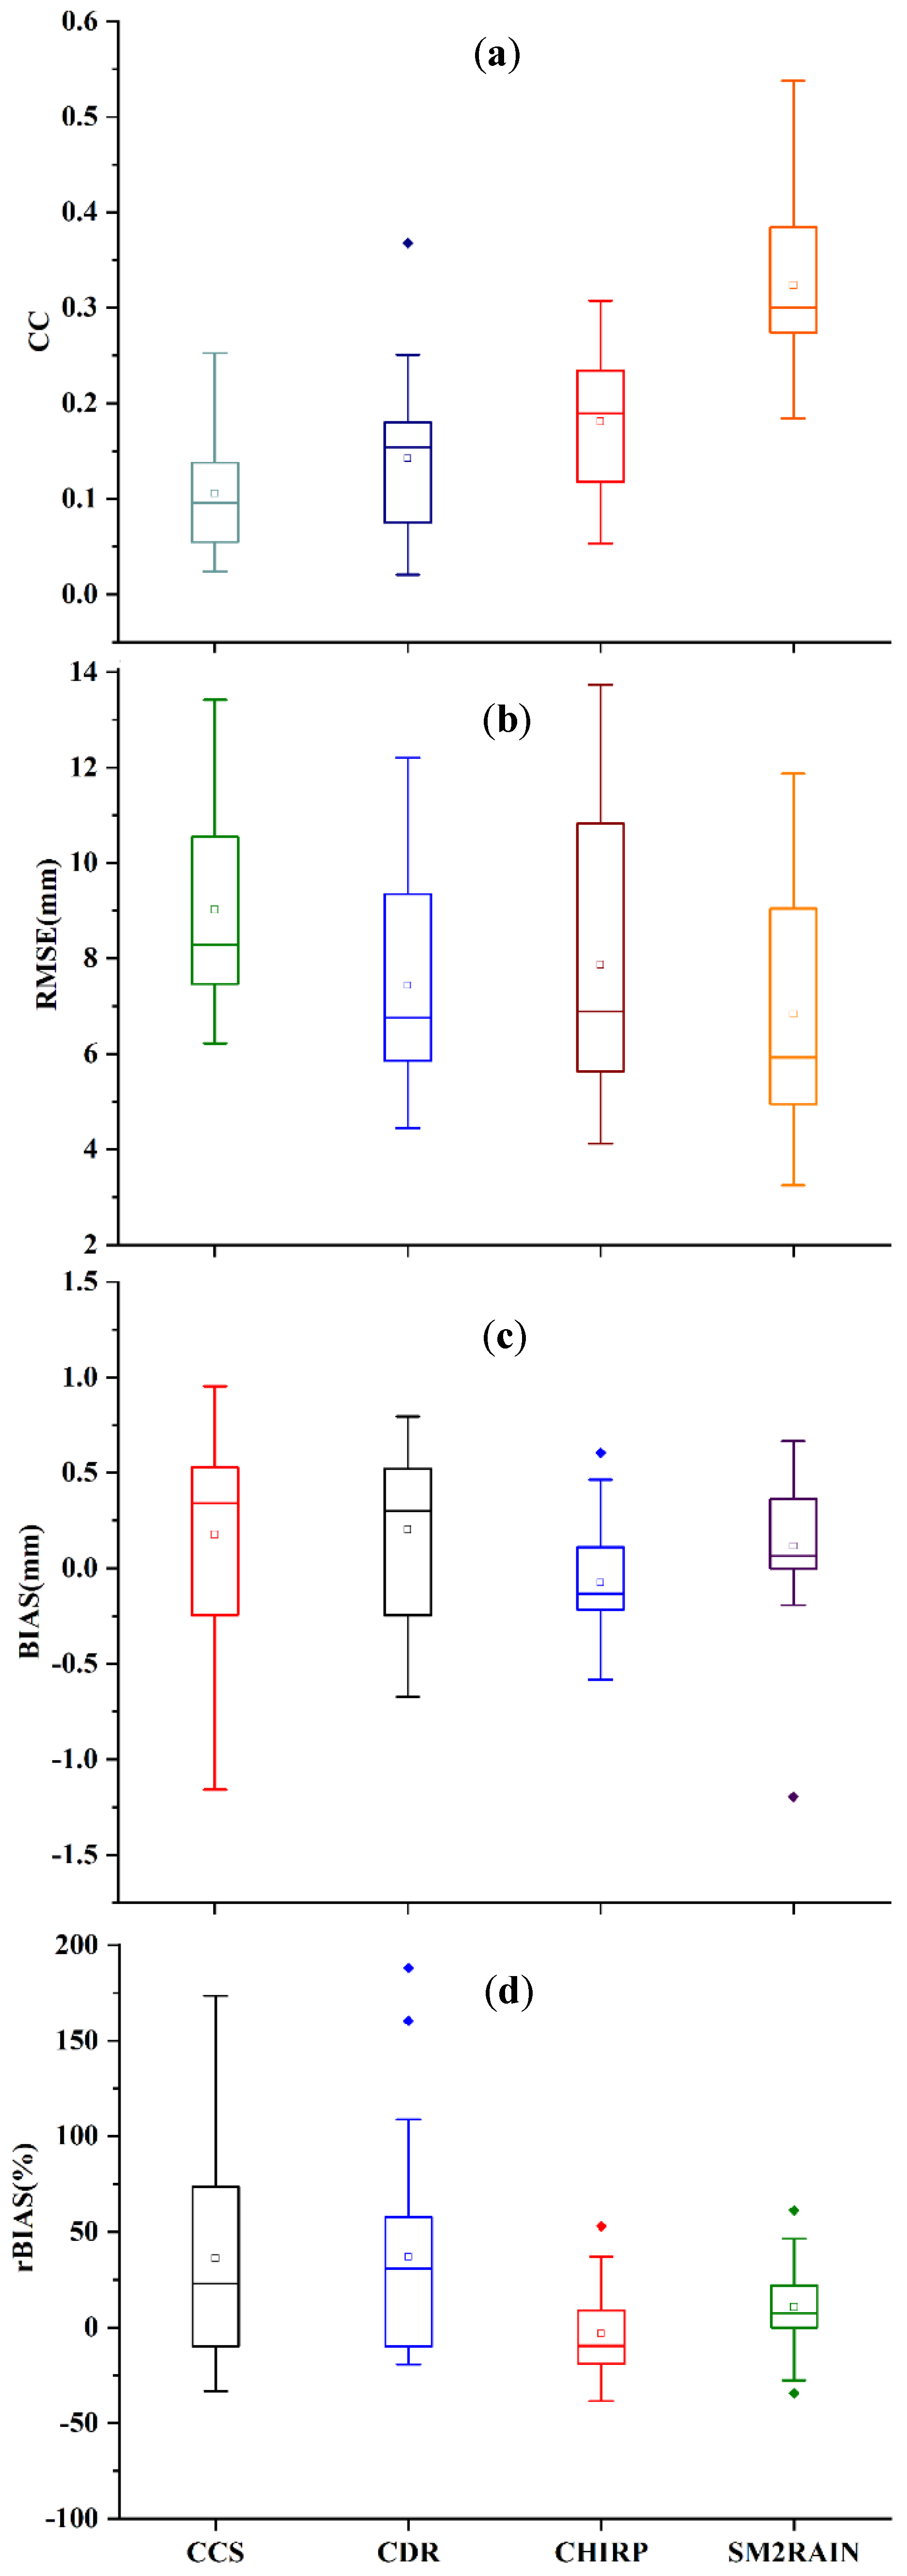
3.3. Performances of the SRPs at the Daily Scale

Figure 6 depicts the daily scale fluctuations in the calculated values of the CC, RMSE, BIAS, and rBIAS for the PERSIANN-CCS, PERSIANN-CDR, CHIRPS-2.0, and SM2RAIN-ASCAT products. PERSIANN-CCS had the shortest CC box length, indicating the least fluctuation in the CC values for this product. In general, all SPPs had a high degree of variability and a weak linear association with the daily gauge data. The BIAS box values for PERSIANN-CCS showed more inconsistency, whereas the BIAS box values in CHIRPS showed the least inconsistency. The RMSE box length for CHIRPS indicated high fluctuations in the estimated values. On the daily scale, all the products had considerable inconsistencies in the values of the assessment indicators.
The summary of the performances of the daily SRPs (PERSIANN-CCS, PERSIANN-CDR, CHIRPS, and SM2RAIN) against gauge-based rainfall data over Punjab Province is presented in Figure 7. The estimated values of the CC for the PERSIANN-CCS, PERSIANN-CDR, CHIRPS, and SM2RAIN products were 0.25, 0.30, 0.40, and 0.60, respectively. This revealed that the daily gauge data had poor agreement with the estimates of the PERSIANN-CCS, PERSIANN-CDR, and CHIRPS products. Moreover, all SRPs showed poor performances in terms of the RMSE, because its values were >0.5.
The impact of elevation change on the SRPs performance was also investigated. As illustrated in Figure 8, the value of the root mean square error (RMSE) for all SRPs increased as the elevation increased. The values of the CC for all SRPs were higher at the higher elevations. The estimated values of the BIAS and rBIAS for both PERSIANN products were lower at the higher elevations, as compared with the SM2Rain and CHIRPS products.
The effect of the daily rainfall intensity on the performances of the considered SRPs was also assessed, as shown in Figure 9. Generally, the error in the estimation of the rainfall was increased with the increase of the rainfall intensity, as indicated by higher values of the RMSE at a high intensity of daily rainfall. The values of the CC for the CHIRPS and PERSIANN-CDR products increased with an increase in the rainfall rate. SM2RAIN showed a slightly decreasing trend in the values of the CC at higher rates of daily rainfall. The values of the BIAS for the PERSIANN-CCS and PERSIANN-CDR products were lower at the higher rates of daily rainfall. However, the values of the BIAS for the CHIRPS and SM2RAIN products were higher at high rainfall rates.

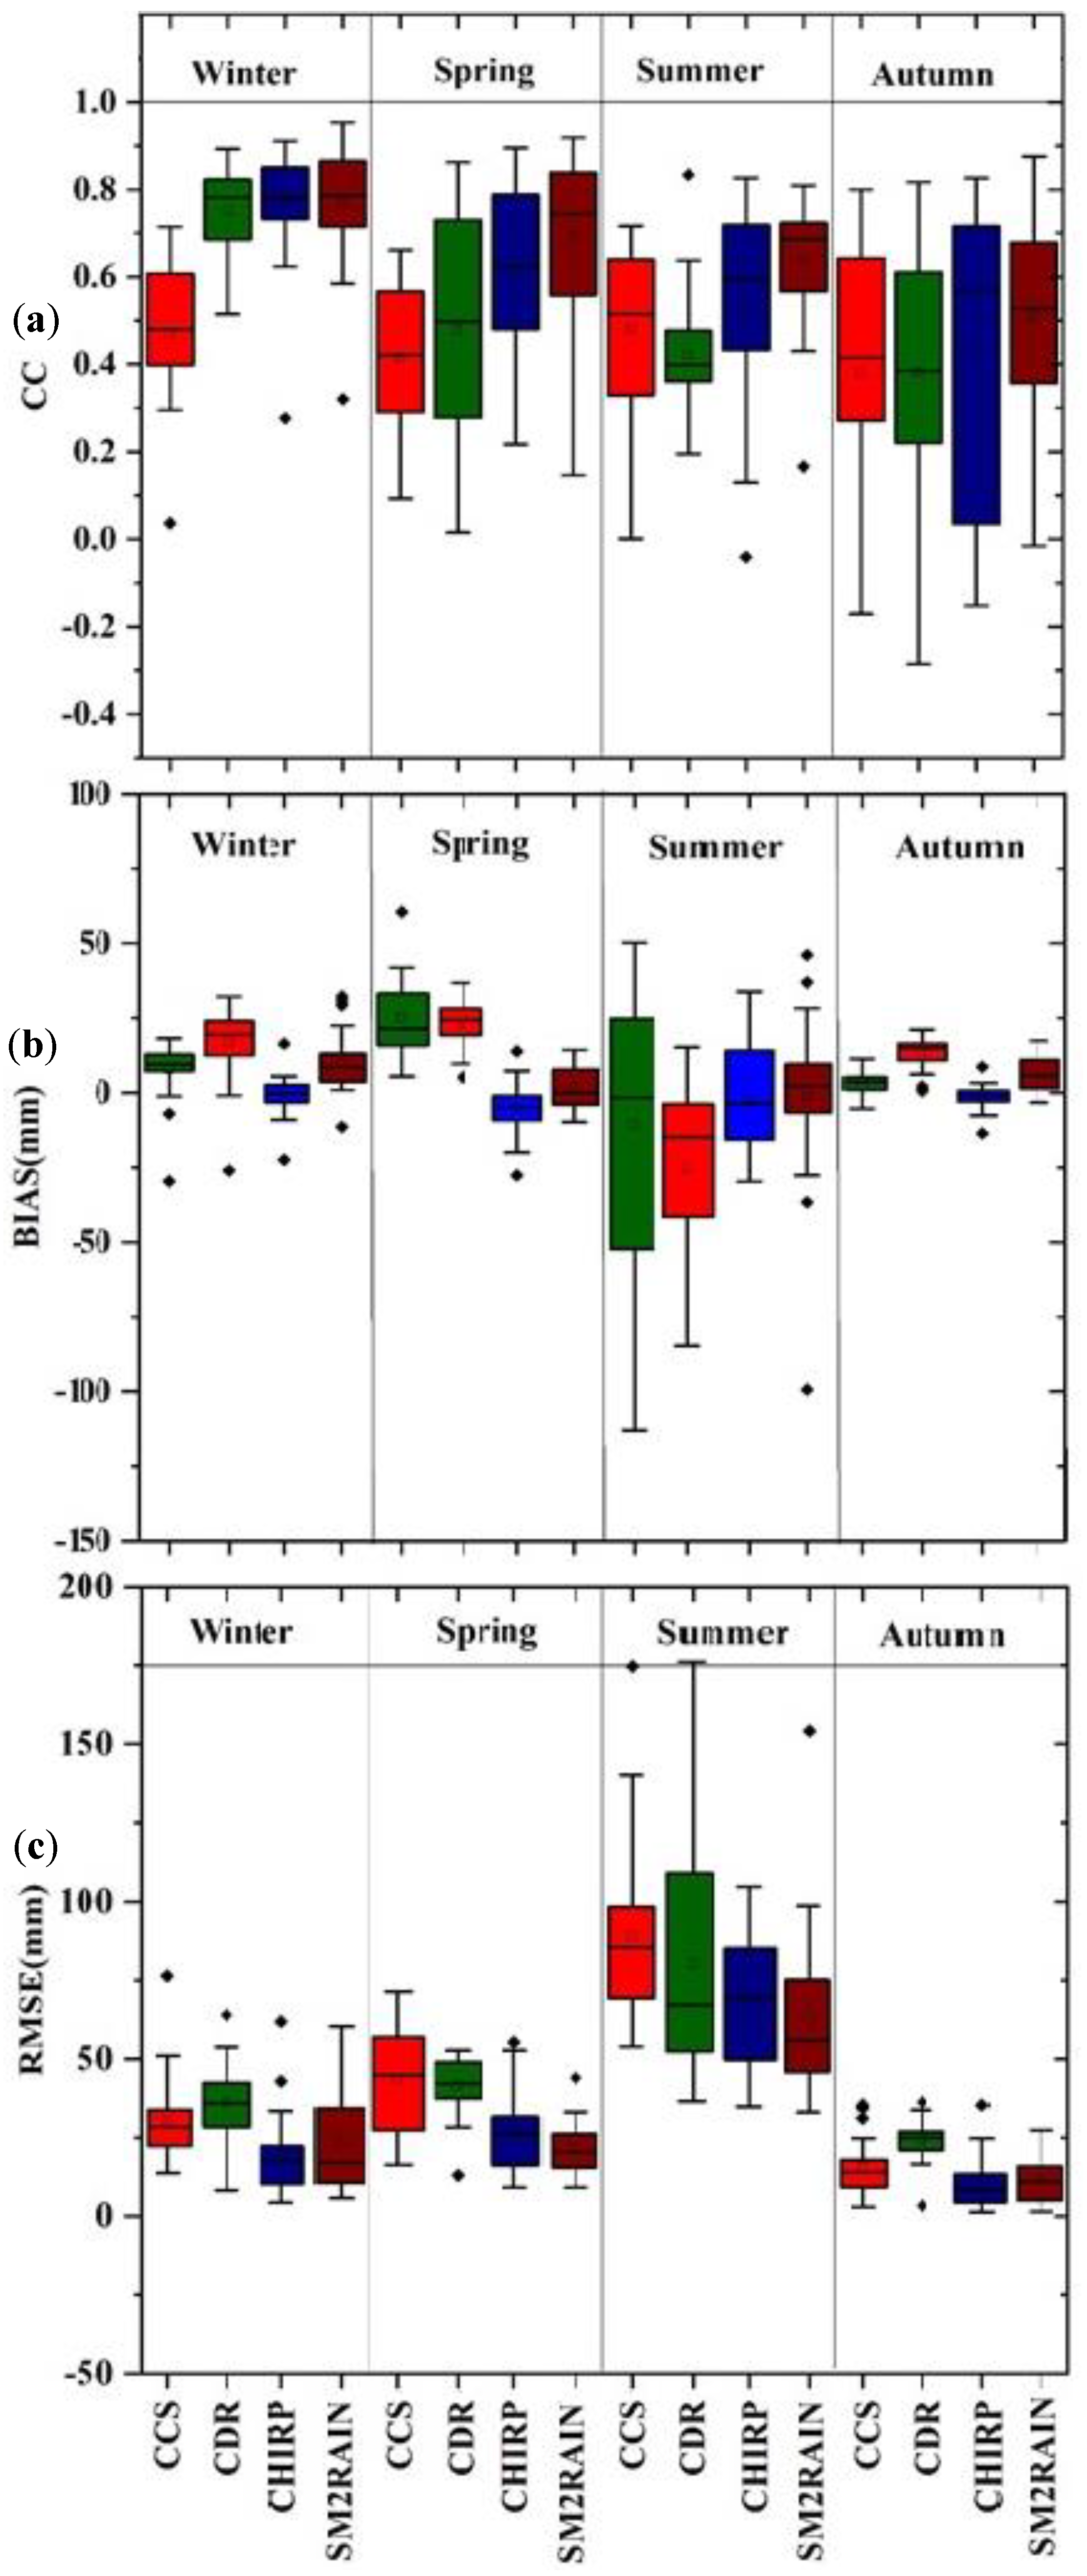
3.4. Performance of SRPs at the Seasonal Scale

Figure 10 depicts the seasonal fluctuation in the estimated assessment indices (CC, RMSE, and BIAS) for four satellite products. As evidenced by the box lengths of the CC values, there are considerable differences in the relationship between in situ station observations and estimations of the PERSIANN-CDR and CHIRPS products during the spring and autumn seasons (Figure 10a). Generally, all products showed less variations in the BIAS values, except for the summer season (Figure 10b). The PERSIANN-CCS product indicted the highest variations in the BIAS values compared to the other SRPs. The pattern of the estimated values of the RMSE for all SRPs was similar to the pattern of the BIAS values in all the seasons.
Figure 11 presents the seasonal variations in the relative biases estimated for all the satellite products. Relatively, both PERSIANN products exhibited high inconsistencies in all the seasons. The CHIRPS-2.0 product showed an underestimation of the total rainfall amounts in all the seasons, whereas the PERSIANN-CCS product showed an overestimation of the rainfall amount in all the seasons. The overall performance of the SM2Rain product was better in the spring and summer seasons. The PERSIANN-CDR product failed to provide acceptable estimates of the rainfall in any season.

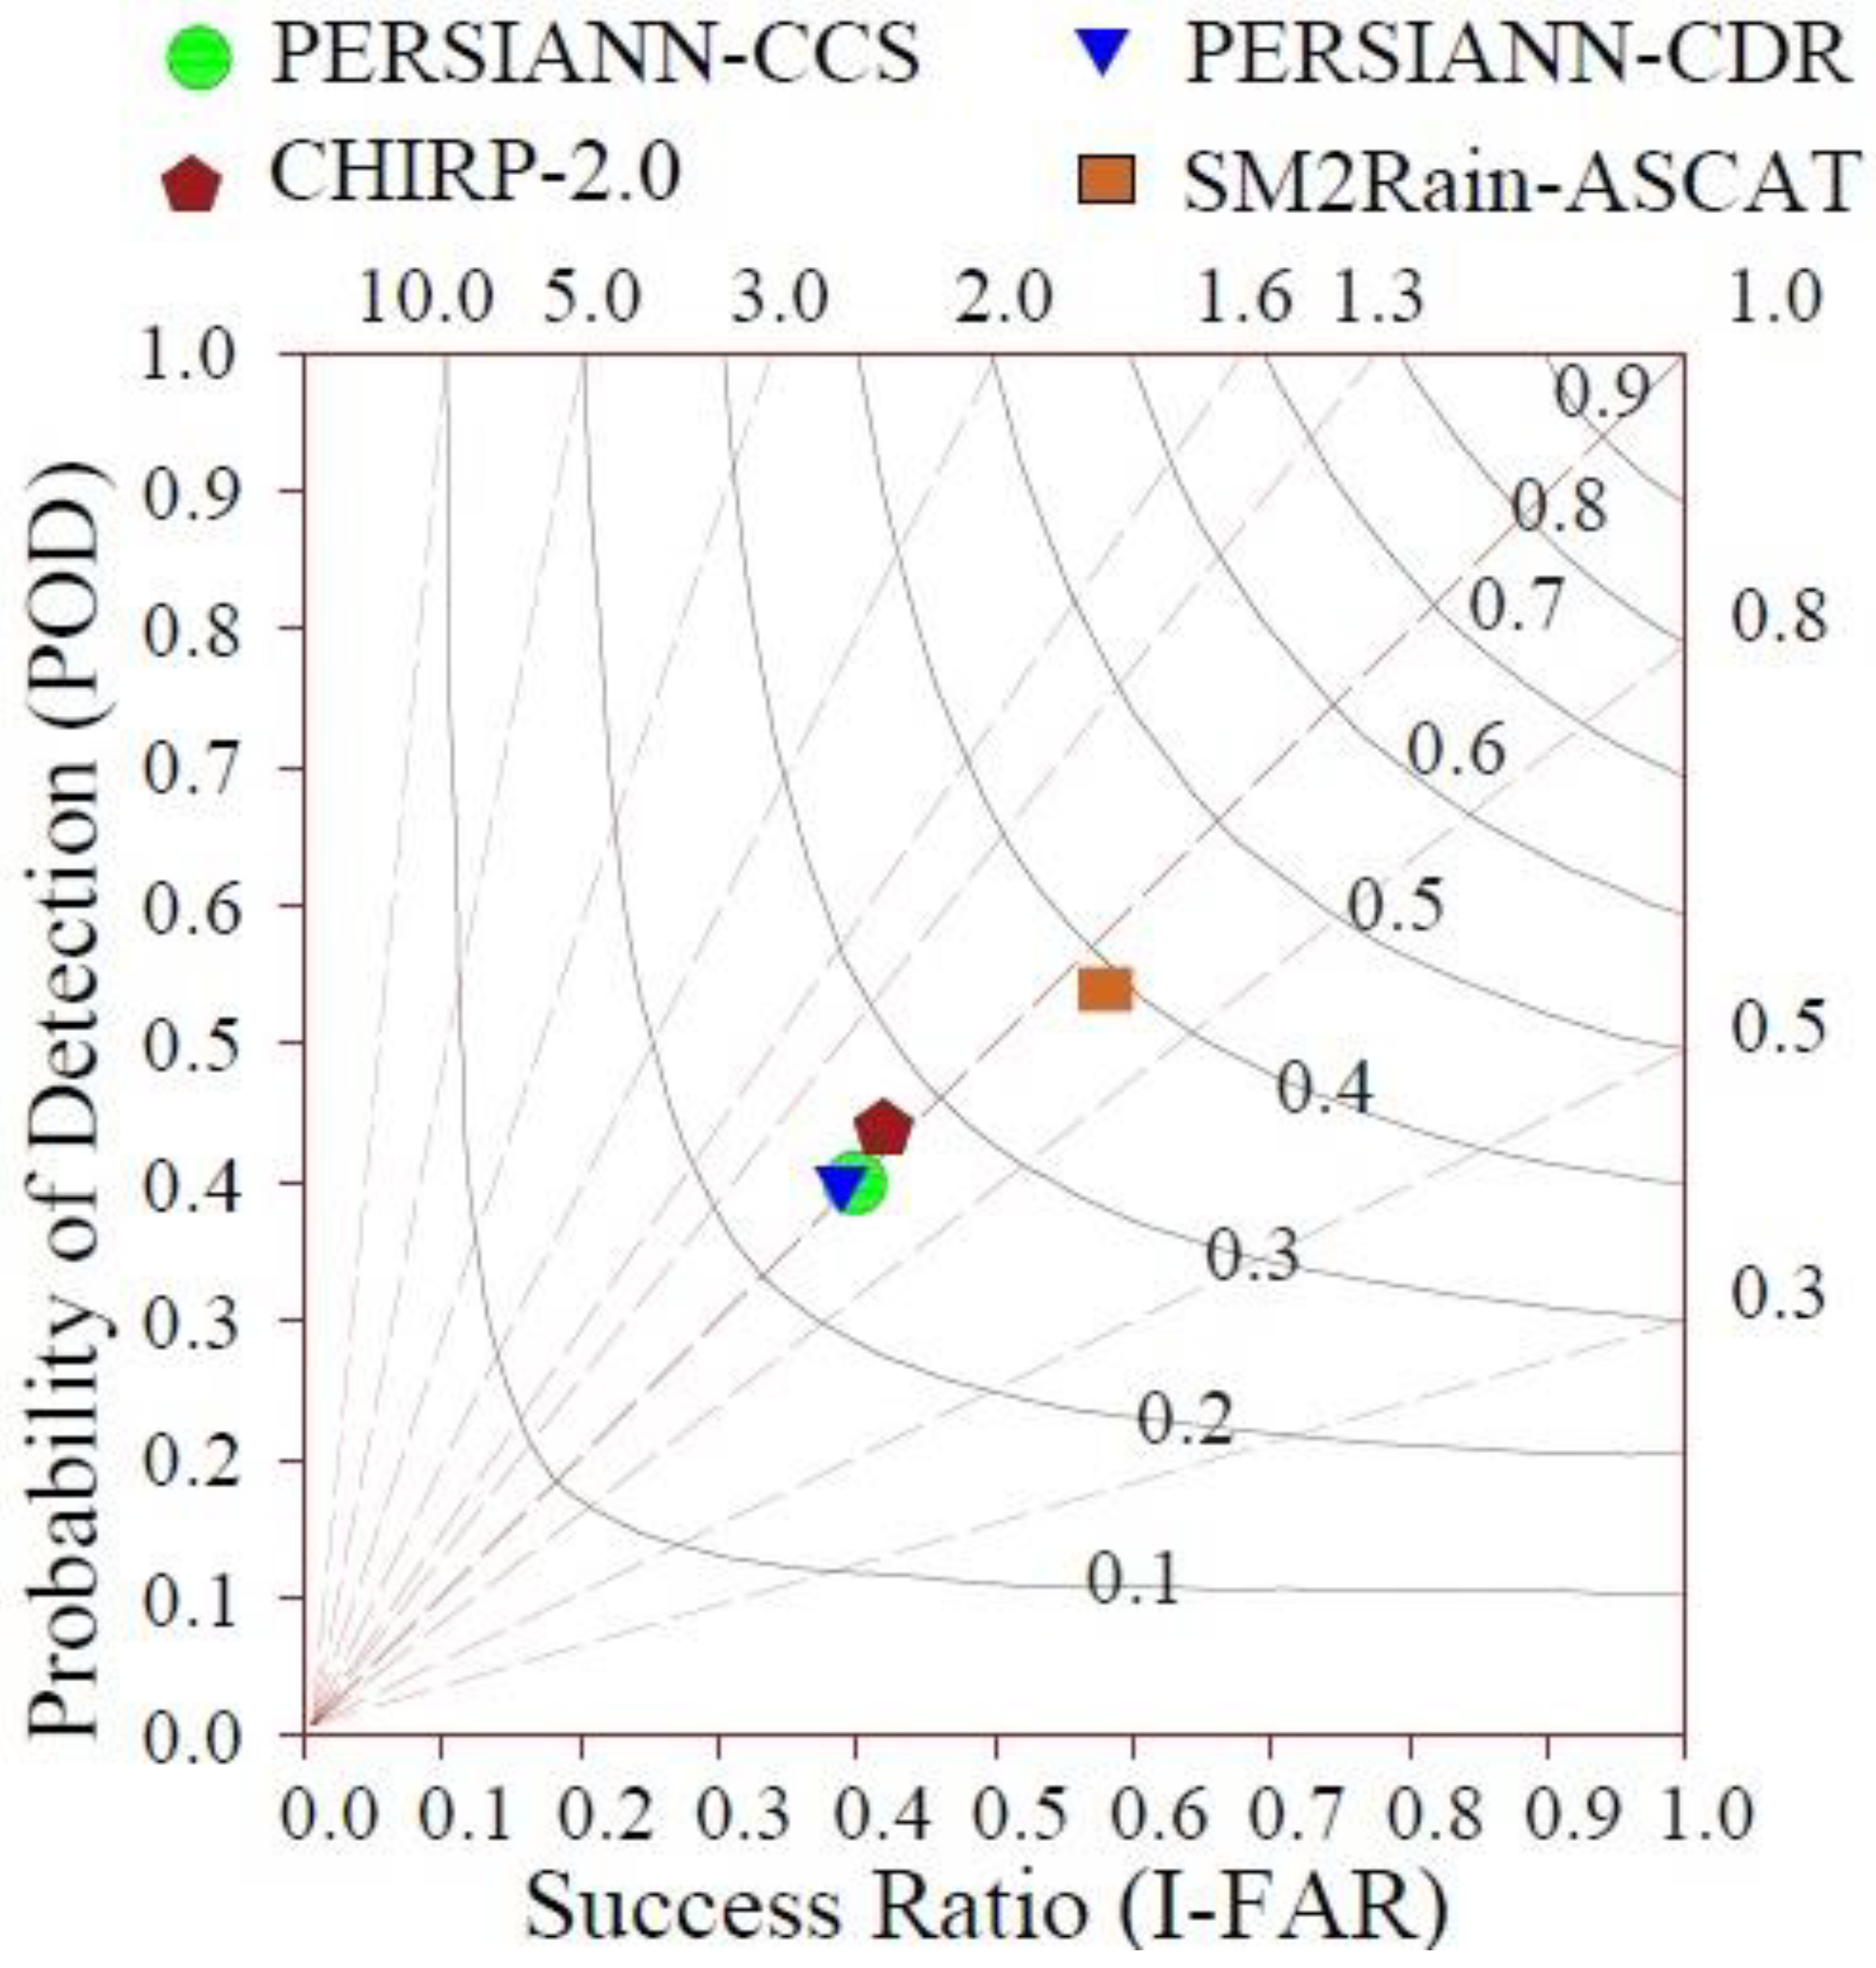
3.5. Skill of SRPs to Record the Occurrence of Rainfall

Figure 12 displays the summary of the skill of SRPs to capture the occurrence of daily rainfall in the Punjab Province of Pakistan. The skill of SRPs to detect the occurrence of daily rainfall was assessed by following the recommendations of a previous study [7]. Based on the estimated values of the categorical indices (POD, CSI, and SR), Reference [33] introduced this diagram, also known as the performance diagram, to elaborate the detection skills of satellite products. It shows the geometric relationship between the SRPs and the records of weather stations. Previously, this picture was utilized to graphically display an overview of the detection abilities of different rainfall products in different regions [10,29,30]. For example, Reference [10] utilized this diagram to compare the rainfall detection abilities of the IMERG and TRMM products over the Hindu-Kush Mountains.
Similarly, References [18,34] utilized this diagram to compare the performances of different SRPs in Brazil and Egypt, respectively. In this diagram, a product is considered as reliable if the estimates values of all the categorical indices are one or near to one. The estimated value of POD (0.58) for the SM2Rain-ASCAT product was higher than other products, presented in Figure 12. The POD of SM2Rain was relatively greater than that of the other products, indicating that this product’s rainfall detection performance was good, and this product detected the majority of the rainfall events. The high SR value for this product also contributed to this conclusion. The low POD and SR values of the CHIRPS and both PERSIANN products revealed that they were unable to detect the occurrence of daily rainfall events.

4. Discussion

This study assessed the accuracy and error characteristics of four SRPs over the Punjab Province of Pakistan using widely used assessment and categorical indices. Previously, the performances of different satellite-based rainfall products (including PERSIANN, CHIRPS-2.0, and SM2Rain-ASCAT products) have been evaluated in different regions of the world [14,27,35,36]. The performances of SRPs are widely known to be highly influenced by regional climatic and topographic conditions. For instance, Reference [24] compared the performance of the PERSIANN-CDR product with other satellite-based products over Malaysia and found that the regional climatology and rainfall retrieval algorithm considerably affected the accuracy of the rainfall products. Hamza et al. [10] compared the performances of the SM2Rain and PERSIANN products and reported that the evaluation indices (RMSE and BIAS) were highly dependent on the regional rainfall patterns, seasonality, and elevation.
In this study, we compared the performances of two PERSIANN products (PERSIANN-CCS and PERSIANN-CDR) with the CHIRPS-2.0 and SM2Rain-ASCAT products over the Punjab Province of Pakistan. The SRPs were evaluated against the daily, monthly, seasonal, and annual observations of 26 in situ weather stations during 2010–2018. The results indicated that the local topography and rainfall intensities significantly impacted the SRP performance (as shown in Figure 8 and Figure 9), which was consistent with previous research [37,38]. Both PERSIANN products were less accurate in tracking the spatial variability of rainfall over the province; this finding was consistent with the results of previous investigations in similar climatic and topographic conditions. The CHIRPS-2.0 and SM2Rain-ASCAT rainfall products could represent the spatial distribution of rainfall, consistent with the findings of Reference [27]. The better performances of the SM2Rain and CHIRPS products in terms of skills to track spatial distribution were also reported by previous studies [27,39,40,41]. As evidenced by the low values of correlation coefficients, the linear agreement between the reference observations and the estimates of all the SRPs was poor at the daily scale (<0.50). However, the agreements between the reference datasets and the datasets of all the SRPs were better than the daily data agreements. The values of the CCs for SM2Rain-ASCAT and CHIRPS-2.0 estimates with the monthly observations of the in situ stations were >0.90, which indicated the better linear relationships of their monthly products with the reference data. For this study area, the summer season revealed more uncertainty in the estimated amounts of rainfall than the other seasons, as indicated by higher variations in the BIAS and RMSE during the summer season for all of the SRPs (Figure 10). This suggested that the greater temperature may also impact the performances of the evaluated satellite-based products. This finding emphasizes the need to assess the impact of temperature on the performance of SRPs. According to Nodzu et al. [42], a similar behavior of the SRPs was found in Vietnam.
It was detected that the correlations between the reference data and the estimates of all the SRPs were increased with the increase of the elevation. The SM2Rain product showed poor performance at higher rainfall rates. These findings are consistent with the results of Hamza et al. [10]. The estimated values of the categorical indices (POD, FAR, CSI, and SR) of the SM2Rain-ASCAT product were better than all the other products. There was a better performance of this product in the plain areas of Iran [43]. The overall detection skill of the CHIRPS product in terms of the POD, CSI, and FAR was very poor compared to the other evaluated products (Figure 12). Similar results of categorical indices were reported by Reference [44].

5. Conclusions

In this study, the performances of four SRPs (PERSIANN-CCS, PERSIANN-CDR, CHIRPS-2.0, and SM2Rain-ASCAT) were evaluated on different spatiotemporal scales with reference to the measurements of 26weather stations in the Punjab Province of Pakistan. All SRPs were assessed from 2010 to 2018. The main findings of the present study are: (1) the performances of the CHIRPS-2.0 and SM2RAIN-ASCAT products outperformed the PERSIANN-CCS and PERSIANN-CDR products in terms of skill to represent the spatial distribution of the observed rainfall over Punjab Province. (2) The temporal variability of the observed daily rainfall over the province was represented well by the CHIRPS-2.0 and SM2Rain-ASCAT products. However, both PERSIANN products (CCS and CDR) failed to track the temporal variation of the average daily rainfall. (3) In general, all the SRPs performed better on a monthly basis (in terms of the CC, RMSE, BIAS, and rBIAS). (4) On the seasonal scale, the rainfall detection skills of the CHIRPS-2.0 and SM2RAIN-ASCAT products were better than those of both PERSIANN products. (5) All SRPs showed higher uncertainty in the estimation of the rainfall amount during the summer season, as indicated by box plots of the BIAS and RMSE for this season. Both PERSIANN products showed significant overestimations of the rainfall amounts during the winter, spring, and autumn seasons. The performance of the SM2Rain-ASCAT product was acceptable during the autumn and summer seasons, with rBIAS <10%.
Our findings demonstrated that the CHIRPS-2.0 and SM2Rain-ASCAT products outperformed the two PERSIANN products in terms of the rainfall estimation skill in the Punjab Province of Pakistan. Due to the fact that both of these SRPs (SM2Rain and CHIRPS) were able to accurately depict the spatiotemporal distribution of the observed rainfall over the province, we recommended their application in understanding the spatial and temporal variabilities of rainfall over the plains of Pakistan. The correlation coefficients between the monthly estimates from the CHIRPS-2.0 and SM2Rain-ASCAT products and reference data were greater than 0.90, and the rBias was less than the allowed limit (±10%). Thus, we recommend that their monthly products be used as a complementary substitution in hydroclimatic research in Punjab Province.

Author Contributions

All authors contributed equally. Conceptualization, M.N.A., M.W. and M.A.M.; methodology, M.N.A., M.I. and U.M.N.; software, M.U.N. and S.u.R.; validation, M.K.L., A.G. and M.I.; formal analysis, M.N.A.; investigation, M.I., S.u.R. and A.G.; resources, M.I., S.u.R. and A.G.; data curation, M.N.A., M.A.M. and M.U.N.; writing—original draft preparation, M.N.A.; writing—review and editing, U.M.N., S.u.R. and A.G.; visualization, M.W. and M.K.L.; supervision, M.I., M.K.L. and M.A.M.; project administration, M.W. and M.K.L.; funding acquisition, M.I., M.K.L., S.u.R. and A.G. All authors have read and agreed to the published version of the manuscript.

Funding

The journal fee was supported by the Higher Education Commission (HEC) of Pakistan Funded Projects: National Centre for Industrial Biotechnology (PSDP-321) and Data Driven Smart Decision Platform (PSDP-332).

Acknowledgments

The authors would like to acknowledge the support of the Deputy for Research and Innovation—Ministry of Education, Kingdom of Saudi Arabia for this research through project number (NU/IFC/INT/01/010) under the Institutional Funding Committee at Najran University, Kingdom of Saudi Arabia. We are thankful to the Pakistan Meteorological Department (PMD) for providing the observations of the in situ weather stations.

Conflicts of Interest

The authors declare no conflict of interest.

Appendix A

Table A1. Salient attributes of the considered weather stations.
NoStation NameLong (°)Lat (°)Elevation (m)Average Annual Rainfall (mm/Year)
1Bahawal Nagar73.2430.00161307
2Bahawal Pur71.7829.33110181
3Bahawal Pur (A/P)71.6829.38119206
4Bhakkar71.0631.62162355
5Chakwal72.8532.92519655
6D.G. Khan70.6330.05148246
7Faisalabad73.1331.43186438
8Gujranwala74.3532.36227857
9Gujrat74.0632.56240780
10Jauharabad72.4332.50187458
11Jhang72.3231.26158420
12Jhelum73.7332.93287860
13Khanpur70.6828.6588243
14Lahore A.P.74.4031.58216792
15Mandi Bahauddin73.8032.96253776
16Mangla73.6333.06283900
17Multan71.4330.20122252
18Noorpur Thal71.9031.87186554
19Okara73.4330.80180408
20Rahim Yar Khan70.3228.4383151
21Rawalpindi73.0233.565081271
22Sahiwal73.1630.65172341
23Sargodha72.6632.05187535
24Sialkot74.5332.522551016
25Sialkot Airport74.0332.53240925
26Toba Tek Singh72.7830.98155367

Appendix B

Figure A1. Over the Punjab Province of Pakistan.
Water 14 00147 g0a1

References

  1. Akhtar, N.; Syakir Ishak, M.I.; Bhawani, S.A.; Umar, K. Various natural and anthropogenic factors responsible for water quality degradation: A review. Water 2021, 13, 2660. [Google Scholar] [CrossRef]
  2. Zhang, Y.; Xu, C.Y.; Hao, Z.; Zhang, L.; Ju, Q.; Lai, X. Variation of melt water and rainfall runoff and their impacts on streamflow changes during recent decades in two tibetan plateau basins. Water 2020, 12, 3112. [Google Scholar] [CrossRef]
  3. Ahmed, E.; Al Janabi, F.; Zhang, J.; Yang, W.; Saddique, N.; Krebs, P. Hydrologic assessment of TRMM and GPM-based precipitation products in transboundary river catchment (Chenab River, Pakistan). Water 2020, 12, 1902. [Google Scholar] [CrossRef]
  4. Hussein, K.A.; Alsumaiti, T.S.; Ghebreyesus, D.T.; Sharif, H.O.; Abdalati, W. High-resolution spatiotemporal trend analysis of precipitation using satellite-based products over the United Arab Emirates. Water 2021, 13, 2376. [Google Scholar] [CrossRef]
  5. Bilal, H.; Govindan, R.; Al-Ansari, T. Investigation of groundwater depletion in the state of qatar and its implication to energy water and food nexus. Water 2021, 13, 2464. [Google Scholar] [CrossRef]
  6. Anjum, M.N.; Ding, Y.; Shangguan, D.; Ahmad, I.; Ijaz, M.W.; Farid, H.U.; Yagoub, Y.E.; Zaman, M.; Adnan, M. Performance evaluation of latest integrated multi-satellite retrievals for Global Precipitation Measurement (IMERG) over the northern highlands of Pakistan. Atmos. Res. 2018, 205, 105135. [Google Scholar] [CrossRef]
  7. Yang, M.; Li, Z.; Anjum, M.N.; Gao, Y. Performance Evaluation of Version 5 (V05) of Integrated Multi-Satellite Retrievals for Global Precipitation Measurement (IMERG) over the Tianshan Mountains of China. Water 2019, 11, 1139. [Google Scholar] [CrossRef] [Green Version]
  8. Bartalis, Z.; Naeimi, V.; Wagner, W. ASCAT Soil Moisture Product Handbook; ASCAT Soil Moisture Report Series, No. 15; Institute of Photogrammetry and Remote Sensing: Vienna, Austria; Vienna University of Technology: Vienna, Austria, 2008. [Google Scholar]
  9. Brocca, L.; Ciabatta, L.; Massari, C.; Moramarco, T.; Hahn, S.; Hasenauer, S.; Kidd, R.; Dorigo, W.; Wagner, W.; Levizzani, V. Soil as a natural rain gauge: Estimating global rainfall from satellite soil moisture data. J. Geophys. Res. Atmos. Res. 2014, 119, 5128–5141. [Google Scholar] [CrossRef]
  10. Nguyen, P.; Ombadi, M.; Gorooh, V.A.; Shearer, E.J.; Sadeghi, M.; Sorooshian, S.; Hsu, K.; Bolvin, D.; Ralph, M.F. Persiann dynamic infrared–rain rate (PDIR-now): A near-real-time, quasi-global satellite precipitation dataset. J. Hydrometeorol. 2020, 21, 2893–2906. [Google Scholar] [CrossRef]
  11. Sadeghi, M.; Nguyen, P.; Naeini, M.R.; Hsu, K.; Braithwaite, D.; Sorooshian, S. PERSIANN-CCS-CDR, a 3-hourly 0.04° global precipitation climate data record for heavy precipitation studies. Sci. Data 2021, 8, 1–11. [Google Scholar] [CrossRef]
  12. Mazzoglio, P.; Laio, F.; Balbo, S.; Boccardo, P.; Disabato, F. Improving an Extreme Rainfall Detection System with GPM IMERG data. Remote Sens. 2019, 11, 677. [Google Scholar] [CrossRef] [Green Version]
  13. Li, G.; Yu, Z.; Wang, W.; Ju, Q.; Chen, X. Analysis of the spatial Distribution of precipitation and topography with GPM data in the Tibetan Plateau. Atmos. Res. 2021, 247, 105259. [Google Scholar] [CrossRef]
  14. Hamza, A.; Anjum, M.N.; Cheema, M.J.M.; Chen, X.; Afzal, A.; Azam, M.; Shafi, M.K.; Gulakhmadov, A. Assessment of IMERG-V06, TRMM-3B42V7, SM2RAIN-ASCAT, and PERSIANN-CDR precipitation products over the hindu kush mountains of Pakistan, South Asia. Remote Sens. 2020, 12, 3871. [Google Scholar] [CrossRef]
  15. Ali, A.F.; Xiao, C.; Anjum, M.N.; Adnan, M.; Nawaz, Z.; Ijaz, M.W.; Sajid, M.; Farid, H.U. Evaluation and comparison of TRMM multi-satellite precipitation products with reference to rain gauge observations in Hunza River basin, Karakoram Range, northern Pakistan. Sustainability 2017, 9, 954. [Google Scholar] [CrossRef] [Green Version]
  16. Anjum, M.N.; Ding, Y.; Shangguan, D.; Ijaz, M.W.; Zhang, S. Evaluation of High-Resolution Satellite-Based Real-Time and Post-Real-Time Precipitation Estimates during 2010 Extreme Flood Event in Swat River Basin, Hindukush Region. Adv. Meteorol. 2016, 2016, 2604980. [Google Scholar] [CrossRef]
  17. Skofronick-Jackson, G.; Petersen, W.A.; Berg, W.; Kidd, C.; Stocker, E.F.; Kirschbaum, D.B.; Kakar, R.; Braun, S.A.; Huffman, G.J.; Iguchi, T.; et al. The global precipitation measurement (GPM) mission for science and Society. Bull. Am. Meteorol. Soc. 2017, 98, 1679–1695. [Google Scholar] [CrossRef]
  18. Rozante, J.R.; Vila, D.A.; Chiquetto, J.B.; Fernandes, A.d.A.; Alvim, D.S. Evaluation of TRMM/GPM blended daily products over Brazil. Remote Sens. 2018, 10, 882. [Google Scholar] [CrossRef] [Green Version]
  19. Vu, T.T.; Li, L.; Jun, K.S. Evaluation of multi-satellite precipitation products for streamflow simulations: A case study for the Han River Basin in the Korean Peninsula, East Asia. Water 2018, 10, 642. [Google Scholar] [CrossRef] [Green Version]
  20. Ren, P.; Li, J.; Feng, P.; Guo, Y.; Ma, Q. Evaluation of multiple satellite precipitation products and their use in hydrological modelling over the Luanhe River Basin, China. Water 2018, 10, 677. [Google Scholar] [CrossRef] [Green Version]
  21. Zhao, C.; Ren, L.; Yuan, F.; Zhang, L.; Jiang, S.; Shi, J.; Chen, T.; Liu, S.; Yang, X.; Liu, Y.; et al. Statistical and hydrological evaluations of multiple satellite precipitation products in the yellow river source region of china. Water 2020, 12, 3082. [Google Scholar] [CrossRef]
  22. Bartsotas, N.S.; Anagnostou, E.N.; Nikolopoulos, E.I.; Kallos, G. Investigating Satellite Precipitation Uncertainty Over Complex Terrain. J. Geophys. Res. Atmos. 2018, 123, 5346–5359. [Google Scholar] [CrossRef]
  23. Sharifi, E.; Steinacker, R.; Saghafian, B. Assessment of GPM-IMERG and other precipitation products against gauge data under different topographic and climatic conditions in Iran: Preliminary results. Remote Sens. 2016, 8, 135. [Google Scholar] [CrossRef] [Green Version]
  24. Tan, M.L.; Santo, H. Comparison of GPM IMERG, TMPA 3B42 and PERSIANN-CDR satellite precipitation products over Malaysia. Atmos. Res. 2018, 202, 63–76. [Google Scholar] [CrossRef]
  25. Huang, W.-R.; Liu, P.-Y.; Hsu, J. Multiple timescale assessment of wet season precipitation estimation over Taiwan using the PERSIANN family products. Int. J. Appl. Earth Obs. Geoinf. 2021, 103, 102521. [Google Scholar] [CrossRef]
  26. Almazroui, M.; Islam, M.N.; Saeed, F.; Alkhalaf, A.K.; Dambul, R. Assessing the robustness and uncertainties of projected changes in temperature and precipitation in AR5 Global Climate Models over the Arabian Peninsula. Atmos. Res. 2017, 194, 202–213. [Google Scholar] [CrossRef]
  27. Mosaffa, H.; Shirvani, A.; Khalili, D.; Nguyen, P.; Sorooshian, S. Post and near real-time satellite precipitation products skill over Karkheh River Basin in Iran. Int. J. Remote Sens. 2020, 41, 6484–6502. [Google Scholar] [CrossRef]
  28. Farid, H.U.; Ahmad, I.; Anjum, M.N.; Khan, Z.M.; Iqbal, M.M.; Shakoor, A.; Mubeen, M. Assessing seasonal and long-term changes in groundwater quality due to over-abstraction using geostatistical techniques. Environ. Earth Sci. 2019, 78, 386. [Google Scholar] [CrossRef]
  29. Iqbal, M.F.; Athar, H. Validation of satellite based precipitation over diverse topography of Pakistan. Atmos. Res. 2018, 201, 247–260. [Google Scholar] [CrossRef]
  30. Ahmad, I.; Zhang, F.; Tayyab, M.; Anjum, M.N.; Zaman, M.; Liu, J.; Farid, H.U.; Saddique, Q. Spatiotemporal analysis of precipitation variability in annual, seasonal and extreme values over upper Indus River basin. Atmos. Res. 2018, 213, 346–360. [Google Scholar] [CrossRef]
  31. Baccou, J.; Liandrat, J. Kriging-based subdivision schemes: Application to the reconstruction of non-regular environmental data. Math. Comput. Simul. 2011, 81, 2033–2050. [Google Scholar] [CrossRef] [Green Version]
  32. Li, J.; Heap, A.D. A review of comparative studies of spatial interpolation methods in environmental sciences: Performance and impact factors. Ecol. Inform. 2011, 6, 228–241. [Google Scholar] [CrossRef]
  33. Roebber, P.J. Visualizing Multiple Measures of Forecast Quality. Weather Forecast. 2009, 24, 601–608. [Google Scholar] [CrossRef] [Green Version]
  34. Nashwan, M.S.; Shahid, S.; Wang, X. Assessment of Satellite-Based Precipitation Measurement Products over the Hot Desert Climate of Egypt. Remote Sens. 2019, 11, 555. [Google Scholar] [CrossRef] [Green Version]
  35. Gao, F.; Zhang, Y.; Chen, Q.; Wang, P.; Yang, H.; Yao, Y.; Cai, W. Comparison of two long-term and high-resolution satellite precipitation datasets in Xinjiang, China. Atmos. Res. 2018, 212, 150–157. [Google Scholar] [CrossRef]
  36. Tang, X.; Zhang, J.; Gao, C.; Ruben, G.B.; Wang, G. Assessing the uncertainties of four precipitation products for SWAT modeling in Mekong River Basin. Remote Sens. 2019, 11, 304. [Google Scholar] [CrossRef] [Green Version]
  37. Anjum, M.N.; Ding, Y.; Shangguan, D.; Liu, J.; Ahmad, I.; Ijaz, M.W.; Khan, M.I. Quantification of spatial temporal variability of snow cover and hydro-climatic variables based on multi-source remote sensing data in the Swat watershed, Hindukush Mountains, Pakistan. Meteorol. Atmos. Phys. 2019, 131, 467–486. [Google Scholar] [CrossRef]
  38. Zhang, Y.; Wu, C.; Yeh, P.J.-F.; Li, J.; Hu, B.X.; Feng, P.; Jun, C. Evaluation and comparison of precipitation estimates and hydrologic utility of CHIRPS, TRMM 3B42 V7 and PERSIANN-CDR products in various climate regimes. Atmos. Res. 2021, 265, 105881. [Google Scholar] [CrossRef]
  39. Beck, H.E.; Vergopolan, N.; Pan, M.; Levizzani, V.; van Dijk, A.I.J.M.; Weedon, G.P.; Brocca, L.; Pappenberger, F.; Huffman, G.J.; Wood, E.F. Global-scale evaluation of 22 precipitation datasets using gauge observations and hydrological modeling. Hydrol. Earth Syst. Sci. 2017, 21, 6201–6217. [Google Scholar] [CrossRef] [Green Version]
  40. Jonah, K.; Wen, W.; Shahid, S.; Ali, M.A.; Bilal, M.; Habtemicheal, B.A.; Iyakaremye, V.; Qiu, Z.; Almazroui, M.; Wang, Y.; et al. Spatiotemporal variability of rainfall trends and influencing factors in Rwanda. J. Atmos. Sol.-Terr. Phys. 2021, 219, 105631. [Google Scholar] [CrossRef]
  41. Zhong, R.; Chen, X.; Lai, C.; Wang, Z.; Lian, Y.; Yu, H.; Wu, X. Drought monitoring utility of satellite-based precipitation products across mainland China. J. Hydrol. 2019, 568, 343–359. [Google Scholar] [CrossRef]
  42. Nodzu, M.I.; Matsumoto, J.; Trinh-Tuan, L.; Ngo-Duc, T. Precipitation estimation performance by Global Satellite Mapping and its dependence on wind over northern Vietnam. Prog. Earth Planet. Sci. 2019, 6, 58. [Google Scholar] [CrossRef] [Green Version]
  43. Eini, M.R.; Olyaei, M.A.; Kamyab, T.; Teymoori, J.; Brocca, L.; Piniewski, M. Evaluating three non-gauge-corrected satellite precipitation estimates by a regional gauge interpolated dataset over Iran. J. Hydrol. Reg. Stud. 2021, 38, 100942. [Google Scholar] [CrossRef]
  44. Mu, Y.; Biggs, T.; Shen, S.S.P. Satellite-based precipitation estimates using a dense rain gauge network over the Southwestern Brazilian Amazon: Implication for identifying trends in dry season rainfall. Atmos. Res. 2021, 261, 105741. [Google Scholar] [CrossRef]
Figure 1. Topographic features of Punjab Province and locations of considered weather stations.
Water 14 00147 g001
Figure 2. Spatial variation of the average daily rainfall amount obtained from the in situ weather stations and satellite products (CHIRPS 2.0, PERSIANN-CCS, PERSIANN-CDR, and SM2RAIN-ASCAT) from 2010 to 2018.
Water 14 00147 g002
Figure 3. Comparison of the reference (gauge-based) average daily rainfall across the Punjab Province of Pakistan with the average daily rainfall of (a) SM2Rain-ASCAT, (b) CHIRPS-2.0, (c) PERSIANN-CDR, and (d) PERSIANN-CCS.
Water 14 00147 g003
Figure 4. Taylor diagram showing the summary of the performances of the monthly rainfall estimates of SM2Rain-ASCAT, CHIRPS-2.0, PERSIANN-CDR, and PERSIANN-CCS in the Punjab Province of Pakistan. The semi-circular green lines show the values of the RMSE, and straight blue lines show the values of the CC.
Water 14 00147 g004
Figure 5. Box plots of monthly values of the (a) CC, (b) RMSE), (c) BIAS, and (d) rBIAS forSM2Rain-ASCAT, CHIRPS-2.0, PERSIANN-CDR, and PERSIANN-CCS.
Water 14 00147 g005
Figure 6. Box plots of the daily values of the (a) CC, (b) RMSE), (c) BIAS, and (d) rBIAS for the PERSIANN-CCS, PERSIANN-CDR, CHIRPS, and SM2Rain products.
Water 14 00147 g006
Figure 7. Taylor diagram presenting the summary of the performances of the PERSIANN-CCS, PERSIANN-CDR, CHIRPS, and SM2Rain products with reference to the daily weather station-based data.
Water 14 00147 g007
Figure 8. Scatter plots of assessment indices versus elevation on the daily scale.
Water 14 00147 g008
Figure 9. Scatter plots between the assessment indices versus rainfall intensity.
Water 14 00147 g009
Figure 10. Seasonal variations in the CC, RMSE, and Bias of the PERSIANN-CCS, PERSINN-CDR, CHIRPS-2.0, and SM2Rain-ASCAT products estimated for the Punjab Province of Pakistan.
Water 14 00147 g010
Figure 11. Seasonal variations in the estimated values of the rBIAS for the PERSIANN-CCS, PERSIANN-CDR, SM2Rain-ASCAT, and CHIRPS-2.0 products.
Water 14 00147 g011
Figure 12. Performance diagram demonstrating the skill of four SRPs (PERSIANN-CDR, PERSIANN-CCS, CHIRPS-2.0, and SM2Rain-ASCAT) in detecting the daily rainfall over Punjab Province.
Water 14 00147 g012
Publisher’s Note: MDPI stays neutral with regard to jurisdictional claims in published maps and institutional affiliations.

