
Economic Analysis of Atomization Drying of Concentrated Solution Based on Zero Discharge of Desulphurization Wastewater

1
China Southern Power Grid Technology Co., Ltd., Guangzhou 510080, China
2
School of Electric Power, South China University of Technology, Guangzhou 510640, China
*
Author to whom correspondence should be addressed.
Water 2022, 14(2), 148; https://doi.org/10.3390/w14020148
Submission received: 1 December 2021
/
Revised: 23 December 2021
/
Accepted: 29 December 2021
/
Published: 7 January 2022
(This article belongs to the Section Wastewater Treatment and Reuse)
Abstract
:With the improvement of environmental protection requirements, more and more attention has been given to desulphurization wastewater with zero discharge in coal power plants. Atomization drying is part of the main zero discharge technologies at present. Economic analysis of the atomization drying of desulphurization wastewater is beneficial to the formulation of an appropriate operation scheme and to the reduction of operation costs. The economic analysis and sensitivity analysis of different operating conditions such as unit load, the handling capacity of concentrates, and the temperature of the extracted flue gas in the atomization drying process of concentrated desulfurized wastewater were carried out in this paper. The main cost of the drying process came from the influence of flue gas extraction on the overall heat transfer in the boiler, resulting in the decrease in power generation revenue, which can reach more than 80%. The operating cost of auxiliary machinery was relatively low. The cost of treatment for per ton of concentrates increased first and then decreased with the increase in temperature of the extracted flue gas, and it decreased with the increase in the handling capacity of the concentrates. The effect of a unit load on the treatment cost was also related to the temperature of the extracted flue gas, and the optimal flue gas temperature increase to higher temperatures as the unit load decreased. The minimum treatment costs per ton of concentrate ranged from CNY 143.54/t to CNY 158.77/t under different unit loads. Sensitivity analysis showed that the temperature of the extracted flue gas had the greatest impact on treatment cost, and its sensitivity coefficient was 0.0834. The ways in which to improve economic benefits were discussed.
1. Introduction
In order to meet the environmental protection requirements, coal power plants need to desulphurize flue gas. The most widely used desulfurization technology in coal power plants is limestone–gypsum wet flue gas desulphurization (WFGD) technology [1,2]. To ensure the desulfurization efficiency and equipment safety, the fluorine and chlorine content in the desulfurization liquid slurry should be controlled within a certain range, so it is necessary to regularly discharge desulfurization wastewater to maintain the chlorine balance of the system [3,4]. There are a lot of pollutants in desulfurization wastewater [5,6], meaning that desulfurized wastewater cannot be directly discharged or directly reused and needs to be treated [7].
The main traditional desulfurization wastewater treatment process is chemical precipitation [8], and the suspended matter in the desulfurization wastewater is precipitated by adding chemical agents. Advanced treatment processes include membrane separation technology [9], the biological treatment method [10], and so on. Nanoporous materials are also commonly used to remove contaminants from wastewater [11,12,13]. With the improvement of environmental protection requirements, the concept of zero liquid discharge has also been encouraged for several saline wastewater sources, such as desalination brine and textile wastewater [14,15]. Evaporation is mostly used to evaporate pretreated desulfurization wastewater concentrate to achieve wastewater with zero discharge.
Flue evaporation technology has become one of the main technical means for the desulfurization wastewater with zero discharge due to its many advantages, such as its simple process operation system, low modification difficulty, and low operating costs [16]. However, since desulfurization wastewater contains complex substances and has corrosive components such as chlorine, it will corrode the flue and equipment if the evaporation process is not complete. The use of independent equipment for atomization drying is conducive to its maintenance and does not affect the operation of the main equipment [17].
As people pay more attention to desulfurization wastewater with zero discharge, researchers have begun to study the drying of wastewater by means of atomization. Ye [18] studied the effects of injection velocity, liquid film angle, flue gas velocity on the evaporation process through numerical simulation. They found that increasing the injection velocity and the liquid film thickness and reducing the flue gas velocity was beneficial to evaporation. Liang [19] studied the effect of solid particles on evaporation and crystallization process. The results showed that solid particles had no effect on evaporation, but the solid particles in desulfurization wastewater, such as SiO2, CaCO3, Fe2O3, and Fe3O4, sped up the crystallization. Chen used the single droplet drying method [20] and pilot-scale spray drying system [21] to study the HCl migration characteristics during the evaporation of desulfurization wastewater and proposed that the release of chloride ions went through three phases. Ma [22] also studied the characteristics of HCl volatilization during wastewater evaporation and pointed out that using Ca(OH)2 to adjust the pH value of desulfurization wastewater to be between 9.0 and 10.0 can inhibit the volatilization of chlorides during high-temperature evaporation. Sun [17] conducted flue gas evaporation and drying on the desulfurization wastewater of a 330 MW coal power plant and found that the moisture content of the bottom ash was below 1.1% under different unit loads, proving that the evaporation system could meet the needs of different loads.
How to ensure that desulfurization wastewater generates zero discharge has been given a great deal of attention; however, all of the existing research on desulfurization wastewater with zero discharge has all been technical research, and there are no research reports on its economic analysis. Without the guidance of economic research, although the environmental protection requirements for wastewater with zero discharge can be met, the operating conditions are often not optimal, which will cause energy to be wasted. Studying the economics of different operating conditions is conducive to formulating a suitable operating plan on the basis of meeting the evaporation requirements and reducing operating costs. This is conducive to reducing energy consumption, which, in turn, contributes to the reduction of carbon emissions. However, there is no relevant research yet, and it is necessary to conduct economic research on different operation schemes that take place during the processes for desulfurization wastewater with zero discharge. Sensitivity analysis is one of the methods that can be used to analyze the uncertainty in the operation process, which can analyze the degree of influence of different parameters on the economics of the project [23,24]. Unit load, the handling capacity of concentrates, and the temperature of the extracted flue gas will all have an impact on the economics of system operation. It is necessary to conduct a sensitivity analysis on the economics of atomization drying.
This paper conducted a comprehensive economic analysis of the atomization drying of a concentrated solution based on z desulphurization wastewater with zero discharge and compared economic performance under the different operation conditions of unit loads, wastewater treatment capacity, and the temperature of the extracted flue gas. Sensitivity analysis was conducted and sensitive factors were pointed out. Suggestions to improve economic benefits were put forward.
2. Unit Situation and Calculation Model
2.1. Unit Situation
The prototype of this paper was a coal thermal power plant in Guangdong Province. There were three coal-fired generating units in operation with a total capacity of 1130 MW, namely Unit 5 (200 MW), Unit 6 (330 MW), and Unit 7 (600 MW). The desulfurization wastewater generated during the operation of the unit was first concentrated by MVR evaporation, and the remaining concentrated liquid was sprayed into the drying tower through a centrifugal atomizing disk, and the boiler flue gas was extracted and sent to the drying tower to evaporate the concentrated liquid, generating wastewater with zero discharge. Since the concentration process used the waste heat in the low-temperature flue gas for heating, it had no effect on the efficiency of the unit; therefore, only the cost of the atomization drying system was discussed. Unit 7 was used as the prototype.
2.2. Calculation Model
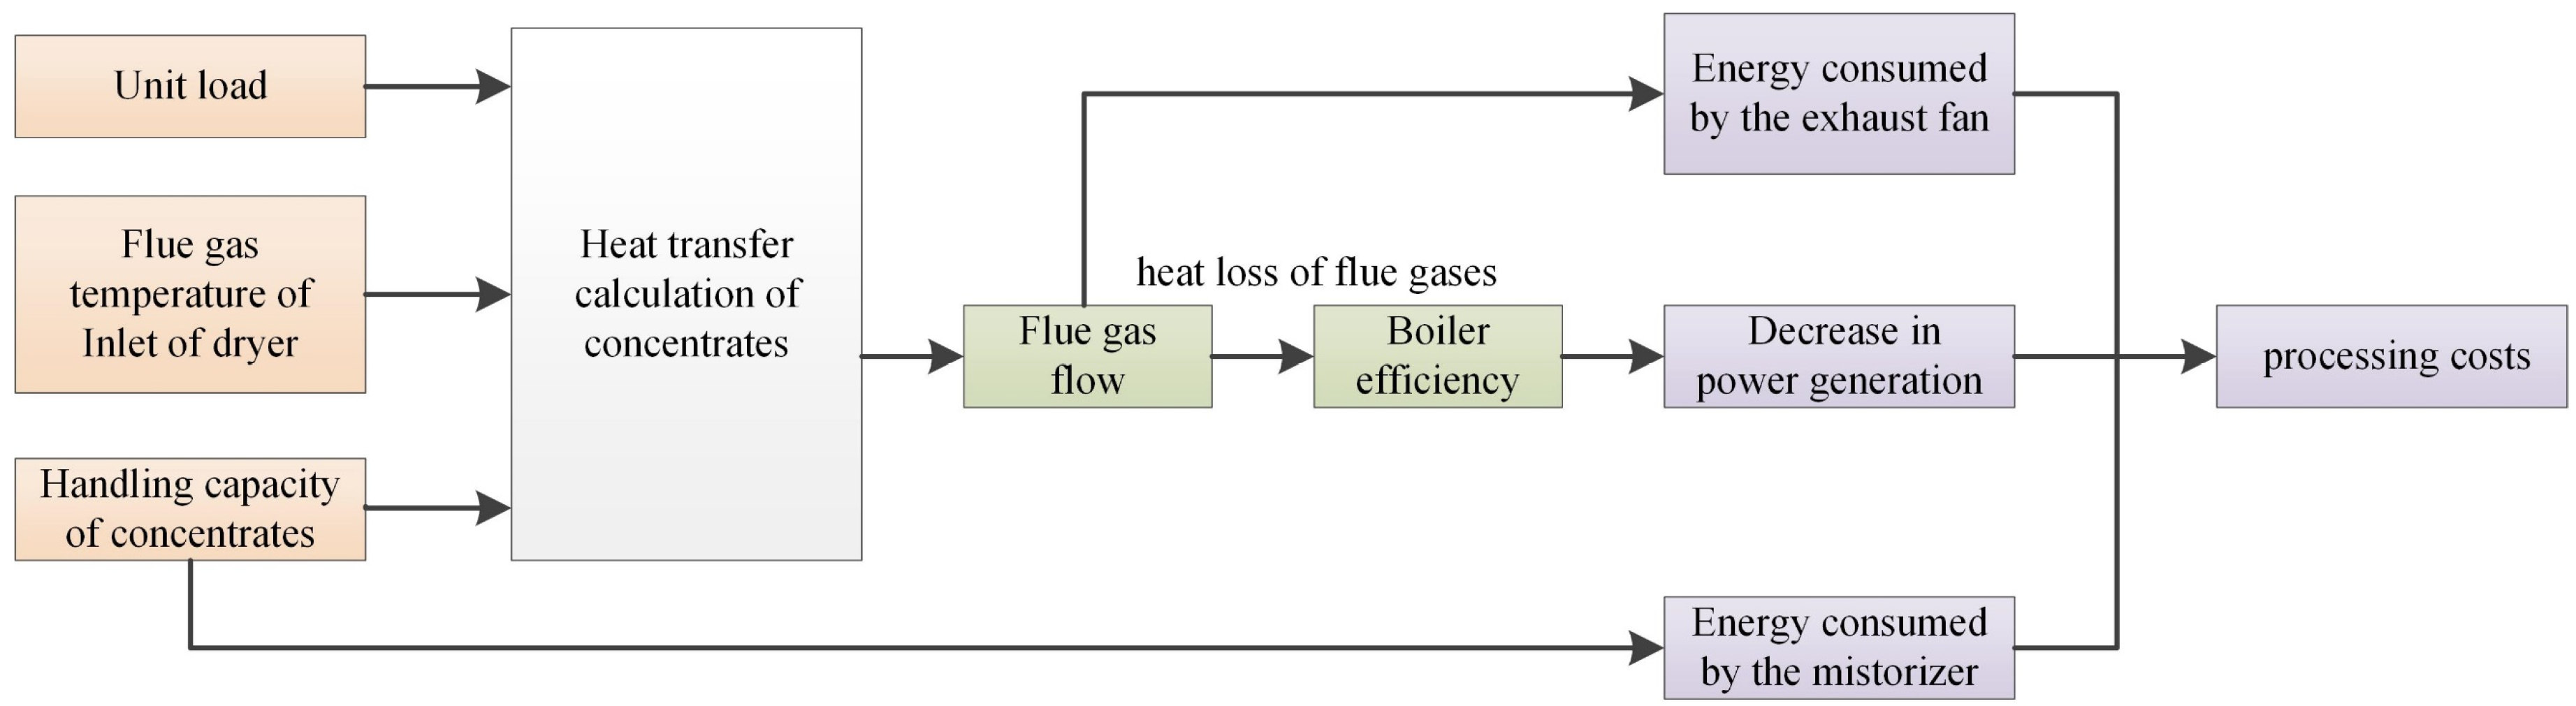
A flowchart of the cost calculation for the atomization drying system is shown in Figure 1. By setting the load of the unit, the temperature of the flue gas at the inlet of the dryer, and the handling capacity of concentrates, the heat exchange calculation was performed on the drying of the wastewater, and the required flue gas flow rate for drying the concentrated liquid was obtained. Then, the reduction in power generation due to the decrease in boiler efficiency caused by the exhaust flue gas was calculated, as was the energy consumption of the exhaust fan. The energy consumption of the mistorizer was determined by the flow of the concentrates.
2.2.1. Calculation Model of Heat Exchange Calculation
The heat required to dry the concentrates consisted of three components:
Sensible heat required to evaporate water :
where is the specific heat capacity of water, 4.19 kJ/(kg·K); is the flow rate of evaporated water, kg/h, calculated as 80% of the flow rate of the concentrates; is the temperature increase of the evaporating water, which was calculated according to the difference between the exhaust gas temperature of the evaporator and the ambient temperature, and the ambient temperature was 20 °C.
Latent heat required to evaporate water :
where is the specific latent heat of water, 2256.40 KJ/Kg.
Heat required to increase the temperature of the impurities in the concentrates :
where is the specific heat capacity of the impurities in the concentrates, 1.05 kJ/(kg·K) [25]; is the mass of the impurities, kg/h, calculated as 20% of the flow rate of the concentrates; is the temperature increase of the impurities, 80 °C.
The heat balance of atomization drying system:
where is the specific enthalpy of the flue gas entering the atomization drying system, kJ/Nm3, which was the same as that of flue gas extracted from the boiler. is the specific enthalpy of the flue gas leaving the atomization drying system, kJ/Nm3. and were calculated from the flue gas temperature and flue gas composition. The inlet temperature was variable, and the outlet temperature was 155 °C. is the flue gas flow rate, Nm3/h; is the heat exchange efficiency, which changed with the heat exchange temperature difference. When the exhaust temperature was 300 °C, was 90%, and decreased by 1% for every 50 increase in the temperature of the flue gas entering the atomization drying system.
2.2.2. Calculation Model of Reduction in Power Generation
The residual heat of that part of the flue gas extracted by the atomization drying system was not used in the boiler, resulting in energy loss :
where is the energy loss caused by flue gas extraction, kJ/h, and is the enthalpy of the exhaust flue gas from the boiler, kJ/Nm3, calculated by the exhaust temperature and flue gas components.
The reduction in boiler efficiency due to flue gas extraction:
where is the total energy input to the boiler, kJ/h.
Boiler efficiency after the atomization drying system was put into use:
where is the boiler efficiency before the atomization drying system was put into use, %.
The total efficiency of the unit after the atomization drying system was put into use:
where is the total product of the other efficiencies, including pipeline efficiency, steam turbine efficiency, mechanical efficiency, and generator efficiency. It was considered that remained unchanged before and after the atomization drying system was put into use, and it can be obtained by dividing the total efficiency before flue gas extraction by the boiler efficiency before flue gas extraction.
Power generation of the unit after the atomization drying system was put into use, MW:
The reduction in power generation after the atomization drying system was put into use, kWh/h:
The decrease in power generation revenue , CNY/h:
where 0.39 was the unit price of electricity, 0.39 CNY/kWh.
The unit parameters under different loads before flue gas extraction are shown in Table 1.
2.2.3. Calculation Model of Energy Consumed by the Exhaust Fan
The power consumption factor of flue gas extraction was 0.005 kWh/Nm3 flue gas, that is, the power consumption of flue gas extraction 1 Nm3 was 0.005 kWh [26].
Cost from the operation of exhaust fan , CNY/h:
2.2.4. Calculation Model of Energy Consumed by the Mistorizer
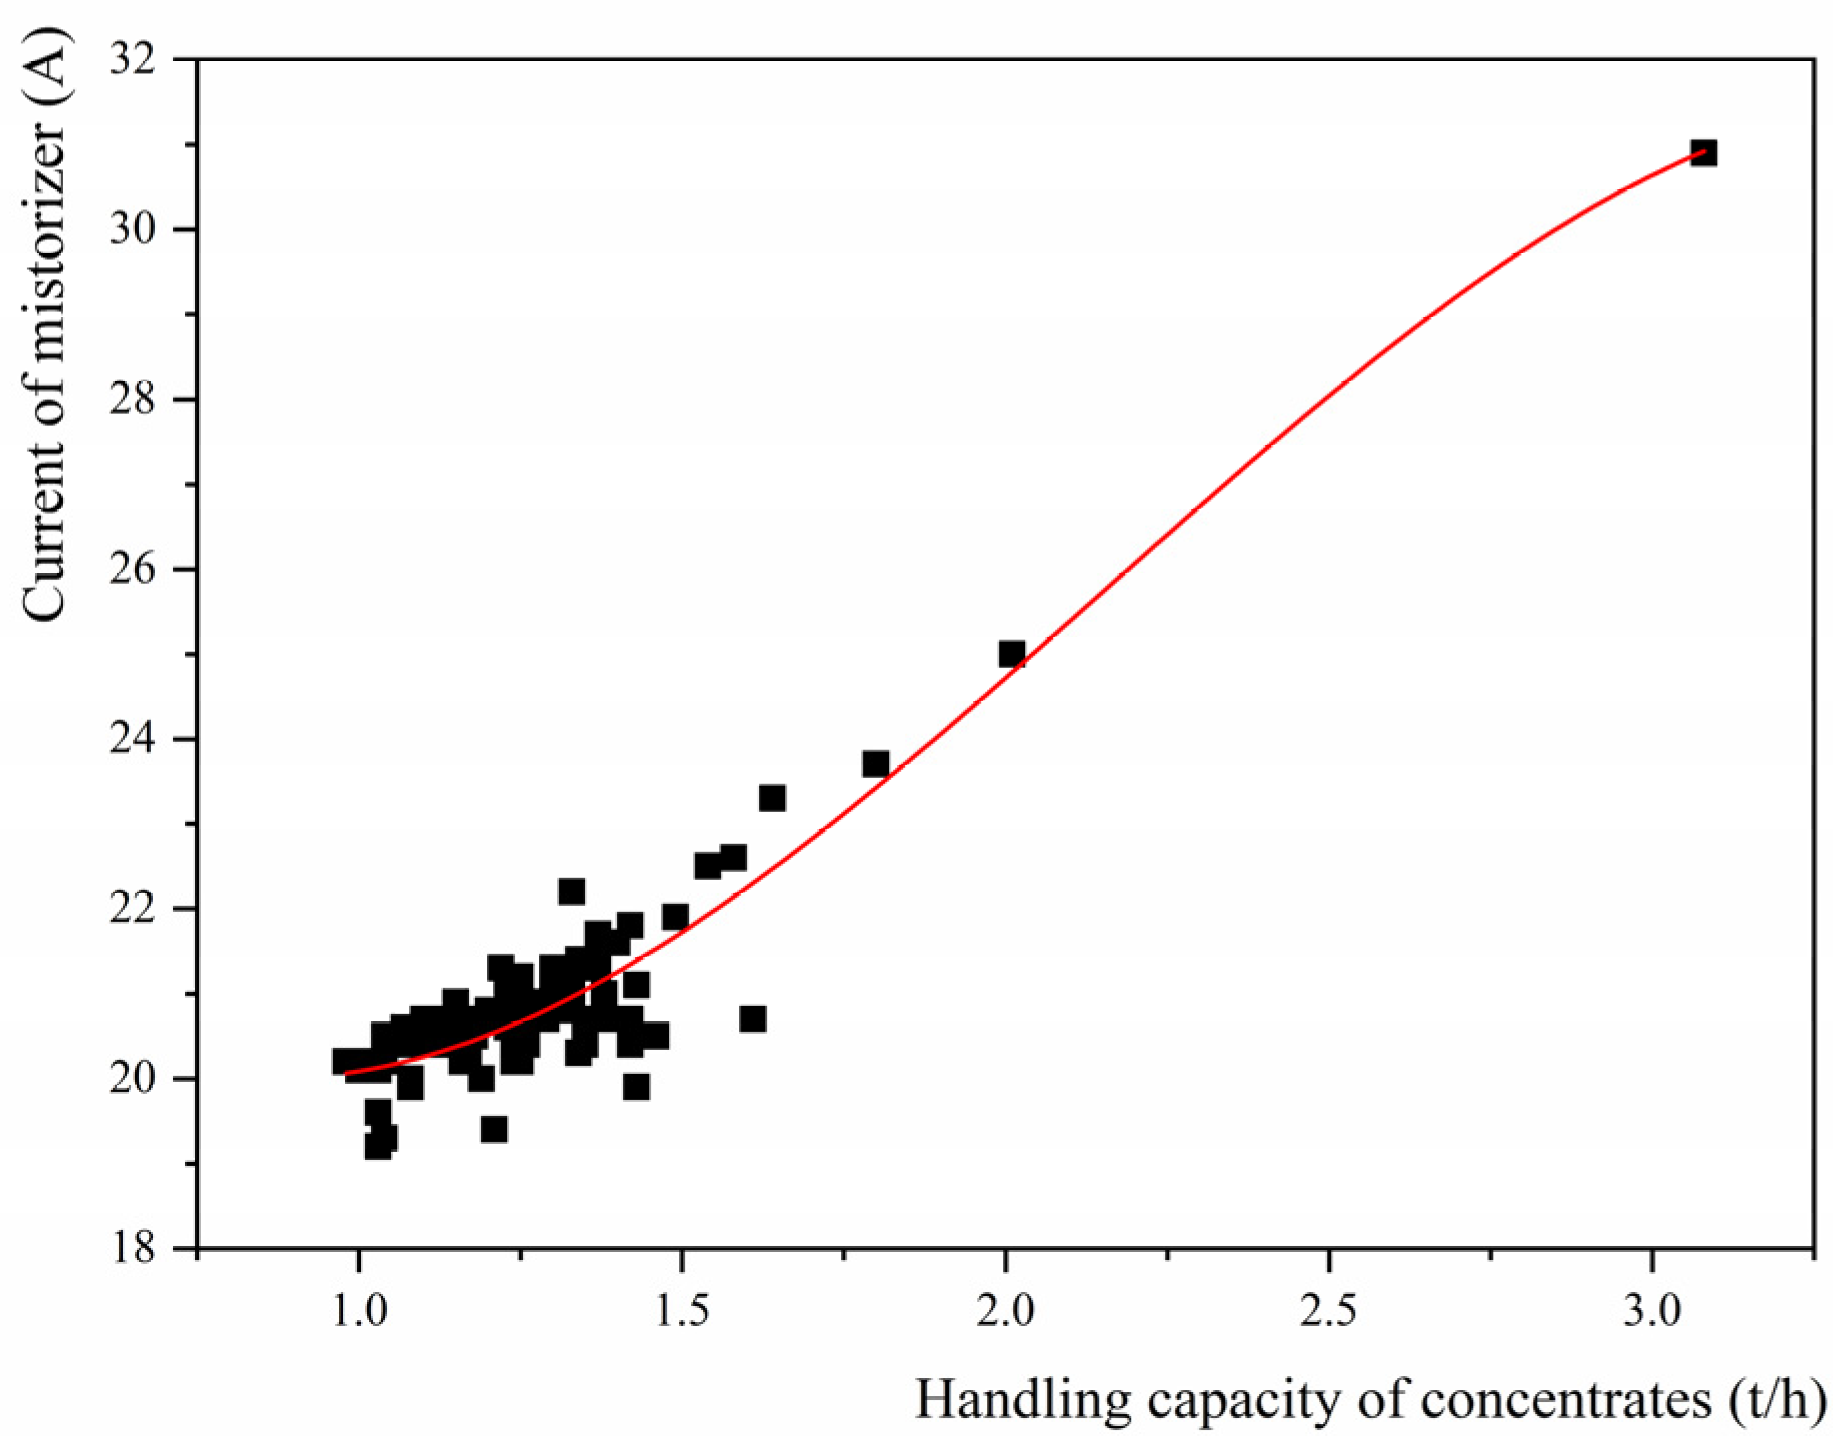
According to the on-site operating data, the relationship between the current of mistorizer and the handling capacity of the concentrates was fitted, as shown in Figure 2. The relationship was obtained as:
where y is the current of mistorizer, A, and x is the handling capacity of the concentrates, t/h.
Power of the mistorizer, W:
where U is the voltages of the mistorizer, 380 V, and I is the current of the mistorizer, A, calculated according to Formula (13).
Cost from the operation of mistorizer , CNY/h:
The cost of treatment for per ton of concentrates , CNY/t:
where C is the sum of all of the costs of different items, CNY/h, and M is the handling capacity of the concentrates, t/h.
2.3. Sensitivity Analysis
The economic benefit index was . Indeterminacy factors included unit load, the handling capacity of the concentrates, and the temperature of the extracted flue gas. Single factor analysis was used to analyze the influence degree of unit load, the handling capacity of the concentrates, and the temperature of the extracted flue gas on [27]:
where is the sensitivity coefficient of factor A to ; is the relative change of relative to fiducial value; and is the relative change of factor A relative to fiducial value.
3. Results
3.1. Different Temperature of the Extracted Flue Gas
The economic parameters under different extracted flue gas temperature operating conditions are showed as Table 2. As the flue gas temperature increased, the required flue gas volume showed an obvious decrease. This was because with the temperature of the inlet flue gas increased, and the heat energy that was carried in the per unit volume of flue gas became so large that the amount of flue gas required to evaporate the same quality of concentrates decreased. With the decrease in the flue gas volume, the energy consumed by the exhaust fan also decreased, while the relationship between the decrease in power generation revenue and flue gas temperature was not monotonous. It can be seen that with the increase in the flue gas temperature, the decrease in power generation revenue first decreased and then increased. The flue gas temperature affected the energy consumption of the exhaust fan through the change of flue gas flow but had no direct correlation with the flue gas temperature itself. However, as for the decrease in power generation revenue, it was mainly reflected by the change in boiler efficiency. In addition to the flue gas flow, the flue gas temperature itself had a great influence on the decrease in power generation revenue. When the temperature rose, if the flue gas flow remained unchanged, it meant that more heat was extracted and that the boiler efficiency would decrease. When the flue gas flow decreased, if the flue gas temperature was unchanged, it meant that the heat extracted was reduced and that the boiler efficiency would increase. In the operation process, the flue gas flow was not independent of the flue gas temperature. As the exhaust gas temperature increased, the required flue gas flow decreased. The effect of the two changes on the boiler efficiency was exactly the opposite. Therefore, under the action of flue gas flow and flue gas temperature, there was an optimal temperature for the extracted flue gas, which made the boiler efficiency drop the least; that is, the decrease in power generation revenue was the lowest. At the beginning, with the increase in the flue gas temperature, the degree of reduction in the boiler efficiency gradually decreased. When the flue gas temperature was 300 °C, the boiler efficiency decreased by 0.0629%, and when the flue gas temperature was 500 °C, the boiler efficiency only decreased by 0.0594%. At this time, the reduction in the flue gas flow played a major role in increasing boiler efficiency. As the flue gas temperature continued to rise, the reduction in the boiler efficiency gradually increased. When the flue gas temperature was 800 °C, boiler efficiency decreased by 0.0613%. It can be seen that when the flue gas temperature was 500 °C, the boiler efficiency was the highest, and the decrease in power generation revenue was the lowest, reaching values of 147.5925 CNY/h. The costs of operating the mistorizer was only related to the handling capacity of the concentrates, and the cost remained unchanged when the flue gas temperature changed.
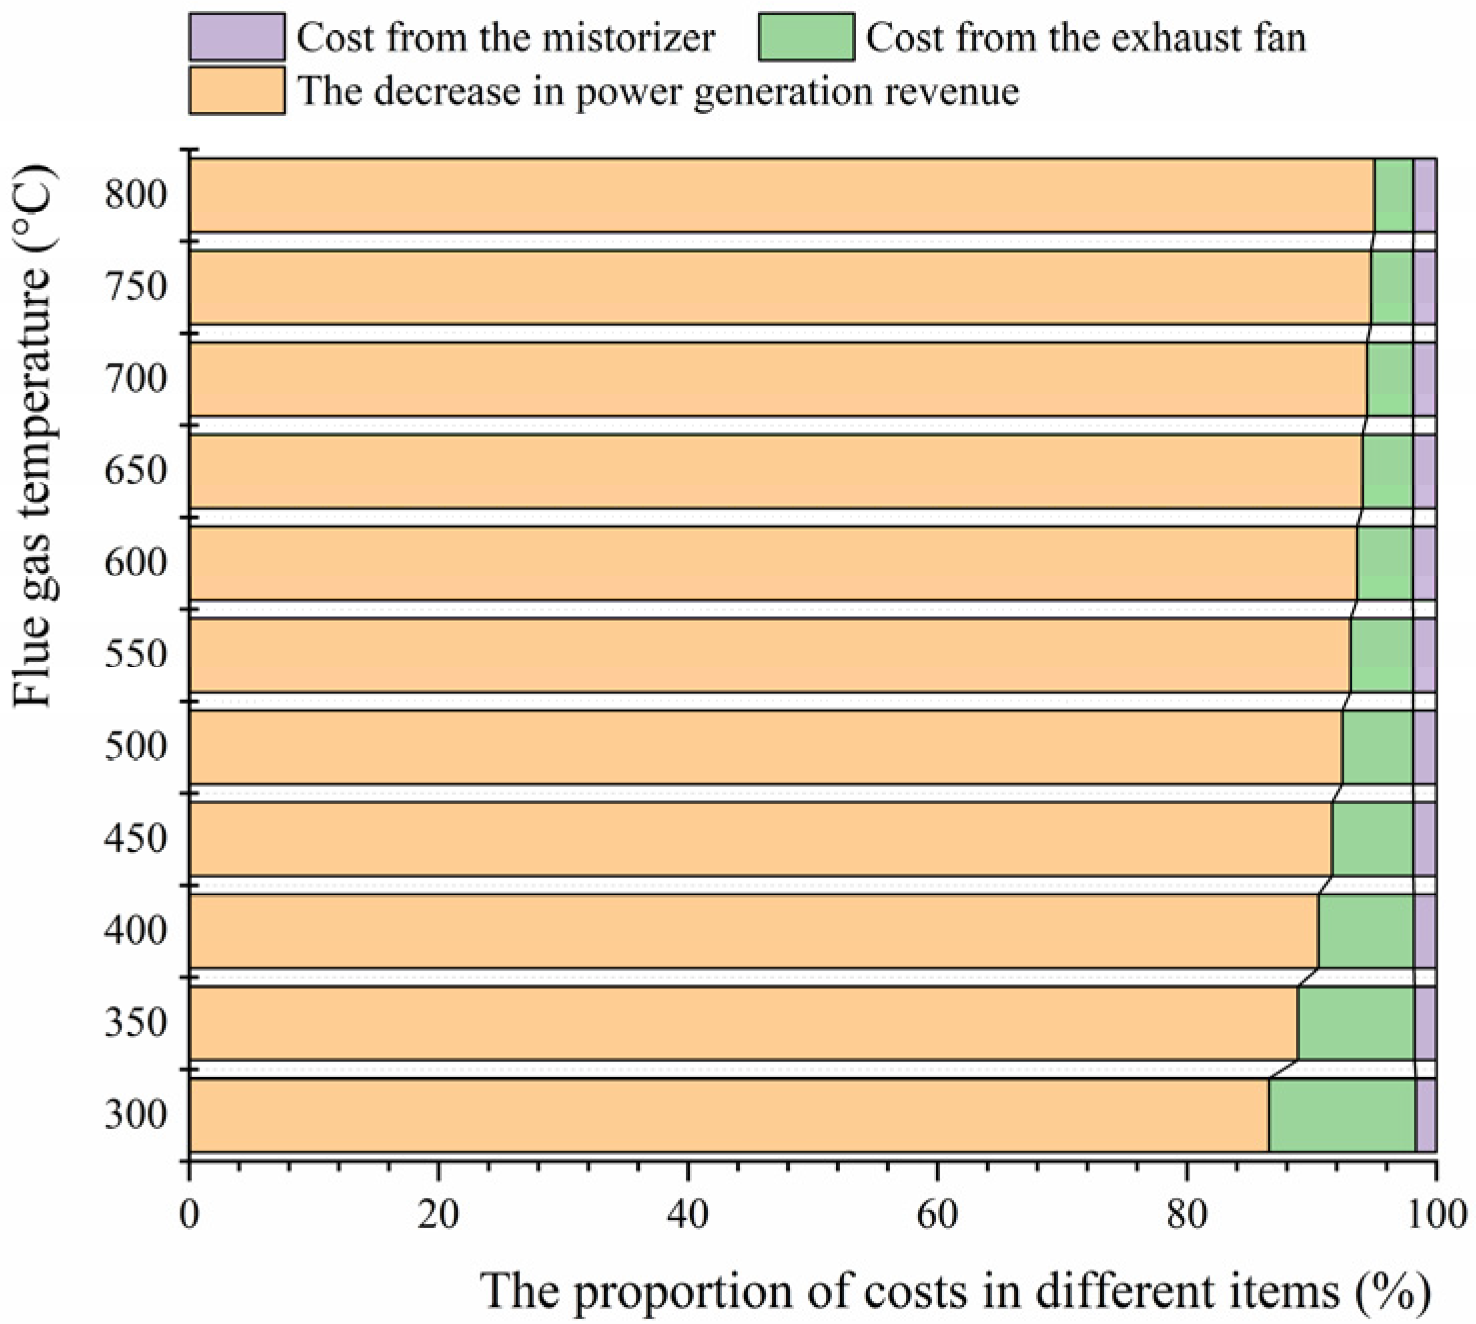
Comparing the costs of the three items, as shown in Figure 3, it can be seen that the decrease in the power generation revenue accounted for the highest proportion, accounting for more than 86%. Furthermore, as the temperature of the flue gas rose, the proportion of the decrease in power generation revenue increased. The second was that of the energy consumption cost of the exhaust fan, which accounted for 11.79%. Combining the costs of the three items, the total cost first decreased and then rose as the flue gas temperature rose, reaching its lowest value at 600 °C, which was 158.3126 CNY/h.
3.2. Different Handling Capacity of Concentrates
The economic parameters under operating conditions where the concentrates had different handling capacities are showed in Table 3. As the handling capacity of the concentrates, the energy consumption of the exhaust fan, the decrease in power generation revenue, and the operation costs of the mistorizer increased to varying degrees, the total cost also increased. However, when comparing the value in conditions where the concentrates had different handling capacities, it can be seen that with the increase in the handling capacity, the value continued to decrease. When the handling capacity was low, the degree of decline was greater, and the degree of decline tended to be flat when the handling capacity increased further, as shown in Figure 4. After the handling capacity reached 2.2 t/h, the relative change in the value was small and basically unchanged. That is, in order to reduce the value, the handling capacity of the concentrates should be kept above 2.2 t/h as much as possible.
3.3. Different Unit Loads
Table 4 shows the economic parameters in operating conditions under different unit loads. As the load of the unit decreased, the operating cost of the exhaust fan increased. Obviously, this was caused by the increase in the amount of flue gas that was extracted. Although the temperature of the extracted flue gas was the same, the decrease in the load caused the flue gas composition to change, which caused the energy contained in the unit flue gas volume to be different, and, in turn, led to the increase in the amount of the required flue gas. The impact of the load on the decrease in the power generation revenue was also related to the temperature of the extracted flue gas. When the extracted temperature was low, there was no obvious relationship between the unit load and the decrease in the power generation revenue. When the extracted temperature became higher, the decrease in the power generation revenue decreased as the unit load decreased. With the decrease in the unit load, the energy that was contained in the unit flue gas volume decreased, resulting in an increase in the amount of required flue gas. Meanwhile, the exhaust temperature of the unit decreased as the unit load increased. That is, when the load decreased, the extracted part of the flue gas should have had more energy available for the unit. However, as the flue gas was extracted, this part of the energy was not used by the boiler. Because of the two reasons mentioned above, as the load decreased, the boiler efficiency decreased more due to flue gas extraction. However, the decrease in power generation revenue was not only determined by efficiency, it was proportional to the product of the unit load and the drop in the boiler efficiency. Therefore, although the low load had a large drop in boiler efficiency, the decrease in power generation revenue was not simply a monotonous change because the unit load value was small. In cases where the flue gas was extracted at a high temperature, when the load decreased, the decrease in power generation revenue decreased. That is, although the decrease in the boiler efficiency under a low load was relatively large, it was not enough to offset the impact of the load base on the decrease in power generation revenue, and the decrease in power generation revenue generally showed a downward trend. The operating costs for the mistorizer were only related to the handling capacity of the concentrates, so it did not change with the unit load. There was a certain relationship between the amount of desulfurization wastewater generated and the unit load; however, desulphurization wastewater with zero discharge refers to not being discharged to the outside rather than real-time elimination. The concentrates of wastewater storage method can be combined with strategic treatment, so it was considered that the handling capacity of the concentrates did not change with the change in the load.
The values under different operating conditions with different unit loads are showed in Figure 5. It can be seen that under different loads, all of the values first decreased and then rose as the flue gas temperature rose, and there was an optimal flue gas temperature. The optimal flue gas temperature corresponding to different loads was different. As the load decreased, the optimal flue gas temperature shifted to higher temperatures. During the operation process, the load was able to change at any time; however, the port through which the flue gas could be distracted was not able to change real-time and was fixed. Therefore, it was necessary to accurately select the position of the port through which the gas was extracted to ensure that the total cost was at a lower value most of the time. This will be further analyzed in later chapters.
3.4. Sensitivity Analysis
A sensitivity analysis of the handling capacities of concentrates and the temperature of the extracted flue gas under the rated load (600 MW) is showed in Table 5. The fiducial value of the flue gas temperature was 600 °C, and it was calculated to be from 300 °C to 800 °C, with a step size of 50 °C. The fiducial value of the handling capacity of the concentrates was 1 t/h, and it was calculated from 1 t/h to 3 t/h, with a step size of 0.2 t/h. When performing a sensitivity analysis of a factor, the other factors maintained their fiducial value.
The sign for the sensitivity coefficient represented the direction of the impact that the indeterminacy factors had on the economic benefit index. A sensitivity coefficient with a positive value meant that the economic benefit index increased as the indeterminacy factors increased; the negative signs represent how the economic benefit index decreased as the indeterminacy factors increased. The absolute value of the sensitivity coefficient represented the degree of influence that the indeterminacy factors had on the economic benefit index; the greater the absolute value, the greater the degree of influence [28].
When the flue gas temperature was lower than 600 °C, the sensitivity coefficient of the flue gas temperature had a negative value; that is, as the temperature increased, the cost of treatment for per ton of concentrates decreased. When the flue gas temperature was higher than 600 °C, the sensitivity coefficient of the flue gas temperature had a positive value; that is, as the temperature increased, the cost of treatment for per ton of concentrates increased. This proves that when the flue gas temperature was 600 °C, the cost of treatment for per ton of concentrates was the lowest, which was consistent with the results of a previous analysis. As for the absolute value of the sensitivity coefficient, it can be seen that when the flue gas temperature was lower than 600 °C, the absolute value of the sensitivity coefficient of the flue gas temperature decreased as the temperature increased. When the flue gas temperature was higher than 600 °C, the absolute value of the sensitivity coefficient of the flue gas temperature increased as the temperature increased. The sensitivity coefficient of the flue gas temperature obtained the smallest absolute value at 600 °C; that is, when the flue gas temperature changed at around 600 °C, the degree of change in the economic benefit index was the smallest. The lower the absolute value of the sensitivity coefficient, the lower economic risk of resistance to the change of a specific indeterminacy factor. Therefore, the flue gas temperature at 600 °C not only achieved the lowest cost, but also had the best risk resistance, showing that it was the optimal flue gas extraction temperature the under rated load.
The sensitivity coefficient of the handling capacity of the concentrates always maintained a negative value; that is, as the handling capacity increased, the cost of treatment for per ton of concentrates decreased. The absolute value of the sensitivity coefficient for the handling capacity of the concentrates decreased as the handling capacity increased. That is, under the high handling capacity, the cost of treatment for per ton of concentrates was less affected by the change in the handling capacity, showing a stronger ability to resist economic risks. That is, regardless of the cost or the ability to resist economic risks, the handling capacity of concentrates should be increased as much as possible within the processing capacity.
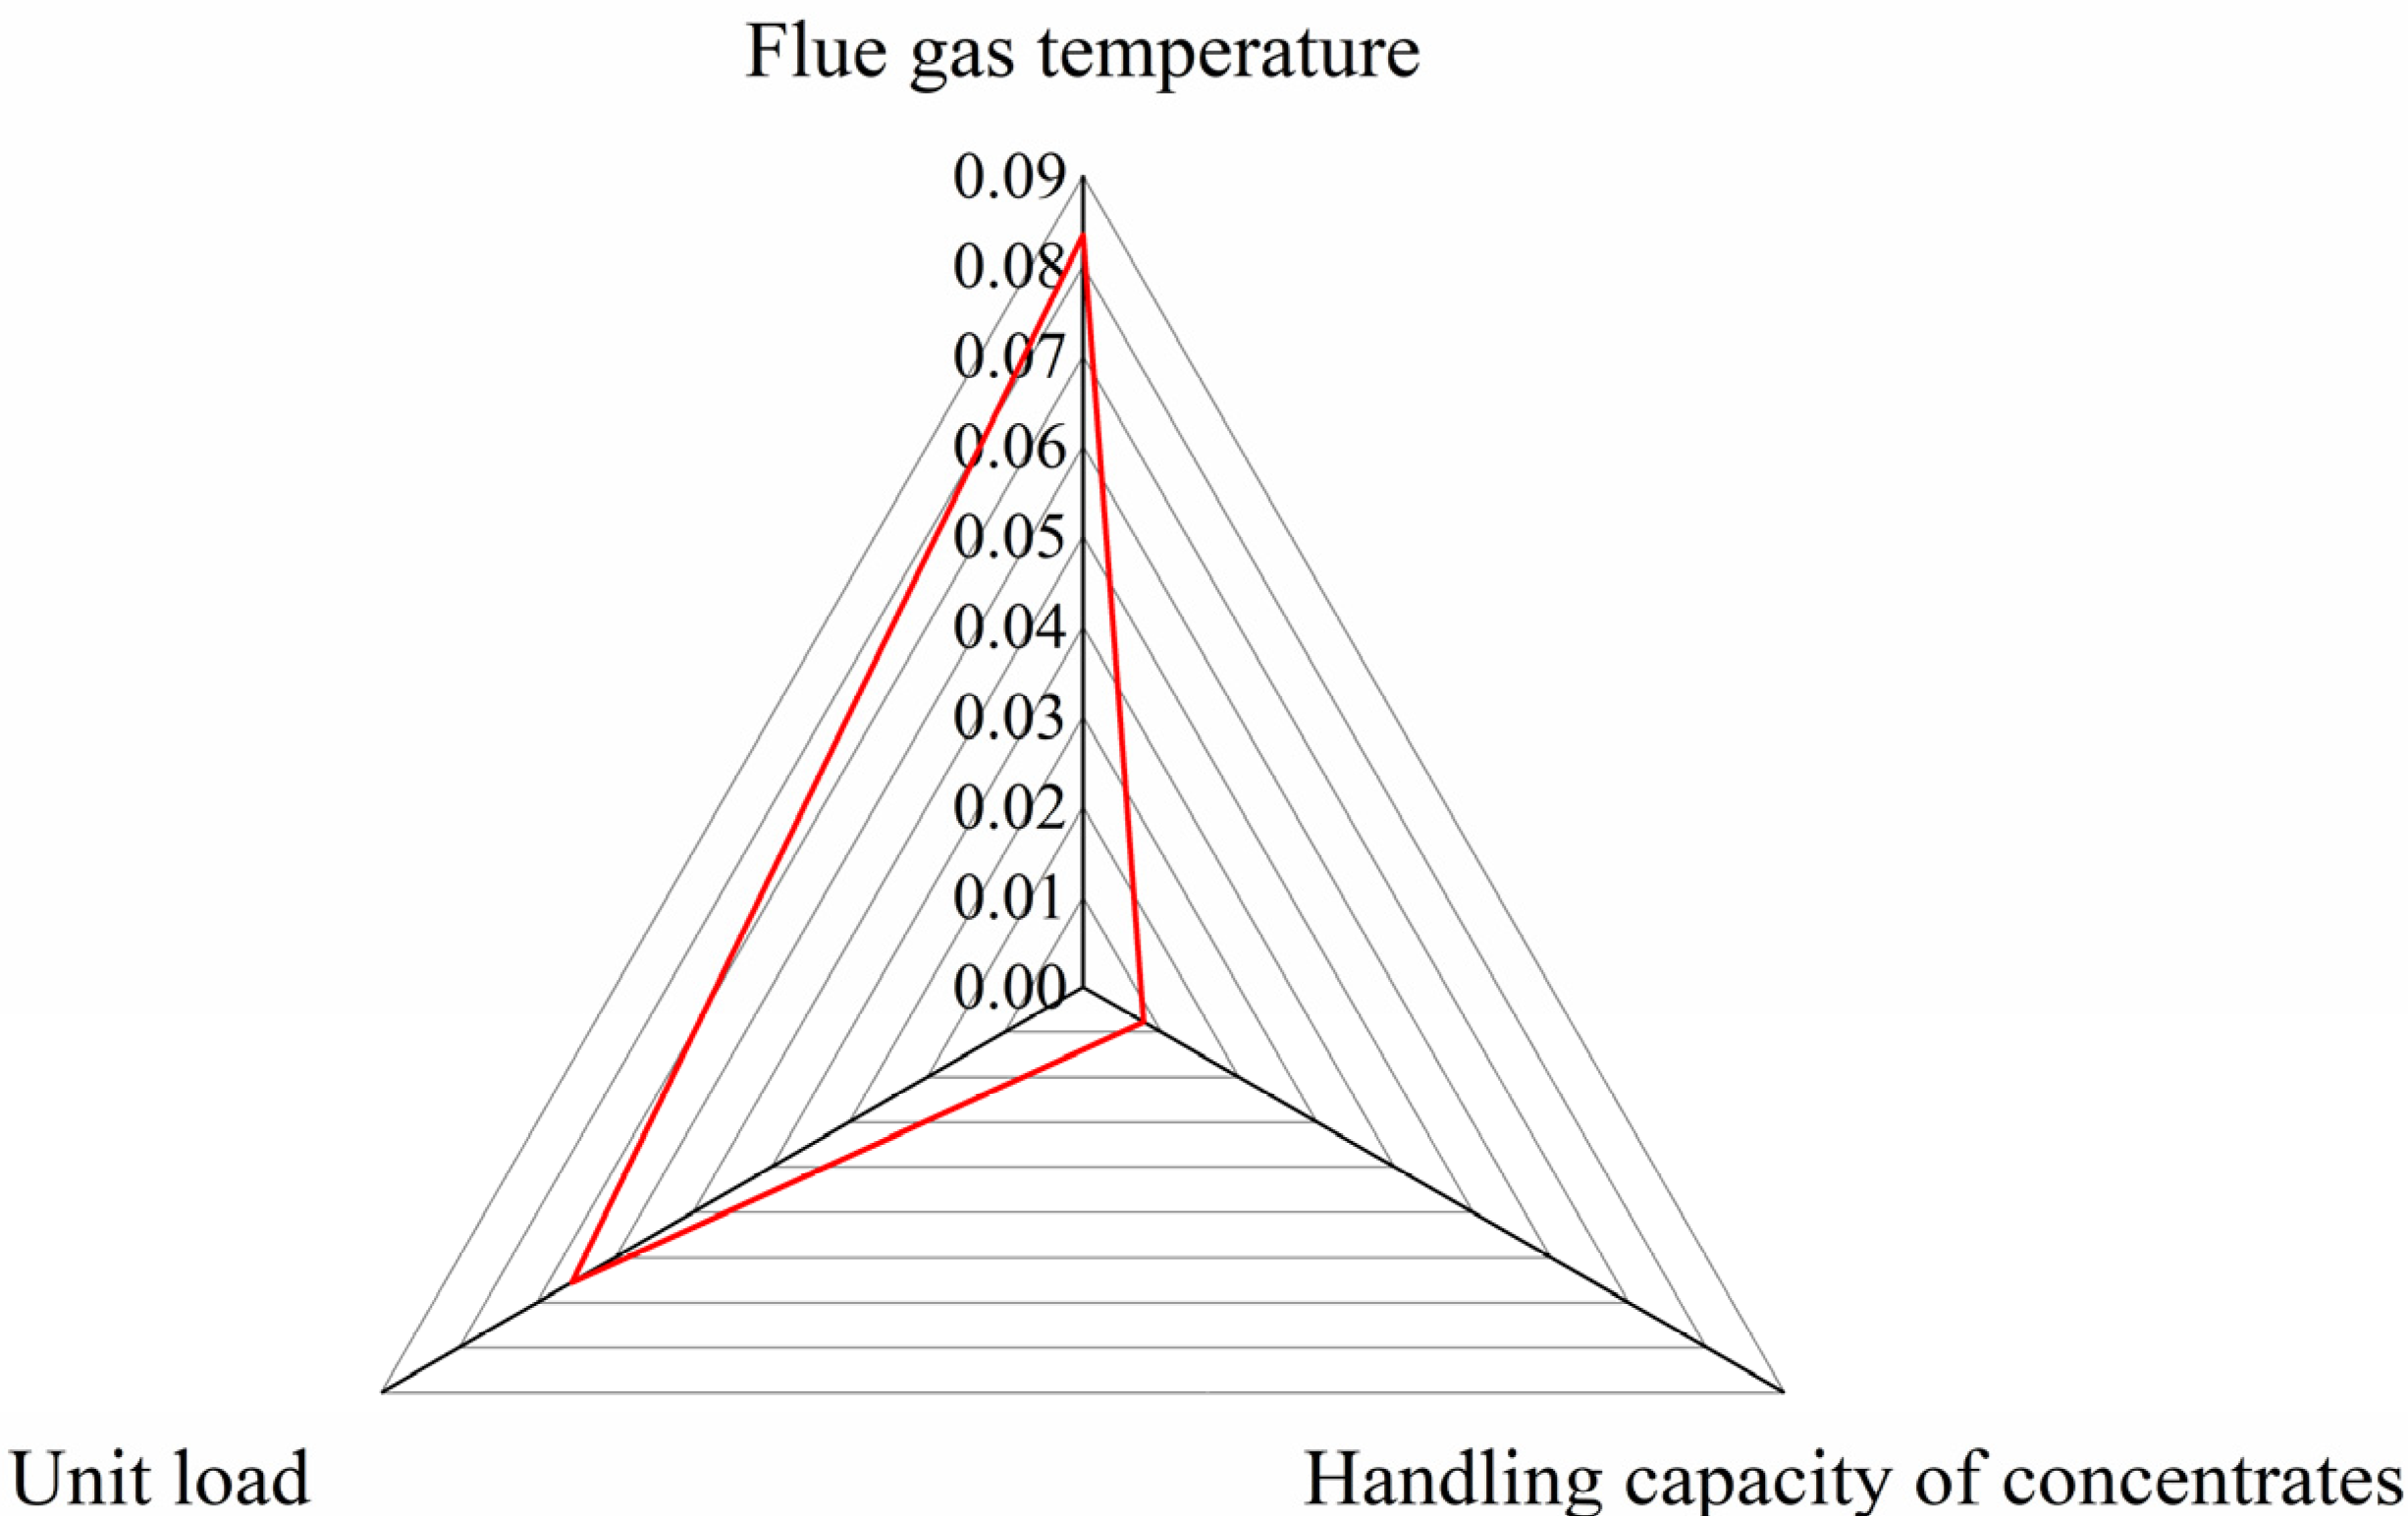
As for the sensitivity coefficient of the unit load, it can be seen from Table 6 that it was also closely related to the flue gas temperature, and it was not a monotonous negative value or a monotonous positive value. This was mainly due to the complicated influence of the unit load on the cost. Regarding the absolute value of the sensitivity coefficient, the absolute value of the sensitivity coefficient was determined, and then the average value was taken. These were compared with the effect of the handling capacity of concentrates and the flue gas temperature, as shown in Figure 6. It can be seen that the unit load and especially flue gas temperature were the main sensitivity factors. The impact of the handling capacity of concentrates was relatively small.
4. Discussion
According to the above results, some measures to improve the economy are put forward:
- Selection of the position of the gas extraction port:
It can be seen from the above analysis that the effects of flue gas temperature and the unit load on treatment cost were interactive rather than separate. The temperature of the extracted flue gas was mainly determined by the location of the extracted port. As mentioned above, the flue gas port cannot change with the change of the load; it was in a fixed position. Then, for a unit whose load changed in real-time, the selection of the position of the gas extraction port should fully consider the influence of flue gas temperature and load change.
The relationship between and the flue gas temperature under different loads was fitted, as showed in Table 7. In this case, y represented , and x represented the flue gas temperature.
The fitting formula of with flue gas temperature under different loads was shown in Table 7. Substituting the flue gas temperature at different positions, as shown in Table 8, into the fitting relationship in Table 7, the value at different flue positions was obtained, as shown in Table 9.
The probability of the unit being under different loads in October 2021 is shown in Table 8. The load rate of 0~35% belonged to 30% THA, the load rate of 35~45% belonged to 40% THA, the load rate of 45~60% belonged to 50% THA, the load rate of 60~80% belonged to 75% THA, and the load rate of 80~100% belonged to 100% THA. To determine the value for a specific extraction port, the treatment cost for each ton of concentrates under different loads should be multiplied with the probability of the corresponding load; when all of the loads are superimposed, then the average cost at the location can be obtained:
where is the average cost of the concentrate treatment for one specific extracted port, CNY/t; is the cost of treatment for per ton of concentrates under a specific load, CNY/t, as shown in Table 9; and is the probability of the corresponding load, %, as shown in Table 8.
The average cost of concentrate treatment at different extraction port locations is shown in Table 9. It can be seen that the average cost varied greatly by extraction port location, with the lowest average costs being achieved when the extraction port location is the position leaving RH2. Therefore, in order to improve the economy, the extraction port should be arranged at the position behind Reheater 2.
- 2.
- A concentrate storage container should be set up to adjust the handling capacity of the concentrates
The handling capacity of the concentrates had less impact on the treatment cost than the flue gas and the unit load did; however, as the handling capacity of the concentrates increased, the cost of treatment for per ton of concentrates also decreased to a certain extent. A concentrates storage container should be set up. When the desulfurization wastewater output is low, then the atomization drying system of concentrates can be suspended. When the output of desulfurization wastewater increases or has accumulated a certain amount, the drying system can be restarted to ensure that the handling capacity of the concentrates increases as much as possible while the drying system is running, and the unit processing cost can be reduced.
5. Conclusions
An economic analysis for the atomization drying of concentrated solutions based on desulphurization wastewater with zero discharge was analyzed. Extracting flue gas to dry the wastewater concentrate reduced the efficiency of the boiler. Under the rated load conditions, extracting flue gas can reduce the boiler efficiency by 0.0594% to 0.0639%, and the boiler efficiency can be reduced by more than 0.1% under low loads. The cost of treatment for per ton of concentrates decreased first and then rose with the increase in the temperature of the extracted flue gas. An optimal extracted temperature was determined. As the load decreased, the optimal flue gas temperature migrated to higher temperature. The increase in the handling capacity of the concentrates was conducive to reducing the cost. The temperature of the extracted flue gas was a sensitive factor for the cost of treatment per ton of concentrate and had the greatest impact on its processing costs. In order to reduce the cost, the effects of flue gas temperature and the unit load should be considered comprehensively, and the extraction port should be arranged behind the Reheater 2.
This paper provided a guide for the economical zero-discharge treatment of desulfurization wastewater from units with a rated load of about 600 MW and provided calculation methods for other units. In future research, researchers can use the calculation method determined in this paper to conduct an economic analysis of desulfurization wastewater with zero discharge from power plants with different rated loads in order to summarize the general law and to extend it to units of differently rated loads.
Author Contributions
Conceptualization, N.Z.; methodology, N.Z., L.C.; software, Y.F.; vali-dation, N.Z., Y.F. and D.L.; formal analysis, N.Z., L.C.; investigation, N.Z. and Y.F.; resources, Y.F. and D.L.; data curation, N.Z.; writing—original draft preparation, N.Z.; writing—review and editing, D.L., Y.F. and L.C.; visualization, D.L. and L.C; supervision, D.L.; project administration, N.Z. and D.L.; funding acquisition, N.Z. All authors have read and agreed to the published version of the manuscript.
Funding
This research was funded by Critical Technology Research and Integrated Application for Wastewater Resources and Zero Emission in High Water Consumption Enterprises, grant number GDKJXM20183546.
Institutional Review Board Statement
Not applicable.
Informed Consent Statement
Not applicable.
Data Availability Statement
Not applicable.
Conflicts of Interest
The authors declare no conflict of interest.
References
- Dong, Y.; Li, Y.; Zhang, L.; Cui, L.; Zhang, B.; Dong, Y. Novel Method of Ultralow SO2 Emission for CFB Boilers: Combination of Limestone Injection and Activated Carbon Adsorption. Energy Fuels 2017, 31, 11481–11488. [Google Scholar] [CrossRef]
- Bogacki, J.; Marcinowski, P.; Majewski, M.; Zawadzki, J.; Sivakumar, S. Alternative approach to current EU BAT recommendation for coal-fired power plant flue gas desulfurization wastewater treatment. Processes 2018, 6, 229. [Google Scholar] [CrossRef] [Green Version]
- Jiang, D.N.; Sha, H.W.; Gong, G.H.; Song, J.; Xu, H.T.; Zhou, C.C.; Shen, K. Fundamental research and demonstration project of evaporation treatment of wastewater from FGD in flue gas duct. Adv. Mater. Res. 2014, 864, 434–437. [Google Scholar] [CrossRef]
- Sun, Z.; Yang, L.; Chen, S.; Bai, L.; Wu, X. Promoting the removal of fine particles and zero discharge of desulfurization wastewater by spray-turbulent agglomeration. Fuel 2020, 270, 117461. [Google Scholar] [CrossRef]
- Li, B.; Yun, Y.; Liu, G.; Li, C.; Li, X.; Hilal, M.; Yang, W.; Wang, M. Direct contact membrane distillation with softening Pre-treatment for effective reclaiming flue gas desulfurization wastewater. Sep. Purif. Technol. 2021, 277, 119637. [Google Scholar] [CrossRef]
- Conidi, C.; Macedonio, F.; Ali, A.; Cassano, A.; Criscuoli, A.; Argurio, P.; Drioli, E. Treatment of flue gas desulfurization wastewater by an integrated membrane-based process for approaching zero liquid discharge. Membranes 2018, 8, 117. [Google Scholar] [CrossRef] [Green Version]
- Gingerich, D.B.; Grol, E.; Mauter, M.S. Fundamental challenges and engineering opportunities in flue gas desulfurization wastewater treatment at coal fired power plants. Environ. Sci. Water Res. Technol. 2018, 4, 909–925. [Google Scholar] [CrossRef]
- Shuangchen, M.; Jin, C.; Gongda, C.; Weijing, Y.; Sijie, Z. Research on desulfurization wastewater evaporation: Present and future perspectives. Renew. Sustain. Energy Rev. 2016, 58, 1143–1151. [Google Scholar] [CrossRef]
- Lee, S.; Kim, Y.; Hong, S. Treatment of industrial wastewater produced by desulfurization process in a coal-fired power plant via FO-MD hybrid process. Chemosphere 2018, 210, 44–51. [Google Scholar] [CrossRef]
- Wei, C.; He, W.; Wei, L.; Ma, J.; Li, C. The performance and microbial communities of biodegradation-electron transfer with sulfur metabolism integrated process for flue gas desulfurization wastewater treatment. Bioprocess Biosyst. Eng. 2017, 40, 1543–1553. [Google Scholar] [CrossRef]
- Eljamal, O.; Eljamal, R.; Maamoun, I.; Khalil, A.M.; Shubair, T.; Falyouna, O.; Sugihara, Y. Efficient treatment of ammonia-nitrogen contaminated waters by nano zero-valent iron/zeolite composite. Chemosphere 2022, 287, 131990. [Google Scholar] [CrossRef] [PubMed]
- Shubair, T.; Eljamal, O.; Khalil, A.; Matsunaga, N. Nitrate removal in porous media using nanoscale zero valent iron: Column experiment. In Proceedings of the International Exchange and Innovation Conference on Engineering & Sciences (IEICES), Kyushu University, Fukuoka, Japan, 21–22 October 2017; pp. 145–148. [Google Scholar]
- Shubair, T.; Eljamal, O.; Matsunaga, N. Nano-Fe/Cu particles for the remediation of cesium contaminated solutions. In Proceedings of the International Exchange and Innovation Conference on Engineering & Sciences (IEICES), Kyushu University, Fukuoka, Japan, 18 October 2018; pp. 60–63. [Google Scholar]
- Panagopoulos, A. Study and evaluation of the characteristics of saline wastewater (brine) produced by desalination and industrial plants. Environ. Sci. Pollut. Res. Int. 2021, 1–14. [Google Scholar] [CrossRef]
- Panagopoulos, A. Energetic, economic and environmental assessment of zero liquid discharge (ZLD) brackish water and seawater desalination systems. Energy Convers. Manag. 2021, 235, 113957. [Google Scholar] [CrossRef]
- Guo, H.; Wang, J.; Wu, J.; Du, X. Study on Spray Evaporation Treatment of Desulfurization Wastewater. Coatings 2021, 11, 418. [Google Scholar] [CrossRef]
- Sun, Z.; Chen, H.; Zhao, N.; Feng, Y.; Liu, F.; Cai, C.; Che, G.; Yang, L. Experimental research and engineering application on the treatment of desulfurization wastewater from coal-fired power plants by spray evaporation. J. Water Process Eng. 2021, 40, 101960. [Google Scholar] [CrossRef]
- Ye, X.; An, X.; Zhang, H.; Wang, S.; Guo, B.; Yu, A. Process simulation on atomization and evaporation of desulfurization wastewater and its application. Powder Technol. 2021, 389, 178–188. [Google Scholar] [CrossRef]
- Liang, Z.; Zhang, L.; Yang, Z.; Cheng, X.; Pu, G.; Ran, J. The effect of solid particles on the evaporation and crystallization processes of the desulfurization wastewater droplet. Appl. Therm. Eng. 2018, 134, 141–151. [Google Scholar] [CrossRef]
- Chen, H.; Zhan, L.; Gu, L.; Feng, Q.; Zhao, N.; Feng, Y.; Wu, H.; Yang, L. Chloride release characteristics of desulfurization wastewater droplet during evaporation process using the single droplet drying method. Fuel 2021, 305, 121551. [Google Scholar] [CrossRef]
- Chen, H.; Liu, F.; Cai, C.; Zhan, L.; Gu, L.; Feng, Q.; Wu, H.; Yang, L. Release and migration characteristics of chlorine during the desulfurization wastewater evaporation process. Fuel Processing Technol. 2021, 218, 106863. [Google Scholar] [CrossRef]
- Ma, S.; Chai, J.; Wu, K.; Wan, Z.; Xiang, Y.; Zhang, J.; Fan, Z. Experimental and mechanism research on volatilization characteristics of HCl in desulfurization wastewater evaporation process using high temperature flue gas. J. Ind. Eng. Chem. 2018, 66, 311–317. [Google Scholar] [CrossRef]
- Pernetti, R.; Garzia, F.; Filippi, U. Oberegger, Sensitivity analysis as support for reliable life cycle cost evaluation applied to eleven nearly zero-energy buildings in Europe. Sustain. Cities Soc. 2021, 74, 103139. [Google Scholar] [CrossRef]
- May, E.C.; Bassam, A.; Ricalde, L.J.; Soberanis, M.E.; Oubram, O.; Tzuc, O.M.; Alanis, A.Y.; Livas-García, A. Global sensitivity analysis for a real-time electricity market forecast by a machine learning approach: A case study of Mexico. Int. J. Electr. Power Energy Syst. 2022, 135, 107505. [Google Scholar]
- Liu, Z. Life Cycle Assessment on Industrial Sludge Drying and Co-Combustion with Coal; South China University of Technology: Guangzhou, China, 2015. [Google Scholar]
- Chen, L.; Liao, Y.; Ma, X. Economic analysis on sewage sludge drying and its co-combustion in municipal solid waste power plant. Waste Manag. 2021, 121, 11–22. [Google Scholar] [CrossRef]
- Tsvetkova, O.; Ouarda, T.B.M.J. A review of sensitivity analysis practices in wind resource assessment. Energy Convers. Manag. 2021, 238, 114112. [Google Scholar] [CrossRef]
- Jiang, Y.; Yang, Z.; Jiao, K.; Du, Q. Sensitivity analysis of uncertain parameters based on an improved proton exchange membrane fuel cell analytical model. Energy Convers. Manag. 2018, 164, 639–654. [Google Scholar] [CrossRef]
Figure 1.
Flowchart of the cost calculation of the atomization drying system.

Figure 2.
Diagram of the relationship between the current of mistorizer and the handling capacity of the concentrates.
Figure 2.
Diagram of the relationship between the current of mistorizer and the handling capacity of the concentrates.

Figure 3.
The proportion of costs in different items.

Figure 4.
Relative change value of .

Figure 5.
The value under operating conditions with different unit loads.

Figure 6.
The absolute value of the sensitivity coefficient of factor A to .


Table 1.
Unit parameters under different loads before flue gas extraction.
| THA | 75%THA | 50%THA | 40%THA | 30%THA | |
|---|---|---|---|---|---|
| Unit load MW | 600 | 450 | 300 | 240 | 180 |
| Exhaust temperature °C | 124 | 110 | 105 | 90 | 91 |
| Total energy input to the boiler GJ/h | 4844.19 | 3699.58 | 2584.36 | 2124.82 | 1695.93 |
| Boiler efficiency % | 94.14 | 94.49 | 94.4 | 94.96 | 94.59 |
| Total efficiency % | 44.59 | 43.79 | 41.79 | 40.66 | 38.21 |
| % | 47.37 | 46.34 | 44.27 | 42.82 | 40.39 |
Table 2.
Economic parameters under different extracted flue gas temperature operating conditions.
| Flue Gas Temperature (°C) | 300 | 350 | 400 | 450 | 500 | 550 | 600 | 650 | 700 | 750 | 800 |
| Unit Load (MW) | 600 | 600 | 600 | 600 | 600 | 600 | 600 | 600 | 600 | 600 | 600 |
| Concentrates Flow (t/h) | 1 | 1 | 1 | 1 | 1 | 1 | 1 | 1 | 1 | 1 | 1 |
| Flue gas flow (Nm3/h) | 10924.06 | 8148.75 | 6475.21 | 5396.33 | 4641.73 | 4070.97 | 3635.35 | 3283.69 | 3001.15 | 2764.33 | 2567.44 |
| Boiler efficiency (%) | 94.0771 | 94.0792 | 94.0800 | 94.0805 | 94.0806 | 94.0806 | 94.0804 | 94.0800 | 94.0796 | 94.0792 | 94.0787 |
| (CNY/h) | 156.4202 | 151.0822 | 149.2037 | 147.9651 | 147.5925 | 147.7274 | 148.2463 | 149.0197 | 150.0109 | 151.1615 | 152.4583 |
| (CNY/h) | 21.3019 | 15.8901 | 12.6267 | 10.5228 | 9.0514 | 7.9384 | 7.0889 | 6.4032 | 5.8522 | 5.3904 | 5.0065 |
| (CNY/h) | 2.9773 | 2.9773 | 2.9773 | 2.9773 | 2.9773 | 2.9773 | 2.9773 | 2.9773 | 2.9773 | 2.9773 | 2.9773 |
| C (CNY/h) | 180.6995 | 169.9496 | 164.8076 | 161.4653 | 159.6212 | 158.6431 | 158.3126 | 158.4002 | 158.8405 | 159.5293 | 160.4421 |
| (CNY/t) | 180.6995 | 169.9496 | 164.8076 | 161.4653 | 159.6212 | 158.6431 | 158.3126 | 158.4002 | 158.8405 | 159.5293 | 160.4421 |
Table 3.
Economic parameters under conditions where the concentrates had different handling capacities.
Table 3.
Economic parameters under conditions where the concentrates had different handling capacities.
| Flue Gas Temperature (°C) | 600 | 600 | 600 | 600 | 600 | 600 | 600 | 600 | 600 | 600 | 600 |
| Unit Load (MW) | 600 | 600 | 600 | 600 | 600 | 600 | 600 | 600 | 600 | 600 | 600 |
| Concentrates Flow (t/h) | 1 | 1.2 | 1.4 | 1.6 | 1.8 | 2 | 2.2 | 2.4 | 2.6 | 2.8 | 3 |
| Flue gas flow (Nm3/h) | 3635.35 | 4362.42 | 5089.49 | 5816.56 | 6543.63 | 7270.70 | 7997.77 | 8724.84 | 9451.91 | 10,178.98 | 10,906.05 |
| (CNY/h) | 148.2463 | 177.8956 | 207.5448 | 237.1941 | 266.8434 | 296.4926 | 326.1419 | 355.7911 | 385.4404 | 415.0897 | 444.7389 |
| (CNY/h) | 7.0889 | 8.5067 | 9.9245 | 11.3423 | 12.7601 | 14.1779 | 15.5956 | 17.0134 | 18.4312 | 19.8490 | 21.2668 |
| (CNY/h) | 2.9773 | 3.0400 | 3.1497 | 3.2965 | 3.4706 | 3.6620 | 3.8609 | 4.0574 | 4.2416 | 4.4035 | 4.5334 |
| C (CNY/h) | 158.3126 | 189.4423 | 220.6190 | 251.8329 | 283.0740 | 314.3325 | 345.5984 | 376.8620 | 408.1132 | 439.3422 | 470.5392 |
| (CNY/t) | 158.3126 | 157.8686 | 157.5850 | 157.3956 | 157.2633 | 157.1663 | 157.0902 | 157.0258 | 156.9666 | 156.9079 | 156.8464 |
Table 4.
Economic parameters under different unit load operating conditions.
| Flue Gas Temperature | Unit Load | 300 °C | 350 °C | 400 °C | 450 °C | 500 °C | 550 °C | 600 °C | 650 °C | 700 °C | 750 °C | 800 °C |
| (CNY/h) | 600 MW | 156.420 | 151.082 | 149.204 | 147.965 | 147.593 | 147.727 | 148.246 | 149.020 | 150.011 | 151.161 | 152.458 |
| 450 MW | 164.624 | 157.186 | 152.902 | 150.543 | 149.374 | 148.898 | 148.941 | 149.322 | 149.991 | 150.864 | 151.922 | |
| 300 MW | 162.082 | 153.078 | 148.412 | 145.773 | 144.385 | 143.725 | 143.608 | 143.846 | 144.382 | 145.130 | 146.070 | |
| 240 MW | 168.145 | 156.563 | 150.369 | 146.686 | 144.553 | 143.315 | 142.745 | 142.606 | 142.827 | 143.303 | 144.005 | |
| 180 MW | 157.890 | 147.157 | 141.424 | 138.023 | 136.062 | 134.932 | 134.424 | 134.315 | 134.543 | 135.007 | 135.682 | |
| (CNY/h) | 600 MW | 21.302 | 15.890 | 12.627 | 10.523 | 9.051 | 7.938 | 7.089 | 6.403 | 5.852 | 5.390 | 5.007 |
| 450 MW | 21.506 | 15.919 | 12.755 | 10.633 | 9.148 | 8.025 | 7.167 | 6.475 | 5.918 | 5.452 | 5.064 | |
| 300 MW | 21.506 | 16.053 | 12.867 | 10.729 | 9.232 | 8.100 | 7.235 | 6.537 | 5.976 | 5.505 | 5.114 | |
| 240 MW | 21.582 | 16.114 | 12.917 | 10.772 | 9.270 | 8.133 | 7.265 | 6.565 | 6.002 | 5.530 | 5.137 | |
| 180 MW | 21.653 | 16.171 | 12.964 | 10.813 | 9.306 | 8.165 | 7.294 | 6.591 | 6.026 | 5.552 | 5.158 | |
| (CNY/h) | 2.977 | 2.977 | 2.977 | 2.977 | 2.977 | 2.977 | 2.977 | 2.977 | 2.977 | 2.977 | 2.977 | |
| C (CNY/h) | 600 MW | 180.699 | 169.950 | 164.808 | 161.465 | 159.621 | 158.643 | 158.313 | 158.400 | 158.840 | 159.529 | 160.442 |
| 450 MW | 189.107 | 176.082 | 168.634 | 164.153 | 161.500 | 159.900 | 159.085 | 158.774 | 158.886 | 159.293 | 159.964 | |
| 300 MW | 186.565 | 172.108 | 164.256 | 159.479 | 156.594 | 154.801 | 153.820 | 153.360 | 153.335 | 153.613 | 154.162 | |
| 240 MW | 192.704 | 175.654 | 166.263 | 160.436 | 156.800 | 154.426 | 152.988 | 152.148 | 151.806 | 151.809 | 152.119 | |
| 180 MW | 182.520 | 166.305 | 157.366 | 151.813 | 148.345 | 146.075 | 144.695 | 143.884 | 143.546 | 143.537 | 143.818 | |
| (CNY/t) | 600 MW | 180.699 | 169.950 | 164.808 | 161.465 | 159.621 | 158.643 | 158.313 | 158.400 | 158.840 | 159.529 | 160.442 |
| 450 MW | 189.107 | 176.082 | 168.634 | 164.153 | 161.500 | 159.900 | 159.085 | 158.774 | 158.886 | 159.293 | 159.964 | |
| 300 MW | 186.565 | 172.108 | 164.256 | 159.479 | 156.594 | 154.801 | 153.820 | 153.360 | 153.335 | 153.613 | 154.162 | |
| 240 MW | 192.704 | 175.654 | 166.263 | 160.436 | 156.800 | 154.426 | 152.988 | 152.148 | 151.806 | 151.809 | 152.119 | |
| 180 MW | 182.520 | 166.305 | 157.366 | 151.813 | 148.345 | 146.075 | 144.695 | 143.884 | 143.546 | 143.537 | 143.818 |
Table 5.
Sensitivity analysis of the handling capacities of the concentrates and the temperature of the extracted flue gas.
Table 5.
Sensitivity analysis of the handling capacities of the concentrates and the temperature of the extracted flue gas.
| Flue gas Temperature (°C) | 300 | 350 | 400 | 450 | 500 | 550 | 600 | 650 | 700 | 750 | 800 |
| (CNY/t) | 180.6995 | 169.9496 | 164.8076 | 161.4653 | 159.6212 | 158.6431 | 158.3126 | 158.4002 | 158.8405 | 159.5293 | 160.4421 |
| −0.2828 | −0.1764 | −0.1231 | −0.0797 | −0.0496 | −0.0251 | / | 0.0066 | 0.0200 | 0.0307 | 0.0404 | |
| Concentrates flow (t/h) | 1 | 1.2 | 1.4 | 1.6 | 1.8 | 2 | 2.2 | 2.4 | 2.6 | 2.8 | 3 |
| (CNY/t) | 158.3126 | 157.8686 | 157.585 | 157.3956 | 157.2633 | 157.1663 | 157.0902 | 157.0258 | 156.9666 | 156.9079 | 156.8464 |
| / | −0.0140 | −0.0115 | −0.0097 | −0.0083 | −0.0072 | −0.0064 | −0.0058 | −0.0053 | −0.0049 | −0.0046 |
Table 6.
Sensitivity analysis of unit load.
| EA | 600 MW | 450 MW | 300 MW | 240 MW | 180 MW |
| 300 °C | / | −0.1861 | −0.0649 | −0.1107 | −0.0144 |
| 350 °C | / | −0.1443 | −0.0254 | −0.0559 | 0.0306 |
| 400 °C | / | −0.0929 | 0.0067 | −0.0147 | 0.0645 |
| 450 °C | / | −0.0666 | 0.0246 | 0.0106 | 0.0854 |
| 500 °C | / | −0.0471 | 0.0379 | 0.0295 | 0.1009 |
| 550 °C | / | −0.0317 | 0.0484 | 0.0443 | 0.1132 |
| 600 °C | / | −0.0195 | 0.0568 | 0.0561 | 0.1229 |
| 650 °C | / | −0.0094 | 0.0636 | 0.0658 | 0.1309 |
| 700 °C | / | −0.0011 | 0.0693 | 0.0738 | 0.1376 |
| 750 °C | / | 0.0059 | 0.0742 | 0.0807 | 0.1432 |
| 800 °C | / | 0.0119 | 0.0783 | 0.0865 | 0.1480 |
Table 7.
The fitting formula of with flue gas temperature under different loads.
| Unit Load | Fitting Formula | R2 |
|---|---|---|
| THA | y = 348.13 − 1.04x + 0.002x2 − 1.86×10−6x3 + 6.20×10−10x4 a | 0.9948 |
| 75%THA | y = 412.59 − 1.40x + 0.003x2 − 2.65×10−6x3 + 9.17×10−10x4 | 0.9982 |
| 50%THA | y = 470.75 − 1.86x + 0.004x2 − 4.10×10−6x3 + 1.54×10−9x4 | 0.9988 |
| 40%THA | y = 555.36 − 2.43x + 0.006x2 − 5.81×10−6x3 + 2.28×10−9x4 | 0.9993 |
| 30%THA | y = 527.16 − 2.30x + 0.005x2 − 5.52×10−6x3 + 2.16×10−9x4 | 0.9993 |
a: y was , and x was flue gas temperature.
Table 8.
Flue gas temperature at different load positions and probabilities.
| Flue Gas Temperature (°C) | THA | 75%THA | 50%THA | 40%THA | 30%THA |
| Leaving Furnace | 965 | 915 | 817 | 772 | 723 |
| Leaving SH2 a | 1139 | 1049 | 930 | 874 | 811 |
| Entering SH3 | 1139 | 1049 | 930 | 874 | 811 |
| Leaving SH3 | 965 | 915 | 817 | 772 | 723 |
| Entering SH1 | 744 | 691 | 616 | 576 | 533 |
| Leaving SH1 | 559 | 519 | 463 | 447 | 432 |
| Entering RH2 b | 969 | 896 | 799 | 754 | 706 |
| Leaving RH2 | 869 | 808 | 730 | 686 | 641 |
| Entering RH1 | 829 | 770 | 691 | 643 | 598 |
| Leaving RH1 | 378 | 365 | 367 | 350 | 352 |
| Entering ECO c | 559 | 519 | 461 | 445 | 429 |
| Leaving ECO | 344 | 318 | 278 | 268 | 248 |
| Probability of the load (%) | 0.00 | 21.46 | 31.71 | 19.70 | 27.13 |
a: SH, superheater; b: RH, reheater; c: ECO, economizer.
Table 9.
The value at different positions and the average cost.
| Cper i | THA | 75%THA | 50%THA | 40%THA | 30%THA | |
|---|---|---|---|---|---|---|
| Leaving Furnace | 159.8413 | 161.2278 | 156.1253 | 150.6330 | 142.1978 | 152.3601 |
| Leaving SH2 a | 173.7831 | 171.4794 | 163.7696 | 156.3855 | 143.1121 | 158.3656 |
| Entering SH3 | 173.7831 | 171.4794 | 163.7696 | 156.3855 | 143.1121 | 158.3656 |
| Leaving SH3 | 159.8413 | 161.2278 | 156.1253 | 150.6330 | 142.1978 | 152.3601 |
| Entering SH1 | 157.1432 | 158.8013 | 155.0615 | 153.2787 | 146.1721 | 153.1014 |
| Leaving SH1 | 156.7897 | 160.1580 | 158.8184 | 159.9803 | 152.8160 | 157.7066 |
| Entering RH2 b | 159.9673 | 160.6666 | 155.7047 | 150.4981 | 142.3714 | 152.1268 |
| Leaving RH2 | 158.0472 | 159.3470 | 154.9958 | 151.0276 | 143.4315 | 152.0107 |
| Entering RH1 | 157.6985 | 159.1125 | 154.9270 | 151.7821 | 144.3294 | 152.3308 |
| Leaving RH1 | 166.6354 | 173.9733 | 169.8800 | 176.1394 | 166.2362 | 171.0032 |
| Entering ECO c | 156.7897 | 160.1580 | 158.9463 | 160.1756 | 153.1473 | 157.8755 |
| Leaving ECO | 171.3747 | 183.7952 | 194.2078 | 206.6030 | 206.0846 | 197.6374 |
a: SH, superheater; b: RH, reheater; c: ECO, economizer.
Publisher’s Note: MDPI stays neutral with regard to jurisdictional claims in published maps and institutional affiliations. |
© 2022 by the authors. Licensee MDPI, Basel, Switzerland. This article is an open access article distributed under the terms and conditions of the Creative Commons Attribution (CC BY) license (https://creativecommons.org/licenses/by/4.0/).
Share and Cite
MDPI and ACS Style
Zhao, N.; Feng, Y.; Li, D.; Chen, L. Economic Analysis of Atomization Drying of Concentrated Solution Based on Zero Discharge of Desulphurization Wastewater. Water 2022, 14, 148. https://doi.org/10.3390/w14020148
AMA Style
Zhao N, Feng Y, Li D, Chen L. Economic Analysis of Atomization Drying of Concentrated Solution Based on Zero Discharge of Desulphurization Wastewater. Water. 2022; 14(2):148. https://doi.org/10.3390/w14020148
Chicago/Turabian StyleZhao, Ning, Yongxin Feng, Debo Li, and Limei Chen. 2022. "Economic Analysis of Atomization Drying of Concentrated Solution Based on Zero Discharge of Desulphurization Wastewater" Water 14, no. 2: 148. https://doi.org/10.3390/w14020148
Note that from the first issue of 2016, this journal uses article numbers instead of page numbers. See further details here.