
Performance and Design of a Stepped Spillway Aerator


1
Stucky Ltd., Rue du Lac 33, CH-1020 Renens, Switzerland
2
Civil Engineering Department, Haute Ecole d’Ingénierie et d’Architecture de Fribourg (HEIA-FR, HES-SO), CH-1705 Fribourg, Switzerland
3
Laboratory of Hydraulic Constructions (LCH), Ecole Polytechnique Fédérale de Lausanne (EPFL), CH-1015 Lausanne, Switzerland
*
Author to whom correspondence should be addressed.
†
Formerly, Laboratory of Hydraulic Constructions (LCH), Ecole Polytechnique Fédérale de Lausanne (EPFL), CH-1015 Lausanne, Switzerland.
Water 2022, 14(2), 153; https://doi.org/10.3390/w14020153
Submission received: 28 October 2021
/
Revised: 17 December 2021
/
Accepted: 31 December 2021
/
Published: 7 January 2022
(This article belongs to the Special Issue Advances in Spillway Hydraulics: From Theory to Practice)
Abstract
:Stepped spillways are frequently limited to specific discharges under around 30 m2/s due to concerns about potential cavitation damages. A small air concentration can prevent such damages and the design of bottom aerators is well established for smooth chutes. The purpose of this study is to systematically investigate the performance of a deflector aerator at the beginning of stepped chutes. Six parameters (chute angle, step height, approach flow depth, approach flow Froude number, deflector angle and deflector height) are varied in a physical model. The spatial air concentration distribution downstream of the aerator, the cavity sub-pressure, water discharge and air discharges are measured. The results describe the commonly used air entrainment coefficient, the jet length, as well as the average and bottom air concentration development to design an aerator. The lowest bottom air concentration measured in all tests is higher than the air concentration recommended in literature to protect against cavitation damages. And, unlike smooth chutes, there appears to be no significant air detrainment downstream of the jet impact. One deflector aerator seems therefore sufficient to provide protection of a stepped spillway.
Keywords:
aeration; aerator; air concentration; air entrainment; cavitation; deflector; stepped chute; stepped spillways1. Introduction
1.1. Stepped Spillways
Stepped spillways are commonly used, owing to their efficient energy dissipation and the emergence of roller compacted concrete (RCC) dams in the 1980s. Steep step spillways (chute angle φ ≈ 50°) are found on the downstream face of RCC or gravity dams, while moderate slope stepped spillways (φ ≈ 30°) are found on embankments dams.
Stepped spillways have been widely studied in the past decades in terms of flow regime, energy dissipation, self-aeration and pressure distribution. General summaries of researches are given in [1,2,3]. One major drawback of stepped spillways is that the specific discharge q has been limited to q ≤ 30 m3/s/m [4,5,6,7] to avoid cavitation damages upstream of the inception point.
1.2. Cavitation
Cavitation corresponds to the formation of vapor cavities in water due to a reduction of the local pressure below the vapor pressure. The low pressure usually results from local flow separation of a high velocity flow along the boundary. Vapor bubbles are swept downstream until they reach a zone with pressures high enough for their collapse. A shock wave is formed during the collapse, as well as a microjet if the collapse happens close to a boundary. The resulting pitting harms the boundary.
The inception of cavitation can be assessed with the cavitation index σ = (p + pa − pv)/(ρu2/2), where p is the local pressure, pa the atmospheric pressure, pv the vapor pressure, ρ the fluid density and u the average flow velocity. Due to local velocities and pressure fluctuations, cavitation inception does not start at σ = 0 but at a critical cavitation index σc, which depends on the geometric chute configuration and surface irregularity.
Multiple studies summarized in [8] determined σc for various geometric singularities. The critical cavitation index below which damages are likely is σc = 0.2 on smooth chutes with strict construction tolerances [8,9,10].
Stepped chutes are probably more prone to cavitation due to steps protruding into the flow. Using acoustic measurements, [11] showed a large increase in cavitation activity for 0.30 ≤ σ ≤ 0.65 for two stepped chute angles of φ = 21.8° and φ = 68.2°. They suggested that the critical cavitation index σc is related to the Darcy friction factor f with σc = 4f. A consecutive research [12], showed that after a few hours of operation at σ = 0.30, consistent damages were observed on steps for φ = 21.8°, while lesser damages were observed for φ = 68.2°. Using pressure measurements for φ = 51.3°, [6] showed that the lowest pressures occur just upstream of the inception point on the vertical face close to the step edge.
1.3. Chute Aerators
On smooth chutes, aerators artificially entrain air into high velocity flow to limit cavitation damages. Many researches of the 1980s [16,17,18,19,20,21,22,23] focused on the air entrainment coefficient β = qA/q—the ratio of specific air discharge qA to specific water discharge q—and showed that it is mainly related to the jet length L, the approach flow Froude number Fo and the air cavity sub-pressure Δp. Further research investigated the stream-wise air transport and air detrainment to determine the bottom air concentration Cb close to the aerator [24] and far downstream [25].
Little research was performed on stepped chutes. Two geometrical configurations were investigated for limited sets of parameters: the deflector aerator commonly used on stepped chutes [26], and a novel the step aerator [27,28]. The results showed a significantly better performance of the deflector aerator compared to the step aerator. Alternatives to aerate stepped chutes include lateral contraction of the flow with flaring gate piers [29], abrupt lateral contraction [30], and macro-roughness elements on the stepped chute that displace the inception point upstream [31]. The latter seems however unlikely to be an effective solution for high specific discharges.
1.4. Objectives
Potential cavitation damages currently limit stepped spillway designs for high specific discharges (q ≤ 30 m3/s/m). Since research on aerators in the past decades solved a similar issue on smooth chutes, some preliminary studies of aerators on stepped chutes were carried out with promising results [26,27,28].
The objective of the present study was to investigate the performance of a deflector aerator at the beginning of stepped chutes to prevent cavitation damages and therefore allow high specific discharges. The deflector aerator was studied on a physical model [38]. The influence of all relevant parameters was for the first time systematically varied to study the aerator performance and its effect on the downstream flow features [38,39].
2. Experimental Setup
2.1. Physical Model
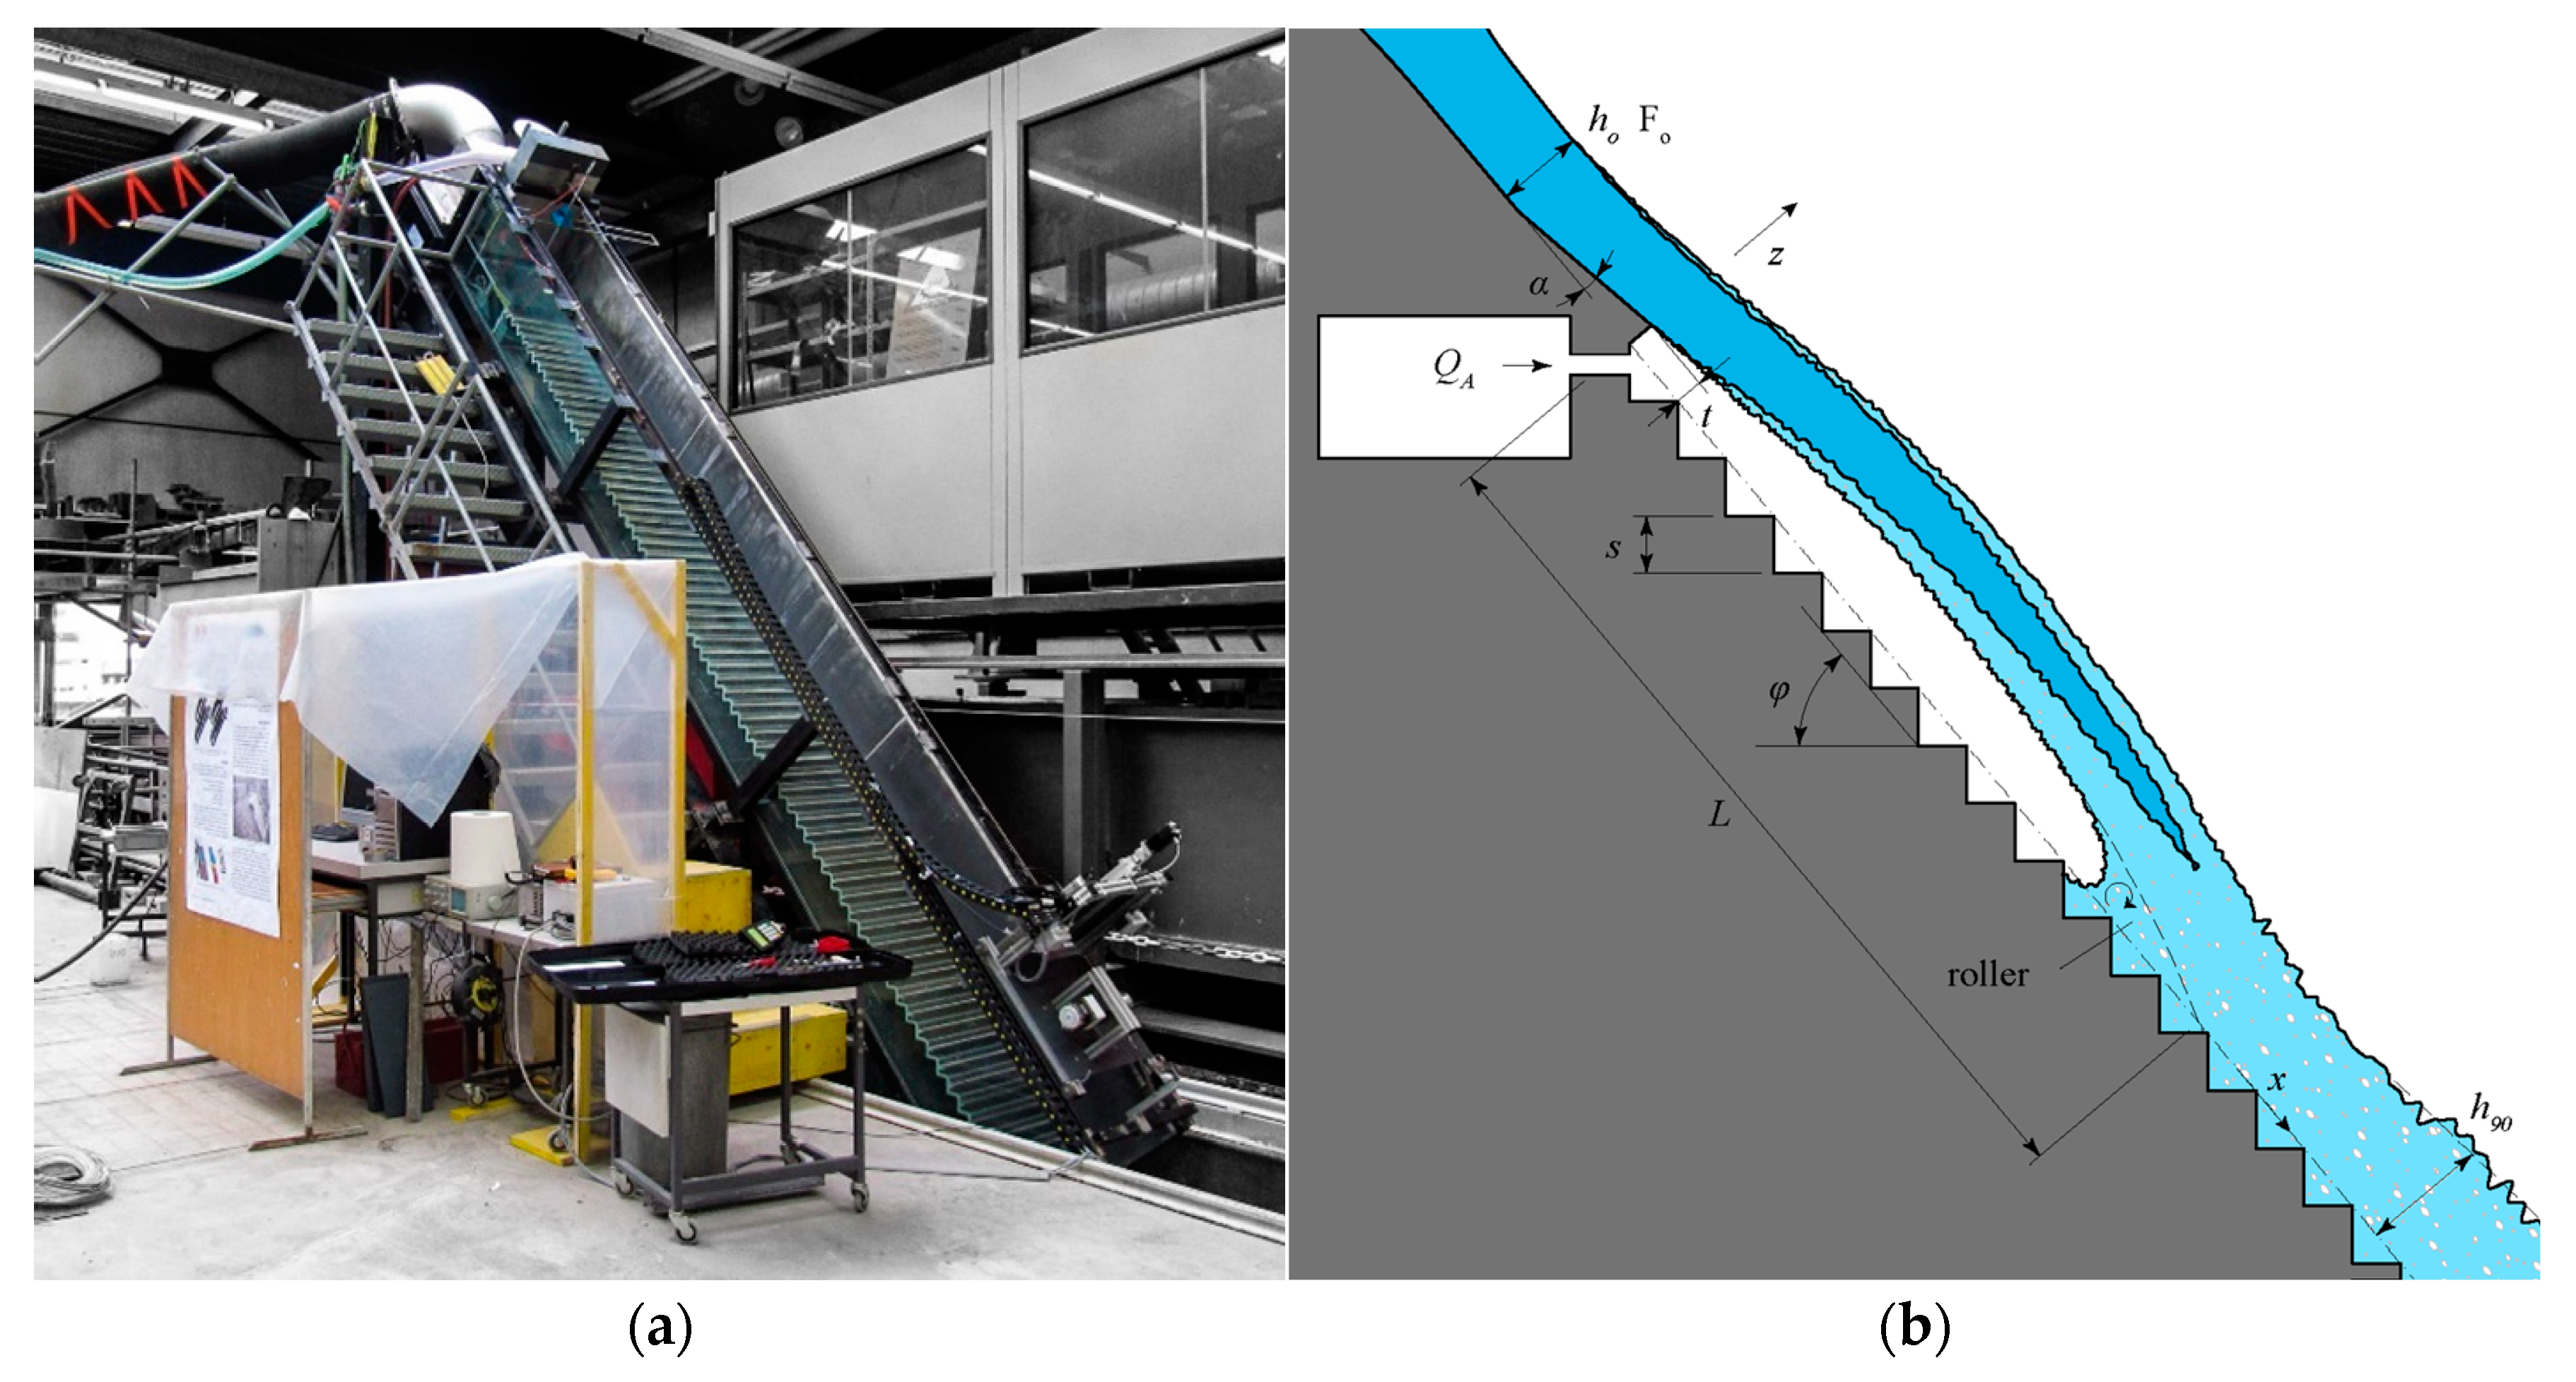
The herein described study was performed in the frame of the work cited as [38]. A 0.5 m wide prismatic channel at the Laboratory of Hydraulic Constructions (LCH) of EPFL was used (Figure 1a) [38]. One sidewall was made of acrylic to allow flow observation and it had an adjustable bottom angle φ (Figure 1b). The stream-wise channel length was 6 m for a chute angle φ = 50° and 8 m for φ = 30°.
The discharge was supplied to the channel via a jet-box [40]. It generated the transition between pressurized to free surface flow. Guiding walls inside the jet-box ensured a homogeneous flow distribution. Unlike an uncontrolled ogee, the jet-box independently set the approach flow depth ho and Froude number Fo. The jet-box opening height hjb could be varied in the range 0.015 ≤ hjb ≤ 0.113 m, and the maximum discharge provided by the pump if the jet-box was fully opened was Q = 0.245 m3/s, corresponding to a unit discharge of q = 0.490 m2/s.
The channel was equipped with steps made of folded aluminum sheets with a step height s = 0.06 m. The fold radius was 0.0055 m for φ = 50° and 0.006 m for φ = 30°. A 0.47 m long smooth section was located between the jet-box (protruding 0.28 m in the channel) and the first step. In total, 67 steps were installed for φ = 50° and 60 steps for φ = 30°. Rectangular wood inserts with a 0.001 m chamfer could be placed in each aluminum step to have a step height s = 0.030 m, which doubled the step count.
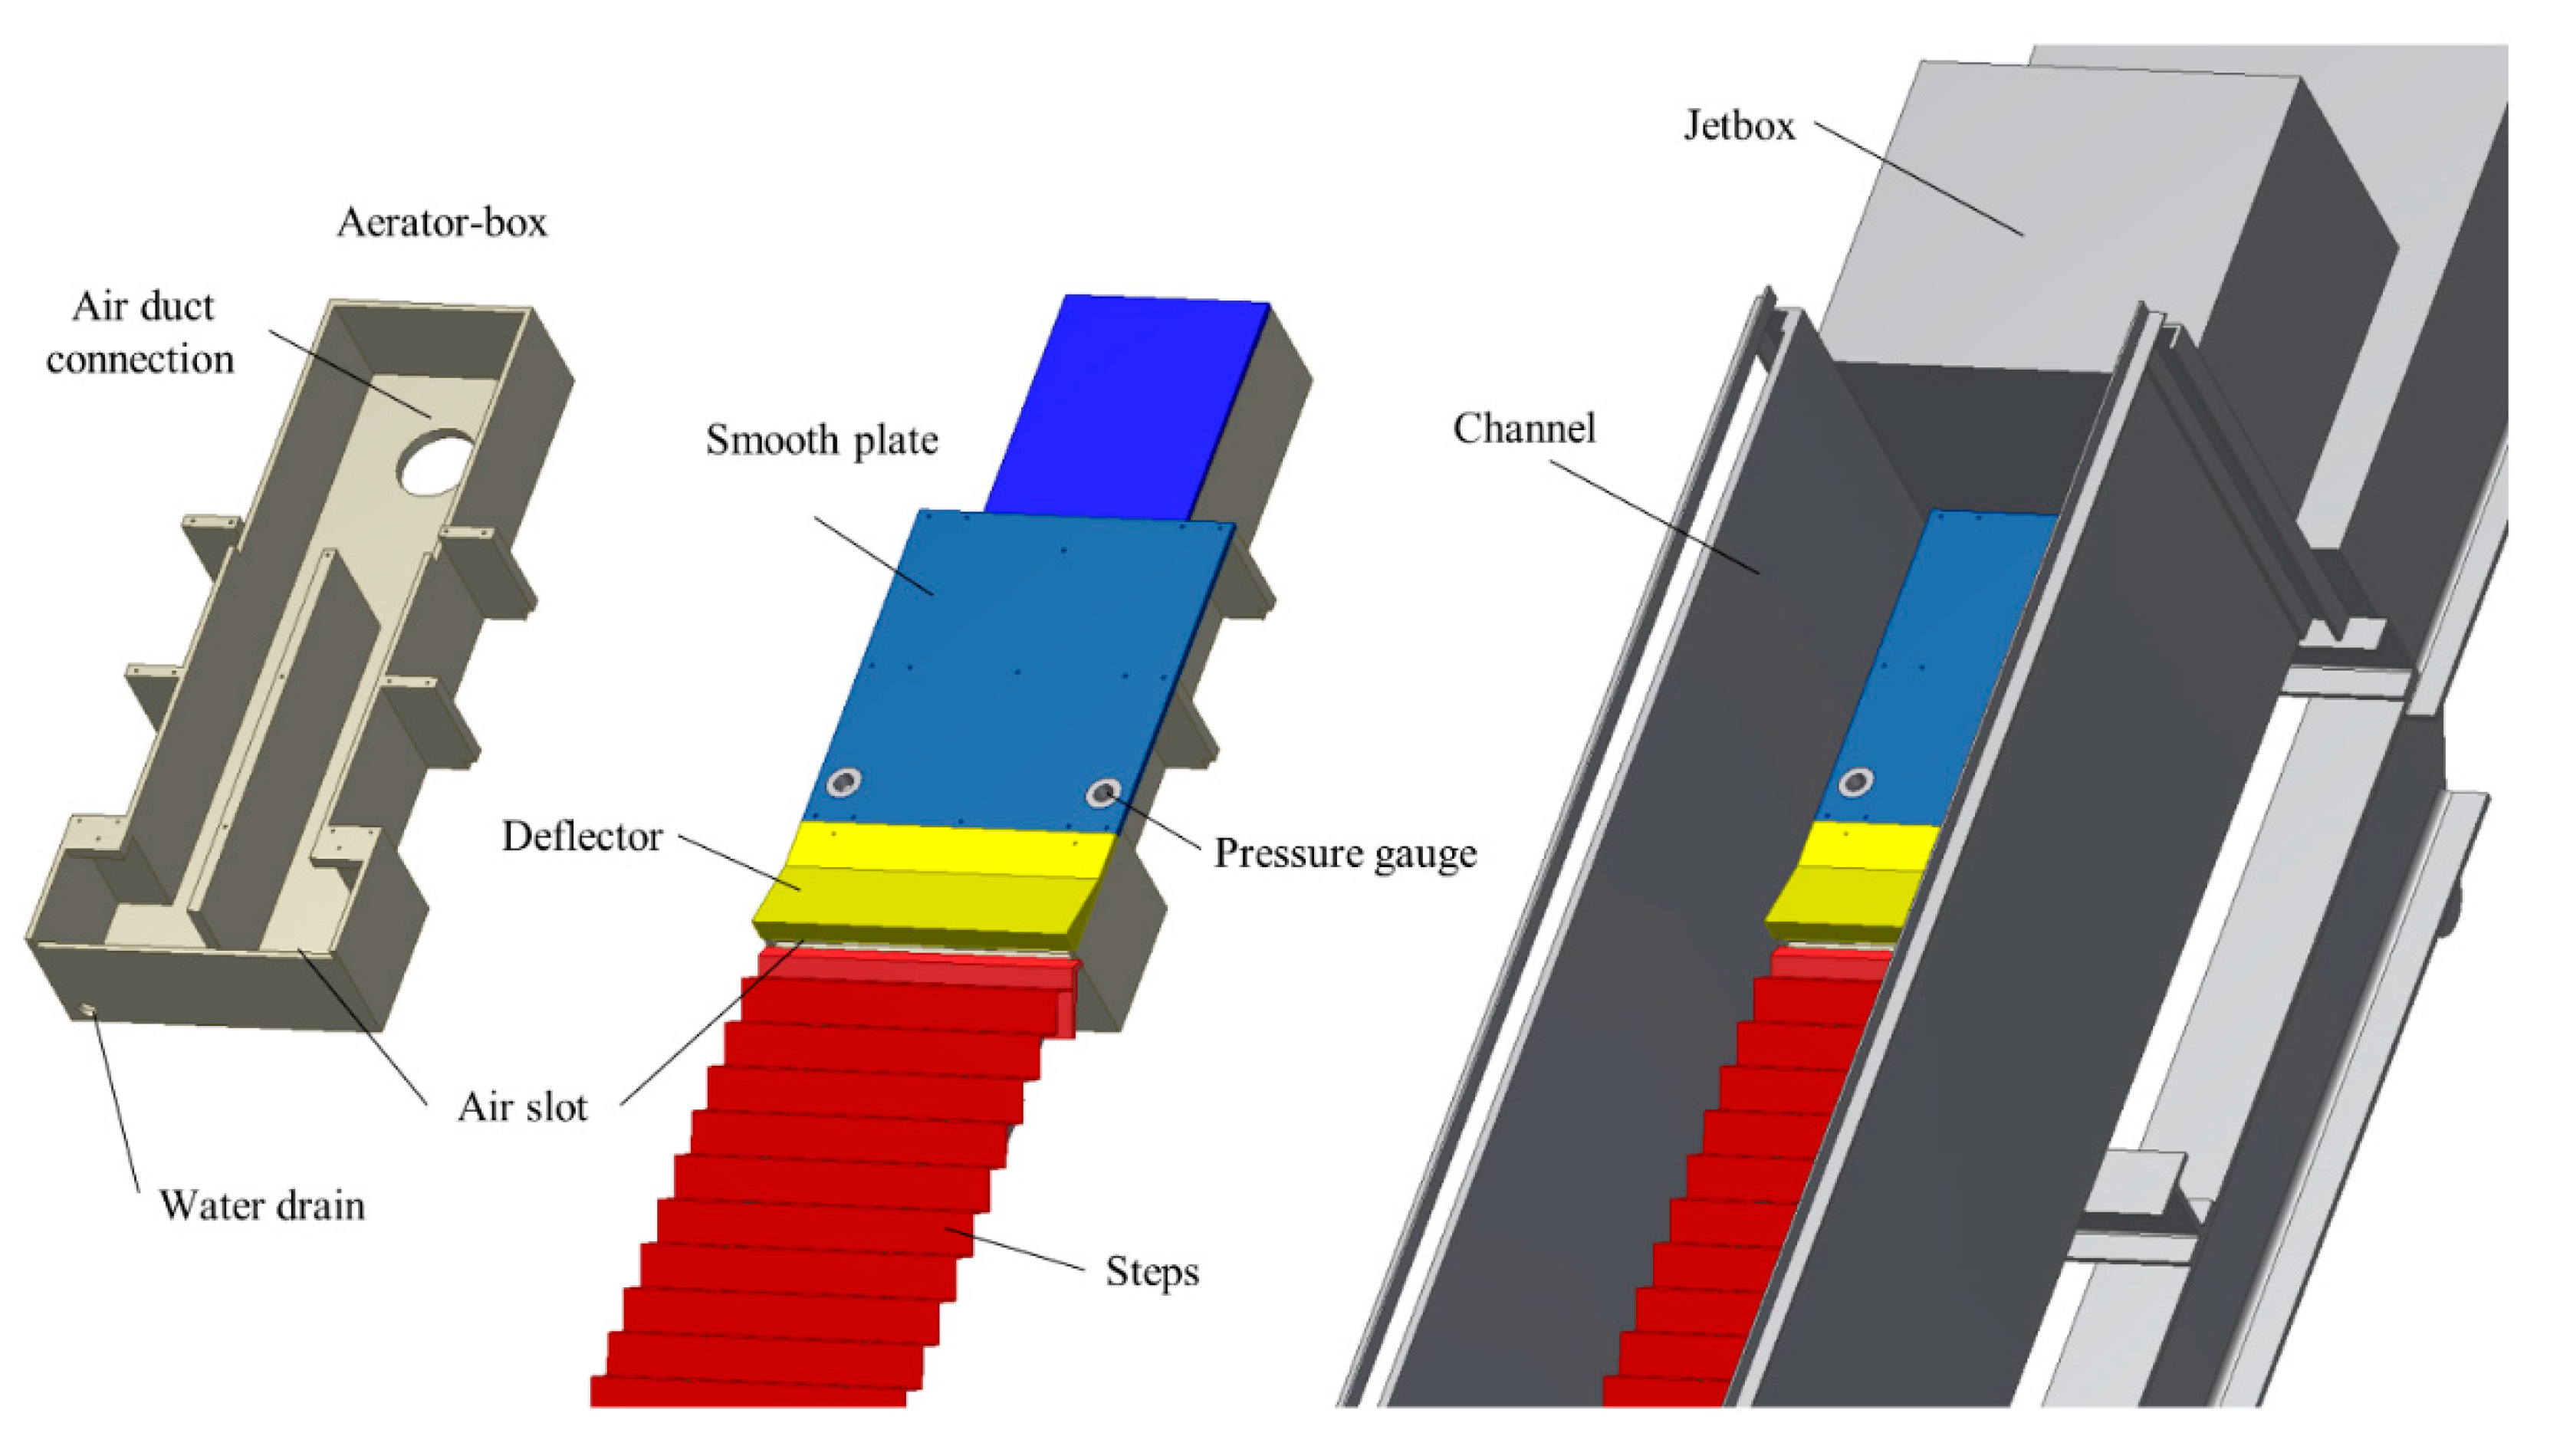
The aerator consisted of an aerator-box, as well as an interchangeable deflector and air duct (Figure 2). The aerator-box was impervious and had a sufficiently large cross-section to limit air head losses and therefore a sub-pressure in the cavity under the jet created by the deflector. The air slot below the deflector had a width of 0.48 m and a height of 0.02 m. The air duct was connected perpendicularly to the aerator-box to measure the air discharge. Two ducts were used: a 1 m long one with a 0.103 m internal diameter (for tests with low Froude numbers of Fo = 3.2) and a 1.8 m long one with a 0.153 m internal diameter (for all other tests).
2.2. Instrumentation
The water discharge was measured with an electromagnetic flowmeter (ABB COPA-XE, Zürich, Switzerland; Qmax = 0.667 m3/s; accuracy of ±0.005 Qmax for Q > 0.047 m3/s). The approach flow depths were measured with a point gauge at x = −0.20 m. Two piezoresistive pressure transducers (Baumer ED701 J20.633, Frauenfeld, Switzerland; pmax = 10 kPa; accuracy of ±0.001 pmax) were installed on the bottom at x = −0.27 m to estimate flow turbulence. The sub-pressure in the cavity below the jet Δp/(ρg) was measured using a U-shaped water manometer placed in the center of the channel at the exit of the air slot. A thermoelectric anemometer (Schiltknecht ThermoAir64, Gossau, Switzerland; umax = 5 m/s; accuracy of 0.005 umax + 0.015 u) was placed in the center of the duct cross-section and at 60% of the length from the intake to calculate the air discharge assuming a logarithmic velocity profile.
The local air concentration C was measured during 20 s with a phase-detection fiber-optical probe using an 80 μm prism at the tip (RBI Instrumentation, Meylan, France). Probes of the same manufacturer were used by [31,41,42,43,44,45]. The measurement error was found to be below 5% by [41]. The probe was compared to a phase-detection conductivity probe and showed a good agreement in the air concentrations measured [46]. Air concentration profiles were measured at the edge of the steps, starting from step 1 and with a regular stream-wise interval of 3 steps (steps 1, 4, 7, 10…) for the steps of s = 0.06 m. For the steps of s = 0.03 m, the same coordinates x was kept (steps 2, 8, 14, 20…). A total of 25 points were systematically measured for each profile. The depth-wise interval ∆z was kept constant for all profiles of the same test and varied in the range 0.004 ≤ ∆z ≤ 0.01 m. The number of profiles measured were 19 for φ = 50° and 18 for φ = 30°.
2.3. Test Program
The tests were designed to study the influence of the chute geometry—chute angle φ and step height s—the influence of the approach flow conditions—Froude number Fo and flow depth ho—as well as the deflector geometry—deflector angle α and deflector height t (Figure 1b). A total of 18 reference tests without the aerator and 44 aerator tests were performed (Table 1).
In addition, two reference tests and two aerator tests with a metal grid (0.008 m square holes every 0.01 m for a thickness of 0.0015 m, placed from x = −0.48 to x = −0.19 m) were performed to study the influence of the approach flow turbulence. Finally, two aerator tests were performed with pressurized air injected in the water supply pipe upstream of the jet-box to study the effect of approach flow pre-aeration. These 6 tests were performed with the chute φ = 30° and s = 0.03 m, the approach flow Fo = 5.5 or 7.5 and ho = 0.075 m, as well as with the deflector α = 9.46° and t = 0.03 m.
2.4. Scale Effects
As usual for free surface flows, a Froude similitude was adopted to conserve the ratio between inertia and gravity forces. For two-phase flows, forces due to turbulence and surface tension should also be considered. They are respectively described by the Reynolds number R(Lref) = uLref/ν and the Weber number W(Lref) = u/(σw/ρ/Lref)0.5, where Lref is a reference length, ν is the kinematic viscosity, ρ the water density and σw the surface tension between air and water. The Froude similitude leads to air bubbles being too large in the model, which results in a higher detrainment rate and lower transport capacity compared to a prototype [47]. The water drops of the disintegrating jet are also too large, although the jet dispersion is not affected [48].
Various smooth chute aerators, stepped spillways and other hydraulic structures studies have provided recommendations on the Reynolds number R, the Weber number W or the model scale factor λ to limit scale effects [21,47,48,49,50,51,52,53,54,55,56]. The recommendations depend on the characteristic being studied: air entrainment coefficient, average air concentration, air concentration profile, velocity profile, air bubble properties, etc. In addition, [57] highlighted that a turbulent velocity of 0.25 to 0.3 m/s is required to break the surface tension and to initiate the aeration process.
The present study mainly focused on the average and bottom air concentrations. For these characteristics, the recommendations are Ro = R(ho) ≥ 105 and Wo = W(ho) ≥ 110–140. The tests performed were in the ranges of 2.02 × 10⁵ ≤ Ro ≤ 4.86 × 10⁵ and 87 ≤ Wo ≤ 209. The Reynolds number recommendations was respected for all tests, while the two approach flow conditions with the lowest discharges (Fo = 3.2 with ho = 0.075 and Fo = 5.5 with ho = 0.052) might have been affected by scale effects based on the Weber number recommendations. However, the turbulence generated by the aerator and the steps might lower the scale effects limit observed in previous studies.
3. Results
3.1. Reference Tests without Aerator
The inception point was defined where the bottom air concentration reached Cb = 0.01. The inception position xi, inception mixture depth hi, inception equivalent blackwater flow depth hwi and inception average air concentration Cai were linearly interpolated between the two profiles adjacent to Cb = 0.01.
The mixture flow depth hi at the inception point showed a good agreement with literature [4,6,58,59] (Figure 3a). The two tests slightly below the general trend are the tests with Fo = 7.5 and s = 0.06 m. At this Froude number, the flow was decelerating when reaching the steps (increasing hw). With the step height s = 0.06 m, the inception point occurred during the deceleration, while it occurred after the deceleration phase for s = 0.03 m. These two tests are unusual cases for stepped spillway and were not considered for the inception point flow depth analysis. The following relationship was obtained for 30° ≤ φ ≤ 50° (r2 = 0.993)
where k = s·cosφ is the step roughness and Fk = q/(gk3 sin φ)0.5 the step roughness Froude number.
The equivalent blackwater flow depth at the inception point hwi gave slightly smaller depths than [60], which might be explained by a different method to locate the inception point (Figure 3b). The following relationship was obtained for 30° ≤ φ ≤ 50° (r2 = 0.988)
The average air concentration at the inception point Cai decreased with an increasing chute angle φ with Cai = 0.241 for φ = 30° and Cai = 0.201 for φ = 50°. The influence of the chute angle φ was previously found by [4] and slightly lower values were obtained in the present study. The results agreed well with Cai = 0.20 found by [58,60] for φ = 53.1°.
The flow depths at the end of the channel agreed well with the uniform mixture depth h90u and uniform equivalent blackwater flow depth hwu suggested by [61].
The uniform flow average air concentration Cau appeared to converge to the Cau values of smooth chutes as suggested by [4,62,63]. It signifies that Cau only depended on the chute angle φ. The influence of the step height s on Cau found in some relationships [4,64] might therefore be the consequence of insufficient flow development due to limited channel lengths. The Cau of [65] was used to normalize Ca in aerator tests results.
The uniform bottom air concentration Cbu also appeared to depend on φ. A value of Cbu = 0.17 is suggested for φ = 30°, and Cbu = 0.32 for φ = 50°. These values were used to normalize Cb in aerator tests results. Compared to smooth chutes [66], Cbu was close for φ = 30° (Cbu = 0.18), but there was an important difference for φ = 50° (Cbu = 0.50). The difference either indicates that steps have an influence or that uniform flow was not fully reached.
Based on the development of Ca and Cb presented in [38], a length of at least X = (x − xi)/hc ≥ 20 appeared to be required to reach quasi-uniform flow conditions.
3.2. Presentation of a Typical Aerator Test
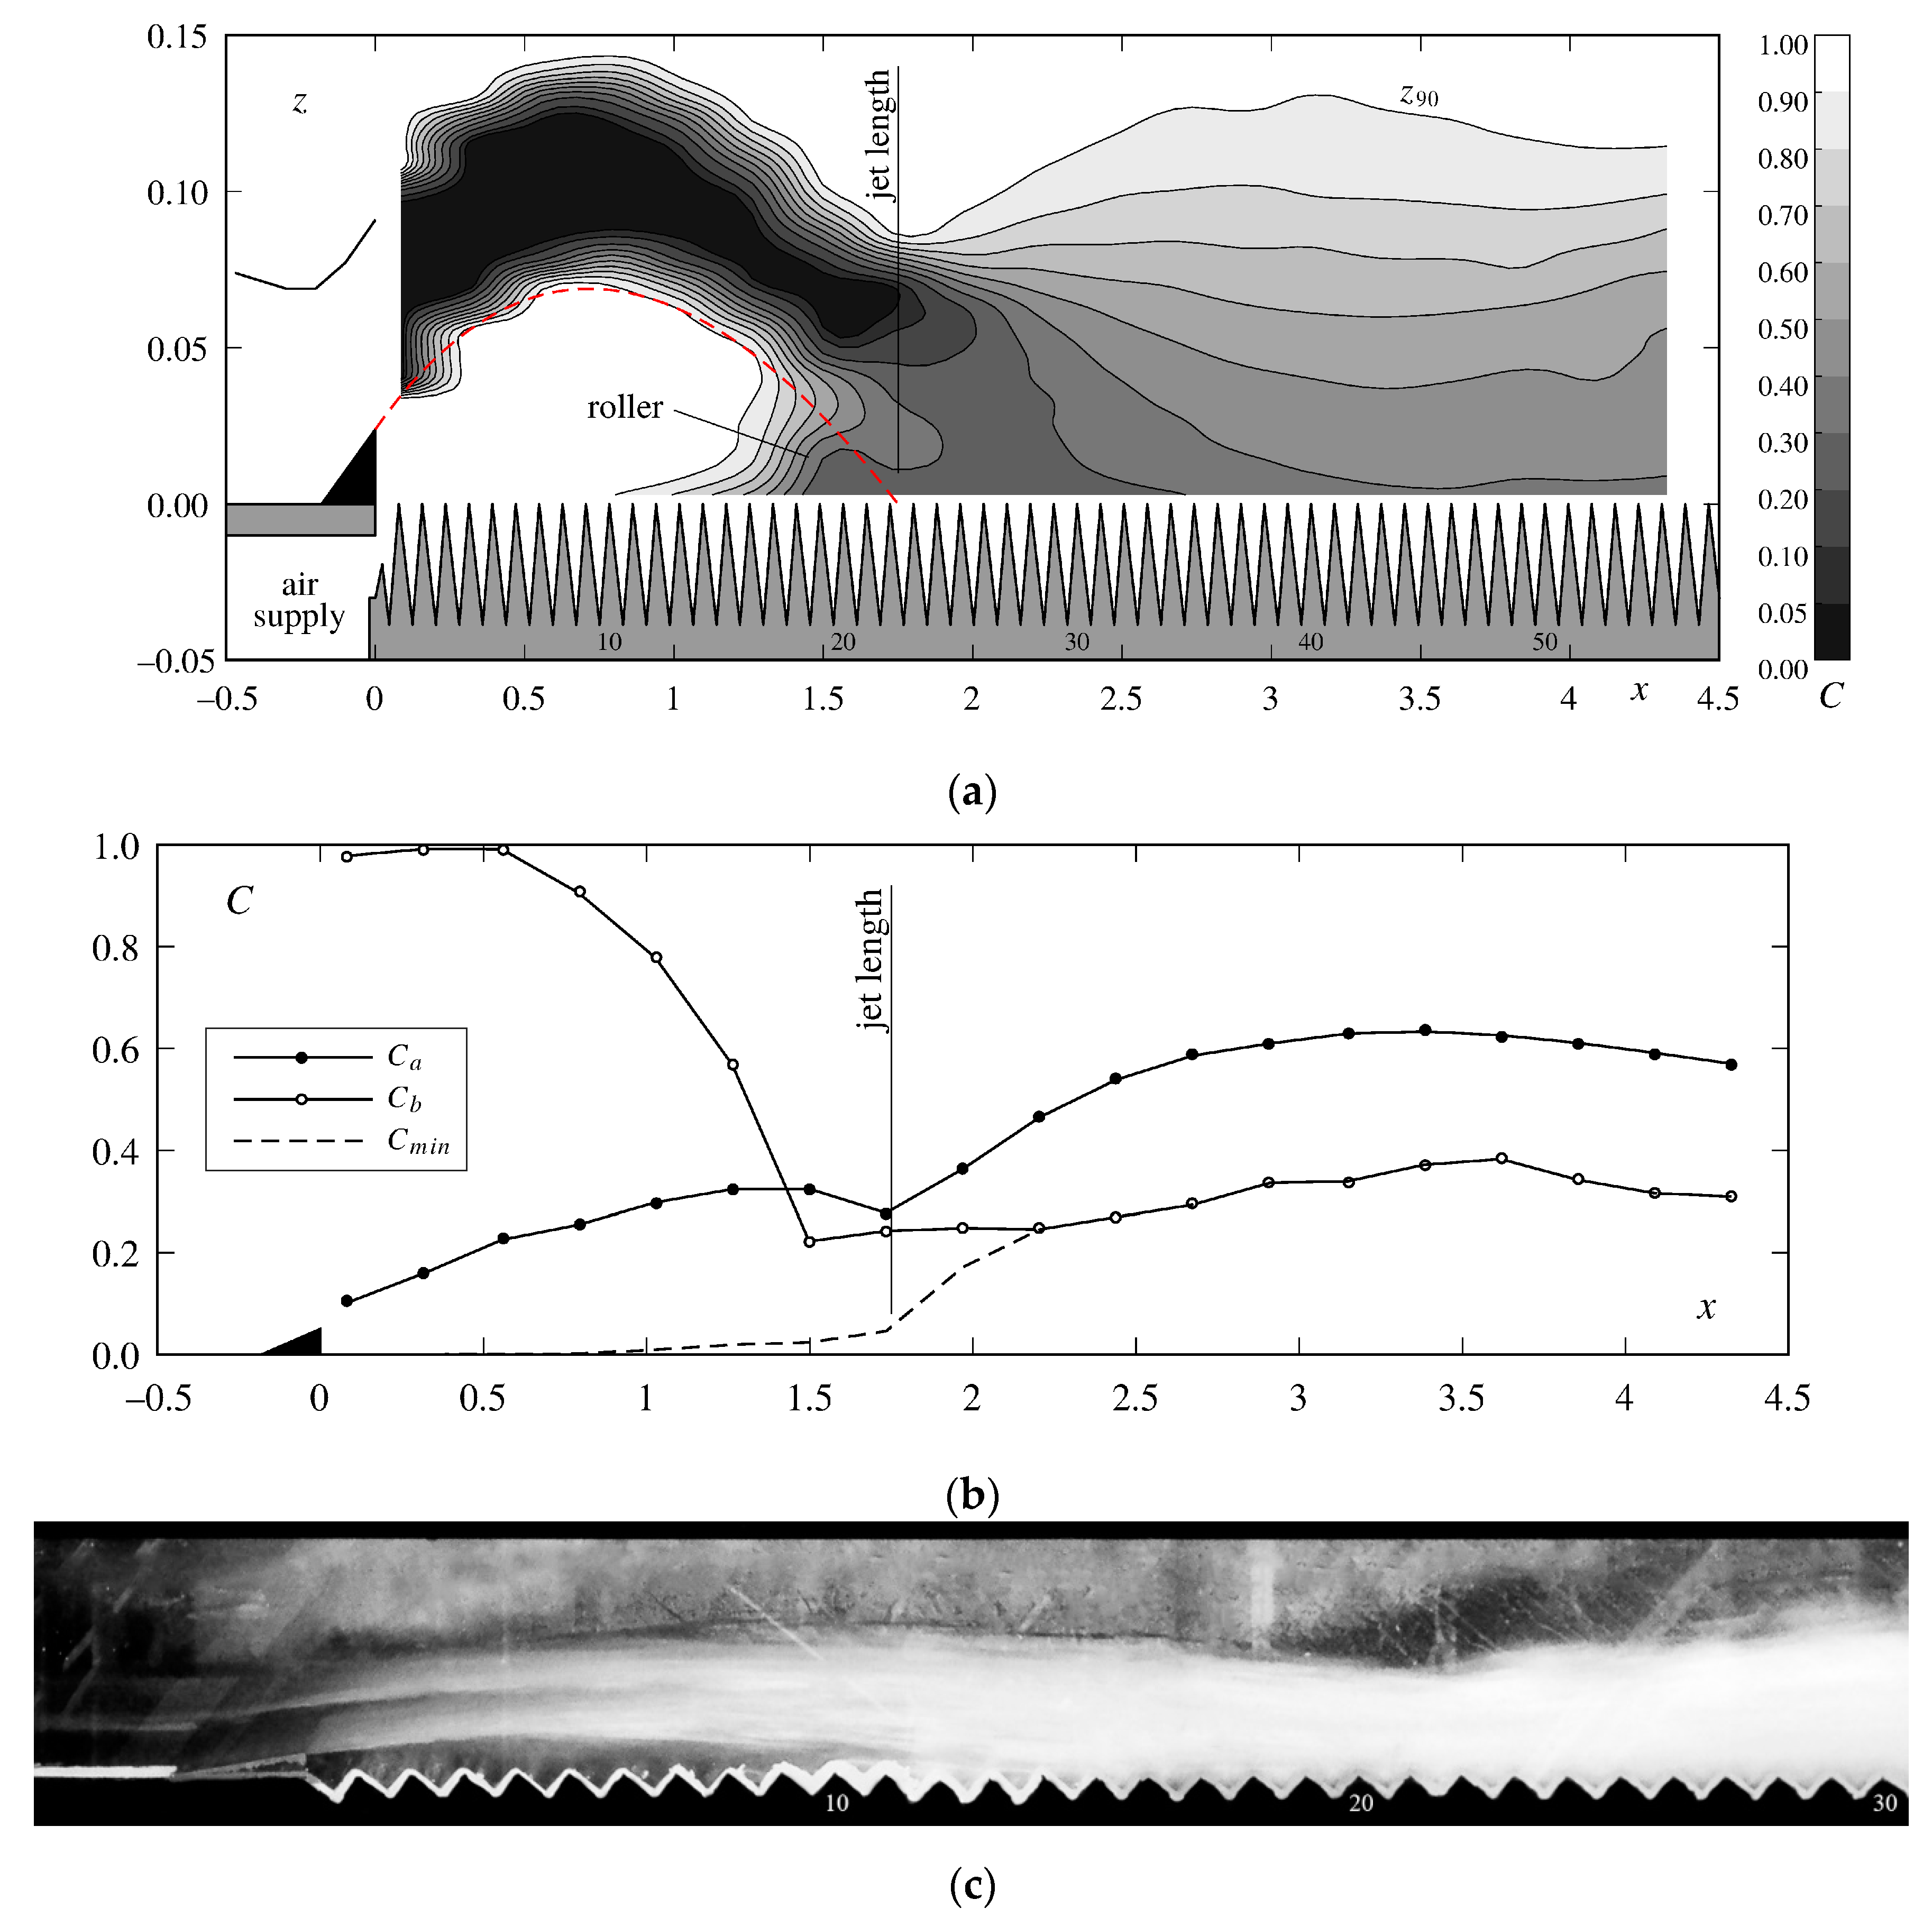
The air concentration distribution obtained in a typical aerator test is presented in Figure 4a.
The deflector is shown with a black triangle at x ≤ 0. Above, the black line is the flow depth measured with the point gauge. Below, the 0.02 m high air slot is visible in the vertical face of the first step. The deflector combined with the aeration underneath allowed for the generation of a free jet. The wavy pattern of the jet surfaces particularly visible for 0 ≤ x ≤ 0.5 m results only from contour interpolation artifacts. The jet was formed of a blackwater core (0 ≤ C ≤ 0.05) with a decreasing thickness in the stream-wise direction as both jet surfaces became gradually aerated. For long and thin jets, the blackwater core ended within the jet, whereas for short and thick jets, the blackwater core ended due to the jet impact on the steps. An air cavity was formed under the jet and allowed for the aeration of the lower jet surface.
The jet length L was defined via the impact of the lower jet surface trajectory on the pseudo-bottom [38]. A roller was located directly upstream of the jet impact. It was multiple steps high, and higher than that observed on smooth chutes [67,68]. The roller included water ejected from the jet by flow turbulence and the resulting nappe flow on the steps. After the jet impact, spray was formed, which increased the water surface z90 with a maximum at x = 3.15 m in this example. Spray returned to the flow close to the channel end.
The average air concentration Ca steadily increased along the jet (Figure 4b), and a local maximum was attained at x ≈ 1.4 m. The ensuing decrease was due to the inclusion of the roller in the profile and to the jet impact where air was compressed and detrained. A second maximum at x ≈ 3.15 m was linked to spray. A gradual convergence towards the uniform average air concentration Cau was then observed although quasi-uniform flow conditions were not exactly reached for this test.
The bottom air concentration was by definition Cb = 1 in the air cavity (Figure 4b). However, there was generally a small number of drops below the jet that slightly decreased Cb. Upstream of the jet impact, the roller decreased Cb and a minimum often occurred in the roller (here at x = 1.5 m). After the jet impact, there were various trends that will be described further below. Unlike what was observed for smooth chute aerators, Cb did not rapidly decrease towards values below a few percent. The minimum air concentration Cmin was located in the center of the jet (blackwater core) at the beginning, and was then located at the pseudo-bottom after the jet impact as indicated by the overlap of Cb and Cmin.
Finally, Figure 4c shows a photo of the jet. At takeoff (x = 0), both the upper and lower jet surface became white, indicating the onset of aeration. The blackwater core can be seen until step 8. The sidewall locally slowed down the jet and affected the local aeration. The consequence was that the jet length and blackwater core extended further than it is visible in Figure 4a. After the jet impact, spray began as indicated by a rough surface.
3.3. Flow Zones
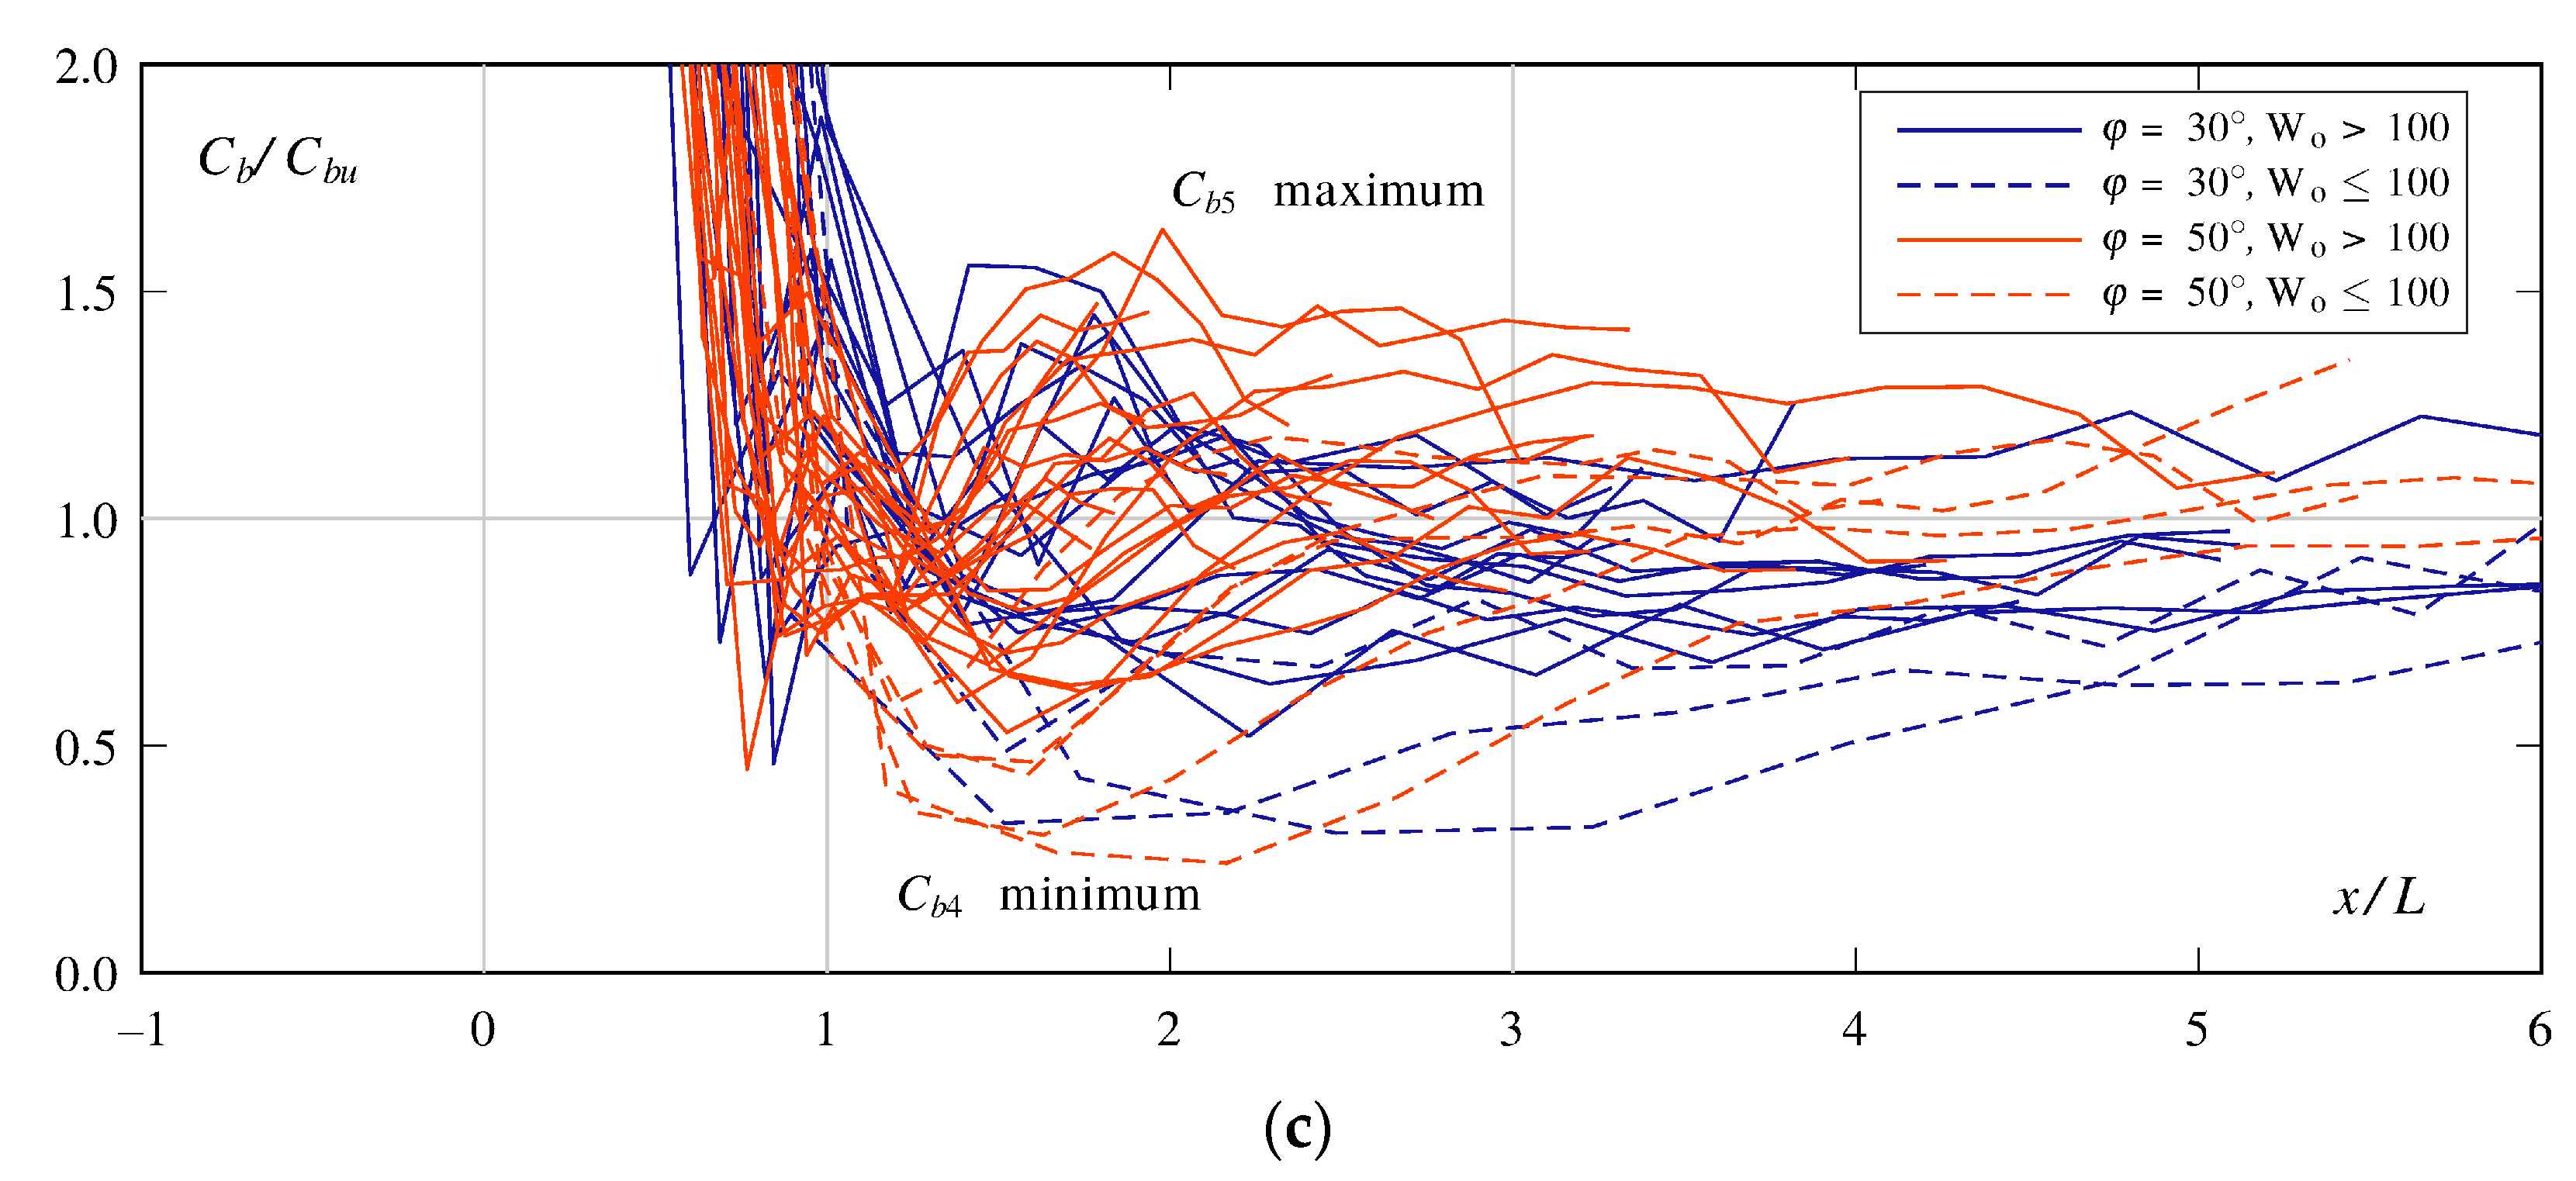
To identify flow zones, the stream-wise coordinate x was normalized with the jet length L as used by [48] for smooth chutes. The quasi-uniform flow values identified above in reference tests were used to normalize flow properties (Figure 5). The behavior and zones of stepped chutes were similar to smooth chutes.
In the approach flow (x/L ≤ 0), three groups of normalized flow depths z90/h90u can be distinguished and reflect the three approach flow Froude numbers.
In zone I, the jet zone where 0 ≤ x/L ≤ 1, the flow upper surface elevation was highly affected by the deflector geometry. The average air concentration Ca gradually increased until a maximum was reached at x/L ≈ 0.8. The inclusion of the roller in the air concentration profiles then decreased Ca although the air entrainment continued at the surface. A minimum appeared at the jet impact (x/L ≈ 1) due to flow compression and air detrainment around the jet impact. The bottom air concentration was Cb ≈ 1 in the jet zone for x/L < 0.6 due to the air cavity. The roller was then encountered, which very rapidly decreased Cb. At the jet impact, Cb was around the quasi-uniform bottom air concentration Cbu.
In zone II, the spray and reattachment zone where 1 ≤ x/L ≤ 3, the flow upper surface elevation showed fluctuations due to the jet impact and spray. The average air concentration Ca rapidly increased directly after the jet impact. A majority of tests reached a second Ca maximum in this zone. A decrease of the bottom air concentration Cb below Cbu was observed following the jet impact. Some tests showed a Cb minimum and a maximum before reaching Cbu while others directly stabilized around Cbu. Tests with Fo = 3.2 had a Weber number Wo ≈ 88 and showed a different trend in Cb likely due to scale effects.
In zone III, the far-field zone where x/L ≥ 3, the flow characteristics stabilized and tended towards the quasi-uniform values observed in chutes without an aerator.
3.4. Air Entrainment Coefficient
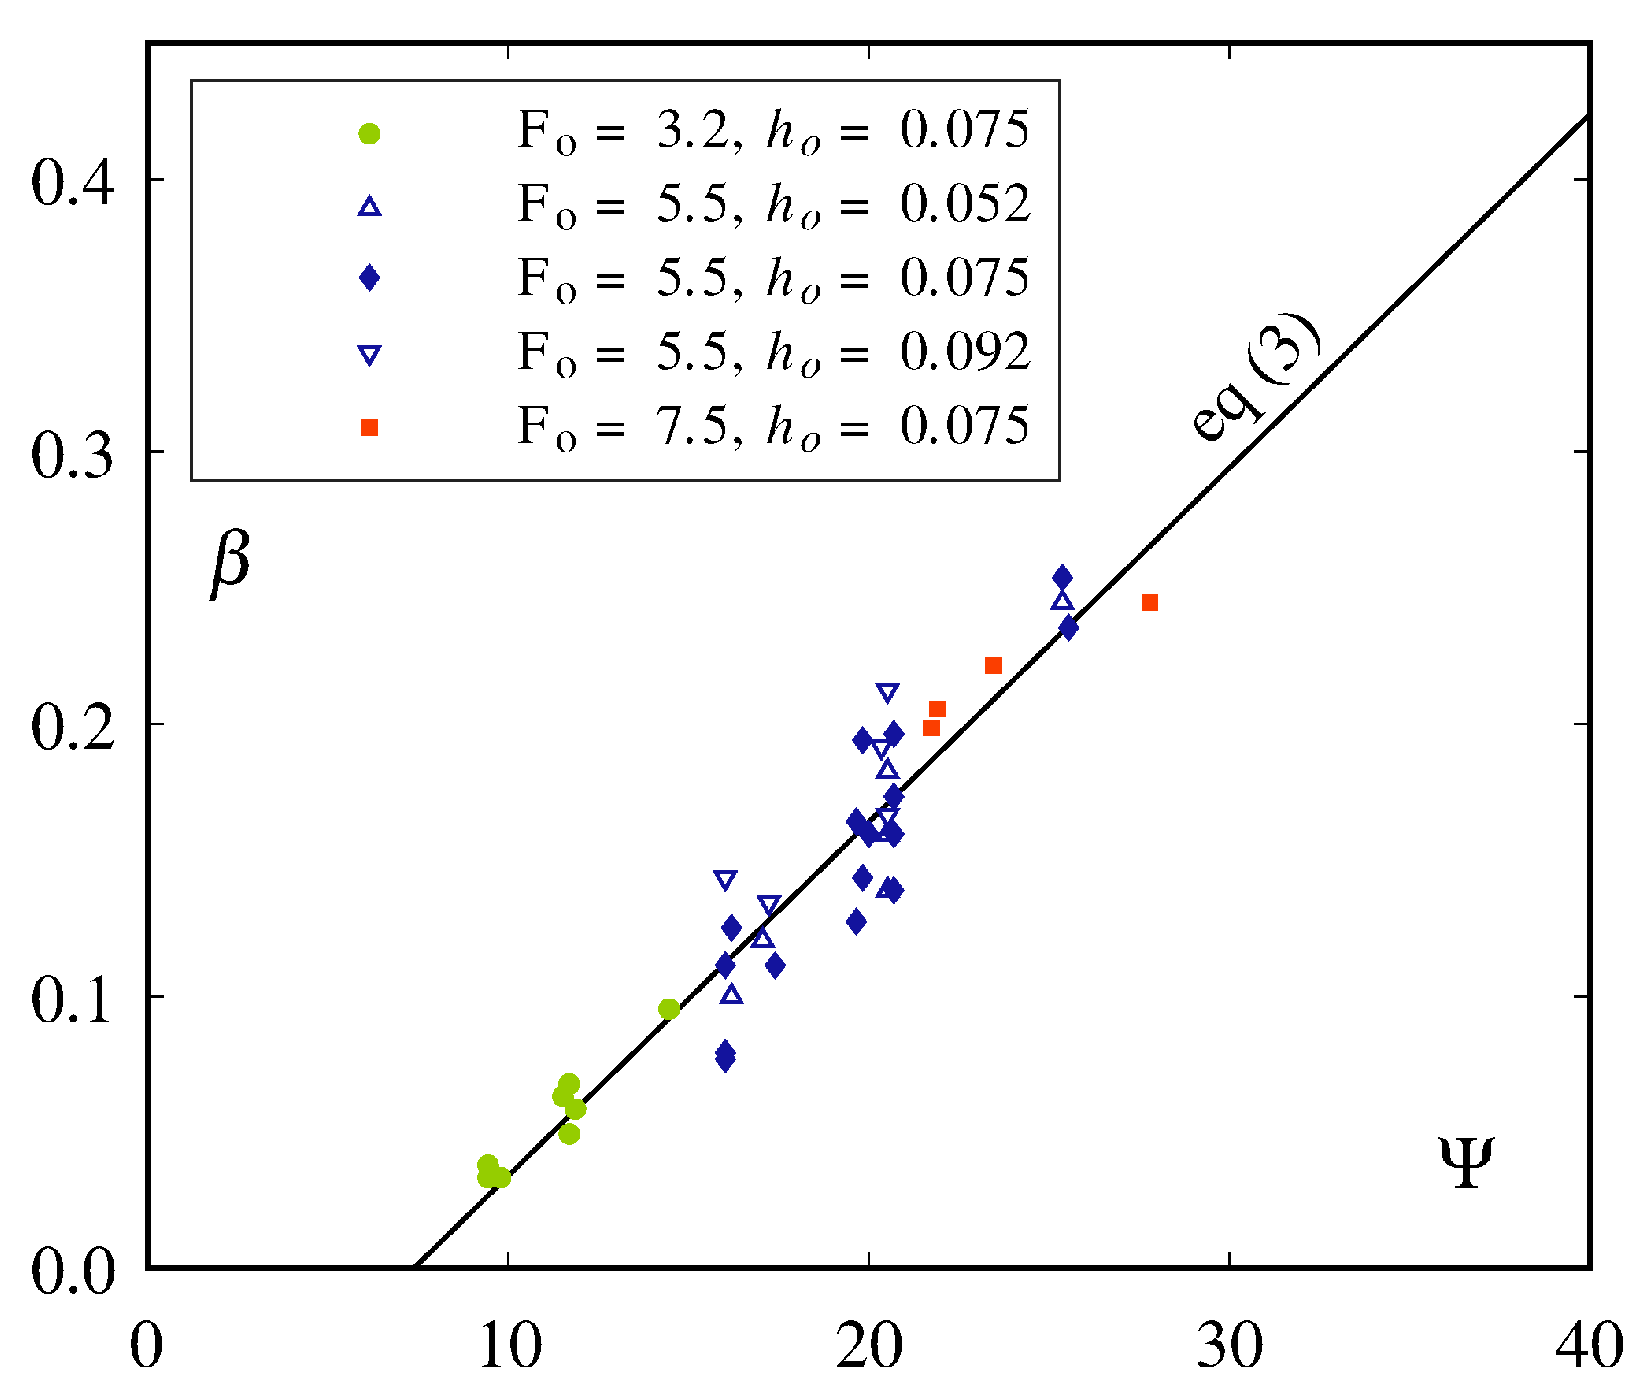
The air entrainment coefficient β = qA/q—the ratio of specific air discharge qA to specific water discharge q—is commonly expressed as a function of the relative jet length L/ho. Since the jet length L is itself a function of the chute, flow and deflector characteristics, the air entrainment coefficient can be empirically derived from these characteristics. The following relationship best described the air entrainment coefficient for stepped chute aerators (r2 = 0.906, Figure 6)
where Fo is the approach Froude number, φ the chute angle and α the deflector angle.
The approach flow Froude number Fo and deflector angle α were used by [24] for smooth chutes. The addition of the chute angle φ for stepped chutes indicated that the process of air entrainment depended on φ with the presence of steps. The relative deflector height t/ho had only a marginal an effect on β, and the relative step height s/ho had an even smaller effect.
No satisfactory relationship providing β for both smooth and stepped chutes could be obtained due to the small influence of s/ho, which is the only characteristic that differed in the two chute types. Ref. [69] showed that air detrainment is related to the jet impact angle γ on the chute bottom. On stepped chutes, the jet impacted the horizontal face of the steps whereas on smooth chutes the jet impacts a surface at an angle of φ. This likely important difference cannot be considered with s/ho. A different process of air entrainment, detrainment and circulation in the cavity might occur, especially since the roller seemed to extend further upstream on the stepped chute.
Equation (3) shows that for a deflector with α = 10° air entrainment might start at Fo = 2.0 for φ = 50° and at Fo = 2.5 for φ = 30°. However, these values were not tested on the model.
3.5. Jet Characteristics
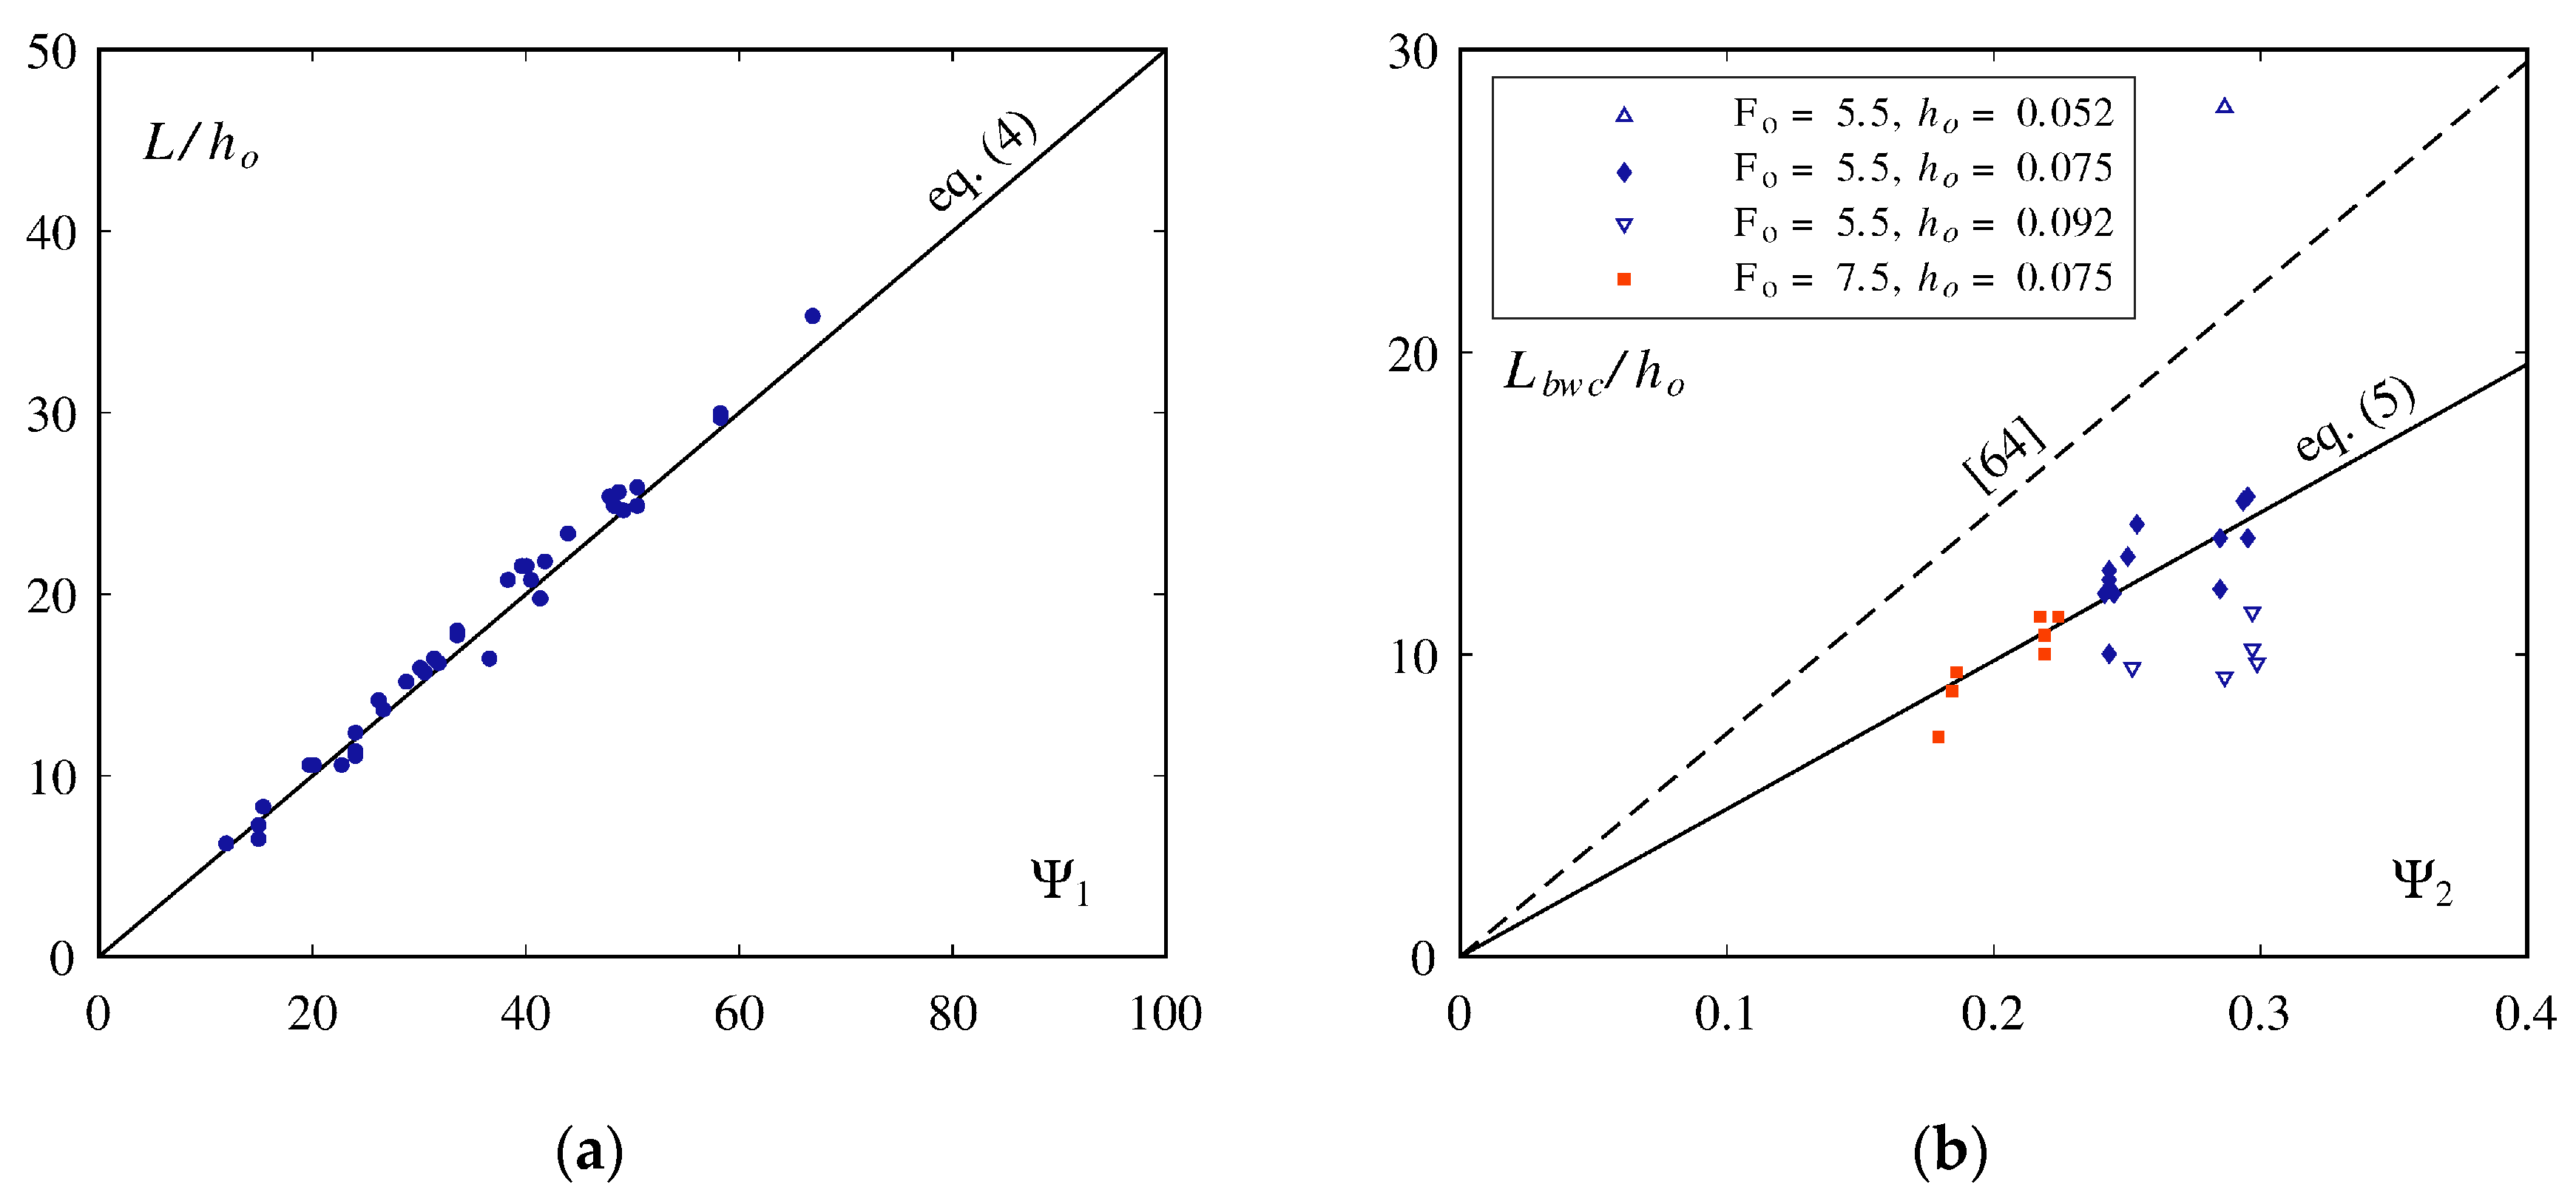
A common approach to express the relative jet length L/ho as a function of the basic parameters was investigated and the following relationship was obtained for a small sub-pressure (i.e., Δp/(ρgho) ≤ 0.1, r2 = 0.979, Figure 7a)
which is valid for 0° ≤ φ ≤ 50°, 3.2 ≤ Fo ≤ 10.4, 5.7° ≤ α ≤ 20°, 0.10 ≤ t/ho ≤ 1.65 and Δp/(ρgho) ≤ 0.1. An alternative method based on jet trajectories using a ballistic parabola was presented in [38].
The relative jet blackwater core length Lbwc/ho for the present study was shorter than the estimation obtained from [70] (Figure 7b). All tests with Fo = 3.2 and all tests with ho = 0.052 m except one (test 34 with the steepest deflector) still had a blackwater core at the jet impact and therefore no Lbwc could be calculated. The results with Fo = 5.5 showed that ho still had an influence on Lbwc/ho, which was likely an effect of a different approach flow turbulence for each ho. The slope of the [70] relationship could be adapted with satisfactory results to (r2 = 0.798)
3.6. Development of Air Concentrations Downstream of the Aerator
3.6.1. Average Air Concentration
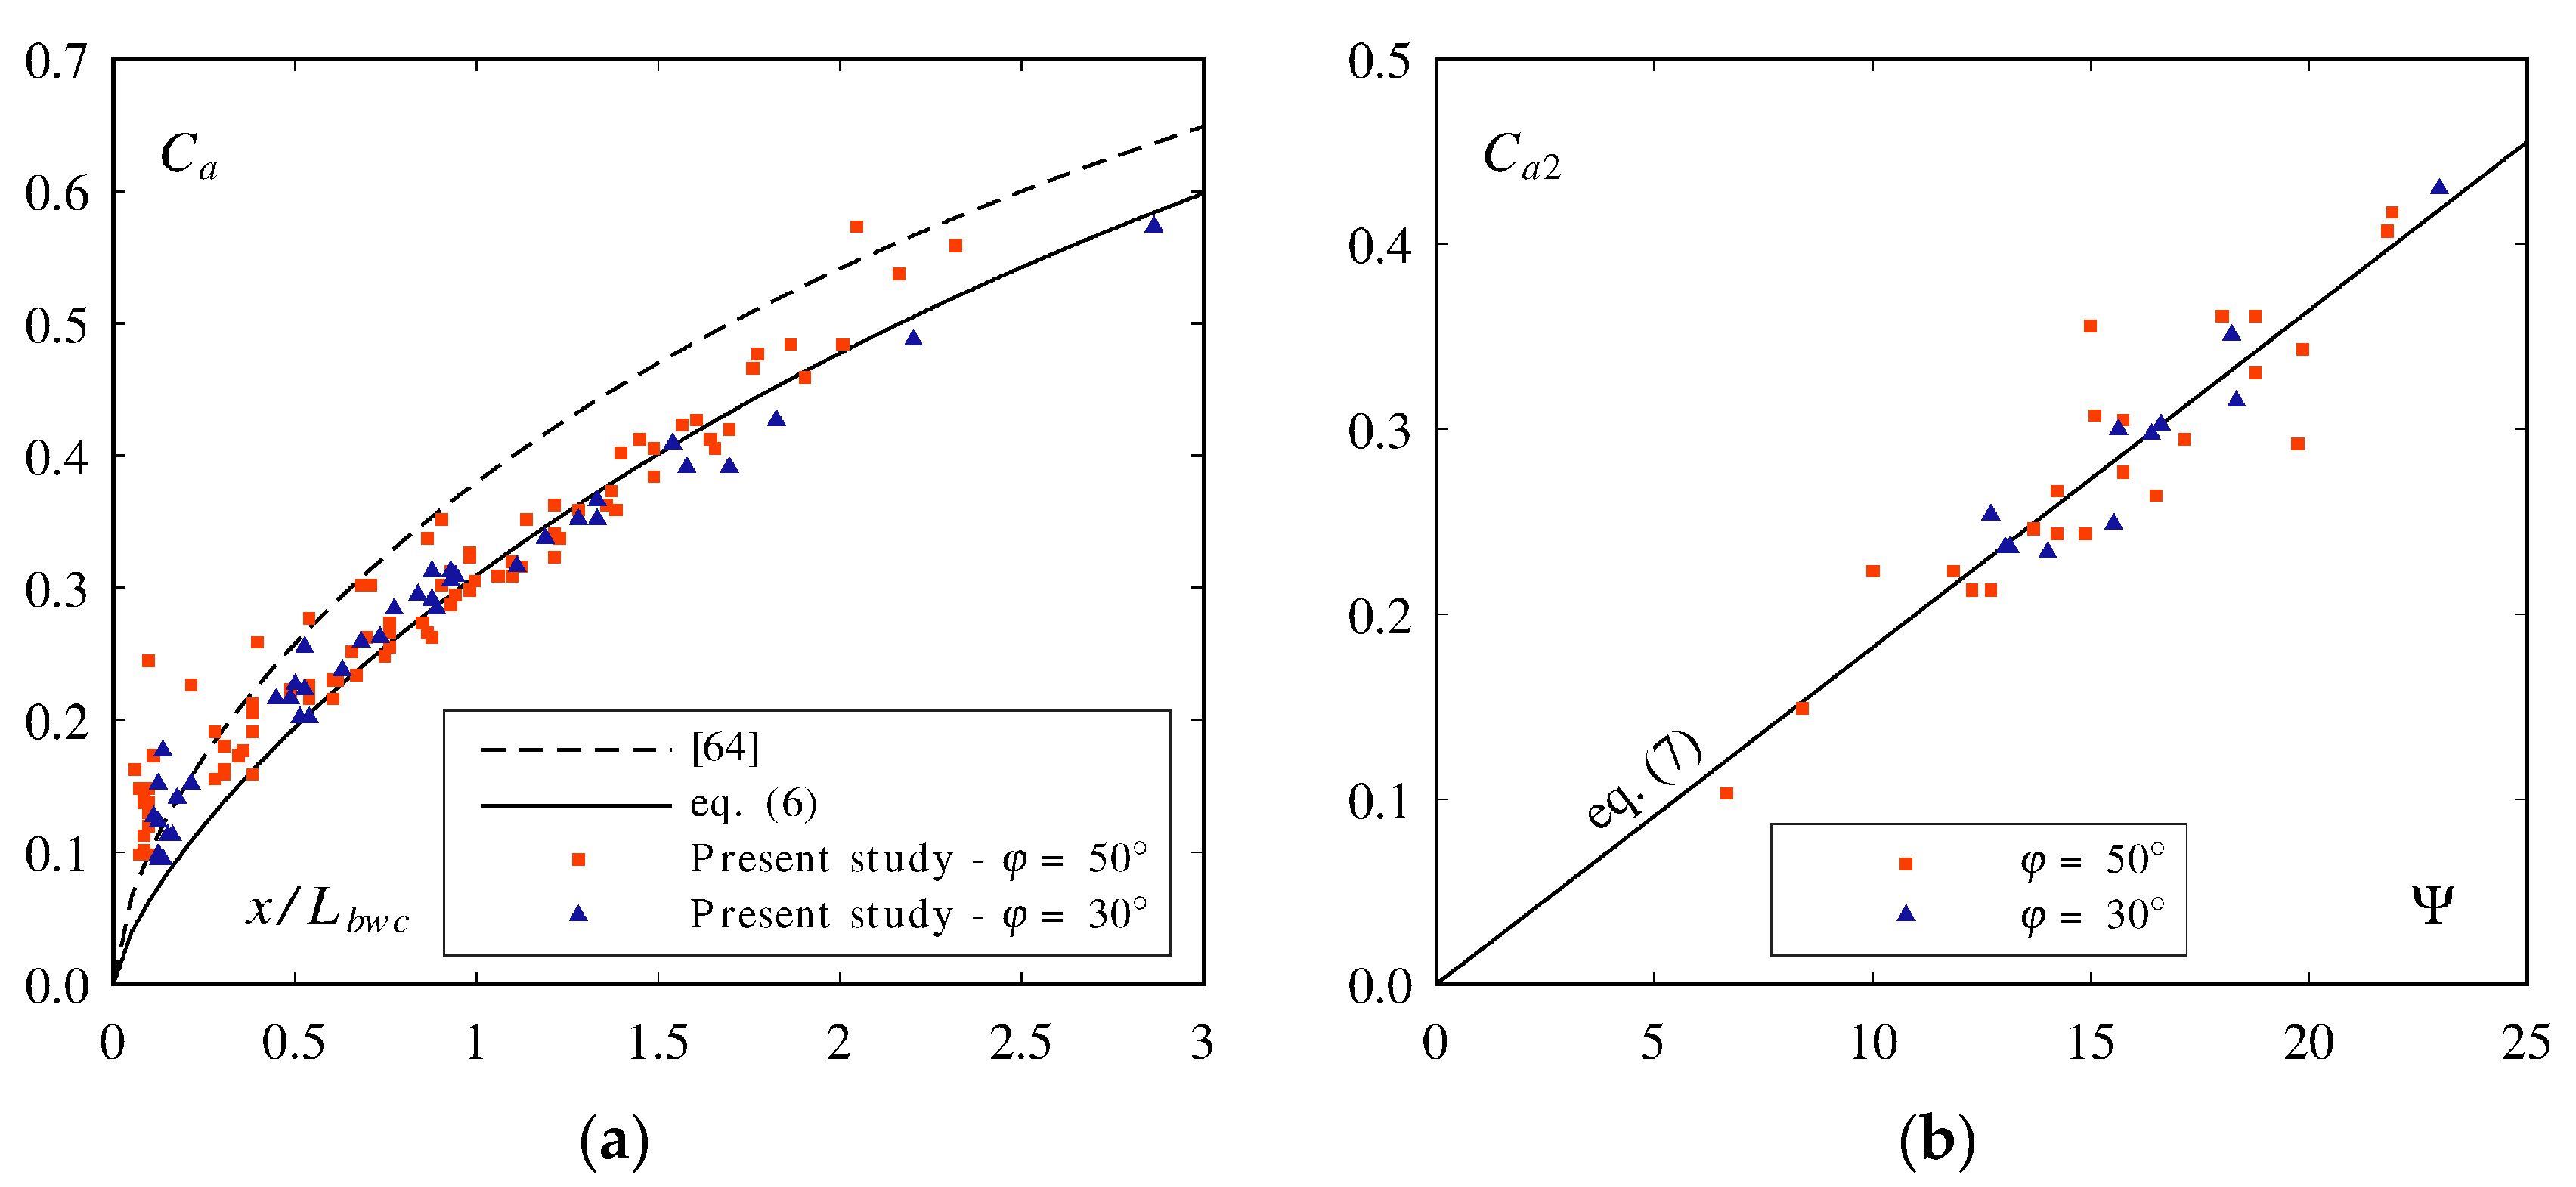
The development of the average air concentration Ca downstream of the aerator showed common characteristics with three distinct extrema (Figure 5b). The first was a maximum shortly before the jet impact. This point will be referred further as the jet maximum with its streamwise coordinate x1 and average air concentration Ca1. It was quickly followed by an impact minimum close to the jet impact (x2 and Ca2). The average air concentration increased again in the spray zone to a second maximum, the spray maximum (x3 and Ca3). Finally, the average air concentration tended towards the quasi-uniform average air concentration Cau.
The position of the jet maximum was on average x1/L = 0.78. The Ca development in the jet is a function of the blackwater core length Lbwc (Figure 8a). The data agreed with [70] with slightly lower values. An adapted relationship was found for x/Lbwc < 3
The jet maximum average air concentration Ca1 can be determined by substituting x1 = 0.78 L and Lbwc from Equation (5) in Equation (6).
The position of the impact minimum was in average x2/L = 1.03. The minimum average air concentration Ca2 was related to the relative jet length L/ho and could be better expressed directly from the base parameters (r2 = 0.863, Figure 8b)
On smooth chutes, the air detrainment at the jet impact was related to the jet impact angle γ [69,71]. On stepped chutes, there was no correlation of the air detrainment with γ and no relationship could be derived.
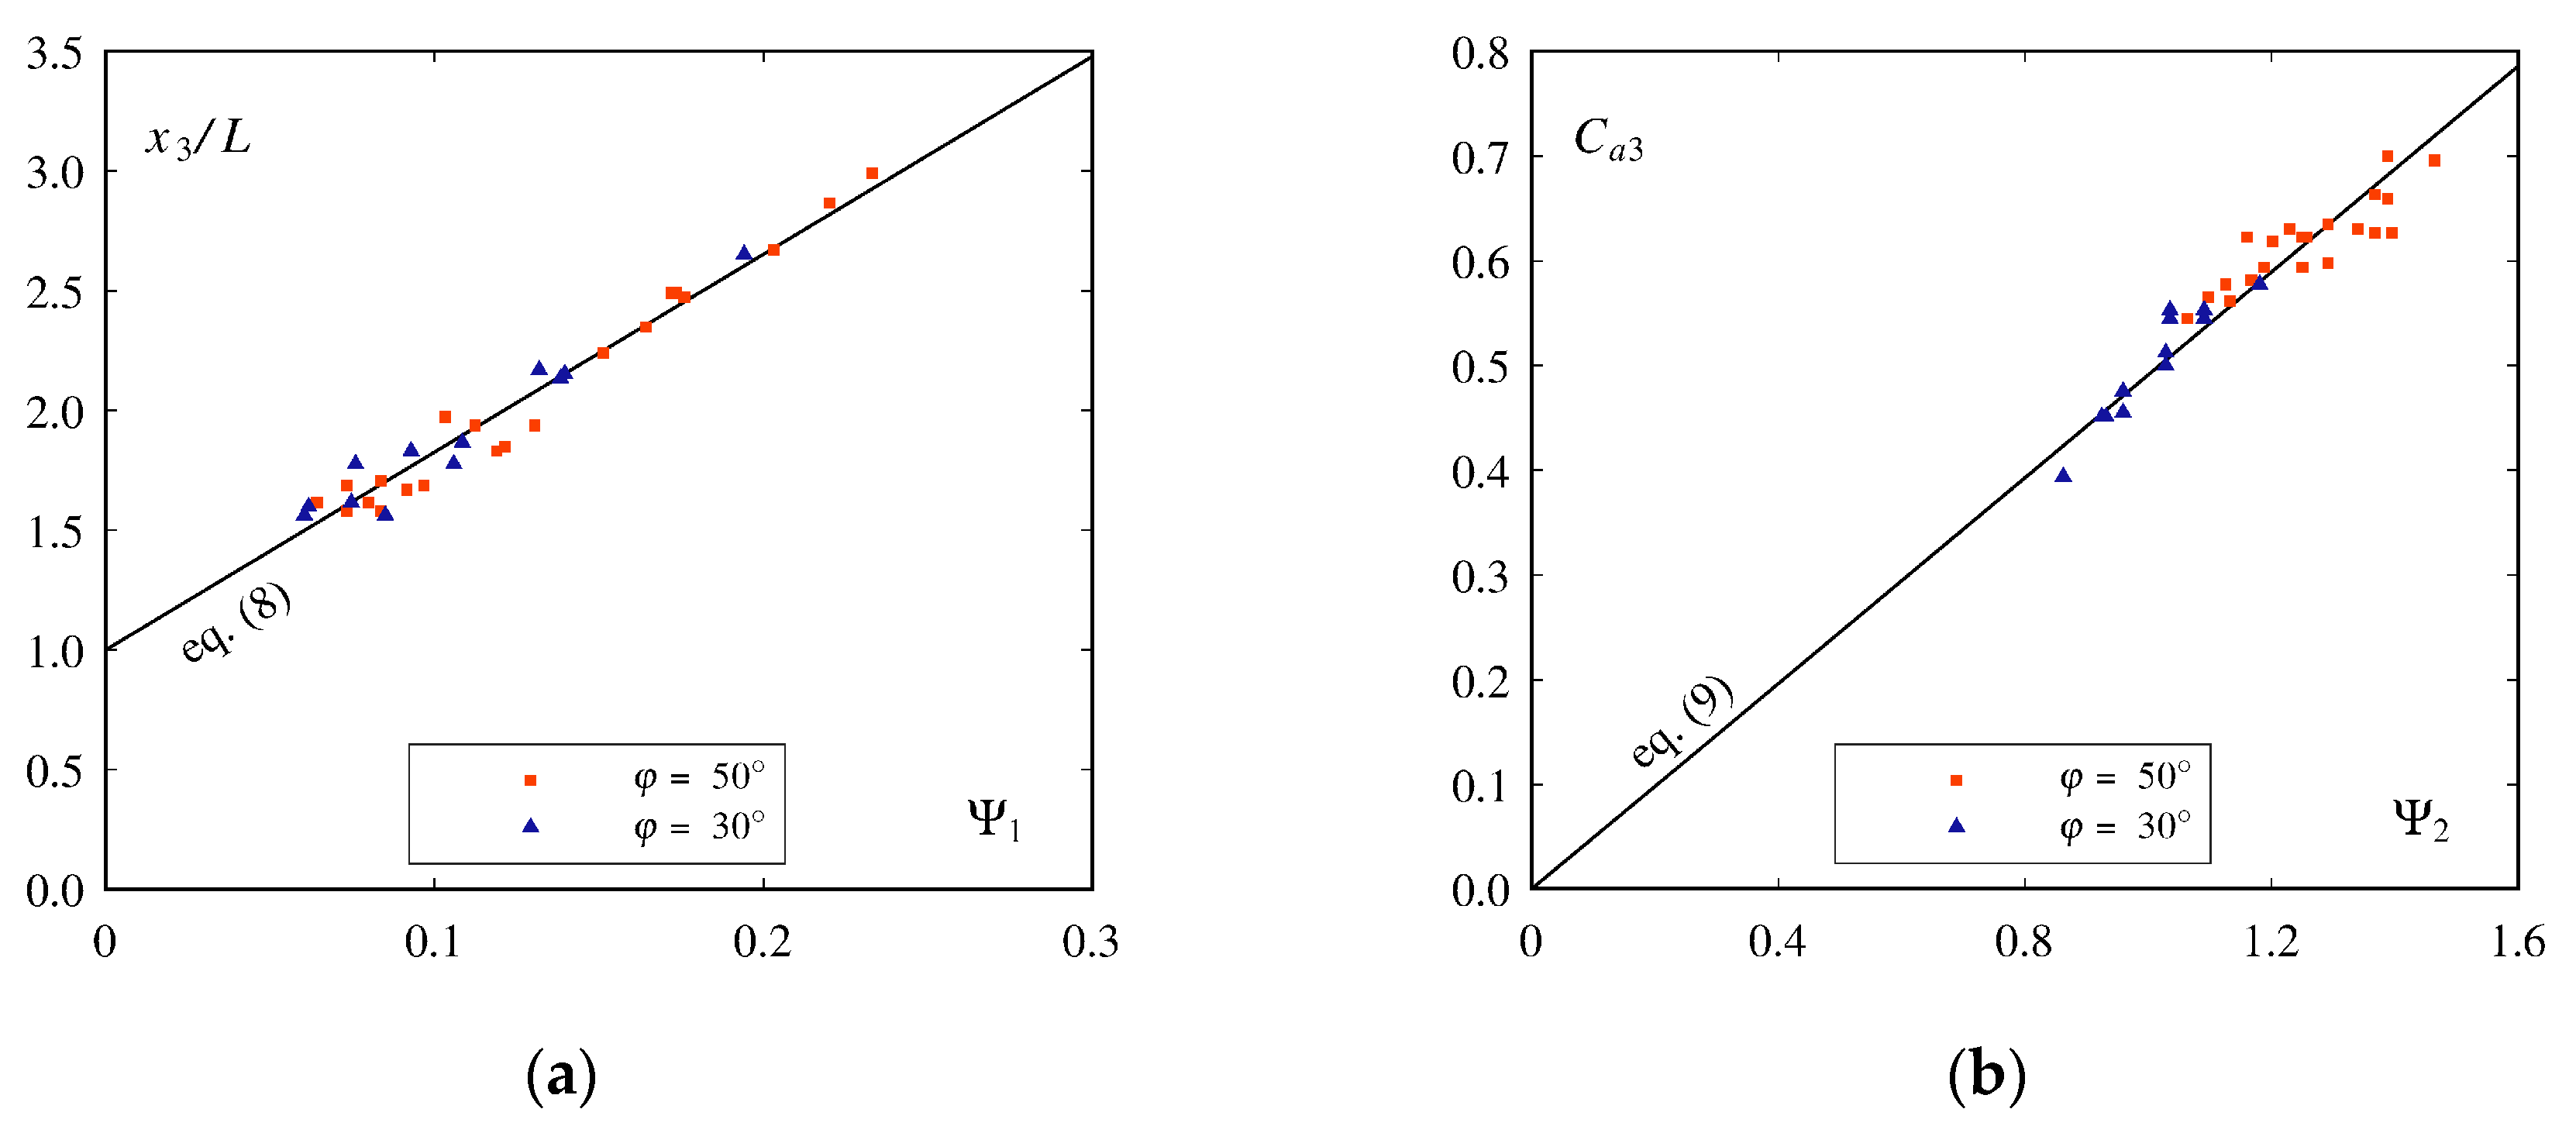
Unlike the two previous extrema, the spray maximum streamwise coordinate x3 varied for each test. A few tests were excluded of the analysis because the jet was too long and the spray maximum was not reached before the end of the channel, or the spray maximum was not well defined. The coordinate x3/L was somewhat correlated with the relative jet length L/ho, with x3/L decreasing for long L/ho. The following relationship was obtained for 1.5 ≤ x3/L ≤ 3 (r2 = 0.958, Figure 9a)
The relationships starts at x3/L = 1 which is the jet impact point. The four first parameters also influence the jet length L; thus, the negative exponents indicate that x3 increases proportionally less than L when one of the four parameters increases. A larger relative step height s/ho increases x3/L which suggests a dampening of the deflection at the jet impact by high steps.
3.6.2. Bottom Air Concentration
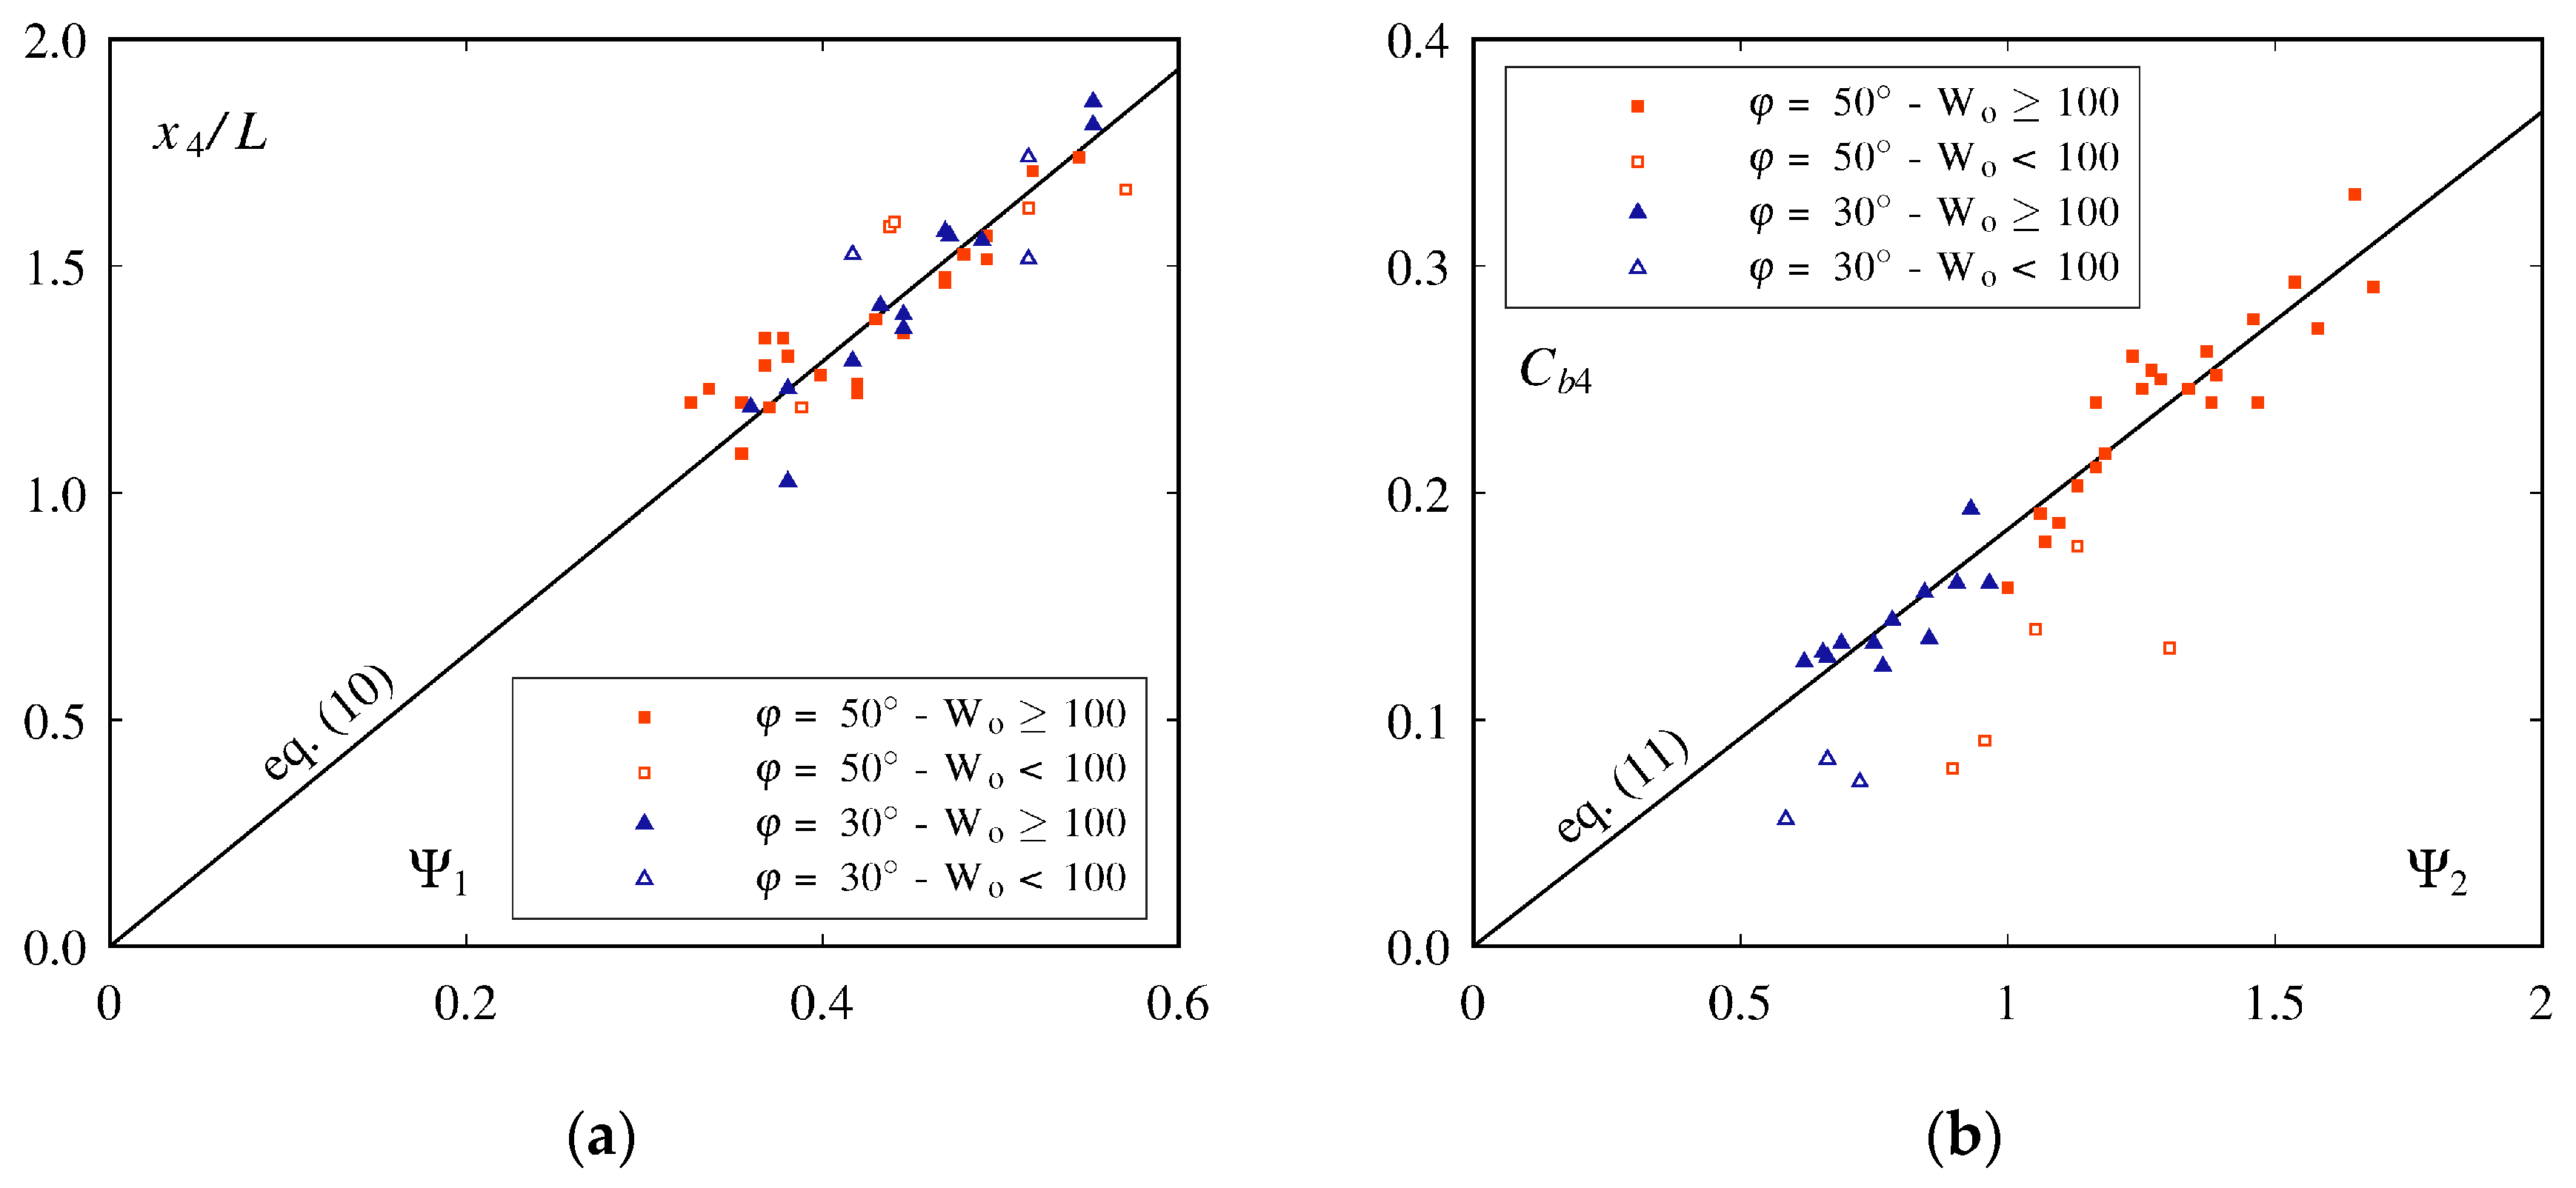
Trends in the bottom air concentration Cb were less distinct than for Ca (Figure 5c). The bottom air concentration decreased along 0.5 ≤ x/L ≤ 1 due to the roller. Some tests showed a roller minimum. This location was not considered critical for cavitation since Cb > 0.1 and the flow velocities were small. After the jet impact at x/L = 1, Cb showed a rapid but continuous decrease similar to observations on smooth chute aerators, until a minimum was reached (x4 and Cb4). From the minimum, Cb increased to a maximum (x5 and Cb5), which was more pronounced for φ = 50° than for φ = 30°. The maximum was not always distinct, especially for φ = 30°. After the maximum, Cb tended towards the quasi-uniform bottom air concentration Cbu.
Similarly to x3, the streamwise coordinate of the minimum x4/L was correlated with L/ho. The minimum x4 was close to the jet impact for long L/ho, and further away for shorter L/ho. A relationship for x4 was obtained with the four parameters characterizing the jet length (r2 = 0.841, Figure 10a)
The minimum bottom air concentration Cb4 was obtained for 1 ≤ x4/L ≤ 2 from (r2 = 0.924, Figure 10b)
Tests with Wo < 100 showed measured values as low as half the estimation of Equation (11) indicating scale effects that are discussed further below.
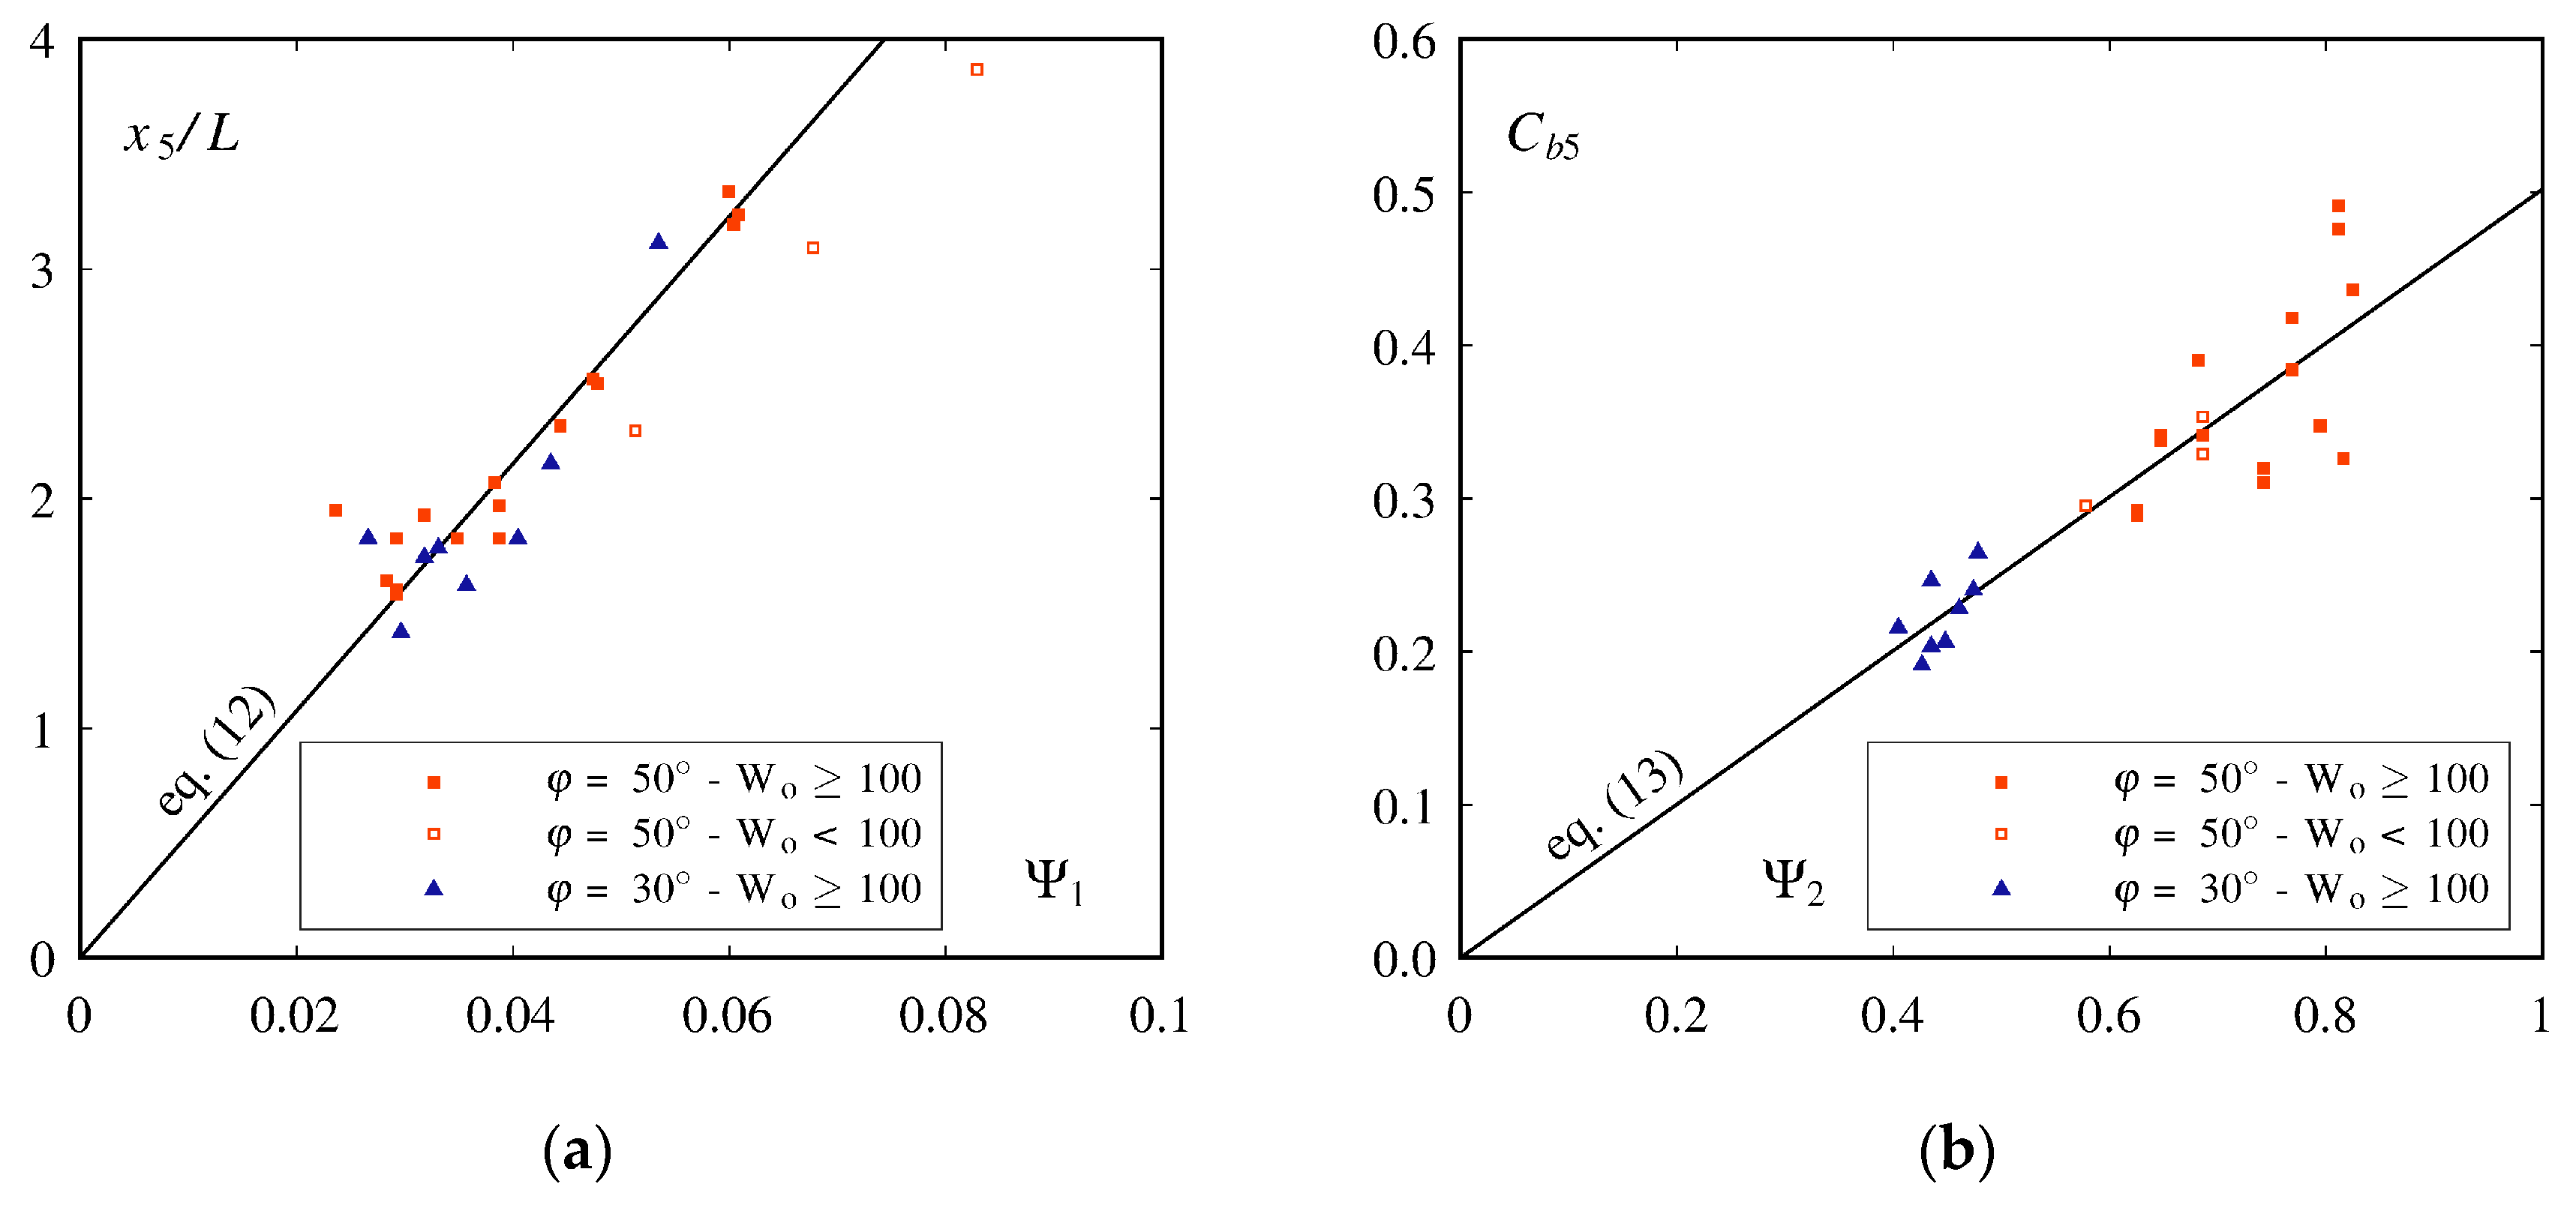
As for x3 and x4, the streamwise coordinate of the minimum x5/L was correlated with L/ho. Many tests with φ = 30° did not show a distinct maximum and were therefore excluded. A relationship for x5 was obtained for 1.4 ≤ x5/L ≤ 3.5 (r2 = 0.845, Figure 11a)
The relative deflector height t/ho and relative step height s/ho have opposite exponents and can be combined to s/t.
Quasi-uniform flow was considered to be attained at x/L ≥ 4.
3.6.3. Comparison with Preliminary Tests
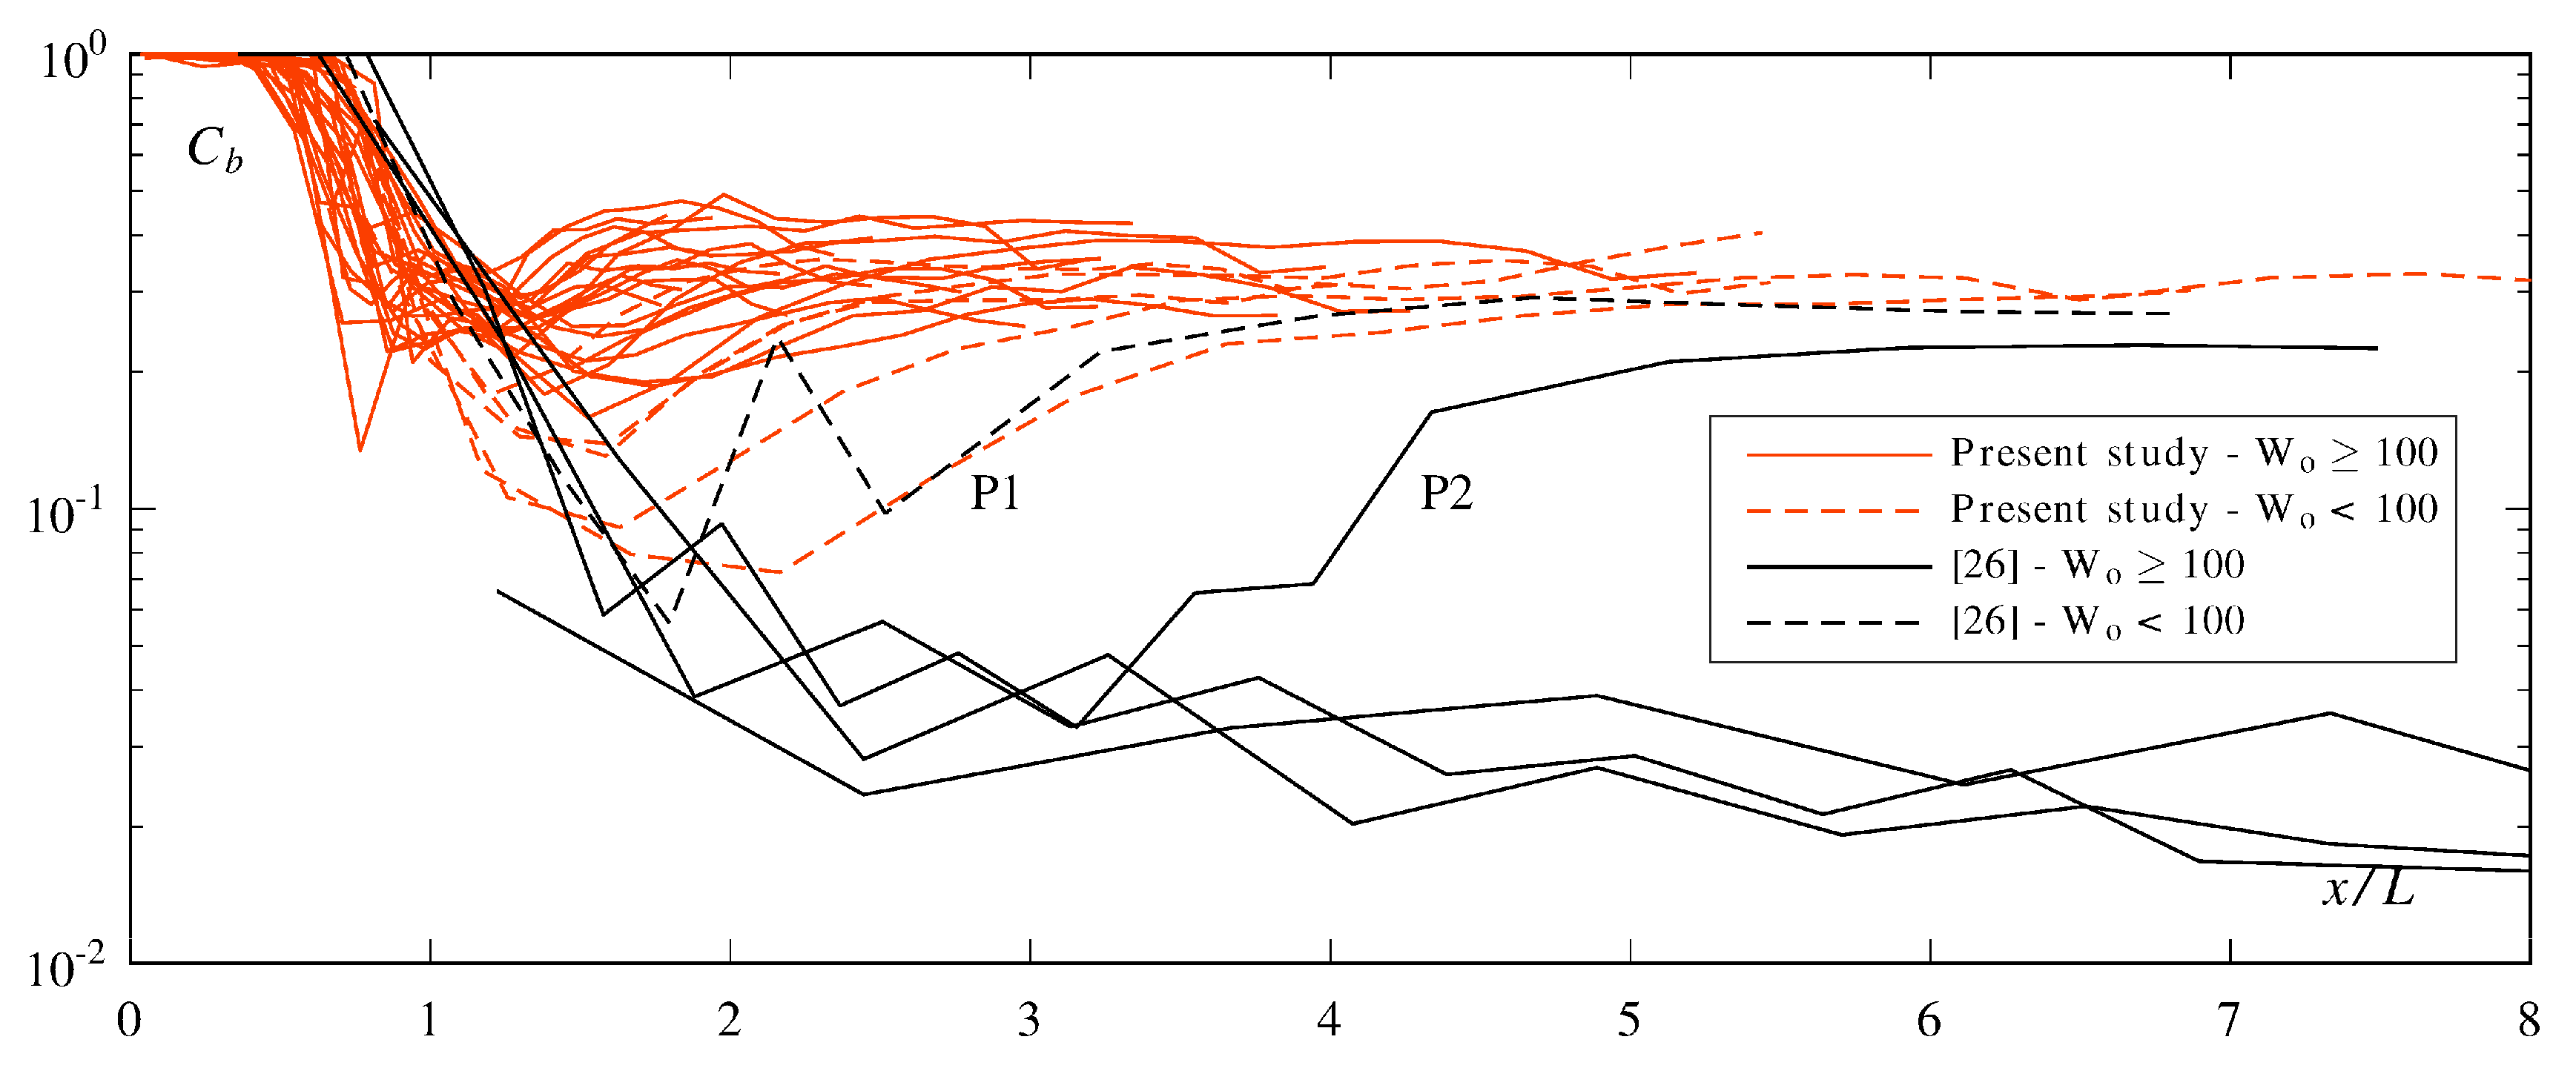
The present study tests are compared in terms of bottom air concentration with the tests of [26] in Figure 12. The difference between the two datasets is explained by a partial aeration of the flow in the tests by [26]. In the latter, the aerator only had a local effect close to the bottom. This performance difference can be explained by a smaller relative deflector height 0.04 ≤ t/ho ≤ 0.24 in [26] compared to 0.16 ≤ t/ho ≤ 0.60 for the present study. [57] showed that a deflector generates turbulence in the flow. A small deflector likely created less turbulence than a larger one, and therefore less air is entrained. It also shortened the relative jet length L/ho, with values ranging from 0.5 ≤ L/ho ≤ 10.3 for [26] compared to 6.3 ≤ L/ho ≤ 44 for the present study, which further reduced air entrainment. Due to the partial aeration, the air was gradually detrained as observed for smooth chutes [24,25] until the entire depth became fully aerated from the surface (inception point). These results demonstrate minimal deflector dimension requirements to obtain the relatively high Cb observed in the present study. It is recommended to respect α ≥ 5.71° for deflector angle, t/ho ≥ 0.16 for the relative deflector height and L/ho ≥ 8 for the jet length.
3.6.4. Scale Effects
Tests with Fo = 3.2 (Wo = 88 and Ro = 2.05 × 10⁵) showed a significant underestimation of the minimum bottom air concentration Cb4 due to scale effects (Figure 10). However, they showed no clear evidence of scale effects for the maximum bottom air concentration Cb5 (some tests did not show a maximum) or the general development of the average air concentration Ca. Tests with the same unit discharge q = 0.205 m3/s but with a higher Froude number Fo = 5.5 (Ro = 2.05 × 10⁵ and Wo = 106) showed no clear evidence of scale effects for Ca or Cb. Therefore, values of Wo ≥ 100 and Ro ≥ 2 × 10⁵ are suggested to limit scale effects. It highlights that a Reynolds number limit is not sufficient for Fo < 5 as explained by [72].
3.6.5. Cavitation Damages Protection
Excluding tests with scale effects, a minimum bottom air concentration Cb = 0.09 was observed for φ = 30° and Cb = 0.16 for φ = 50°. These bottom air concentrations were higher than the air concentrations observed by [13,14,15] to limit cavitation damages. For the configurations tested, a stepped spillway was fully protected against cavitation damages downstream of one single aerator.
3.7. Effect of Turbulence and Pre-Aeration
In addition to the six parameters varied, literature shows that turbulence has an influence on air entrainment [51,57]. Having steps upstream of the aerator instead of the smooth bottom used in the model would increase turbulence. To qualitatively evaluate the influence of increased turbulence on the aerator performance, a grid was attached to increase the bottom roughness. Holes in the grid were cut around the pressure transducers. It reduced the average pressure upstream of the deflector by 15 to 35% (helping dissipate the remaining jet-box pressure) and increased root mean square of the pressure fluctuations by 40 to 60% compared to tests without the grid.
In special circumstances, for example if another aerator upstream is present or for small discharges, the approach flow can be partially aerated. Two tests were performed to evaluate the resulting aerator performance. Pressurized air was injected 15 m upstream of the jet-box to ensure a homogeneous distribution within the flow. An air concentration profile was measured at x = 0 m without a deflector and the jet-box opening height was iterated until the equivalent blackwater depth reached hw = 0.075 m. For both tests, a unit air discharge of 0.080 m2/s was measured at x = 0 m. The deflector was then installed, and the test started.
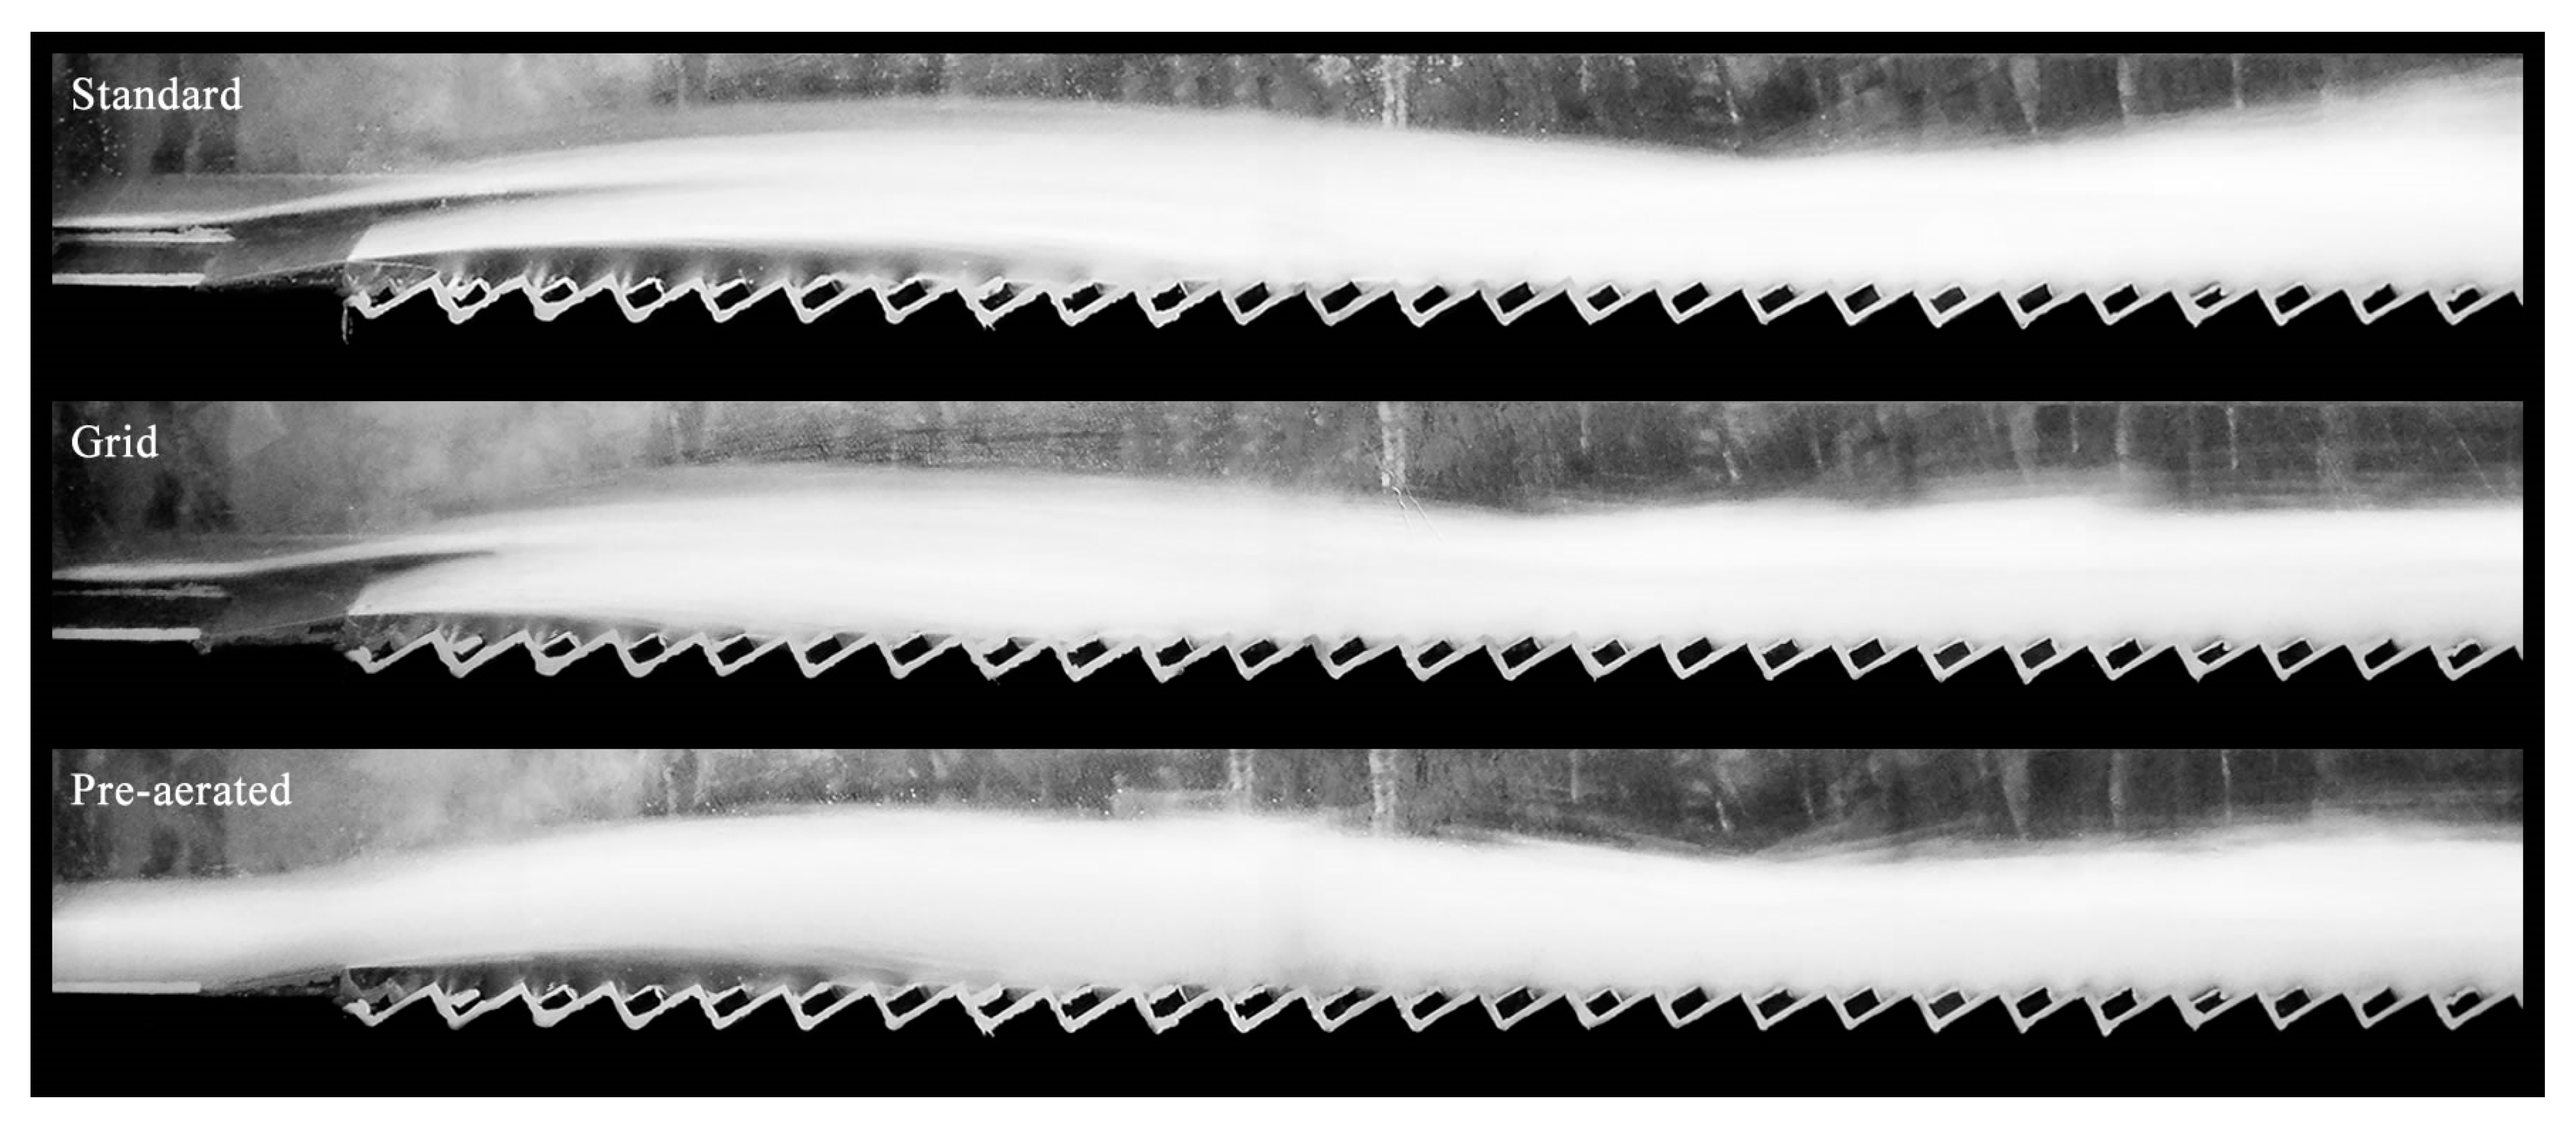
Compared visually to the standard test (Figure 13), the grid test showed an increase in the jet spread revealed by a shorter blackwater core and an impact of the lower jet surface on the pseudo-bottom closer to the aerator. Less spray was observed for the grid test downstream of the jet impact. The pre-aerated test showed exclusively whitewater. No distinct difference could be observed on the upper jet surface, while a slightly larger spread was visible for the lower jet surface. This spread was lower than that of the grid test. As for the grid test, less spray was observed downstream of the jet impact as compared to the standard test.
Both the grid and pre-aerated tests showed a decrease in the jet length L as well as an increase in the air entrainment coefficient β and air cavity sub-pressure Δp/(ρgho) as compared to the standard tests (Table 2). This was due to a higher turbulence that enhanced the jet spread.
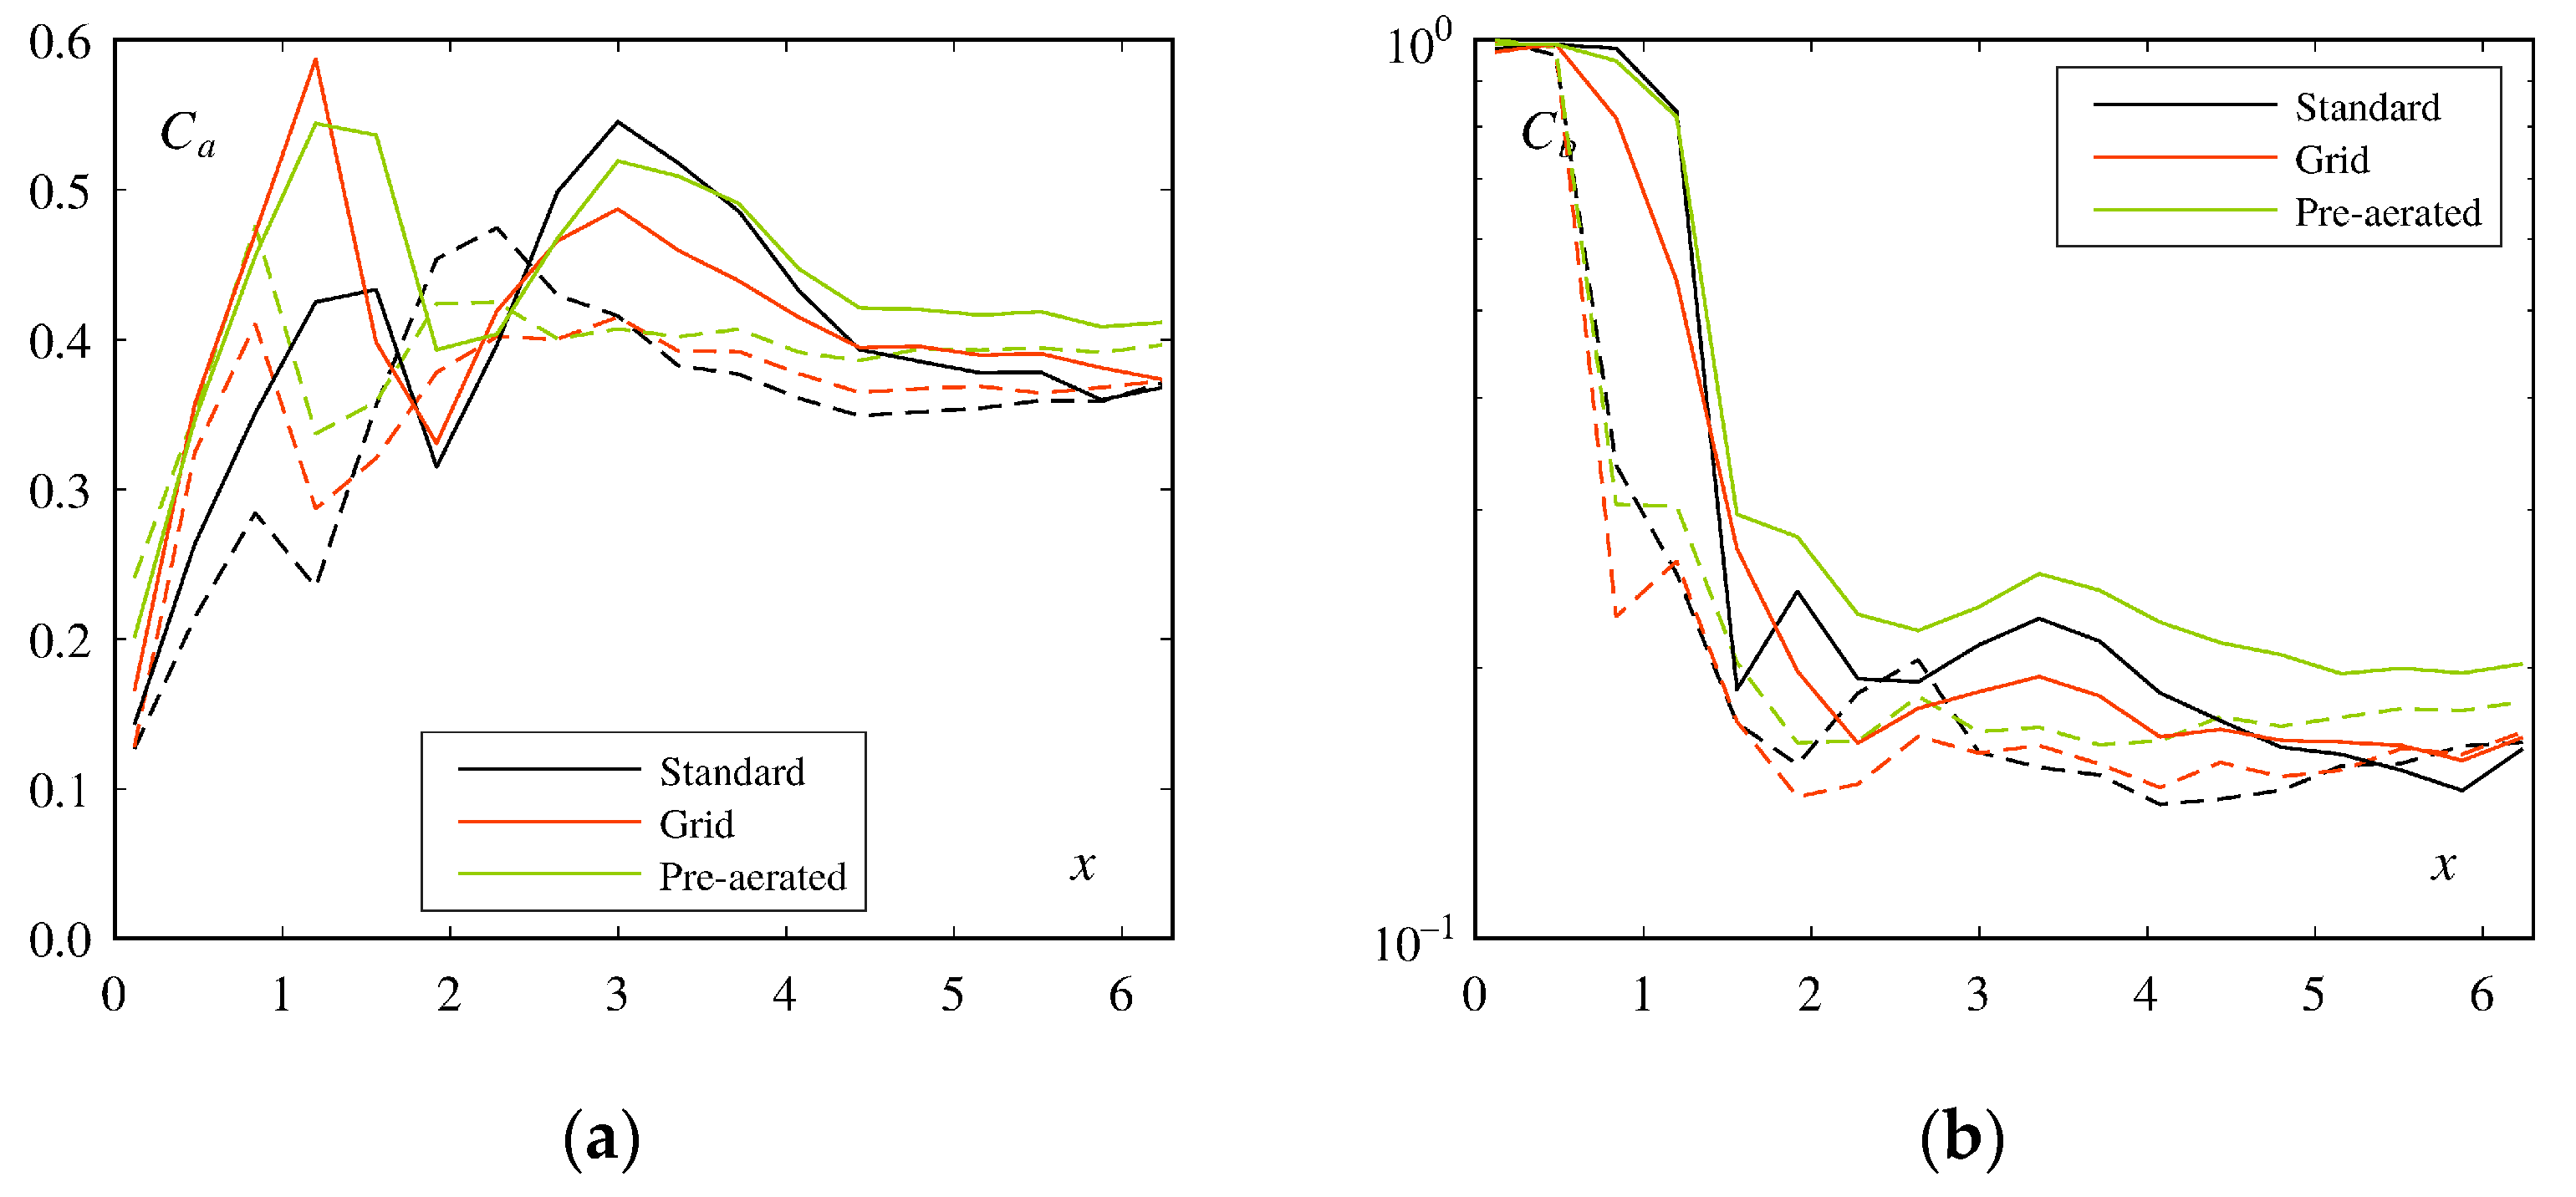
The average air concentration Ca was significantly increased in the jet for the grid and pre-aerated tests as compared to the standard tests, which lead to a higher jet maximum Ca1 (Figure 14a). The impact minimum Ca2 was, however, not proportionally increased. The spray maximum Ca3 was reduced for the pre-aerated and grid tests, suggesting a dampening of the jet impact and the resulting spray by a higher air concentration in the jet. In the far-field zone, the grid tests were similar to the standard tests, whereas the pre-aerated flow tests had a higher Ca.
The bottom air concentration Cb was decreased at the minimum Cb4 and maximum Cb5 compared to the standard tests (Figure 14b). For the pre-aerated tests, Cb was increased at the minimum Cb4 and there was no clear trend for the maximum Cb5 (decrease for Fo = 5.5 and increase for Fo = 7.5).
In the far-field zone, the grid tests did not show a significant difference as compared to the standard tests while the pre-aerated tests appeared to converge faster to quasi-uniform flow conditions.
4. Design Example
An example is given to demonstrate the application of the results obtained. An aerator is planned on a stepped chute with a unit design discharge qD = 60 m2/s, a chute angle φ = 50° and a step height s = 1.5 m. The spillway includes first a smooth standard ogee crest [73] (Figure 15). The ogee design head is HD = 9.09 m and the natural air self-inception point would be located at a distance Li = 70.8 m from the crest according to [60].
The tangency point is located at xcr = 14.97 m and zcr = 7.89 m, which is far upstream of the inception point. Based on [73], at the tangency point the flow depth is hwr = 3.49 m and the bottom pressure pr/(ρg) = 0.50 m. This leads to a mean flow velocity ur = q/hr = 17.2 m/s, a Froude number Fr = 2.94 and a head Hr = 7.67 m. Considering an atmospheric pressure patm = 101 kPa and a vapor pressure pv = 1.23 kPa, the cavitation index is σr = 0.71.
The bottom pressure is reduced on the ogee due to convex curvilinear flow but is assumed to be hydrostatic downstream of the tangency point. This leads to a discontinuity at the tangency point: the bottom pressure increases from pr/(ρg) = 0.50 m to 2.43 m, the flow depth from hr = 3.49 m to 3.79 m, and the cavitation index from σr = 0.71 to 0.98.
The first two steps are filled to have a smooth bottom and accelerate the flow to provoke a better aerator performance as well as flow conditions inside the parameter range of the present study. The drawdown curve is calculated until the second filled step edge (xco = 18.90 m and zco = 10.89 m) using a Strickler coefficient K = 70 m1/3/s. The approach flow values obtained are Fo = 3.13 and ho = 3.13 m.
A deflector with an angle α = 9.46° (slope of 1:6) and height t = 0.65 m (relative height t/ho = 0.19) is chosen. The deflector takes the length of two steps and its downstream end is aligned with a step edge (xct = 22.80 m and zct = 13.89 m), resulting in the configuration shown in Figure 15.
The aerator parameters as well as the jet characteristics and the air concentration extrema obtained with the relationships presented in this article are shown in Table 3. The results are compared with test 27 using a geometrical scale factor λ = 45. The six base parameters are nearly identical except for the step height s, which only has a minor overall influence. The calculated jet length is shorter than the scaled test 27. The Ca development is well described by the three extrema (Figure 16a) whereas the Cb development cannot be compared due to scale effects of the model test (Ro = 2.03 × 10⁵ and Wo = 87, Figure 16b). Quasi-uniform flow is reached 91.2 m after the aerator or 114 m downstream from the crest. Finally, it is important to design the air supply system in a way to limit the cavity sub-pressure to Δp/(ρgho) ≤ 0.1 to obtain the aerator performance described above, and to include an efficient drainage system.
For lower specific discharges than qD, the aerator approach Froude number Fo would increase, leading to a higher air entrainment coefficient β and a similar jet length L. The average air concentration extrema Ca1, Ca2 and Ca3 would increase. The minimum bottom air concentration Cb4 would be approximately stable as the increase of the Fo and t/ho terms is compensated by a decrease of the s/ho term. The maximum bottom air concentration Cb5 would increase.
Without the aerator and filled steps, the critical cavitation index σc = 0.70 of stepped chutes would be reached shortly downstream of the third step edge considering a friction factor f = 0.1 for the stepped bottom drawdown.
5. Conclusions
The performance of a stepped spillway aerator using a deflector was for the first time systematically investigated by varying the governing parameters on a large-scale physical model. The following conclusions were drawn from aerator tests:
- Three zones can be identified as a function of the jet length L: (i) jet zone for 0 ≤ x/L ≤ 1, (ii) spray and reattachment zone for 1 ≤ x/L ≤ 3 and (iii) far-field zone for x/L ≥ 3. They are similar to the zones observed on smooth chutes;
- The air entrainment coefficient β is mainly influenced by the chute angle φ, the approach flow Froude number Fo and the deflector angle α. For φ = 50° and α = 10°, air entrainment may start at values of Fo = 2.0;
- Relationships are presented for the jet length L;
- Relationships are presented for the three identified average air concentration Ca extrema and two bottom air concentration Cb extrema, which allow to characterize the flow development downstream of the aerator. Unlike smooth chutes, there appears to be no significant air detrainment in the far-field zone as the flow rapidly (x/L ≥ 4) converges to quasi-uniform conditions. One aerator seems thus sufficient to aerate the entire chute;
- The lowest Cb measured at the step edges in all tests is higher than the air concentration recommended by literature to protect against cavitation damages. A deflector aerator is sufficient to provide protection of a stepped spillway when the parameter ranges given below are respected;
- Increased turbulence in the approach flow increases β and has a minor effect on Ca and Cb;
- Scale effects are observed on the bottom air concentration Cb for tests with Fo = 3.2 and Wo ≈ 88, while no distinct effects are observed for the tests with Fo = 5.5 and Wo ≈ 106. An approach flow Weber number Wo ≥ 100 is therefore recommended to limit scale effects.
Due to potential cavitation damages on stepped spillways, an aerator is required for high specific discharges (q ≥ 30 m3/s/m) as one of the most efficient mitigation measures. The results of the present study allow for the design of a stepped spillways aerator and an example was provided. The results of the study apply within the following parameter ranges: 30° ≤ φ ≤ 50°, 0.32 ≤ s/ho ≤ 1.16, 3.2 ≤ Fo ≤ 7.5, 5.7° ≤ α ≤ 14°, 0.16 ≤ t/ho ≤ 0.60, Δp/(ρgho) ≤ 0.1 and L/ho ≥ 8.
Author Contributions
Conceptualization, A.J.S. and M.P.; methodology, A.J.S., M.P. and S.T.; software, S.T. and M.P.; validation, S.T. and M.P.; formal analysis, S.T., M.P. and A.J.S.; investigation, S.T.; resources, A.J.S.; data curation, S.T. and M.P.; writing—original draft preparation, S.T.; writing—review and editing, A.J.S., M.P. and S.T.; visualization, S.T.; supervision, A.J.S. and M.P.; project administration, M.P.; funding acquisition, M.P. and A.J.S. All authors have read and agreed to the published version of the manuscript.
Funding
This research was funded by Swiss National Science Foundation SNSF, grant numbers 200021_137572/1 and 200020_159967/1, and by Fondazione Giovanni Lombardi. The APC was funded by EPFL.
Institutional Review Board Statement
Not applicable.
Informed Consent Statement
Not applicable.
Data Availability Statement
Some or all data, models, or code that support the findings of this study are available from the corresponding author upon reasonable request.
Acknowledgments
The authors thank Cédric Bron for his technical assistance with the experiments.
Conflicts of Interest
The authors declare no conflict of interest. The funders had no role in the design of the study; in the collection, analyses, or interpretation of data; in the writing of the manuscript, or in the decision to publish the results.
References
- Matos, J.; Meireles, I.C. Hydraulics of stepped weirs and dam spillways: Engineering challenges, labyrinths of research. In Proceedings of the 5th International Symposium on Hydraulic Structures, University of Queensland, Brisbane, Australia, 25–27 June 2014; pp. 1–30. [Google Scholar]
- Chanson, H.; Bung, D.B.; Matos, J. Stepped spillways and cascades. In Energy Dissipation in Hydraulic Structures; Chanson, H., Ed.; IAHR Monograph; CRC Press: London, UK, 2015; pp. 45–64. [Google Scholar]
- Hager, W.H.; Schleiss, A.J.; Boes, R.M.; Pfister, M. Stepped chute. In Hydraulic Engineering of Dams; CRC Press: Boca Raton, FL, USA, 2021; pp. 277–319. [Google Scholar]
- Boes, R.M.; Hager, W.H. Two-phase flow characteristics of stepped spillways. J. Hydraul. Eng. 2003, 129, 661–670. [Google Scholar] [CrossRef]
- Gomes, J.; Marques, M.; Matos, J. Predicting cavitation inception on steeply sloping stepped spillways. In Proceedings of the 32nd IAHR Congress, Venice, Italy, 1–6 July 2007; 1232; pp. 1–9. [Google Scholar]
- Amador, A.; Sánchez-Juny, M.; Dolz, J. Developing flow region and pressure fluctuations on steeply sloping stepped spillways. J. Hydraul. Eng. 2009, 135, 1092–1100. [Google Scholar] [CrossRef]
- Pfister, M.; Boes, R.M. Discussion of “Skimming, nonaerated flow on stepped spillways over roller compacted concrete dams” by I. Meireles, F. Renna, J. Matos, and F. Bombardelli. J. Hydraul. Eng. 2014, 140, 07014012:1–07014012:2. [Google Scholar] [CrossRef]
- Falvey, H.T. Cavitation in Chutes and Spillways; Engineering monographs 42; United States Department of the Interior: Denver, CO, USA, 1990.
- Hamilton, W. Preventing cavitation damage to hydraulic structures. Int. Water Power Dam Constr. 1983, 35, 48–53. [Google Scholar]
- Pugh, C.A.; Rhone, T.J. Cavitation in Bureau of Reclamation tunnel spillways. In Proceedings of the Hydraulics for High Dams, Beijing, China, 15–18 November 1988; Chinese Hydraulic Engineering Society: Beijing, China, 1988; pp. 645–652. [Google Scholar]
- Frizell, K.W.; Renna, F.M.; Matos, J. Cavitation potential of flow on stepped spillways. J. Hydraul. Eng. 2013, 139, 630–636. [Google Scholar] [CrossRef]
- Frizell, K.W.; Renna, F.M.; Matos, J. Closure to “Cavitation potential of flow on stepped spillways”. J. Hydraul. Eng. 2015, 141, 07015009:1–07015009:3. [Google Scholar] [CrossRef]
- Peterka, A.J. The effect of entrained air on cavitation pitting. In Proceedings of the Minnesota International Hydraulic Convention, Minneapolis, MN, USA, 1–4 September 1953; pp. 507–518. [Google Scholar]
- Rasmussen, R.E.H. Some experiments on cavitation erosion in water mixed with air. In Proceedings of the International Symposium on Cavitation in Hydrodynamics, Teddington, UK, 14–17 September 1956; Volume 20, pp. 1–25. [Google Scholar]
- Russell, S.O.; Sheehan, G.J. Effect of entrained air on cavitation damage. Can. J. Civ. Eng. 1974, 1, 97–107. [Google Scholar] [CrossRef]
- Pinto, N.L.; Neidert, S.H.; Ota, J.J. Aeration at high velocity flows I. Int. Water Power Dam Constr. 1982, 34, 34–38. [Google Scholar]
- Pinto, N.L.; Neidert, S.H.; Ota, J.J. Aeration at high velocity flows II. Int. Water Power Dam Constr. 1982, 34, 42–44. [Google Scholar]
- Volkart, P.; Chervet, A. Air Slots for Flow Aeration; Vischer, D., Ed.; VAW Mitteilung 66; ETH Zürich: Zürich, Switzerland, 1983. [Google Scholar]
- Tan, T.P. Model Studies of Aerators on Spillways; Research report 84–6; University of Canterbury: Christchurch, New Zealand, 1984. [Google Scholar]
- Low, H.S. Model Studies of Clyde Dam Spillway Aerators; Research report 86–6; University of Canterbury: Christchurch, New Zealand, 1986. [Google Scholar]
- Koschitzky, H.-P. Dimensionierungskonzept für Sohlbelüfter in Schussrinnen zur Vermeidung von Kavitationsschäden; Kobus, H., Ed.; Institut für Wasserbau Mitteilung 65; Universität Stuttgart: Stuttgart, Germany, 1987. [Google Scholar]
- Chanson, H. Study of Air Entrainment and Aeration Devices on a Spillway Model. Ph.D. Thesis, University of Canterbury, Christchurch, New Zealand, 1988. [Google Scholar]
- Rutschmann, P.; Hager, W.H. Air entrainment by spillway aerators. J. Hydraul. Eng. 1990, 116, 765–782. [Google Scholar] [CrossRef]
- Pfister, M.; Hager, W.H. Chute aerators. II: Hydraulic design. J. Hydraul. Eng. 2010, 136, 360–367. [Google Scholar] [CrossRef]
- Kramer, K.; Hager, W.H.; Minor, H.-E. Development of air concentration on chute spillways. J. Hydraul. Eng. 2006, 132, 908–915. [Google Scholar] [CrossRef]
- Pfister, M.; Hager, W.H.; Minor, H.-E. Bottom aeration of stepped spillways. J. Hydraul. Eng. 2006, 132, 850–853. [Google Scholar] [CrossRef]
- Pfister, M.; Hager, W.H.; Minor, H.-E. Stepped chutes: Pre-aeration and spray reduction. Int. J. Multiph. Flow 2006, 32, 269–284. [Google Scholar] [CrossRef]
- Schiess Zamora, A.; Pfister, M.; Hager, W.H.; Minor, H.-E. Hydraulic performance of step aerator. J. Hydraul. Eng. 2008, 134, 127–134. [Google Scholar] [CrossRef]
- Lin, K.J.; Han, L. Stepped spillway for Dachaoshan RCC dam. In Proceedings of the 29th IAHR Congress, Beijing, China, 16–21 September 2001; Burgi, P.H., Gao, J., Eds.; Tsinghua University Press: Beijing, China, 2001; pp. 88–93. [Google Scholar]
- Ma, F.; Wu, J.-H. Hydraulics of abrupt contraction aerator on stepped chutes. J. Hydraul. Res. 2021, 59, 345–350. [Google Scholar] [CrossRef]
- André, S. High Velocity Aerated Flows on Stepped Chutes with Macro-Roughness Elements; LCH Communication 20; EPFL-LCH: Lausanne, Switzerland, 2004. [Google Scholar]
- Deng, Y.; Lin, K.; Han, L. Design and prototype test of stepped overflow surface at Dachaoshan hydropower station in China. In Proceedings of the 4th Roller Compacted Concrete Dams Symposium, Madrid, Spain, 16–19 November 2003; pp. 431–432. [Google Scholar]
- Guo, J.; Liu, Z.; Liu, J.; Lu, Y. Field observation on the RCC stepped spillways with the flaring pier gate on the Dachaoshan project. In Proceedings of the 30th IAHR Congress, Thessaloniki, Greece, 24–29 August 2003; Volume D, pp. 473–478. [Google Scholar]
- Prisk, M.; Richards, M.; Hieatt, M. Delivering Wadi Dayqah, Oman’s tallest dam. Proc. Inst. Civ. Eng. 2009, 162, 42–50. [Google Scholar] [CrossRef]
- Al Harthy, S.H.; Hall, J.K.; Hieatt, M.J.; Wheelerl, M. The day Wadi Dayqah roared. Int. Water Power Dam Constr. 2010, 62, 40–43. [Google Scholar]
- Toloshinov, A.V.; Volynchikov, A.N.; Prokof’ev, V.A.; Sudol’skii, G.A. Development of the design for the No. 2 spillway at the Boguchany hydroproject. Power Technol. Eng. 2009, 43, 135–142. [Google Scholar] [CrossRef]
- Willey, J.; Ewing, T.; Lesleighter, E.; Dymke, J. Numerical and physical modelling for a complex stepped spillway. Int. J. Hydropower Dams 2010, 17, 108–113. [Google Scholar]
- Terrier, S. Hydraulic Performance of Stepped Spillway Aerators and Related Downstream Flow Features. Ph.D. Thesis, EPFL, Lausanne, Switzerland, 2016. [Google Scholar]
- Terrier, S.; Pfister, M.; Schleiss, A.J. Effect of deflector aerator on stepped spillway flow. In Proceedings of the Hydraulic Structures and Water System Management, Portland, OR, USA, 27–30 June 2016; Crookston, B.M., Tullis, B., Eds.; pp. 168–177. [Google Scholar] [CrossRef]
- Schwalt, M.; Hager, W.H. Die Strahlbox. Schweiz. Ing. Archit. 1992, 110, 547–549. [Google Scholar] [CrossRef]
- Boes, R.M. Zweiphasenströmung und Energieumsetzung an Grosskaskaden; VAW Mitteilung 166; ETH Zürich: Zürich, Switzerland, 2000. [Google Scholar]
- Kramer, K. Development of Aerated Chute Flow; VAW Mitteilung 183; ETH Zürich: Zürich, Switzerland, 2004. [Google Scholar]
- Pfister, M. Schussrinnenbelüfter Lufttransport ausgelöst durch interne Abflussstruktur; VAW Mitteilung 203; ETH Zürich: Zürich, Switzerland, 2008. [Google Scholar]
- Ostad Mirza, M.J. Experimental Study on the Influence of Abrupt Slope Changes on Flow Characteristics over Stepped Spillways; LCH Communication 64; EPFL-LCH: Lausanne, Switzerland, 2016. [Google Scholar]
- Stojnic, I. Stilling Basin Performance Downstream of Stepped Spillways. Ph.D. Thesis, EPFL, Lausanne, Switzerland, 2020. [Google Scholar]
- Felder, S.; Pfister, M. Comparative analyses of phase-detective intrusive probes in high-velocity air–water flows. Int. J. Multiph. Flow 2017, 90, 88–101. [Google Scholar] [CrossRef] [Green Version]
- Kobus, H. Local air entrainment and detrainment. In Proceedings of the Symposium on Scale Effects in Modelling Hydraulic Structures, Esslingen am Neckar, Germany, 3–6 September 1984; Kobus, H., Ed.; Institut für Wasserbau, Universität Stuttgart: Stuttgart, Germany, 1984; Volume 4.10, pp. 1–10. [Google Scholar]
- Pfister, M.; Hager, W.H. Chute aerators. I: Air transport characteristics. J. Hydraul. Eng. 2010, 136, 352–359. [Google Scholar] [CrossRef]
- Pinto, N.L. Model evaluation of aerators in shooting flow. In Proceedings of the Symposium on Scale Effects in Modelling Hydraulic Structures, Esslingen am Neckar, Germany, 3–6 September 1984; Kobus, H., Ed.; Institut für Wasserbau, Universität Stuttgart: Stuttgart, Germany, 1984; Volume 4.2, pp. 1–6. [Google Scholar]
- Rutschmann, P. Belüftungseinbauten in Schussrinnen; Vischer, D., Ed.; VAW Mitteilung 97; ETH Zürich: Zürich, Switzerland, 1988. [Google Scholar]
- Skripalle, J. Zwangsbelüftung von Hochgeschwindigkeitsströmungen an Zurückspringenden Stufen im Wasserbau; IWAWI Mitteilung 124; TU Berlin: Berlin, Germany, 1994. [Google Scholar]
- Wahrheit-Lensing, A. Selbstbelüftung und Energieumwandlung beim Abfluss über treppenförmige Entlastungsanlagen. Ph.D. Thesis, University of Karlsruhe, Karlsruhe, Germany, 1996. [Google Scholar]
- Boes, R.M. Scale effects in modelling two-phase stepped spillway flow. In Proceedings of the Hydraulics of Stepped Spillways, Zürich, Switzerland, 22–24 March 2000; Minor, H.-E., Hager, W.H., Eds.; Balkema: Zürich, Switzerland, 2000; pp. 53–60. [Google Scholar]
- Chanson, H.; Aoki, S.; Hoque, A. Physical modelling and similitude of air bubble entrainment at vertical circular plunging jets. Chem. Eng. Sci. 2004, 59, 747–758. [Google Scholar] [CrossRef] [Green Version]
- Takahashi, M.; Yasuda, Y.; Ohtsu, I. Effect of Reynolds number on characteristics of skimming flows in stepped channels. In Proceedings of the 31st IAHR Congress, Seoul, Korea, 11–17 September 2005; pp. 2880–2889. [Google Scholar]
- Chanson, H. Turbulent air-water flows in hydraulic structures: Dynamic similarity and scale effects. Environ. Fluid Mech. 2009, 9, 125–142. [Google Scholar] [CrossRef] [Green Version]
- Ervine, D.A.; Falvey, H.T.; Kahn, A.R. Turbulent flow structure and air uptake at aerators. Int. J. Hydropower Dams 1995, 2, 89–96. [Google Scholar]
- Matos, J.; Quintela, A.; Sánchez-Juny, M.; Dolz, J. Air entrainment and saftey against cavitation damage in stepped spillway over RCC dams. In Proceedings of the Hydraulics of Stepped Spillways, Zürich, Switzerland, 22–24 March 2000; Minor, H.-E., Hager, W.H., Eds.; Balkema: Zürich, Switzerland, 2000; pp. 69–76. [Google Scholar]
- Chanson, H. The Hydraulics of Stepped Chutes and Spillways; Balkema: Lisse, The Netherlands, 2002. [Google Scholar]
- Meireles, I.C.; Renna, F.M.; Matos, J.; Bombardelli, F.A. Skimming, nonaerated flow on stepped spillways over roller compacted concrete dams. J. Hydraul. Eng. 2012, 138, 870–877. [Google Scholar] [CrossRef]
- Boes, R.M.; Hager, W.H. Hydraulic design of stepped spillways. J. Hydraul. Eng. 2003, 129, 671–679. [Google Scholar] [CrossRef] [Green Version]
- Chanson, H. Hydraulic Design of Stepped Cascades, Channels, Weirs, and Spillways; Pergamon: Oxford, UK, 1994. [Google Scholar]
- Matos, J. Discussion of “Characteristics of skimming flow over stepped spillways” by M.R. Chamani and N. Rajaratnam. J. Hydraul. Eng. 2000, 126, 865–869. [Google Scholar] [CrossRef]
- Takahashi, M.; Ohtsu, I. Aerated flow characteristics of skimming flow over stepped chutes. J. Hydraul. Res. 2012, 50, 427–434. [Google Scholar] [CrossRef]
- Wilhelms, S.C.; Gulliver, J.S. Bubbles and waves description of self-aerated spillway flow. J. Hydraul. Res. 2005, 43, 522–531. [Google Scholar] [CrossRef]
- Hager, W.H. Uniform aerated chute flow. J. Hydraul. Eng. 1991, 117, 528–533. [Google Scholar] [CrossRef]
- Chanson, H. Predicting the filling of ventilated cavities behind spillway aerators. J. Hydraul. Res. 1995, 33, 361–372. [Google Scholar] [CrossRef] [Green Version]
- Wu, J.; Ma, F.; Xu, W. Bottom roller characteristics in cavity of chute aerators. J. Hydraul. Res. 2013, 51, 317–321. [Google Scholar] [CrossRef]
- Pfister, M. Jet impact angle on chute downstream of aerator. In Proceedings of the 4th International Symposium on Hydraulic Structures, Porto, Portugal, 9–11 February 2012; pp. 1–8. [Google Scholar]
- Pfister, M.; Hager, W.H. Deflector-generated jets. J. Hydraul. Res. 2009, 47, 466–475. [Google Scholar] [CrossRef]
- Chanson, H. Aeration and deaeration at bottom aeration devices on spillways. Can. J. Civ. Eng. 1994, 21, 404–409. [Google Scholar] [CrossRef]
- Pfister, M.; Chanson, H. Two-phase air-water flows: Scale effects in physical modeling. J. Hydrodynam. 2014, 26, 291–298. [Google Scholar] [CrossRef] [Green Version]
- U.S. Army Corps of Engineers. Hydraulic Design Criteria; Waterways Experiment Station: Vicksburg, MS, USA, 1987. [Google Scholar]
Figure 1.
(a) Experimental facility with a chute bottom angle of φ = 50°; (b) Definition scheme of a stepped spillway aerator.
Figure 1.
(a) Experimental facility with a chute bottom angle of φ = 50°; (b) Definition scheme of a stepped spillway aerator.

Figure 2.
Components and placement of the aerator at the head of the stepped channel.

Figure 3.
Inception point (a) mixture flow depth hi, and (b) equivalent blackwater flow depth hwi.

Figure 4.
Typical results of an aerator test (test 20). (a) Air concentration C distribution and flow surface elevation z90. The dashed red line shows the lower jet trajectory. The steps are distorted due to the use of different stream-wise and depth-wise scales; (b) Average air concentration Ca, bottom air concentration Cb and minimum air concentration Cmin; (c) Photo of the upper part of the channel (−0.5 ≤ x ≤ 2.35 m).

Figure 5.
Development of the (a) flow surface elevation z90, (b) average air concentration Ca and (c) bottom air concentration Cb in the different flow zones along the chute. Blue lines are tests with φ = 30° and orange lines are tests with φ = 50°.
Figure 5.
Development of the (a) flow surface elevation z90, (b) average air concentration Ca and (c) bottom air concentration Cb in the different flow zones along the chute. Blue lines are tests with φ = 30° and orange lines are tests with φ = 50°.


Figure 6.
Air entrainment coefficient β as a function of Ψ = Fo·(1 + sin φ)1.5·(1 + tan α)3.

Figure 7.
(a) Relative jet length L/ho as a function of Ψ1 = (1 + sin φ)2·(1 + tan α)4·Fo1.4·(t/ho)0.4; (b) Relative blackwater core length Lbwc/ho as a function of Ψ2 = Fo−1·(1 + tan α)−0.5·(1 + sin φ).
Figure 7.
(a) Relative jet length L/ho as a function of Ψ1 = (1 + sin φ)2·(1 + tan α)4·Fo1.4·(t/ho)0.4; (b) Relative blackwater core length Lbwc/ho as a function of Ψ2 = Fo−1·(1 + tan α)−0.5·(1 + sin φ).

Figure 8.
(a) Development of the average air concentration Ca in the jet as a function of the streamwise position x relative to the blackwater core length Lbwc. Only points upstream of the jet maximum were used (x ≤ x1); (b) Impact minimum average air concentration Ca2 as a function of Ψ = (1 + sin φ)1.1·(1 + tan α)2.5·Fo1.1·(t/ho)0.15.

Figure 9.
Spray maximum characteristics: (a) relative streamwise position x3/L as a function of Ψ1 = (1 + sin φ)−1·(1 + tan α)−5·Fo−0.75·(t/ho)−0.55·(s/ho)0.3, and (b) average air concentration Ca3 as a function of Ψ2 = sin0.7 φ·(1 + tan α)·Fo0.25·(t/ho)0.15.
Figure 9.
Spray maximum characteristics: (a) relative streamwise position x3/L as a function of Ψ1 = (1 + sin φ)−1·(1 + tan α)−5·Fo−0.75·(t/ho)−0.55·(s/ho)0.3, and (b) average air concentration Ca3 as a function of Ψ2 = sin0.7 φ·(1 + tan α)·Fo0.25·(t/ho)0.15.

Figure 10.
Bottom minimum characteristics: (a) relative streamwise position x4/L as a function of Ψ1 = (1 + sin φ)−1·(1 + tan α)−1.75·Fo−0.17·(t/ho)−0.23, and (b) bottom air concentration Cb4 as a function of Ψ2 = sin1.4 φ·(1 + tan α)·Fo0.3·(t/ho)0.15·(s/ho)−0.3.
Figure 10.
Bottom minimum characteristics: (a) relative streamwise position x4/L as a function of Ψ1 = (1 + sin φ)−1·(1 + tan α)−1.75·Fo−0.17·(t/ho)−0.23, and (b) bottom air concentration Cb4 as a function of Ψ2 = sin1.4 φ·(1 + tan α)·Fo0.3·(t/ho)0.15·(s/ho)−0.3.

Figure 11.
Bottom maximum characteristics: (a) relative streamwise position x5/L as a function of Ψ1 = (1 + sin φ)−2·(1 + tan α)−4·Fo−1·(t/ho)−0.3·(s/ho)0.3, and (b) bottom air concentration Cb5 as a function of Ψ2 = sin1.5 φ·Fo0.2·(t/ho)0.25(s/ho)−0.1.
Figure 11.
Bottom maximum characteristics: (a) relative streamwise position x5/L as a function of Ψ1 = (1 + sin φ)−2·(1 + tan α)−4·Fo−1·(t/ho)−0.3·(s/ho)0.3, and (b) bottom air concentration Cb5 as a function of Ψ2 = sin1.5 φ·Fo0.2·(t/ho)0.25(s/ho)−0.1.

Figure 12.
Bottom air concentration Cb comparison of all present study tests for φ = 50° with those of [26].
Figure 12.
Bottom air concentration Cb comparison of all present study tests for φ = 50° with those of [26].

Figure 13.
Visual comparison of the standard, grid and pre-aerated tests (respectively tests 58, 65 and 68) for Fo = 7.3–7.5.
Figure 13.
Visual comparison of the standard, grid and pre-aerated tests (respectively tests 58, 65 and 68) for Fo = 7.3–7.5.

Figure 14.
Development of (a) the average air concentration Ca, and (b) the bottom air concentration Cb along the stream-wise coordinate x (m) for the standard, the grid and the pre-aerated tests. Continues lines (–––) are tests at Fo = 7.3–7.5 and dashed lines (– – –) are tests at Fo = 5.5.
Figure 14.
Development of (a) the average air concentration Ca, and (b) the bottom air concentration Cb along the stream-wise coordinate x (m) for the standard, the grid and the pre-aerated tests. Continues lines (–––) are tests at Fo = 7.3–7.5 and dashed lines (– – –) are tests at Fo = 5.5.

Figure 15.
Definition scheme of the design example showing the upper part of the stepped chute in the vicinity of the aerator.
Figure 15.
Definition scheme of the design example showing the upper part of the stepped chute in the vicinity of the aerator.

Figure 16.
Comparison of the air concentration development between the example and test 27 (a) Average air concentration Ca; (b) Bottom air concentration Cb. Note that test 27 showed scale effects. The dotted segments between the extrema for the example are only indicative.
Figure 16.
Comparison of the air concentration development between the example and test 27 (a) Average air concentration Ca; (b) Bottom air concentration Cb. Note that test 27 showed scale effects. The dotted segments between the extrema for the example are only indicative.


Table 1.
Test numbers and their parameters: deflector angle α, deflector height t, chute angle φ, step height s, Froude number Fo and flow depth ho.
Table 1.
Test numbers and their parameters: deflector angle α, deflector height t, chute angle φ, step height s, Froude number Fo and flow depth ho.
| α | t | φ | s | Fo (-) | Fo (-) | Fo (-) | Fo (-) | Fo (-) |
|---|---|---|---|---|---|---|---|---|
| (°) | (m) | (°) | (m) | 3.2 | 5.5 | 5.5 | 5.5 | 7.5 |
| ho (m) | ho (m) | ho (m) | ho (m) | ho (m) | ||||
| 0.075 | 0.052 | 0.075 | 0.092 | 0.075 | ||||
| - | - | 50 | 0.06 | 17 | 15 | 13 | 14 | 16 |
| - | - | 50 | 0.03 | 10 | 9 | 8 | 7 | 6 |
| - | - | 30 | 0.06 | 41 | 40 | 38 | 39 | 42 |
| - | - | 30 | 0.03 | 56 | 54 | 55 | ||
| 5.71 | 0.015 | 50 | 0.06 | 29 | 33 | 32 | 30 | 31 |
| 9.46 | 0.015 | 50 | 0.06 | 27 | 25 | 24 | 26 | 23 |
| 9.46 | 0.015 | 50 | 0.03 | 12 | ||||
| 9.46 | 0.015 | 30 | 0.06 | 47 | ||||
| 9.46 | 0.015 | 30 | 0.03 | 58 | ||||
| 9.46 | 0.030 | 50 | 0.06 | 18 | 21 | 20 | 19 | 2 |
| 9.46 | 0.030 | 50 | 0.03 | 3 | 2 | 1 | 4 | 5 |
| 9.46 | 0.030 | 30 | 0.06 | 52 | 46 | 44 | 45 | 43 |
| 9.46 | 0.030 | 30 | 0.03 | 62 | 57 | 58 | ||
| 14.04 | 0.015 | 30 | 0.06 | 48 | ||||
| 14.04 | 0.030 | 50 | 0.06 | 28 | 34 | 35 | 36 | 37 |
| 14.04 | 0.030 | 50 | 0.03 | 11 | ||||
| 14.04 | 0.030 | 30 | 0.06 | 49 | ||||
| 14.04 | 0.030 | 30 | 0.03 | 60 | ||||
| 14.04 | 0.045 | 30 | 0.06 | 53 | 50 | 51 | ||
| 14.04 | 0.045 | 30 | 0.03 | 61 |
Table 2.
Jet characteristics of standard, grid and pre-aerated aerator tests.
| Test | Type | Fo (-) | L (m) | β (-) | Δp/(ρgho) (-) |
|---|---|---|---|---|---|
| 57 | standard | 5.49 | 1.22 | 0.112 | 0.00 |
| 64 | grid | 5.52 | 1.00 | 0.216 | 0.04 |
| 67 | pre-aerated | 5.54 | 0.95 | 0.149 | 0.01 |
| 58 | standard | 7.51 | 1.93 | 0.207 | 0.07 |
| 65 | grid | 7.29 | 1.56 | 0.297 | 0.16 |
| 68 | pre-aerated | 7.47 | 1.66 | 0.244 | 0.09 |
Table 3.
Design example characteristics compared to test 27 using a scale factor λ = 45.
| Characteristic | Equation | Example | Test 27 | Unit |
|---|---|---|---|---|
| Chute angle φ | 50 | 50 | ° | |
| Step height s | 1.5 | 2.7 | m | |
| Approach flow Froude number Fo | 3.13 | 3.16 | - | |
| Approach flow depth ho | 3.35 | 3.38 | m | |
| Deflector angle α | 9.46 | 9.46 | ° | |
| Deflector height t | 0.65 | 0.68 | m | |
| Unit discharge q | 60 | 61.3 | m2/s | |
| Relative step height s/ho | 0.46 | 0.80 | - | |
| Relative deflector height t/ho | 0.19 | 0.20 | - | |
| Air entrainment coefficient β | (3) | 0.056 | 0.050 | - |
| Jet length L | (4) | 24.8 | 28.3 | m |
| Blackwater core length Lbwc | (5) | 85.8 1 | - | m |
| Jet maximum coordinate x1 | 19.3 | 14.4 | m | |
| Jet maximum average air concentration Ca1 | (6) | 0.11 | 0.14 | - |
| Impact minimum coordinate x2 | 25.5 | 25.0 | m | |
| Impact minimum average air concentration Ca2 | (7) | 0.14 | 0.13 | - |
| Spray maximum coordinate x3 | (8) | 68.9 | 78.0 | m |
| Spray maximum average air concentration Ca3 | (9) | 0.49 | 0.52 | - |
| Minimum coordinate x4 | (10) | 41.4 | - 2 | m |
| Minimum bottom air concentration Cb4 | (11) | 0.21 | - 2 | - |
| Maximum coordinate x5 | (12) | 94.8 | - 2 | m |
| Minimum bottom air concentration Cb5 | (13) | 0.30 | - 2 | - |
| Quasi-uniform flow conditions xu | 99.1 | - | m |
1 Theoretical value as the jet impact ends the blackwater core. 2 No values due to scale effects.
Publisher’s Note: MDPI stays neutral with regard to jurisdictional claims in published maps and institutional affiliations. |
© 2022 by the authors. Licensee MDPI, Basel, Switzerland. This article is an open access article distributed under the terms and conditions of the Creative Commons Attribution (CC BY) license (https://creativecommons.org/licenses/by/4.0/).
Share and Cite
MDPI and ACS Style
Terrier, S.; Pfister, M.; Schleiss, A.J. Performance and Design of a Stepped Spillway Aerator. Water 2022, 14, 153. https://doi.org/10.3390/w14020153
AMA Style
Terrier S, Pfister M, Schleiss AJ. Performance and Design of a Stepped Spillway Aerator. Water. 2022; 14(2):153. https://doi.org/10.3390/w14020153
Chicago/Turabian StyleTerrier, Stéphane, Michael Pfister, and Anton J. Schleiss. 2022. "Performance and Design of a Stepped Spillway Aerator" Water 14, no. 2: 153. https://doi.org/10.3390/w14020153
Note that from the first issue of 2016, this journal uses article numbers instead of page numbers. See further details here.