
Roadmapping the Transition to Water Resource Recovery Facilities: The Two Demonstration Case Studies of Corleone and Marineo (Italy)

 , , ,
, , ,
Abstract
:1. Introduction
2. Sicilian Case Studies
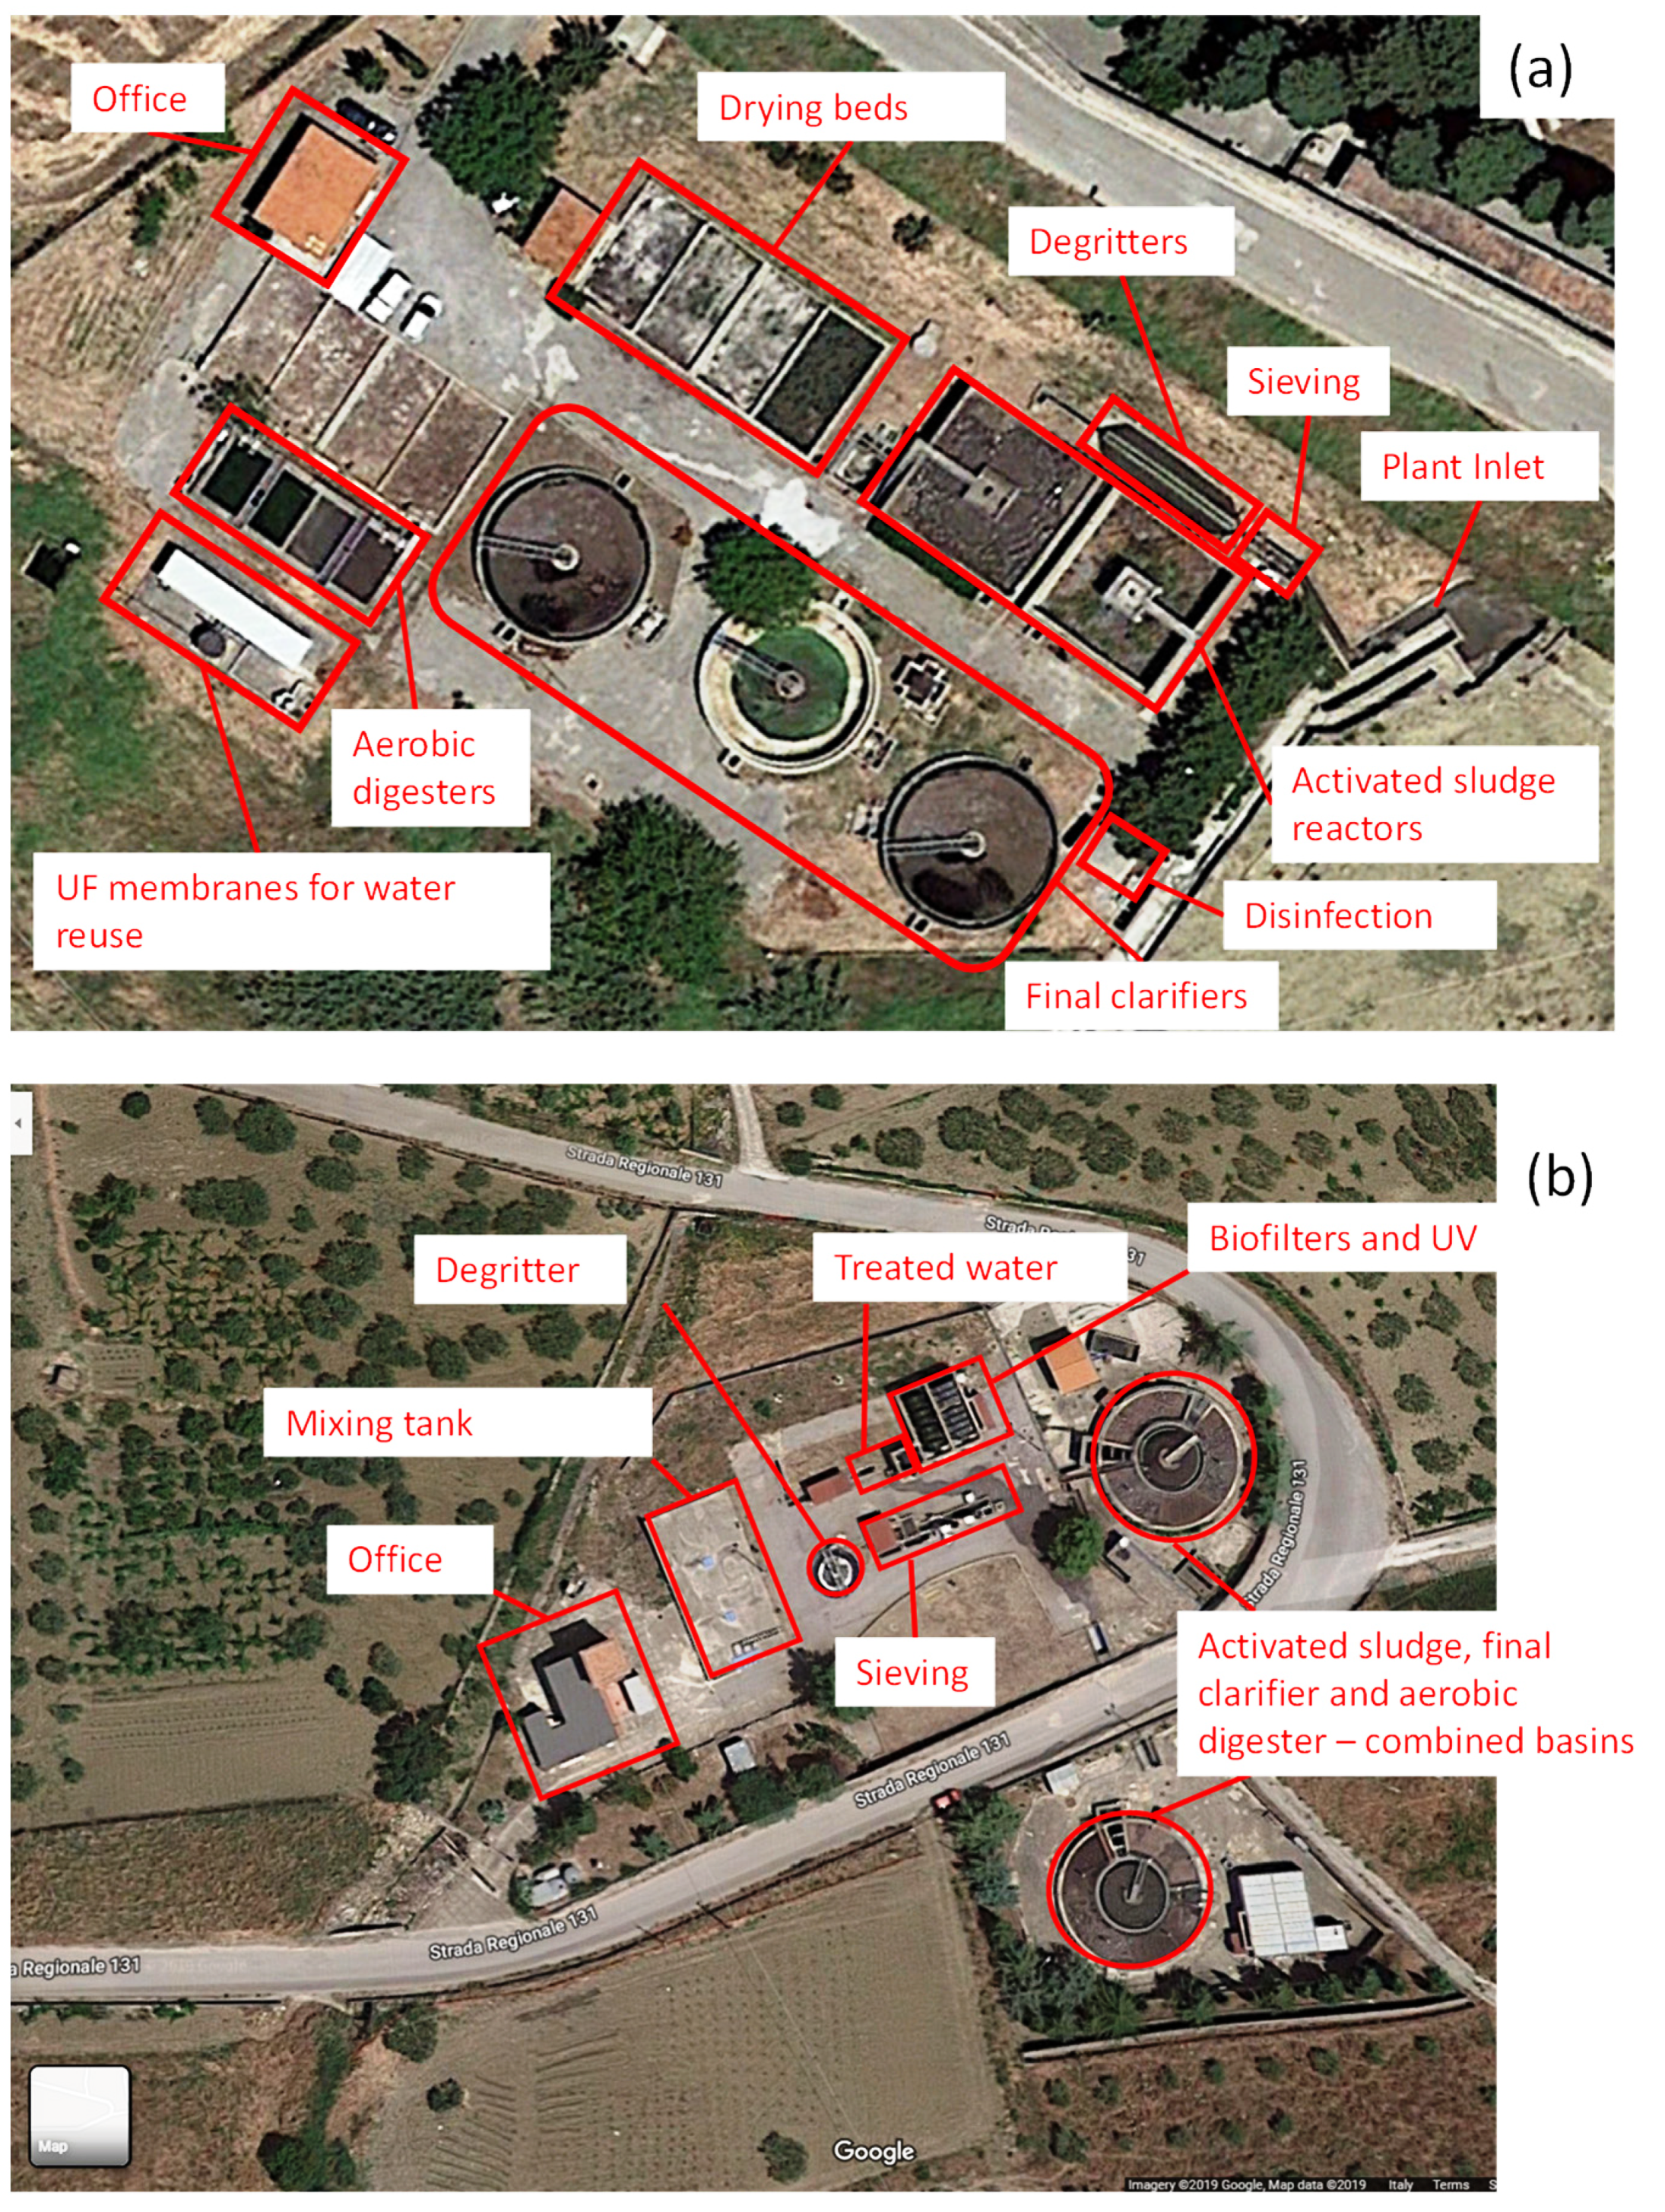
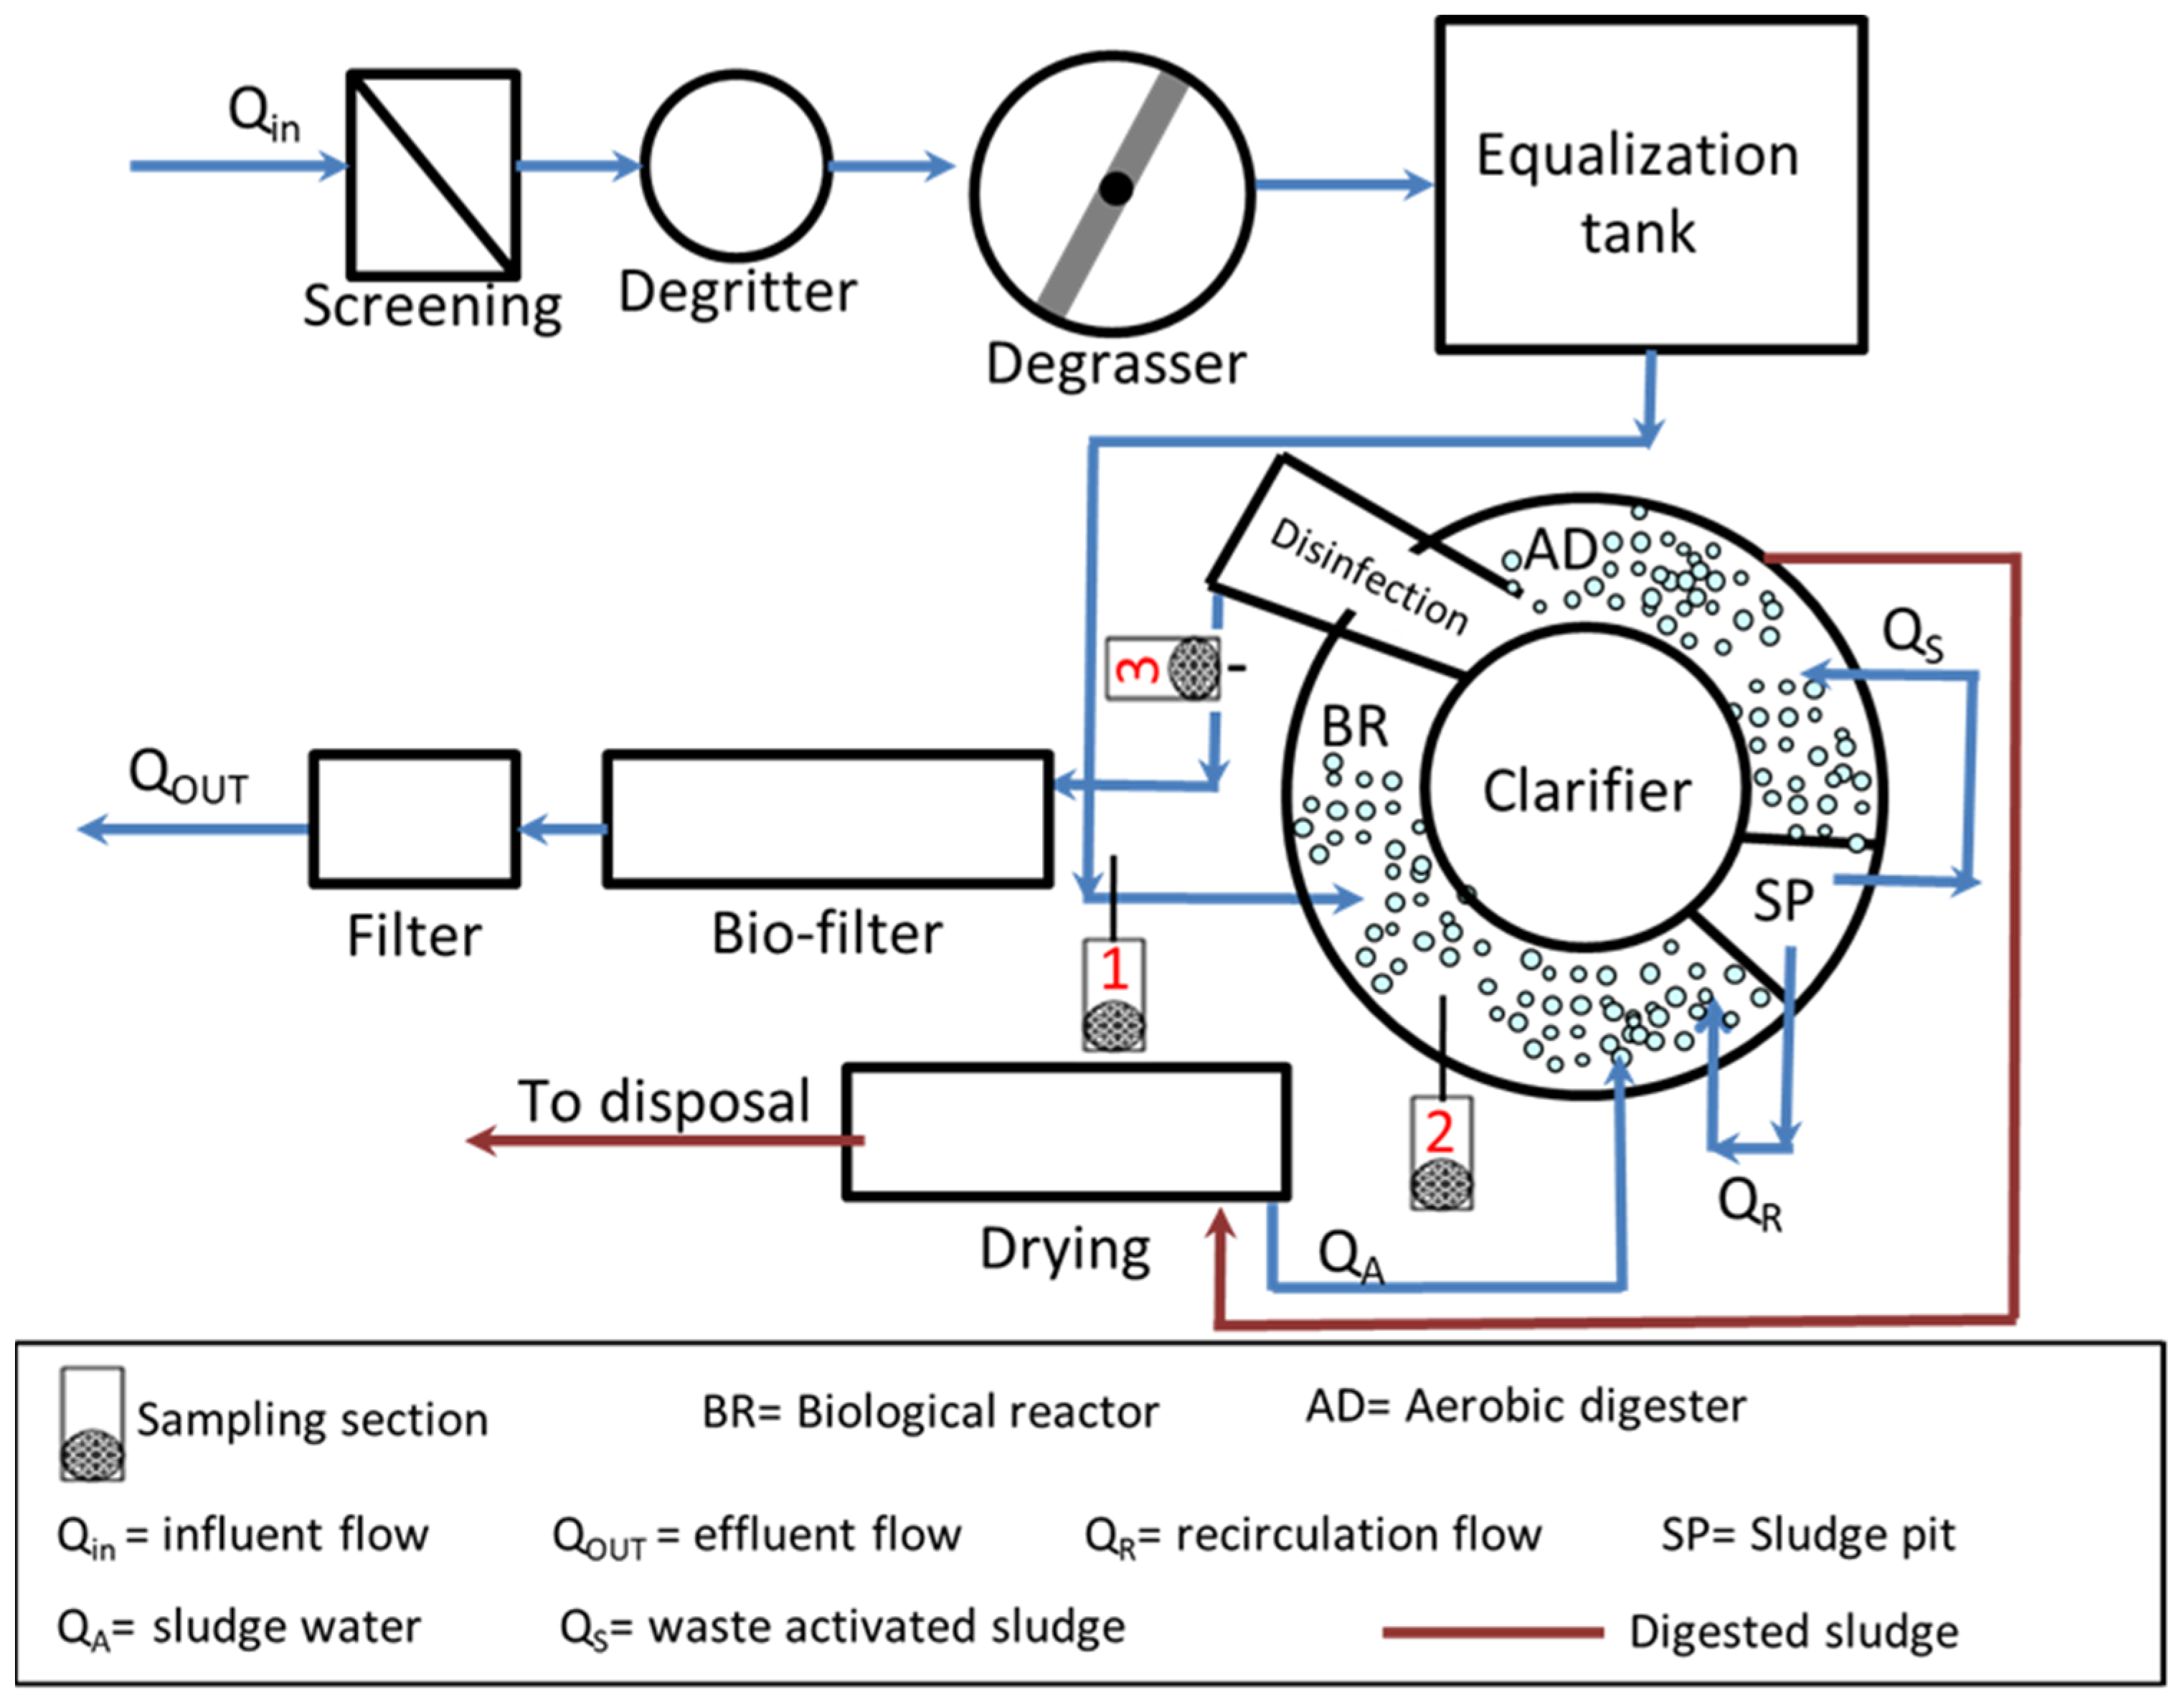
The WWTPs of Corleone and Marineo
3. The Role of Wider-Uptake Project
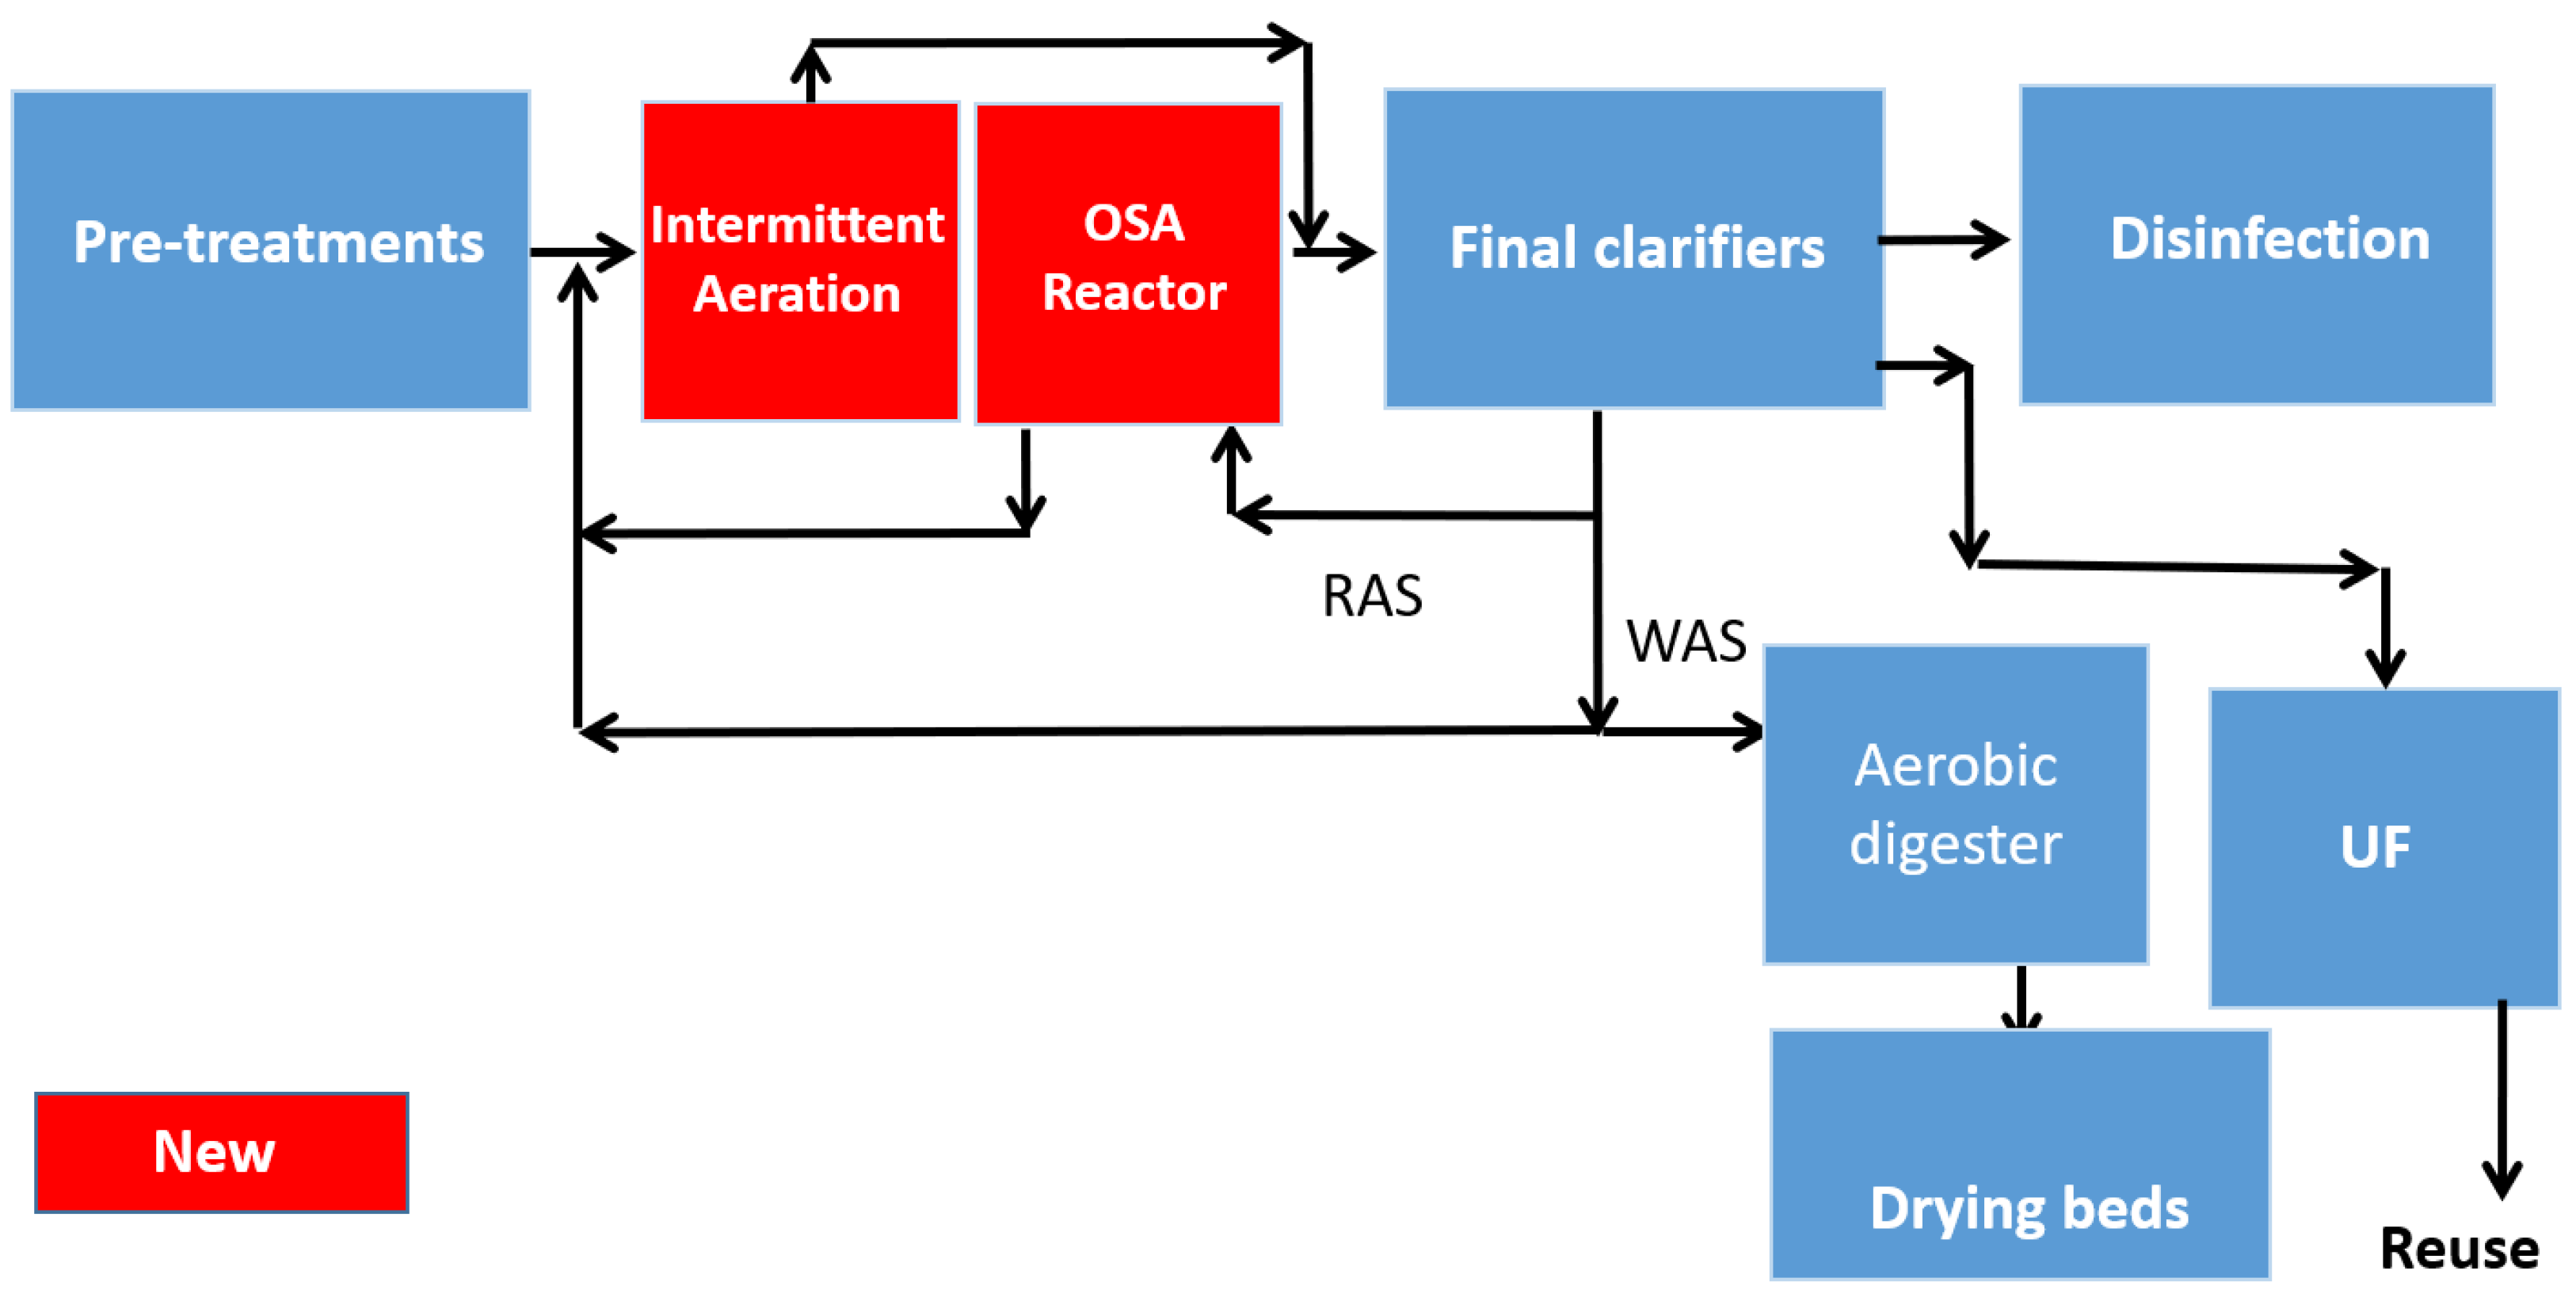
3.1. Corleone
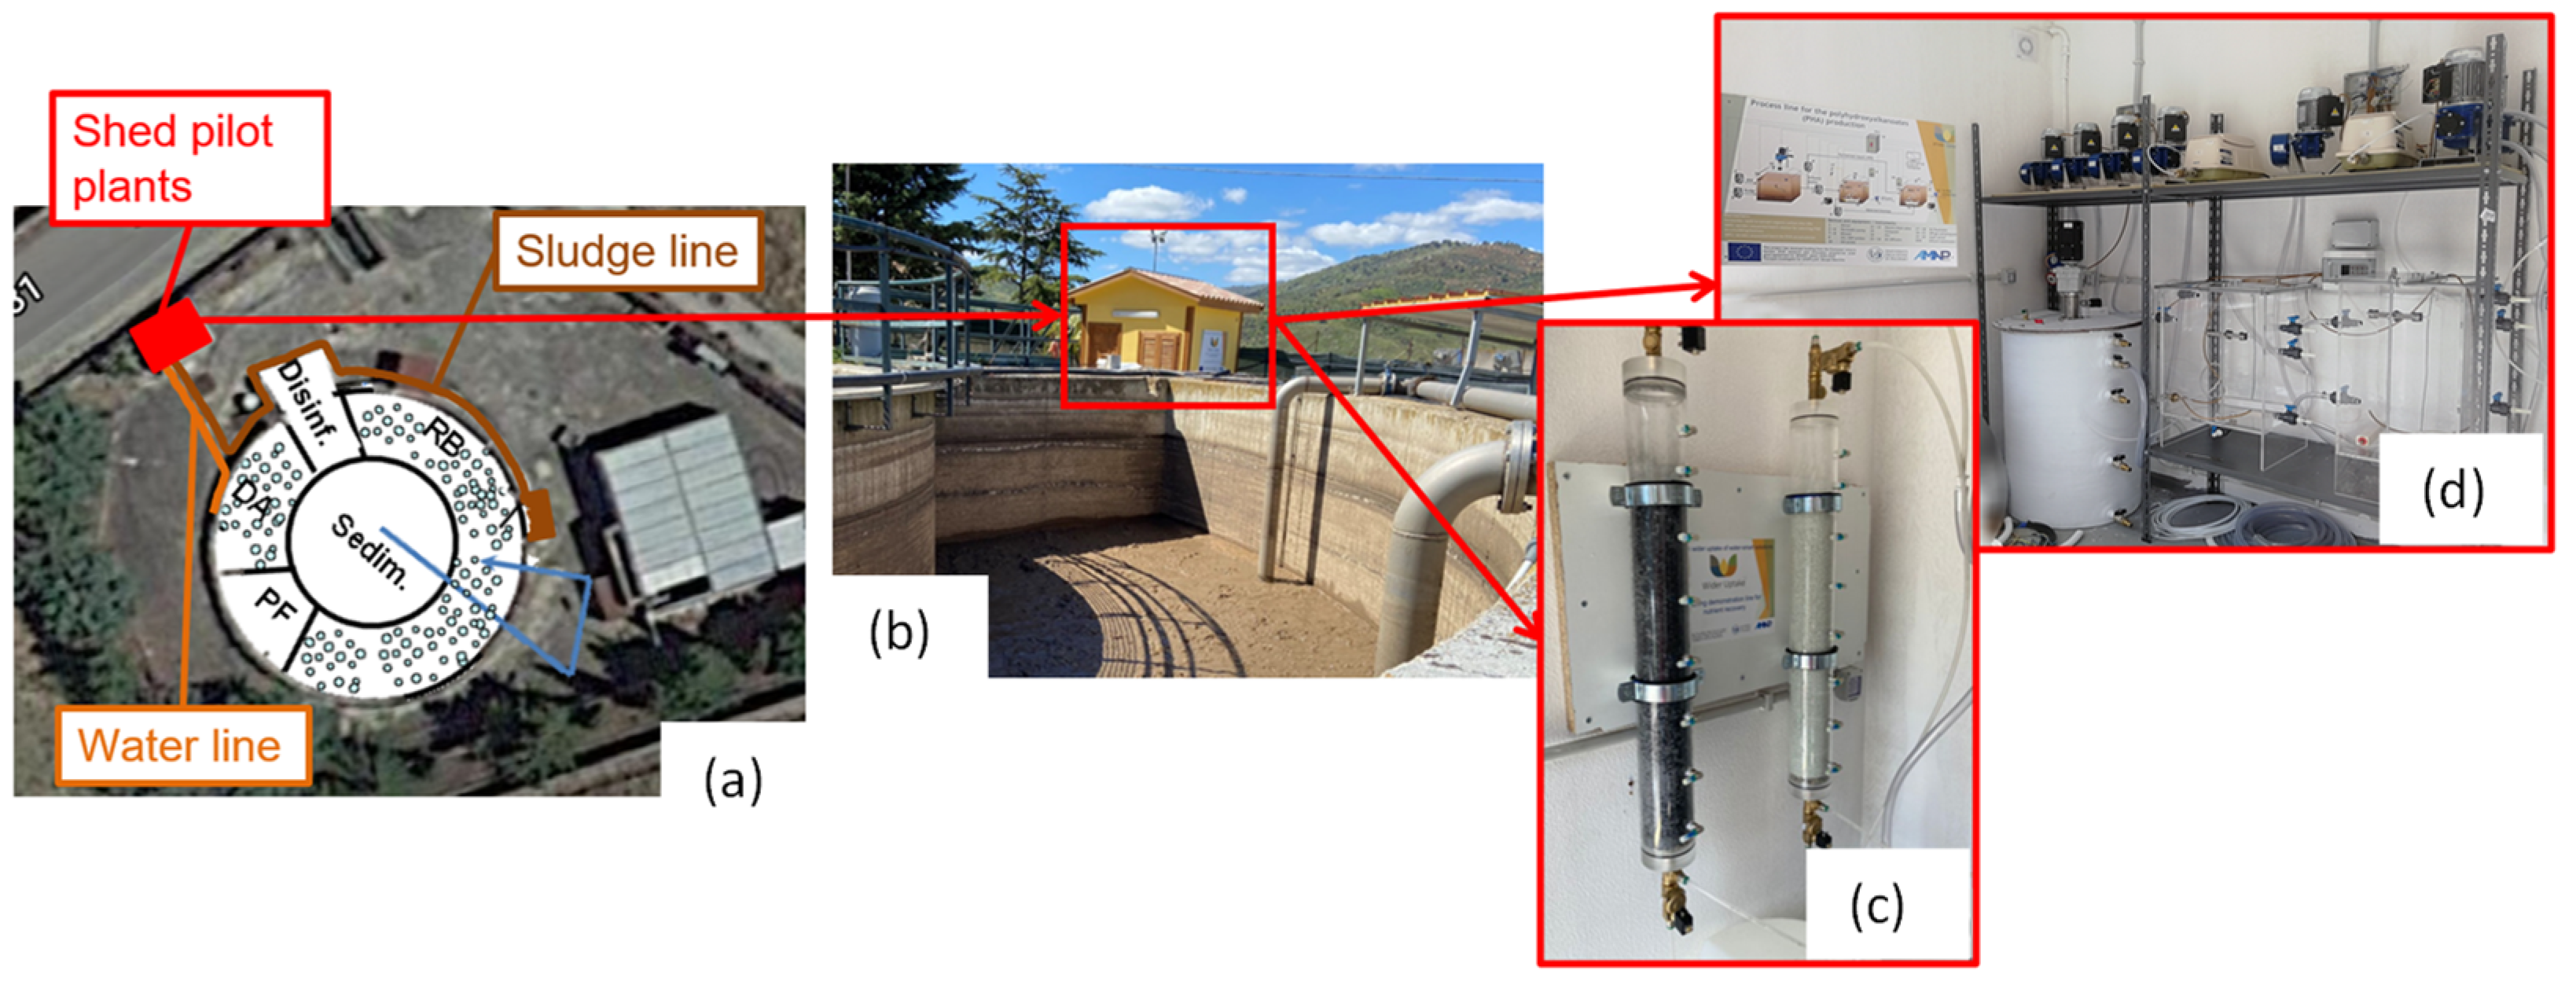
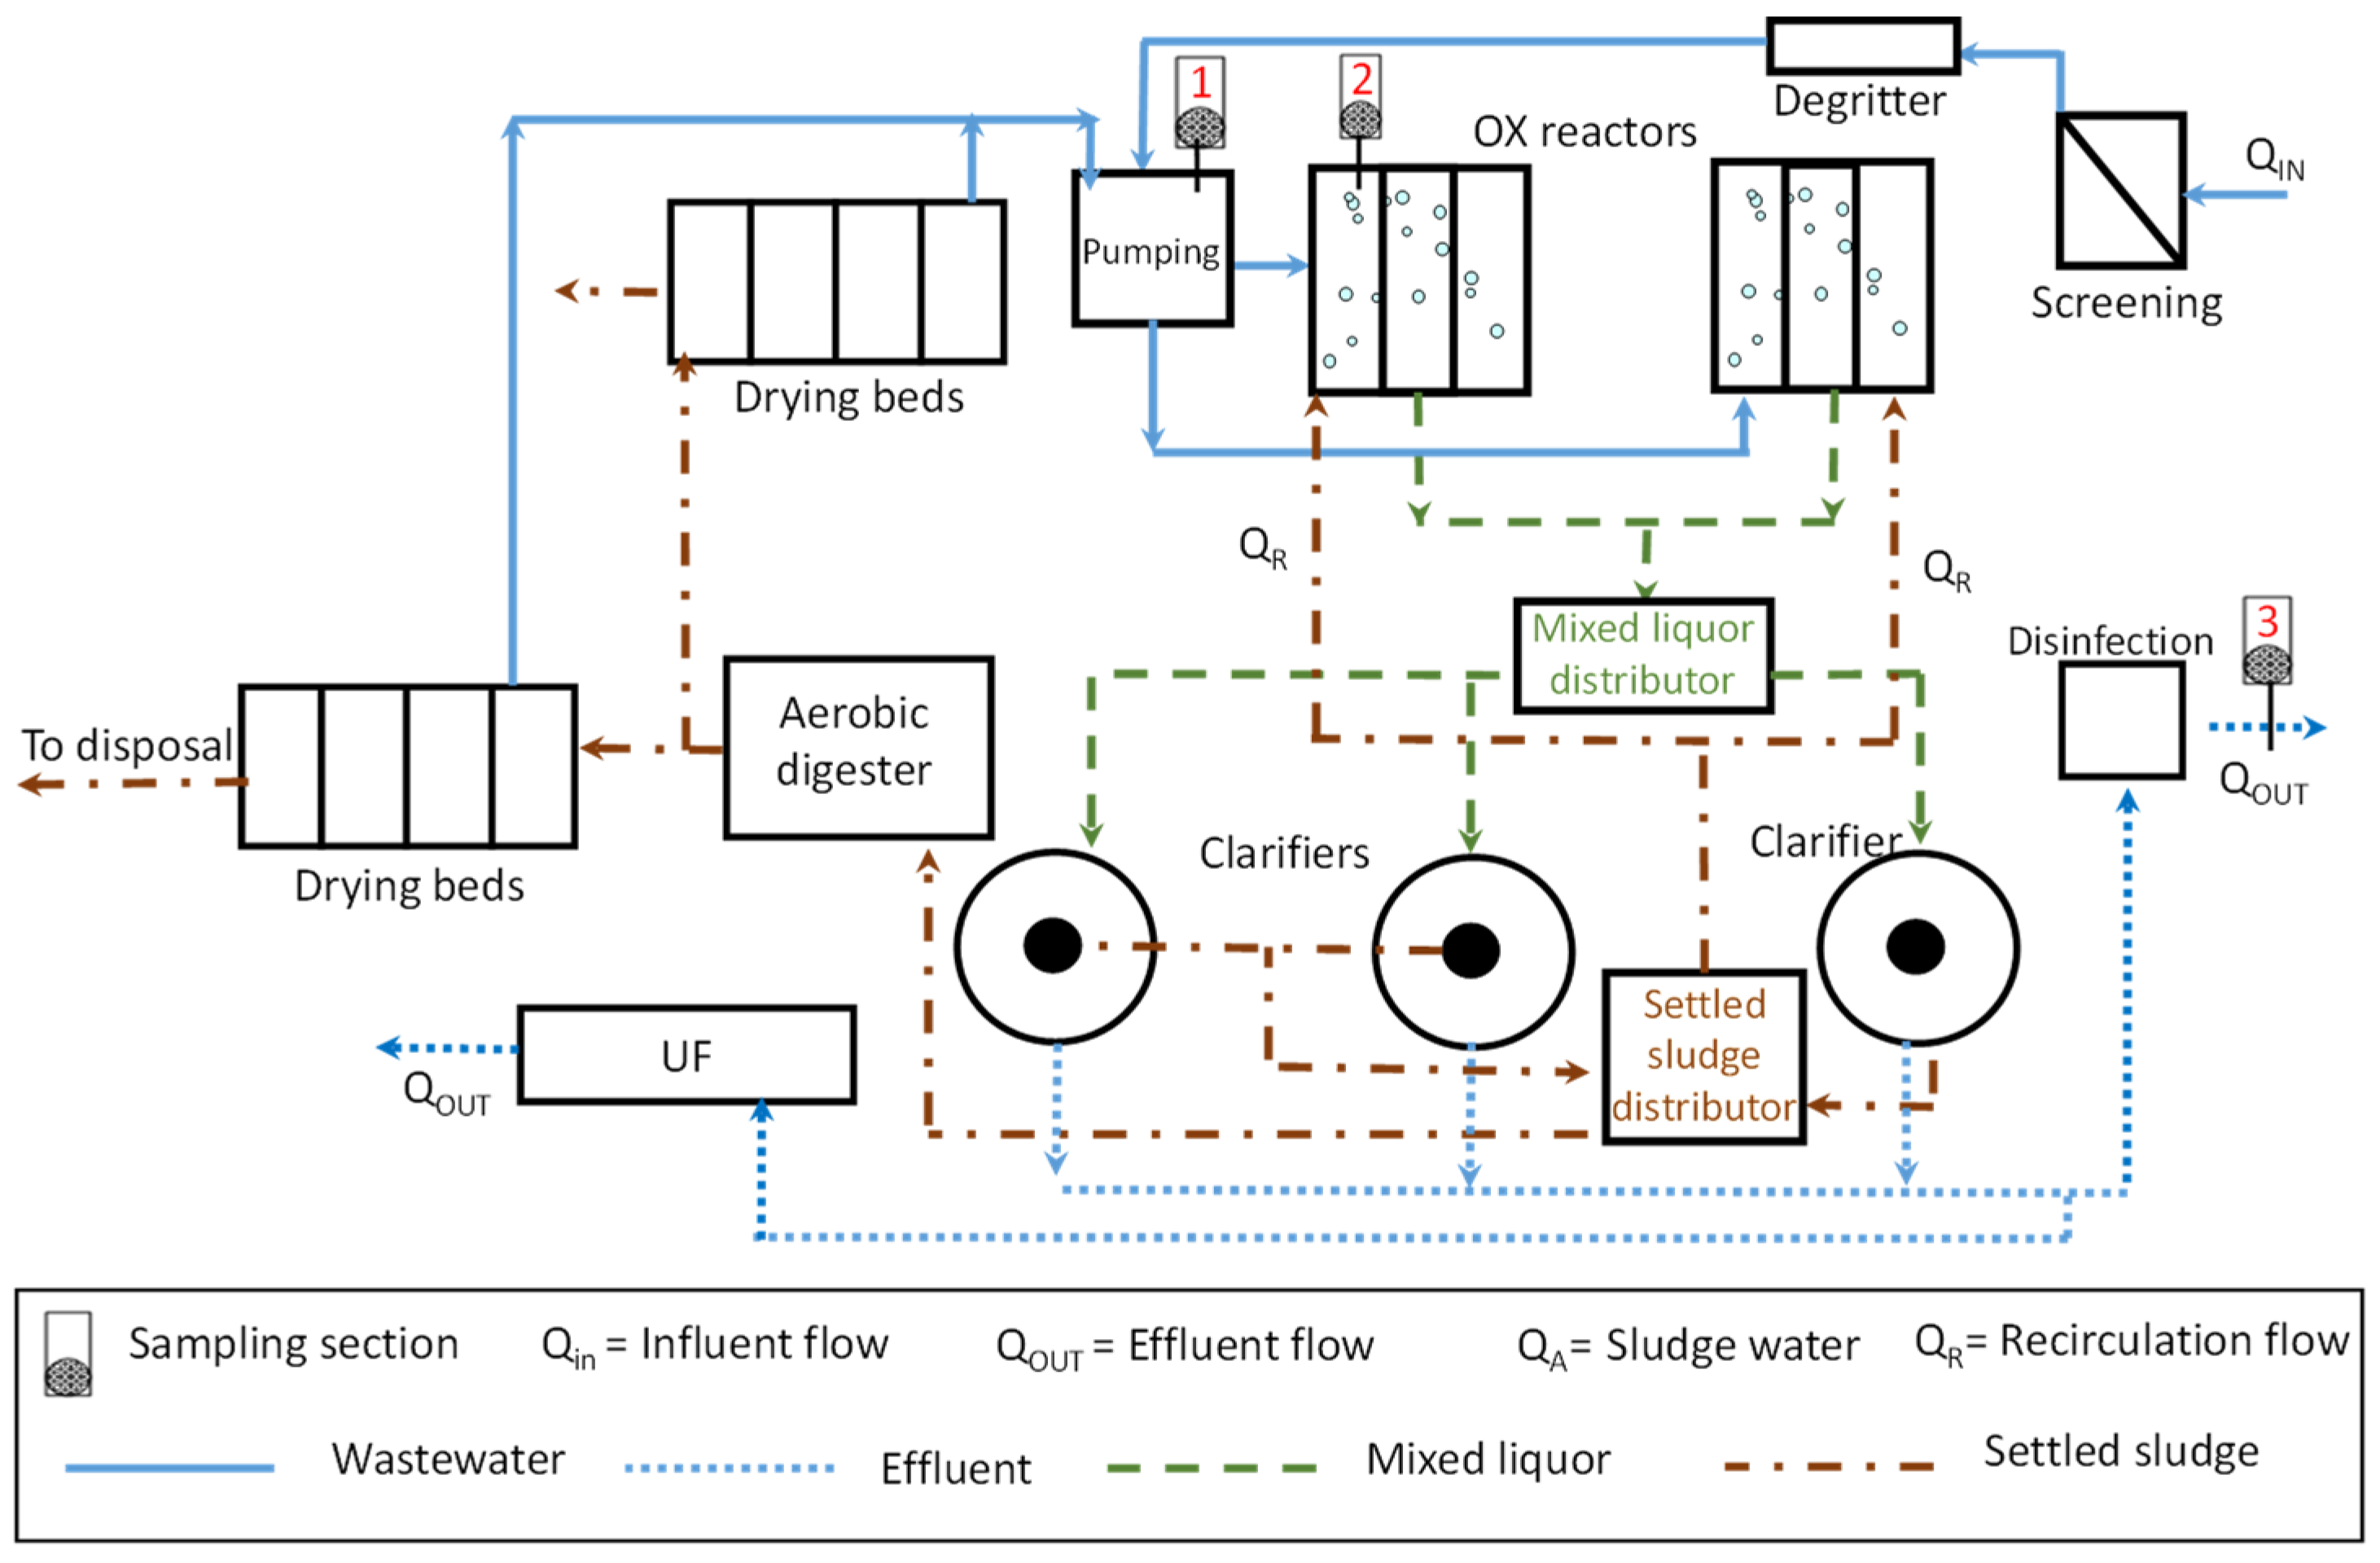
3.2. Marineo WWTP
4. Materials and Methods
4.1. Historical Data Analysis and Monitoring Campaign
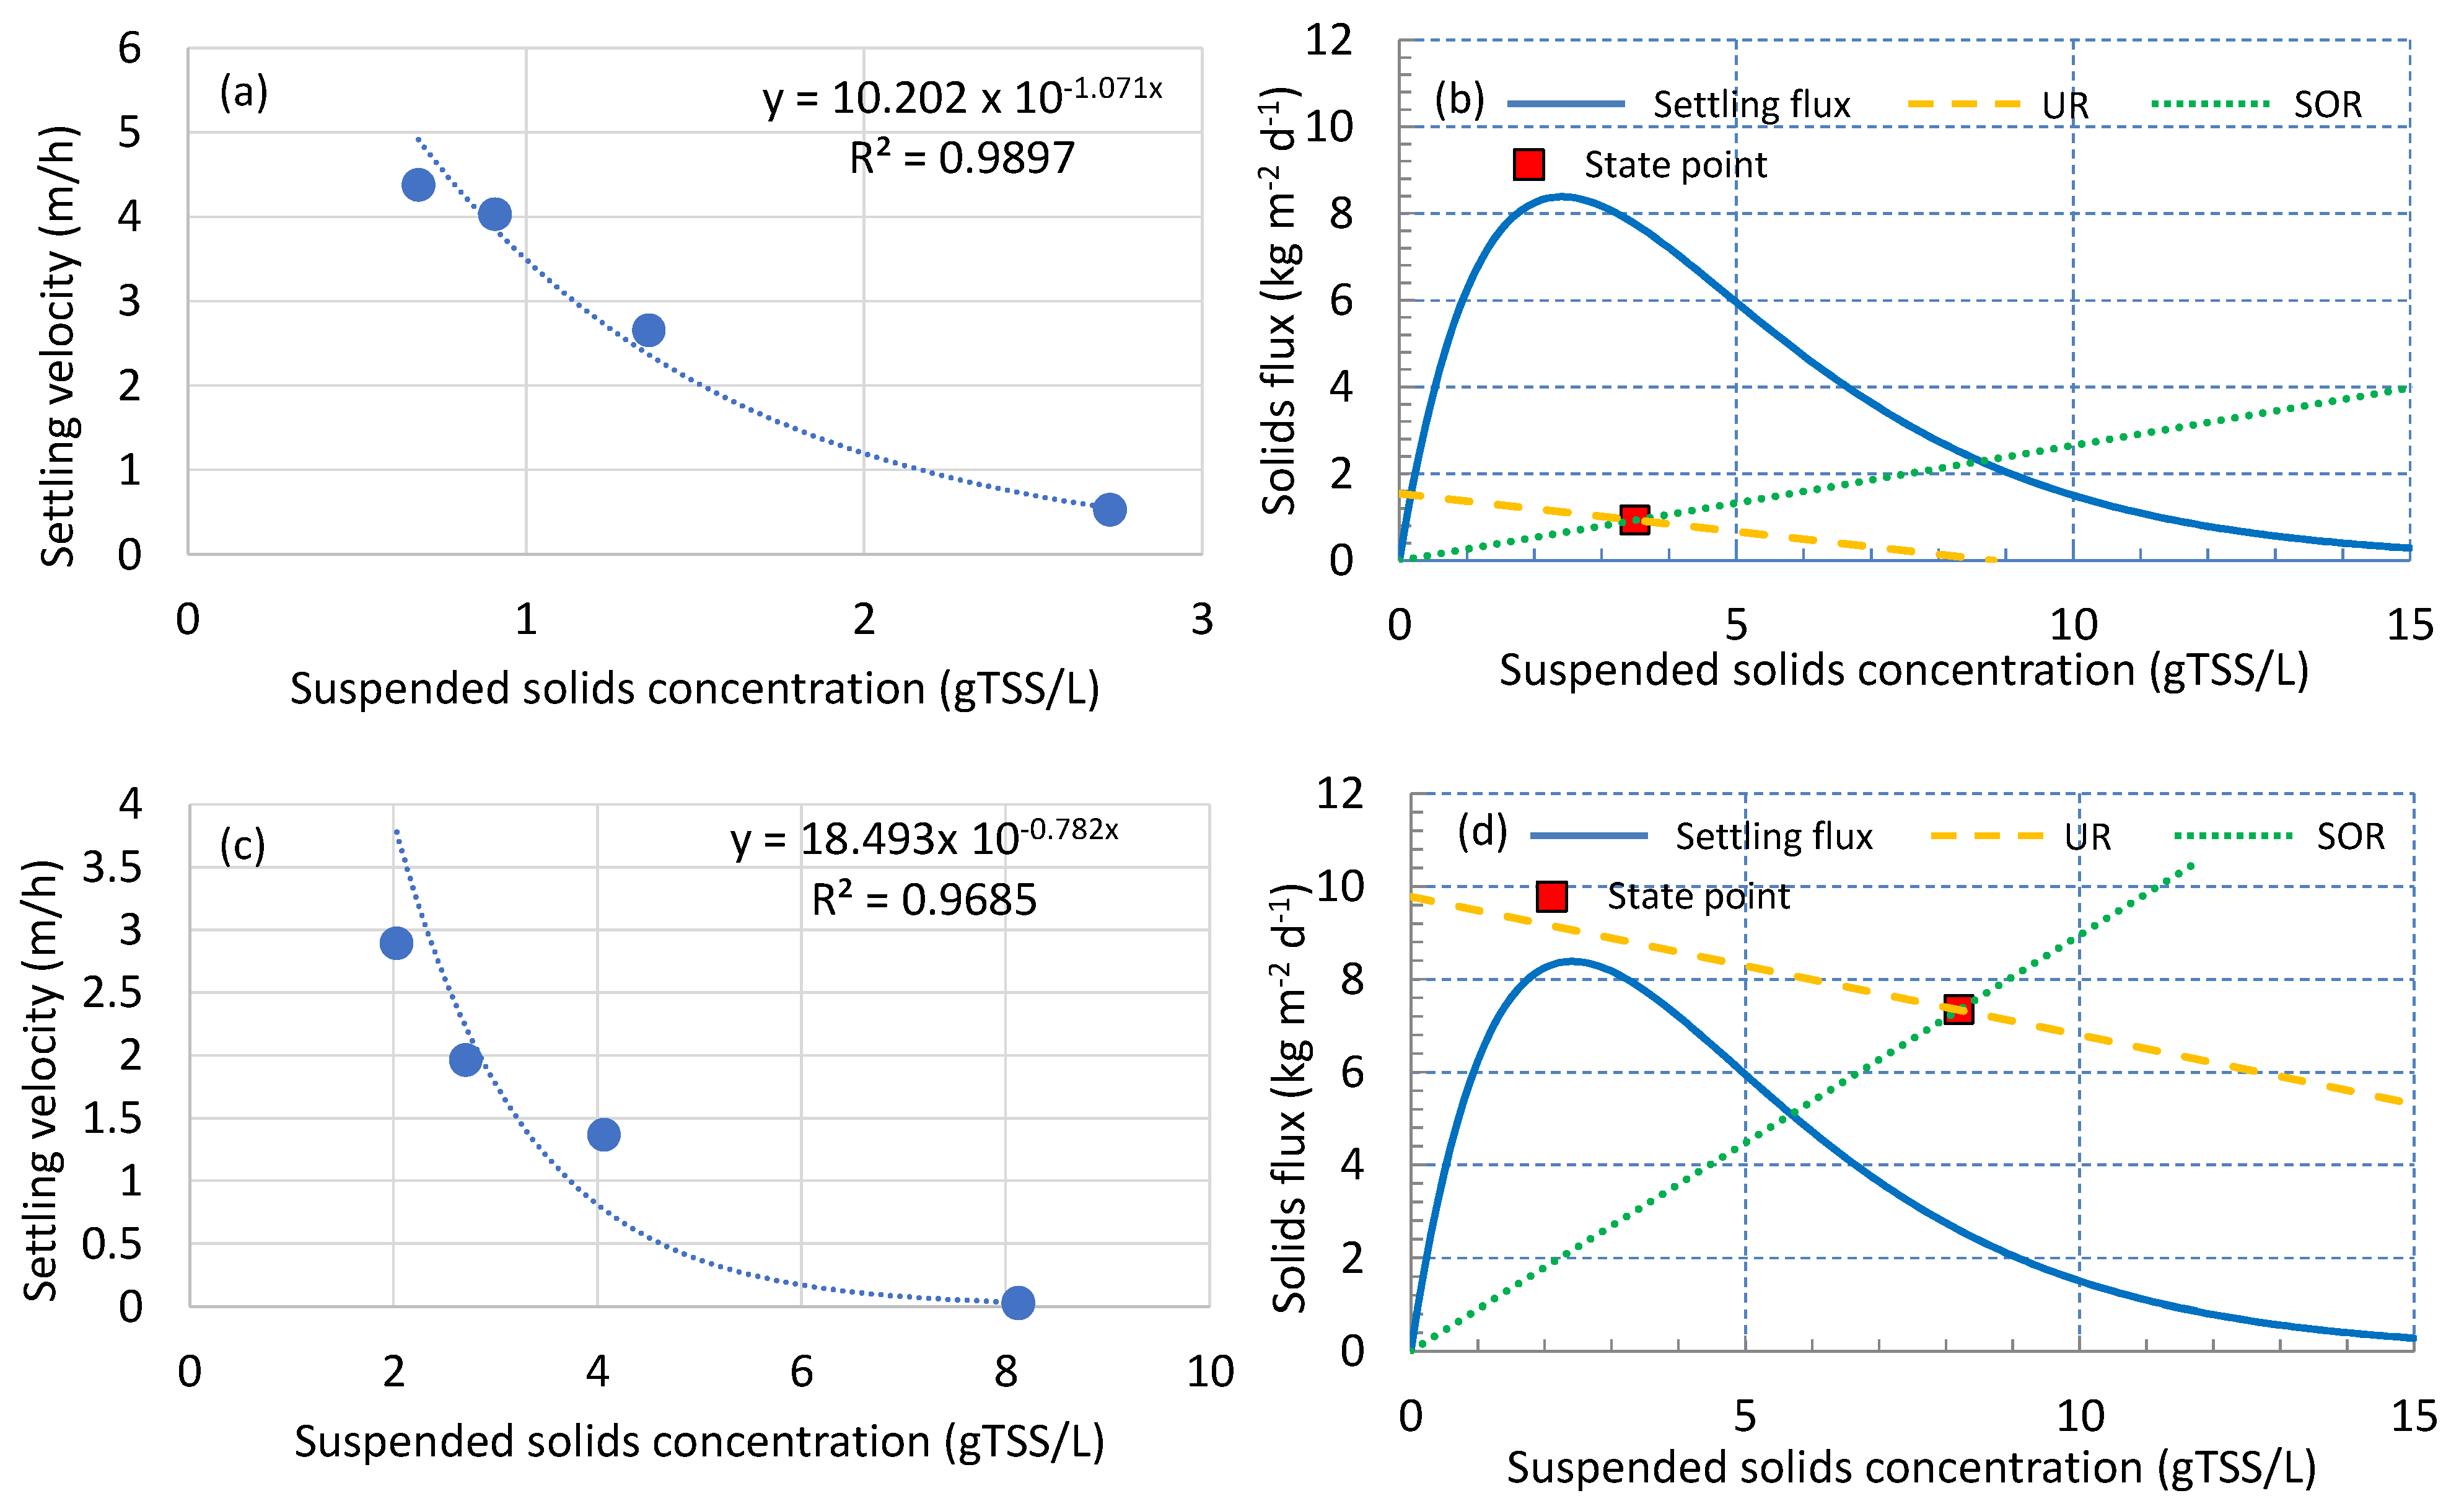
4.2. Clarifier Performance Verification
- ✓
- hydraulic capacity evaluation (detention time, surface overflow rate (SOR) and weir overflow rate (WOR)) and
- ✓
- solids loading capacity or solids loading rate (SLR).
- ✓
- acquire the clarifier data (number of clarifiers in operation, clarifier surface, mixed liquor suspended solid–MLSS concentration, influent flow rate and return activated sludge–RAS flow rate);
- ✓
- build the sludge settling curve representing how the sludge settling velocity varies with the MLSS concentration [27];
- ✓
- build the settling flux curve and
- ✓
- draw the settling flux curve, SOR and UR line in a graph and identify the state point.
- SSV30 = 30-min settle sludge volume (mL),
- X = mixed liquor suspended solids concentration (mg/L) and
- VT = volume of the settle column.
- DSV30 = 30-min settled sludge volume of diluted sludge and
- Xd = mixed liquor suspended solids concentration (mg/L) after dilution.
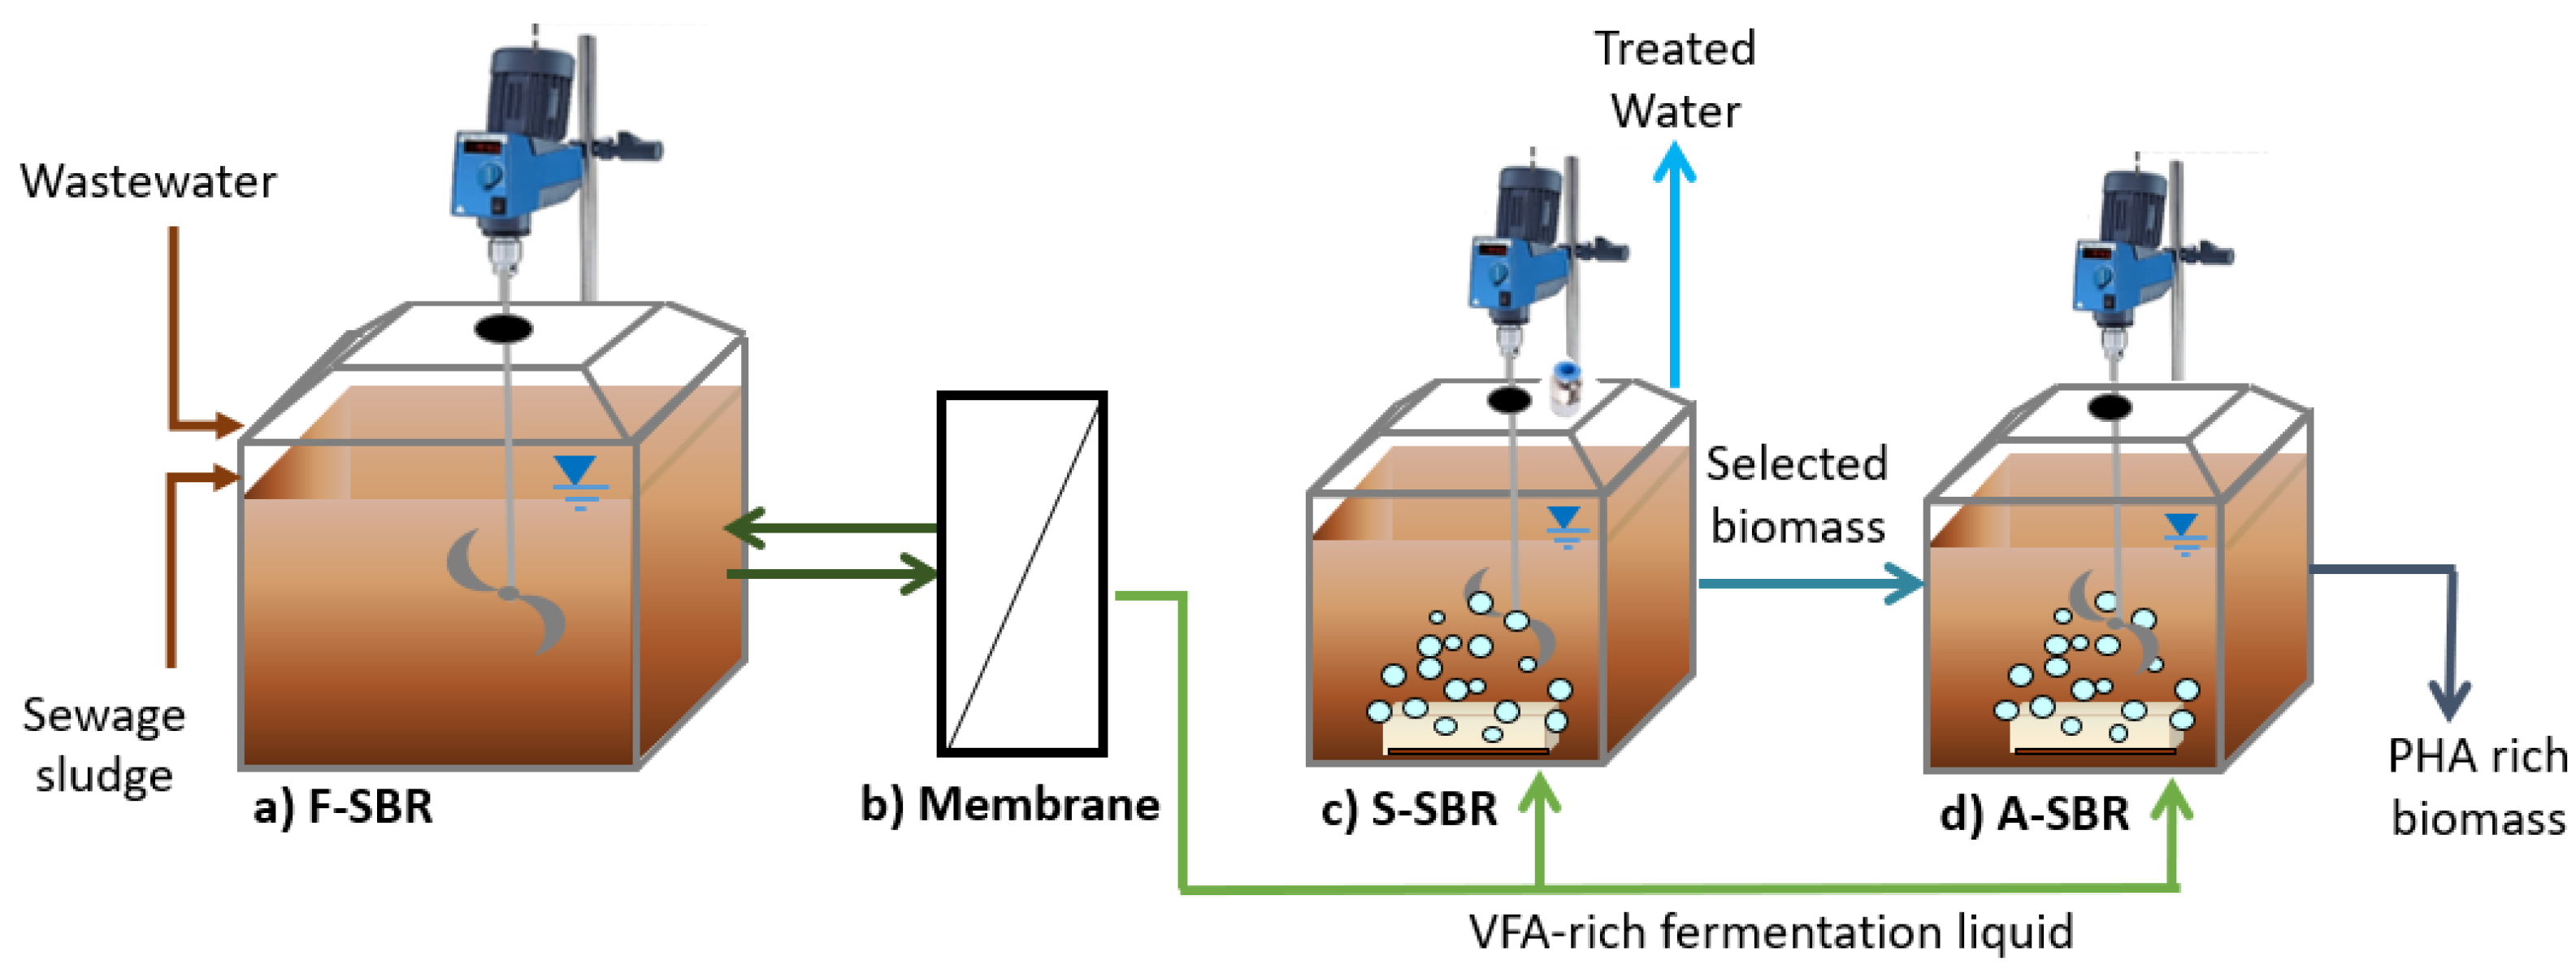
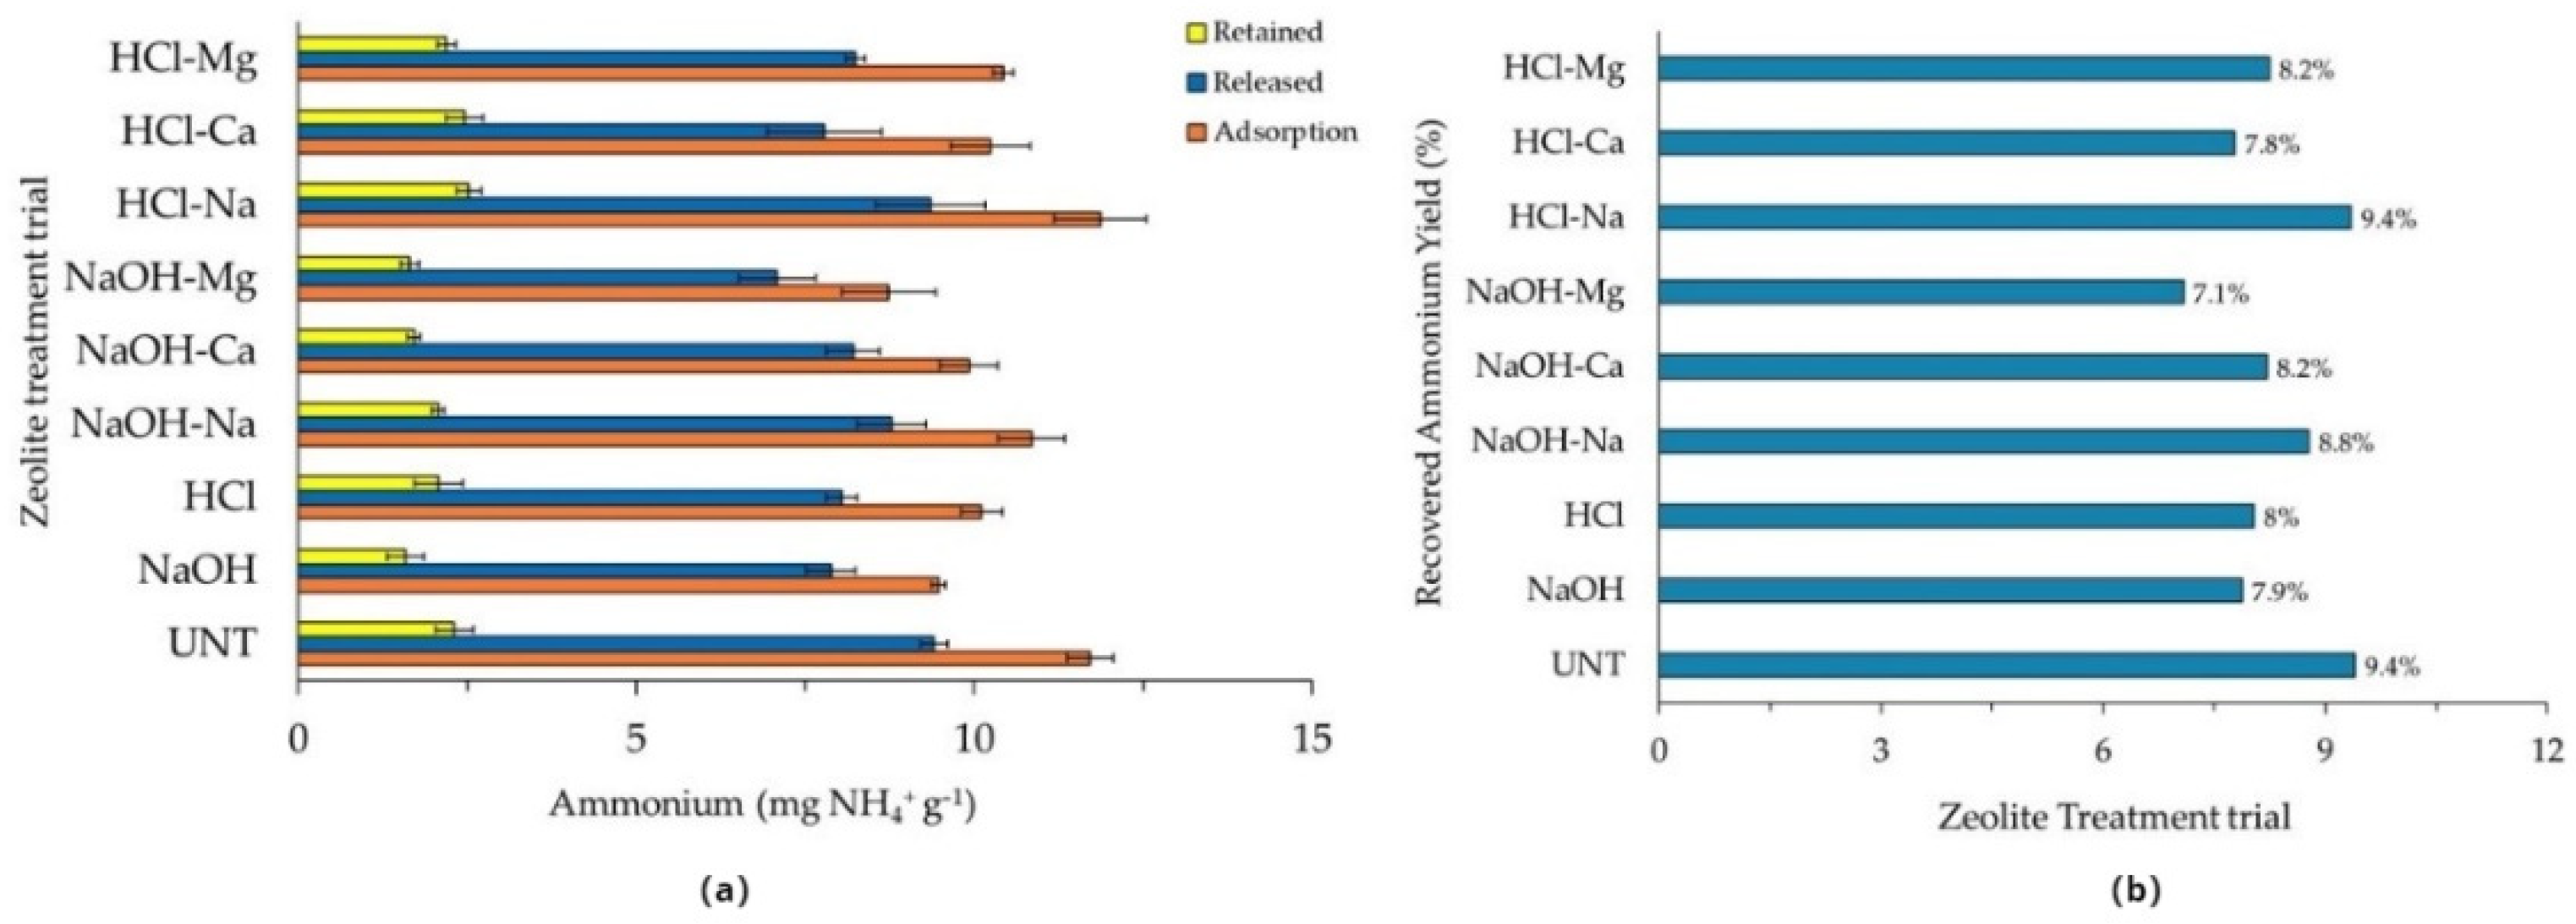
4.3. Batch Tests
4.4. Governance Analysis
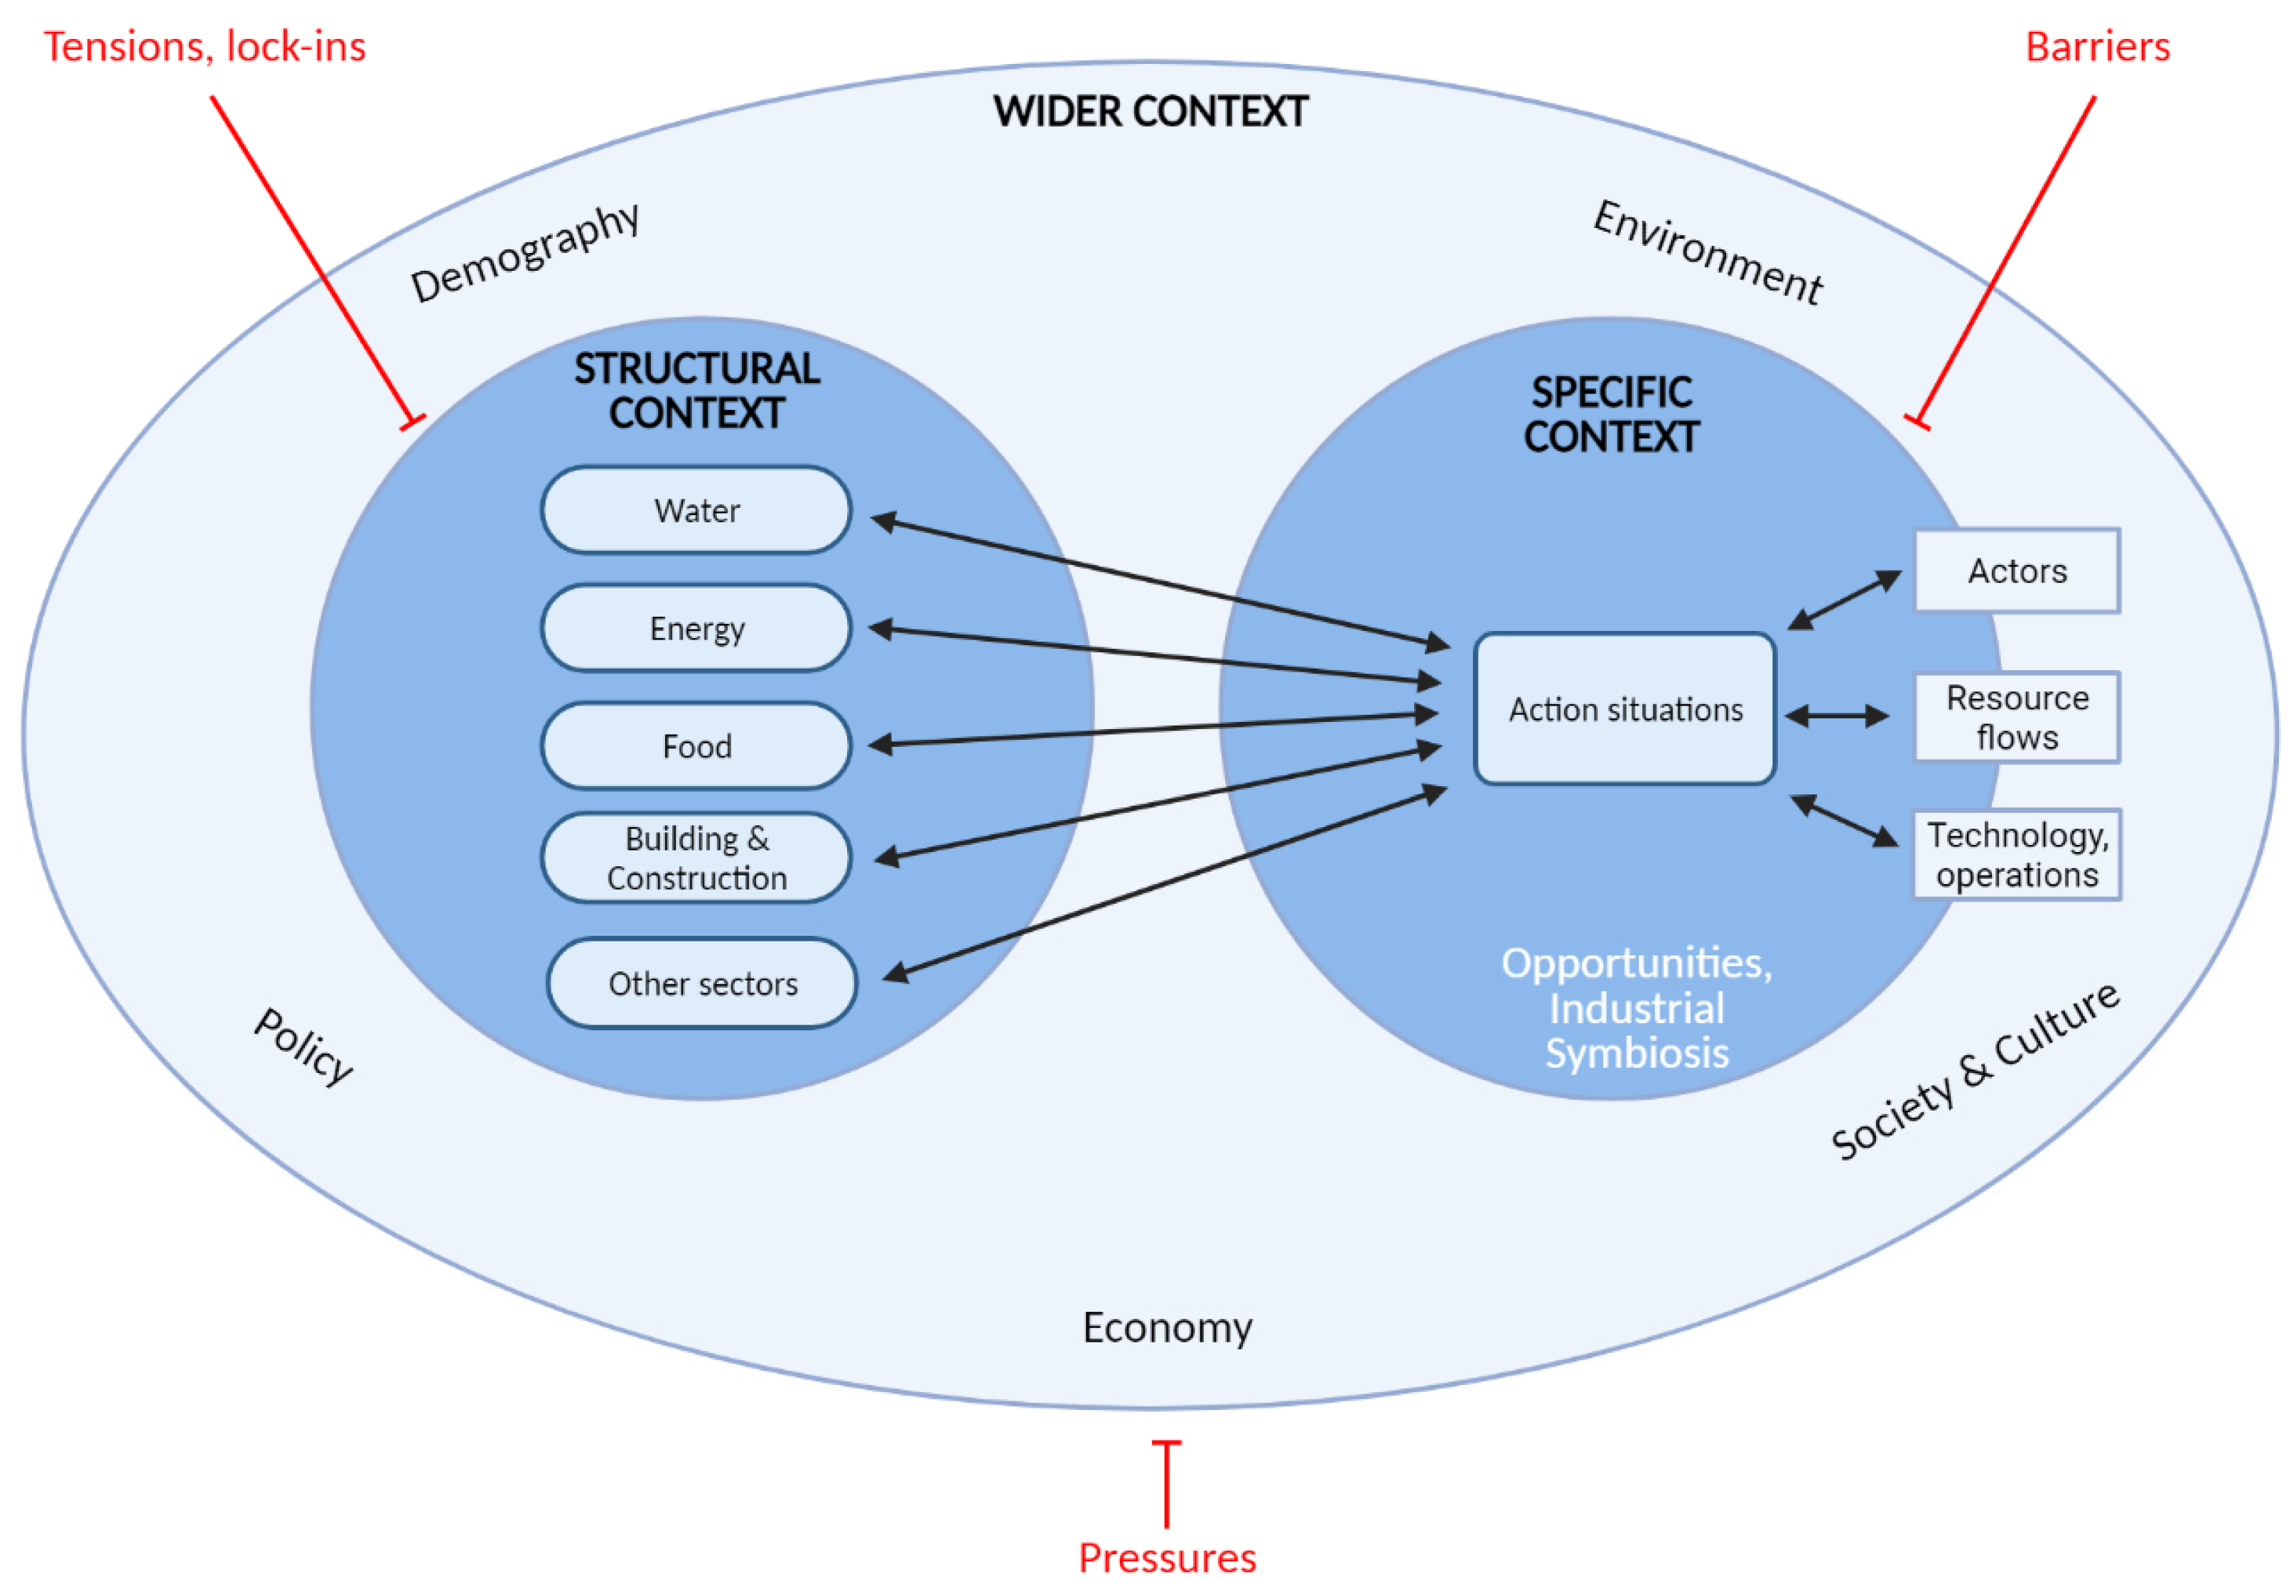
- The wider context refers to a broad view of the political, economic, social and cultural scenarios in which governance regimes are situated and includes the effects of market dynamics and environmental changes. To describe it, the focus is on five key aspects, namely: Sociocultural Scenario, Population and Urbanization, Environmental Challenges, Political Context and Economic Conditions.
- The structural context includes the established governance regime and related rights of ownership and use, as well as the prevailing practices that characterize the current situation. To describe this context, six fundamental aspects are considered, namely: Levels and Scales, Prevailing Technologies, Actors and Networks, Perspectives and Ambitions, Strategies and Tools and Accountability and Resources. The main barriers to overcome are “Tensions” and “Lock-ins”. A Community of Practice (CoP) was established in order to form a group of professionals, experts, companies and associations orbiting around the main themes of the project. The CoP will be used to share the perspectives of water utilities, solution providers and stakeholders from different industry sectors to jointly develop the technical, marketing and commercial aspects of the water-smart systems.
- Context-specific deals with assessing the factors directly related to the case studies, such as the geographical location of the systems and their histories, which consist of a previous decision-making and framing process. At this level, the aspects to be evaluated are previous decisions and case-specific circumstances.
5. Preliminary Results
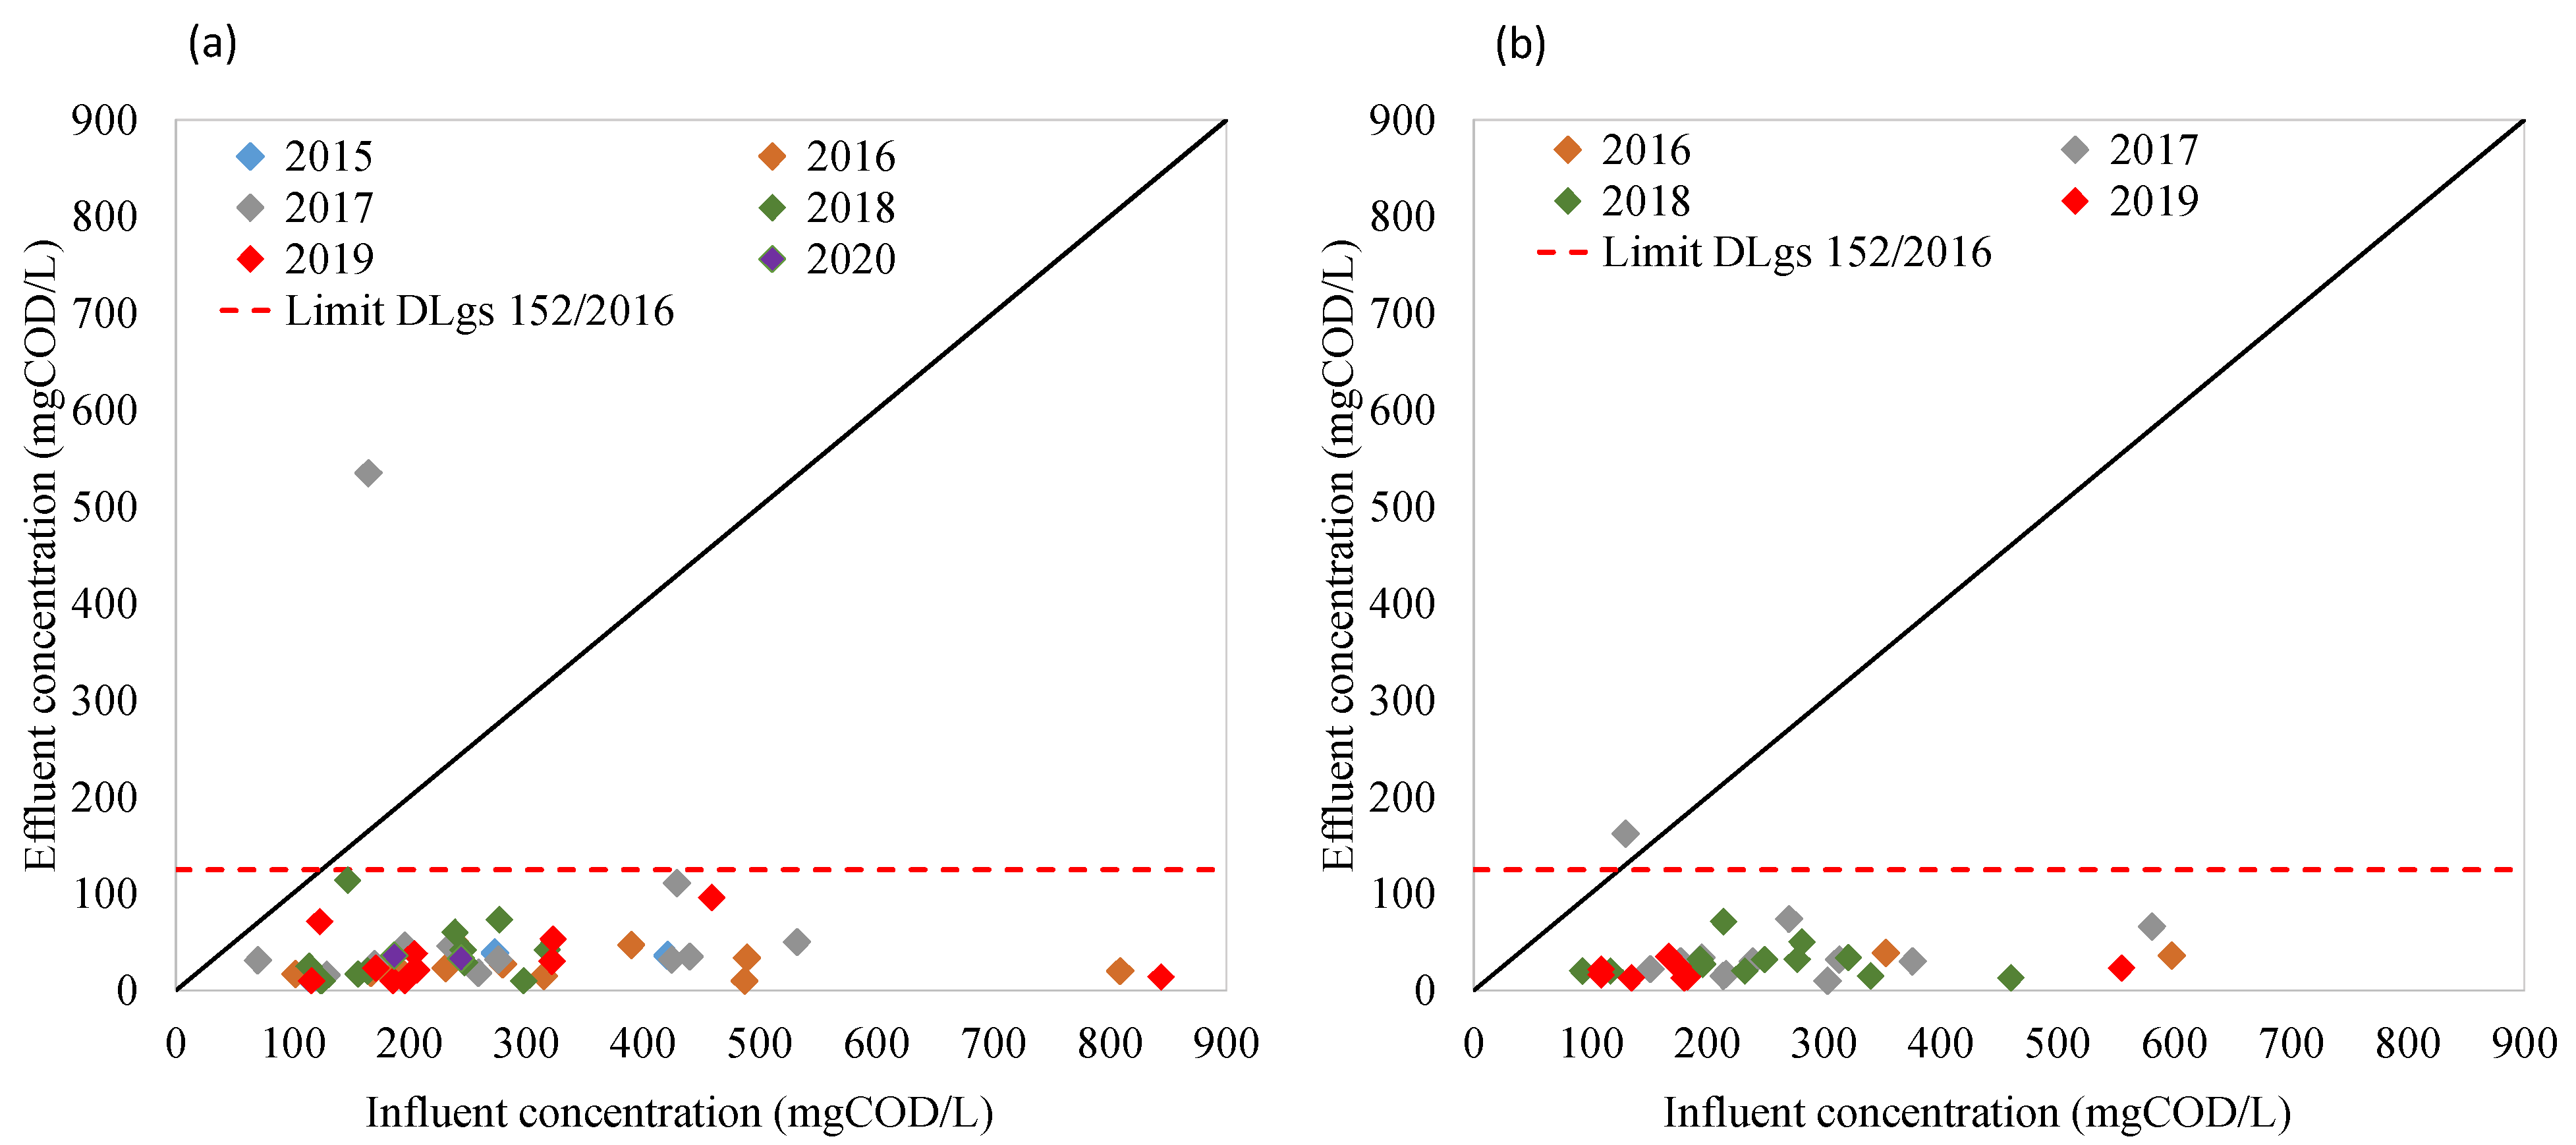
5.1. Brief Analysis of Historical Data
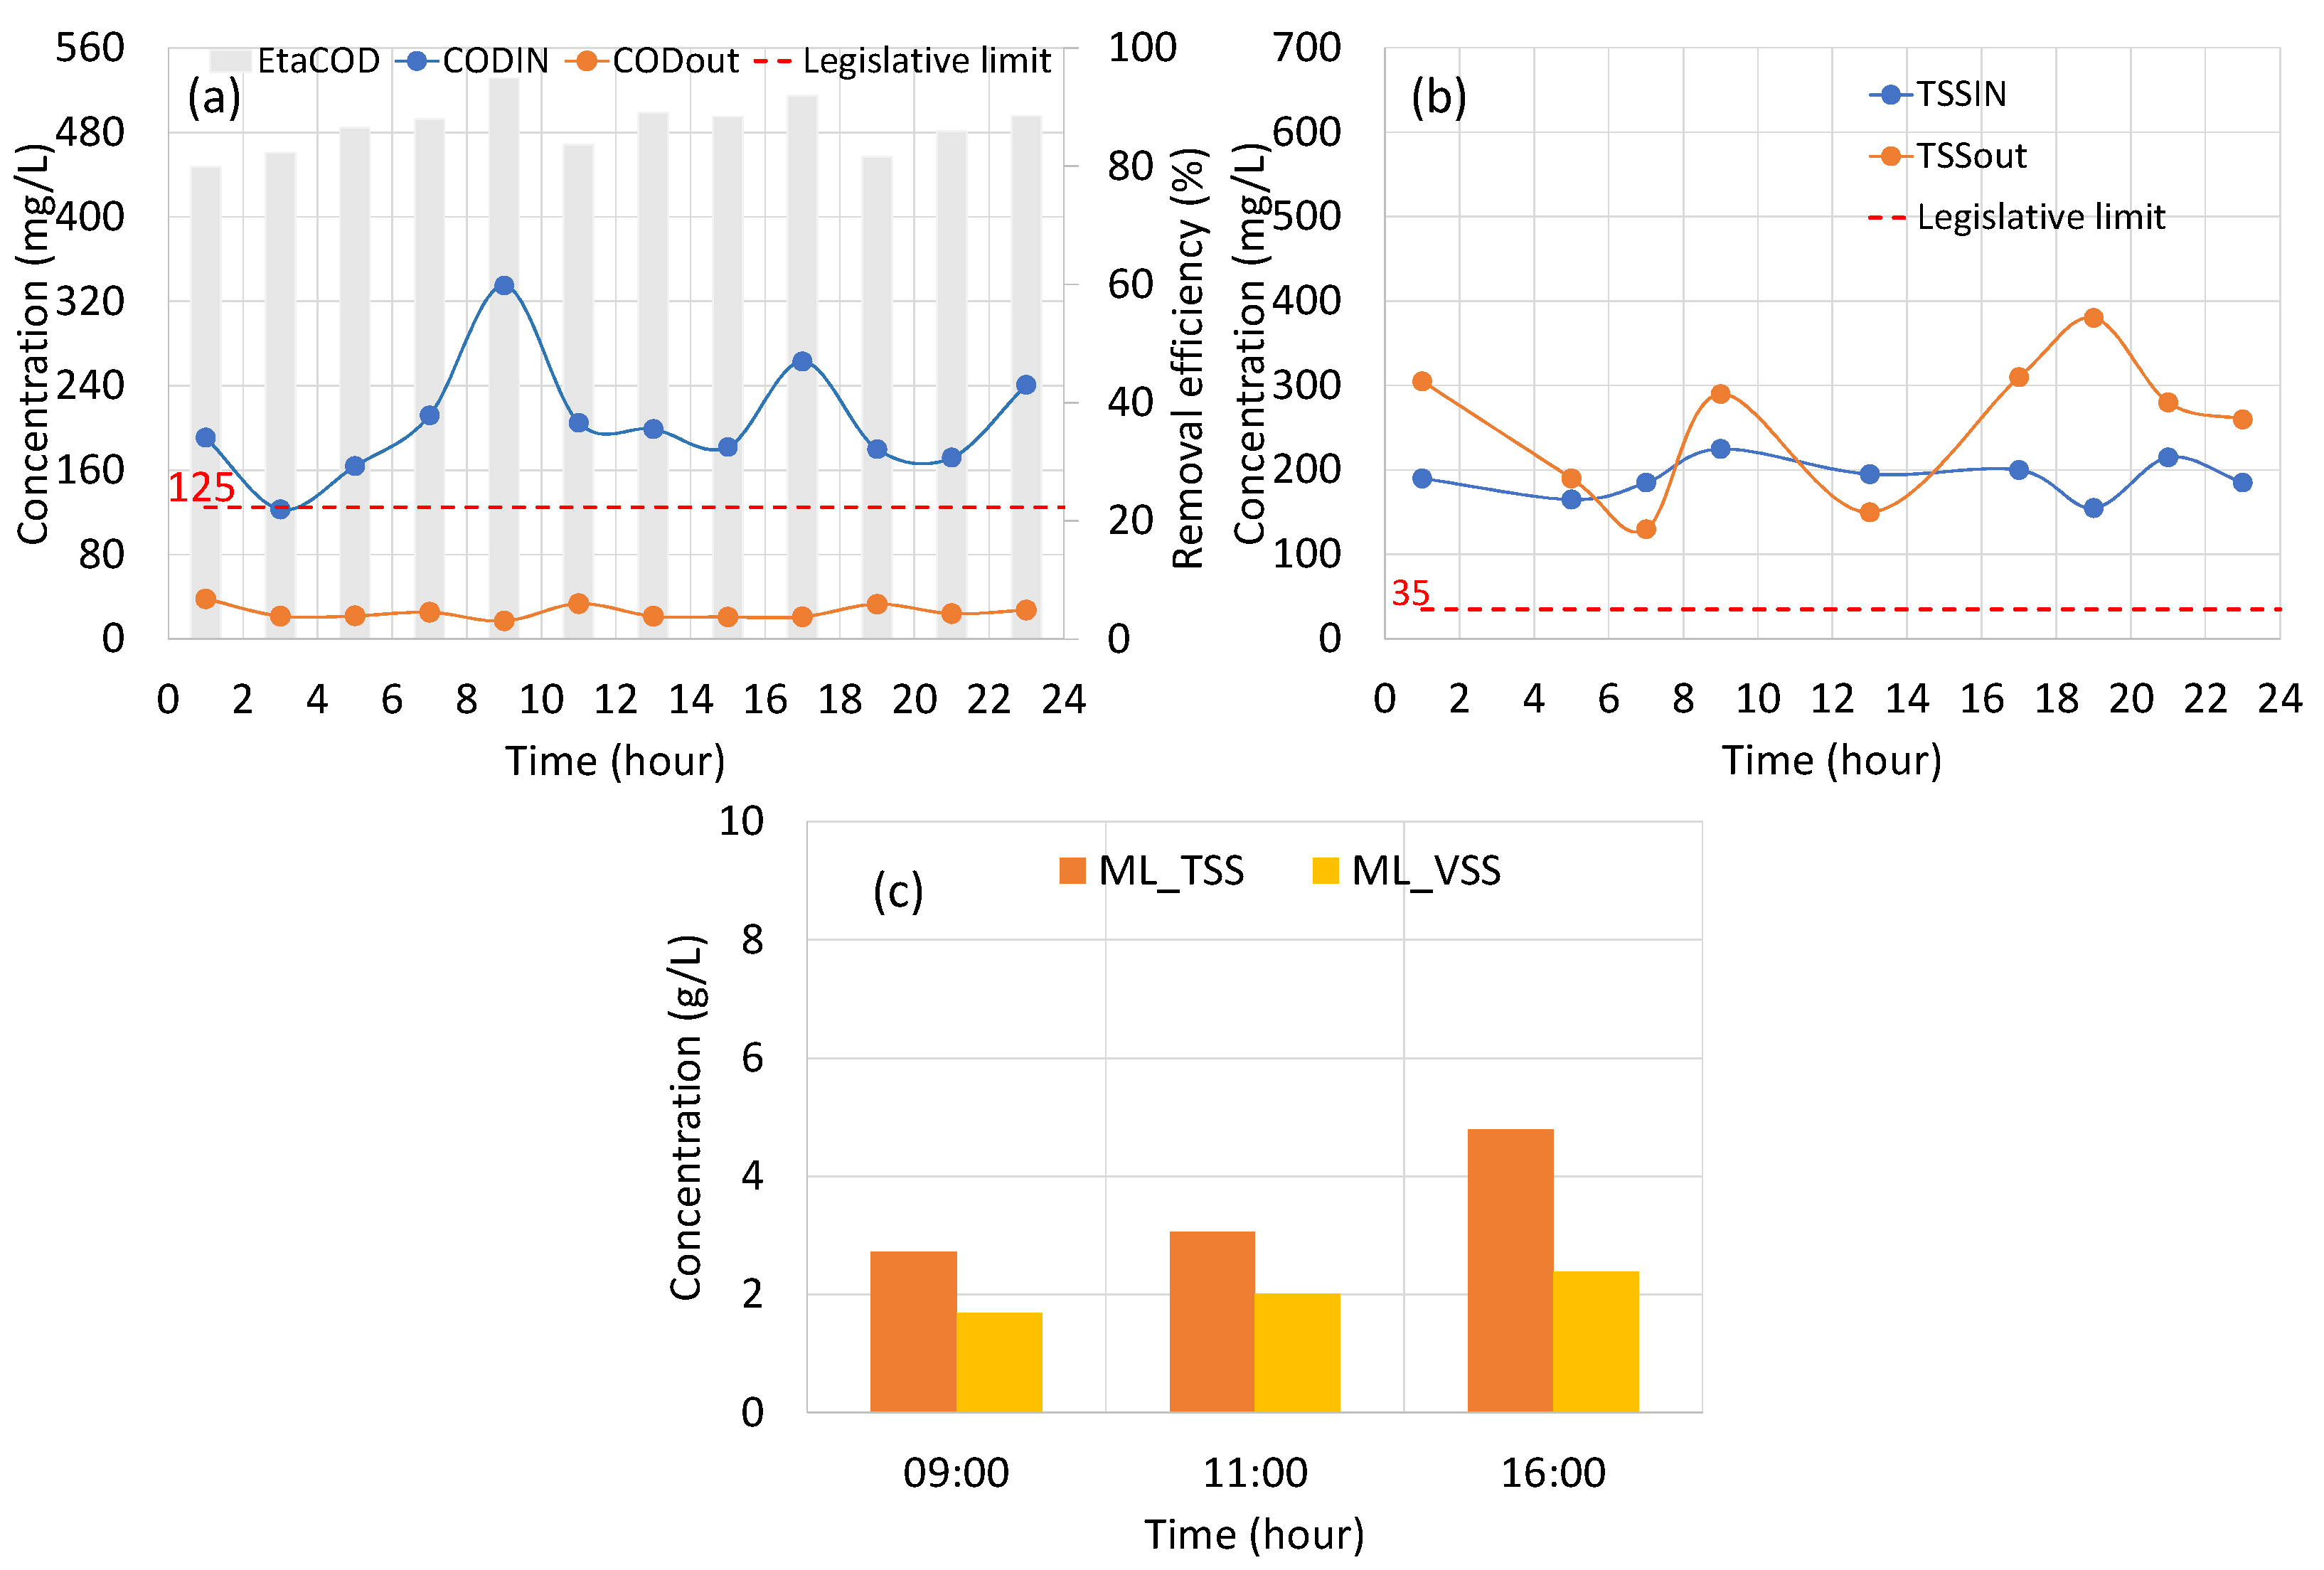
5.2. Monitoring Campaign Results for Corleone and Marineo WWTPs
5.3. Clarifier Verification for Corleone and Marineo WWTPs
5.4. Batch Test Preliminary Results
5.5. COGIWA Application
6. Conclusions
Author Contributions
Funding
Institutional Review Board Statement
Informed Consent Statement
Data Availability Statement
Conflicts of Interest
References
- Mannina, G.; Badalucco, L.; Barbara, L.; Cosenza, A.; di Trapani, D.; Gallo, G.; Laudicina, V.A.; Marino, G.; Muscarella, S.M.; Presti, D.; et al. Enhancing a transition to a circular economy in the water sector: The EU project wider uptake. Water 2021, 13, 946. [Google Scholar] [CrossRef]
- Metcalf & Eddy; Burton, F.L.; Stensel, H.D.; Tchobanoglous, G.I. Wastewater Engineering: Treatment and Reuse; McGraw-Hill Professional: New York, NY, USA, 2003. [Google Scholar]
- Van Loosdrecht, M.C.M.; Brdjanovic, D. Anticipating the next century of wastewater treatment. Science 2014, 344, 1452–1453. [Google Scholar] [CrossRef]
- Guest, J.S.; Skerlos, S.J.; Barnard, J.L.; Beck, M.B.; Daigger, G.T.; Hilger, H.; Jackson, S.J.; Karvazy, K.; Kelly, L.; Macpherson, L.; et al. A new planning and design paradigm to achieve sustainable resource recovery from wastewater. Environ. Sci. Technol. 2009, 43, 6126–6130. [Google Scholar] [CrossRef] [Green Version]
- Puyol, D.; Batstone, D.J.; Hülsen, T.; Astals, S.; Peces, M.; Krömer, J.O. Resource recovery from wastewater by biological technologies: Opportunities, challenges, and prospects. Front. Microbiol. 2017, 7, 2106. [Google Scholar] [CrossRef] [PubMed] [Green Version]
- Nielsen, P.H. Microbial biotechnology and circular economy in wastewater treatment. Microb. Biotechnol. 2017, 10, 1102–1105. [Google Scholar] [CrossRef] [Green Version]
- Nizami, A.S.; Rehan, M.; Waqas, M.; Naqvi, M.; Ouda, O.K.M.; Shahzad, K.; Miandad, R.; Khan, M.Z.; Syamsiro, M.; Ismail, I.M.I.; et al. Waste biorefineries: Enabling circular economies in developing countries. Bioresour. Technol. 2017, 241, 1101–1117. [Google Scholar] [CrossRef] [PubMed]
- Neczaj, E.; Grosser, A. Circular Economy in Wastewater Treatment Plant–Challenges and Barriers. Proceedings 2018, 2, 614. [Google Scholar] [CrossRef] [Green Version]
- Kehrein, P.; van Loosdrecht, M.; Osseweijer, P.; Garfí, M.; Dewulf, J.; Posada, J. A critical review of resource recovery from municipal wastewater treatment plants-market supply potentials, technologies and bottlenecks. Environ. Sci. Water Res. Technol. 2020, 6, 877–910. [Google Scholar] [CrossRef] [Green Version]
- Regmi, P.; Maere, T.; Stewart, H.; Amerlinck, Y.; Samstag, R.; Rieger, L.; Jimenez, J.; Johnson, B.; Vanrolleghem, P.A.; Takács, I.; et al. The future of WRRF modelling—Outlook and challenges. Water Sci. Technol. 2018, 79, 3–14. [Google Scholar] [CrossRef]
- Pott, R.; Johnstone-Robertson, M.; Verster, B.; Rumjeet, S.; Nkadimeng, L.; Raper, T.; Rademeyer, S.; Harrison, S.T.L. Wastewater Biorefineries: Integrating Water Treatment and Value Recovery. In The Nexus: Energy, Environment and Climate Change. Green Energy and Technology; Leal Filho, W., Surroop, D., Eds.; Springer: Cham, Switzerland, 2018; pp. 289–302. [Google Scholar]
- Verster, B.; Minnaar, S.; Cohen, B. Introducing the Wastewater Biorefinery Concept: A Scoping Study of Poly-Glutamic Acid Production from a Bacillus—Rich Mixed Culture Using Municipal Wastewater; Water Research Commission Report TT587/13; Water Research Commission: Pretoria, South Africa, 2014. [Google Scholar]
- Coats, E.R.; Wilson, P.I. Toward Nucleating the Concept of the Water Resource Recovery Facility (WRRF): Perspective from the Principal Actors. Environ. Sci. Technol. 2017, 51, 4158–4164. [Google Scholar] [CrossRef]
- Daigger, G.T. Evolving Urban Water and Residuals Management Paradigms: Water Reclamation and Reuse, Decentralization, and Resource Recovery. Water Environ. Res. 2009, 81, 809–823. [Google Scholar] [CrossRef] [PubMed]
- Bozkurt, H.; Gernaey, K.V.; Sin, G. Superstructure-Based Optimization Tool for Plant Design and Retrofitting. In Innovative Wastewater Treatment & Resource Recovery Technologies: Impacts on Energy, Economy and Environment; IWA Publishing: London, UK, 2017. [Google Scholar]
- Peter, J.; der Hoek, V.; de Fooij, H.; Struker, A. Wastewater as a resource: Strategies to recover resources from Amsterdam’s wastewater. Resour. Conserv. Recycl. 2016, 113, 53–64. [Google Scholar]
- Alcalde Sanza, L.; Gawlik, B.M. Water Reuse in Europe: Relevant guidelines, needs for and barriers to innovation; JRC Science and Policy Report; Publications Office of the European Union: Luxembourg, 2014; pp. 1–18.
- Karlikanovaite-Balikçi, A.; Yağci, N. A review on promising strategy to decrease sludge production: Oxic-Settling-Anoxic/anaerobic process. Environ. Res. Technol. 2020, 3, 81–91. [Google Scholar] [CrossRef]
- Wang, K.; Zhou, Z.; Zheng, Y.; Jiang, J.; Huang, J.; Qiang, J.; An, Y.; Jiang, L.; Jiang, L.M.; Wang, Z. Understanding mechanisms of sludge in situ reduction in anaerobic side-stream reactor coupled membrane bioreactors packed with carriers at different filling fractions. Bioresour. Technol. 2020, 316, 123925. [Google Scholar] [CrossRef]
- Lin, L.; Lei, Z.; Wang, L.; Liu, X.; Zhang, Y.; Wan, C.; Lee, D.J.; Tay, J.H. Adsorption mechanisms of high-levels of ammonium onto natural and NaCl-modified zeolites. Sep. Purif. Technol. 2013, 103, 15–20. [Google Scholar] [CrossRef] [Green Version]
- Morgan-Sagastume, F.; Hjort, M.; Cirne, D.; Gérardin, F.; Lacroix, S.; Gaval, G.; Karabegovic, L.; Alexandersson, T.; Johansson, P.; Karlsson, A.; et al. Integrated production of polyhydroxyalkanoates (PHAs) with municipal wastewater and sludge treatment at pilot scale. Bioresour. Technol. 2015, 181, 78–89. [Google Scholar] [CrossRef]
- Moretto, G.; Russo, I.; Bolzonella, D.; Pavan, P.; Majone, M.; Valentino, F. An urban biorefinery for food waste and biological sludge conversion into polyhydroxyalkanoates and biogas. Water Res. 2020, 170, 115371. [Google Scholar] [CrossRef]
- Montiel-Jarillo, G.; Gea, T.; Artola, A.; Fuentes, J.; Carrera, J.; Suárez-Ojeda, M.E. Towards PHA Production from Wastes: The Bioconversion Potential of Different Activated Sludge and Food Industry Wastes into VFAs Through Acidogenic Fermentation. Waste Biomass Valorization 2021, 12, 6861–6873. [Google Scholar] [CrossRef]
- Xin, X.; He, J.; Li, L.; Qiu, W. Enzymes catalyzing pre-hydrolysis facilitated the anaerobic fermentation of waste activated sludge with acidogenic and microbiological perspectives. Bioresour. Technol. 2018, 250, 69–78. [Google Scholar] [CrossRef] [PubMed]
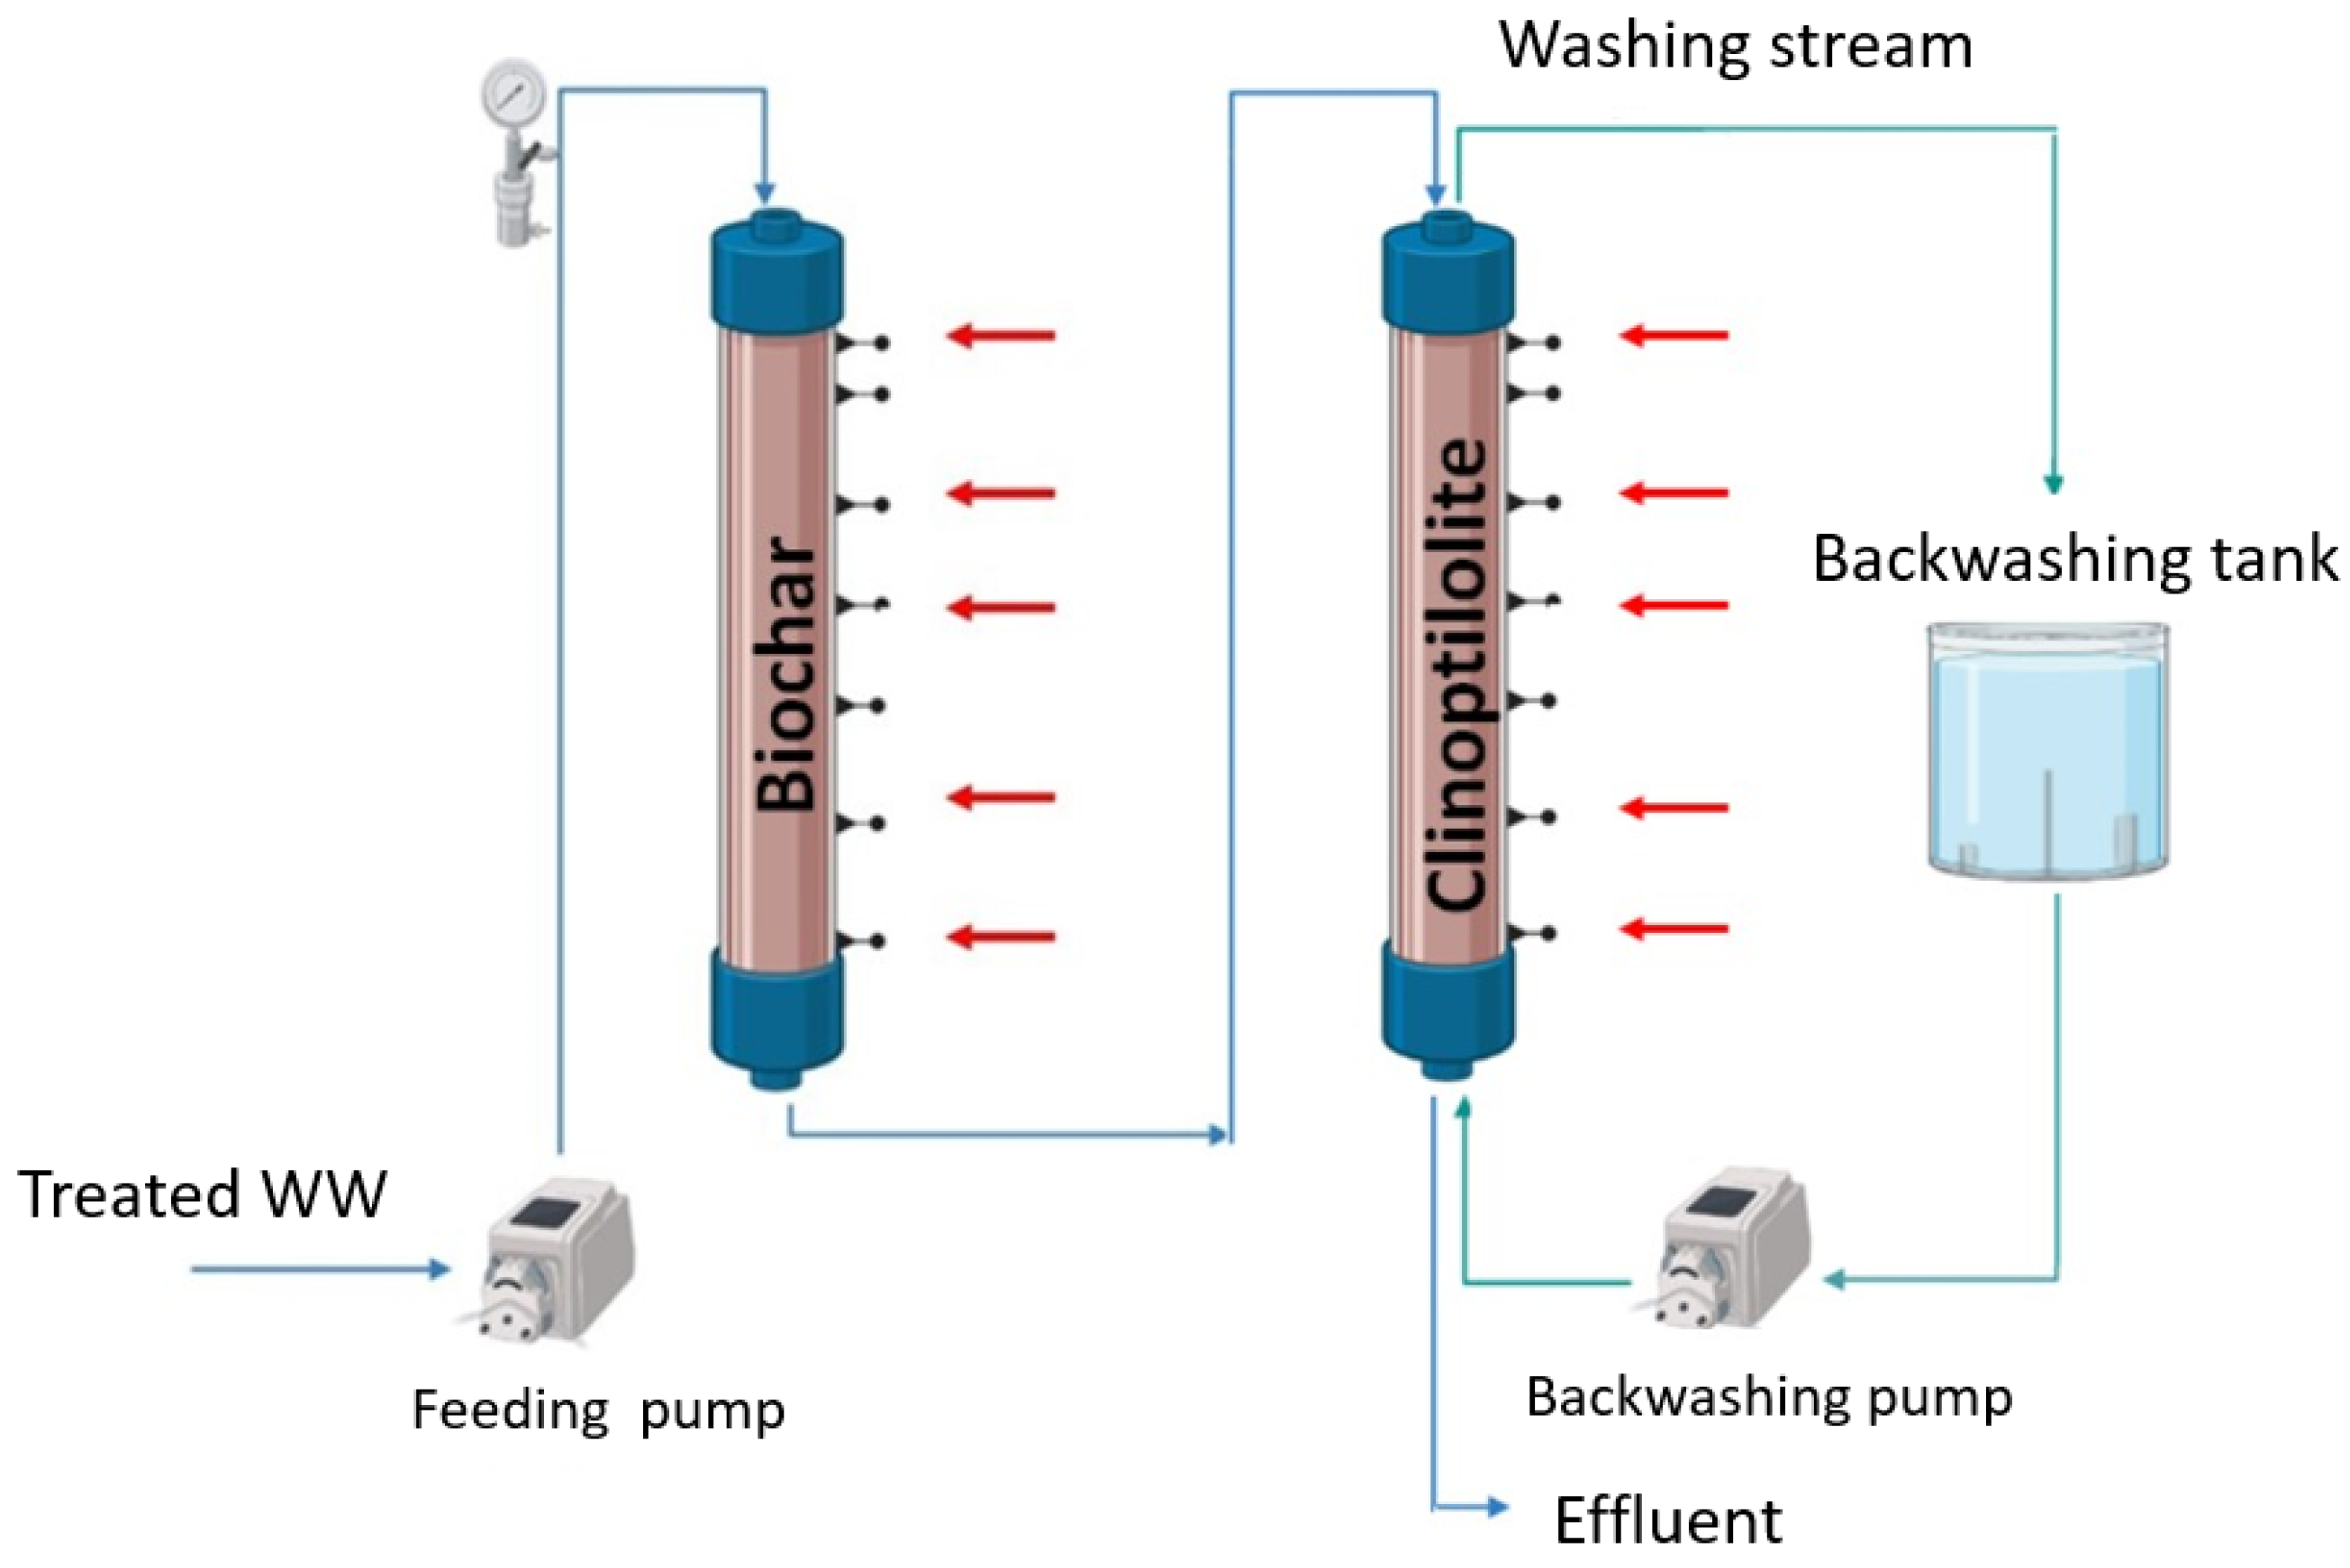
- Nobaharan, K.; Novair, S.B.; Lajayer, B.A.; van Hullebusch, E.D. Phosphorus removal from wastewater: The potential use of biochar and the key controlling factors. Water 2021, 13, 517. [Google Scholar] [CrossRef]
- Keinath, T.M. Operational Dynamics and Control of Secondary Clarifiers. J. Water Pollut. Control Fed. 1985, 57, 770–776. [Google Scholar]
- Ekama, G.A.; Barnard, J.L.; Günthert, F.W. Secondary Settling Tanks: Theory, Modelling, Design and Operation; IWA Publishing: London, UK, 1997. [Google Scholar]
- Grce, M.; Pavelić, K. Antiviral properties of clinoptilolite. Microporous Mesoporous Mater. 2005, 79, 165–169. [Google Scholar] [CrossRef]
- Muscarella, S.M.; Badalucco, L.; Cano, B.; Laudicina, V.A.; Mannina, G. Ammonium adsorption, desorption and recovery by acid and alkaline treated zeolite. Bioresour. Technol. 2021, 341, 125812. [Google Scholar] [CrossRef]
- Presti, D.; Cosenza, A.; Capri, F.C.; Gallo, G.; Alduina, R.; Mannina, G. Influence of volatile solids and pH for the production of volatile fatty acids: Batch fermentation tests using sewage sludge. Bioresour. Technol. 2021, 342, 125853. [Google Scholar] [CrossRef] [PubMed]
- Takács, I.; Patry, G.G.; Nolasco, D. A dynamic model of the clarification-thickening process. Water Res. 1991, 25, 1263–1271. [Google Scholar] [CrossRef]
- Soetardji, J.P.; Claudia, J.C.; Ju, Y.H.; Hriljac, J.A.; Chen, T.Y.; Soetaredjo, F.E.; Santoso, S.P.; Kurniawan, A.; Ismadji, S. Ammonia removal from water using sodium hydroxide modified zeolite mordenite. RSC Adv. 2015, 5, 83689–83699. [Google Scholar] [CrossRef]
- Semmens, M.J.; Martin, W.P. The influence of pretreatment on the capacity and selectivity of clinoptilolite for metal ions. Water Res. 1988, 22, 537–542. [Google Scholar] [CrossRef]
- Yuan, Q.; Sparling, R.; Oleszkiewicz, J.A. VFA generation from waste activated sludge: Effect of temperature and mixing. Chemosphere 2011, 82, 603–607. [Google Scholar] [CrossRef]
- Mannina, G.; Alduina, R.; Badalucco, L.; Barbara, L.; Capri, F.C.; Cosenza, A.; Di Trapani, D.; Gallo, G.; Laudicina, V.A.; Muscarella, S.M.; et al. Water resource recovery facilities (Wrrfs): The case study of Palermo university (Italy). Water 2021, 13, 3413. [Google Scholar] [CrossRef]
- Mannina, G.; Ekama, G.A.; Capodici, M.; Cosenza, A.; Di Trapani, D.; Ødegaard, H. Moving bed membrane bioreactors for carbon and nutrient removal: The effect of C/N variation. Biochem. Eng. J. 2017, 125, 31–40. [Google Scholar] [CrossRef]
- Freni, G.; Mannina, G. Uncertainty in water quality modelling: The applicability of Variance Decomposition Approach. J. Hydrol. 2010, 394, 324–333. [Google Scholar] [CrossRef]
- Istat. Previsioni Della Popolazione—Anni 2018–2065. Available online: http://dati.istat.it/Index.aspx?DataSetCode=DCIS_PREVDEM1 (accessed on 6 October 2021).
- Istat. Le Statistiche Dell’istat Sull’Acqua. Available online: https://www.istat.it/it/files/2020/03/Le-statistiche-Istat-sull’acqua.pdf (accessed on 1 November 2021).
- ISPRA. Qualità Delle Acque—Inquinamento da Pesticidi. Available online: https://annuario.isprambiente.it/sys_ind/report/html/295#C295 (accessed on 1 November 2021).


| WWTP | Corleone | Marineo | |||
|---|---|---|---|---|---|
| Units | Influent | Effluent | Influent | Effluent | |
| TSS | (mg L−1) | 122.54 | 15.18 | 283 | 32.8 |
| BOD5 | (mg L−1) | 144.17 | 19.43 | 278 | 19.38 |
| COD | (mg L−1) | 239.76 | 33.31 | 565.5 | 42.5 |
| TP | (mg L−1) | 3.58 | n.a. | 12.73 | n.a. |
| NH4+ | (mg L−1) | 20.38 | 11.54 | 24.3 | 3.1 |
| NO2− | (mg L−1) | n.a. | 0.26 | n.a. | 1.03 |
| NO3− | (mg L−1) | n.a. | 2.29 | n.a. | 17.99 |
| Parameter | Sampling Sections | ||
|---|---|---|---|
| 1 | 2 | 3 | |
| BOD5 | X | X | |
| CODTOT | X | X | |
| NTOT | X | X | |
| NH4+ | X | X | |
| NO3− | X | X | |
| NO2− | X | X | |
| PTOT | X | X | |
| PO43− | X | X | |
| SST | X | X | X |
| SSV | X | X | X |
| DSVI/SVI | X | ||
| Clarifier performance | X | ||
| Parameters | Week 0 | Week 3 | Week 6 | Week 9 |
|---|---|---|---|---|
| pH | 7.1 | 7.1 | 7.2 | 7.0 |
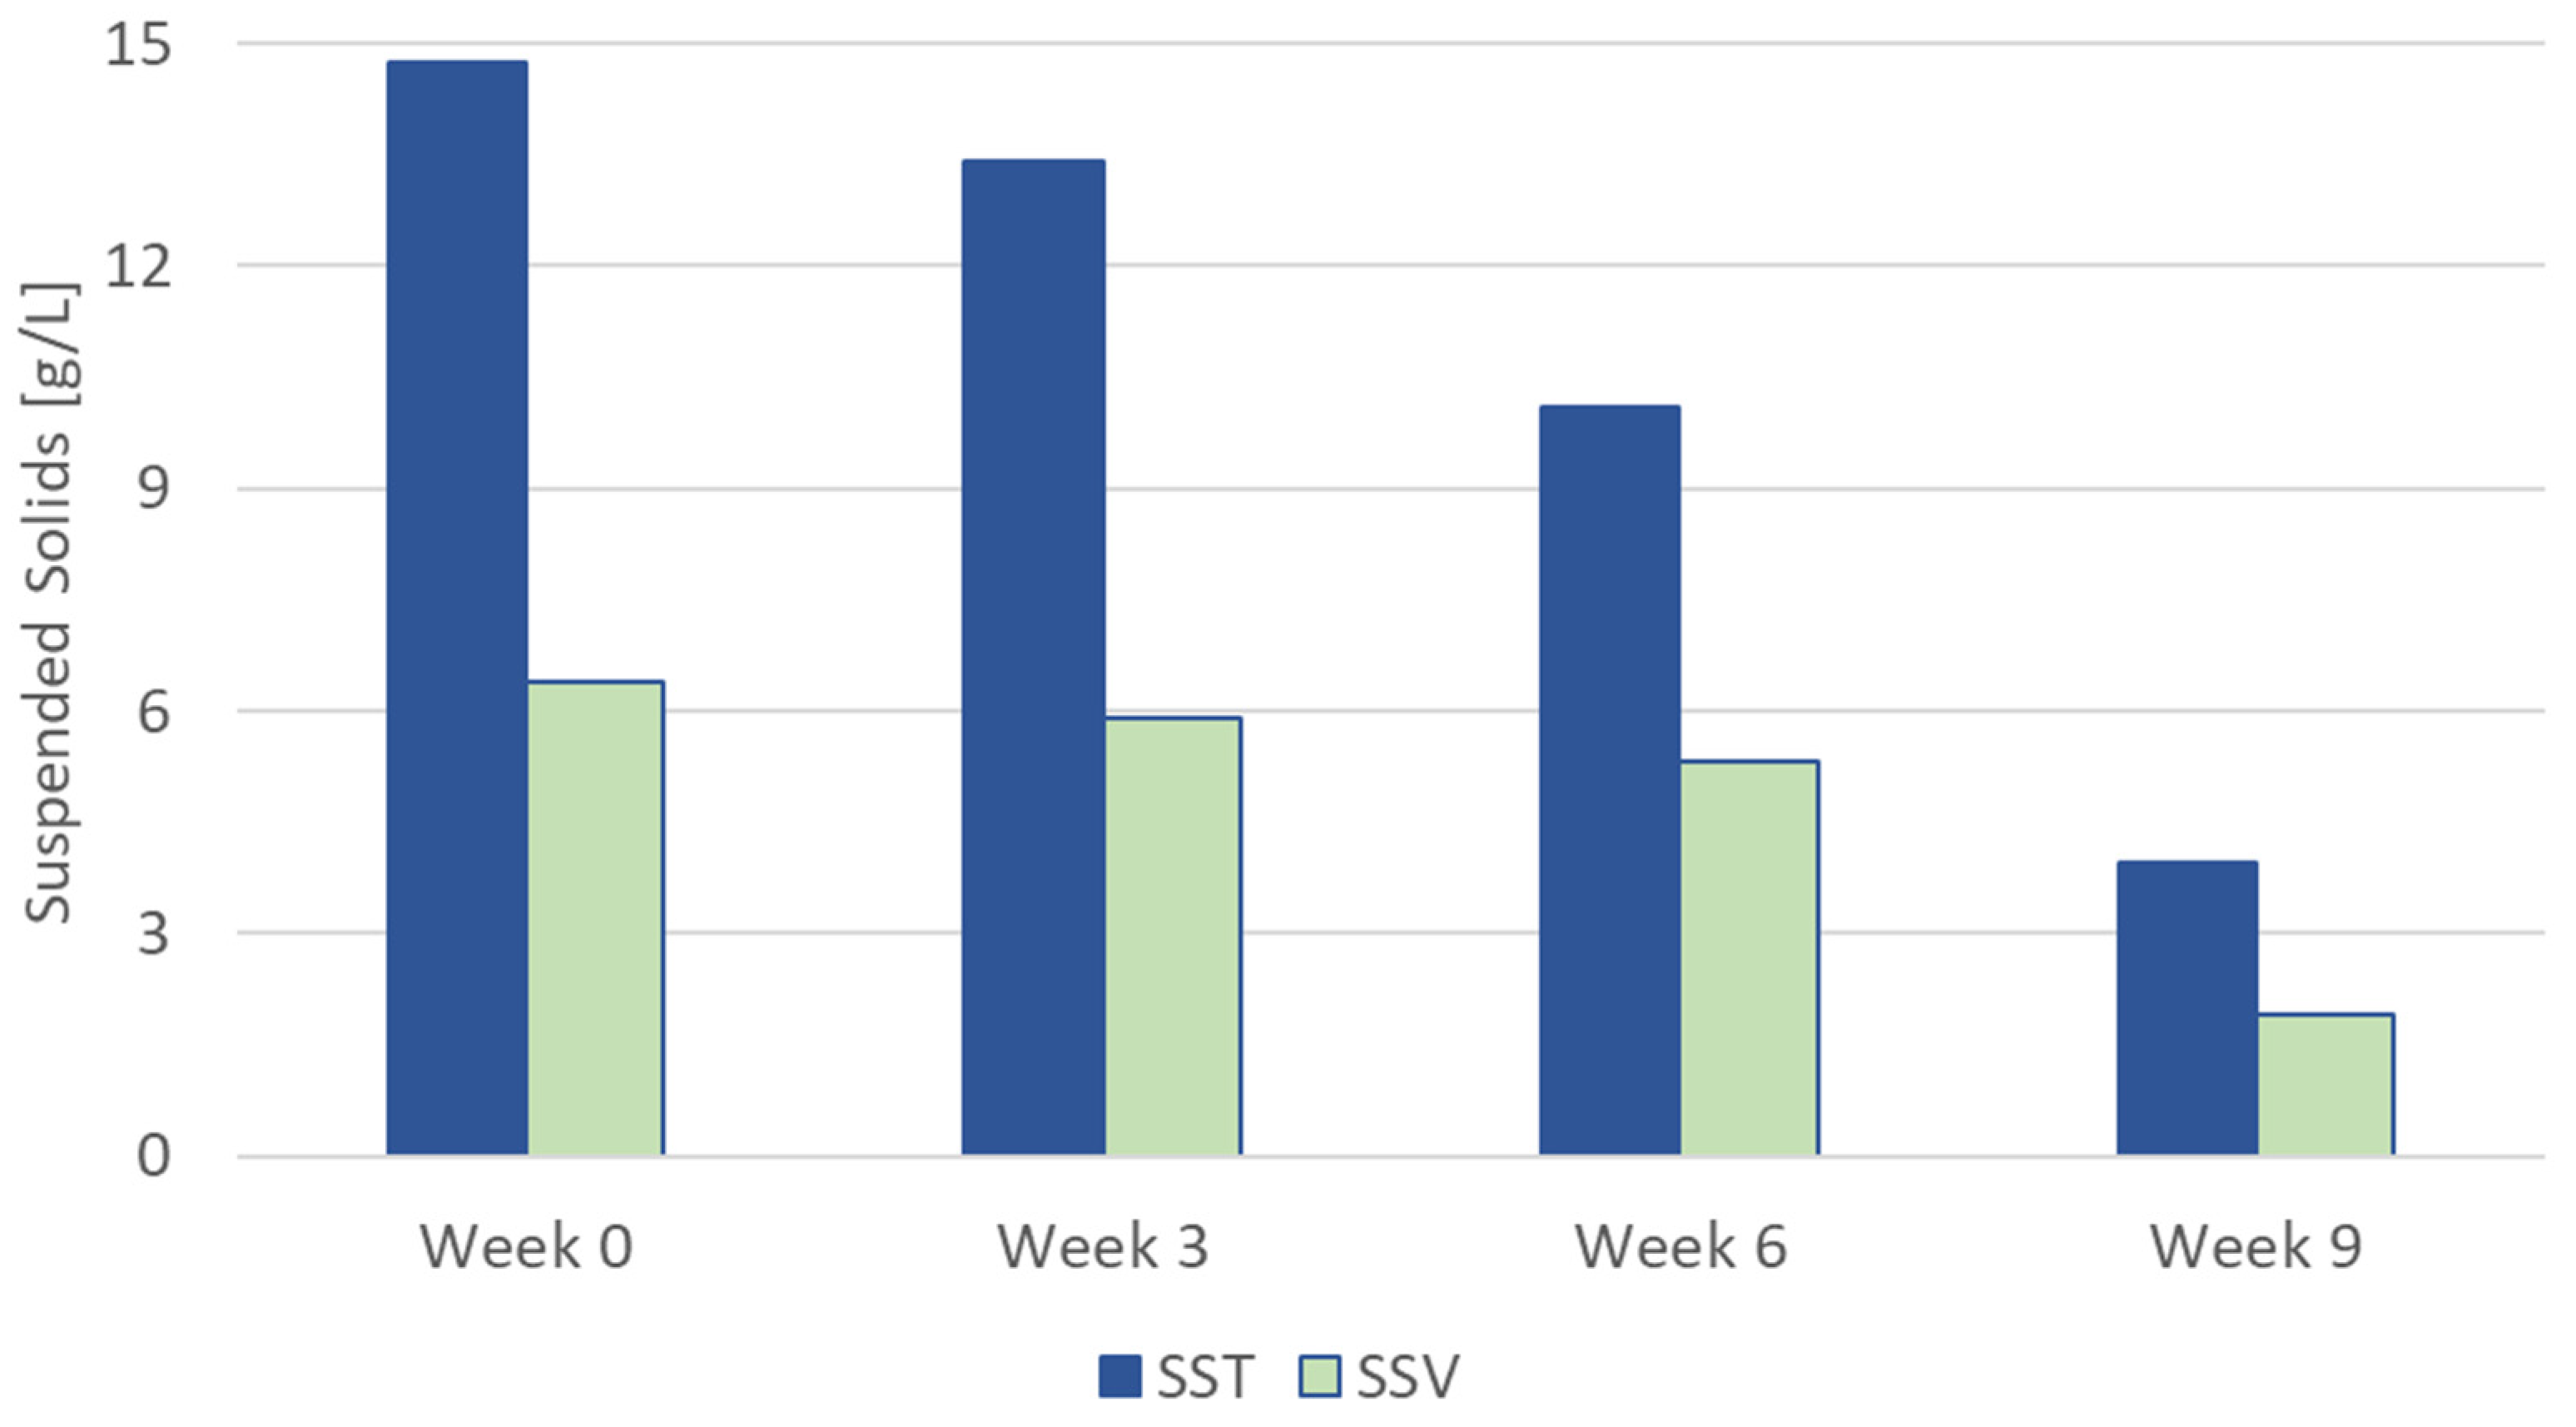
| Total Suspended solids, TSS (g/L) | 14.74 | 13.4 | 10.08 | 3.95 |
| Volatile Suspended Solids, VSS (g/L) | 6.4 | 5.9 | 5.31 | 1.92 |
| VSS/TSS | 0.43 | 0.44 | 0.52 | 0.48 |
| Total Chemical Oxygen Demands, TCOD (g/L) | 9.89 | 13.39 | 13.73 | 5.93 |
| Soluble Chemical Oxygen Demands, sCOD (g/L) | 0.23 | 0.94 | 0.23 | 0.18 |
| Protein (g/L) | 0.68 | 0.65 | 0.69 | 0.4 |
| Carbohydrate (g/L) | 0.09 | 0.1 | 0.1 | 0.04 |
| Ammonium, NH4+-N (mg/L) | 4.7 | 8.3 | 9.5 | 24.2 |
| Phosphate, PO43−-P (mg/L) | 7.4 | 20.8 | 24.0 | 4.5 |
| Favorable Factors | Barriers |
|---|---|
| Economic interest in implementing water-smart solutions | Limited large-scale application of advanced technologies |
| Interest in recovering reuse systems that were built but never went into operation | Difficulty in creating a market based on recovered resources |
| Favorable local conditions for reuse of recovered resources in terms of social acceptance | Regulatory limits on the reuse of recovered resources |
| Sufficient technological maturity to implement water-smart solutions | Difficulty in identifying authorities responsible for reusing resources |
| Apparent political will to support transition to circular economy | Absence or weak interaction with policymakers and decision makers |
| Lack of collaboration between the various administrative levels | |
| Fragmented management responsibilities (treatment → AMAP, reuse → municipalities) | |
| Limited interaction of actors with citizen associations |
Publisher’s Note: MDPI stays neutral with regard to jurisdictional claims in published maps and institutional affiliations. |
© 2022 by the authors. Licensee MDPI, Basel, Switzerland. This article is an open access article distributed under the terms and conditions of the Creative Commons Attribution (CC BY) license (https://creativecommons.org/licenses/by/4.0/).
Share and Cite
Mannina, G.; Badalucco, L.; Barbara, L.; Cosenza, A.; Di Trapani, D.; Laudicina, V.A.; Muscarella, S.M.; Presti, D. Roadmapping the Transition to Water Resource Recovery Facilities: The Two Demonstration Case Studies of Corleone and Marineo (Italy). Water 2022, 14, 156. https://doi.org/10.3390/w14020156
Mannina G, Badalucco L, Barbara L, Cosenza A, Di Trapani D, Laudicina VA, Muscarella SM, Presti D. Roadmapping the Transition to Water Resource Recovery Facilities: The Two Demonstration Case Studies of Corleone and Marineo (Italy). Water. 2022; 14(2):156. https://doi.org/10.3390/w14020156
Chicago/Turabian StyleMannina, Giorgio, Luigi Badalucco, Lorenzo Barbara, Alida Cosenza, Daniele Di Trapani, Vito Armando Laudicina, Sofia Maria Muscarella, and Dario Presti. 2022. "Roadmapping the Transition to Water Resource Recovery Facilities: The Two Demonstration Case Studies of Corleone and Marineo (Italy)" Water 14, no. 2: 156. https://doi.org/10.3390/w14020156