
Performance Evaluation of Watershed Environment Governance—A Case Study of Taihu Basin

1
Wuxi Taihu Lake Restoration Co., Ltd., Wuxi 214000, China
2
School of Economics and Management, Tongji University, Shanghai 200092, China
*
Author to whom correspondence should be addressed.
Water 2022, 14(2), 158; https://doi.org/10.3390/w14020158
Submission received: 10 November 2021
/
Revised: 3 January 2022
/
Accepted: 6 January 2022
/
Published: 7 January 2022
(This article belongs to the Section Water Quality and Contamination)
Abstract
:The rapid development of urbanization and industrialization brings a series of problems of environment governance, and several basins are facing huge pressure. This paper selects the Taihu basin in the Yangtze River Delta of China as the study area, establishes the DPSIR model to measure the water environment governance performance of the region (Cj), analyzes the causes of changes in the five subsystems (the governance performance of the subsystems is recorded as ), and uses the diagnostic model to identify the barrier factors that restrict the improvement of Cj in the last 5 years. The results show that during the study period, of the driving force subsystem generally tends to increase and maintains a steady growth, which is closely linked to economic growth in the basin; of the pressure subsystem increases with a small fluctuation, and the pollution generation still needs attention; in the state subsystem, shows a large fluctuation, and varies significantly in a cyclical manner, corresponding to the short maintenance time and repeated treatment of pollution in the watershed; of the impact subsystem shows an overall upward but a slightly slower trend, and it is related to the fact that the industrial structure of the basin still needs to be improved; and of the response subsystem shows an overall upward trend and a slightly larger increase, and the multi-actor collaborative management has helped a lot. The main barrier factors include key cross-sections’ water quality compliance rate, the water quality compliance rate of key water function areas, water consumption per 10,000 yuan of industrial added value, and the lake trophic status index. Based on the results of the study, the article gives recommendations for watershed governance, such as controlling pollution generation, optimising industrial structure, using technological tools to help governance, sharing the cost of governance among multiple parties and strengthening supervision The findings help to make scientific environmental protection planning and policies of the study region. The research can also provide experience for other countries and regions in watershed governance.
1. Introduction
With the rapid development of industrialization and urbanization, the consequent deterioration of the water environment caused by improper sewage discharge, insufficient sewage treatment capacity, and excessive water consumption seriously affects the basin’s sustainable development [1]. Limits to growth theory was proposed by the Club of Rome in its study on the human predicament [2]. The idea is that “natural and social resources are finite, and as economic and social development proceeds, they will inevitably be consumed to their limits, exposing human survival and development to serious disasters”. As an important strategic resource, water resources have become a guarantee for sustainable socio-economic development. Balancing the relationship between the economic benefits and the environmental penalties is the way forward to achieve the development of the basin.
Globally, both developed and developing countries are facing declining water quality and functional water scarcity due to environmental degradation, which is more prominent and urgent in developing countries [3]. In countries with an early start of industrialization, ecological and environmental problems have been around for a long time. To address the water pollution problems brought about by the industrial revolution, many Western countries tried to restore the water environment. The United Kingdom, Japan and other industrial countries set up special research institutions to manage the water issues in the river basin, and their restoration process has even lasted for more than a century [4]. Compared to the above-mentioned countries with systematic theories and comprehensive practices in water environment governance, Chinese cities have started the research and practice in the relevant fields relatively late.
China also has its strengths and weaknesses in water environment governance due to its unique political and administrative system. In China, the Central Government can pool resources and coordinate arrangements to address watershed governance issues on a national scale [5]. Over the past 50 years, the Government has invested massively in water management. From 2014 to 2020, USD 320 billion has been set aside only for water pollution projects [6]. However, in some countries such as India, the democratic system of governance means that there are more veto players in the approval process, such as the local government, the parliament, the courts, the media, etc. [7]. Therefore, compared to India and some Western countries, China has a governance advantage in terms of the central leadership. However, watershed governance in China involves several juxtaposed government departments, such as the environment and municipalities, as well as multiple actors such as industry, universities and residents. Furthermore, watershed governance is primarily based on administrative boundaries, rather than at the watershed level. Each jurisdictional subject seeks to achieve its objectives and is not obliged to consider the subsequent impacts of its actions [5]. There is the potential for competition and inefficiency in time and space. In addition, the insufficient public participation due to the concentration of government power, and the capacity of water environment governance still need further improvement [8].
The study of environmental performance evaluation originated in the late 1980s and the world’s first corporate environmental report was published by Norsk Hydro, which proposed that the goal of environmental performance evaluation was to increase the actual achievement and effectiveness of environmental protection [9]. Since then, many international organizations, such as the World Bank, International Organization for Standardization (ISO) and the United Nations Organization for Economic Cooperation and Development (OECD) became involved in the evaluation [10]. Water governance performance assessment is one of the practices in watershed management, and the relevant studies are mainly concerned with watershed governance evaluation [11], water environment carrying capacity assessment [12], and governance audit evaluation [13]. In terms of indicators for evaluating the water environment governance, Pires has developed an assessment system for sustainable use of water resources, with indicators covering three dimensions: environmental, economic and social [14]. Lane aggregated water environment models into multi-dimensional performance indicators through water consumption, reliability, resilience, vulnerability and sustainability to explain the effectiveness of human management of water systems [15]. Luo et al., established a water governance performance evaluation index system based on three dimensions of exploitation and utilization, efficiency and pollution control to evaluate the water resources management of Xi’an, Chian, from 2005–2016 [16]. From the construction of evaluation index content, the most common one is the pressure–state–response (PSR) model established by the OECD [17] and the driving forces–pressure–state–impact–response (DPSIR) model developed by the European Environment Agency (EEA) [18]. Related studies such as Wang et al. combined the PSR model and the material element topology method, and established an evaluation model to quantify the water resources utilization performance of Beijing, China, in 2012 and 2016 [19]. Henriques et al., integrated the DPSIR framework with hydrology, environment, living standards and policy to form a dynamic basin performance evaluation indicator system for assessing the performance of water governance in Scottish and Welsh [20]. Most of the research indicators related to water performance evaluation were related to the current water quality status [21], pollution prevention [22], water intensification [23], urban economic development [24], water demand [25] and technological innovation [26], etc. From the evaluation methods, Than et al. used neural network algorithms to classify and predict the water quality of Dong Nai River using historical data [27], and Alodah and Seidou simulated the hydrological impacts of rare events through randomly generated climate time series for risk forecasting and performance assessment [28]. Gray correlation analysis [29], principal component analysis [30], EFAST method and entropy method [31] were also frequently used for evaluation in related studies.
To summarize, several shortcomings should be noticed in the existing literature. First, although there are some studies of the given topic in different regions or basins, fewer studies have focused on China’s national system of centralized leadership and multi-sectoral participation in watershed governance, and this part of study needs to be supplemented. Second, the evaluation indicator system is not comprehensive enough. Most of them revolve around social, economic and environmental dimensions, without incorporating management mechanisms and public participation in the actual watershed governance. This study complements the indicator system by providing a flexible and modifiable performance governance assessment framework [32]. Thirdly, as a component of the Yangtze River Delta, which is one of the most economically developed regions in China, the evaluation of water environment governance performance for the Taihu basin can help guide the balanced development of the regional economy and environmental protection. This study uses DPSIR, a widely recognized theoretical framework, to construct an evaluation system for water environmental governance, evaluates the effect with the help of the entropy-weight TOPSIS method and tries to identify the possible barriers in the process, which provides references for the scientific formulation of water environmental protection planning and policies in the Taihu basin. The findings can also provide reference experience for other countries and regions in watershed governance.
2. Construction of Index System and Data Acquisition
2.1. Construction of DPSIR-Based Index System
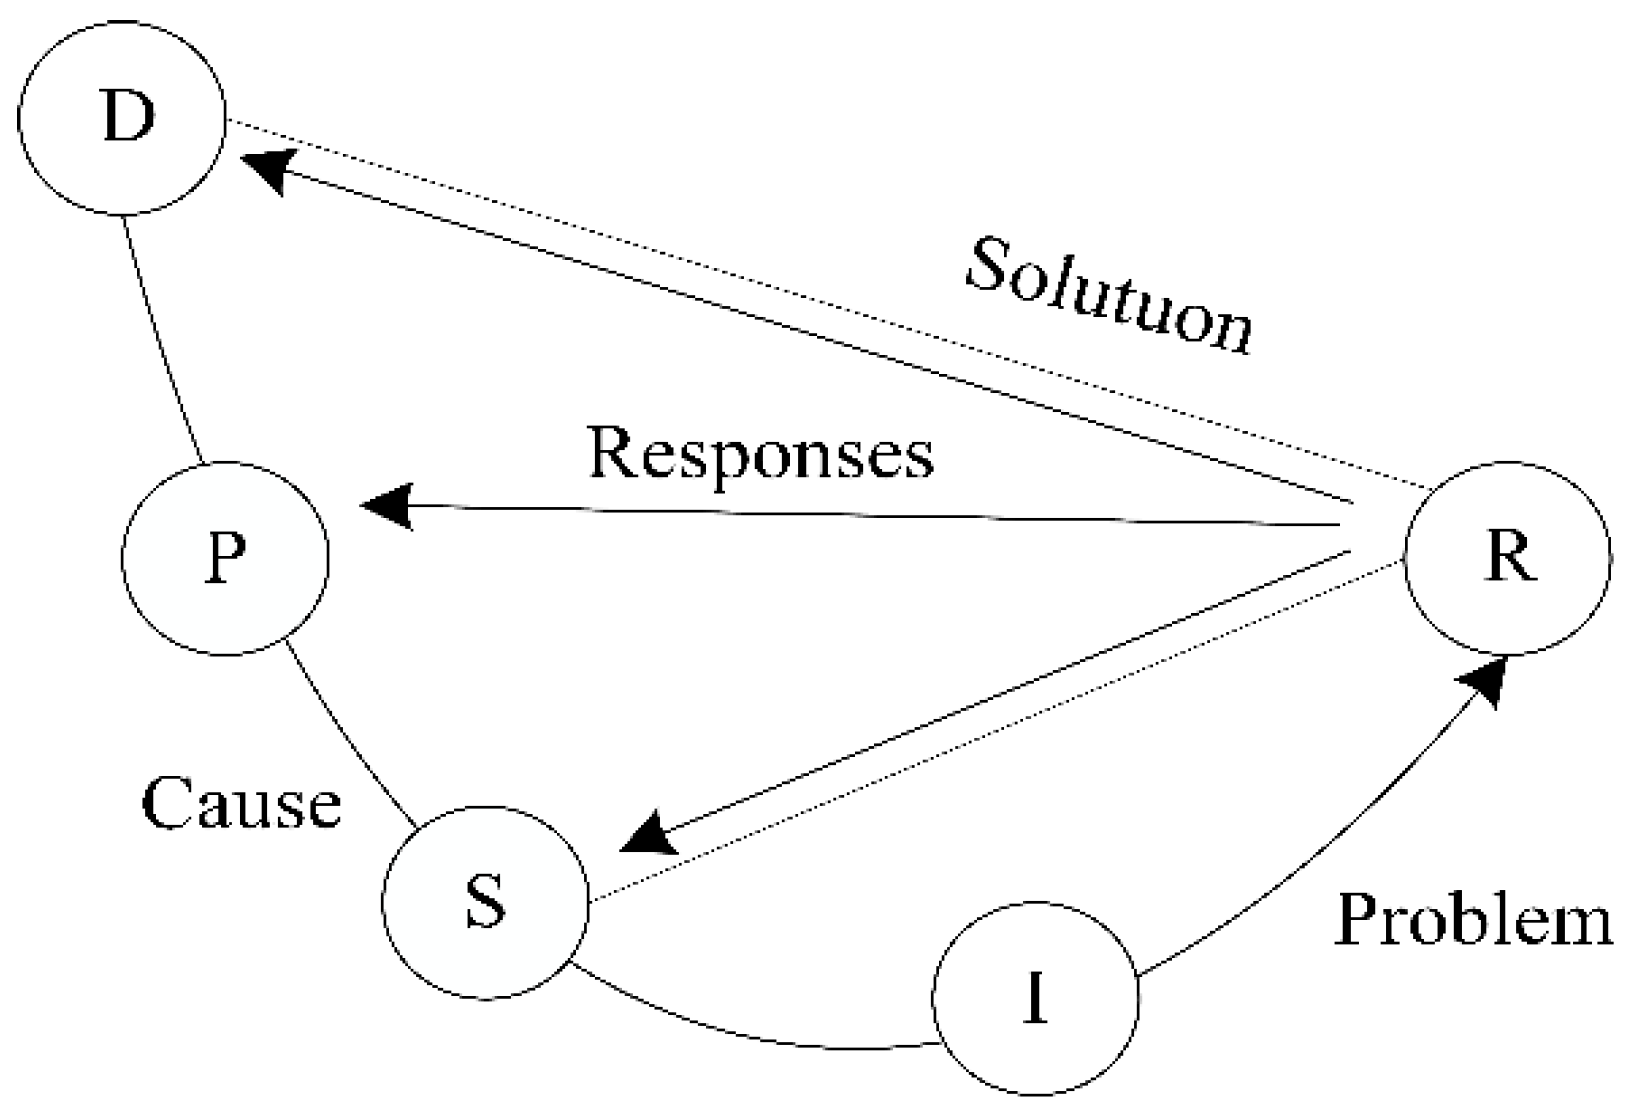
The water environment governance performance (Cj) aims to evaluate the treatment benefits of water governance to the basin. Therefore, to achieve scientific evaluation, it is necessary to adopt a suitable modeling approach that reflects the causal linkages of watershed pressures and responses based on analysis of watershed systems. The DPSIR conceptual model is an evolution of the PSR model, which is widely used in policy development and relevant research. The driving force–pressure–state–impact–response model framework, which separates the “impact” from the “state” based on the PSR, clearly reveals the strong correlation between environmental changes and human activities [33].
The DPSIR describes a causal chain between the origins and outcomes of environmental problems (Figure 1). The chain suggests that social, economic, and demographic developments act as long-term drivers (D) on the environment, thus exerting pressure (P) and causing changes in the state (S) of the ecosystem, resulting in various impacts (I) on the ecosystem such as water resources. These impacts drive human response (R) to changes in ecological state (S), and response (R) measures to act on the complex system of social, economic and demographic components or directly on environmental pressures (P), state (S) and impacts (I).
Therefore, the model of water environment governance performance assessment around the Taihu basin consists of five parts: driving force layer, pressure layer, state layer, impact layer and response layer, each of which is composed of several indicators [34]. The connotation of the layers is explained separately below.
The “driving force layer” () explains the potential driving force for changes in the water environment due to population growth and socio-economic development [35], which is the source of power for regional water environmental protection, including social, economic, political and cultural factors. The industrial development leads to economic development, more funding for watershed governance is allocated [36], the improvement of people’s living standards results in a greater appreciation of social capital such as the watershed environment [37], and the financial investment virtuously drive the development of watershed governance [38].
The “pressure layer” () is related to factors that cause changes in the state of the water environment due to the influence of production and lifestyle [39]. The indicators of the driving force layer discussed above are potential factors of environmental change, while the indicators of the pressure layer are direct factors, which can visualize by environmental change. Combined with the actual situation of the Taihu basin, the pressure caused by industrial wastewater is mainly considered. The water consumption of secondary industry measures the secondary sector water use [40], the change of the ratio of secondary industry to GDP is an indicator of whether the same amount of water is used to generate more capacity, i.e., whether industrial water use is efficient, and the secondary industry sewage discharge measures the generation of total industrial pollution [41].
The driving force layer and pressure layer are more related to economic and social development, and we have the state, impact and response layers corresponding to the three main process elements of water quality governance: setting standards, mitigation and protection, and implementation monitoring [42].
Indicators of the “state layer” ()are relevant for monitoring the state effects of water use on the water environment [43]. Water quality monitoring is the task of analysing the state of water sources according to quality standards and norms [42]. According to relevant studies, the indicators to measure the state of the water body include chemical oxygen demand (CODMn) [32], total ammonia nitrogen concentration of water [44], and the lake trophic status index [45].
The “impact layer” () corresponds to the mitigation and protection of water quality governance. We protect the water environment by mitigating short and long-term water pollution factors and maintaining water quality standards [42].The relevant indicators mainly involve the water quality compliance rate [46], water supply rate [47], and water quality qualification rate [46], etc.
The indicator of “response layer” refers to the measures taken and monitored by relevant government departments, industry, research, universities and residents to respond to changes in the water environment [42]. For example, the government departments can increase funding for protection, thus encouraging research units to improve their output, and can also strengthen public participation in local environment governance [8], with multiple parties working together to effectively reduce the negative impacts of water environmental damage [48].
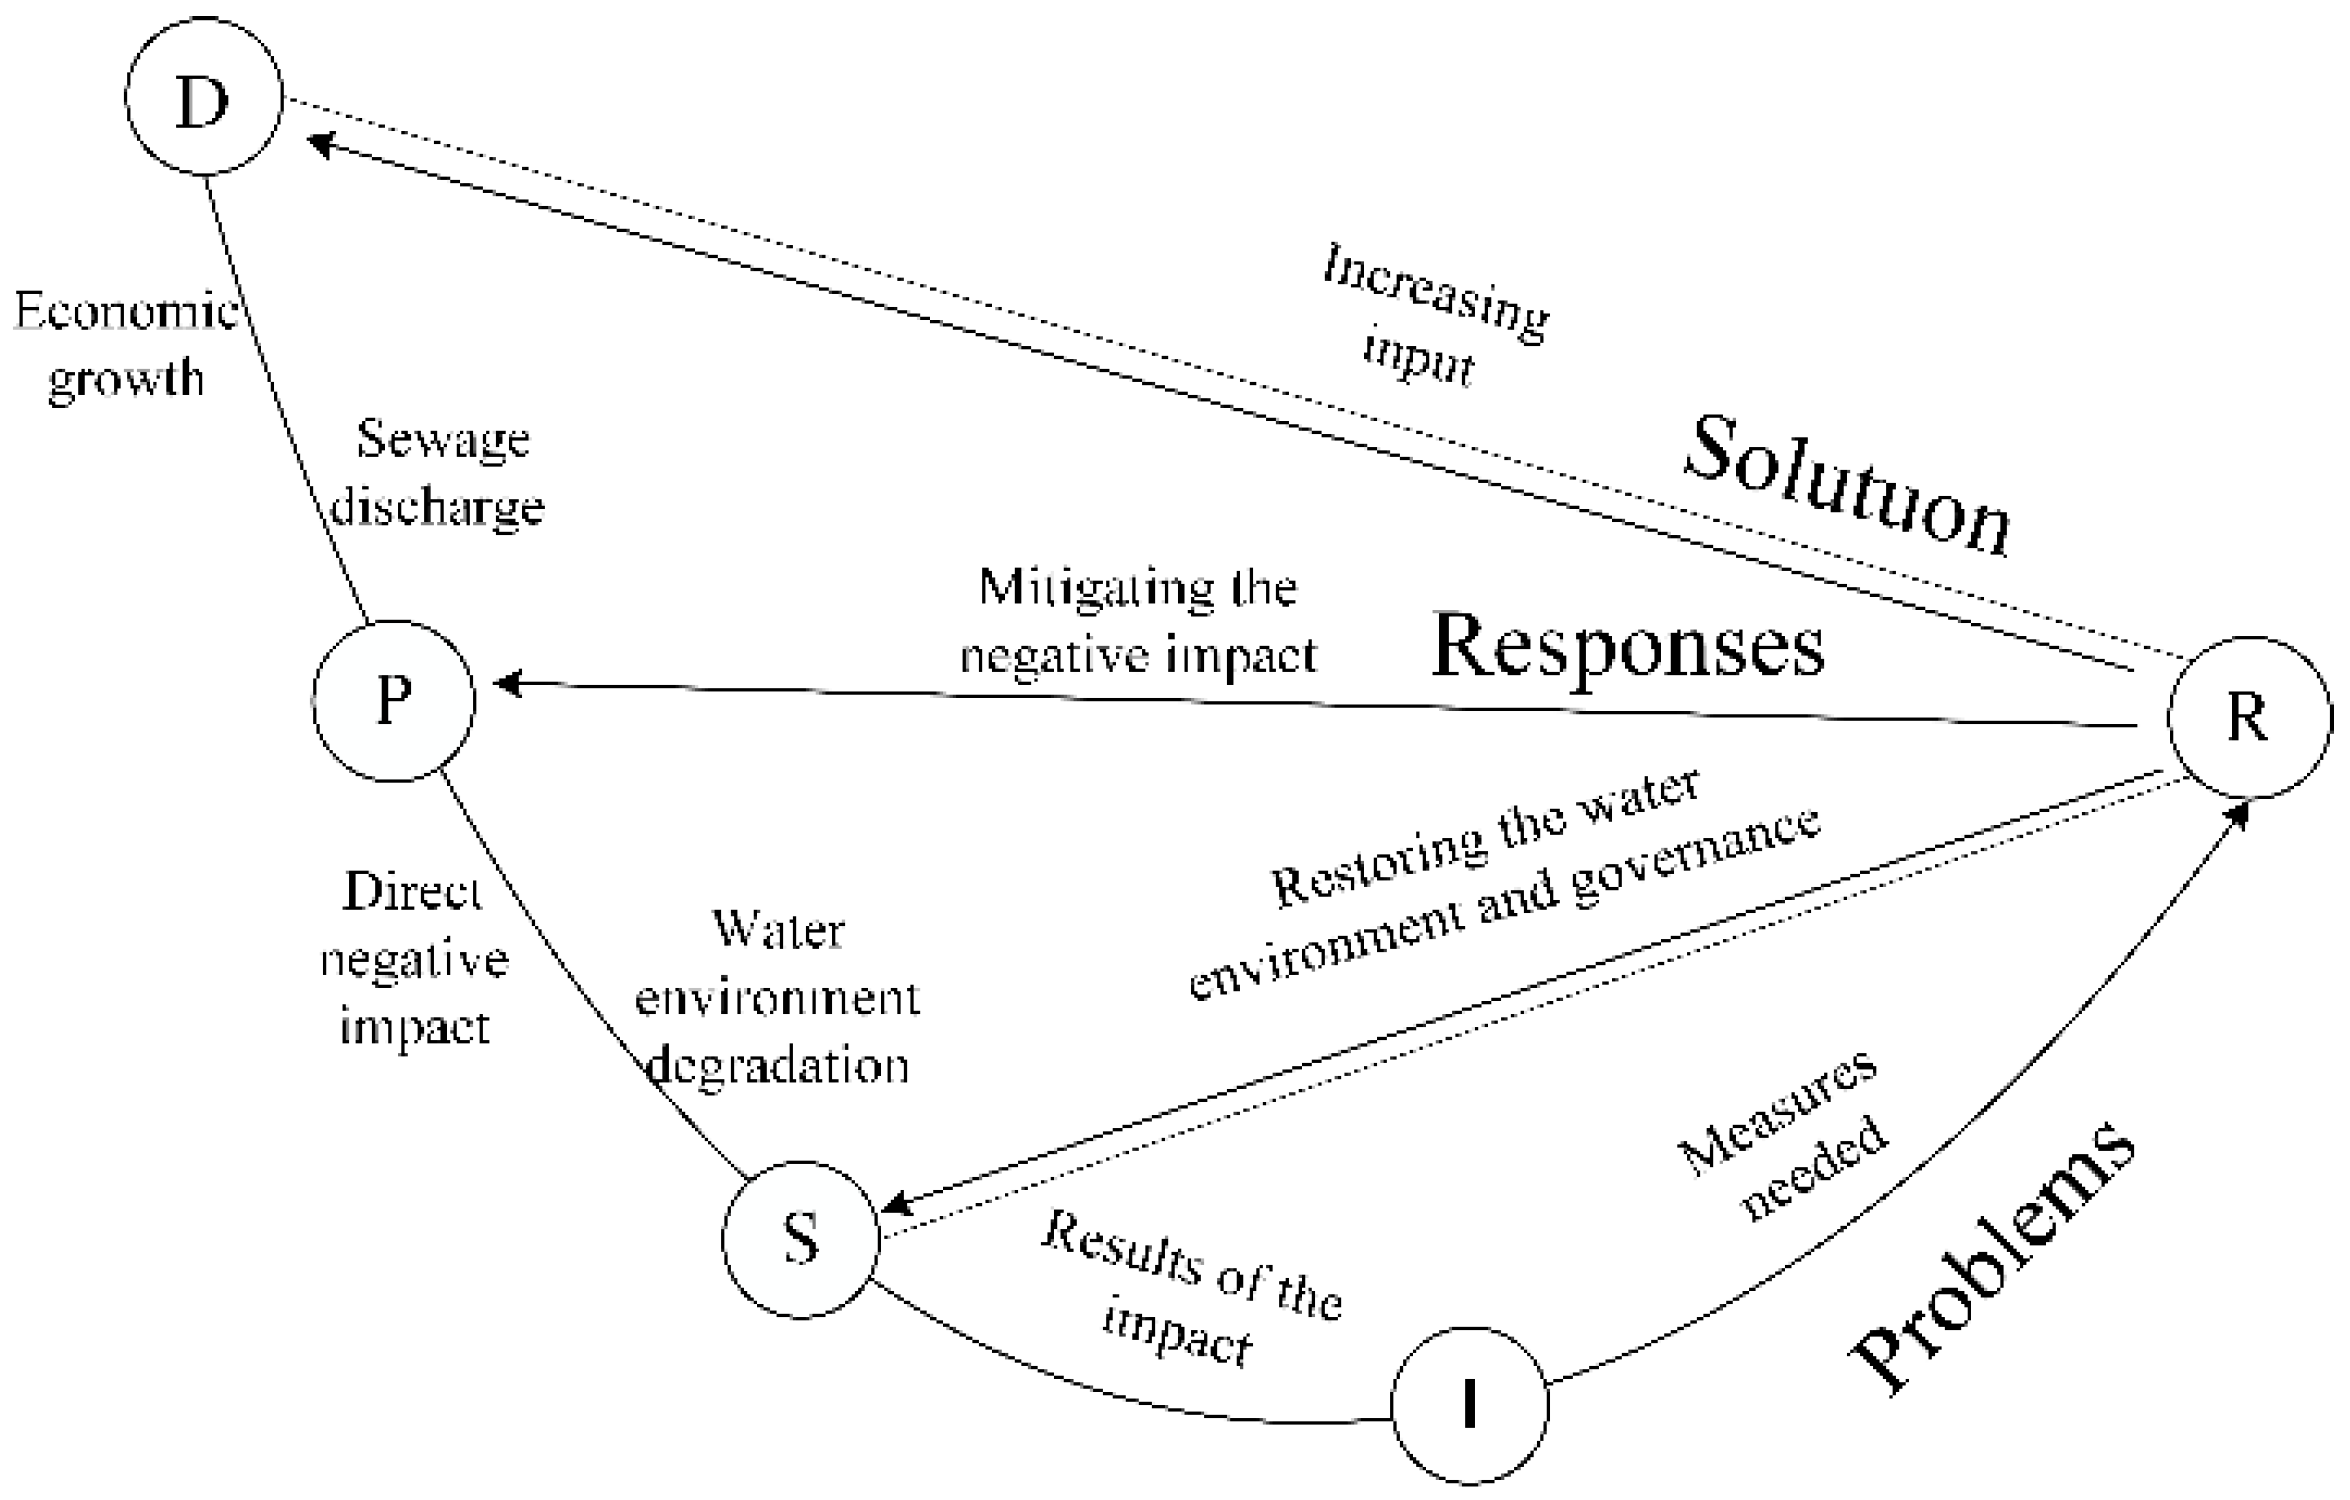
From the above framework combined with the actual situation, we improve and establish the DPSIR model of water environment governance performance (Figure 2).
Accordingly, we establish the evaluation index system (Table 1). When distinguishing evaluation indicators, they are divided into positive and negative indicators: the larger the value of positive indicators, the better the evaluation result; conversely, the smaller the value of negative indicators, the better the evaluation result.
The DPSIR model not only shows the negative impact of socio-economic development and human behavior on the ecological environment, but also shows the actual process of water quality management. The water environment governance performance assessment index system based on the DPSIR model has a reasonable internal logic, and clearly shows the consequences of water environment problems through the causal chain, so it is very suitable for the analysis of the environmental management in this study.
2.2. Study Area
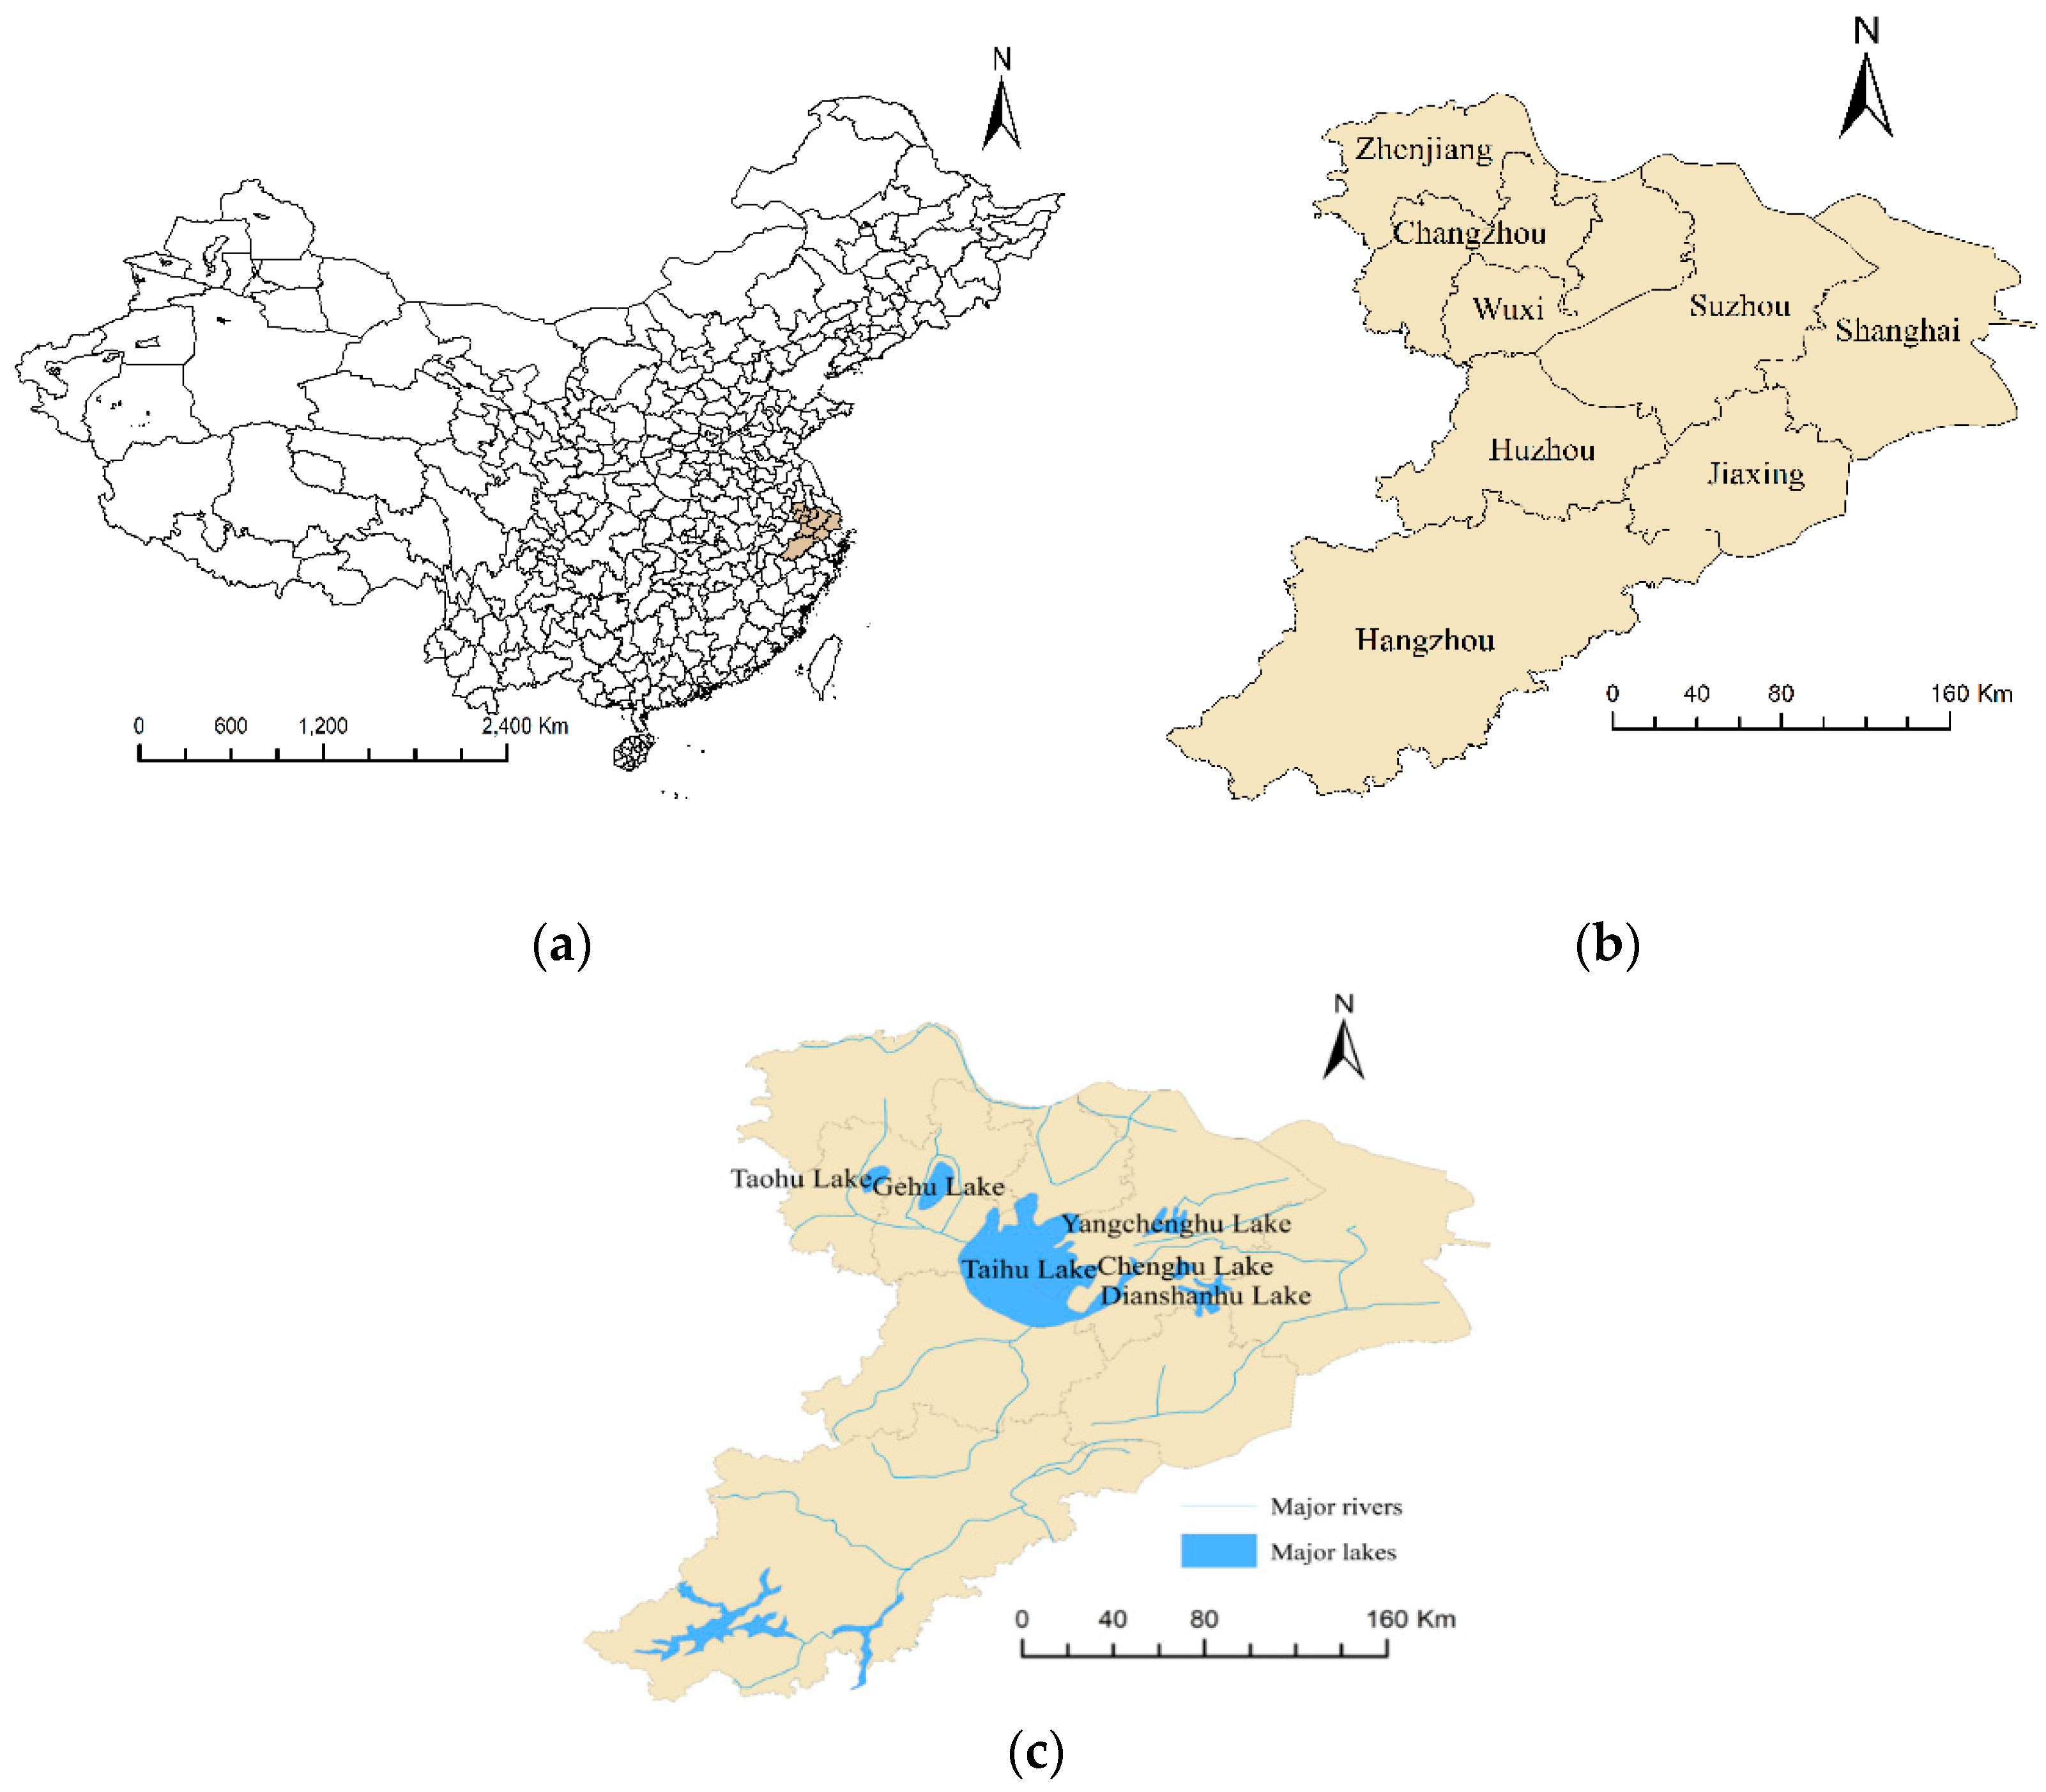
The Taihu basin is the core area of the economically developed Yangtze River Delta region of China, with an area of 3.69 × 10⁴ km2. All the lakes in the basin are shallow, with an average depth of less than 2 m and a maximum depth of less than 3 m, and the ground elevation is generally only 2 m above sea level. The basin is dominated by plains, accounting for 4/6 of the total area, while water, hills and mountains each account for 1/6 of the area. Three sides of the basin are bordered by rivers and seashores, and the middle is plain, with the topography characterized by a high periphery and a low middle. The basin is located in the mid-latitudes and has a humid northern subtropical climate zone with an average annual temperature of 15–17 °C.
According to the information given on the website of the Taihu Basin Authority of Ministry of Water Resources of China, the division of the region involves part of Jiangsu, Zhejiang, Anhui and Shanghai (Figure 3). Among the watershed, the part of Anhui is not included because it occupies too small a proportion (0.1%) and it is not convenient to obtain accurate data. Similarly, the data of Gaochun County of Nanjing are not analyzed for the same reason. In this paper, we study the situation of the prefecture-level cities (including their jurisdictions) of the region, and the scope of the study is shown in Figure 3b. There are six lakes with an area of more than 10 square kilometers in the study area of Taihu Basin, namely Taihu Lake, Fuyu lake, Yangcheng Lake, Tao Lake, Dianshan Lake and Chenghu lake, which are shown in Figure 3c, also rivers above Level 5 in the basin are also shown in the figure.
While water resources in the Taihu basin support social and economic development, its water environment has also been affected. According to statistics data, from the 1980s to the early 1990s, the water grades of the Taihu basin decreased from mainly II to mainly III. From the mid-1990s, with the aggravation of pollution, the eutrophication of water has been increasing. The outbreaks of cyanobacteria in the Taihu basin in 2000 and 2007 have brought attention to the sustainable development of the basin, and since the implementation of comprehensive water management in 2008, the water quality has been significantly improved. In the new era, how to take measures to ensure water safety, water ecological health and water environment livability is of strategic importance to the region. Therefore, the new round of Taihu basin governance has attracted extensive attention [49].
2.3. Data Source
The population data, socio-economic data, agricultural data, environmental protection data and urban construction data of the Taihu region involved in this study are mainly from the China Statistical Yearbook [50], Ecological and Environmental Status Bulletin (2010–2019) of relevant provinces and cities, and statistical yearbooks of prefecture-level cities. Furthermore, the data from the Taihu basin official website also helps a lot. Few other data are obtained from relevant department news or special reports. The missing data of some indicators are replaced by linear interpolation. By averaging the data of each indicator in each city for the corresponding year, we obtain the data of each city in the region of the study period.
3. Research Methodology
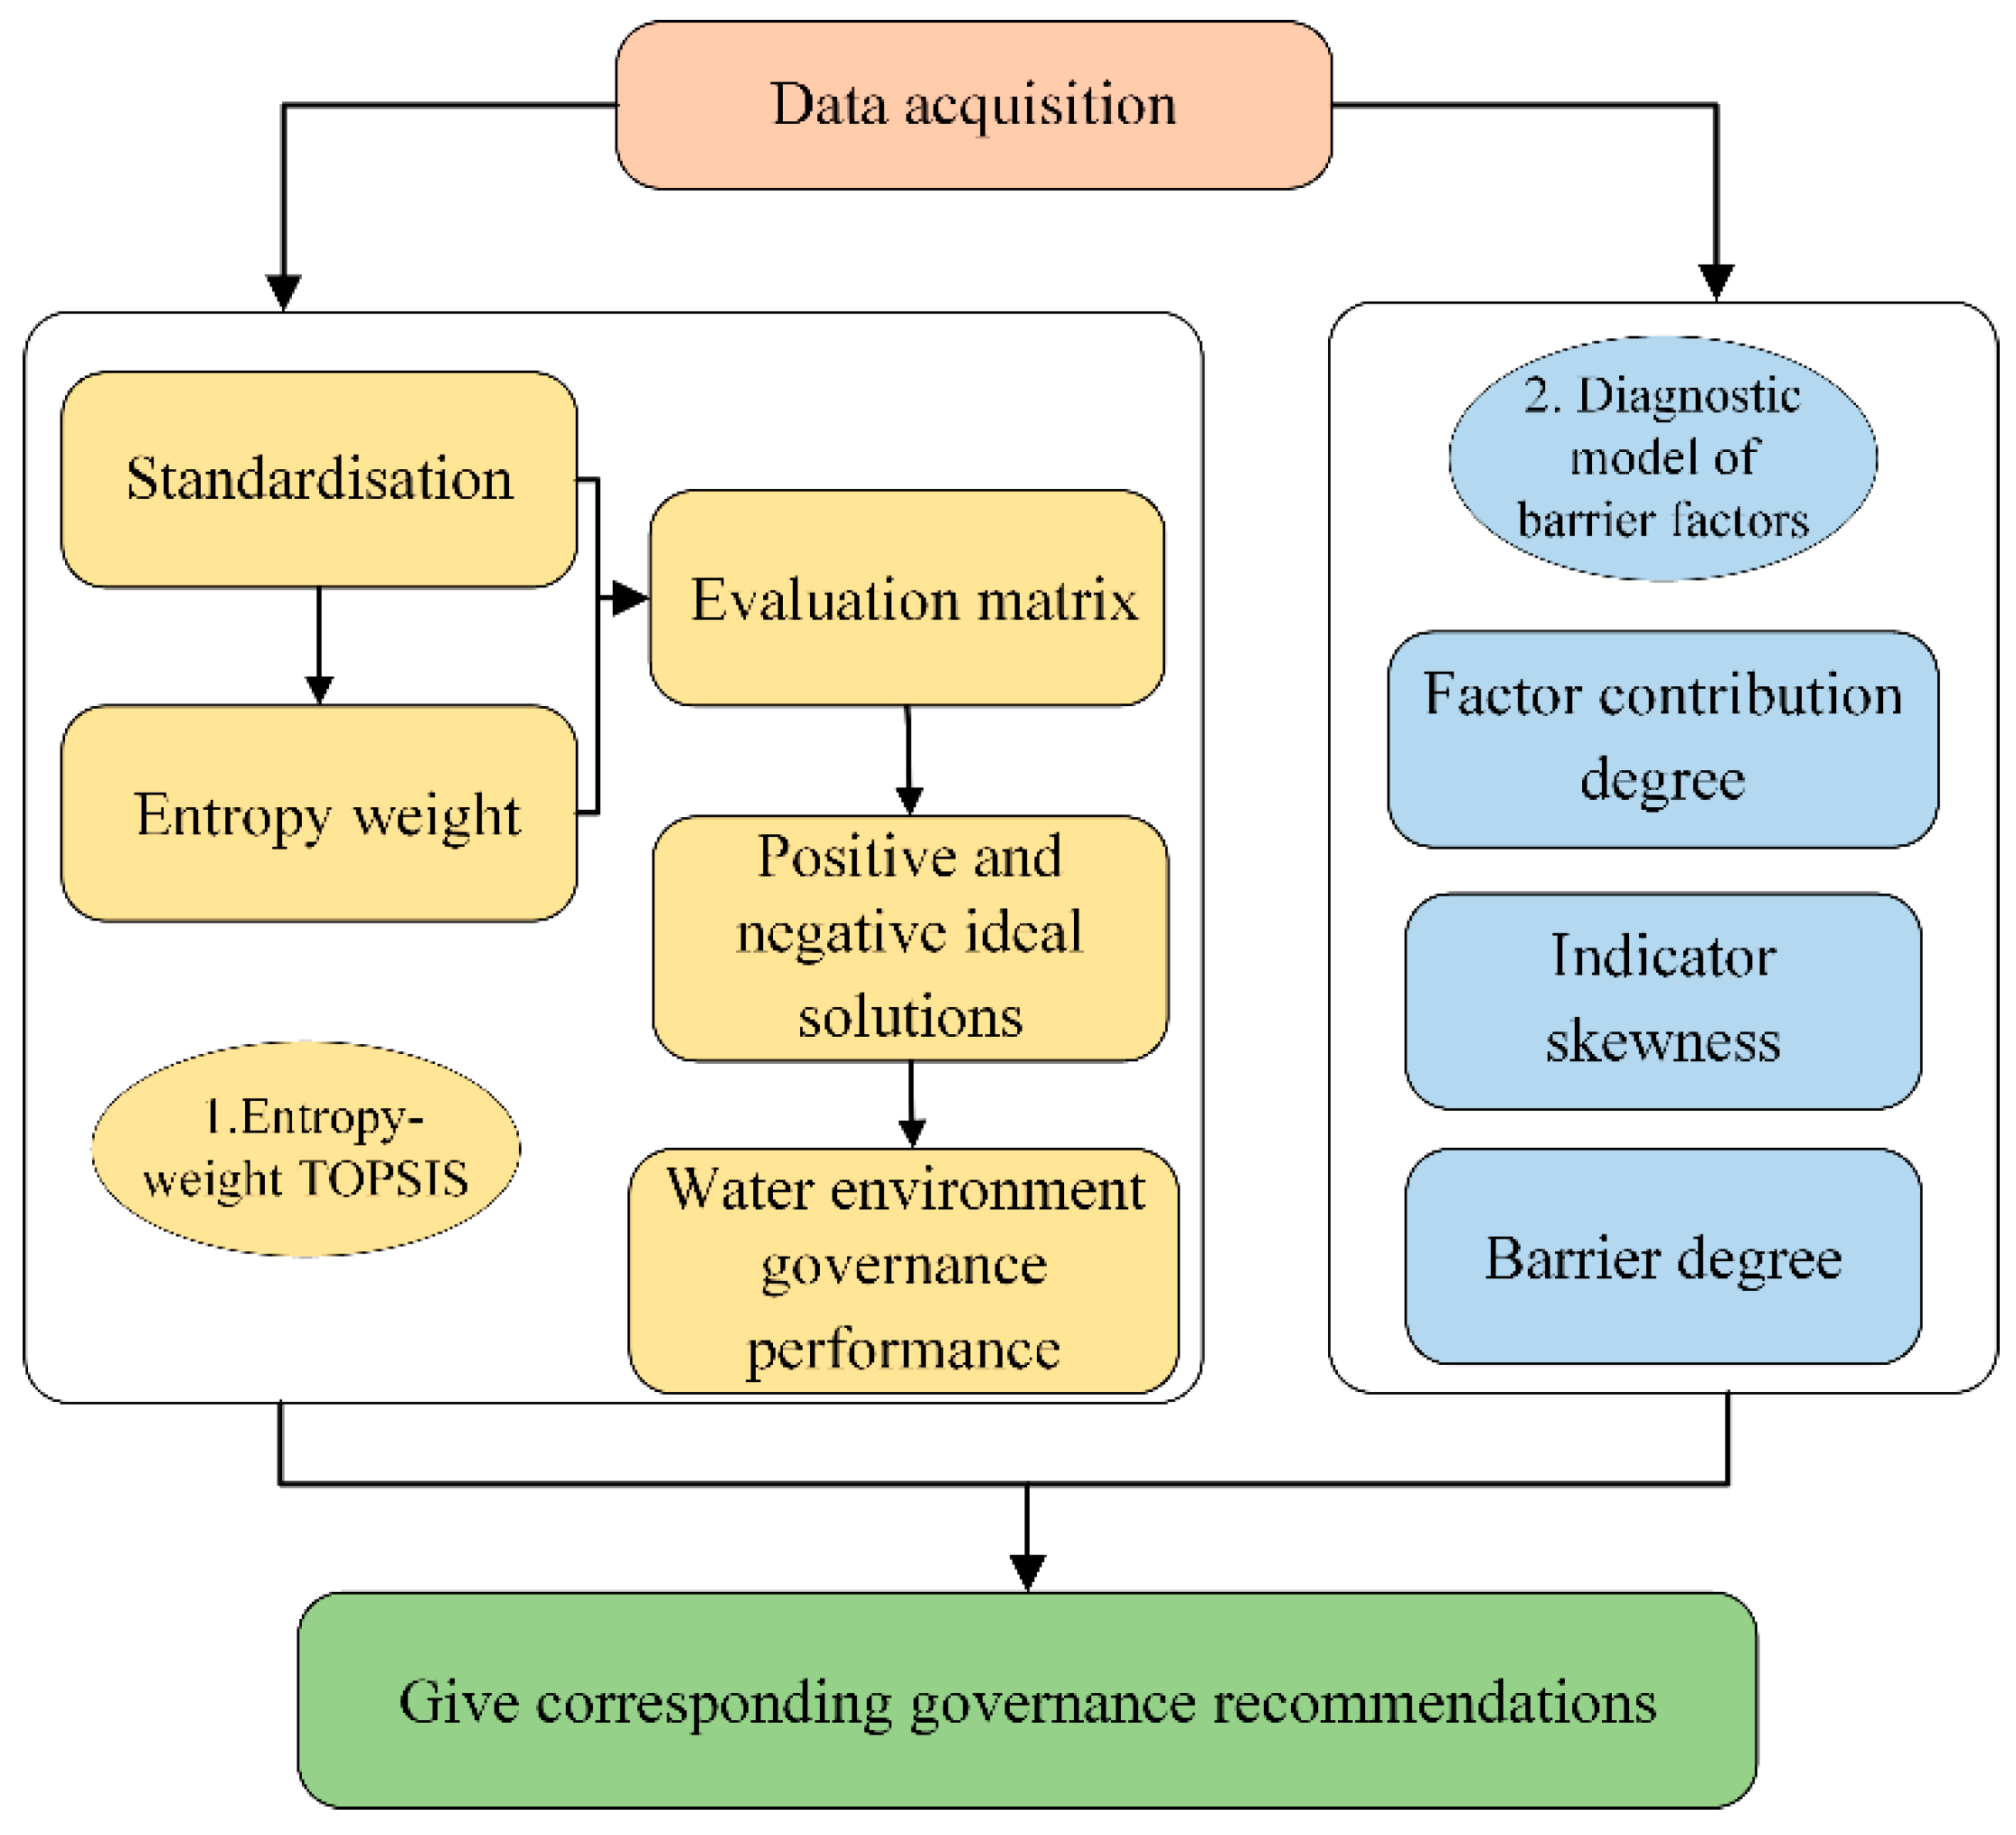
The overall idea of the following part is given here [51] (Figure 4). We use the evaluation index system in Table 1 and corresponding data, combined with the entropy-weight method and the diagnostic model of barrier factors to evaluate the water environment governance performance. Then we analyze the change trend during the study period, as well as the main obstacle factors affecting governance performance. Some policy recommendations are given in conjunction with the findings.
3.1. Entropy-Weight TOPSIS
3.1.1. Introduction to the Entropy-Weight Method
From entropy, the decision accuracy can be improved by relying on the amount of decision information [52]. In this paper, the weights are determined according to the entropy of the data, which can objectively reflect the implicit information, and avoid the selection bias caused by the small difference of indicators. The entropy weight is to characterize the relative intensity of competition of indicators, and in general, the higher the entropy of an indicator, the lower the entropy weight, which means that the indicator is less important; and vice versa [53]. The specific solution of the entropy weight is described in detail in Section 3.2.
3.1.2. Introduction to TOPSIS Model
TOPSIS model is a ranking method to approximate the ideal solution, which is mainly used to solve multi-objective decision-making problems with finite solutions. By using distance as the evaluation criterion, the degree to which the objective is close to or deviates from the positive or negative ideal solution is calculated [54]. In this study, by assessing the degree of deviation of the water environmental carrying capacity from the positive or negative ideal situation during the study period, the dynamic trend of the regional water environment governance performance can be reflected.
3.2. The Evaluation Model Using Entropy-Weight TOPSIS Method
- (1)
- Construction of standardized evaluation matrix
We make the initial evaluation index matrix of the performance evaluation problem as:
For positive indicators (indicators with larger values reflecting better governance performance), the processing method is shown in Equation (2), and for negative indicators (indicators with smaller values reflecting better governance performance), the processing method is shown in Equation (3).
Normalizing the matrix and we obtain:
where is the initial evaluation matrix, is the initial value of the th indicator in year ; is the standardized evaluation matrix, (0 ≤ ≤ 1) is the standardized value of the th indicator in year ;, is the number of evaluation indicators; , is the number of evaluation years.
- (2)
- Determination of index weights
Define the entropy of the th evaluation index as:
where , , , and when , let .
We define the entropy weight of the th evaluation index as:
- (3)
- Evaluation matrix construction based on entropy weight
To further improve the objectivity of the matrix in (4), with the aid of the obtained by the entropy-weight method, we construct a weighted normalized evaluation matrix , which is calculated as follows:
where is the weighted normalized value of the th indicator in year .
- (4)
- Determination of the positive and negative ideal solutions and
- (5)
- Calculation of the distance
In this study, Euclidean distance is used to calculate the distances and from each indicator evaluation vector to the positive and negative ideal solutions and respectively, by the following Equations (10) and (11).
- (6)
- Calculation of Cj
Cj characterizes the degree of water environment carrying capacity close to the optimal state in year , and is used to measure the water environment governance performance in Taihu, ranging between. The larger the value of Cj, the closer the current evaluation index value is to the positive ideal solution, and the higher water environmental management performance. The smaller the value of Cj, the closer the current evaluation index value is to the negative ideal solution, and the worse the water environment governance performance. The change in water environment governance performance during the study period can be judged from the change of Cj
3.3. Diagnostic Model of Barrier Factors for Cj
After obtaining Cj, we try to identify the barrier factors that constrain it. We introduce three basic variables of factor contribution degree , indicator skewness and barrier degree [55]. is the weight of individual indicators on Cj; is the gap between individual indicators and the water environmental governance objectives; can indicate the degree of barrier influence of each indicator on Cj. The calculation formula is as follows:
4. Empirical Analysis
4.1. Overall and Sub-Dimensional Evaluation Results
According to the research method we choose above, this paper measures the water environment governance performance in the Taihu basin from 2010 to 2019, and the results are shown in Table 2. The evaluation results and the sub-dimensional results of the D-P-S-I-R subsystem with the change trends are shown in Figure 5 and Figure 6.
4.2. Analysis of the Evaluation Result of Cj
From Figure 5 and Figure 6, it can be seen that Cj shows an overall increasing trend, from 0.0673 at the beginning of 2010 to 1.0000 in 2019 at the end of the study period, reflecting a continuous improvement during the study period. decreases from 0.2566 to 0.0050, with a reduction of 0.2516, gradually converging to the positive ideal solution. Further, increases from 0.0185 to 0.2603, with an increment of 0.2418, gradually deviating from the negative ideal solution. All of the above analyses show that that the overall level of the water environment governance performance has been greatly improved.
4.3. The Specified Result of ~
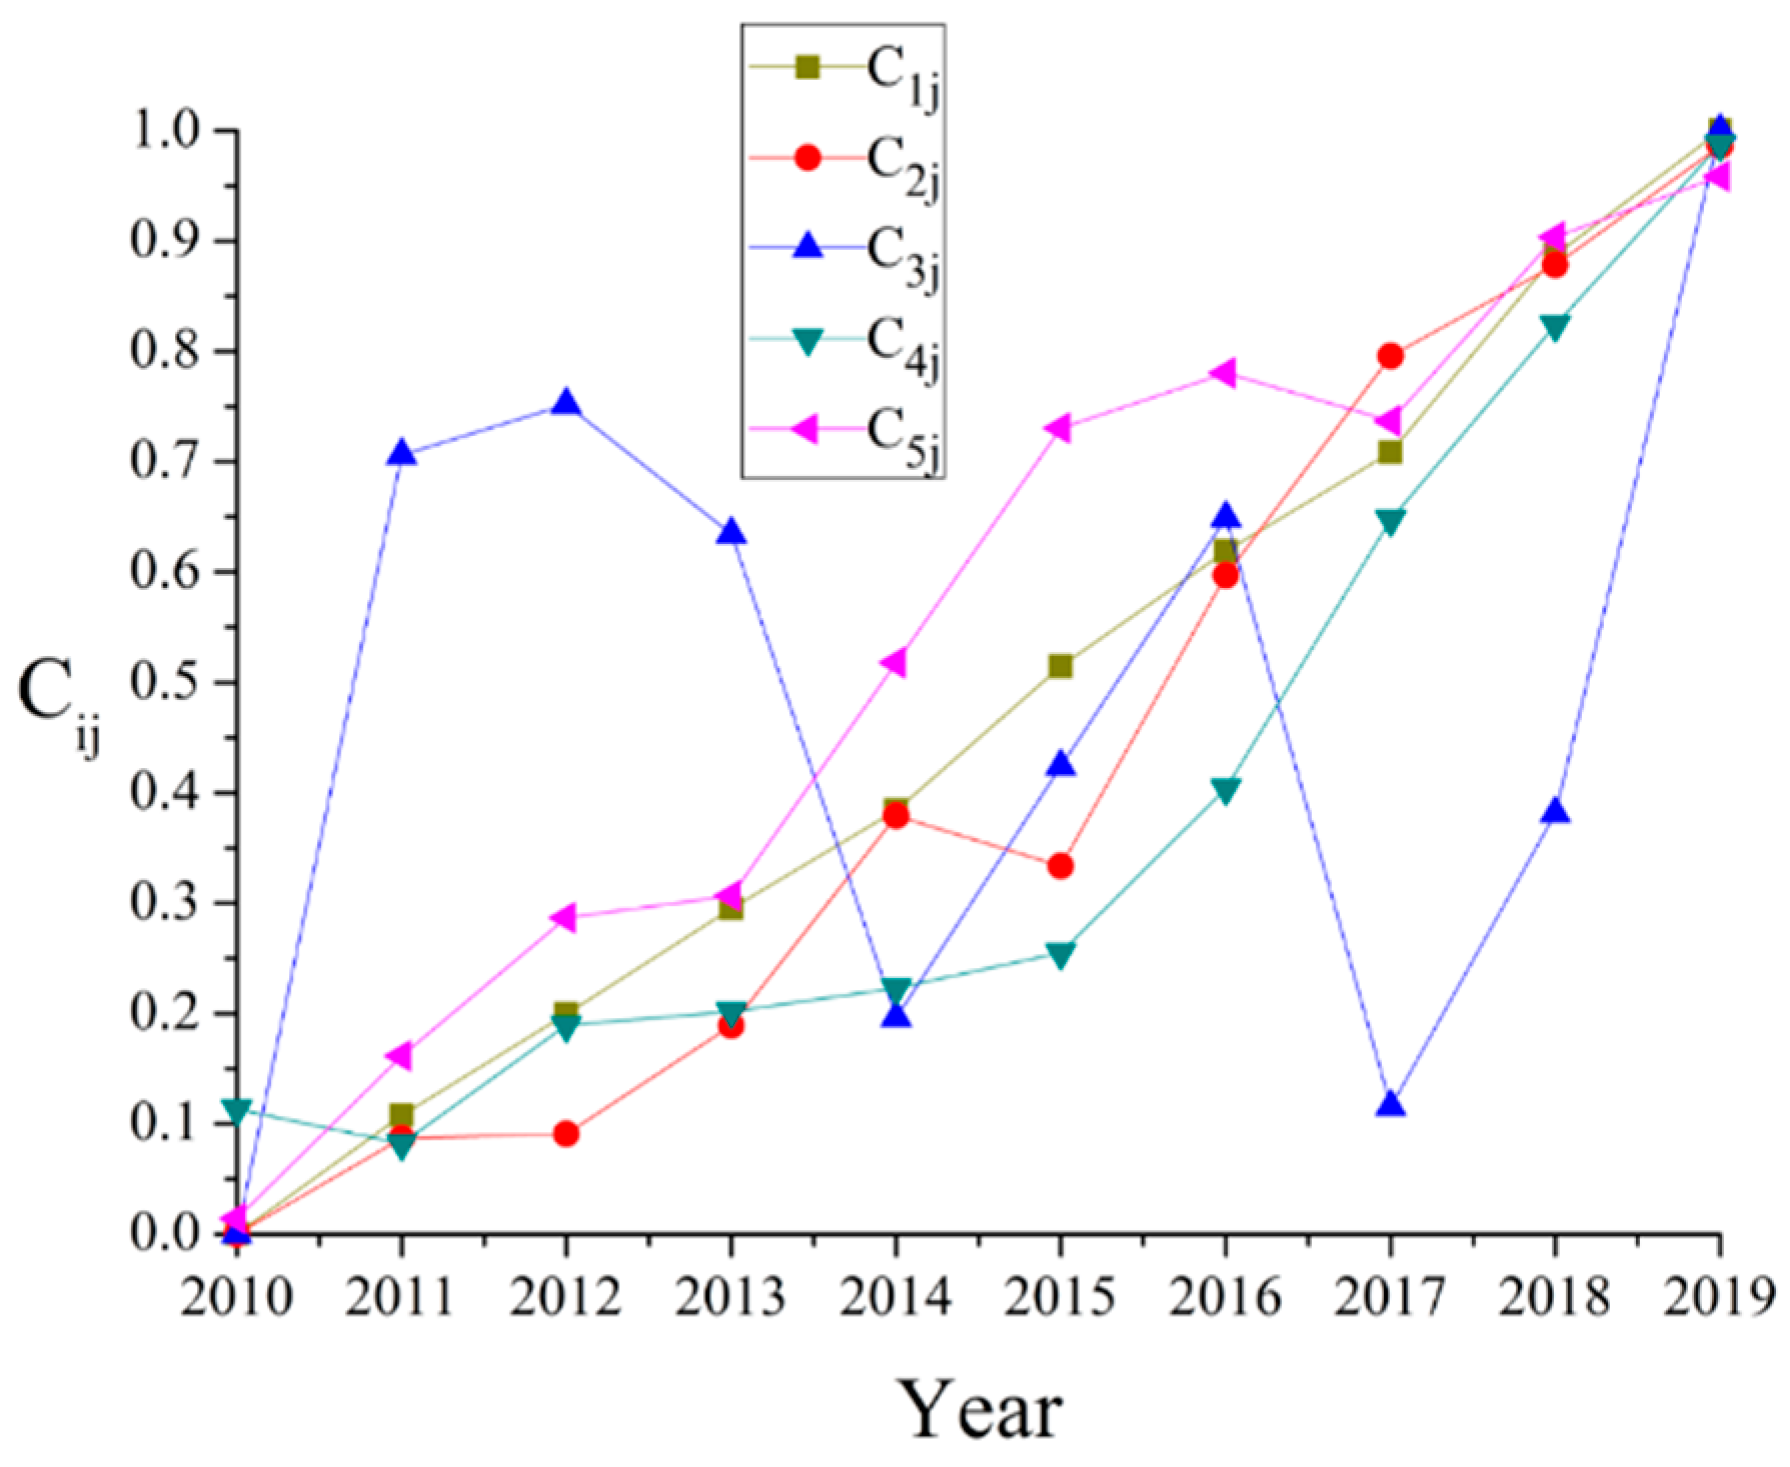
Analyzing the different sub-dimensions (Figure 6), the change in ~ is specified as follows.
Driving force subsystem: generally shows an upward trend and a steady increase rate from 2010 to 2019. Taking 2010 as the base point, the growth rate maintains a yearly increase of about 0.1000 during the whole period, reflecting the gradual enhancement of the water environment carrying capacity of the subsystem correspondingly.
Pressure subsystem: within 2010–2019 shows an overall rising trend, but there are small fluctuations within the period, such as 2011–2012, and 2017–2018, where the upward trend is significantly slower than the previous period, and dropped significantly from 0.3791 to 0.3335 in 2014–2015.
State subsystem: within 2010~2019 shows a large fluctuation, rising from the beginning of the study period to 0.7518 in 2012, and then continuing to decline to 0.1963 in 2014, after which it gains an increase from 2014 to 2016, declines significantly to 0.1153 in 2016~2017, and then continues to rebound. The overall change in during the period is large, and the cyclical changes of decline and rebound back are obvious.
Impact subsystem: of the impact subsystem shows an overall rising trend from 2010 to 2019, reflecting the gradual increase in the carrying capacity of the impact subsystem. Compared with the , has a similar but slightly slower trend of increase, and the governance performance value is also slightly lower than .
Response subsystem: the upward trend of from 2010 to 2019 reflects the gradual increase in the carrying capacity. Still using as the reference, the rising trend of is similar but the increase is slightly larger, and the value of is also slightly higher than .
4.4. Analysis of the Sub-Dimensional Result of –
Driving force subsystem: the increasing trend of is closely related to the rapid economic development and the enhancement of people’s living standards in the past 10 years. The per capita GDP of Taihu Basin jumped from 79,000 RMB in 2010 to 157,000 RMB in 2019, with an average annual growth rate of 6.9%. As a consequence, regional economic growth provides more adequate financial support for water environment management. Take Jiangsu Province as an example, the finance department arranges 2 billion yuan of special guiding funds for the treatment of Taihu basin every year, and the local finance takes out 10–20% of the financial funds to match the same, which has supported more than 6400 watershed treatment projects and drove the whole society to invest more than 100 billion into it. The reasonable allocation of resources further promotes water environmental governance, and raises the system carrying capacity year by year.
Pressure subsystem: shows an overall upward trend from 2010 to 2019, but there are small fluctuations within the period. This study tends to explain the evaluation results from the perspective of secondary industry development. According to statistical data, in 2011, the Taihu basin produced 10.8% of the country’s gross regional product and the economic output occupies a pivotal position in the country. However, the water environment in the basin has been affected a lot. On the one hand, the water demand is increasing, and especially industrial water faces a huge demand gap. On the other hand, the increase in pollutant emissions has caused negative pressure on the environment. The previous crude economic development had a negative impact, and the basin has taken positive actions to accelerate the transformation. In recent years, the problem of water shortage for the industry has been relived through water transfer from outside the region, such as the implementation of the “Yangtze–Taihu Water Diversion Project”. The Government has guided the industry to develop in the direction of light pollution and low energy consumption by improving water efficiency, optimizing the industrial structure and promoting clean production, which effectively relieved the pressure on the water environment caused by industrial pollution problems.
States subsystem: shows a “W” pattern from 2010 to 2019, with obvious cyclical changes, which is closely related to the characteristics of the lake body and the treatment means. The unique geographical, hydrological and meteorological characteristics of the Taihu basin form an ecosystem, together with the high load of nitrogen and phosphorus nutrient inputs, and provide external conditions for cyanobacterial bloom outbreaks. The fourfold cycle of nitrogen and phosphorus nutrients adds to the long treatment cycles and duplication of watershed management. Throughout the history of pollution control, the Government has implemented various actions, including the construction of sewage treatment facilities, cyanobacteria salvage, ecological dredging, etc., which have good short-term effects, but in the long run, they cannot solve the underlying problem, and the effects are not sustainable. The state of the basin has remained precarious in recent years.
Impact subsystem: within 2010–2019 shows an overall rising pattern, but the trend is slow. There are mainly the following reasons. First, the discharge is well managed. The wastewater treatment capacity is sufficient for the basin, and the industrial wastewater, farming wastewater and domestic wastewater are strictly managed by category. Second, the industrial structure is being optimized. The wastewater discharge of Taihu basin has shown a decreasing trend in recent years, which is related to the steady development of new energy, electronics, biomedicine, software and other new industries in the region, so that the proportion of traditional machinery, metallurgy, chemical industry and textile decreases, further reducing pollution. However, we should also note that although the industrial pollution is controlled, the emerging high-tech industries are still in the early stage of development, and its influence on the impact subsystem still needs to be strengthened subsequently. In addition, the water diversion project implemented in recent years has been successful in improving the water quality of the Taihu basin by accelerating the flow rate of water bodies. Therefore, by taking advantage of the river and sea nearby, we can continue to implement scientific drainage, to improve the capacity of the water environment and ecological restoration capacity of the Taihu basin.
Response subsystem: generally shows an upward trend and an obvious growth during 2010–2019, which is inextricably linked to collaborative governance by the basin government, research institutions, universities, enterprises and residents. With the release of “Taihu Lake Basin Management Regulations” in 2011, the environmental protection departments of Jiangsu Province and Zhejiang Province, where the basin is located, have implemented precise measures and increased supporting infrastructure, thus the level of water environment governance has been continuously improved. The patented technology is an indispensable support for governance by guiding production and transformation in action. For example, the patented product “modified biological substrate improver” is used to remove endogenous pollution and prevent algal blooms; deep artificial aeration technology enhances the dissolved oxygen concentration at the bottom of the river, effectively improving the microbial environment of the substrate. Farmers take measures to improve irrigation techniques in conjunction with efficient and rational use of water resources. Overall, the response subsystem reflects a remarkable increase in the carrying capacity of the water environment as a result of concerted action by multiple parties.
4.5. Results of the Diagnostic Model of Barrier Factors
To further make targeted suggestions for improving the performance of water environmental governance in the Taihu basin, we conduct the diagnostic model of barrier factors to analyze the result of Cj. According to the calculation method in Section 3.2, the of indicators within the evaluation index system in the past 5 years is calculated separately. The top 6 indicators are selected in the order of the value of , and the results are shown in Table 3.
From Table 3, the selected indicators with the top six barrier degrees in 5 years are as follows: key cross-sections’ water quality compliance rate (I12), the water quality compliance rate of key water function areas (I11), water consumption per 10,000 yuan of industrial added value (I5). The indicator with the top six barrier degree in 4 of the 5 years is the lake trophic status index (I10). The indicators with the top six barrier degree in 2 of the 5 years are the contribution of secondary industry to GDP growth (I6), water consumption for agricultural irrigation (I15), and GDP per capita (I1), and the other indicators within the top 6 barrier degree in 5 years include 14/I7/I13/I14/I18.
The result reveals that the barrier factors of the impact subsystem are more concentrated (I11/I12/I13/I14), especially factors relating to the water quality has a more intuitive improvement on the performance of water environment governance. In addition, among the barrier factors of the pressure subsystem (15/I6/I7), there is a particular need to focus on industrial water use efficiency and industrial water-saving potential. Attention should also be paid to I10 to reduce nutrient input to the water body and ecological restoration of the basin. The impact of I1 and I6 suggests that the development of the Taihu basin should realize a shift from sloppy to intensive economic growth. By introducing scientific water conservation and irrigation measures, the utilization rate of irrigation water can be improved, thus achieving efficient development. In summary, the new stage of improving the performance of the regional water environment governance of Taihu basin should focus on the impact subsystem and the pressure subsystem, while taking into account the other three types of subsystems to improve the overall performance of regional water environmental governance together.
4.6. Discussion
From the above analysis, it is clear that the Taihu basin has experienced water environment problems in recent years. Actions related to water environment governance are also ongoing. Economic development has led to more than sufficient financial funds for watershed management, but we should also note that the costs for water environment governance are currently mainly borne by the Government, which is under greater financial pressure. Moreover, the local economy is facing slower growth, making it difficult to continue the high level of investment in governance as in previous years. There are risks to the sustainability of water environment governance. Thus the watershed governance must change the Government’s single-entity model and provide a reasonable cost-sharing mechanism. Promote the sharing of costs arising from ecological protection and environmental management by multiple entities. Moreover, the cost effect can create a backward pressure to induce enterprises to transform and upgrade.
It is a long-term process to adjust the industrial structure and change the mode of economic development, and the high level of pollution of the lake will continue. To achieve effective treatment in this situation, a comprehensive strategy of “source treatment–pollution mitigation–ecological restoration” needs to be implemented. While focusing on industrial emissions and reducing external pollution, we should continue to implement strict wastewater classification management measures, improve water efficiency and control internal pollution through technological means. We should continue to implement inter-basin water transfer measures, thereby enhancing the carrying capacity of the water environment and ecological restoration. Multi-entity participation is effective in improving the water environment performance governance, and we need to pay particular attention to the lack of public participation in current water governance measures. The public’s perception of environmental risk is irrational. They rely more on direct perceptions of environmental pollution and media campaigns [56], and the lack of action on environmental protection is closely linked to their concerns about the credibility of regulators [37]. This requires the regulatory authorities to establish an information-sharing mechanism for watershed governance, and to widely inform public opinion through regular environmental bulletins or the influence of the media. In terms of regional synergy, a protection mechanism for the unified planning and management of water resources and the water environment, and a consultation mechanism across basins and administrative regions, will be established to support water environment management efforts through a system of incentives and accountability. There is also a need to accelerate the integration of industry, academia and research to enhance the effectiveness of scientific and technological achievements and to empower the high-quality development of watershed governance.
This study uses the DPSIR framework to evaluate the effectiveness of water environment governance in the Taihu basin. By combining the actual situation of the basin and the governance process, the causes and obstructive factors affecting the water environment governance are identified, and countermeasure suggestions are given in a targeted manner. In conclusion, scientific planning, basin integration and close cooperation of multiple subjects are required to curb the effective improvement of the water environment and to truly protect the Taihu basin.
The study points out the direction for the enhancement of the water environment quality in the Taihu basin, and provides a reference for water environment protection planning and policy formulation. The results of the study can also provide reference experience for other countries and regions in watershed management. However, in future studies, more factors in a wider context need to be considered when assessing watershed governance, such as climate change [51], the construction of smart cities [57] and risk prevention, which directly or indirectly affect the environmental carrying capacity of watersheds. Adapting the indicator system when applying it is a step that needs to be taken in the future.
5. Conclusions and Suggestions
5.1. Conclusions
Based on the water environmental problem of the Taihu basin, this paper establishes the DPSIR model of water environment governance performance and selects panel data from 2010 to 2019 to conduct the study. The results show a general upward trend in Cj over the study period, from 0.0673 at the beginning of 2010 to 1.0000 at the end of the study period in 2019, reflecting the sustained improvement in the water environment governance performance of the Taihu basin. The results of the sub-dimensional evaluation show that continues to grow and maintain a steady growth rate of approximately 0.1000 per year. This is closely related to the economic development of the basin and the allocation of financial resources, which leads to a continuous increase in the level of carrying capacity of the driving force subsystem. shows an overall upward trend, but there are small fluctuations during the upward period. The reason is that although water sources are introduced into the basin to enhance the positive interaction between rivers and lakes, industrial water consumption and sewage generation in the basin remain high. The trend of is in the shape of a “W”, with a clear cyclical trend. This is due to the short maintenance time and repeated treatment of pollution in the watershed, and the health status of the watershed still needs to be improved. is increasing overall, but the trend is slightly slower. This is related to the fact that the industrial structure of the basin still needs to be improved. is generally on the rise and growing significantly, due to the improved water environment governance performance by the synergistic management of multiple entities.
Based on the results of the diagnostic model of barrier factors, the main barriers that have constrained water environment governance performance over the past five years were identified. The main barrier factors include the key cross-sections’ water quality compliance rate (I12), the water quality compliance rate of key water function areas (I11), water consumption per 10,000 yuan of industrial added value (I5), the lake trophic status index (I10), contribution of secondary industry to GDP growth (I6), water consumption for agricultural irrigation (I15), and GDP per capita (I1). Among them, the impact subsystem and the pressure subsystem have a higher concentration of barrier factors and need to focus on, while we should also take into account the other three types of subsystems of various key obstacles.
5.2. Suggestions
- (1)
- Strengthen sewage treatment and reduce the discharge
First, focus on industrial pollution. Promote industrial restructuring, raise the regional entry threshold for relevant companies, and strictly limit the emission of industries with heavy pollution. Second, control agricultural pollution. Reduce the use of chemical fertilizers and pesticides, and vigorously promote organic agriculture and ecological agriculture. Third, manage domestic sewage discharge. Speed up the construction of various scales of sewage treatment plants according to local conditions, and comprehensively strengthen the treatment of all kinds of sewage in the Taihu basin.
- (2)
- Optimise the industrial structure, realize clean production, and improve water efficiency
Adjust the existing industrial structure, promote cleaner production and guide industrial transformation towards light pollution and low energy consumption. Accelerate the elimination of backward production capacity, thus directly reducing the discharge in the production process and achieving source control. Strengthen the research on irrigation-related technologies and make full use of precipitation by adopting new measures such as water storage, water interception and water conservation. Strengthen the construction of agricultural water conservation facilities and improve the level of agricultural water conservation.
- (3)
- Use multiple ways to control existing pollution and improve the capacity of the water environment
Promote the water environment capacity and ecological restoration capacity. Continue to implement water transfer measures to promote the flow and exchange of water bodies, so that high-quality water from the Yangtze River can enter the Taihu basin. It has been proven that the diversion of water has been successful in improving the water quality. Introduce high-tech tools into water environment management, such as source pollution control systems, artificial aeration systems and submerged plant purification systems, coupled with traditional techniques, ecological dredging and cyanobacteria salvage, can effectively improve the water quality of the Taihu basin.
- (4)
- Promote cost-sharing and collaborate with multiple parties to achieve governance changes
It is vital to change the single-cost model of investment for governance. A reasonable cost-sharing mechanism is needed to achieve sustainable water environment governance in the basin. As users of water resources, the enterprises should bear the costs of water use and sewage treatment. The cost effect can, in turn, lead to industrial transformation and upgrading. However, in the long term, the environmental costs borne by companies will ultimately be passed on to the public through their products. Further, as participants in governance, the public should take the initiative to share the responsibility. This requires increased publicity and raising public awareness of environmental protection.
- (5)
- Strengthen the institutional basis, reinforce the water quality supervision and accountability system
Build a cross-basin and cross-administrative consultation mechanism, actively implement water quality testing and water environment supervision, to support governance through the top-level design of incentive and accountability systems. Strengthen information sharing by regularly publishing environmental bulletins. Deepen accountability for water quality, increase the strength of rewards and punishments, and reinforce public participation.
Only by working closely together of all the parties can we fundamentally improve the environment and achieve sustainable development of the Taihu basin.
Author Contributions
X.H. conceived and designed the study; W.H. completed the paper in English and revised it critically for important intellectual content; X.D. gave much good research advice and revised the manuscript. All authors have read and agreed to the published version of the manuscript.
Funding
This paper was supported by the National Water Pollution Control and Management Science and Technology Major Project. Sub-topic: Water Quality Improvement Technology and Engineering Demonstration in Small Watersheds of Heavily Polluted Rivers (2012ZX07101-013-02).
Institutional Review Board Statement
Not applicable.
Informed Consent Statement
Not applicable.
Data Availability Statement
The data used in this study are available from the corresponding author upon request.
Conflicts of Interest
The authors declare no conflict of interest.
References
- Lu, S.; Xiao, B.; Li, J.; Tang, Y.; Guo, M. Research on standard calculation method for watershed water pollution compensation. Sci. Total Environ. 2020, 737, 138157. [Google Scholar] [CrossRef] [PubMed]
- Graham, A.; Metz, D. Limits to growth. Air Transp.-A Tour. Perspect. 2019, 48, 41–53. [Google Scholar] [CrossRef]
- Balthazard-Accou, K.; Emmanuel, E.; Agnamey, P.; Raccurt, C. Pollution of Water Resources and Environmental Impacts in Urban Areas of Developing Countries: Case of the City of Les Cayes (Haiti). Environ. Health Manag. Prev. Pract. 2020. [Google Scholar] [CrossRef] [Green Version]
- Kohzu, A.; Shimotori, K.; Imai, A. Effects of macrophyte harvesting on the water quality and bottom environment of Lake Biwa, Japan. Limnology 2019, 20, 83–92. [Google Scholar] [CrossRef]
- Silveira, A. China’s political system, economic reform and the governance of water quality in the Pearl River Basin. In Federal Rivers: Managing Water in Multi-Layered Political Systems; Edward Elgar Publishing Limited: Cheltenham, UK, 2014; pp. 261–279. ISBN 9781781955055. [Google Scholar]
- Li Li China: A Watershed Moment for Water Governance. Available online: https://www.worldbank.org/en/news/press-release/2018/11/07/china-a-watershed-moment-for-water-governance (accessed on 9 November 2021).
- Araral, E.; Ratra, S. Water governance in India and China: Comparison of water law, policy and administration. Water Policy 2016, 18, 14–31. [Google Scholar] [CrossRef]
- Wang, Y.; Cao, H.; Yuan, Y.; Zhang, R. Empowerment through emotional connection and capacity building: Public participation through environmental non-governmental organizations. Environ. Impact Assess. Rev. 2020, 80, 106319. [Google Scholar] [CrossRef]
- O’Laoire, R.W.D. Corporate Environmental Management 1: Systems and Strategies; Routledge: London, UK, 2014; ISBN 1134187343. [Google Scholar]
- Srebotnjak, T. Environmental Performance Index. Wiley StatsRef Stat. Ref. Online 2014. [Google Scholar] [CrossRef]
- Gallego-Ayala, J.; Juízo, D. Performance evaluation of River Basin Organizations to implement integrated water resources management using composite indexes. Phys. Chem. Earth 2012, 50–52, 205–216. [Google Scholar] [CrossRef]
- Bu, H.; Wan, J.; Zhang, Y.; Meng, W. Spatial characteristics of surface water quality in the Haicheng River (Liao River basin) in Northeast China. Environ. Earth Sci. 2013, 70, 2865–2872. [Google Scholar] [CrossRef]
- Stanescu, S.G.; Ionescu, C.A.; Coman, M.D. Environmental Audit Contribution to the Evaluation and Control of Environmental Information. Int. Conf. Glob. Innov. Dev. Trends Prospect. 2020, 10, 200–213. [Google Scholar] [CrossRef]
- Pires, A.; Morato, J.; Peixoto, H.; Botero, V.; Zuluaga, L.; Figueroa, A. Sustainability Assessment of indicators for integrated water resources management. Sci. Total Environ. 2017, 578, 139–147. [Google Scholar] [CrossRef] [PubMed]
- Lane, B.; Pablo Ortiz-Partida, J.; Sandoval-Solis, S. Extending water resources performance metrics to river ecosystems. Ecol. Indic. 2020, 114, 106336. [Google Scholar] [CrossRef] [Green Version]
- Luo, H.; Zhao, W.; Bai, J.; Tang, J.; Yang, A. Performance evaluation and obstacle degree analysis of water resources management based on GC-TOPSIS Model. J. Water Resour. Water Eng. 2019, 8, 26–31. (In Chinese) [Google Scholar]
- Ye, H.; Ma, Y.; Dong, L. Land ecological security assessment for bai autonomous prefecture of dali based using PSR model-with data in 2009 as case. Energy Procedia 2011, 5, 2172–2177. [Google Scholar] [CrossRef] [Green Version]
- Kohsaka, R. Developing biodiversity indicators for cities: Applying the DPSIR model to Nagoya and integrating social and ecological aspects. Ecol. Res. 2010, 25, 925–936. [Google Scholar] [CrossRef]
- Wang, Q.; Li, S.; Li, R. Evaluating water resource sustainability in Beijing, China: Combining PSR model and matter-element extension method. J. Clean. Prod. 2019, 206, 171–179. [Google Scholar] [CrossRef]
- Henriques, C.; Garnett, K.; Weatherhead, E.K.; Lickorish, F.A.; Forrow, D.; Delgado, J. The future water environment—Using scenarios to explore the significant water management challenges in England and Wales to 2050. Sci. Total Environ. 2015, 512–513, 381–396. [Google Scholar] [CrossRef] [PubMed]
- Zhang, Y.; Chu, C.; Liu, L.; Xu, S.; Ruan, X.; Ju, M. Water environment assessment as an ecological red line management tool for marine wetland protection. Int. J. Environ. Res. Public Health 2017, 14, 870. [Google Scholar] [CrossRef] [Green Version]
- Yu, Y.; Zhu, J. Research on Construction and Application of Environmental Performance Evaluation Indicators for Water Environment Governance: A Case Study of Chengdu. Sichuan Environ. 2019, 38, 90–100. (In Chinese) [Google Scholar]
- Jung, C.G.; Park, J.Y.; Kim, S.J.; Park, G.A. The SRI (system of rice intensification) water management evaluation by SWAPP (SWAT-APEX Program) modeling in an agricultural watershed of South Korea. Paddy Water Environ. 2014, 12, 251–261. [Google Scholar] [CrossRef]
- Yu, J. Coordinated development of urban economy and total amount control of water environmental pollutants in the Yellow River basin. Arab. J. Geosci. 2021, 14, 658. [Google Scholar] [CrossRef]
- Abdi-Dehkordi, M.; Bozorg-Haddad, O.; Salavitabar, A.; Goharian, E. Developing a sustainability assessment framework for integrated management of water resources systems using distributed zoning and system dynamics approaches. Environ. Dev. Sustain. 2021, 23, 16246–16282. [Google Scholar] [CrossRef]
- Huysamen, T. Optimising water resources with technology. Water Sew. Effl. 2018, 38, 12–13. [Google Scholar]
- Hien Than, N.; Dinh Ly, C.; Van Tat, P. The performance of classification and forecasting Dong Nai River water quality for sustainable water resources management using neural network techniques. J. Hydrol. 2021, 596, 126099. [Google Scholar] [CrossRef]
- Alodah, A.; Seidou, O. The adequacy of stochastically generated climate time series for water resources systems risk and performance assessment. Stoch. Environ. Res. Risk Assess. 2019, 33, 253–269. [Google Scholar] [CrossRef]
- Li, B.; Wu, Q.; Zhang, W.; Liu, Z. Water resources security evaluation model based on grey relational analysis and analytic network process: A case study of Guizhou Province. J. Water Process Eng. 2020, 37, 101429. [Google Scholar] [CrossRef]
- Cao, F.; Lu, Y.; Dong, S.; Li, X. Evaluation of natural support capacity of water resources using principal component analysis method: A case study of Fuyang district, China. Appl. Water Sci. 2020, 10, 192. [Google Scholar] [CrossRef]
- Zhao, Y.; Wang, Y.; Wang, Y. Comprehensive evaluation and influencing factors of urban agglomeration water resources carrying capacity. J. Clean. Prod. 2021, 288, 125097. [Google Scholar] [CrossRef]
- Singh, A.P.; Dhadse, K.; Ahalawat, J. Managing water quality of a river using an integrated geographically weighted regression technique with fuzzy decision-making model. Environ. Monit. Assess. 2019, 191, 378. [Google Scholar] [CrossRef]
- Huang, H.F.; Kuo, J.; Lo, S.L. Review of PSR framework and development of a DPSIR model to assess greenhouse effect in Taiwan. Environ. Monit. Assess. 2011, 177, 623–635. [Google Scholar] [CrossRef]
- Zou, H.; Ma, X. Identifying resource and environmental carrying capacity in the Yangtze River Economic Belt, China: The perspectives of spatial differences and sustainable development. Environ. Dev. Sustain. 2021, 23, 14775–14798. [Google Scholar] [CrossRef]
- Mandić, A. Structuring challenges of sustainable tourism development in protected natural areas with driving force–pressure–state–impact–response (DPSIR) framework. Environ. Syst. Decis. 2020, 40, 560–576. [Google Scholar] [CrossRef]
- Zhang, Y.; Sun, M.; Yang, R.; Li, X.; Zhang, L.; Li, M. Decoupling water environment pressures from economic growth in the Yangtze River Economic Belt, China. Ecol. Indic. 2021, 122, 107314. [Google Scholar] [CrossRef]
- Bickerstaff, K. Risk perception research: Socio-cultural perspectives on the public experience of air pollution. Environ. Int. 2004, 30, 827–840. [Google Scholar] [CrossRef]
- Nazer, D.W.; Siebel, M.A.; van der Zaag, P.; Mimi, Z.; Gijzen, H.J. A Financial, Environmental and Social Evaluation of Domestic Water Management Options in the West Bank, Palestine. Water Resour. Manag. 2010, 24, 4445–4467. [Google Scholar] [CrossRef] [Green Version]
- Kaur, M.; Hewage, K.; Sadiq, R. Investigating the impacts of urban densification on buried water infrastructure through DPSIR framework. J. Clean. Prod. 2020, 259, 120897. [Google Scholar] [CrossRef]
- Xu, Y.; Su, B.; Wang, H.; He, J.; Yang, Y. Analysis of the water balance and the nitrogen and phosphorus runoff pollution of a paddy field in situ in the Taihu Lake basin. Paddy Water Environ. 2020, 18, 385–398. [Google Scholar] [CrossRef]
- Yan, Y.; Deng, Y.; Ji, M.; Xu, X.; Zhang, L.; Wang, G. Antibiotic pollution and risk assessment under different cultivation modes in aquaculture ponds of the Taihu Lake Basin, China. Mar. Freshw. Res. 2020, 71, 1234–1240. [Google Scholar] [CrossRef]
- Withanachchi, S.S.; Ghambashidze, G.; Kunchulia, I.; Urushadze, T.; Ploeger, A. A paradigm shift in water quality governance in a transitional context: A critical study about the empowerment of local governance in Georgia. Water 2018, 10, 98. [Google Scholar] [CrossRef] [Green Version]
- Mosaffaie, J.; Salehpour Jam, A.; Tabatabaei, M.R.; Kousari, M.R. Trend assessment of the watershed health based on DPSIR framework. Land Use Policy 2021, 100, 104911. [Google Scholar] [CrossRef]
- Liu, W.W.; Guo, Z.L.; Wang, D.A.; Zhang, M.Y.; Zhang, Y.G. Spatial-Temporal Variation of Water Environment Quality and Pollution Source Analysis in Hengshui Lake. Huanjing Kexue/Environ. Sci. 2021, 42, 1361–1371. [Google Scholar] [CrossRef]
- Lin, C.; Xiong, J.; Ma, R.; Zhu, C. Identifying the critical watershed regions creating lake nutrient enrichment (SLRs) based on a watershed-lake integrated perspective—A case study of Chaohu Lake Basin, China. Ecol. Indic. 2021, 121, 107037. [Google Scholar] [CrossRef]
- Kamarudin, M.K.A.; Wahab, N.A.; Jalil, N.A.A.; Sunardi; Saad, M.H.M. Water quality issues in water resources management at Kenyir Lake, Malaysia. J. Teknol. 2020, 82, 1–11. [Google Scholar] [CrossRef] [Green Version]
- Zhang, X.J.; Ding, K.S.; Hao, M.R.; Long, M. Emergency water supply and water resources management in Tongzhou District, Nantong City, China. Int. J. Environ. Stud. 2017, 74, 412–427. [Google Scholar] [CrossRef]
- Su, Y.; Gao, W.; Guan, D.; Zuo, T. Achieving Urban Water Security: A Review of Water Management Approach from Technology Perspective. Water Resour. Manag. 2020, 34, 4163–4179. [Google Scholar] [CrossRef]
- Jia, C.; Jingjing, D.; Yanan, W.; Bin, X.; Yanting, S. Exploration of key issues of Taihu Lake governance and protection in the new development stage. China Water Resour. 2021, 5, 24–27. (In Chinese) [Google Scholar]
- State Statistical Burreau. China Statistical Yearbook 2010–2019; China Statistics Press: Beijing, China, 2019.
- Singh, A.P.; Dhadse, K. Economic evaluation of crop production in the Ganges region under climate change: A sustainable policy framework. J. Clean. Prod. 2021, 278, 123413. [Google Scholar] [CrossRef]
- Guo, Z. Evaluation of Financial Ability of Port Listed Companies Based on Entropy Weight TOPSIS Model. J. Coast. Res. 2020, 103, 182–185. [Google Scholar] [CrossRef]
- Yue-Ming, H.; Dan, F.; Hong-Yan, Z.; Yuan, L. Efficiency evaluation of intelligent swarm based on AHP entropy weight method. J. Phys. Conf. Ser. 2020, 1693, 012072. [Google Scholar] [CrossRef]
- Chen, P. Effects of the entropy weight on TOPSIS. Expert Syst. Appl. 2021, 168, 114186. [Google Scholar] [CrossRef]
- Herranz, N.; Ruiz-Castillo, J. Sub-field normalization in the multiplicative case: Average-based citation indicators. J. Informetr. 2012, 6, 543–556. [Google Scholar] [CrossRef] [Green Version]
- Withanachchi, S.S.; Kunchulia, I.; Ghambashidze, G.; Al Sidawi, R.; Urushadze, T.; Ploeger, A. Farmers’ perception of water quality and risks in the Mashavera River Basin, Georgia: Analyzing the vulnerability of the social-ecological system through community perceptions. Sustainability 2018, 10, 3062. [Google Scholar] [CrossRef] [Green Version]
- Tauseef Hassan, S.; Xia, E.; Lee, C.C. Mitigation pathways impact of climate change and improving sustainable development: The roles of natural resources, income, and CO2 emission. Energy Environ. 2021, 32, 338–363. [Google Scholar] [CrossRef]
Figure 1.
Schematic of DPSIR model.

Figure 2.
The DPSIR model of water environment governance performance.

Figure 3.
Schematic diagram of the study area delineated in this study. (a) The location of Taihu basin in China. (b) The study area of Taihu basin. (c) Distribution of main lakes and rivers in Taihu basin.
Figure 3.
Schematic diagram of the study area delineated in this study. (a) The location of Taihu basin in China. (b) The study area of Taihu basin. (c) Distribution of main lakes and rivers in Taihu basin.

Figure 4.
Schematic diagram of the methodology.

Figure 5.
The result of Cj, .

Figure 6.
Evaluation results of the D–P–S–I–R subsystem.


Table 1.
The evaluation index system based on the DPSIR model.
| Target Layer | Serial Number | Indicator Layer | Meaning of the Selection | Attribute |
|---|---|---|---|---|
| Driving force | I1 | GDP per capita (million yuan) | Reflecting the driving effect of economic development on water environment in the Taihu basin | + |
| I2 | Per capita disposable income of residents (yuan) | Reflecting the driving effect of the improvement of urban residents’ living standards on water environment in the Taihu basin | + | |
| I3 | Value added of the total output of secondary industry (billion yuan) | Reflecting the driving effect of industrial development on water environment in the Taihu basin | + | |
| I4 | Agriculture, forestry and water affairs input amount (million yuan) | Reflecting the driving effect of financial investment on water environment in the Taihu basin | + | |
| Pressure | I5 | Water consumption for 10,000 yuan of industrial added value (m3) | Reflecting the pressure of industrial production water efficiency on the water environment in the Taihu basin | − |
| I6 | Contribution of secondary industry to GDP growth (%) | Reflecting the pressure of industrial structure composition on the water environment in the Taihu basin | − | |
| I7 | Secondary industry wastewater discharge (billion tons) | Reflecting the pressure of secondary industry sewage treatment and discharge on the water environment in the Taihu basin | − | |
| State | I8 | Permanganate index (CODMn) (mg/L) | Reflects the current state of organic and inorganic oxidizable substances pollution in the water | − |
| I9 | Total ammonia nitrogen concentration of water (mg/L) | Reflects the current status of ammonia and nitrogen levels in the water | − | |
| I10 | Lake trophic status level index | Reflecting the current state of lake eutrophication in the water environment around the Taihu basin | − | |
| Impact | I11 | Water quality compliance rate of key water function areas (%) | Reflecting the impact on water quality in the key water function areas of the Taihu basin | + |
| I12 | Water quality compliance rate of key cross-sections (%) | Reflecting the impact on the water quality of key cross-sections within the key areas of the Taihu basin | + | |
| I13 | Water quality compliance rate of provincial boundary rivers (%) | Reflecting the impact on the water quality of provincial boundary rivers around the Taihu basin | + | |
| I14 | Taihu basin water supply (billion m3) | Reflecting the water supply available in the region around the Taihu basin | − | |
| Response | I15 | Water consumption for agricultural irrigation (billion m3) | Reflects changes in irrigation water consumption for agricultural production in the Taihu basin | − |
| I16 | Urban sewage treatment rate (%) | Reflecting the change of urban domestic sewage treatment in the Taihu basin | + | |
| I17 | Completion rate of water environment complaints (%) | Reflecting the satisfaction of the residents of the area with water management and the enforcement and supervision of government departments | + | |
| I18 | Number of relevant published papers (piece) | Reflecting the research results of universities on the governance of the Taihu basin | + | |
| I19 | Number of granted patents (piece) | Reflecting the research and development of Lake Tai governance technology and the transformation of results | + |
Table 2.
The overall and sub-dimensional evaluation results of the water environment governance performance in the Taihu basin.
Table 2.
The overall and sub-dimensional evaluation results of the water environment governance performance in the Taihu basin.
| Year | Cj | Cj1 | Cj2 | Cj3 | Cj4 | Cj5 |
|---|---|---|---|---|---|---|
| 2010 | 0.0673 | 0.0000 | 0.0000 | 0.0000 | 0.1131 | 0.0141 |
| 2011 | 0.2011 | 0.1074 | 0.0867 | 0.7060 | 0.0820 | 0.1614 |
| 2012 | 0.2575 | 0.1993 | 0.0908 | 0.7518 | 0.1893 | 0.2866 |
| 2013 | 0.2762 | 0.2952 | 0.1891 | 0.6343 | 0.2017 | 0.3068 |
| 2014 | 0.3371 | 0.3842 | 0.3791 | 0.1963 | 0.2231 | 0.5180 |
| 2015 | 0.4112 | 0.5146 | 0.3335 | 0.4241 | 0.2551 | 0.7305 |
| 2016 | 0.5483 | 0.6190 | 0.5969 | 0.6491 | 0.4042 | 0.7803 |
| 2017 | 0.6393 | 0.7086 | 0.7959 | 0.1153 | 0.6477 | 0.7368 |
| 2018 | 0.7897 | 0.8874 | 0.8783 | 0.3813 | 0.8240 | 0.9038 |
| 2019 | 1.0000 | 1.0000 | 0.9862 | 1.0000 | 0.9877 | 0.9588 |
Table 3.
Analysis of the barrier degree of each index on .
| Index Ranking | 2015 | 2016 | 2017 | 2018 | 2019 | |||||
|---|---|---|---|---|---|---|---|---|---|---|
| Indicators | Indicators | Indicators | Indicators | Indicators | ||||||
| 1 | I15 | 43.30 | I10 | 34.11 | I10 | 25.08 | I12 | 31.00 | I12 | 19.13 |
| 2 | I14 | 24.83 | I12 | 19.07 | I12 | 15.44 | I5 | 16.40 | I11 | 14.24 |
| 3 | I6 | 22.23 | I5 | 10.45 | I11 | 9.94 | I11 | 9.95 | I5 | 13.18 |
| 4 | I12 | 14.56 | I11 | 5.34 | I5 | 7.99 | I10 | 7.59 | I6 | 9.77 |
| 5 | I11 | 12.45 | I1 | 4.56 | I18 | 4.72 | I1 | 5.22 | I10 | 9.03 |
| 6 | I5 | 1.20 | I15 | 3.70 | I4 | 4.54 | I7 | 4.29 | I13 | 4.91 |
Publisher’s Note: MDPI stays neutral with regard to jurisdictional claims in published maps and institutional affiliations. |
© 2022 by the authors. Licensee MDPI, Basel, Switzerland. This article is an open access article distributed under the terms and conditions of the Creative Commons Attribution (CC BY) license (https://creativecommons.org/licenses/by/4.0/).
Share and Cite
MDPI and ACS Style
Huang, X.; Hua, W.; Dai, X. Performance Evaluation of Watershed Environment Governance—A Case Study of Taihu Basin. Water 2022, 14, 158. https://doi.org/10.3390/w14020158
AMA Style
Huang X, Hua W, Dai X. Performance Evaluation of Watershed Environment Governance—A Case Study of Taihu Basin. Water. 2022; 14(2):158. https://doi.org/10.3390/w14020158
Chicago/Turabian StyleHuang, Xiaofeng, Wenwen Hua, and Xingying Dai. 2022. "Performance Evaluation of Watershed Environment Governance—A Case Study of Taihu Basin" Water 14, no. 2: 158. https://doi.org/10.3390/w14020158
Note that from the first issue of 2016, this journal uses article numbers instead of page numbers. See further details here.