Article

Biogeochemical Budgets of Nutrients and Metabolism in the Curonian Lagoon (South East Baltic Sea): Spatial and Temporal Variations

1
Marine Research Institute, Klaipeda University, 92294 Klaipeda, Lithuania
2
Department of Chemistry, Life Sciences and Environmental Sustainability, University of Parma, 43124 Parma, Italy
*
Authors to whom correspondence should be addressed.
Water 2022, 14(2), 164; https://doi.org/10.3390/w14020164
Submission received: 13 December 2021 / Revised: 4 January 2022 / Accepted: 5 January 2022 / Published: 8 January 2022
(This article belongs to the Section Ecohydrology)

Abstract

:
Estuaries are biogeochemical reactors able to modulate the transfer of energy and matter from the watershed to the coastal zones and to retain or remove large amounts of terrestrially generated nutrients. However, they may switch from nutrient sink to source depending upon interannual variability of the nutrient supply and internal processes driving whole system metabolism (e.g., net autotrophic or heterotrophic). We tested this hypothesis in the Curonian Lagoon, a hypertrophic estuary located in the south east Baltic Sea, following the budget approach developed in the Land-Ocean Interactions in the Coastal Zone (LOICZ) project. Annual budgets for nitrogen (N), phosphorus (P), and silica (Si) were calculated for the 2013–2015 period. The lagoon was divided in a flushed, nutrient loaded area, and in a confined, less loaded area. The lagoon was always a sink for dissolved inorganic Si and P whereas it was a N sink in the confined area, dominated by denitrification, and a N source in the flushed area, due to dinitrogen (N2) fixation. The net ecosystem metabolism (NEM) indicated that the Curonian Lagoon was mainly autotrophic because of high primary production rates. In this turbid system, low N:P ratio, high summer temperatures, and calm weather conditions support high production of N2-fixing cyanobacteria, suppressing the estuarine N-sink role.

1. Introduction

Estuaries are highly productive transitional areas between land and the open ocean, contributing with other coastal systems to 30–40% of the global oceanic production [1,2]. Their productivity depends on nutrient inputs from upstream catchments and specific hydrometeorological conditions, which in turn regulate nutrient loads to the sea [3,4,5,6,7]. Estuaries are also frequently considered as important areas for nutrient loads attenuation due to intense productivity, high rates of biogeochemical activity, and elevated water residence time [8,9,10]. Nutrient attenuation is governed by incorporation of dissolved forms into biomass of primary producers and their settling (burial in sediments) or removal by filter-feeders, and loss to the atmosphere [11,12,13,14,15]. Physical processes are also important in nutrient retention as inorganic nitrogen (N), silica (Si), and phosphorus (P) can be immobilized in insoluble salts and complexes, adsorbed on particle surfaces and settled for burial [16,17]. However, the equilibrium between nutrient retention and release can vary at different temporal scales spanning from diel (e.g., light-dependent uptake), seasonal (e.g., primary producers growth and decay), or interannual (e.g., net autotrophic or heterotrophic macro-periods) [4,18]. Other factors such as eutrophication, unbalanced nutrient stoichiometry or altered timing in nutrient transport (e.g., large floods or drought events) may adversely impact estuarine functioning, resulting in sudden shift from sink to source, with cascade effects for the coastal zone [19,20]. These aspects were questioned for Narragansett Bay and Chesapeake Bay by Nixon et al. [21] and Nixon [22]. They supported the idea that nutrient retention in estuaries can affect only a small percentage of the annual nutrient load whereas under specific circumstances exports may exceed inputs [6,7,23]. Net export from estuaries to coastal areas may occur due to intensive remineralization of labile deposited organic material [24], under extreme events such as blooms of dinitrogen (N2) fixing microorganisms [6] or prolonged hypoxia, affecting the capacity of ferric iron to retain P [16,23].
Since estuaries are spatially and temporally heterogeneous systems hosting multiple processes, the application of models can be useful to conceptualize, integrate, and generalize the current state of knowledges. Nutrient budget models are simple mass balance calculations of specific compounds within the systems, useful to investigate nutrient cycles [25,26]. The methodology used in this study is based on the approach developed in the framework of the Land-Ocean Interactions in the Coastal Zone (LOICZ) project (now Future Earth Coasts), a core project of the International Geosphere-Biosphere Project [27,28]. The important advantage of using such black-box budgeting approach is its simplicity in application, its robustness, and the simple evaluation of the results [29]. It is based on accurate inventories of inputs and outputs, allowing to produce robust annual budgets and infer about dominant metabolic pathways. When the sum of all the outputs is greater than the sum of all the inputs, the system acts as a nutrient source whereas when it is lower, the system is a sink. Budgets estimations, repeated for several years, can provide insights into how the system responds to climate or anthropogenic pressure changes, affecting interannual variations of riverine and other loads. Effective management of human activities in the river catchment (e.g., reduction of fertilizer application, waste disposal) can limit the nutrient inputs to the estuarine systems but does not ensure a rapid and linear recover of eutrophication and a transition to oligotrophication [30,31,32,33]. In fact, large temporal lags between external nutrient load reduction and significant changes in estuarine functioning can be often observed due to high internal recycling and slow recovery of local biological communities.
In this study, we applied the budget approach to a large, hypereutrophic coastal lagoon with frequent cyanobacteria blooms (the Curonian Lagoon, Republic of Lithuania and Russian Federation) to better understand if the whole system and its distinctive macroareas are nutrient sinks or sources, and how this depends upon riverine inputs. This aspect is particularly interesting as metabolism and nutrient cycling can largely differ between macroareas and affect the whole transport of nutrients from the river basin to the Baltic Sea [7,23]. Ongoing socio-economic changes, including the development of intensive agricultural practices, affects soil element budgets and losses of excess nutrients to the lagoon [34]. The timing and ecological stoichiometry of delivered nutrients is a main driver of N2-fixing cyanobacteria blooms [23]. The latter in turn impacts the functioning of large lagoon areas, depending on stagnation, water stratification, and oxygen shortage [20]. Petkuviene et al. [23] and Vybernaite-Lubiene et al. [6] have applied a simplified black-box budgeting exercise to the Curonian Lagoon. However, they did not take into account hydrology-driven zonation and lagoon–Baltic Sea water exchange.
The main aim of this study was to calculate annual budgets for the three key nutrients N, Si, and P, and estimate their net retention/release in the Curonian Lagoon during their path to the Baltic Sea. We hypothesize that (1) areas characterized by different water residence time display different metabolism and nutrient cycling, (2) N2-fixing cyanobacteria blooms may offset nutrient retention or release.

2. Materials and Methods
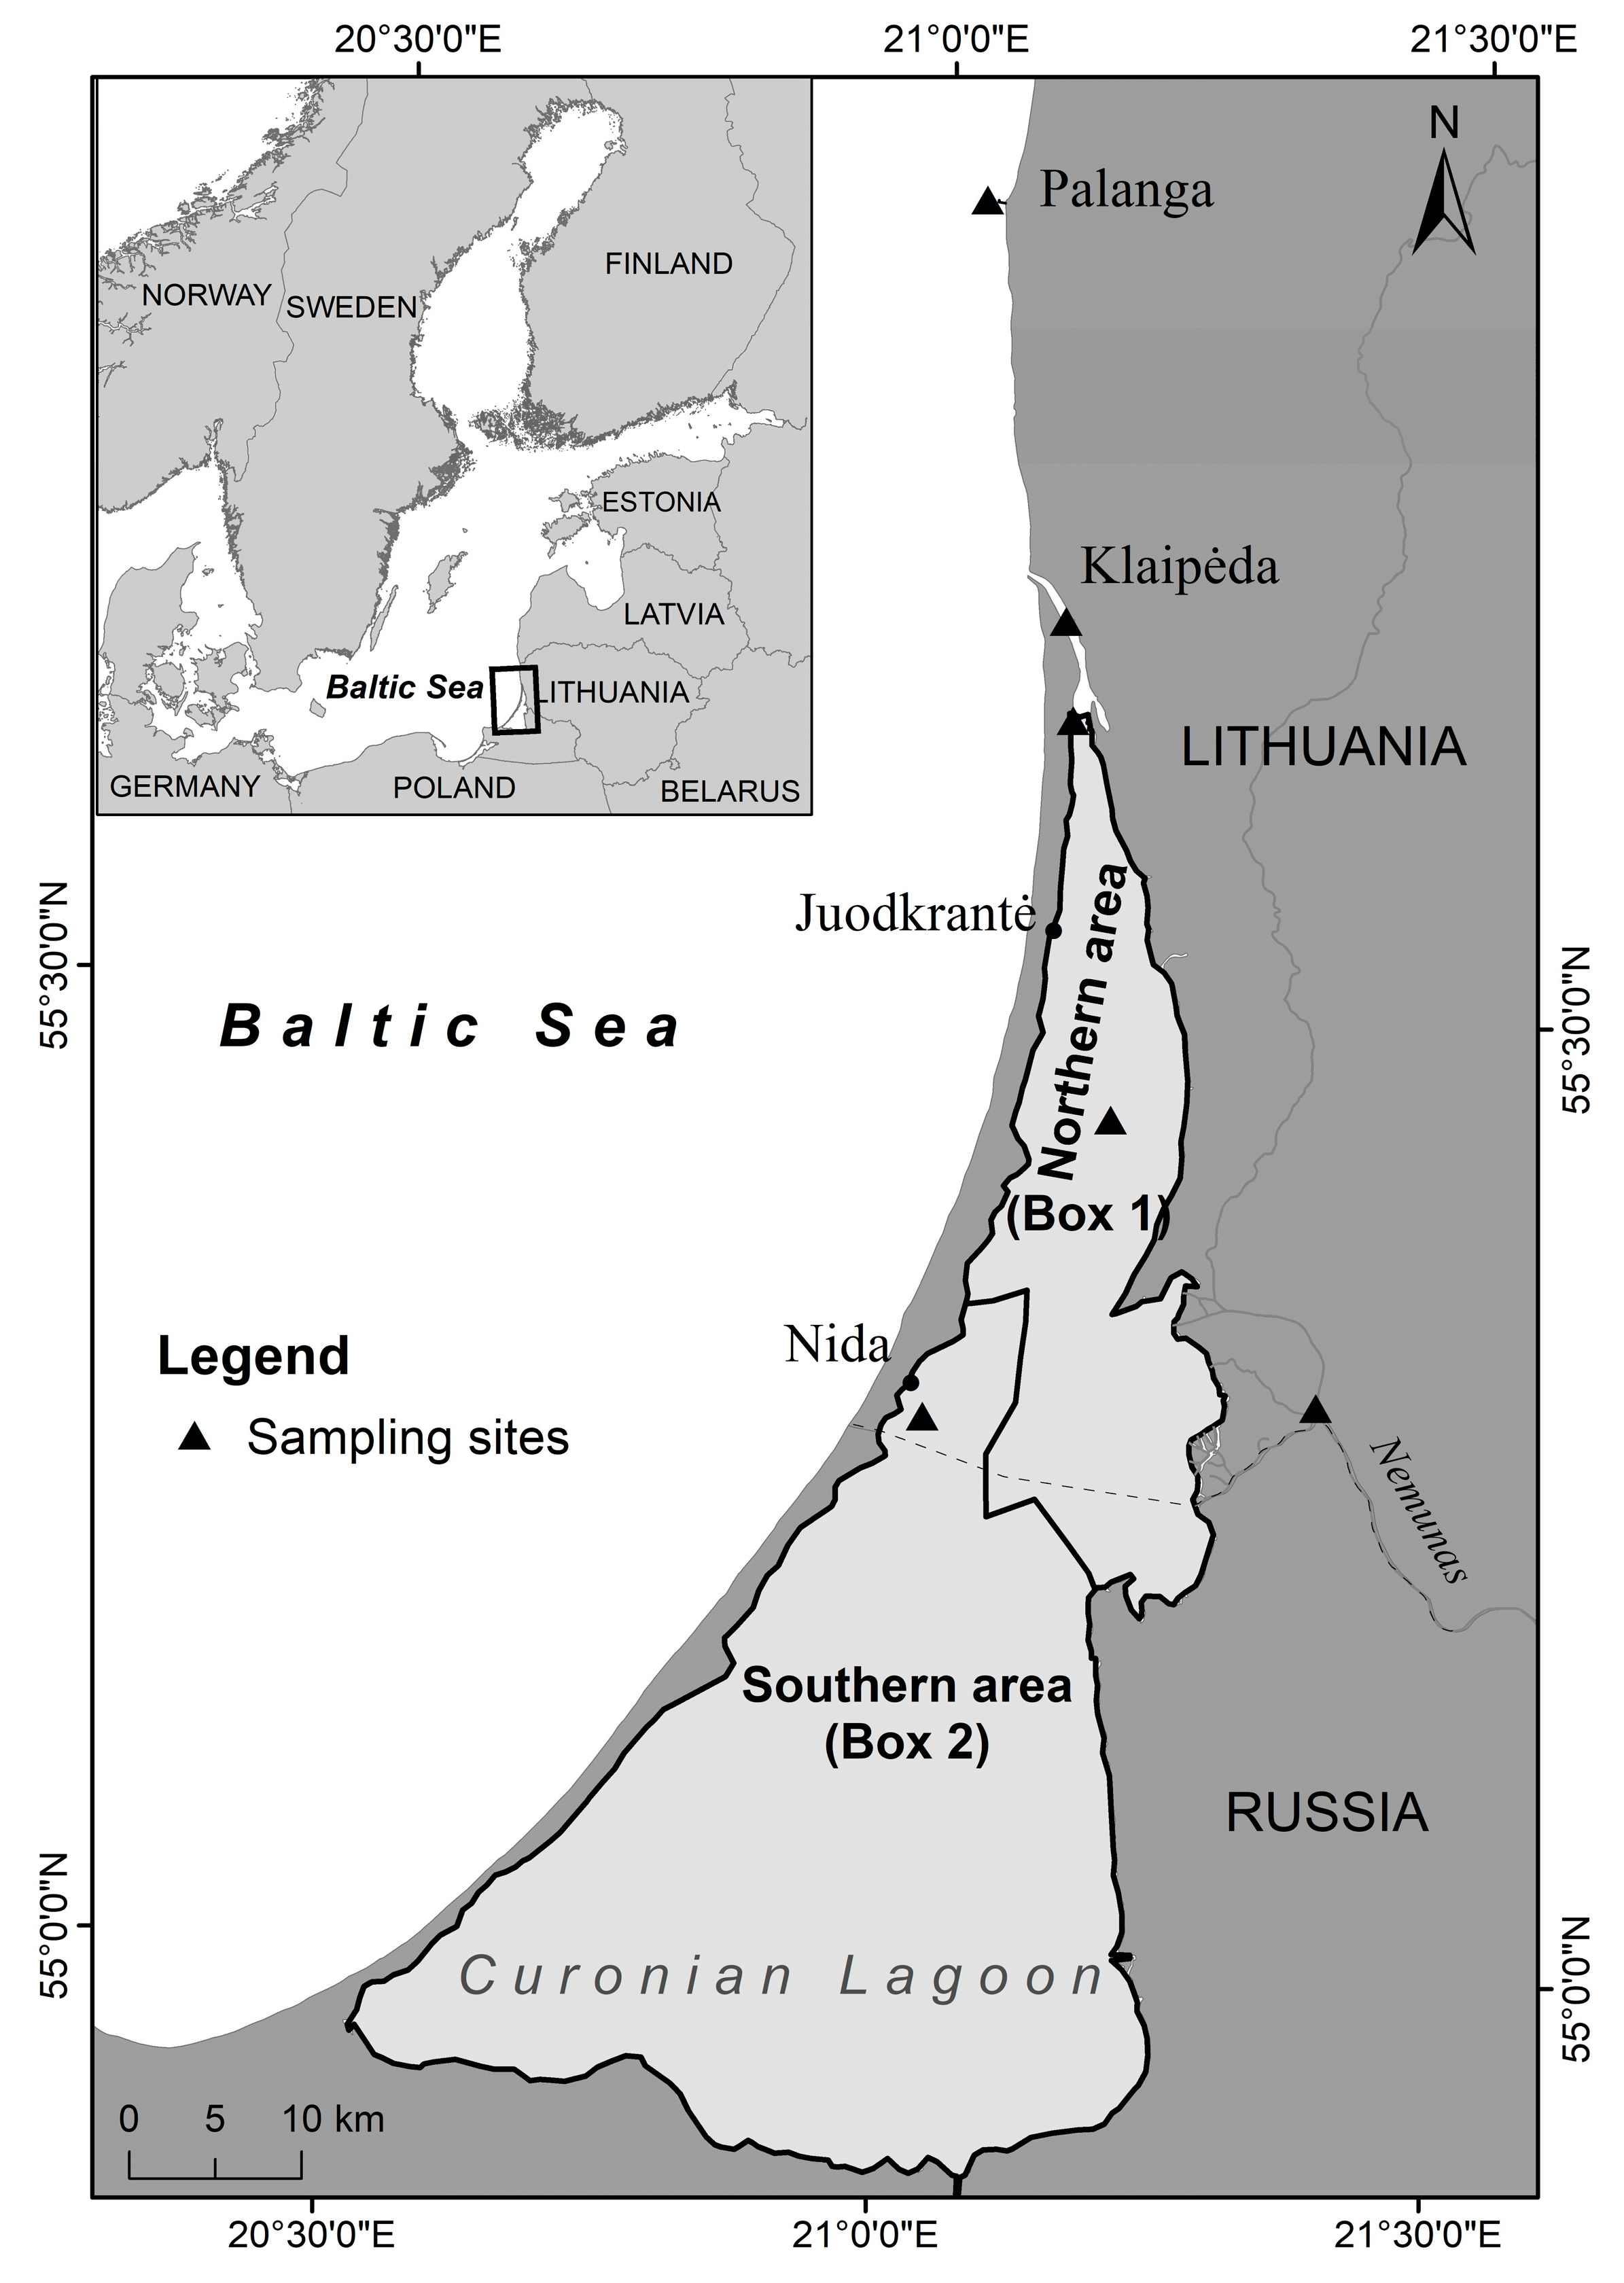
2.1. Study Site

The Curonian Lagoon is a large (~1600 km2) and shallow estuarine system (mean depth 3.8 m) connected to the Baltic Sea through a narrow strait (Figure 1). The lagoon occasionally receives inputs from the sea during periods of wind-driven tidal forcing [35]. Under such circumstances, the salinity can rise up to 5–6 PSU, but only in the northern part of the lagoon.
The Nemunas River is the main tributary of the Curonian Lagoon accounting for 96% of the total freshwater input (annual discharge 21.8 km3; [36]). Its catchment has a total area of 97,864 km2, of which cultivated lands cover nearly 60% and forested areas account for most of the rest [37]. Riverine inputs to the Curonian Lagoon exhibit strong seasonal patterns, peaking during snowmelt in March and April [34]. The Nemunas River enters the lagoon in its central-eastern border and its flow divides the system in a northern, flushed half which exports freshwater directly to the sea (Box 1) and in a southern, confined half with longer water residence time (Box 2) (Figure 1) [38]. Only during peaks of riverine flow, the southern part can be temporally flushed by freshwater. Other inputs are from sewage treatment plants located along the lagoon perimeter. The largest is the one of the city of Klaipeda, which treats effluents from nearly 200,000 inhabitants and discharges directly into the Klaipeda Strait.
In general, the lagoon is considered hypereutrophic with concentrations of chlorophyll-a (Chl-a) up to 400 μg L−1 [20]. The succession of phytoplankton community from diatom dominated in spring to N2-fixing cyanobacteria dominated in summer is driven by physical conditions and unbalanced nutrient availability [7,39]. The establishment of cyanobacterial blooms strongly alters N and P cycling, creating self-sustaining positive feedbacks [20,23].

2.2. Water Sampling and Nutrient Analysis

Monthly water samples were collected at two sites: the closing section of the Nemunas River (freshwater inflow) and the Klaipeda Strait (lagoon outflow) from January 2013 to December 2015 (Figure 1). Sampling frequency at the inflow was intensified (1–2 week intervals) during periods of high discharge (January–April). In 2015, samples were collected from small tributaries around the Curonian Lagoon (Dane, Dreverna, Minija, Šyša, Vilhelmas Channel, and Smeltalė) and from the Klaipeda wastewater treatment plant (WWTP), all representing additional freshwater inputs. Water samples were also collected at two sites inside the lagoon (a northern station representing the river flushed area, and a southern station representing the confined area), and at a coastal site of the Baltic Sea (55°55′13.1″ N, 21°02′39.4″ E) from January 2013 to December 2015.
During each sampling event, salinity was measured in situ with an YSI ProPlus multiprobe. Water samples integrated along the water column (1 L, n = 3) were collected with a Ruttner bottle and transported to the laboratory for further treatments. Here, particulate [particulate nitrogen− (PN), biogenic silica (BSi), and total particulate phosphorus (TPP)] and dissolved inorganic nutrients [dissolved inorganic nitrogen (DIN = NH4+ + NO2 + NO3), dissolved inorganic phosphorus (DIP), and dissolved silica (DSi)], total dissolved nitrogen (TDN) and total dissolved phosphorus (TDP) were analyzed. Total nitrogen, (TN), total phosphorus (TP), and total silica (TSi) were calculated as sum of dissolved and particulate forms. Analytical details can be found in Vybernaite-Lubiene et al. [6].

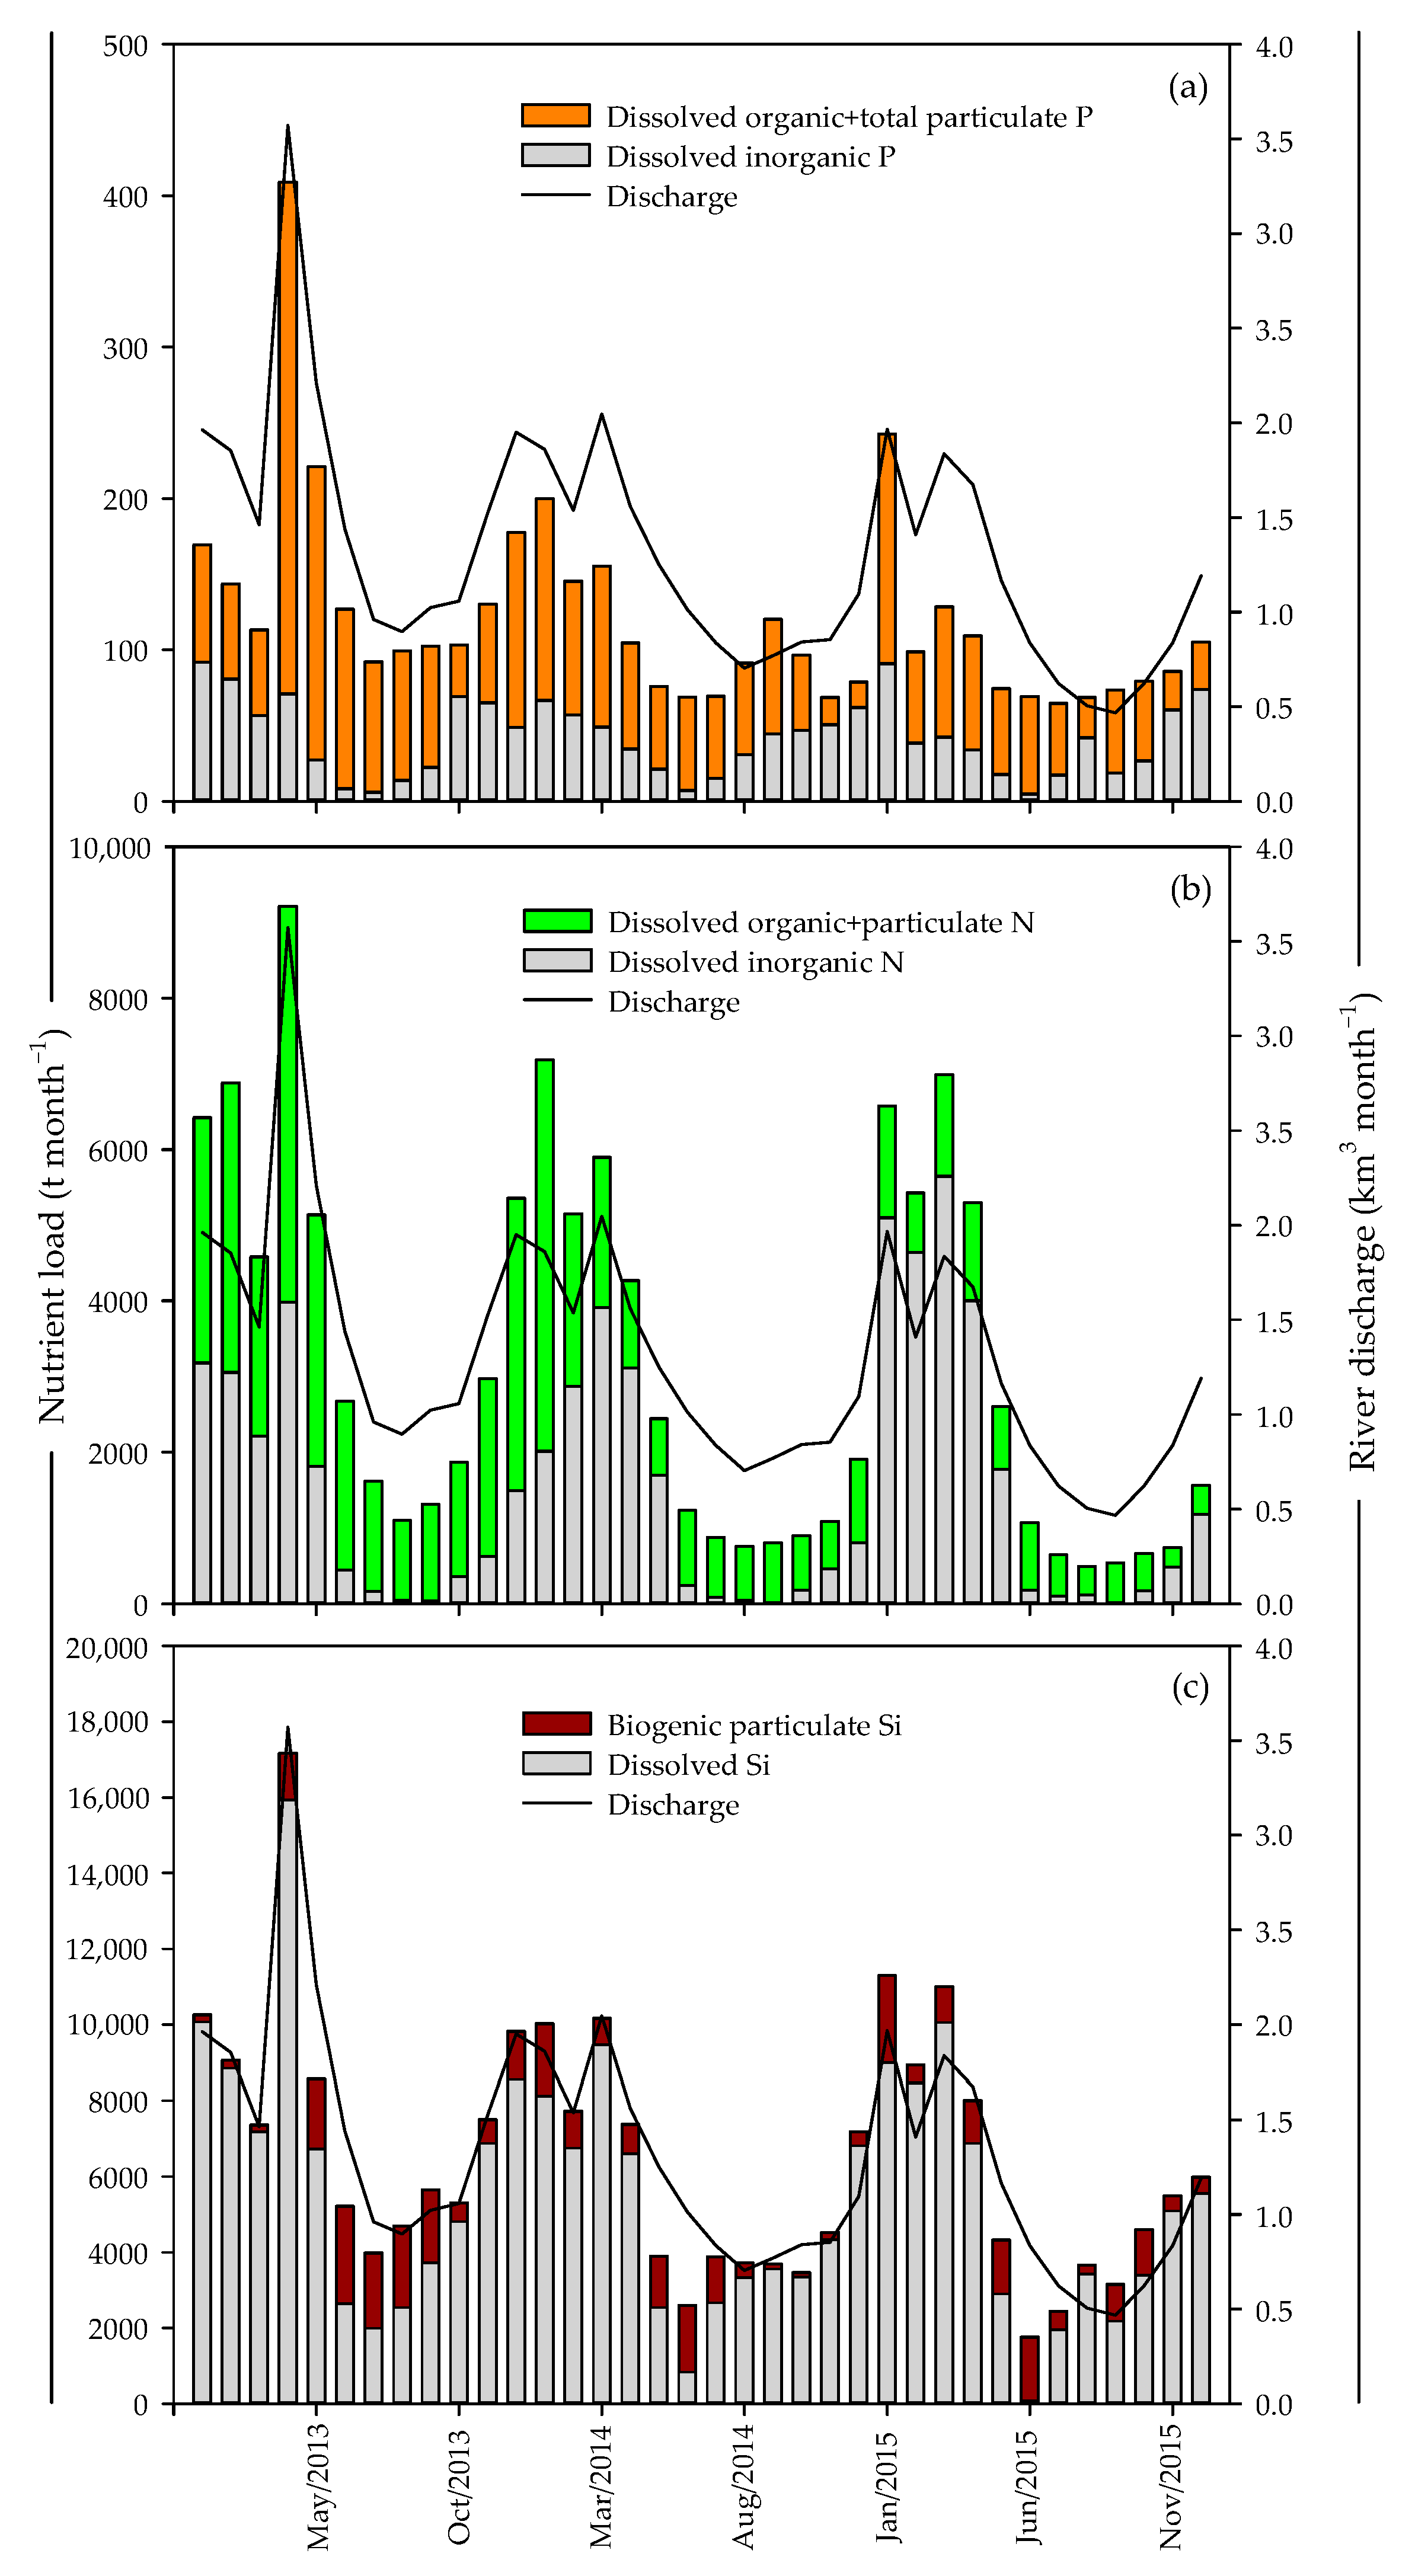
2.3. Discharge Data and Nutrient Input Calculation

In order to calculate water and nutrient budgets, all riverine inputs, precipitation, evaporation, marine intrusions, exchange between areas of the lagoon, and outflows to the Baltic Sea were quantified or estimated. Riverine inputs to the Curonian Lagoon were estimated from the daily average values of river discharge provided by the Lithuanian Hydro-meteorological Service. Nemunas River discharge was calculated by summing the discharge of Nemunas at the gauging station Smalininkai and its tributaries contributing down from Smalininkai: Šešupė, Jūra, and Minija. Since Deima River is located in the Russian Federation, real discharge data are not accessible, however daily discharges were calculated from daily discharges of the Šešupė River using the empirical equation proposed by Jakimavičius [40]. Water discharge data for the WWTP were provided by the sewage treatment laboratory of “Klaipėdos Vanduo”.
Nutrient balances for each box were calculated by multiplying mean monthly concentration by mean inflowing and outflowing fluxes (see Section 2.4 for details). Since water residence time (τw) exceeds two months [38], only annual water and nutrient balances were calculated.

2.4. Nutrient Balance and Metabolism Calculations

The water and nutrient exchange between the Curonian Lagoon and the Baltic Sea was calculated according to Gordon et al. [27], Swaney and Giordani [29]. Briefly, this approach is based on a black-box mass balance, considering all possible inputs and exports of a target nutrient for different time scales (month, season or year). To this purpose, steady state conditions were assumed, together with additional assumptions for P and N cycles, later discussed.
The budgets were calculated for the period 2013–2015 in two separate lagoon compartments, Box 1 (404.4 km2) and Box 2 (1176.3 km2) (Figure 1). Previous studies have demonstrated distinct hydrodynamics in the two boxes, driving different biogeochemical processes [6,7]. The LOICZ water budgets and the calculation of saline water intrusion are generally based on end members with large salinity differences, a condition that is not verified in the Curonian Lagoon due to generally low salinities (<1) [27]. Therefore, data of marine intrusion and outflow from the lagoon were calculated using the hydrodynamic finite element modelling system SHYFEM (http://www.ismar.cnr.it/shyfem) (accessed on 13 December 2021) adapted to the Curonian Lagoon and the coastal area of the Baltic Sea by Zemlys et al. [35]. The same tool was used to estimate the surface area of the northern (404 km2) and southern (1180 km2) macroareas defined in the Curonian Lagoon and to calculate water volume exchange between them (Figure 1). These areas partly overlap those defined by Zilius et al. [7,20]. Precipitation and water evaporation for the Curonian Lagoon were accounted in the model for all fluxes calculations done by SHYFEM using climate data obtained from ECMWF climate model as model inputs. Thus, all the relevant water fluxes between boxes, rivers, and the sea were estimated as well as the residence time of water and materials within the system. The latter is a critical variable of biogeochemical processes in coastal sites, as it depends on the discharge but also on morphological features [29]. The hydraulic residence time (τw, days) was calculated by dividing the system volume (m3) by the hydraulic discharge (m3 s−1) through the system. In steady state conditions, water outflows equal water inflows and it can be accurately estimated by measuring the output through the Klaipeda Strait.
Estimated water budget was followed by nutrient mass balance calculations, which consist of the inventory of all the relevant nutrient inputs and outputs in the system. Unlike water, nutrients are characterized by internal transformations as they are actively produced and consumed by biogeochemical processes. These internal processes are generally identified as ∆Y, where Y is a nutrient form. If we assume that the system is at steady state, a nutrient mass balance can be used to estimate ∆Y using the following equation [27]:
∆Y = −(∑outputs + ∑inputs)
∆Y is negative, suggesting retention, when the sum of the inputs (with positive sign) exceeds the sum of the outputs (with negative sign). On the contrary, ∆Y is positive when internal processes as mineralization, desorption or dissolution determine outputs exceeding inputs.
Water and nutrient budgets allow calculation of ecosystem functions, that according to the LOICZ approach are the net ecosystem metabolism (NEM) and the net difference between N2−fixation and denitrification (nfix-denit). NEM is the net difference between whole system production and respiration (p–r). Positive and negative NEM values suggest net autotrophy (indicating nutrient sink role) or net heterotrophy (indicating nutrient source) [29,41]. The NEM calculations in the LOICZ are based on dissolved inorganic phosphorus (DIP) rather than on carbon (C). The use of P data, for both rivers and coastal marine waters, is due to their availability, higher analytical quality than those of C and N, and to the absence of gaseous phases for P [29]. Assuming that C and P are taken up and released at a fixed ratio and non-biological P transformations are negligible over long periods (e.g., one year), NEM can be estimated from ∆DIP and C:P ratio by NEM = −∆DIP (C:P). The last assumption is not valid in systems subjected to bottom anoxia, where iron-dependent DIP release from sediment can be relevant [27]. However, despite recorded hypoxia, such events in the Curonian Lagoon are confined to extreme hydrological and climatic condition, that occur over short (days) time spans and not every year [23]. The ratio of C:P measured in the primary producer tissues corresponds to the proportion at which these organisms can uptake C and P from the water mass as well as to the ratio at which these elements are released during mineralization processes. The Redfield ratio can be used in systems dominated by phytoplankton when direct measurements are missing.
The concentration of dissolved inorganic nitrogen (DIN) can be altered either by production and respiration or by the microbial reactions of denitrification and N2-fixation. ∆DINexpected = ∆DIP (N:P) is an estimation of DIN changes associated to the ecosystem metabolism based on ΔDIP fluxes and N:P ratio in the primary producers. The (nfix-denit) can be estimated from the difference between ∆DINobserved, obtained from DIN mass budget, and ∆DINexpected. Positive values indicate that N2-fixation dominates over denitrification whereas negative values have opposite meaning. The large differences often observed in many coastal systems are indicative of the relative importance of these two pathways for non-conservative N fluxes [29].

3. Results

3.1. Water Balance

In the 2013–2015 period, the daily average discharge of Nemunas River was 43.4 × 10⁶ m3 d−1 (Table 1, Figure 2). Discharge displayed seasonal and interannual variability with the highest mean value in 2013, sustained by the peak discharge observed during the spring snowmelt of April and May (119.0 and 71.3 × 10⁶ m3 d−1, respectively). The Minija River is another tributary directly discharging in Box 1; it generally accounts for 5–8% of the Nemunas River flow, with peaks up to 10–13% in the winter months. Box 2 receives riverine loads mainly from the Deima River which annual mean discharge ranges from 1.8 to 3.7 × 10⁶ m3 d−1 (4–9% of Nemunas flow) with peaks in the first four months of the year.
Our calculations show that direct precipitation is offset by evaporation fluxes, and therefore has minor influence on annual water budgets. Even if evaporation dominates in summer and precipitation in spring, the fluxes have minor effects also on seasonal water budgets because they account for less than 5% of Nemunas River flow (both fluxes are in the range 2–3 × 10⁶ m3 d−1). Water discharge from the WWTP was <0.1 × 10⁶ m3 d−1 in the whole period. As result of the water budgets, the net annual average residual outflow to the Baltic Sea was 49.1 × 10⁶ m3 d−1, with a monthly maximum observed in April 2013 (129.5 × 10⁶ m3 d−1). The water volume exchange between Box 1 and the Baltic Sea and between the two boxes is reported in Table 1. These volumes are of the same order of magnitude of total riverine discharge to Box 1 and 20 times higher than other inputs to Box 2. Due to these different fluxes, hidraulic residence time (τw values) is in the order of a few days in Box 1 and of about two months in Box 2.

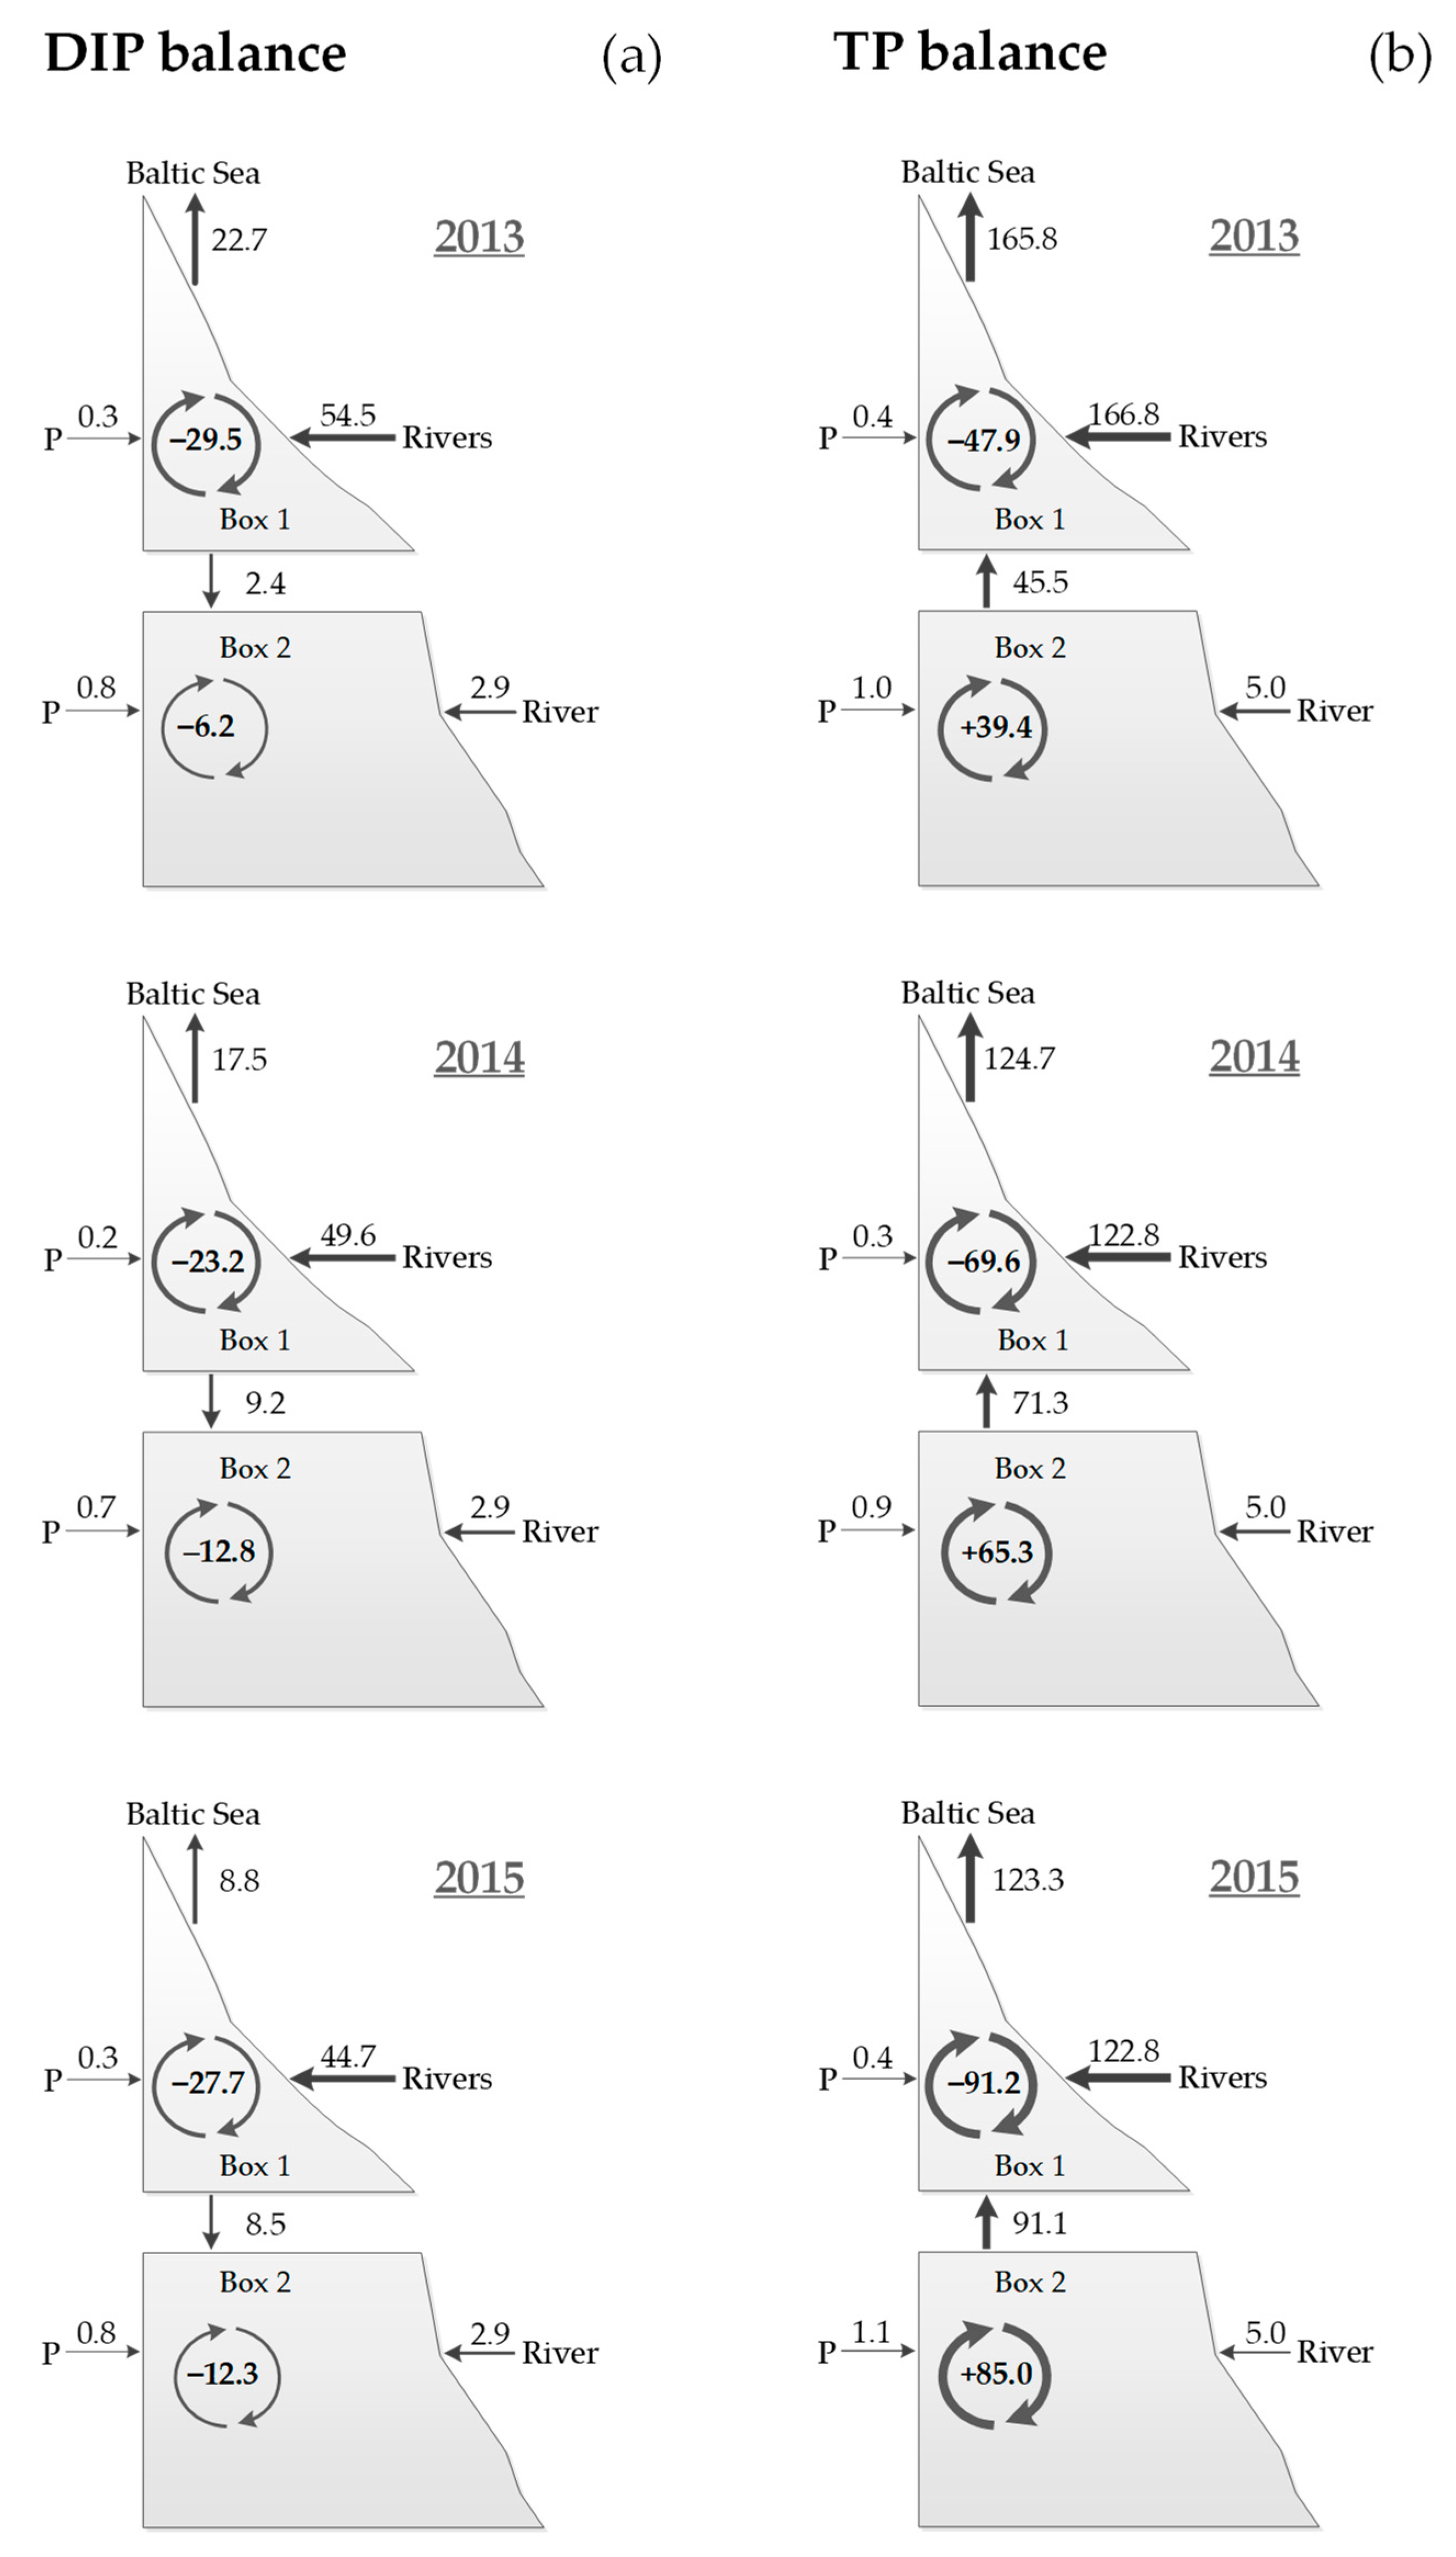
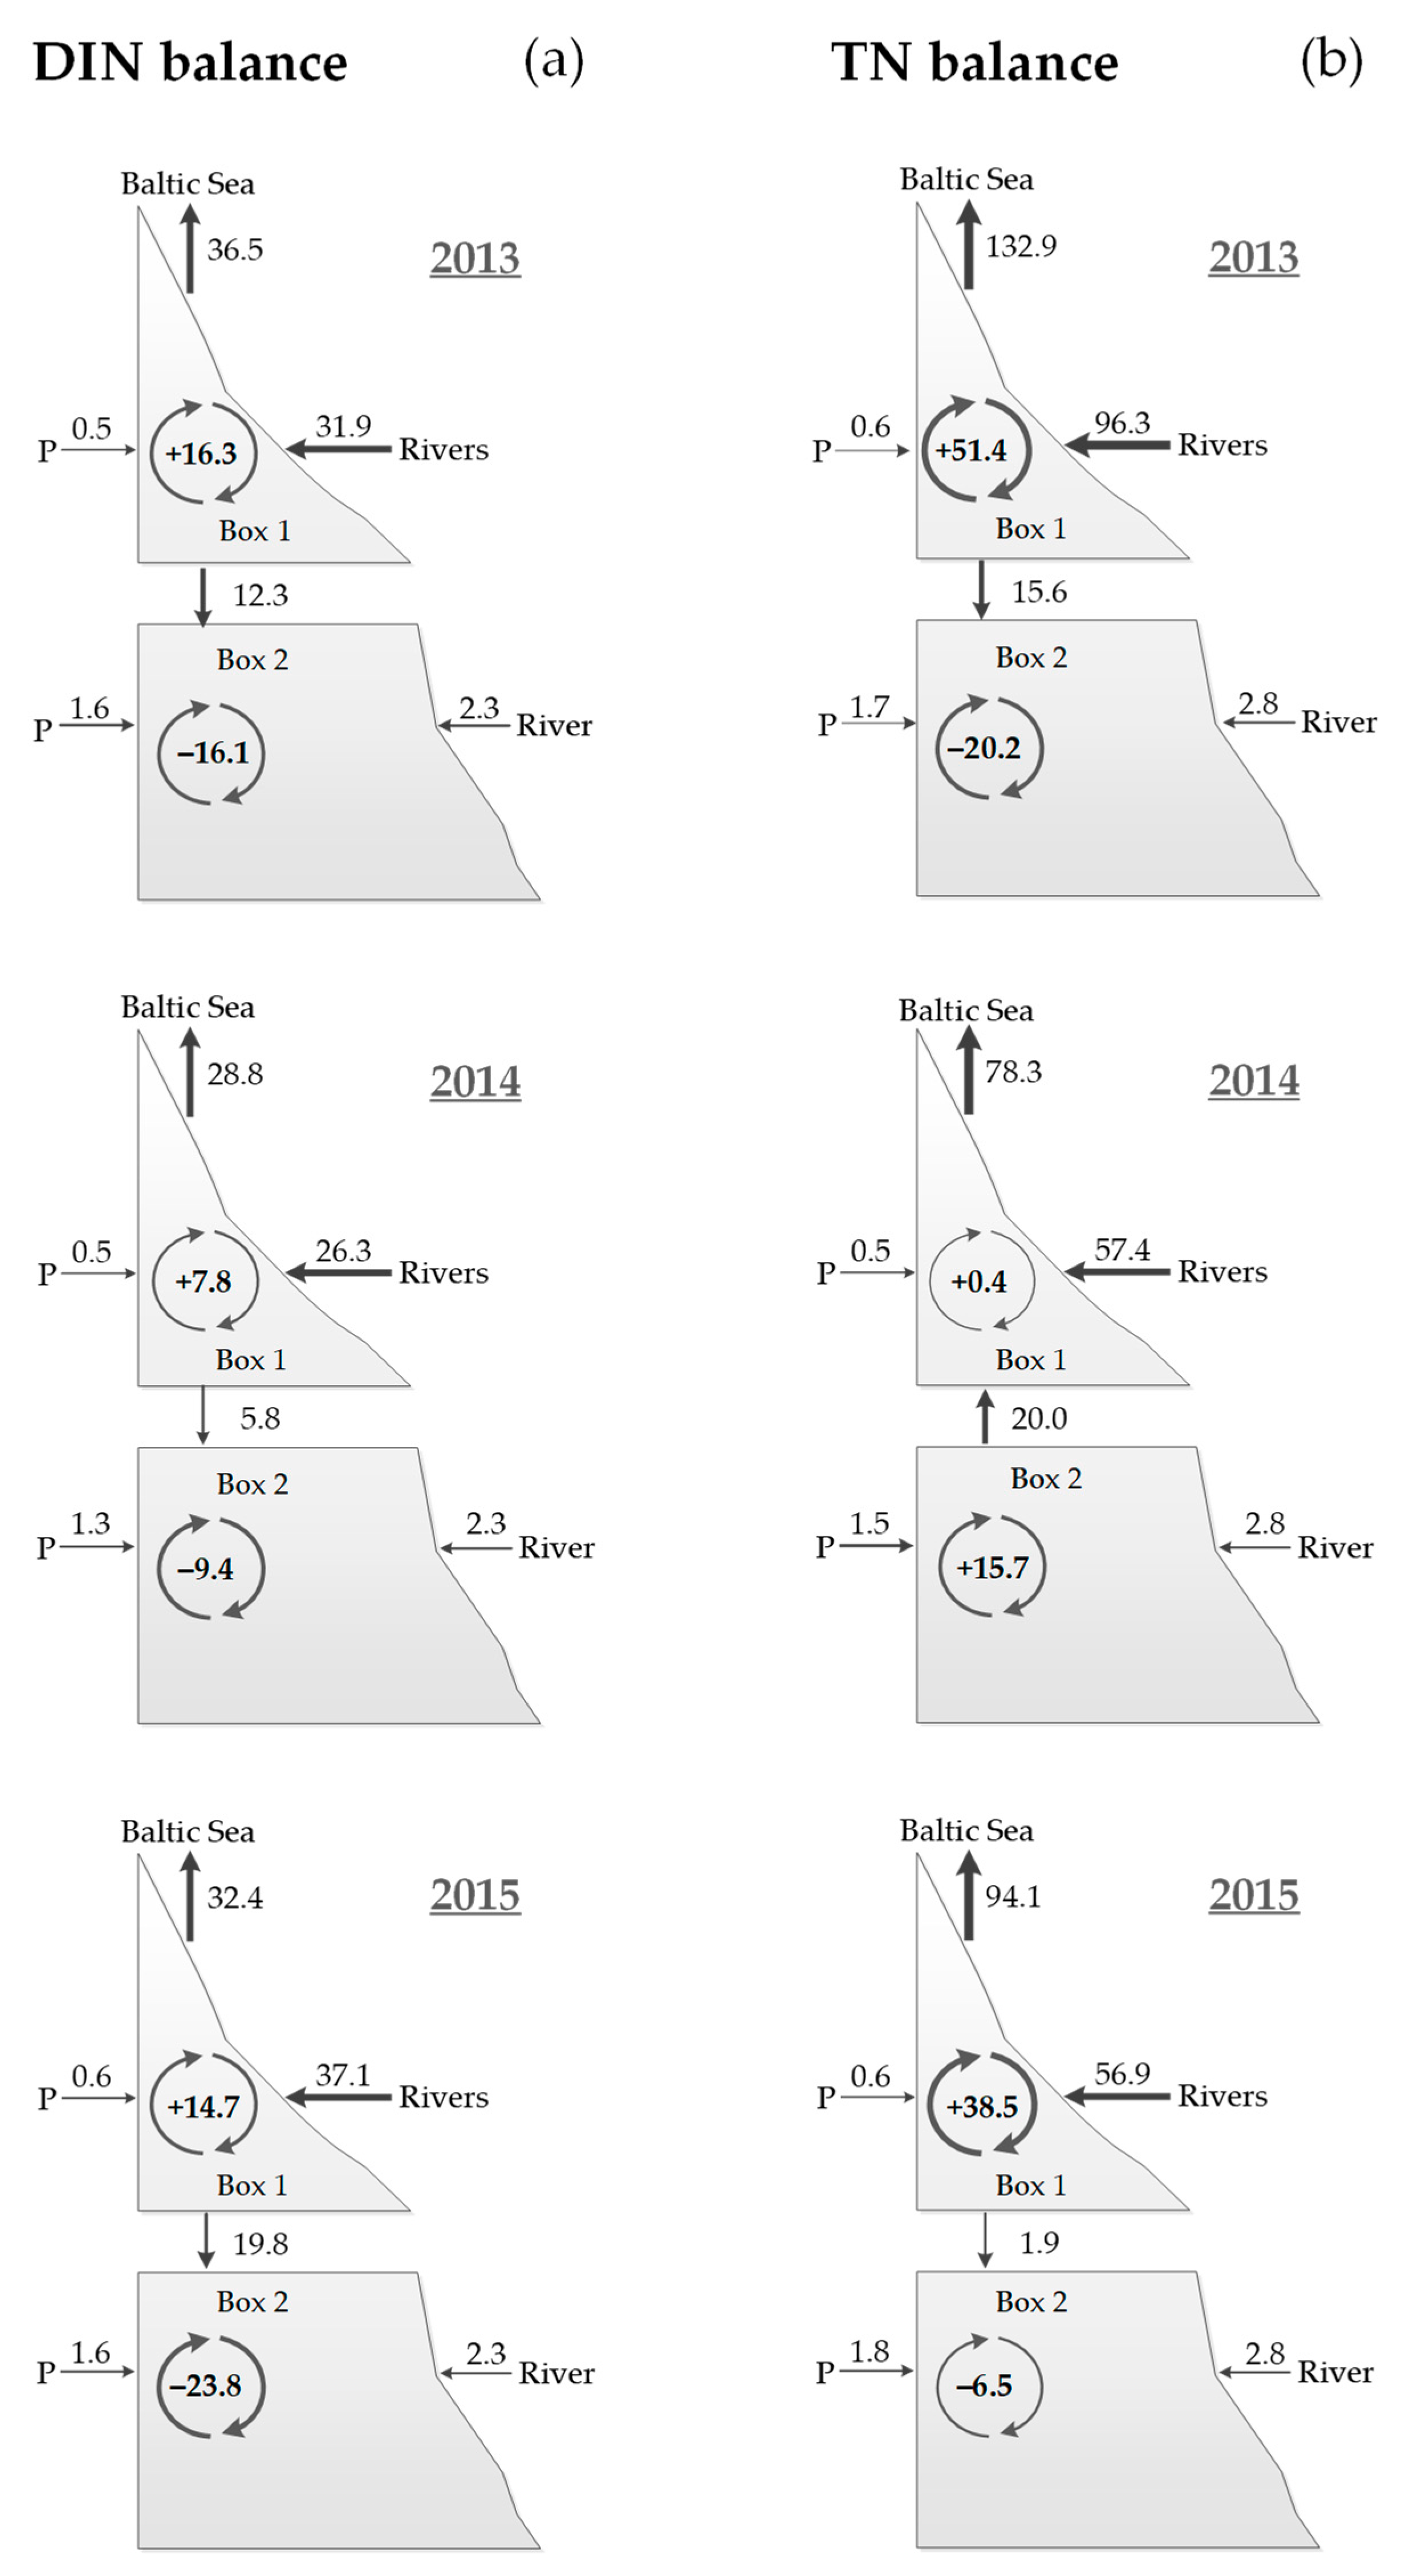
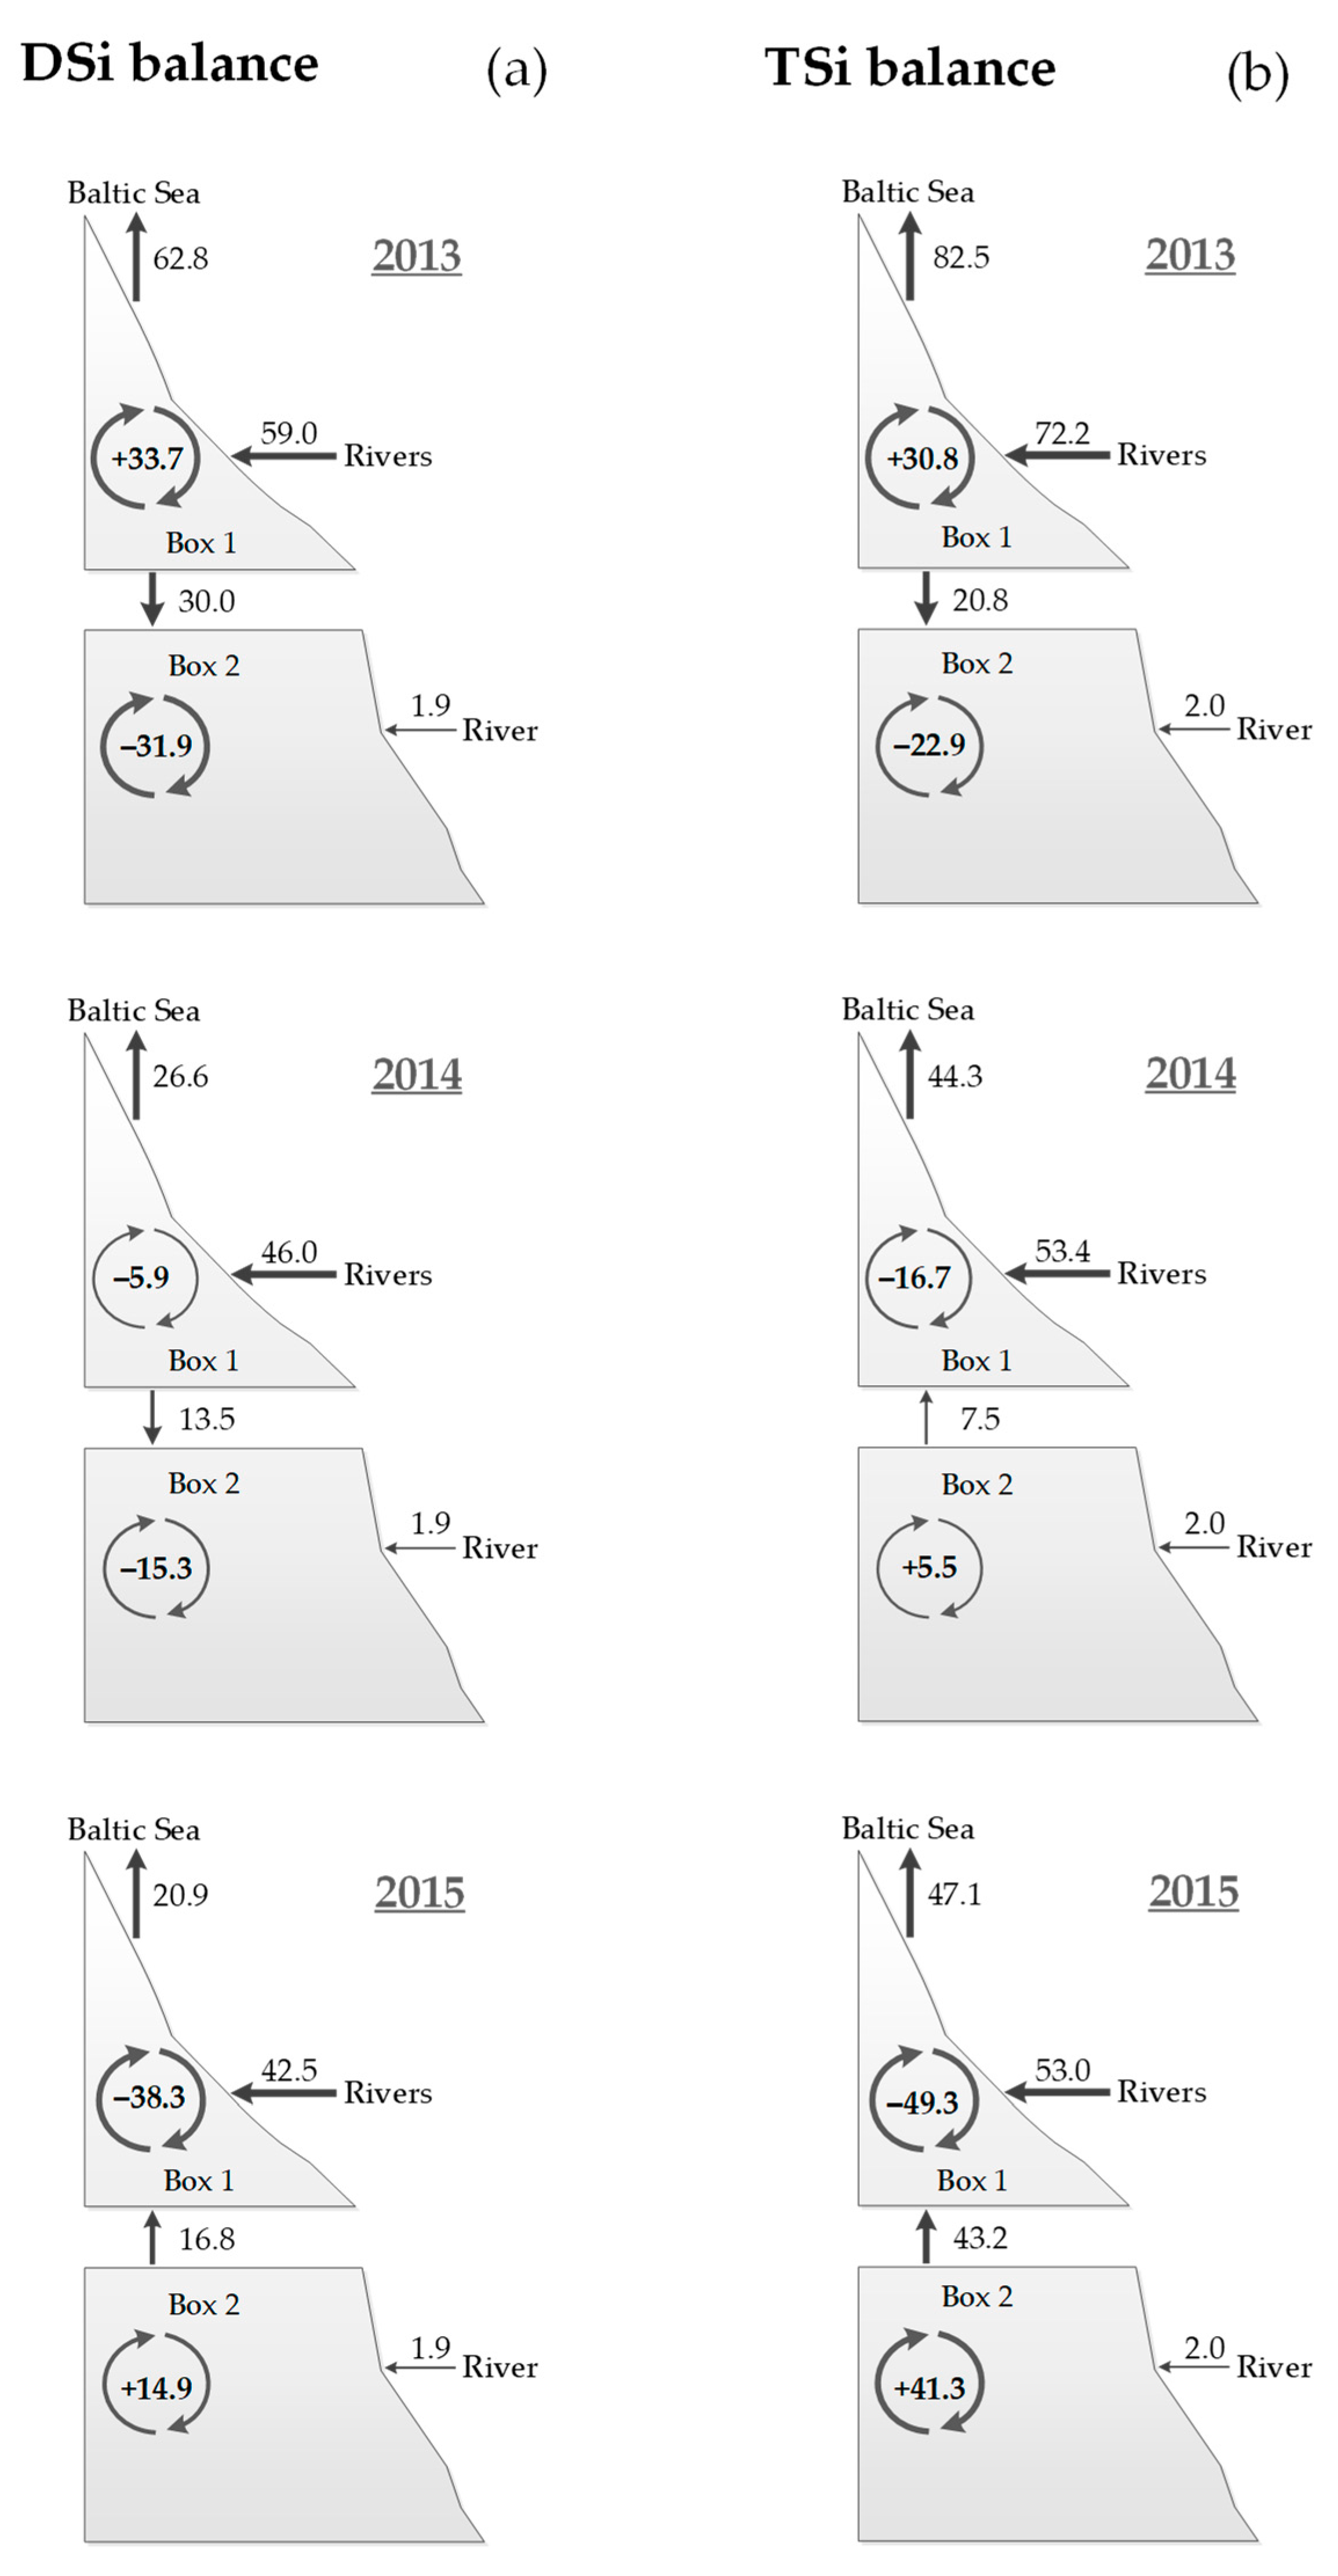
3.2. Nutrient Balances

In the study period, nutrient inputs to the Curonian Lagoon were dominated by the Nemunas River that delivered ~90% of the TN, TP, and TSi loads. The nutrient loads showed both seasonal and interannual variations with peaks in winter and spring (Figure 2). The highest loads of all nutrient forms coincided with the extreme flooding event of April 2013. Although the highest nutrient concentrations were observed at the WWTP outflow (up to 45 µM of TP and 850 µM of TN), the low water discharge resulted in negligible loads, representing <1% of the total. All the other external sources of nutrients (i.e., small rivers and precipitation) were minor contributors to the lagoon nutrient budgets (Figure 3, Figure 4 and Figure 5).
Figure 2. Monthly nutrient loads of dissolved and particulate phosphorus (a), nitrogen (b), and silica (c) measured at the Nemunas River gauging section in the 2013–2015 period. The monthly Nemunas River water flow means are also reported.
Water 14 00164 g002
The Nemunas River always represented the main DIP input to Box 1, where DIP was retained or exported to Box 2 or to the Baltic Sea (Figure 3). Box 1 represented the main DIP input to Box 2 during 2014 and 2015, largely exceeding Deima River inputs, whereas during 2013 Box 2 received comparable DIP inputs from Box 1 and the Deima River. Area normalized mean annual DIP inputs differed by a factor of 10 in the two boxes (~200 versus 20 µmol m−2 d−1 in Box 1 and Box 2, respectively). Regardless the different inputs, on an annual basis, the two boxes were always functioning as a DIP sink, with different rates in the different areas. At Box 1, DIP retention was in the range 23–30 × 103 mol d−1 whereas at Box 2 it ranged from 6 to 13 × 103 mol d−1. Considering the large surface of Box 2, the areal removal rates resulted even more different with 60–70 and 5–10 µmol DIP m−2 d−1 removed in Box 1 and 2, respectively (Table 2). The whole lagoon retained on average 37 × 103 mol DIP d−1 in the study period, corresponding to 20–30 µmol m−2 d−1.
Total P budgets displayed consistent differences between the two boxes in the study period. Box 2 was a TP source during the whole period and exported TP to Box 1. The net TP production and subsequent export varied by a factor of ~2 over the 3-year period (Table 2, Figure 3). At the opposite, Box 1 was always a TP sink with retention rates varying between 47.9 (2013) and 91.2 × 10³ mol d−1 (2015). Mass budget calculations showed that the Curonian Lagoon, besides being a DIP net sink, retained also TP (6.3 × 10³ mol d−1) (Table 2)
DIN inputs to Box 1 were mainly sustained by rivers, and exceeded inputs to Box 2 by a factor of nearly 20 (Figure 4). The contribution of precipitation was negligible in both boxes. As for DIP, the exchange flow between the two boxes represented the main DIN input to Box 2, largely exceeding inputs from the Deima River. Box 2 was always a net DIN sink whereas Box 1 was always a DIN source, producing on average 12.9 × 10⁵ mol d−1 (Table 2). The DIN budget of the whole lagoon reflected the contrasting DIN sink/source role of the two boxes and the variable interannual magnitude of processes. As a result, during the study period the whole lagoon acted both as net DIN sink (2014 and 2015) or slight source (2013). The net DIN internal fluxes ranged from −0.8 to −2.0 mmol m−2 d−1 and from 1.9 to 4.0 mmol m−2 d−1 in Box 1 and 2, respectively (Table 2).
The Nemunas River inputs represented the main TN source to the lagoon, with 40% higher loads in 2013 than in 2014 and 2015. Box 1 was always a TN source, with variable fluxes among years, peaking in 2013. Box 2 was functioning either as a TN sink (2013 and 2015) or source (2014). Aggregated fluxes indicated that the whole lagoon was always a TN source, with a mean TN production of 26.4 × 10⁵ mol d−1 (Table 2).
The riverine DSi and TSi inputs to Box 1 displayed some variability among the three years, and always exceeded by a factor >20 silica inputs to Box 2 (Figure 5). Inputs via precipitation were considered negligible and not estimated. The sink or source role for the DSi varied between the two boxes over the study period often with contrasting patterns (Table 2). DSi and TSi export from the lagoon to the Baltic Sea peaked in 2013, with fluxes 2–3 times higher than those of 2014 and 2015. The whole lagoon was a net silica source in 2013 and a silica sink for both the subsequent years (Table 2).

3.3. Ecosystems Functions

Calculated NEM values for the Curonian Lagoon were positive in both boxes for the whole study period, with average C production exceeding respiration by nearly 2.5 mmol C m−2 d−1 (Table 3). The NEM rates were much higher in Box 1, likely due to higher nutrient availability or better nutrient stoichiometry with respect to uptake by phytoplankton (algae and cyanobacteria) and bacteria.
Our calculations suggest that, on an annual basis, the equilibrium between the two microbial processes of N2-fixation and denitrification differed between boxes (Table 3). In Box 1, N2-fixation exceeded denitrification and contributed as net DIN source whereas in Box 2 denitrification exceeded N2-fixation and contributed as N sink. These calculations also suggest that the equilibrium between these opposite processes varies among years, along with their variability in the two boxes. During 2013 and 2014, N2-fixation exceeded denitrification in the whole lagoon whereas the opposite was true in 2015.

4. Discussion

4.1. Water Balance

The inflow of the Nemunas River divides the Curonian lagoon into a northern and a southern area, characterized by different water residence time and dominating biological and biogeochemical processes [7,42]. Different studies targeting the hydrology or the ecological functioning of this estuarine system have analysed separately the two macroareas [7,20,23,42]. The two–box approach allows a better understanding of the spatial patterns of nutrient fluxes and the effect that algal blooms produce on nutrient transformations in flushed and stagnant sectors of the estuary. Our results, based on mass budget analysis, reveal large spatial and temporal variability of the two boxes’ sink/source functions. Water exchanges between the well flushed northern and the confined southern area are more dependent on wind directions and intensity than on Nemunas River discharges [38]. Wind also affects the brackish water intrusion from the Baltic Sea to the northern part of the lagoon.
Discharge of the principal tributary followed the expected seasonal patterns for temperate latitudes, with a spring peak and a summer minimum [34]. However, the interannual differences in snowpack accumulation, temperature, and precipitation resulted in pronounced seasonal differences of discharge across years. In comparison to previous measurements, the Nemunas River discharges measured in the present study period was ~28% lower than the average of the 1961–1990 period (~60 × 106 m3 d−1) [43]. Long-term analysis of the water balance of the Curonian Lagoon suggests decreasing trend for the Nemunas discharge and consequently for the frequency and magnitude of spring floods [36]. The reasons for ongoing changes are the milder and drier winters, the reduction of snow deposition, and thinner snow cover. This trend is also observed in our water budget since the river discharge tended to decrease over the three–year period. Large interannual variability of temperatures and climate, affecting precipitation and discharge, advocates the need of multi-year analysis of estuarine ecosystem functioning and suggests cautious conclusions or generalizations in studies limited to one year investigations. Discharge is in fact a driver of estuarine functioning and variable discharge leads to variable dominant processes within estuaries.
Previous studies considered water inflow from the Baltic Sea to the Curonian Lagoon as negligible [6], mainly due to low and constant salinities. In the present study, seawater fluxes to the lagoon were based on a hydrodynamical model that proved earlier assumptions to be wrong. The model revealed how the annual seawater inflow to the lagoon was similar or even higher than the Nemunas discharge; it was consistent over the 3–year period, and it contributed 42–54% of the water balance. The main driving mechanism was identified in the sea–lagoon water level differences induced by wind coupled with low summer discharge of the Nemunas River that results in high seawater inflow to the lagoon [38]. In the 27 samplings carried out at Box 1 during 2013–2015, salinities >1 were measured only on four occasions, suggesting episodic and short–term seawater inflows to the lagoon. Zemlys et al. [35] reported that seawater intrusion is restricted to a small and limited area in the northern part of the lagoon, which covers ~3% of the lagoon surface. One of the assumptions of the black-box approach is that the two identified areas within the lagoon are homogeneous. However, this is quite difficult to assess due to their large surface and the evident environmental gradient established from the river to the sea mouth. A visual estimation of spatial heterogeneity of the Curonian Lagoon is reported in a study by Bresciani et al. [44], which indicates that meteorological, as well as hydrological conditions, can strongly affect the seasonal distribution of phytoplankton blooms. For this reason, annual more than seasonal mass budgets approach a steady state.

4.2. Nutrient Balances

The estimated budgets show that nutrient inputs to the Curonian Lagoon were mainly delivered by the Nemunas River. Such inputs displayed large seasonality, depending on river discharge, crops, and vegetation activity in the river catchment [34,45]. A major fraction of N and P delivered from Nemunas catchment has anthropogenic origin [46,47] whereas DSi transport depends on the intensity of natural bedrock weathering and groundwater transport, that can be amplified by agriculture [48]. The ecological stoichiometry of delivered nutrients suggests strong N and Si summer limitation that favors dominance of cyanobacteria [6].
A major objective of this study was to understand whether watershed-generated nutrient loads were attenuated or increased during their path to the Baltic Sea through the Curonian Lagoon. We found that both dissolved inorganic and total P and Si, and dissolved inorganic N were net retained within the estuary. The lagoon acted as an efficient filter, in particular for DIP (74% of load), and less for DIN and DSi (10% and 25% of load, respectively). These findings show that DIP retention in the Curonian Lagoon is >30% higher in comparison to other estuarine systems [10,49,50,51], but similar to that reported for the Swedish coast [52]. DIN retention in the Curonian Lagoon was comparatively lower, and aligned with recent evaluation of nutrient retention, more effective for P than for N, in other coastal zones of the Baltic Sea [10,52]. Unfortunately, we cannot compare the estuarine filter efficiency for DSi due to the lack of data from other estuarine systems based on our used LOICZ approach. Prior studies [53,54,55], using different experimental methods, had previously documented the effective DSi retention and transformation along the river-estuarine continuum. Dissolved nutrient can be attenuated by uptake and incorporation into biomass of primary producers (microphytobenthos and phytoplankton), sedimentation, and burial or loss to the atmosphere via denitrification or anammox [12,13,14,15].
The loads of TN increased within the estuarine system whereas terrestrial TP and TSi loads decreased. However, the TP and TSi net retention in the Curonian Lagoon was less than 5% of external loads. This percentage is considerably lower than those reported in other estuarine systems where TP and TN retention may correspond to 16–52% and 20–87% of riverine loads, respectively [26,50,51,56]. Our results suggest that in shallow lagoons with N2-fixing cyanobacterial blooms, the elevated production of labile organic matter may partly (TP) or entirely (TN) offset annual retention. These patterns can be found in other freshwater lagoons along the coasts of the Baltic Sea (e.g., Oder Lagoon, [56]).
Another major objective of this study was to highlight spatial and temporal differences in nutrient transformation within the two considered boxes. Box 2 received inputs of inorganic nutrients from Box 1, generally exceeding inputs from the Deima River and from precipitation. Due to the large surface of Box 2, such inputs were about 10 times lower for unit area in comparison with the areal loads of Box 1. Our results show that Box 2 functioned as a net sink for DIN and DIP and that combining annual net internal transformations with (nfix-denit) values (Table 2 and Table 3), it is possible to distinguish the contribution of phytoplankton assimilation and denitrification to DIN retention. Results show that in Box 2, nearly 88% of DIN was lost thought denitrification whereas a minor fraction was retained due to phytoplankton uptake. In Box 1, on the contrary, assimilative processes were dominated over losses via denitrification.
In Box 2, the inefficient DIP retention resulted in a lower DIN:DIP molar ratio. In a scenario of increasing temperatures, lower discharge and higher water renewal time, such an unbalanced nutrient availability, may further promote blooms of N2-fixing cyanobacteria [57]. The latter might also be supported by short-term anoxia events, inducing DIP redox-dependent release from sediments [20,23]. In Box 1, efficient DIP retention maintained a more balanced DIN:DIP molar ratio, likely preventing undesired cyanobacterial blooms.

4.3. Ecosystem Functions

The estimated ecosystem functions NEM and (nfix-denit) (2.50 and 0.15 mmol m−2 d−1, respectively) are consistent with values obtained during budget calculations performed in more than 200 systems over the world conducted in the framework of LOICZ [58]. Positive values indicate a dominance of organic matter production over respiration and N2-fixation over denitrification. Rates of carbon fixation exceeding those or system respiration suggest also the dominance of dissolved inorganic N, P, and Si net retention in the Curonian Lagoon [6,7]. The reliability of these estimates can be tested via comparison with direct measurements of pelagic N2-fixation, net N2 flux at the sediment–water interface and NEM by open water techniques carried out in 2015 (7, Stæhr et al. in prep.). Estimates of (nfix-denit) are in agreement with the results obtained by laboratory incubations of intact sediment cores and water (−0.34 mmol m−2 d−1 [7]). Assuming that in 2015, DIN retention was 0.58 mmol m−2 d−1 and (nfix-denit) was −0.17 mmol m−2 d−1, we speculate that 30% of DIN was denitrified whereas the rest was retained through assimilative uptake by primary producers. However, the balance between denitrification and N2-fixation in the Curonian Lagoon varies seasonally and spatially [7]. Differences in organic matter content, N availability, microphytobenthos activity, and water residence time may stimulate one process over the other. Considering the low rates of N2 fluxes measured in the water column, benthic processes are likely more important to define (nfix-denit) function in the Curonian Lagoon [7]. We conclude that the high rates of benthic N2-fixation in the northern sector can offset N loss via denitrification occurring in the southern sector and set the whole lagoon as net N source to the Baltic Sea (Table 3).
NEM estimations with budgets indicate that the Curonian Lagoon was a net source of organic material with uptake rates of dissolved inorganic nutrients by phytoplankton and their conversion into particulate forms exceeding rates of mineralization. Surprisingly, such estimations largely differ from the results obtained with open water technique, which stated a large dominance of respiration processes in this estuary (−36.9 mmol m−2 d−1, Stæhr et al. in prep.). A number of assumptions could account for this disparity and it is worth understanding them. Besides spatial and temporal heterogeneities of the system and consequent upscaling errors, NEM was calculated from DIP budgets. The latter, for example, might be affected by the suspended particles that are abundant in the transitional area and can adsorb DIP and induce some overestimation of NEM.

5. Conclusions

Results from this study support the hypothesis that the Curonian Lagoon functioning, which results from the combined biogeochemical processes occurring in this estuary, display large spatial and temporal (i.e., annual) variability. This means that interannual climatic differences, resulting in different discharge, temperature regimes, and nutrient loads can suppress or reverse the estuarine filter role. The application of the LOICZ budget approach represents a unique opportunity to analyze the whole system functioning of large estuaries [28,29]. It is unique as it can simultaneously provide different and reliable estimates of ecosystem functions (e.g., net autotrophy and nutrient retention or net heterotrophy and nutrient regeneration) and does not require sophisticated modeling tools and very skillful expertise but rather good experimental data and use of basic equations. The use of this approach peaked in Europe in the 1990s, coinciding with a large effort promoted and supported by the European Commission aiming at better understanding the consequences of eutrophication on estuaries [25]. We believe that the analysis of a large number of estuarine systems with the same method is important as it makes these systems comparable. Under scenarios of changing climate and socio–economic activities and in the framework of oligotrophication pathways for many European watersheds, the application of this budgeting appears useful also now, with the same comparative aims. The general impression that emerges from the analysis of the literature is that calculations of whole system functioning (e.g., NEM) were limited in time (e.g., a single application over a single annual dataset) and sometimes with heterogeneous datasets (e.g., collected in different years and from different projects). With this respect, data, calculations, and results reported in the present study seem very robust: budgets were calculated over three consecutive years on accurate datasets collected on purpose. Furthermore, the Curonian Lagoon biogeochemistry has been and is still intensively studied and recent investigation of pelagic and benthic processes carried out in stations from both the flushed and confined area, supports the results of this study [7].
We believe that the synthetic outcome of the LOICZ approach should become part of a new monitoring strategy, not limited to static parameters such as chlorophyll a or nitrate concentrations but targeting processes. This is the only way to analyze trajectories over time, from pristine to eutrophic, but also from eutrophic to oligotrophic and their feedback on whole system functioning. Following the ongoing Baltic Sea Action Plan (BSAP, [33]) Lithuania promised a large reduction of N and P loads to the Baltic Sea. Target reduction for P loads were achieved while reduction of N loads is still in progress [34]. Unfortunately, we cannot analyze how nutrient reduction affects the Curonian Lagoon functioning (e.g., its metabolism and nutrient retention). This is due to the fact that we simply do not know the baseline metabolism of most of our estuaries and have no references on how it might vary from year to year. We believe it is important to create long-term databases in order to follow trajectories in the functioning of ecosystems, along loads or other environmental gradients, including those associated to climate change as timing and amount of precipitation and average temperatures.

Author Contributions

Conceptualization, G.G. and M.Z.; methodology, G.G. and P.Z.; software, P.Z.; investigation, I.V.-L., J.P. M.Z. and P.Z.; resources, M.Z.; data curation, I.V.-L., J.P., G.G., P.Z. and M.M.; writing—original draft preparation, G.G., I.V.-L. and M.B.; writing—review and editing, all; visualization, M.Z. and M.M.; funding acquisition, M.B. and M.Z. All authors have read and agreed to the published version of the manuscript.

Funding

This research was funded by the Research Council of Lithuania (LMT), grants No. S-MIP-17-11 (Phosphorus as driver of cyanobacterial hyperblooms in the Curonian Lagoon-Patchy) and No. S-MIP-17-7 (The role of atmospheric nitrogen fixation in the largest eutrophicated European lagoon-NitFix).

Institutional Review Board Statement

Not applicable.

Informed Consent Statement

Not applicable.

Data Availability Statement

Data can be accessed upon request to the corresponding author.

Acknowledgments

We kindly acknowledge Diana Vaičiūtė and Tomas Ruginis for assistance in field and laboratory analysis. We gratefully thank the Lithuanian Marine Research Department of the Ministry of Environment for providing meteorological and Nemunas River discharge data.

Conflicts of Interest

The authors declare no conflict of interest. The funders had no role in the design of the study; in the collection, analyses, or interpretation of data; in the writing of the manuscript, or in the decision to publish the results.

References

  1. Gazeau, F.; Smith, S.V.; Gentili, B.; Frankignoulle, M.; Gattuso, J. The European coastal zone: Characterization and first assessment of ecosystem metabolism. Estuar. Coast. Shelf Sci. 2004, 60, 673–694. [Google Scholar] [CrossRef]
  2. Danielsson, Å.; Papush, L.; Rahm, L. Alterations in nutrient limitations—Scenarios of a changing Baltic Sea. J. Mar. Syst. 2008, 73, 263–283. [Google Scholar] [CrossRef]
  3. Nowicki, B.L.; Oviatt, C.A. Are estuaries traps for anthropogenic nutrients? Evidence from estuarine mesocosms. Mar. Ecol. Prog. Ser. 1990, 66, 131–146. [Google Scholar] [CrossRef]
  4. McGuirk, F.A. Organic matter and nutrient cycling in a coastal plain estuary: Carbon, nitrogen and phosphorus distributions, budgets and fluxes. J. Coast. Res. 2008, 10055, 76–94. [Google Scholar] [CrossRef] [Green Version]
  5. Carstensen, J.; Sánchez-Camacho, M.; Duarte, C.M.; Krause-Jensen, D.; Marba, N. Connecting the dots: Responses of coastal ecosystems to changing nutrient concentrations. Environ. Sci. Technol. 2011, 45, 9122–9132. [Google Scholar] [CrossRef]
  6. Vybernaite-Lubiene, I.; Zilius, M.; Giordani, G.; Petkuviene, J.; Vaiciute, D.; Bukaveckas, P.A.; Bartoli, M. Effect of algal blooms on retention of N, Si and P in Europe’s largest coastal lagoon. Estuar. Coast. Shelf Sci. 2017, 194, 217–228. [Google Scholar] [CrossRef]
  7. Zilius, M.; Vybernaite-Lubiene, I.; Vaiciute, D.; Petkuviene, J.; Zemlys, P.; Liskow, I.; Voss, M.; Bartoli, M.; Bukaveckas, P.A. The influence of cyanobacteria blooms on the attenuation of nitrogen throughputs in a Baltic coastal lagoon. Biogeochemistry 2018, 141, 143–165. [Google Scholar] [CrossRef]
  8. Nixon, S.W.; Ammerman, J.W.; Atkinson, L.P.; Berounsky, V.M.; Billen, G.; Boicourt, W.C.; Boynton, W.R.; Church, T.M.; Ditoro, D.M.; Elmgren, R.; et al. The fate of nitrogen and phosphorus at the land-sea margin of the North Atlantic Ocean. Biogeochemistry 1996, 35, 141–180. [Google Scholar] [CrossRef]
  9. Boyer, E.W.; Howarth, R.W. Nitrogen fluxes from rivers to the coastal oceans. In Nitrogen in the Marine Environment; Elsevier Inc.: Amsterdam, The Netherlands, 2008; pp. 1565–1587. [Google Scholar]
  10. Asmala, E.; Carstensen, J.; Conley, D.J.; Slomp, C.P.; Stadmark, J.; Voss, M. Efficiency of the coastal filter: Nitrogen and phosphorus removal in the Baltic Sea. Limnol. Oceanogr. 2017, 62, S222–S238. [Google Scholar] [CrossRef]
  11. Schubel, J.R.; Kennedy, V.S. Estuary as a Filter: An Introduction; Academic Press: Orlando, FL, USA, 1984; Volume 10, pp. 1–11. [Google Scholar]
  12. Nedwell, D.B.; Jickells, T.D.; Trimmer, M.; Sanders, R. Nutrients in Estuaries. In Advances in Ecological Research; Nedwell, D.B., Raffaelli, D.G., Eds.; Academic Press: Cambridge, MA, USA, 1999; Volume 29, pp. 43–92. [Google Scholar]
  13. Sundbäck, K.; Linares FLarson, F.; Wulff, A.; Engelsen, A. Benthic nitrogen fluxes along a depth gradient in a microtidal fjord: The role of denitrification and microphytobenthos. Limnol. Oceanogr. 2004, 49, 1095–1107. [Google Scholar] [CrossRef]
  14. Brion, N.; Jans, S.; Chou, L.; Rousseau, V. Nutrient loads to the Belgian coastal zone. In Current Status of Eutrophication in the Belgian Coastal Zone; Presse Universitaire de Bruxelles: Brussels, Belgium, 2008. [Google Scholar]
  15. Eyre, B.D.; Maher, D.T.; Sanders, C. The contribution of denitrification and burial to the nitrogen budgets of three geomorphically distinct Australian estuaries: Importance of seagrass habitats. Limnol. Oceanogr. 2016, 61, 1144–1156. [Google Scholar] [CrossRef] [Green Version]
  16. Jensen, H.S.; Mortensen, P.B.; Andersen, F.O.; Rasmussen, E.; Jensen, A. Phosphorus cycling in a coastal marine sediment, Aarhus Bay, Denmark. Limnol. Oceanogr. 1995, 40, 908–917. [Google Scholar] [CrossRef]
  17. Howarth, R.W.; Billen, G.; Swaney, D.; Townsend, A.; Jawoski, N.; Lajtha, K.; Downing, J.A.; Elmgren, R.; Caraco, N.; Jordan, T.; et al. Regional nitrogen budgets and riverine N & P fluxes for the drainages to the North Atlantic Ocean: Natural and human influences. Biogeochemistry 1996, 35, 75–139. [Google Scholar]
  18. Bukaveckas, P.A.; Isenberg, W.N. Loading, transformation, and retention of nitrogen and phosphorus in the tidal freshwater James River (Virginia). Estuaries Coasts 2013, 36, 1219–1236. [Google Scholar] [CrossRef]
  19. Viaroli, P.; Bartoli, M.; Giordani, G.; Naldi, M.; Orfanidis, S.; Zaldivar, J.M. Community shifts, alternative stable states, biogeochemical controls and feedbacks in eutrophic coastal lagoons: A brief overview. Aquat. Conserv. Mar. Freshw. Ecosyst. 2008, 18, S105–S117. [Google Scholar] [CrossRef]
  20. Zilius, M.; Bartoli, M.; Bresciani, M.; Katarzyte, M.; Ruginis, T.; Petkuviene, J.; Lubiene, I.; Giardino, C.; Bukaveckas, P.A.; de Wit, R.; et al. Feedback mechanisms between cyanobacterial blooms, transient hypoxia, and benthic phosphorus regeneration in shallow coastal environments. Estuaries Coasts 2014, 37, 680–694. [Google Scholar] [CrossRef]
  21. Nixon, S.W.; Hunt, C.D.; Nowicki, B.L. The retention of nutrients (C, N, P), heavy metals (Mn. Cd, Pb, Cu), and petroleum hydrocarbons in Narragansett Bay. In Biogeochemical Processes at the Land-Sea Boundary; Elsevier: Amsterdam, The Netherlands, 1986; pp. 99–122. [Google Scholar]
  22. Nixon, S.W. Chesapeake Bay nutrient budgets: A reassessment. Biogeochemistry 1987, 4, 77–90. [Google Scholar] [CrossRef]
  23. Petkuviene, J.; Zilius, M.; Lubiene, I.; Ruginis, T.; Giordani, G.; Razinkovas-Baziukas, A.; Bartoli, M. Phosphorus cycling in a freshwater estuary impacted by cyanobacterial blooms. Estuaries Coasts 2016, 39, 1386–1402. [Google Scholar] [CrossRef]
  24. Herbert, R.A. Nitrogen cycling in coastal marine ecosystems. FEMS Microbiol. Rev. 1999, 23, 563–590. [Google Scholar] [CrossRef]
  25. Le Tissier, M.; Buddemeier, R.; Parslow, J.; Swaney, D.P.; Crossland, C.J.; Smith, S.V.; Kremer, H.H. The Role of the Coastal Ocean in the Disturbed and Undisturbed Nutrient and Carbon Cycles—A Management Perspective; LOICZ: Geesthacht, Germany, 2006; p. 44. [Google Scholar]
  26. Boynton, W.R.; Hagy, J.D.; Cornwel, J.C.; Kemp, W.M.; Greene, S.M.; Owens, M.S.; Baker, J.E.; Larsen, R.K. Nutrient budgets and management actions in the Patuxent river estuary, Maryland. Estuaries Coasts 2008, 31, 623–651. [Google Scholar] [CrossRef]
  27. Gordon, D.C.; Boudreau, P.R.; Mann, K.H.; Ong, J.E.; Silvert, W.L.; Smith, S.V.; Wattayakorn, G.; Wulff, F.; Yanagi, T. LOICZ Biogeochemical Modelling Guidelines; LOICZ: Texel, The Netherlands, 1996. [Google Scholar]
  28. Ramesh, R.; Chen, Z.; Cummins, V.; Day, J.; D’Elia, C.; Dennison, B.; Forbes, D.L.; Glaeser, B.; Glaser, M.; Glavovic, B.; et al. Land–Ocean Interactions in the Coastal Zone: Past, present & future. Anthr. Rev. 2015, 12, 85–98. [Google Scholar]
  29. Swaney, D.P.; Giordani, G. LOICZ Research & Studies No. 37. Helmholtz-Zentrum Geesthacht. In Proceedings of the LOICZ Workshop on Biogeochemical Budget Methodology and Applications, Providence, RI, USA, 9–10 November 2007; p. 195. [Google Scholar]
  30. Rabalais, N.N. Nitrogen in Aquatic Ecosystems. Ambio 2002, 102–112. [Google Scholar] [CrossRef]
  31. Borja, Á.; Elliott, M.; Carstensen, J.; Heiskanen, A.S.; van de Bund, W. Marine management–towards an integrated implementation of the European Marine Strategy Framework and the Water Framework Directives. Mar. Pollut. Bull. 2010, 60, 2175–2186. [Google Scholar] [CrossRef]
  32. Voss, M.; Dippner, J.; Humborg, C.; Korth, F.; Neumann, T.; Hürdler, J.; Schernewski, G.; Venohr, M. History and scenarios of future development of Baltic Sea eutrophication. Estuar. Coast. Shelf Sci. 2011, 92, 307–322. [Google Scholar] [CrossRef]
  33. HELCOM. HELCOM Guidelines for the Annual and Periodical Compilation and Reporting of Waterborne Pollution Inputs to the Baltic Sea (PLC-Water). 2015. Available online: http://www.helcom.fi/Lists/Publications/PLC-Water%20Guidelines.pdf (accessed on 8 November 2018).
  34. Vybernaite-Lubiene, I.; Zilius, M.; Saltyte-Vaisiauske, L.; Bartoli, M. Recent Trends (2012–2016) of N, Si, and P Export from the Nemunas River Watershed: Loads, Unbalanced Stoichiometry, and Threats for Downstream Aquatic Ecosystems. Water 2018, 10, 1178. [Google Scholar] [CrossRef] [Green Version]
  35. Zemlys, P.; Ferrarin, C.; Umgiesser, G.; Gulbinskas, S.; Bellafiore, D. Investigation of saline water intrusions into the Curonian Lagoon (Lithuania) and two-layer flow in the Klaipėda Strait using finite element hydrodynamic model. Ocean Sci. J. 2013, 9, 573–584. [Google Scholar] [CrossRef] [Green Version]
  36. Jakimavičius, D.; Kovalenkovienė, M. Long-term water balance of the Curonian Lagoon in the context of anthropogenic factors and climate change. Baltica 2010, 23, 33–46. [Google Scholar]
  37. Vaitkuviene, D.; Dagys, M. CORINE 2006 Land Cover, Lithuania. Implementing CLC2006 Project in Lithuania, Report; Institute of Ecology of Vilnius University: Vilnius, Lithuania, 2008. [Google Scholar]
  38. Umgiesser, G.; Zemlys, P.; Erturk, A.; Razinkova-Baziukas, A.; Mežinė, J.; Ferrarin, C. Seasonal renewal time variability in the Curonian Lagoon caused by atmospheric and hydrographical forcing. Ocean Sci. J. 2016, 12, 391–402. [Google Scholar] [CrossRef] [Green Version]
  39. Pilkaitytė, R.; Razinkovas, A. Factors controlling phytoplankton blooms in a temperate estuary: Nutrient limitation and physical forcing. Hydrobiologia 2006, 555, 41–48. [Google Scholar] [CrossRef]
  40. Jakimavicius, D. Changes of Water Balance Elements of the Curonian Lagoon and Their Forecast Due to Anthropogenic and Natural Factors. Ph.D. Thesis, Lithuanian Energy Institute, Kaunas, Lithuania, 2012. [Google Scholar]
  41. Caffrey, J.M. Production, respiration and net ecosystem metabolism in US estuaries. In Coastal Monitoring through Partnerships; Springer: Dordrecht, The Netherlands, 2003; pp. 207–219. [Google Scholar]
  42. Ferrarin, C.; Razinkovas, A.; Gulbinskas, S.; Umgiesser, G.; Bliudziute, L. Hydraulic regime-based zonation scheme of the Curonian Lagoon. Hydrobiologia 2008, 611, 133–146. [Google Scholar] [CrossRef] [Green Version]
  43. Jakimavičius, D.; Kriaučiūnienė, J. The climate change impact on the water balance of the Curonian Lagoon. Water Resour. Res. 2013, 40, 120–132. [Google Scholar] [CrossRef]
  44. Bresciani, M.; Adamo, M.; De Carolis, G.; Matta, E.; Pasquariello, G.; Vaičiūtė, D.; Giardino, C. Monitoring blooms and surface accumulation of cyanobacteria in the Curonian Lagoon by combining MERIS and ASAR data. Remote Sens. Environ. 2014, 146, 124–135. [Google Scholar] [CrossRef]
  45. Fulweiler, R.W.; Nixon, S.W. Export of nitrogen, phosphorus, and suspended solids from a southern New England watershed to Little Narragansett Bay. Biogeochemistry 2005, 76, 567–593. [Google Scholar] [CrossRef]
  46. Korth, F.; Fry, B.; Liskow, I.; Voss, M. Nitrogen turnover during the spring outflows of the nitrate-rich Curonian and Szczecin lagoons using dual nitrate isotopes. Mar. Chem. 2013, 154, 1–11. [Google Scholar] [CrossRef]
  47. Bauer, A. Status of Nutrient Bookkeeping in the Baltic Sea Countries. Report document Texte 95/2015. 2015. Available online: http://www.umweltbundesamt.de/publikationen/status-of-nutrient-bookkeeping-in-the-baltic-sea.pdf (accessed on 13 December 2021).
  48. Mangalaa, K.R.; Cardinal, D.; Brajard, J.; Rao, D.B.; Sarma, N.S.; Djouraev, I.; Chiranjeevulu, G.; Murty, K.N.; Sarma, V.V.S.S. Silicon cycle in Indian estuaries and its control by biogeochemical and anthropogenic processes. Cont. Shelf Res. 2017, 148, 64–88. [Google Scholar] [CrossRef]
  49. Rendell, A.R.; Horrobin, T.M.; Jickells, T.D.; Edmunds, H.M.; Brown, J.; Malcolm, S.J. Nutrient cycling in the Great Ouse estuary and its impact on nutrient fluxes to The Wash, England. Estuar. Coast. Shelf Sci. 1997, 45, 653–668. [Google Scholar] [CrossRef]
  50. Grelowski, A.; Pastuszak, M.; Sitek, S.; Witek, Z. Budget calculations of nitrogen, phosphorus and BOD 5 passing through the Oder estuary. J. Mar. Syst. 2000, 5, 221–237. [Google Scholar] [CrossRef]
  51. Bukaveckas, P.A.; Beck, M.; Devore, D.; Lee, W.M. Climatic variability and its role in regulating C, N and P retention in the James River Estuary. Estuar. Coast. Shelf Sci. 2018, 205, 161–173. [Google Scholar] [CrossRef] [Green Version]
  52. Edman, M.K.; Eilola, K.; Almroth-Rosell, E.; Meier, H.E.; Wåhlström, I.; Arneborg, L. Nutrient retention in the Swedish coastal zone. Front. Mar. Sci. 2018, 5, 415. [Google Scholar] [CrossRef] [Green Version]
  53. Amann, T.; Weiss, A.; Hartmann, J. Silica fluxes in the inner Elbe Estuary, Germany. Biogeochemistry 2014, 118, 389–412. [Google Scholar] [CrossRef]
  54. Soetaert, K.; Middelburg, J.J.; Heip, C.; Meire, P.; Van Damme, S.; Maris, T. Long-term change in dissolved inorganic nutrients in the heterotrophic Scheldt estuary (Belgium, The Netherlands). Limnol. Oceanogr. 2006, 51, 409–423. [Google Scholar] [CrossRef] [Green Version]
  55. Romero, E.; Garnier, J.; Billen, G.; Ramarson, A.; Riou, P.; Le Gendre, R. Modeling the biogeochemical functioning of the Seine estuary and its coastal zone: Export, retention, and transformations. Limnol. Oceanogr. 2019, 64, 895–912. [Google Scholar] [CrossRef]
  56. Radtke, H.; Neumann, T.; Voss, M.; Fennel, W. Modeling pathways of riverine nitrogen and phosphorus in the Baltic Sea. J. Geophys. Res. 2012, 117. [Google Scholar] [CrossRef]
  57. Bartoli, M.; Zilius, M.; Bresciani, M.; Vaičiūtė, D.; Lubiene-Vybernaite, I.; Petkuviene, J.; Giordani, G.; Daunys, D.; Ruginis, T.; Benelli, S.; et al. Drivers of cyanobacterial blooms in a hypertrophic lagoon. Front. Mar. Sci. 2018, 5, 434. [Google Scholar] [CrossRef] [Green Version]
  58. Crossland, C.J.; Kremer, H.H.; Lindeboom, H.; Crossland, J.I.M.; Le Tissier, M. (Eds.) Coastal Fluxes in the Anthropocene: The Land-Ocean Interactions in the Coastal Zone Project of the International Geosphere-Biosphere Programme; Springer Science & Business Media: Berlin, Germany, 2005. [Google Scholar]
Figure 1. Map of the Curonian Lagoon reporting the sampling stations (black triangles) and the two boxes in which the system was divided for budget calculations.
Water 14 00164 g001
Figure 3. Dissolved inorganic (DIP) (a) and total phosphorus (TP) (b) budget for the Curonian Lagoon in 2013–2015. “P” is precipitation, “Rivers” includes Nemunas and Minija rivers plus Klaipeda WWTP that discharge in Box 1 and “River” is the Deima River that discharges in the southern area. Negative values in the internal transformations (round arrows within the grey areas) indicate retention (sinks) while positive values indicate production (sources). Units are 103 mol d−1.
Water 14 00164 g003
Figure 4. Dissolved inorganic (DIN) (a) and total nitrogen (TN) (b) balance for the Curonian Lagoon in 2013–2015. Legends are the same of Figure 3. Units are 105 mol d−1.
Water 14 00164 g004
Figure 5. Dissolved inorganic (DSi) (a) and total silica (TSi) (b) budget for the Curonian Lagoon in 2013–2015. Legends are the same of Figure 3. Units are 105 mol d−1.
Water 14 00164 g005
Table 1. Annual average river discharge and net outflow to the Baltic Sea, water volume exchange between Box 1 and the Baltic Sea (Box 1–Sea) and between Box 1 and Box 2 (Box 1–Box 2), and hydraulic residence time (τw).
Macro AreaYearRiver Discharge (106 m3 d−1)Net Outflow (106 m3 d−1)Exchange Flow (106 m3 d−1)τw (Days)
Box 1201357.861.946.3 (Box 1–Sea)4
201441.543.840.2 (Box 1–Sea)4
201539.241.749.7 (Box 1–Sea)4
Box 220134.04.185.6 (Box 1–Box 2)57
20142.32.276.8 (Box 1–Box 2)65
20152.32.390.5 (Box 1–Box 2)55
Table 2. Annual net internal transformations of dissolved inorganic and total phosphorus, nitrogen, and silica forms in the Curonian Lagoon. Positive values indicate net production (source) whereas negative values indicate net retention (sink). Net fluxes in Box 1 and Box 2 and at the whole lagoon scale are expressed in 103 mol d−1 (DIP, TP) and in 105 mol d−1 (DIN, TN and DSi and TSi); areal fluxes are reported in brackets and are all expressed in mmol m−2 d−1.
NutrientNutrient FormYearBox 1Box 2Whole Lagoon
PhosphorusDIP2013−29.5 (−0.073)−6.2 (−0.005)−35.7 (−0.023)
2014−23.2 (−0.057)−12.8 (−0.011)−36.0 (−0.023)
2015−27.7 (−0.069)−12.3 (−0.010)−40.0 (−0.025)
TP2013−47.9 (−0.118)+39.4 (+0.033)−8.5 (−0.005)
2014−69.6 (−0.172)+65.3 (+0.056)−4.3 (0.003)
2015−91.2 (−0.226)+85.0 (+0.072)−6.2 (0.004)
NitrogenDIN2013+16.3 (+4.031)−16.1 (−1.369)+0.2 (+0.013)
2014+7.8 (+1.929)−9.4 (−0.799)−1.6 (−0.101)
2015+14.7 (+3.635)−23.8 (−2.023)−9.1 (−0.576)
TN2013+51.4 (+12.711)−20.2 (−1.717)+31.2 (+1.974)
2014+0.4 (+0.099)+15.7 (+1.335)+16.1 (+1.019)
2015+38.5 (+9.521)−6.5 (−0.553)+32.0 (+2.024)
SilicaDSi2013+33.7 (+8,334)−31.9 (−2.712)+1.8 (+0.114)
2014−5.9 (−1.459)−15.3 (−1.301)−21.2 (−1.341)
2015−38.3 (−9.472)+14.9 (+1.267)−23.4 (−1.480)
TSi2013+30.8 (+7.617)−22.9 (−1.947)+7.9 (+0.500)
2014−16.7 (−4.130)+5.5 (+0.468)−11.1 (−0.702)
2015−49.3 (−12.192)+41.3 (+3.511)−8.0 (−0.506)
Table 3. Total and areal (in brackets) annual rates of Net Ecosystem Metabolism (NEM) and net difference between N2-fixation and denitrification (nfix-denit) calculated in Box 1 and 2 and in the whole Curonian Lagoon. Positive values indicate the dominance of net production over respiration for NEM and N2-fixation over denitrification for nfix–denit; negative values have opposite meaning.
MetabolismYearBox 1Box 2Whole Lagoon
NEM 105 mol d−1 (mmol C m−2 d−1)201331.3 (7.73)6.5 (0.56)37.8 (2.39)
201424.6 (6.08)13.5 (1.15)38.1 (2.41)
201529.3 (7.26)13.0 (1.11)42.4 (2.68)
(nfix-denit) 105 mol d−1 (mmol N m−2 d−1)201321.0 (5.20)−15.1 (−1.29)5.9 (0.37)
201411.5 (2.85)−7.4 (−0.63)4.2 (0.26)
201519.1 (4.72)−21.8 (−1.85)−2.7 (−0.17)
Publisher’s Note: MDPI stays neutral with regard to jurisdictional claims in published maps and institutional affiliations.

