
Adsorption Characteristics and Molecular Simulation of Malachite Green onto Modified Distillers’ Grains

1
College of Environmental Science and Engineering, Shaanxi University of Science & Technology, Xi’an 710021, China
2
Key Laboratory of Cleaner Production and Integrated Resource Utilization of China National Light Industry, Beijing Technology and Business University, Beijing 100048, China
3
Liquor Making Biological Technology and Application of Key Laboratory of Sichuan Province, Sichuan University of Science & Engineering, Zigong 643000, China
4
Key Laboratory of Wuliangye-flavor Liquor Solid-state Fermentation, China National Light Industry, Yibin 644000, China
*
Authors to whom correspondence should be addressed.
Water 2022, 14(2), 171; https://doi.org/10.3390/w14020171
Submission received: 8 December 2021
/
Revised: 4 January 2022
/
Accepted: 6 January 2022
/
Published: 8 January 2022
Abstract
:Adsorbent material was prepared using distillers’ grains (DG), which is a waste product of distilleries. The DG was pre-treated with NaOH and esterification-modified with CS2, which is a commonly used anionic modifier. The structure and morphology of the adsorbent was characterized by FTIR, XRD, EDS, SEM, BET, and zeta potential. The related mechanism of adsorption of malachite green (MG) onto modified distiller’s grains (MDG) was studied by adsorption experiments and molecular simulation techniques. The experimental results showed that CS2 successfully modified the DG fiber, and simultaneously yielded the MDG with a uniform pore distribution. MDG had a considerable adsorption capacity of 367.39 mg/g and a maximum removal rate of 96.51%. After eight adsorption–desorption cycle experiments, the adsorption removal rate of MDG to MG dye remained at 82.6%. The adsorption process could be fitted well by a pseudo-second-order kinetic model (the correlation coefficient R2 > 0.998) and Freundlich isotherm adsorption equation (the correlation coefficient R2 > 0.972). Moreover, the adsorption of MG dye by MDG is a spontaneous, endothermic, and increased entropy process. The results of molecular simulation showed that the mechanism of MG molecules onto MDG was mainly chemical adsorption. The adsorption performance of MG onto MDG was better and more stable than DG. Molecular simulation also provided a theoretical guidance of MDG adsorption–desorption for the research on recycling of DG resources.
1. Introduction
Distillers’ grains (DG) are residues obtained from the solid-state distillation and brewing processes of fermented grains, usually generated due to incomplete fermentation. Various chemical macromolecules are present in DG, including proteins (26.8–33.7%, dry weight basis), carbohydrates (39.2–61.9%, including fibers), oils (3.5–12.8%), and ash (2.0–9.8%) [1]. The average annual output of DG in China is over 100 million tons [2]. DG waste discharged without proper treatment can cause rotting, and therefore causes serious pollution in environment. At present, most DG is used in applications such as cultivating edible mushrooms, producing fodder, and generating biogas, which have low utilization levels and low added value. Moreover, the abundant residual fiber and other components in DG cannot be reasonably utilized, resulting in a huge waste of resource and environmental pollution. Thus, it is necessary to develop a suitable utilization method for DG in line with the goals of the present century of carrying out clean production, developing sustainable agriculture and building a resource-saving society for sustainable development.
Malachite green (MG), also known as alkaline green, is a triphenylmethane-type dye [3]. It is easily soluble in water. It turns blue-green after dissolution in water and the aqueous solution becomes alkaline. As a typical cationic dye, MG is widely used in the leather, ceramics, textile and printing, and dyeing industries. Due to the benzene ring in its triphenylmethane structure, MG has a higher reactivity [4] and is difficult to degrade. More seriously, the dye accumulates in organisms and leads to carcinogenic, teratogenic, and mutagenic risks [5,6]. The main treatment methods for MG wastewater include the electrochemical method [7], the flocculation method, membrane separation, microwave degradation, and the adsorption method [8,9]. Among these methods, the adsorption method is simple and has a relatively low cost, therefore this method can be used for the treatment of wastewater from printing and dyeing industry. Currently, some new, high-efficient, and inexpensive adsorbent materials with high surface area, including saw dust [10], orange peel [11], activated carbon [12], peanut shell [13], and bagasse [14] have been developed and utilized as new adsorption material for organic dyes [15,16,17,18,19,20]). The dual function adsorbent (IPNs) showed an excellent CV dye adsorption capacity (94.4%, Qmax = 555.6 mg/g) at the optimum conditions chosen [21]. However, to the best of our knowledge, DG has not been applied yet as an adsorbent for organic dyes [22,23,24,25].
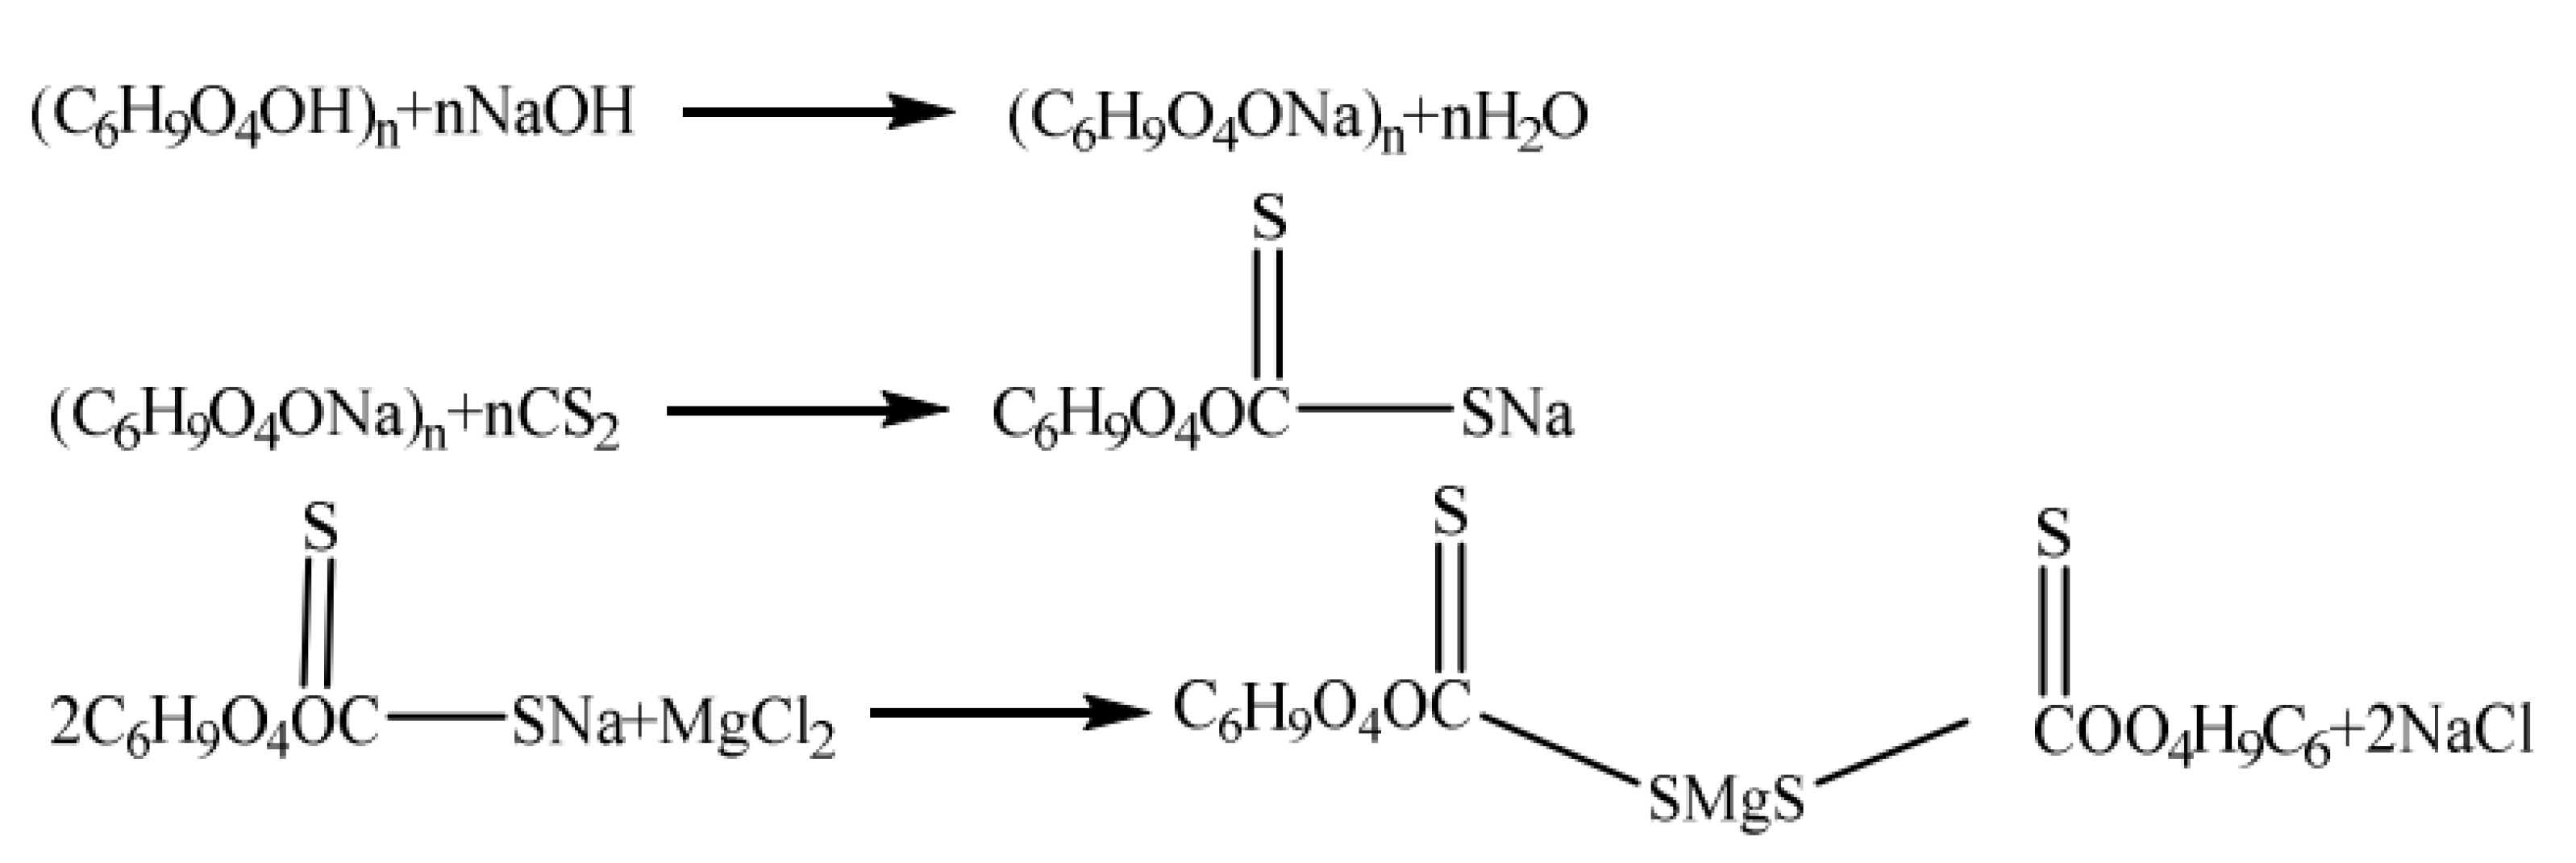
The protein, fat, and microbial precursors in DG can be removed via a suitable pre-treatment method [26,27], which can lead to a large number of pores in the DG structure ultimately increasing its specific surface area [28]. Furthermore, a large number of active hydroxyl and carbonyl groups exists on the surface of DG fiber [29,30]. CS2 is a commonly used anionic modifier. Under alkaline conditions, CS2 reacts with NaOH to form dithiocarbonate (HCS2ONa), and then reacts with the hydroxyl group on cellulose structure to be esterified and form cellulose xanthogen acid sodium salt, and the resultant product is an intermediate, which can be decomposed easily. Metal ions need to be added for transformation to increase the stability of the product. Metal ions such as Mg2+ can form a more stable structure with S and O atoms in cellulose xanthogenate [29]. Therefore, DG fibers can easily form modified distiller’s grains (MDG) via chemical modification and react with the cationic groups of MG, which can further enhance the adsorption performance of distillers’ grains.
However, in the existing studies, the adsorption efficiency and adsorption capacity of MDG are not very high, and is only used once, without multiple cycles of adsorption. If it can be reused many times, its resource utilization rate will be greatly improved.
In this study, DG fiber was used as raw material to prepare MDG through pre-treatment and chemical modification. The structure and composition of DG before and after modification was characterized by FTIR, XRD, EDS, BET, and SEM. The adsorption mechanism of DG for MG was discussed through the adsorption kinetic equation, the adsorption isothermal equation, and the thermodynamic equations and molecular simulation of adsorption process. The present work can provide a reference for the high value-added comprehensive utilization of DG as a waste product of distilleries. This work also provides a method for the disposal of wastewater containing triphenylmethane-type dyes using the concept of “disposing waste with waste”.
2. Experimental Section
2.1. Reagents, Materials and Instrumentation
Sodium hydroxide (NaOH) and hydrochloric acid (HCl) were purchased from Jinwang Chemical Co., Ltd. (Guangzhou, China), carbon disulfide (CS2) and magnesium chloride (MgCl2) were purchased from Yatai United Chemical Co., Ltd. (Wuxi, China), malachite green (MG) was purchased from Fuqiang Chemical Instrument Co., Ltd. (Hangzhou, China), and ethanol (CH3CH2OH) was purchased from Lu’s Chemical Co., Ltd. (Shanghai, China). DG was procured from a winery in Xi’an, China. Distilled water was used for this experiment. The equipment used in this experiment includes a shredder (XS-10, Xunzhong, China), a constant temperature oscillator (OS-1102, Woxin, China), an ultraviolet-visible spectrophotometer (UV-2006A, Long Nike, China), a Fourier transform infrared spectroscopy (Vector-22, Bruker, Germany), scanning electron spectrometer (EDAX Octane Prime, EDAX, Mahwah, NJ, USA), advance X-ray diffractometer (AXS D8, Bruker, Germany), specific surface analyzer (ASAP2460, Mike Corporation, Norcross, GA, USA), and a scanning electron microscope (FEI-Q45, FEI, Hillsboro, OR, USA).
2.2. Preparation of MDG
To prepare the adsorbent, 15 g of 120 mesh DG powder was poured into a three-necked flask (250 mL), and then 200 mL of 10% NaOH was added. The mixture was stirred at 110 rpm at 30 °C for 3 h in a water bath. At the end of the reaction, distilled water and 95% ethanol solution were used to wash the mixture until it attained neutral pH. Then the product was dried at 60 °C using an oven to obtain alkali DG fiber. Then, 10 g of DG alkali was placed in a 250 mL three-necked flask and 200 mL of 5% NaOH was added. The mixture was stirred at 110 rpm and allowed to react for 0.5 h in a water bath at 30 °C. Next, 20 g of CS2 was added and the reaction was continued for 2.5 h. Subsequently, 20 mL of 5% MgCl2 solution was added, and the reaction completed after 0.5 h. Distilled water and 95% ethanol solution were used to wash the mixture until it attained neutral pH, and then the product was dried at 60 °C using an oven to obtain modified distiller’s grains (MDG). The obtained MDG was sealed for later study, MDG The preparation scheme [29] is shown in Figure 1.
2.3. Characterization of MDG
The structure of the MDG was characterized using FTIR spectrometer with a scanning range of 4000~500 cm−1 and a scanning number of 32, the surface morphology of adsorption material was analyzed with FEI Q45 scanning electron microscope, the elemental composition of adsorbent was characterized by EDS, and the BT method was used to measure the surface area and pore structure of DG and MDG. The absorbance of MG-containing wastewater was measured with UV-Vis spectrophotometer.
2.4. Adsorption Experiment
For this experiment, 0.195 g of 140 mesh MDG was added to 30 mL of MG solution at the concentration of 200 mg/L for adsorption experiment. After the adsorption process, ultra-centrifugation of the mixture was done at 6000 r/min to get the supernatant. Absorbance of the MG remaining in the supernatant was recorded at 620 nm. The following equations were used for calculating adsorption capacity and removal rate of DG for MG [30]:
where:
C0 is the initial concentration;
Ce (mg/L) is the final concentration of MG solution;
V (L) is the initial volume of MG solution;
m (g) is the absorbent mass;
Qe (mg/g) is the adsorption capacity;
η is the rate of removal.
2.5. MDG Regeneration Performance
Next, 0.15 g MDG was added to a 30 mL solution with an MG concentration of 200 mg/L. After adsorption equilibrium, adsorbed MDG was added to 0.3 M HCl solution, shaken at 150 rpm for 30 min, washed with deionized water several times, and finally dried in a vacuum oven at 80 °C to obtain regenerated MDG. After that, three parallel adsorption experiments were conducted to analyze the ability of the regenerated MDG to remove MG dye. To test the regeneration of CDG, the adsorption-desorption cycle was repeated eight times.
2.6. Adsorption Kinetics
The rate of change of adsorption capacity is explained by the adsorption kinetics. Pseudo-first-order, pseudo-second order and intra-particle diffusion models are commonly used to describe the solid-liquid adsorption kinetics. Equations (3)–(5) show pseudo-first-order, pseudo-second order and intra-particle diffusion models, respectively:
where:
qe (mg/g) shows the adsorption capacities at equilibrium;
qt (mg/g) is the adsorption capacities at time t;
k1 (g/(mg/min) is the rate constant (pseudo-first order);
k2 (g/(mg/min) is the rate constant (pseudo-second order);
kd (mg g−1·min−1/2) is the intraparticle diffusion rate constant (intra-particle diffusion).
2.7. Isotherm Model of Adsorption
The Langmuir isotherm model assumes that: (a) molecular adsorption is a kind of mono-layer adsorption and a certain number of identical sites are distributed on a uniform surface, (b) the kinetic equilibrium cannot further adsorb except for the adsorption equilibrium, and (c) the adsorbed particles are thoroughly independent, and no interaction occurs between them [31,32]. The non-linear Langmuir isotherm equation is as follows:
where:
Ce (mg/L) shows the equilibrium concentration;
qe (mg/g) is the adsorption capacity at equilibrium concentration;
qm (mg/g) is the saturated adsorption capacity;
KL (L/mg) is the Langmuir adsorption constant related to adsorption capacity.
The Freundlich isotherm model is an empirical equation which can predict the situations where: (a) the surface of absorbent is non-uniform, (b) increase in concentration results in increased adsorption capacity, and (c) interaction amongst adsorbed molecules [33].:
where:
Ce (mg/L) is the equilibrium concentration;
qe (mg/g) is the adsorption capacity at the equilibrium concentration;
KF (L/mg) is the Freundlich adsorption constant which relates to adsorption capacity and characterized the strength of interaction between adsorbent and adsorbate. Adsorption capacity increases as the KF increase. The term 1/n is the heterogeneity factor of Freundlich isotherm, representing the adsorption intensity. When 0 < l/n < 1, the adsorption is favorable and proceeds easily; if 1/n = 1, the adsorption is non-linear and there is almost no interaction between adsorbent and adsorbate; when l/n > 1, the adsorption is unfavorable and difficult.
The Temkin model is based on a linear relationship between the heat of adsorption and the temperature, rather than a logarithmic relationship. It can describe the purification mechanism well:
where:
Ce (mg/L) is the concentration of MG solution when the adsorbent reaches adsorption equilibrium;
qe (mg/g) is the adsorption capacity at the equilibrium concentration;
αT(L/mg), βT(J/mol) are the Temkin isothermal model parameters.
2.8. Adsorption Thermodynamics
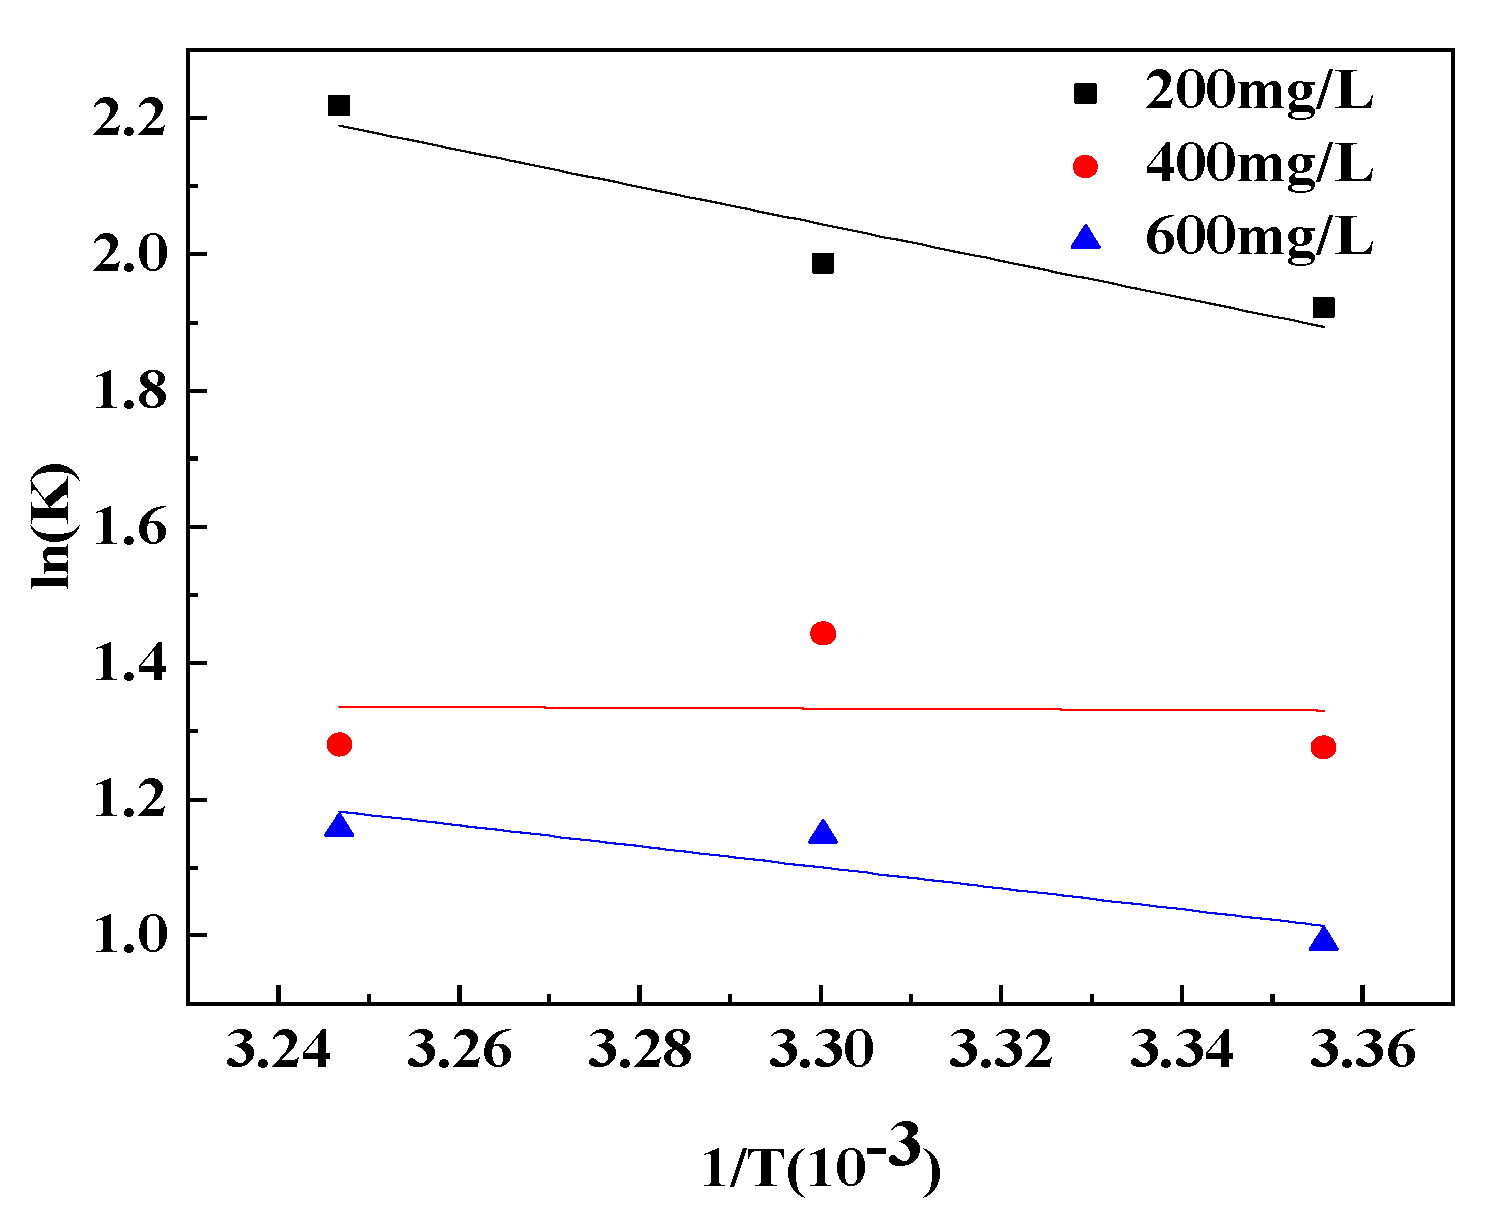
The temperature effect on the adsorption process for the MG solution with different concentrations was studied. Relevant thermodynamic parameters [33] (ΔG0, ΔS0, ΔH0) were calculated using following equations:
where:
T is the temperature in Kelvin;
R is the universal gas constant;
K is the equilibrium constant (K = qe/Ce);
Ce (mg/L) is the concentration at equilibrium;
qe (mg/g) is the adsorption capacity at equilibrium.
2.9. Molecular Simulation
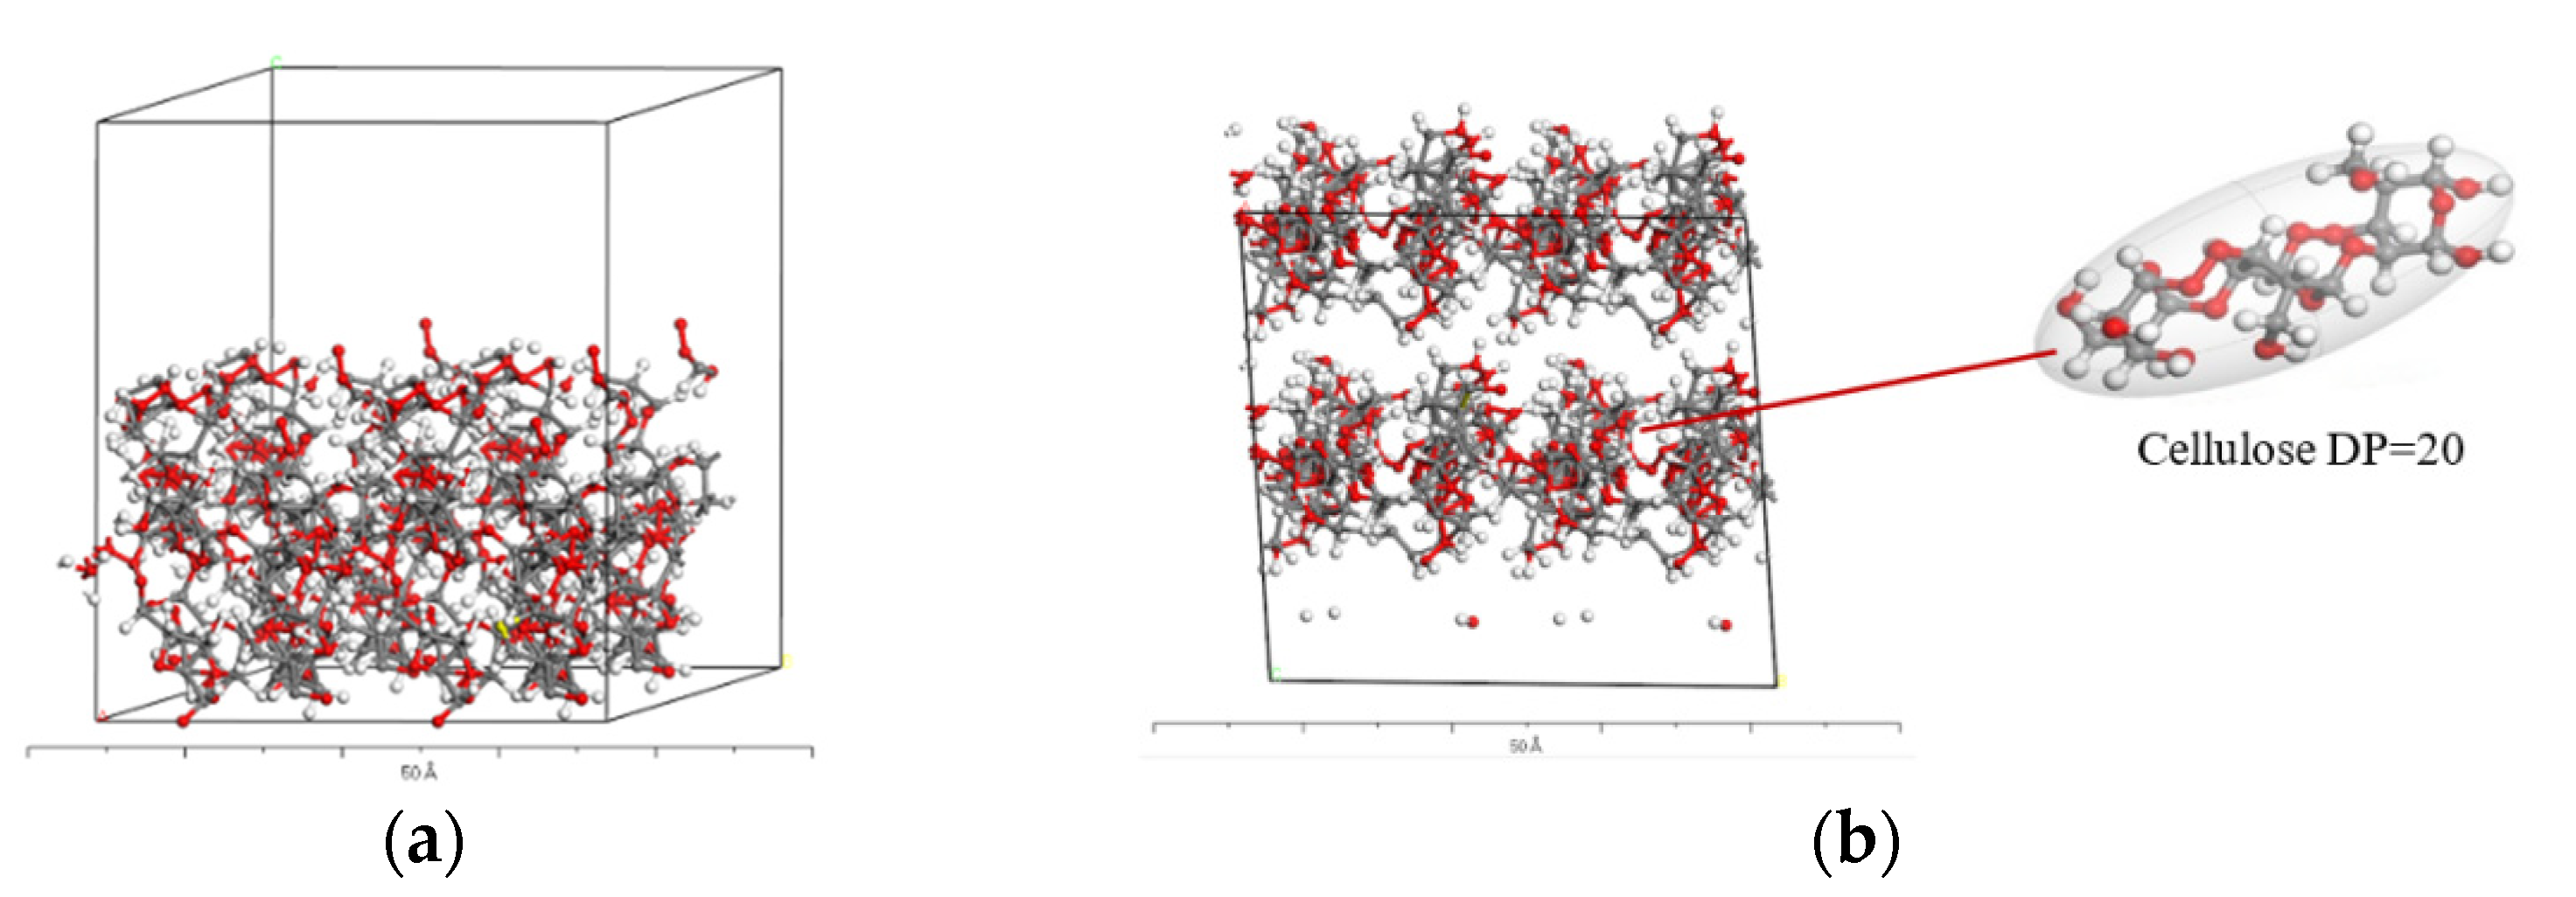
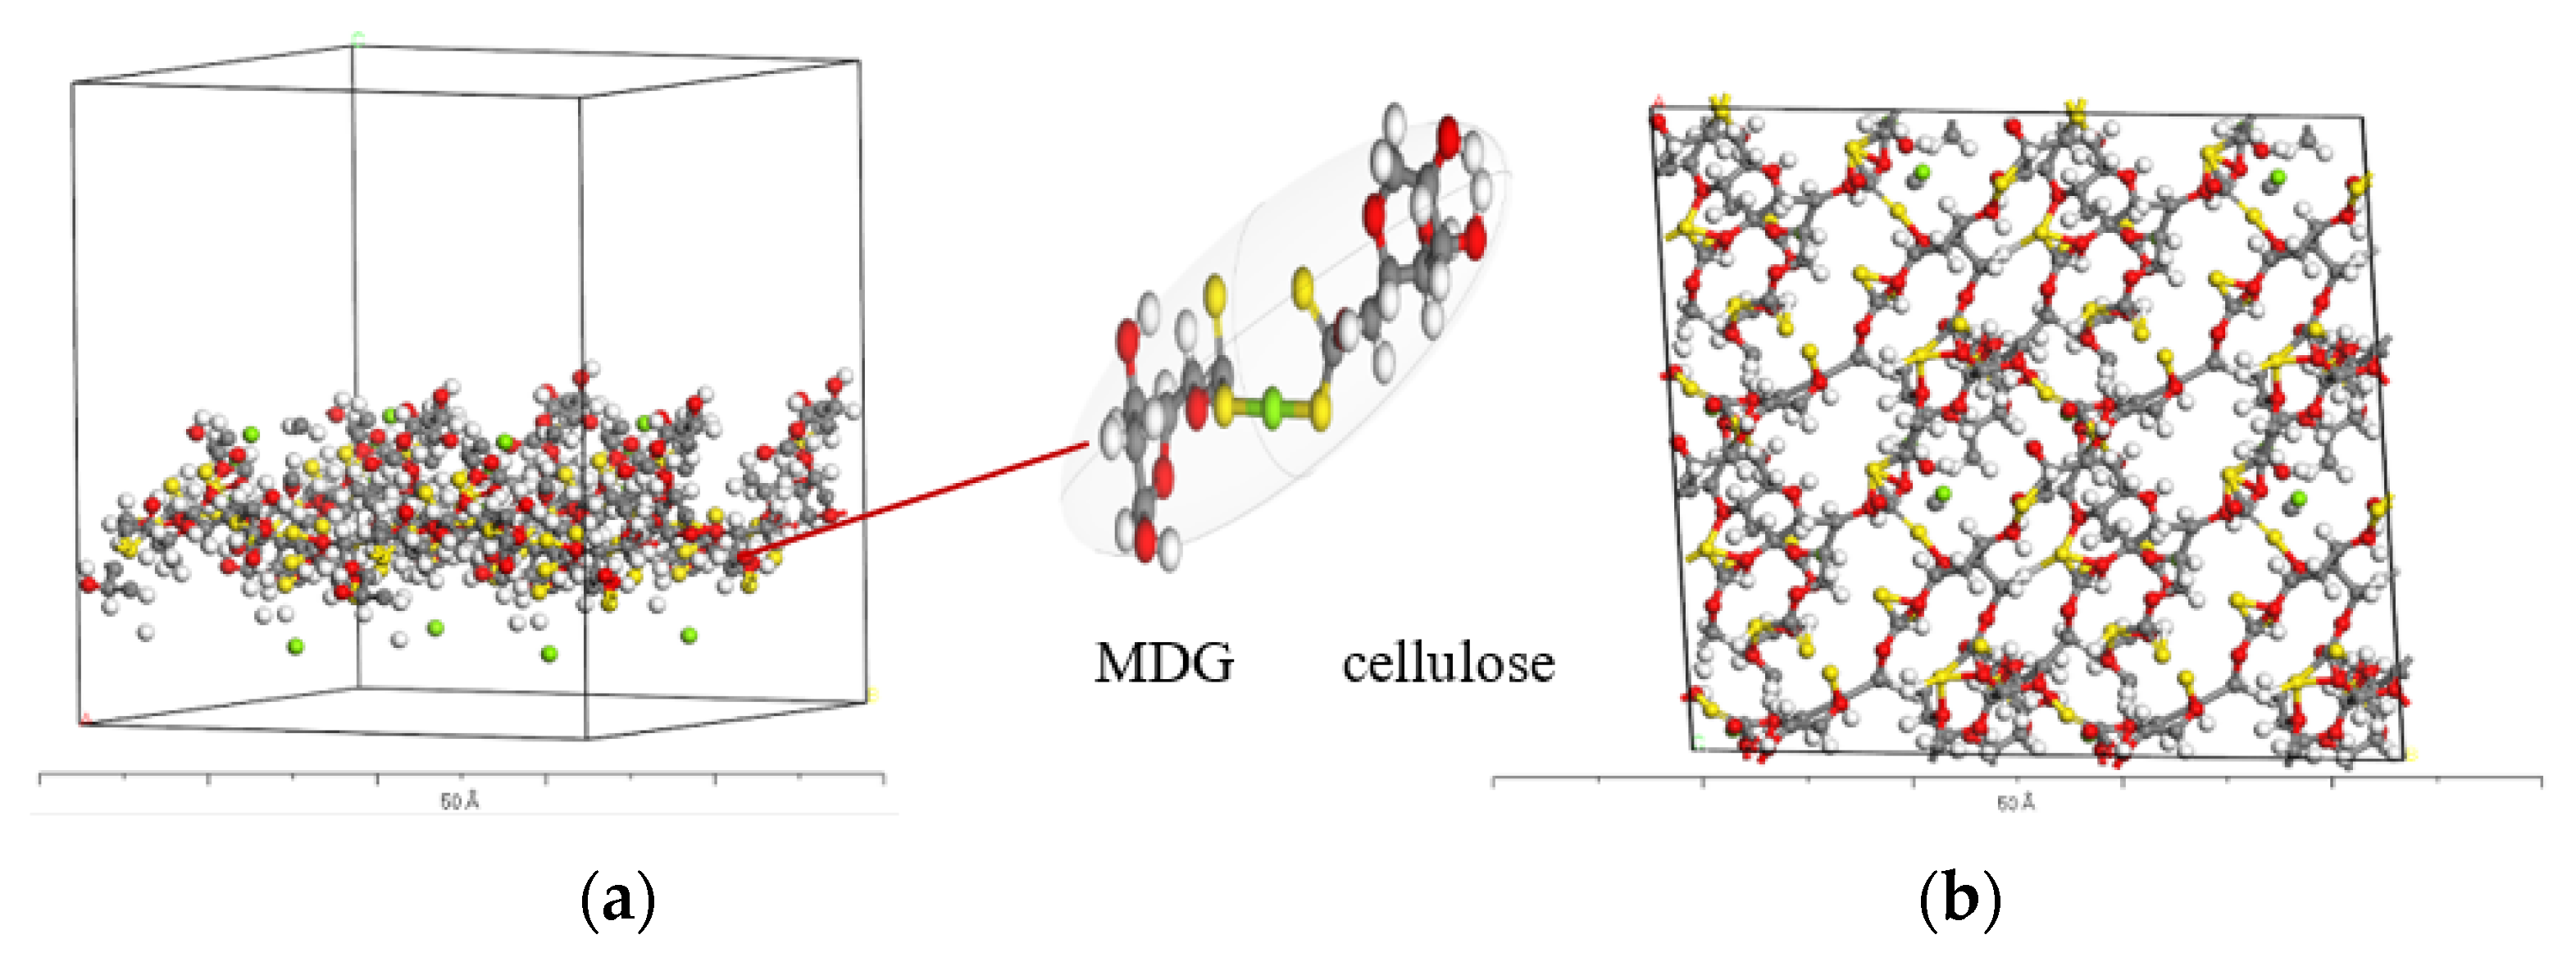
Materials Studio 7.0 (MS) software was used for model construction and molecular simulation study. The build module in MS is used to construct the unit cell of cellulose, which is a highly ordered polymer formed by direct combination of 1,4-β-D-glucopyranose (Glc) [34]. Unit cell structure is as follows: a = 7.784 Å, b = 8.201 Å, c = 10.38 Å, α = 90°, β = 96.5°, γ = 90°. Using periodic boundary conditions, the basic unit is 2 × 2 × 2 unit cells. The low energy surface (−1 1 0) plane of the unit cell was intercepted as the adsorption surface model. The forcite module was then used for molecular dynamics optimization and was optimized to use a UFF force field. The evaluation function RMS < 0.001 displays that the optimization was completed. The obtained unit cell configuration is shown in Figure 2 and Figure 3. The unit cell size was a = 31.14 Å, b = 33.92 Å, c = 38.15 Å, degree of polymerization was 20, and the resultant fiber was observed by TEM [35]. The prime unit cell was 3–4 nm.
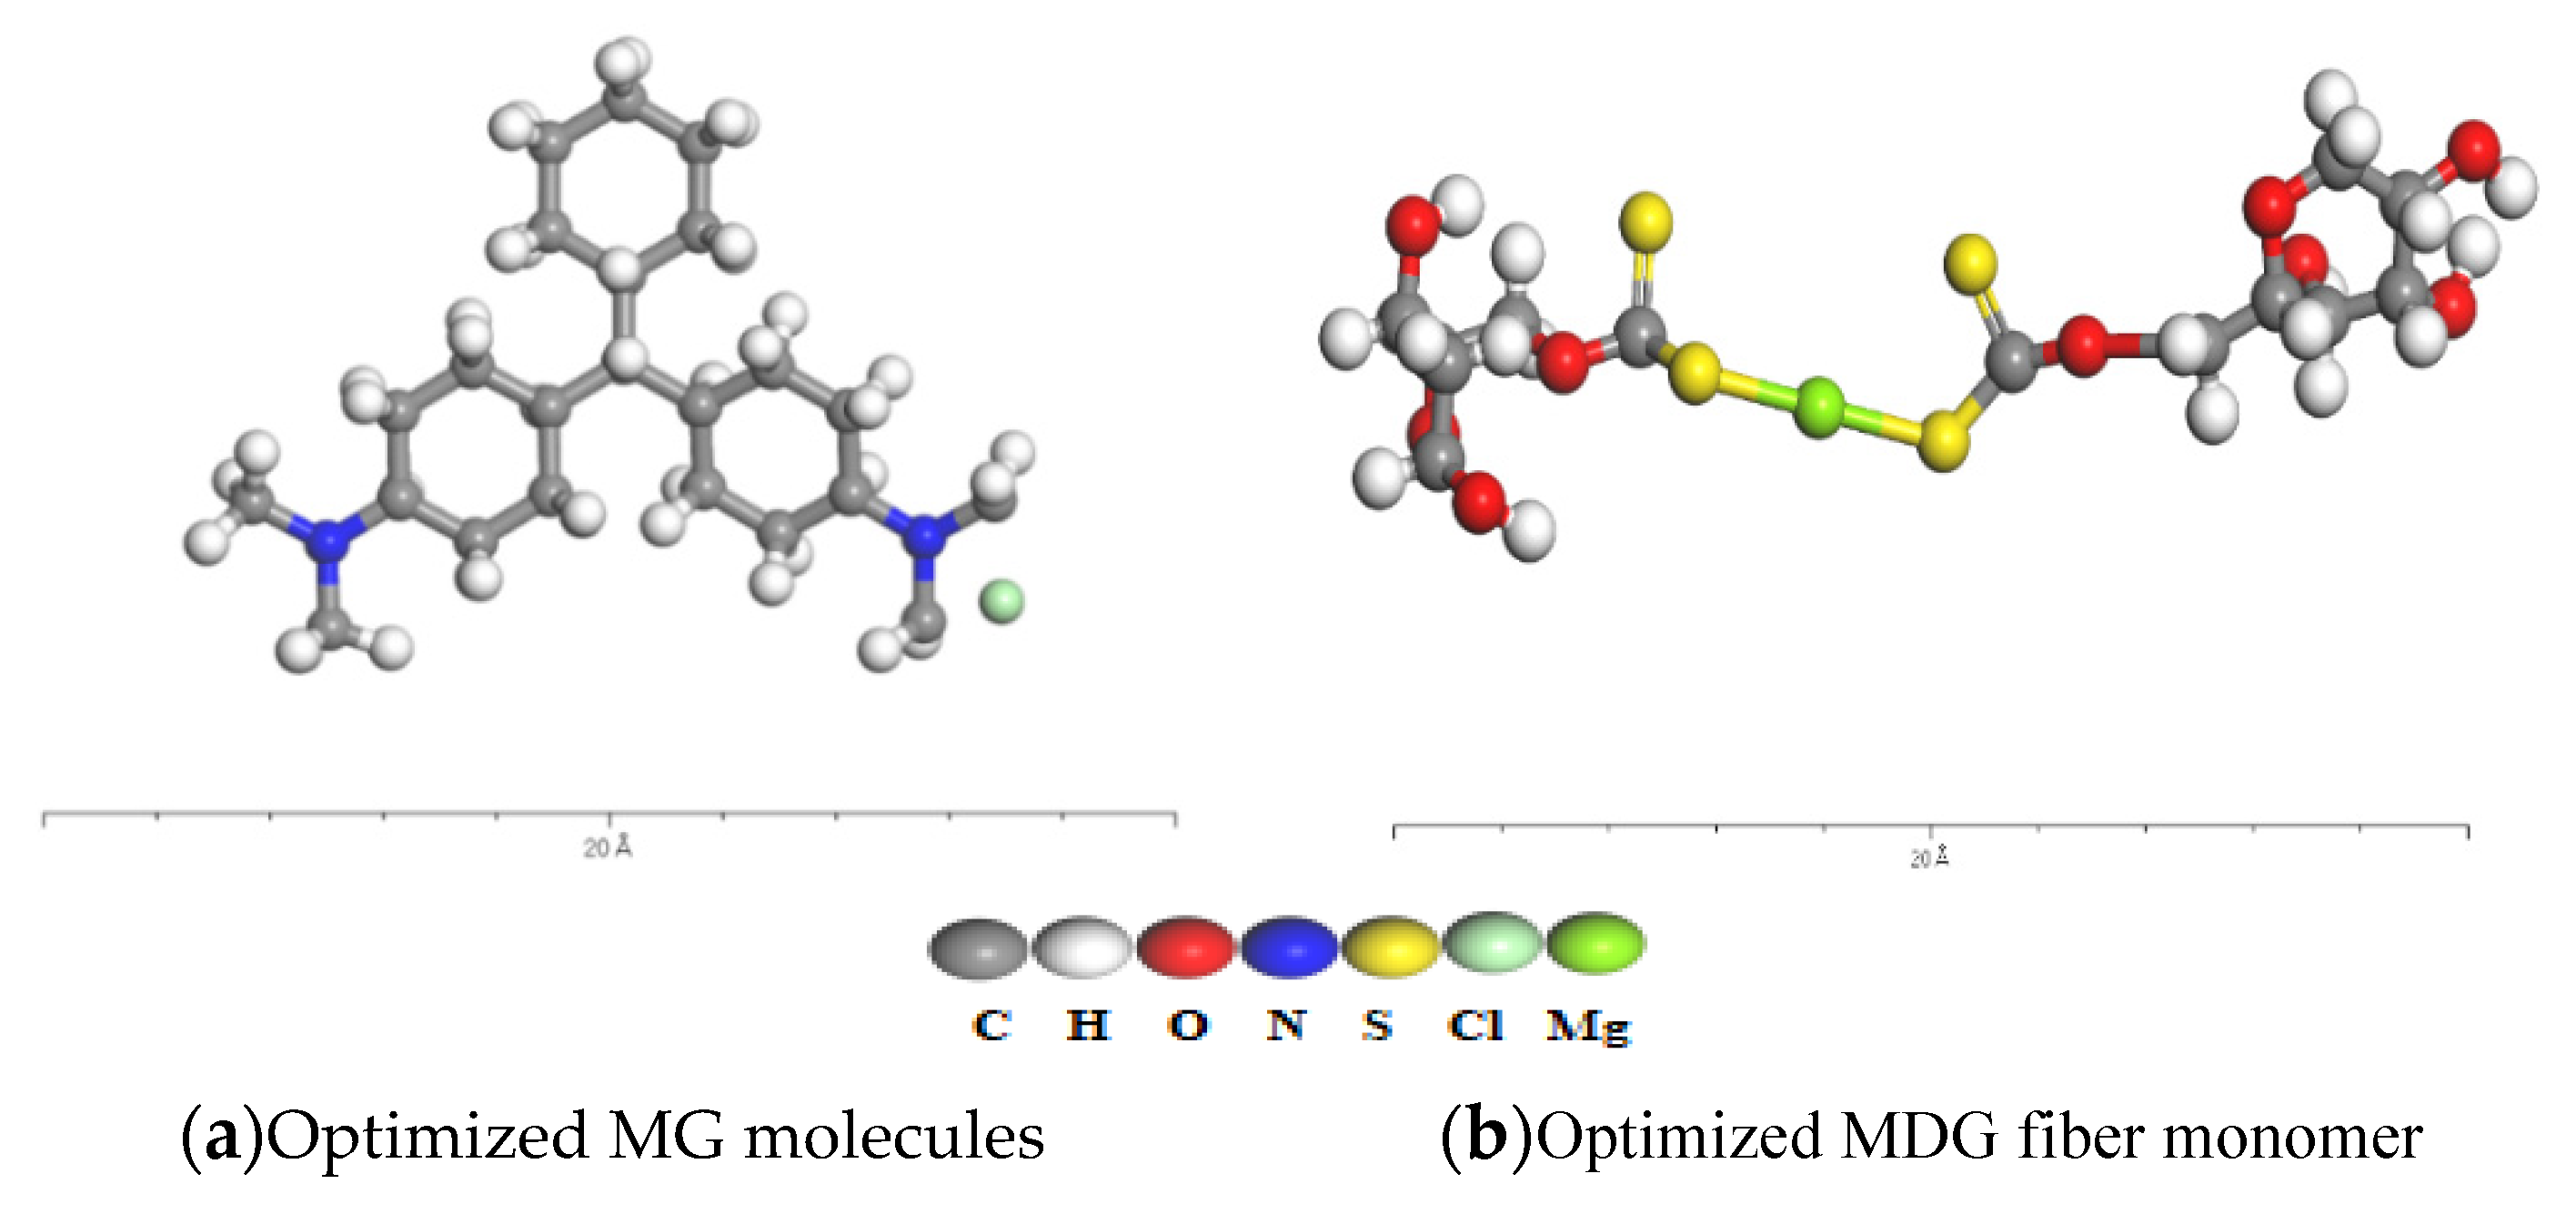
The configuration of the MG molecule (MG) in Figure 4a and the MDG fiber (MDG) in Figure 4b was minimized, and the force field was pcff. The optimized configuration is as follows:
The adsorption of MG molecules on the DG was carried out by the Metropolis Monte Carlo simulation method in sorption. To ensure the number of particles that appear and disappear during simulation were equal, the probability of particle exchange between two boxes was as follow: 39% interaction between molecules, molecular structure type change accounts for 20%, molecular rotation accounts for 20%, molecular translation accounts for 20%, and molecular regeneration accounts for 2%. The force field was UFF [35,36]. The Ewald summation method and atom-based method were used for electrostatic potential energy and van der Waals potential energy, respectively. The non-bond truncation distance was 12.5 Å, which was smaller than the minimum side length of the simulated unit cell (36.696 Å) half. The number of steps was 10,000, and the result was 100, 000 steps.
3. Results and Discussion
3.1. The DG and MDG Structures
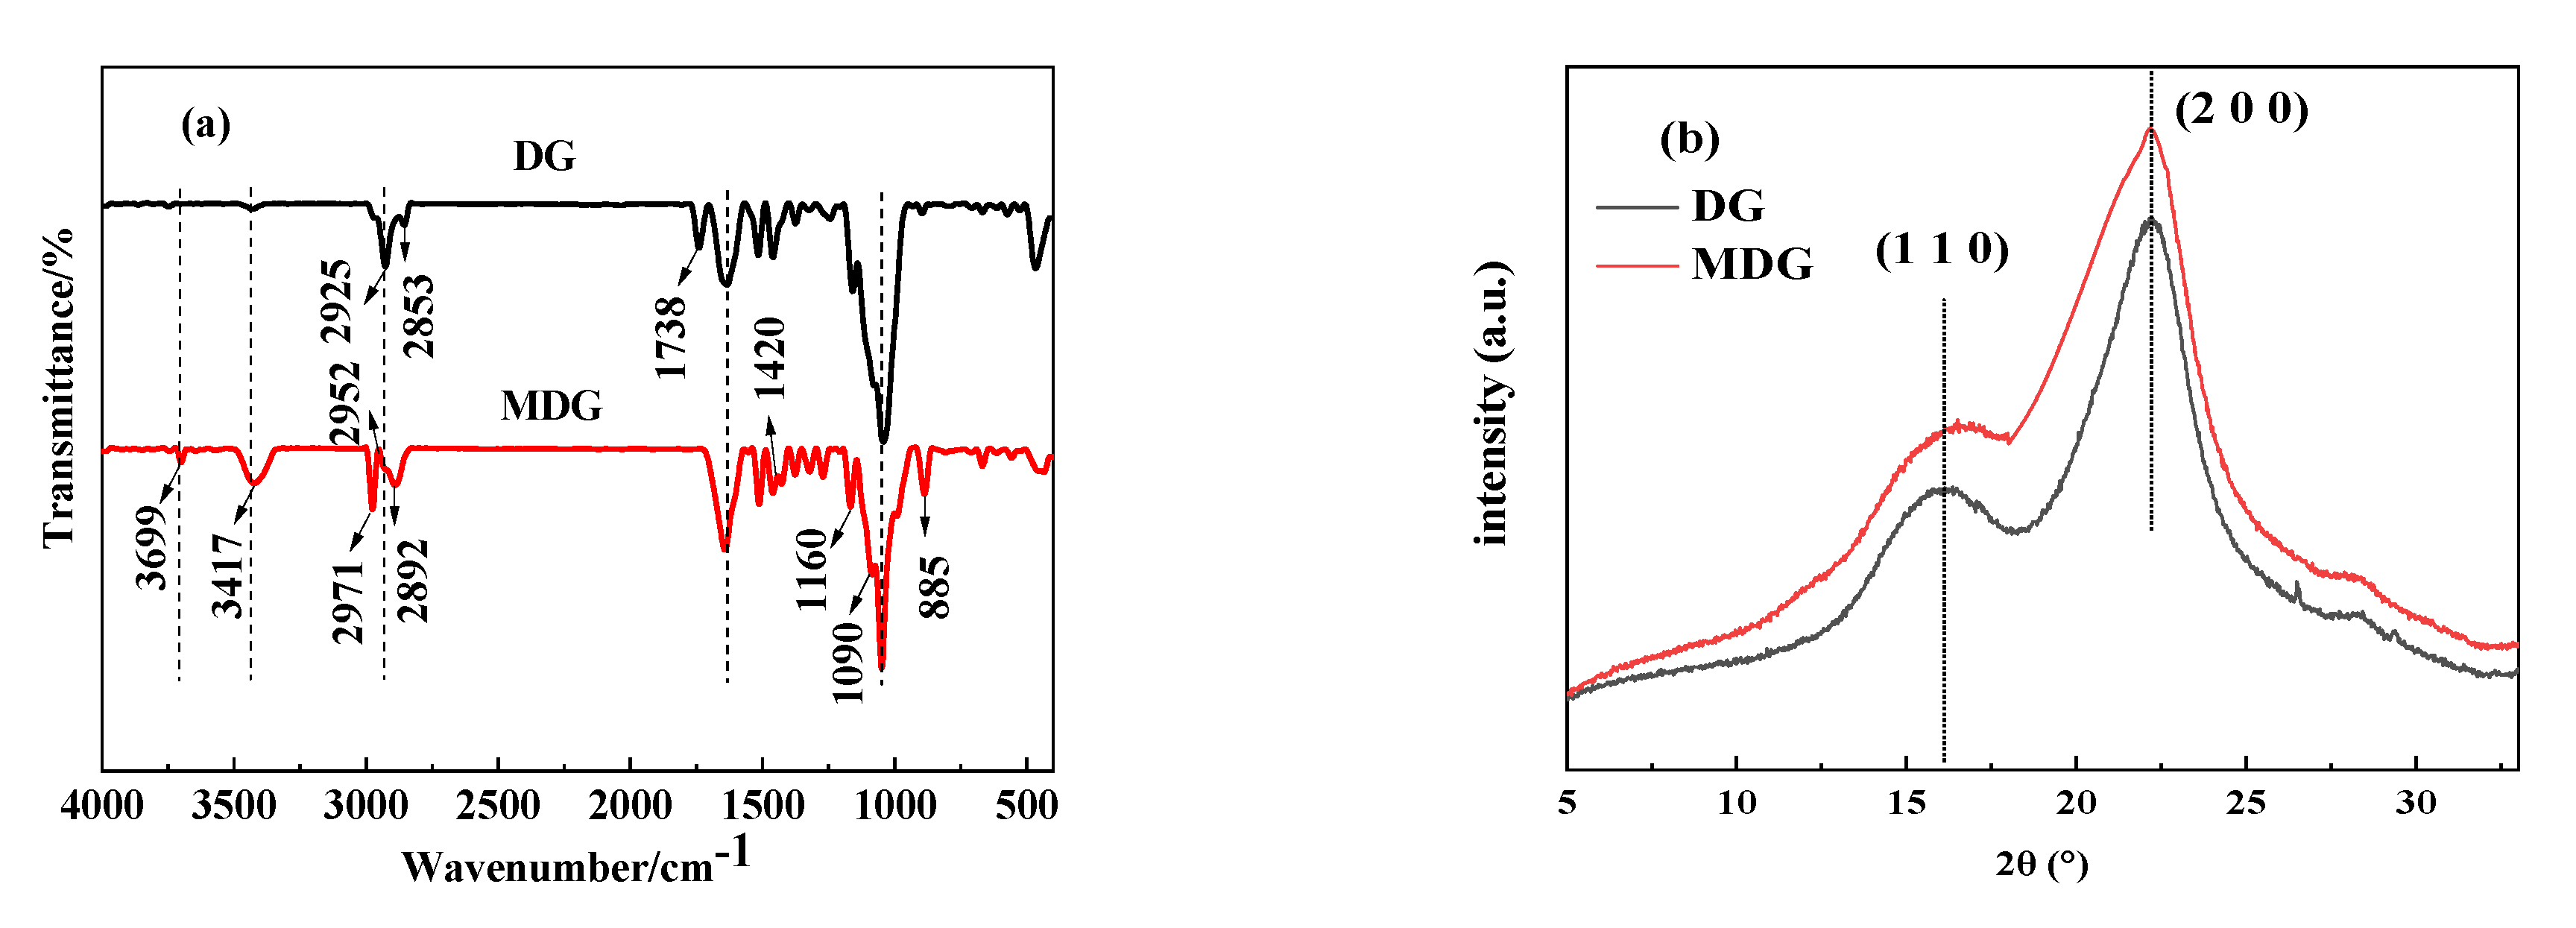
The FTIR spectra of DG and MDG are shown in Figure 5a. It shows that the stretching vibration absorption peaks of hydroxyl groups (-OH) of MDG at 3699 cm−1 and 3417 cm−1 were intensified [7]. An absorption peak at 1738 cm−1 corresponding to the stretching vibration of -CH2- group disappeared while the stretching vibration peak of -CH2- at 1632 cm−1 was intensified, indicating that there was a chemical reaction between DG, NaOH, and CS2 after pre-treatment and chemical modification. The stretching vibration peak of the -C-O- group of MDG at 1090 cm−1 appears to be due to the sulfonation reaction between CS2 and the hydroxyl groups of DG fiber. Moreover, the absorption peaks of -C=S and -C-S- at 1160 cm−1 and 1420 cm−1 appeared on the spectrum of MDG [37], which verifies the existence of -O-C=S functional group, and indicates that the DG fiber was successfully modified by CS2.
Figure 5b shows the XRD patterns of DG and MDG. It shows that DG exhibits two strong diffraction peaks at 16.1° and 22.2° 2θ, corresponding to the crystal planes of (1 1 0) and (2 0 0), respectively [38]. It indicates that the crystalline structure of cellulose in DG is cellulose Iβ. As shown in Figure 5b, MDG also exhibits two strong diffraction peaks at 16.1° and 22.2° 2θ, which shows that the diffraction peaks of DG and MDG are the same. It indicates that chemical modification does not change the crystalline structure of cellulose.
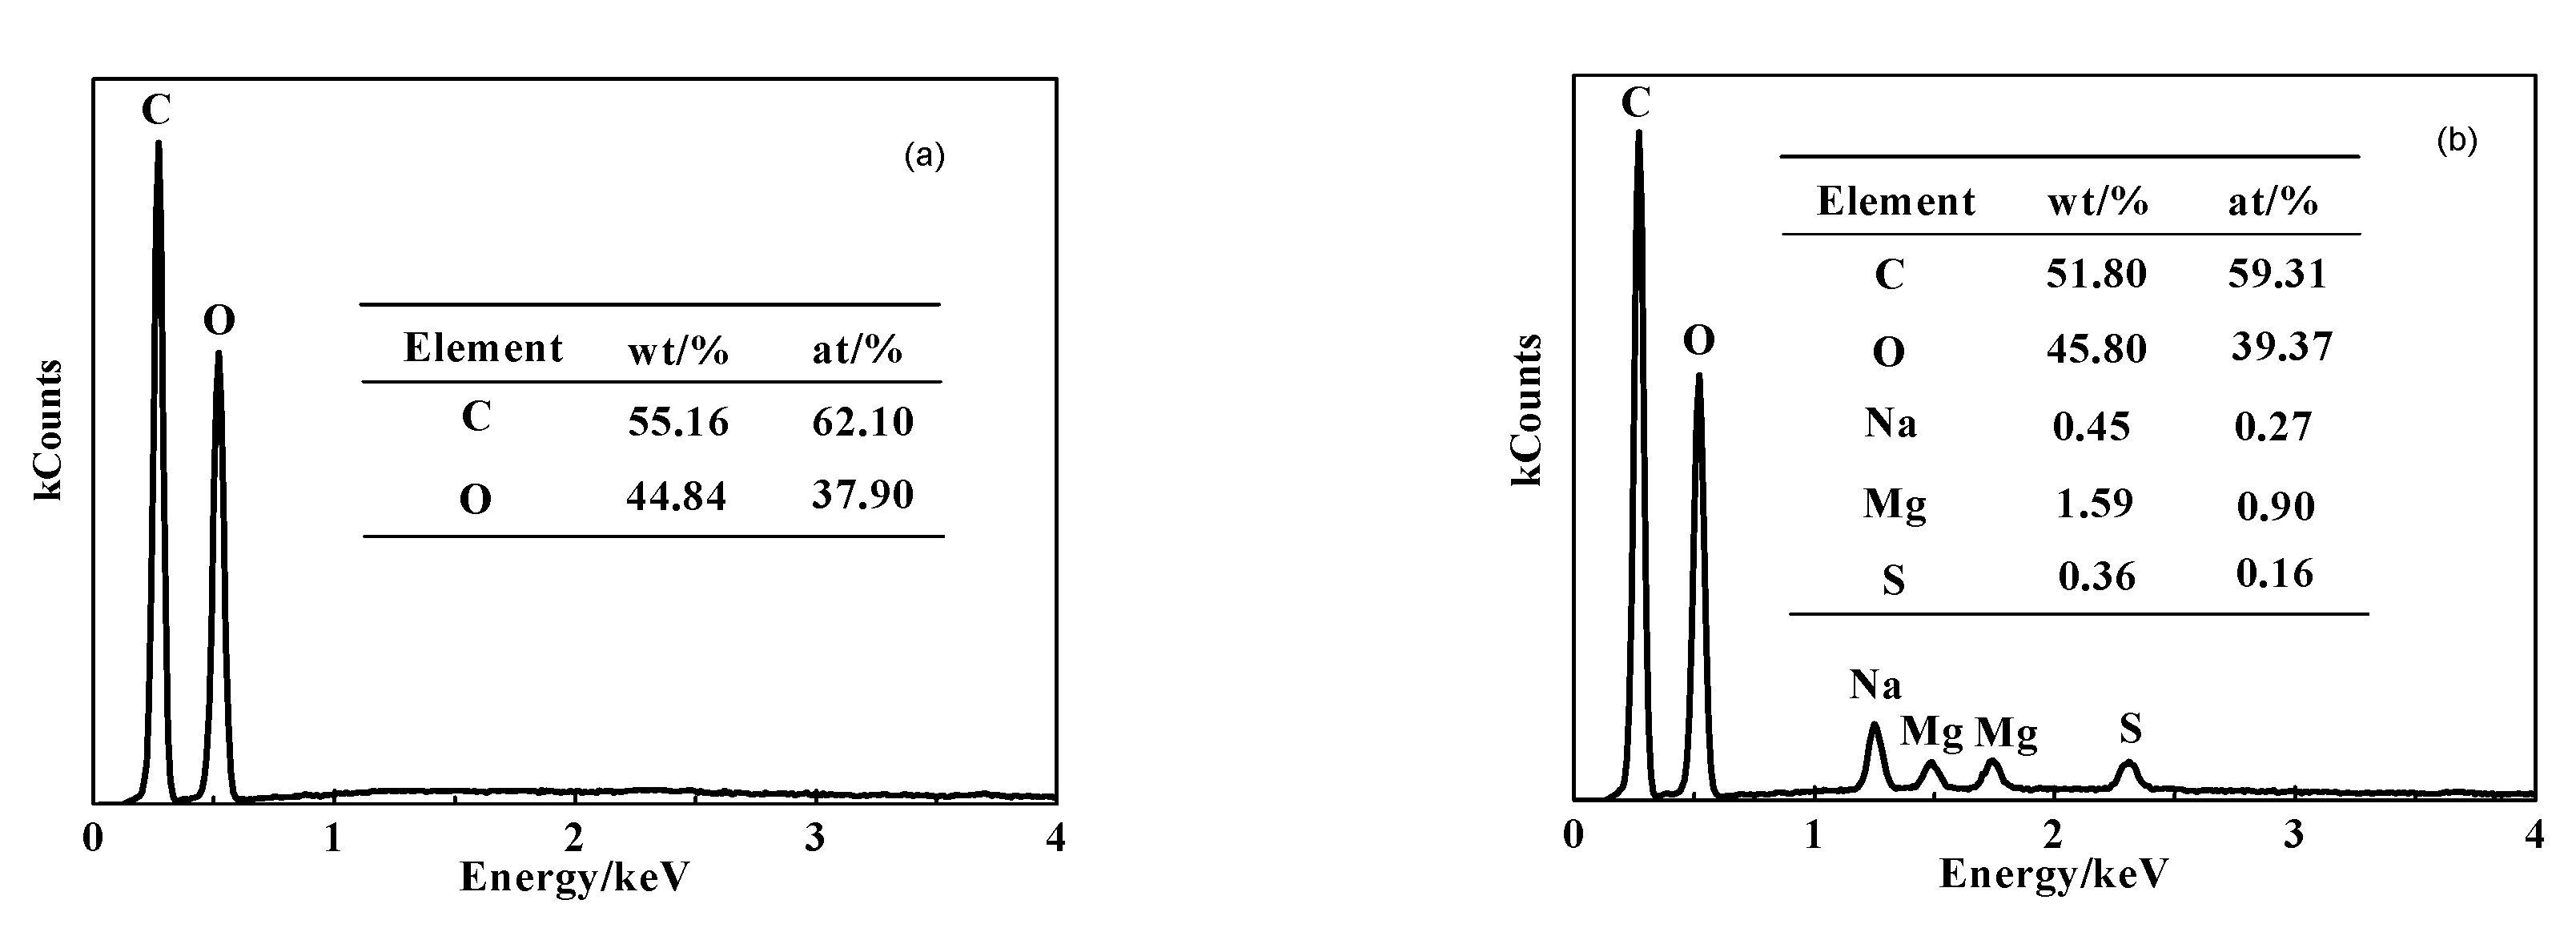
Figure 6 shows the local point-scanning energy diagram of (a) DG and (b) MDG. The C and O contents of DG are 55.16% and 44.84%, respectively (Figure 6a). Figure 6b shows that Na, Mg, and S elements are detected in the MDG. The elemental contents recorded are C 51.80%, O 45.80%, Na 0.45%, Mg 1.59%, and S 0.36%, further indicating that the CS2 can successfully modify the DG fiber after the NaOH pre-treatment.
3.2. Analyses of the Micro-Morphologies and Surface Structures of DG and MDG
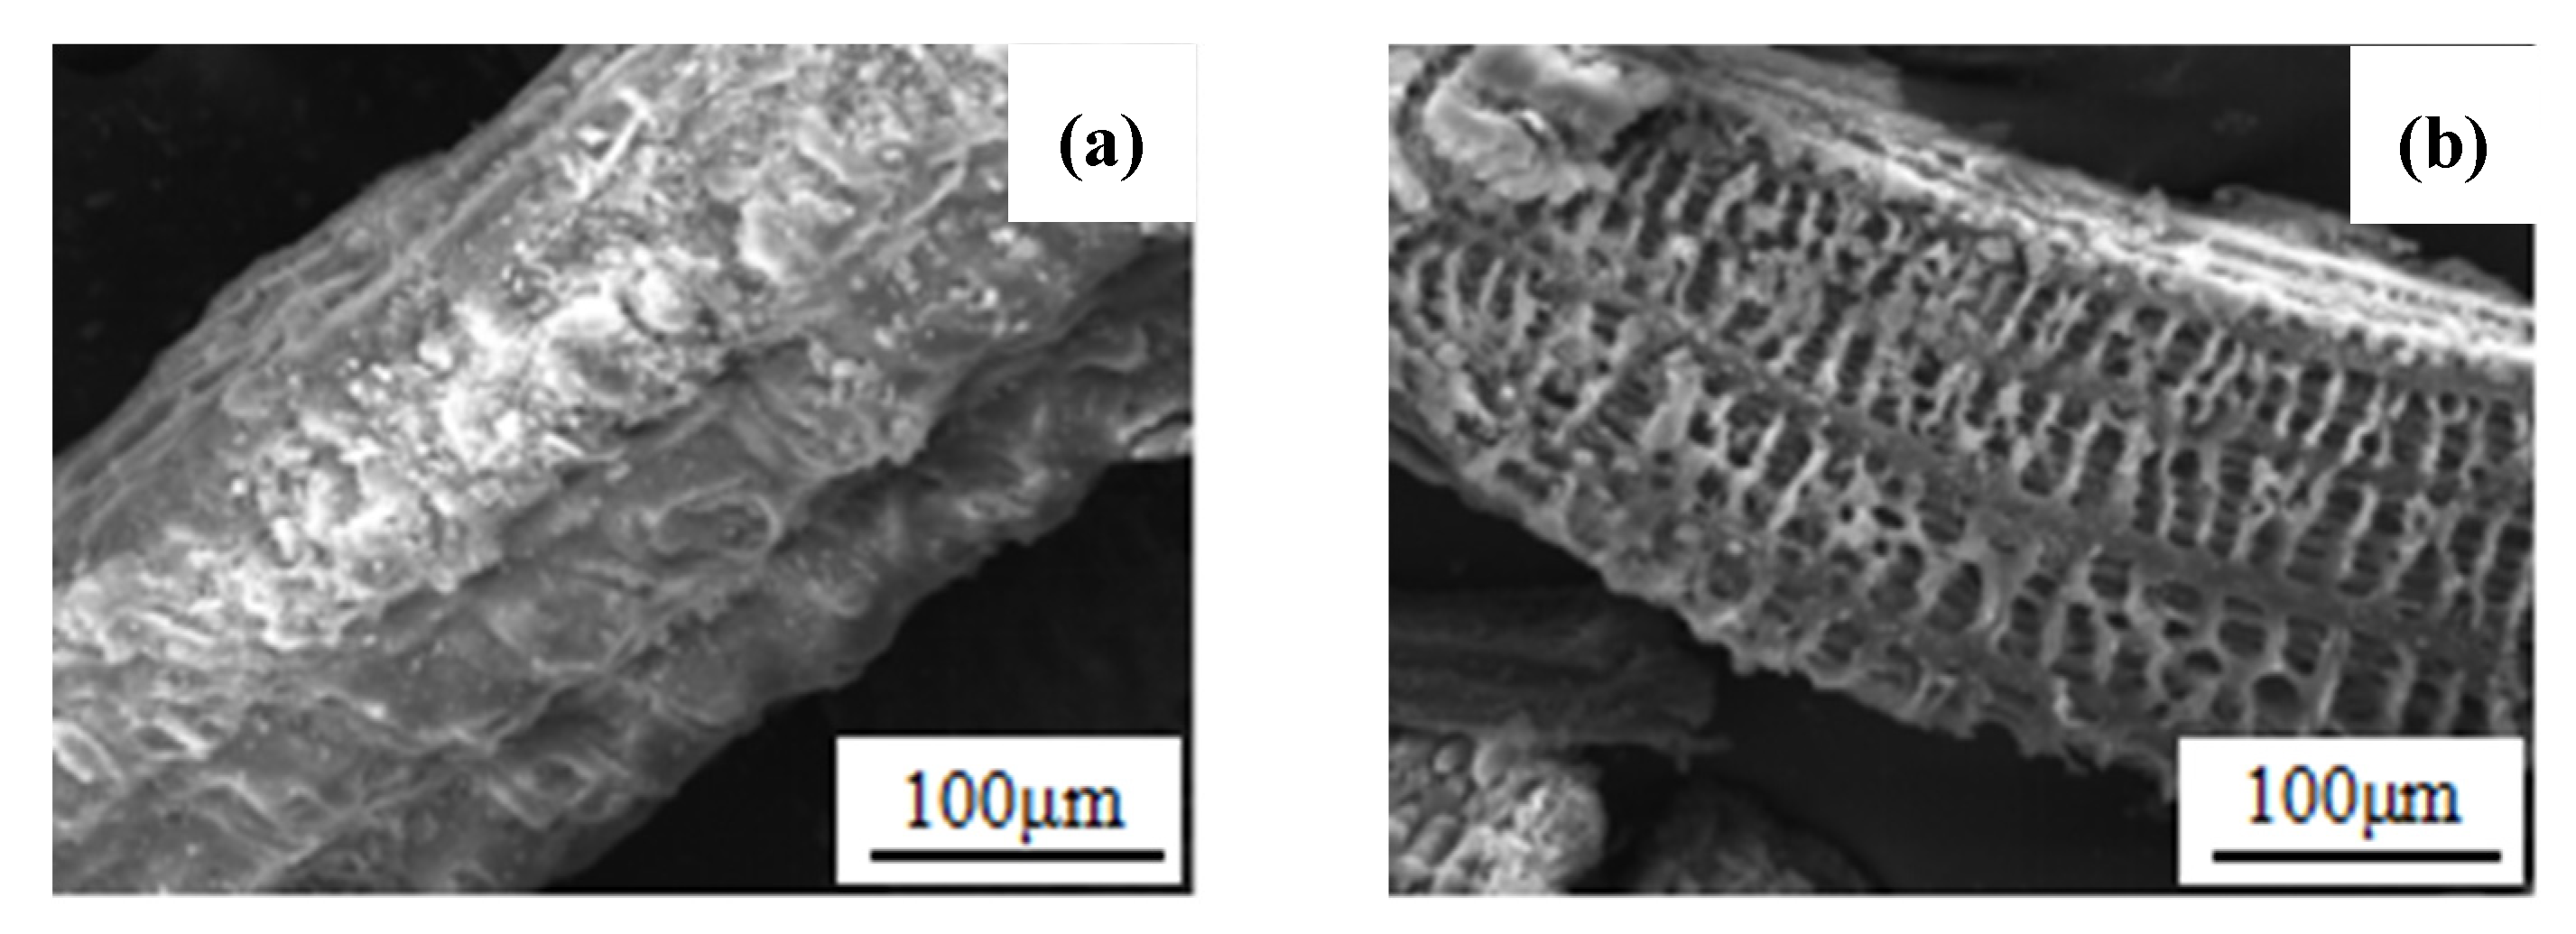
The micro-morphologies of (a) DG and (b) MDG were observed using SEM (Figure 7). It can be seen that the morphology of DG showed obvious change before and after the modification. Before modification, DG had a smooth, dense, and orderly surface. After the modification and pre-treatment, the lignin and fatty acids were removed, which increased the pores on the surface of MDG, causing the surface to become loose and porous [39]. This increased the surface area of adsorbent, which ultimately increased the adsorption mechanism for absorbate and helped the adsorption of MG.
Figure 8 represents the N2 adsorption-desorption curves and pore size distribution of DG and MDG. The N2 adsorption-desorption curves of the adsorbent, before and after modification, both belong to the typical type-IV curve (IUPAC classification) [40,41]. It can be seen from Figure 8a that the pore diameter of DG and MDG, both exhibited uniform size distributions which are between 5~100 nm and 10~40 nm, respectively. When P/P0 is less than or equal to 0.4, the adsorption and desorption curves of MDG overlap each other, indicating the existence of micro-pores and mono-layer adsorption (Figure 8b). When P/P0 was greater than 0.4, the N2 adsorption capacity of MDG increased rapidly, indicating that the pores in the adsorbent were slit pores [42,43]. The surface area and pore volume of MDG increased significantly as compared to DG, which supports the results recorded in Table 1. The surface area of MDG was 3.54 m2/g, showing an increase of 216% compared with DG.
3.3. pH Experiment and Zeta Potential Analysis
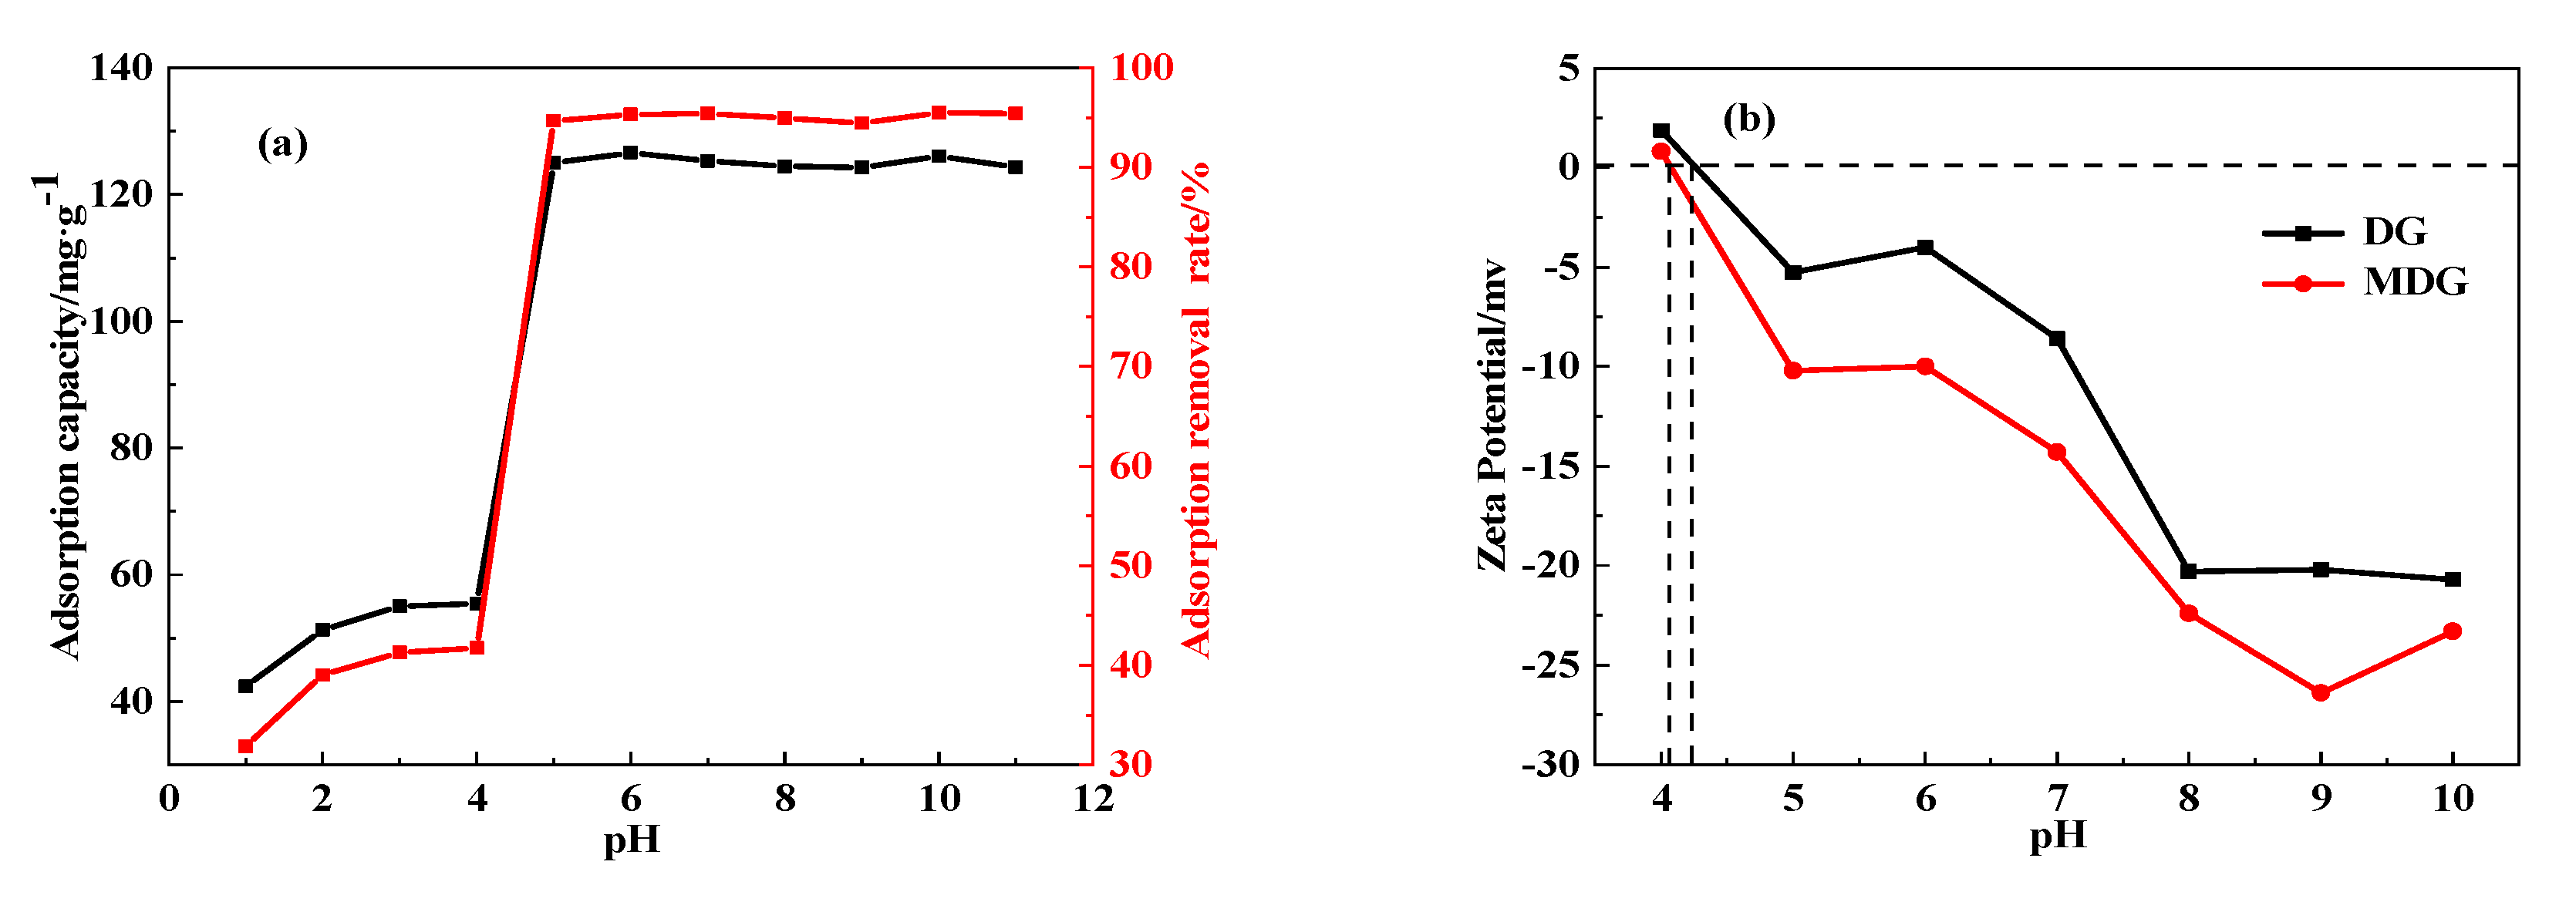
The effect of pH of aqueous solution on adsorption of MG onto MDG is shown in Figure 9a. The adsorption capacity and adsorption removal rate increased as the pH rose from 1.0 to 6.0, and remained stable as the pH rose from 6.0 to 11.0. This is because MG is a cationic dye and, under acidic conditions, MG and H+ have the same charge, both of them competing at active adsorption sites on MDG, resulting in a lower adsorption rate of MG. However, under alkaline conditions, MG has opposite charge due to OH-, while MDG is negatively charged and adsorbs MG molecules through electrostatic interaction [44]. At a pH of 8, the adsorption removal rate was maximum, i.e., 96.54%, and when the pH was between 5 and 11, the adsorption removal rate was above 94.70%. Therefore, the result shows that MDG can be applied to the treatment of dye wastewater with large pH fluctuations.
Figure 9b demonstrates the difference in zeta potential between DG and MDG at different pH values. It can be seen that the DG has positive zeta potential when the pH values are less than 4.2. This is due to the presence of a large number of -OH groups on DG before modification, which causes its surface to be electronegative. However, the point of zero potential value of MDG is lower than DG, which may be due to the modification of DG by CS2 to generate cellulose xanthate, which consumes part of -OH group on cellulose, resulting in a decrease in the total amount of -OH groups. MDG had access to a negatively charged ester group, leading to a negative shift in electrical properties. As the pH of the solution increases, the carboxyl group was gradually deprotonated, and the surface potential gradually decreased. MDG has good affinity for cationic dyes, so it can be proven that MDG might adsorb MG through electrostatic interaction.
3.4. Adsorption Experiment
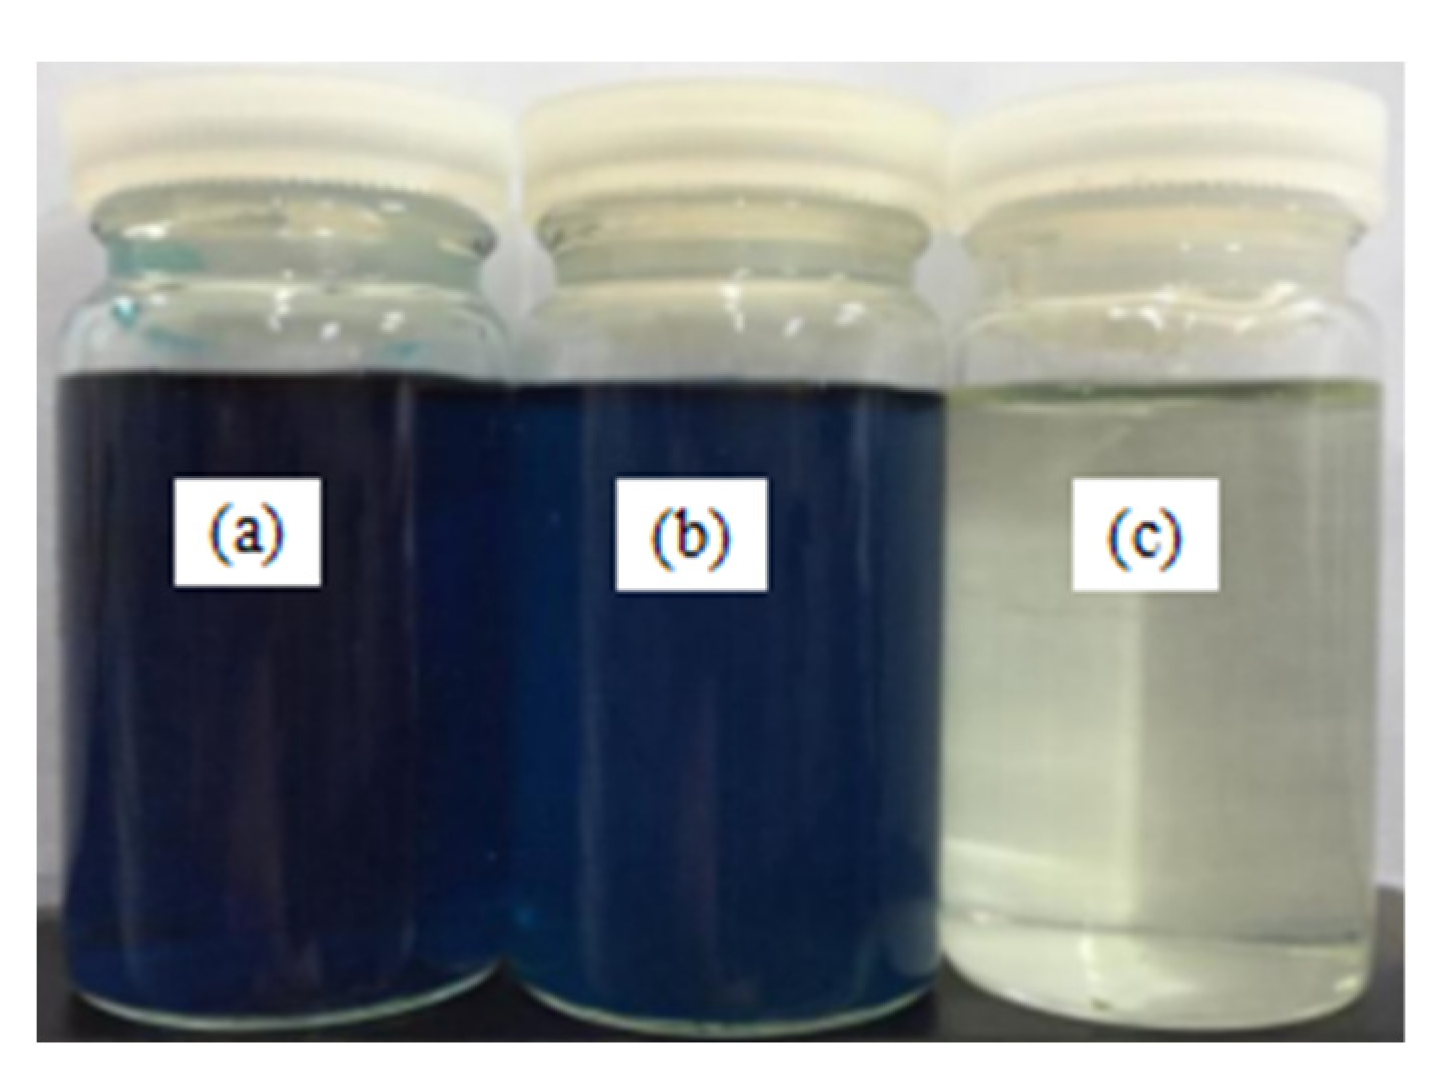
Either DG or MDG (0.195 g) was added into 30 mL of MG solution at the rate of 200 mg/L. The adsorption performance and adsorption parameters for both materials are shown in Figure 10 and Table 2, respectively.
The adsorption of MG by DG lead to a light-colored solution, but the change in color was not obvious. The relative adsorption capacity and removal rate were 7.67 mg/g and 50.04%, respectively. However, the adsorption of MG by MDG resulted in a nearly colorless solution, with a relative adsorption capacity and removal rate of 14.48 mg/g and 96.38%, respectively. Compared with DG, MDG showed a 46.34% improvement in the removal rate and a 92.70% increase in the relative adsorption capacity, which further verified that DG has a much-enhanced adsorption capability after chemical modification (Figure 9, Table 2).
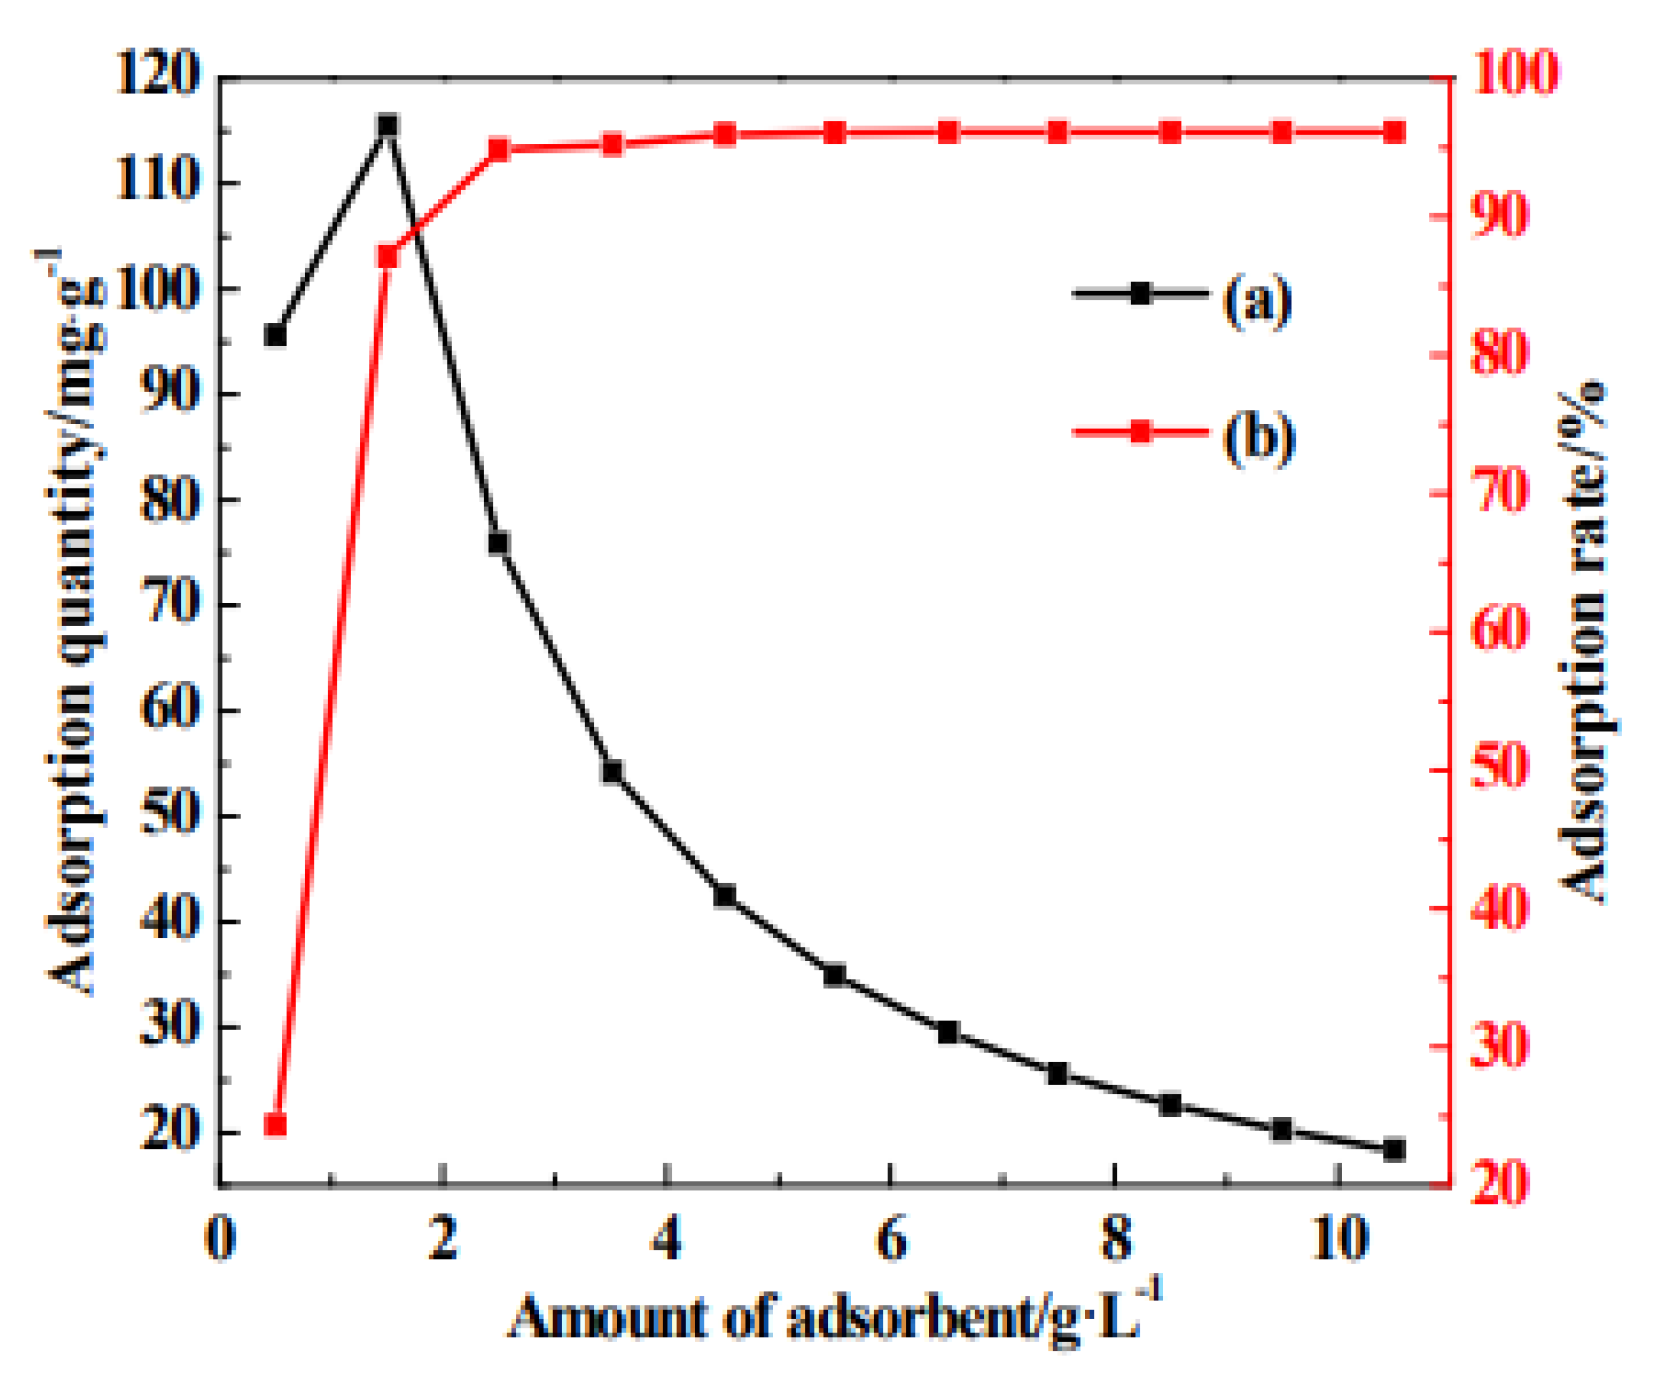
The influence of the amount of adsorbent on the adsorption performance of MDG is shown in Figure 11. It can be seen from Figure 11 that the adsorption rate increases first, and then becomes stable with the increase of the amount of adsorbent, while the adsorption amount decreases continuously, since the number of adsorption sites attached to MG molecules increases with the increase of MDG dosage; however, if the MG molecular concentration is certain, the number of adsorption sites it needs is certain. Further increasing the amount of MDG will cause the effective adsorption mass to be far less than the actual dosage.
3.5. MDG Regeneration Performance
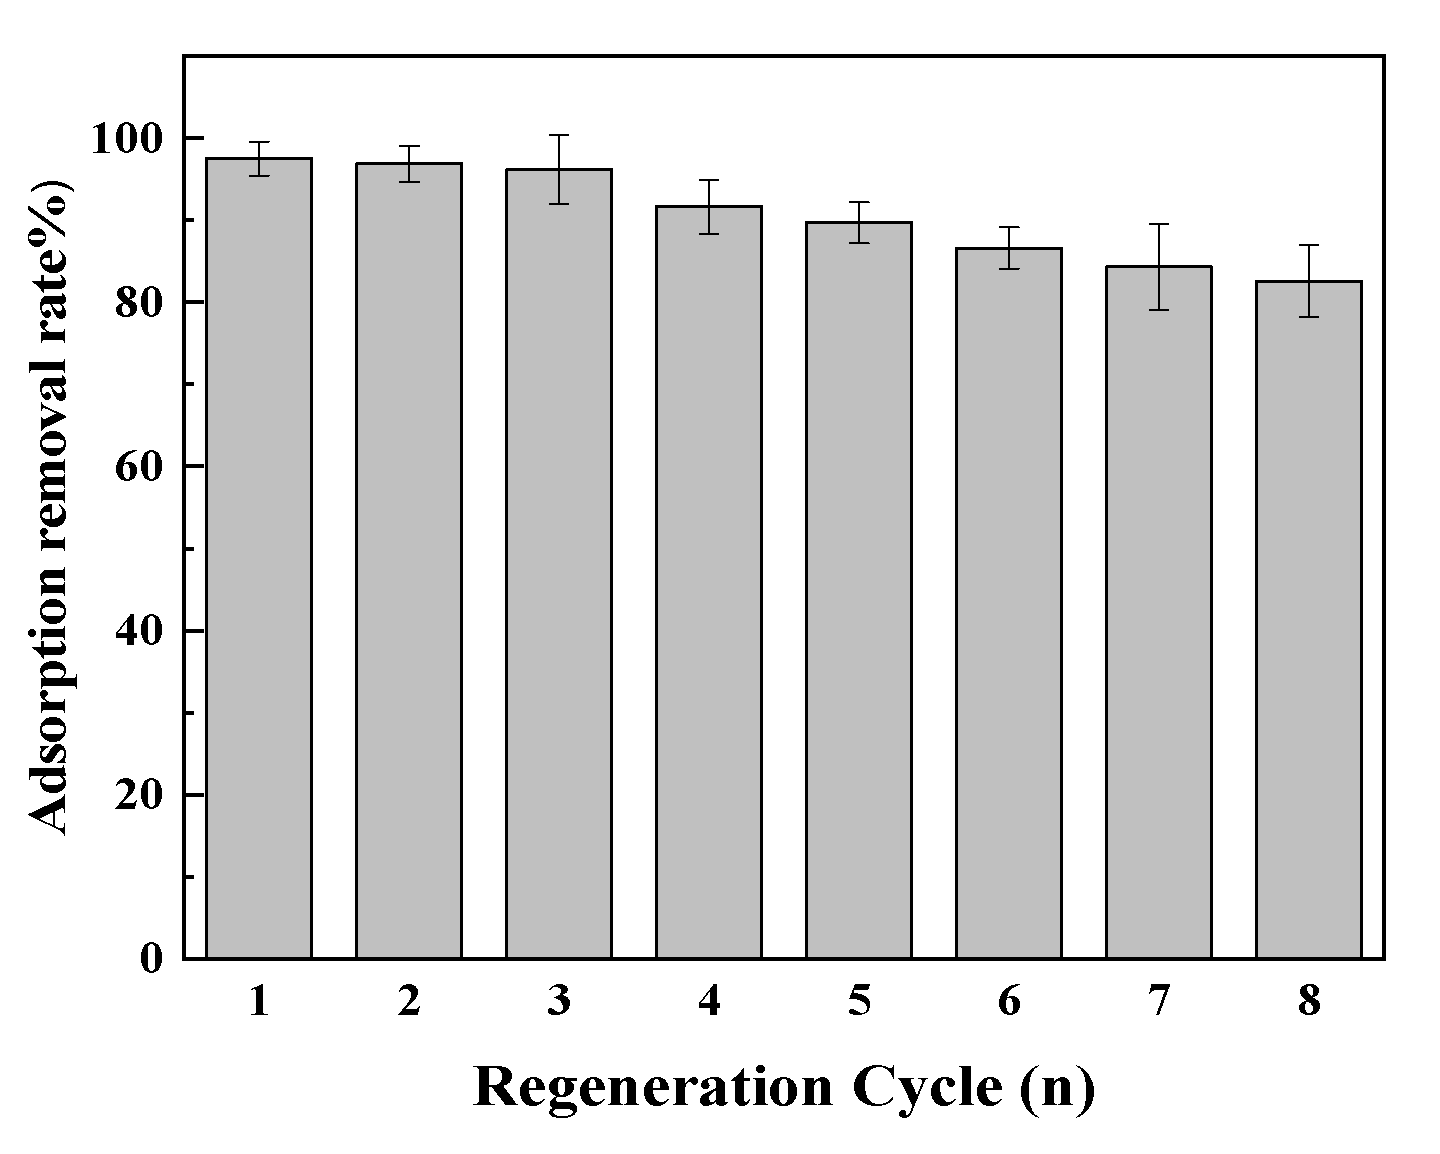
The regeneration of adsorbents is very important in industrial practices to ensure that wastewater treatment is economical [45]. The successful desorption with HCl solution is due to the reason that, under acidic conditions, H+ in the solution competes with cationic dye molecules, causing the dye molecules to desorb from the adsorbent surface. The adsorption–desorption cycle of MDG was also evaluated. As shown in Figure 12, the adsorption removal rate of MDG remained almost unchanged in the first three cycles, and the adsorption removal rate after the third adsorption-desorption was 96.14%. After eight adsorption–desorption cycle experiments, the adsorption removal rate of MDG to MG dye remained at 82.6%. The result shows that MDG has good regeneration performance, and still has strong adsorption performance after multiple adsorption-desorption. This has the advantage of lowering cost of dye wastewater treatment. The repeated use of adsorbent saves energy and achieves green, clean production and environmental protection.
3.6. Adsorption Kinetics
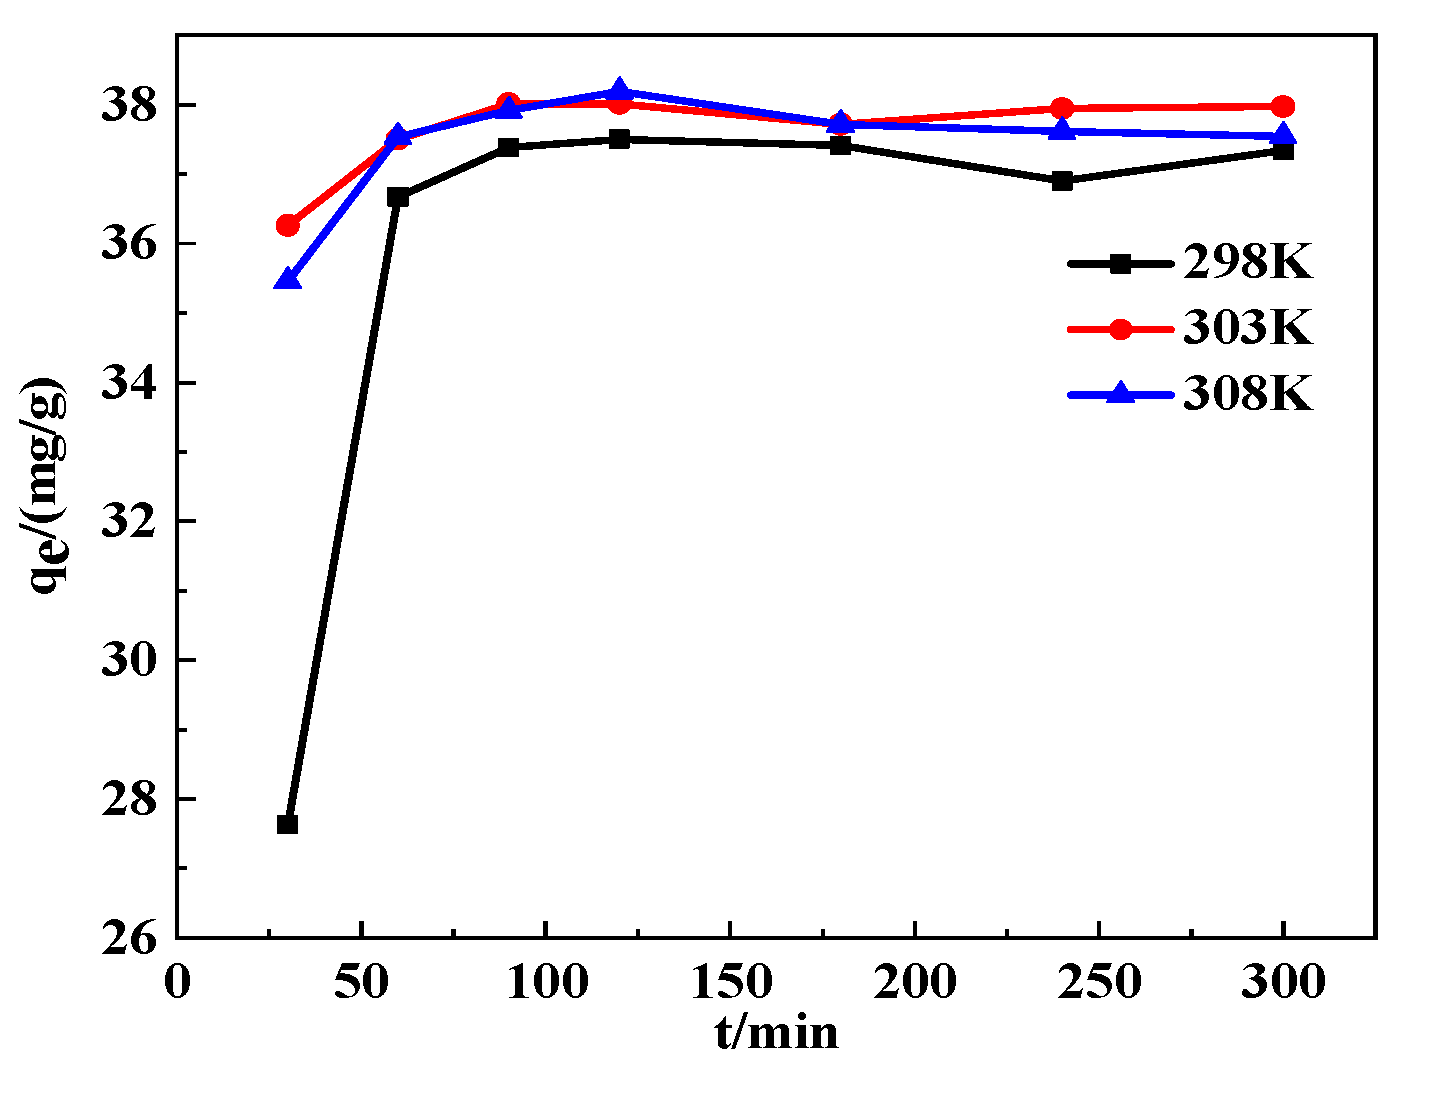
The adsorption experiments were performed at different temperature ranges, i.e., 298 K, 303 K, and 308 K for 30, 60, 90, 120, 180, 240, and 300 min, respectively, to discover the optimal adsorption time. The relationship between the adsorption time and adsorption performance of MDG for MG is shown in Figure 13.
At different temperatures, the adsorption capacity and adsorption removal rate of MG increased with the increase of adsorption time. The adsorption capacity gradually increased and stabilized after 240 min, and finally reached the adsorption equilibrium, showing a maximum adsorption capacity of 38.19 mg/g. At the beginning, concentration gradient between MG solution and the DG surface was large, and more sites were available for adsorption on MDG, therefore MG could easily combine with the MDG. With the increase in adsorption time, the pores of MDG were gradually filled with MG molecules. As a result, the surface adsorption sites were gradually saturated. Therefore, adsorption capacity and removal rate became slower and approached the equilibrium stage (Figure 13).
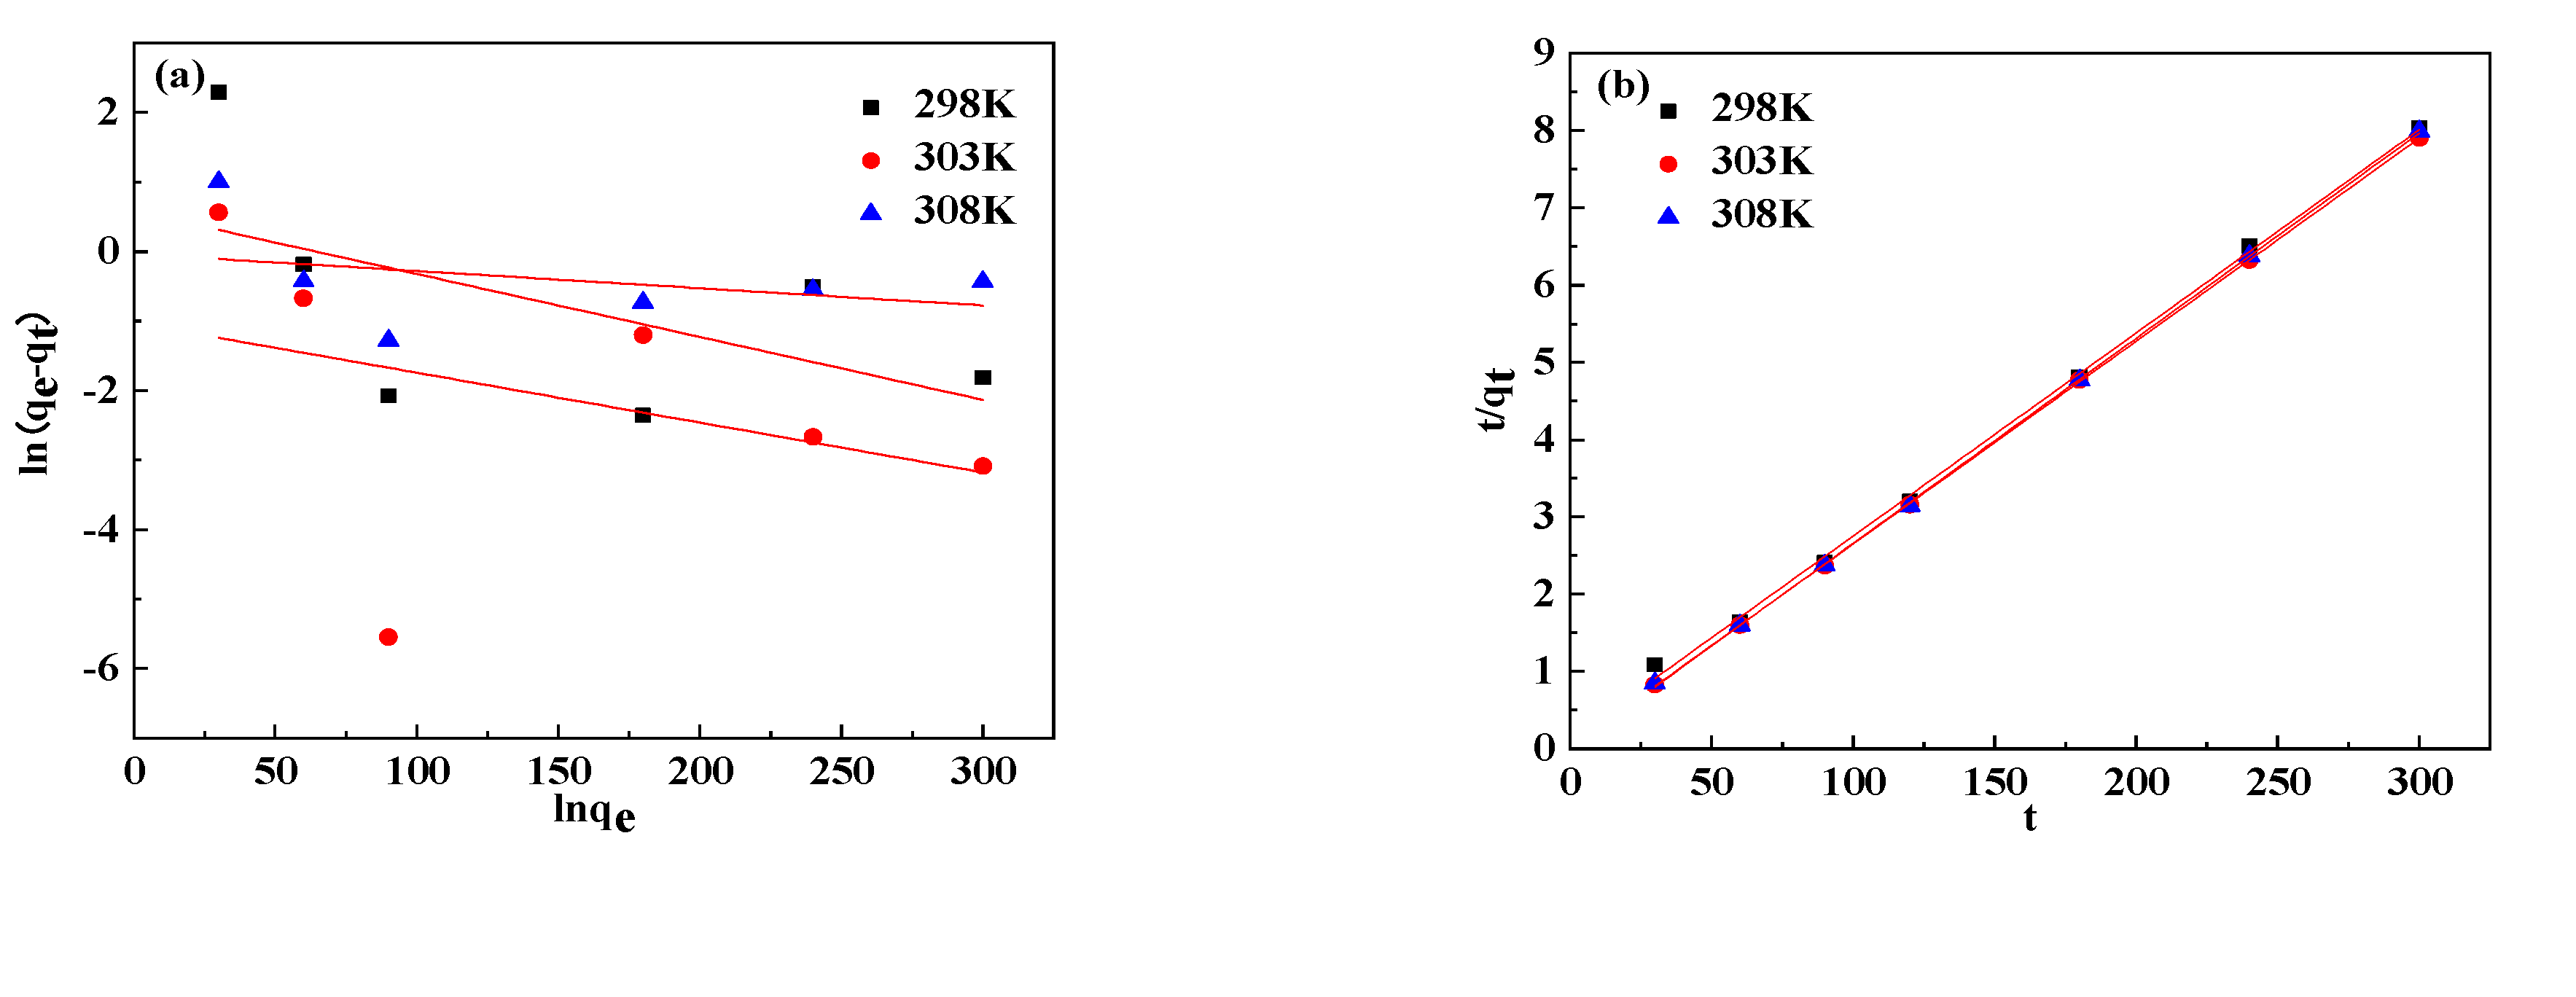
Further study on the adsorption mechanism of MDG for MG was explored using pseudo-first order and pseudo-second-order kinetic models (Figure 14 and Table 3) [46,47,48,49]. As presented in Table 3, the rate constant k2 increases with increasing temperature. Therefore, adsorption process of MDG for MG can be better explained with pseudo-second order model with correlation coefficient R2 > 0.998. These results indicated that there was chemical interaction between adsorbent and adsorbate. The chemical bonding was the main factor affecting the pseudo-second-order kinetic model.
The intra-particle diffusion kinetics of MG onto MDG at different temperatures are shown in Figure 14c. If the plot of qt versus t0.5 gives a straight line that passes through the origin of coordinates, then the adsorption process is controlled by intraparticle diffusion only. However, the data present a multi-non-linear graph, with straight lines deviating from the origin. The first straight line describes the intraparticle diffusion of dye molecules in the macropores of MDG, the second straight line represents the diffusion in the micropores. The results show that intra-particle diffusion is not the controlling mechanism in the adsorption system [50,51,52]. The result reveals that intraparticle diffusion is not the controlling mechanism in the adsorption system.
3.7. Isothermal Model of Adsorption
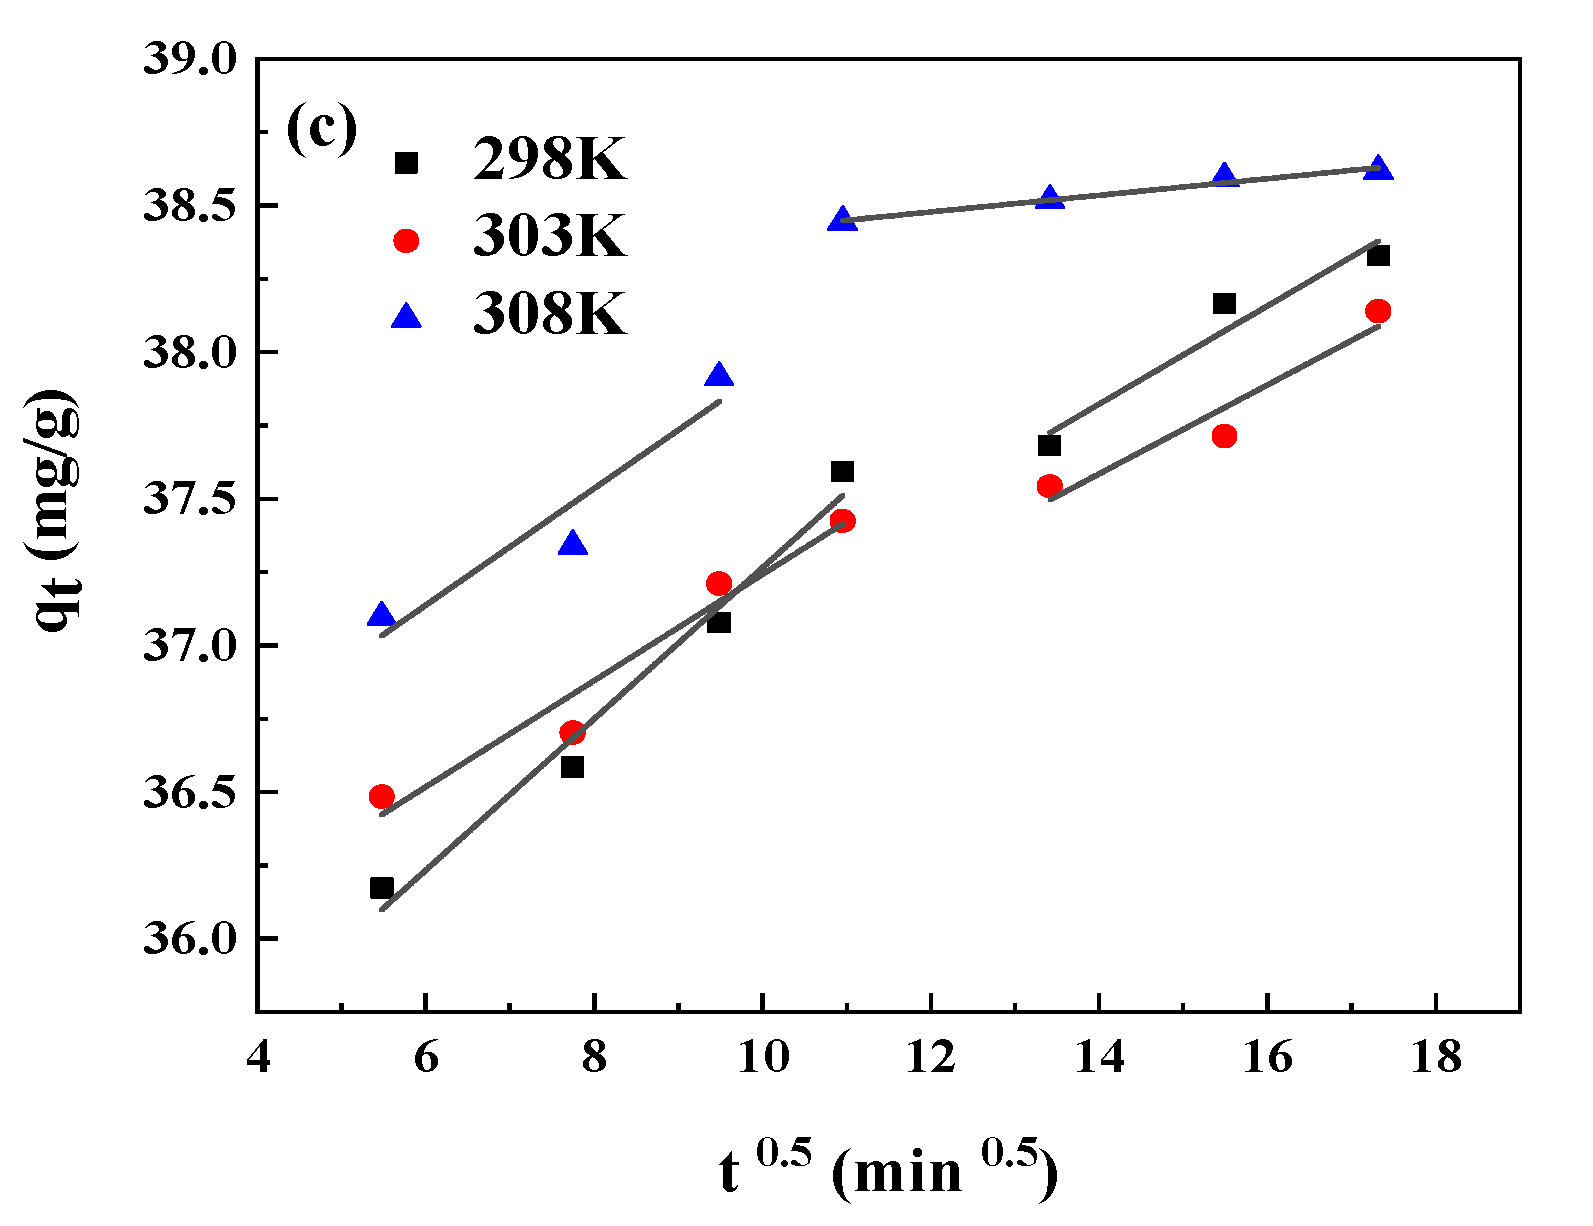
The effect of different MG concentrations (100, 200, 300, 400, 500, 600, and 700 mg/L) on adsorption performance were determined using the adsorption experiments of MDG for MG solutions at 298 K, 303 K, and 308 K, and the results are shown in Figure 15. At different temperatures, increase in MG concentration significantly increased the adsorption capacity. This is because higher MG concentration increases the collision frequency between MG molecules and the adsorbent. At fixed adsorbent amount, the number of active sites remained constant. Therefore, increased MG solution concentration resulted in saturation of active sites, which resulted in gradual decrease in the removal rate.
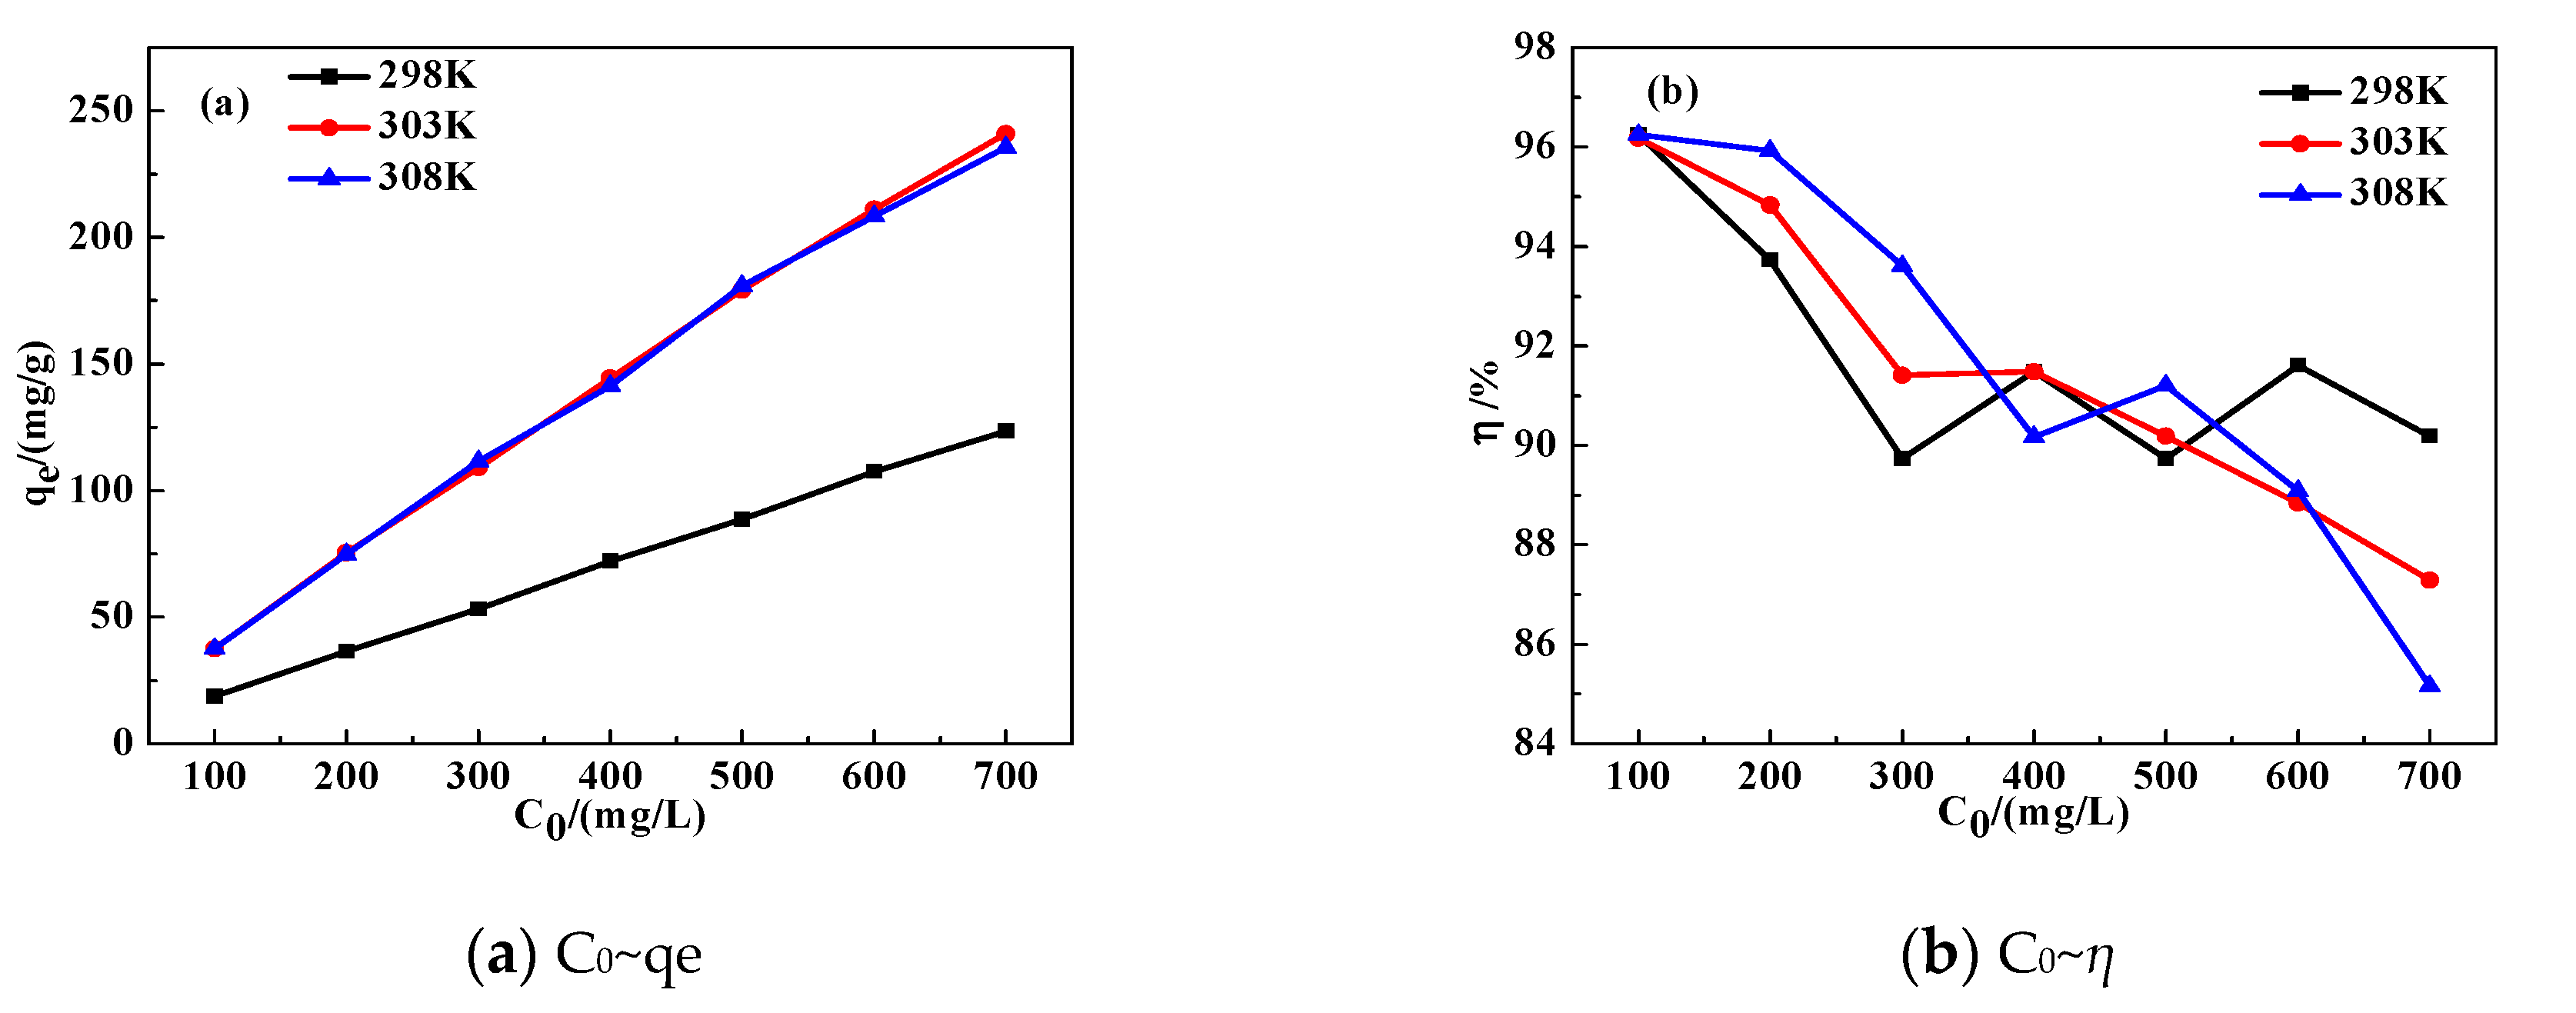
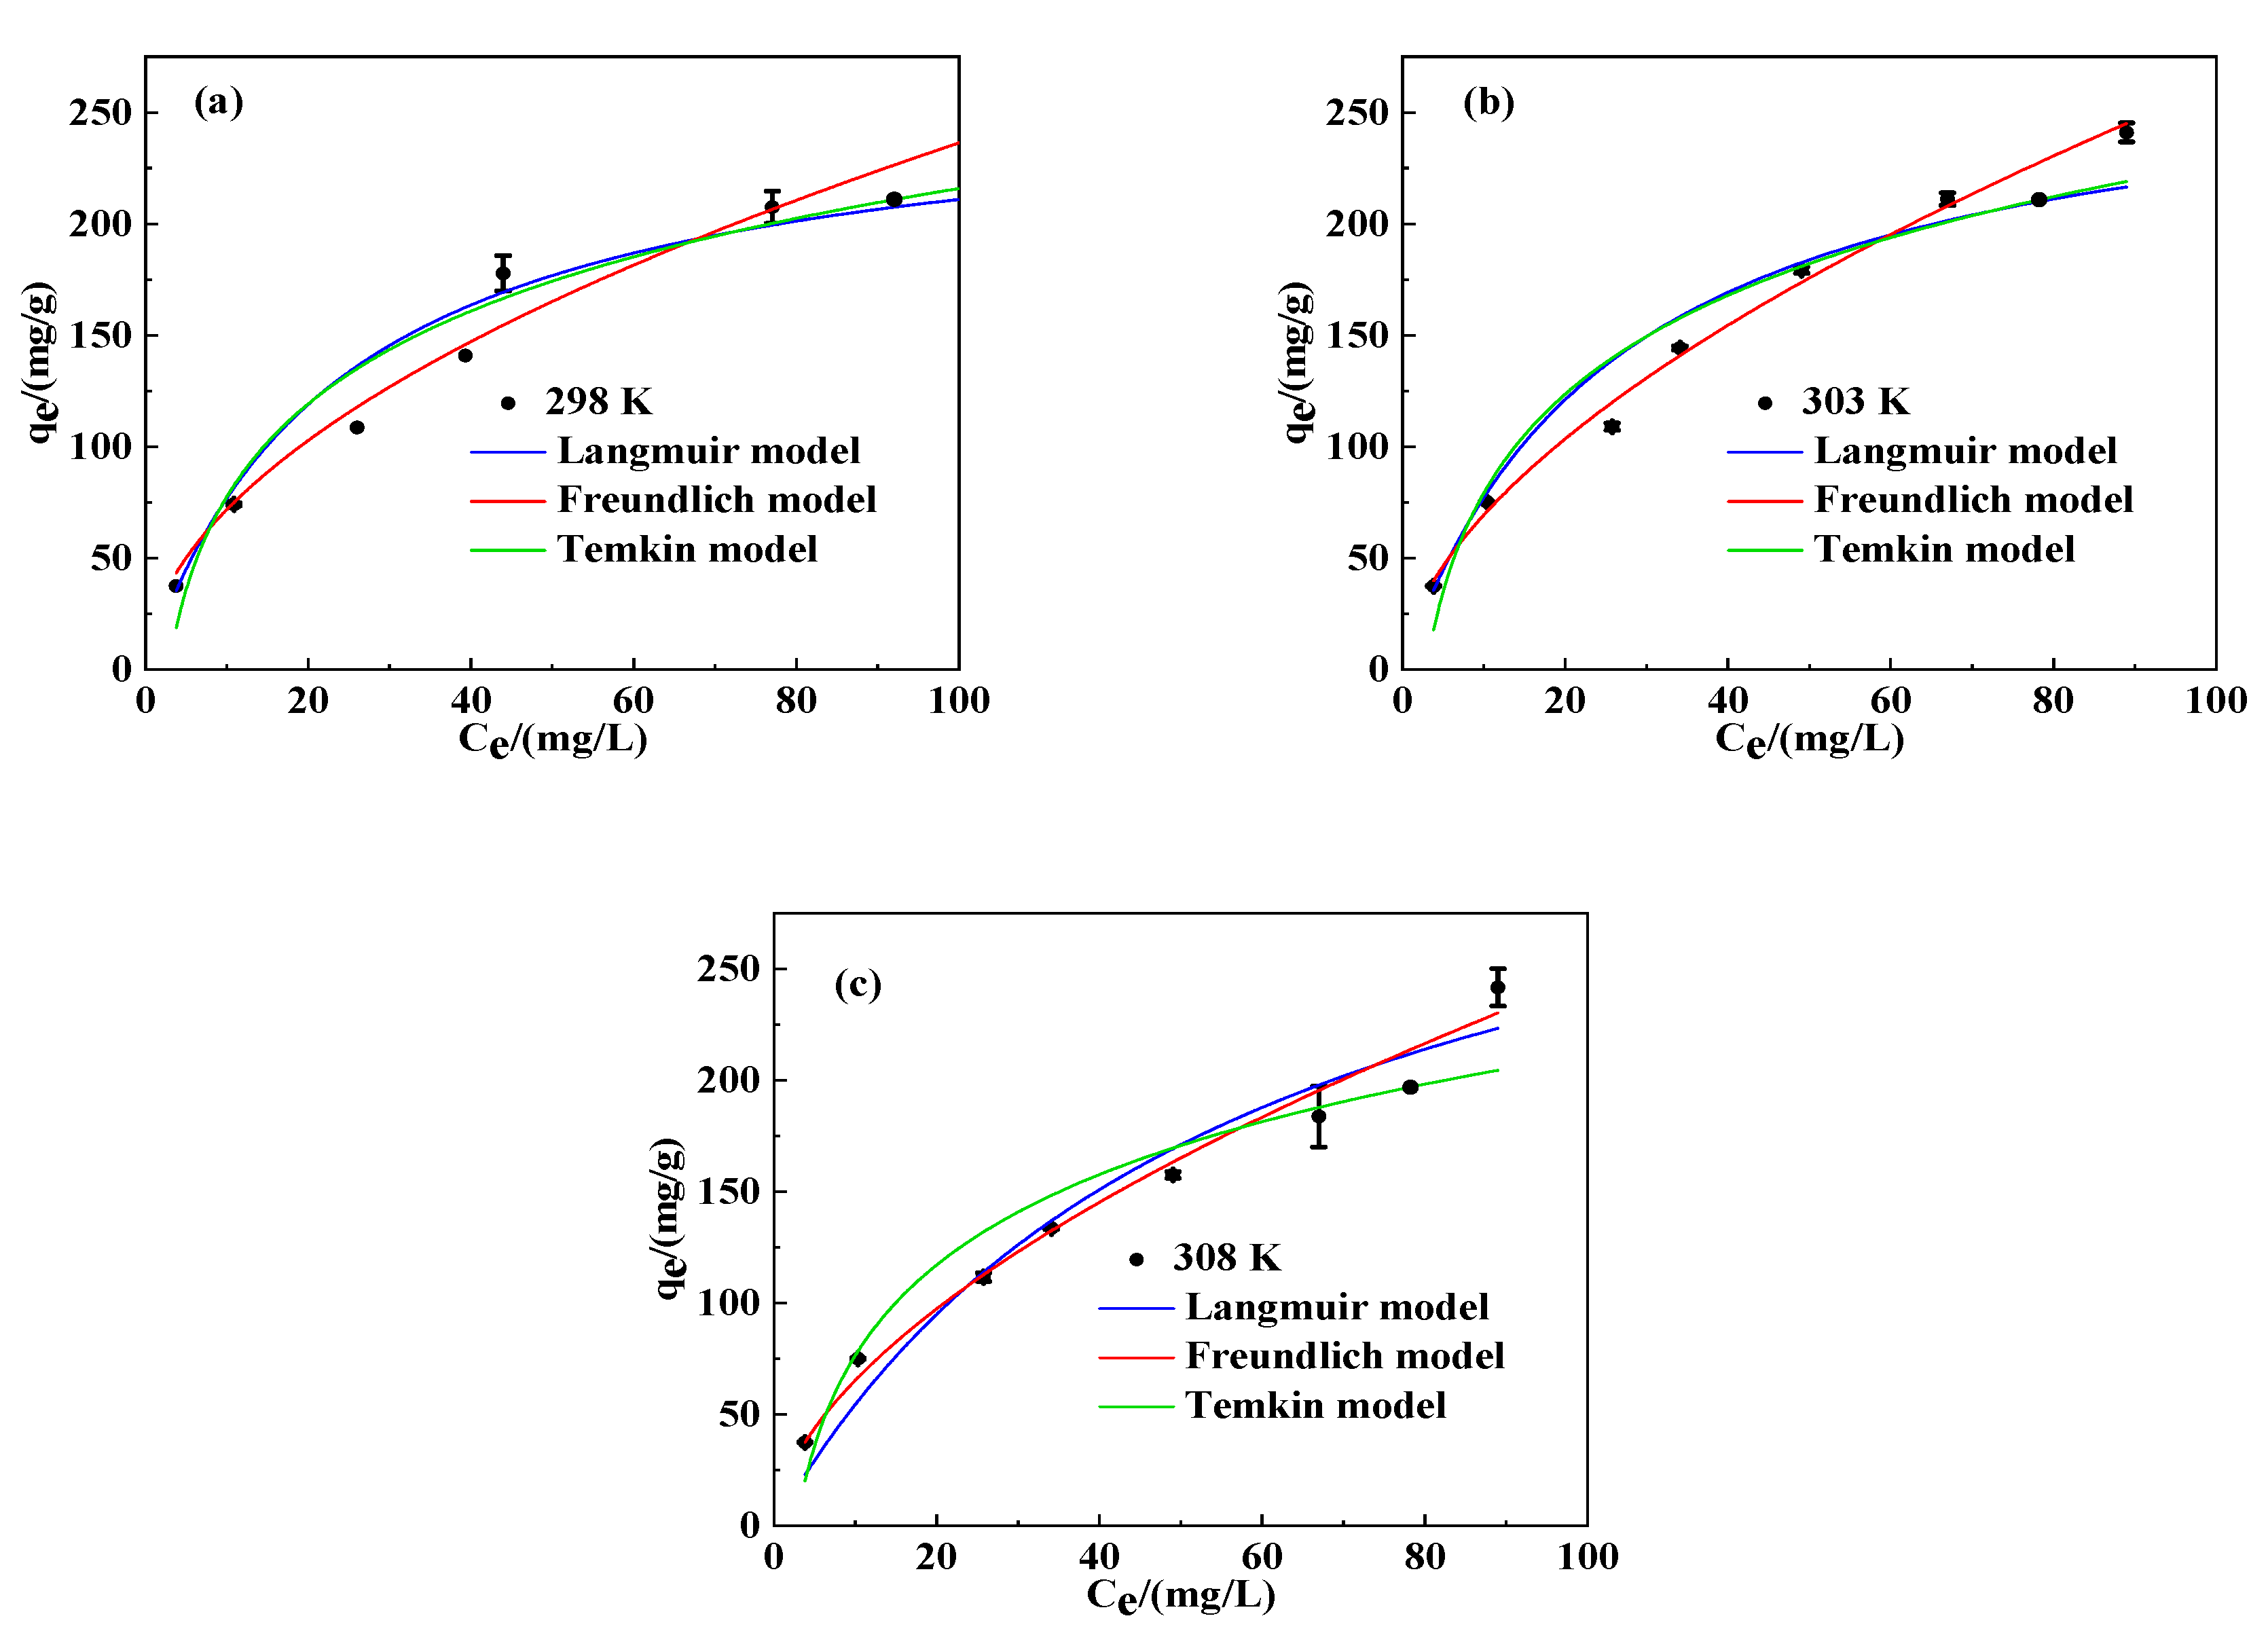
The experimental data was better supported with the Langmuir, Freundlich, and Temkin isotherms (Figure 16). The parameters of isotherms are shown in Table 4. The non-linear Freundlich isotherm fits the adsorption process well, with R2 > 0.938 (Table 4). As the temperature increased, KF value also rises, showing higher adsorption capacity of the MDG, and there was better affinity between MDG and MG. In addition, the fitted heterogeneity factors of Freundlich isotherm (1/n) were all between 0 and 1, indicating that the adsorption process is favorable. These results indicate that the MDG has a non-uniform surface, the adsorption capacity of MDG increased with the increase in concentration of MG, and there was an interaction between MG molecules, which is consistent with the results shown in Figure 15a. The non-linearity of the Langmuir model is higher with R2 > 0.972 (Table 4), indicating that the surface of adsorbent has a relatively homogeneous and regular pore structure [53].
3.8. Adsorption Thermodynamics
The temperature effect on the adsorption process for MG solution with different concentrations was studied (Figure 17). Results of the experiment showed an increase in adsorption capacity with increasing temperature. Figure 17 and Table 5 show the thermodynamics analysis and the relevant parameters of the adsorption process of MDG for MG. The ΔG0 values of MDG for MG at 298 K, 303 K, and 308 K were all negative. It is shown that the adsorption is a spontaneous process. In addition, the ΔG0 gradually decreased with an increase in temperature, which means a better adsorption of MG can be obtained at high temperature, i.e., the reaction is easier to proceed. The value of ΔH0 is positive which indicates that adsorption was an endothermic process and was more likely to occur at high temperature, and was consistent with the temperature effect on the adsorption (Table 4). The positive value of ΔS0 points toward the uncertainty between adsorbent and adsorbate at the interface, which increased during the adsorption process and indicates that adsorption process was more likely to occur [54].
3.9. Adsorption Molecular Simulation
In the simulation, the system was annealed from 1 × 10⁵ K to 100 K. Using the smart method, the force field used was UFF force field. When the energy convergence reached 1 × 10⁻⁴ kcal/mol, the simulation was considered to be over.
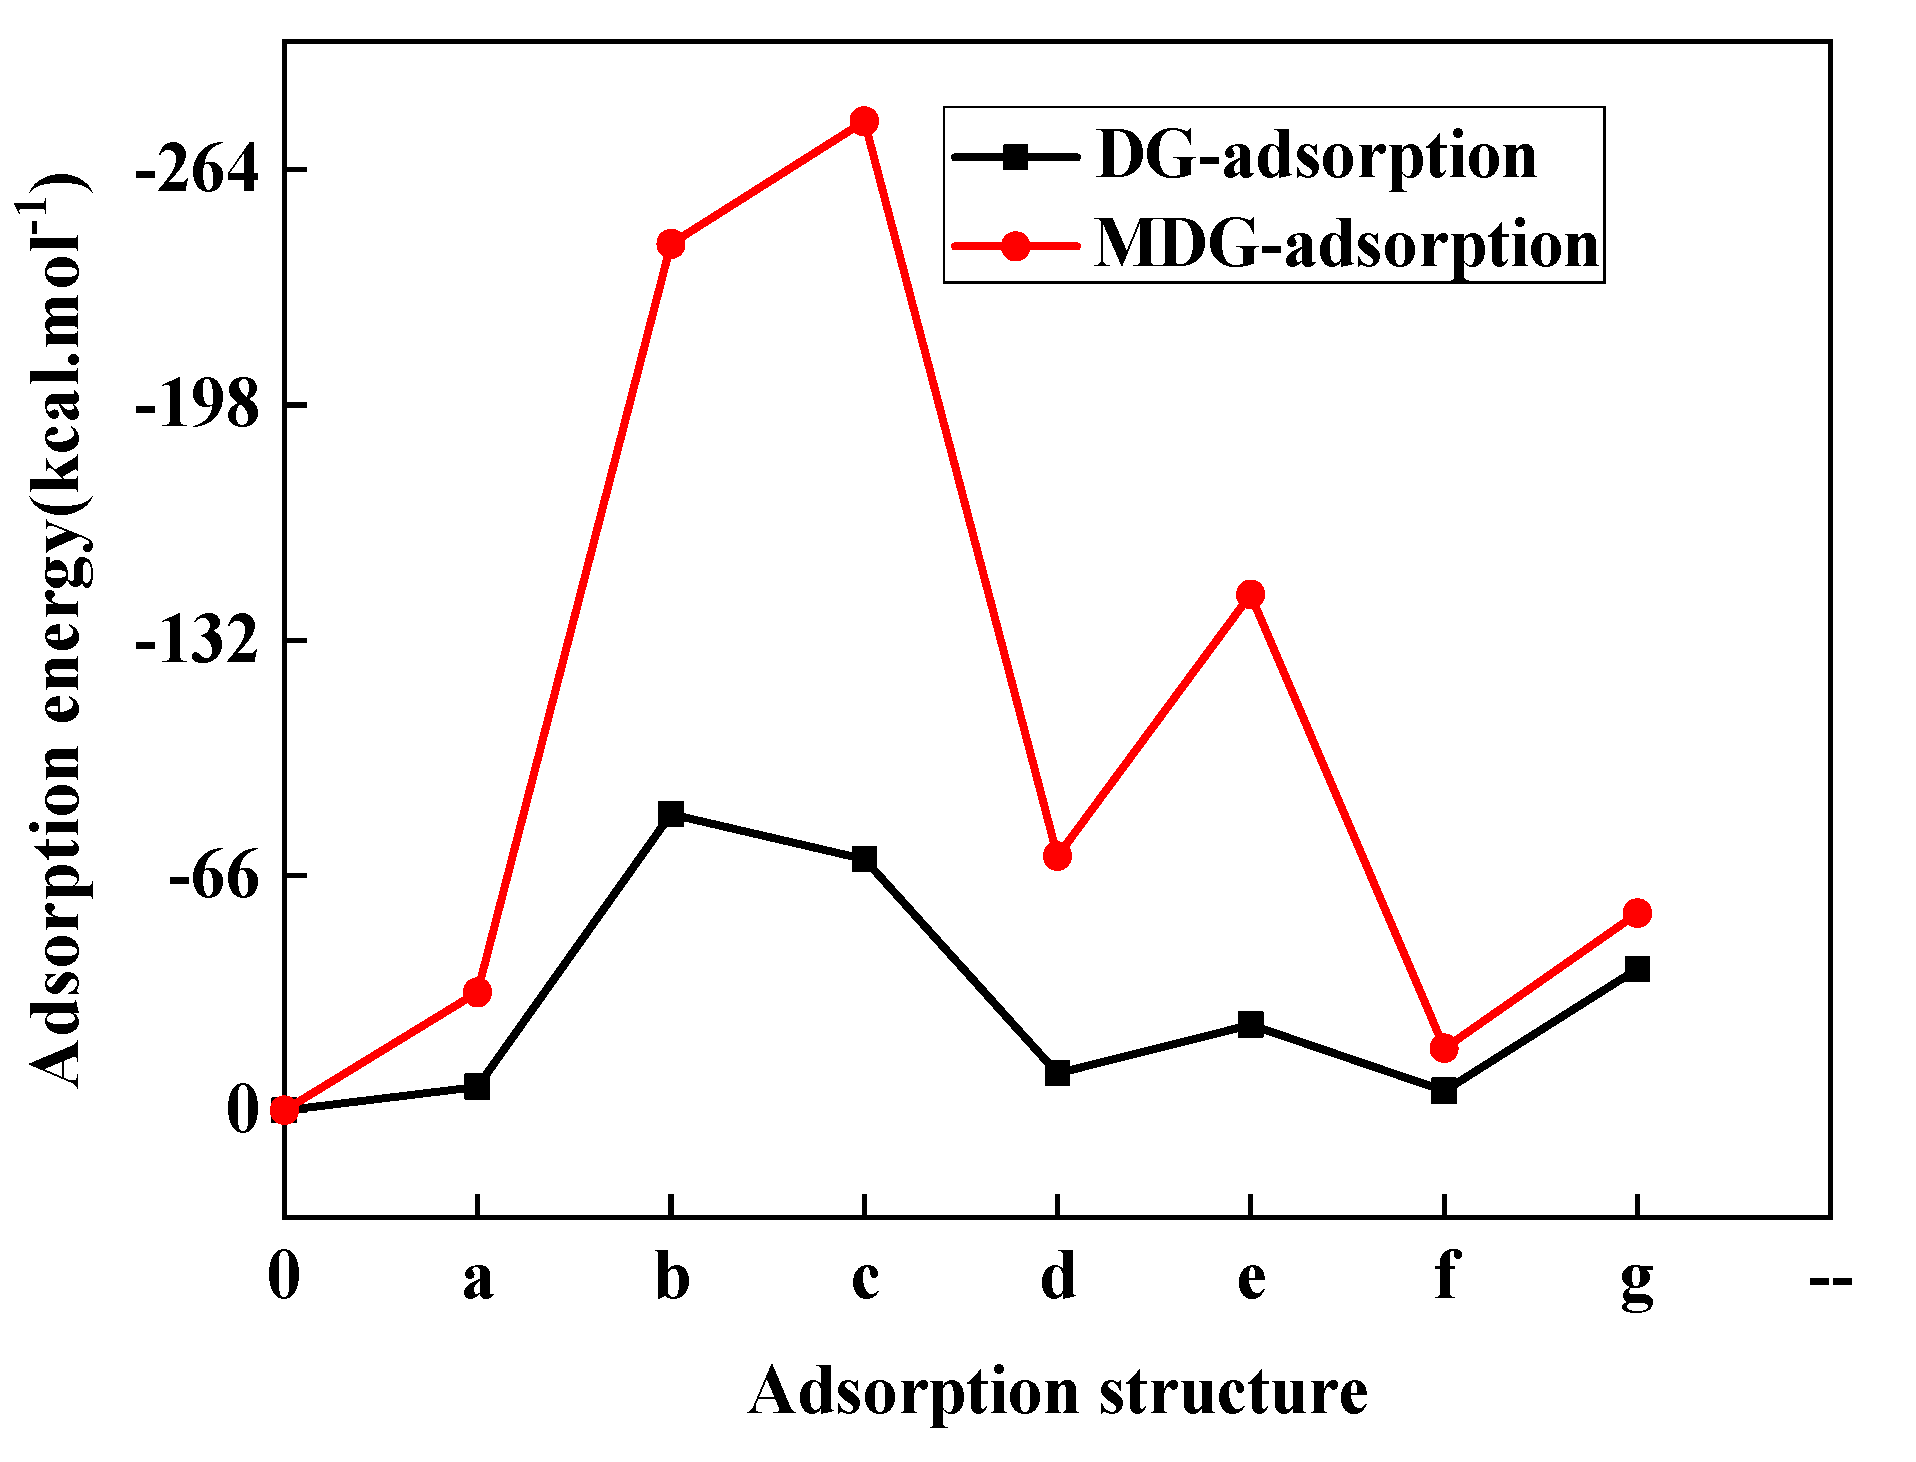
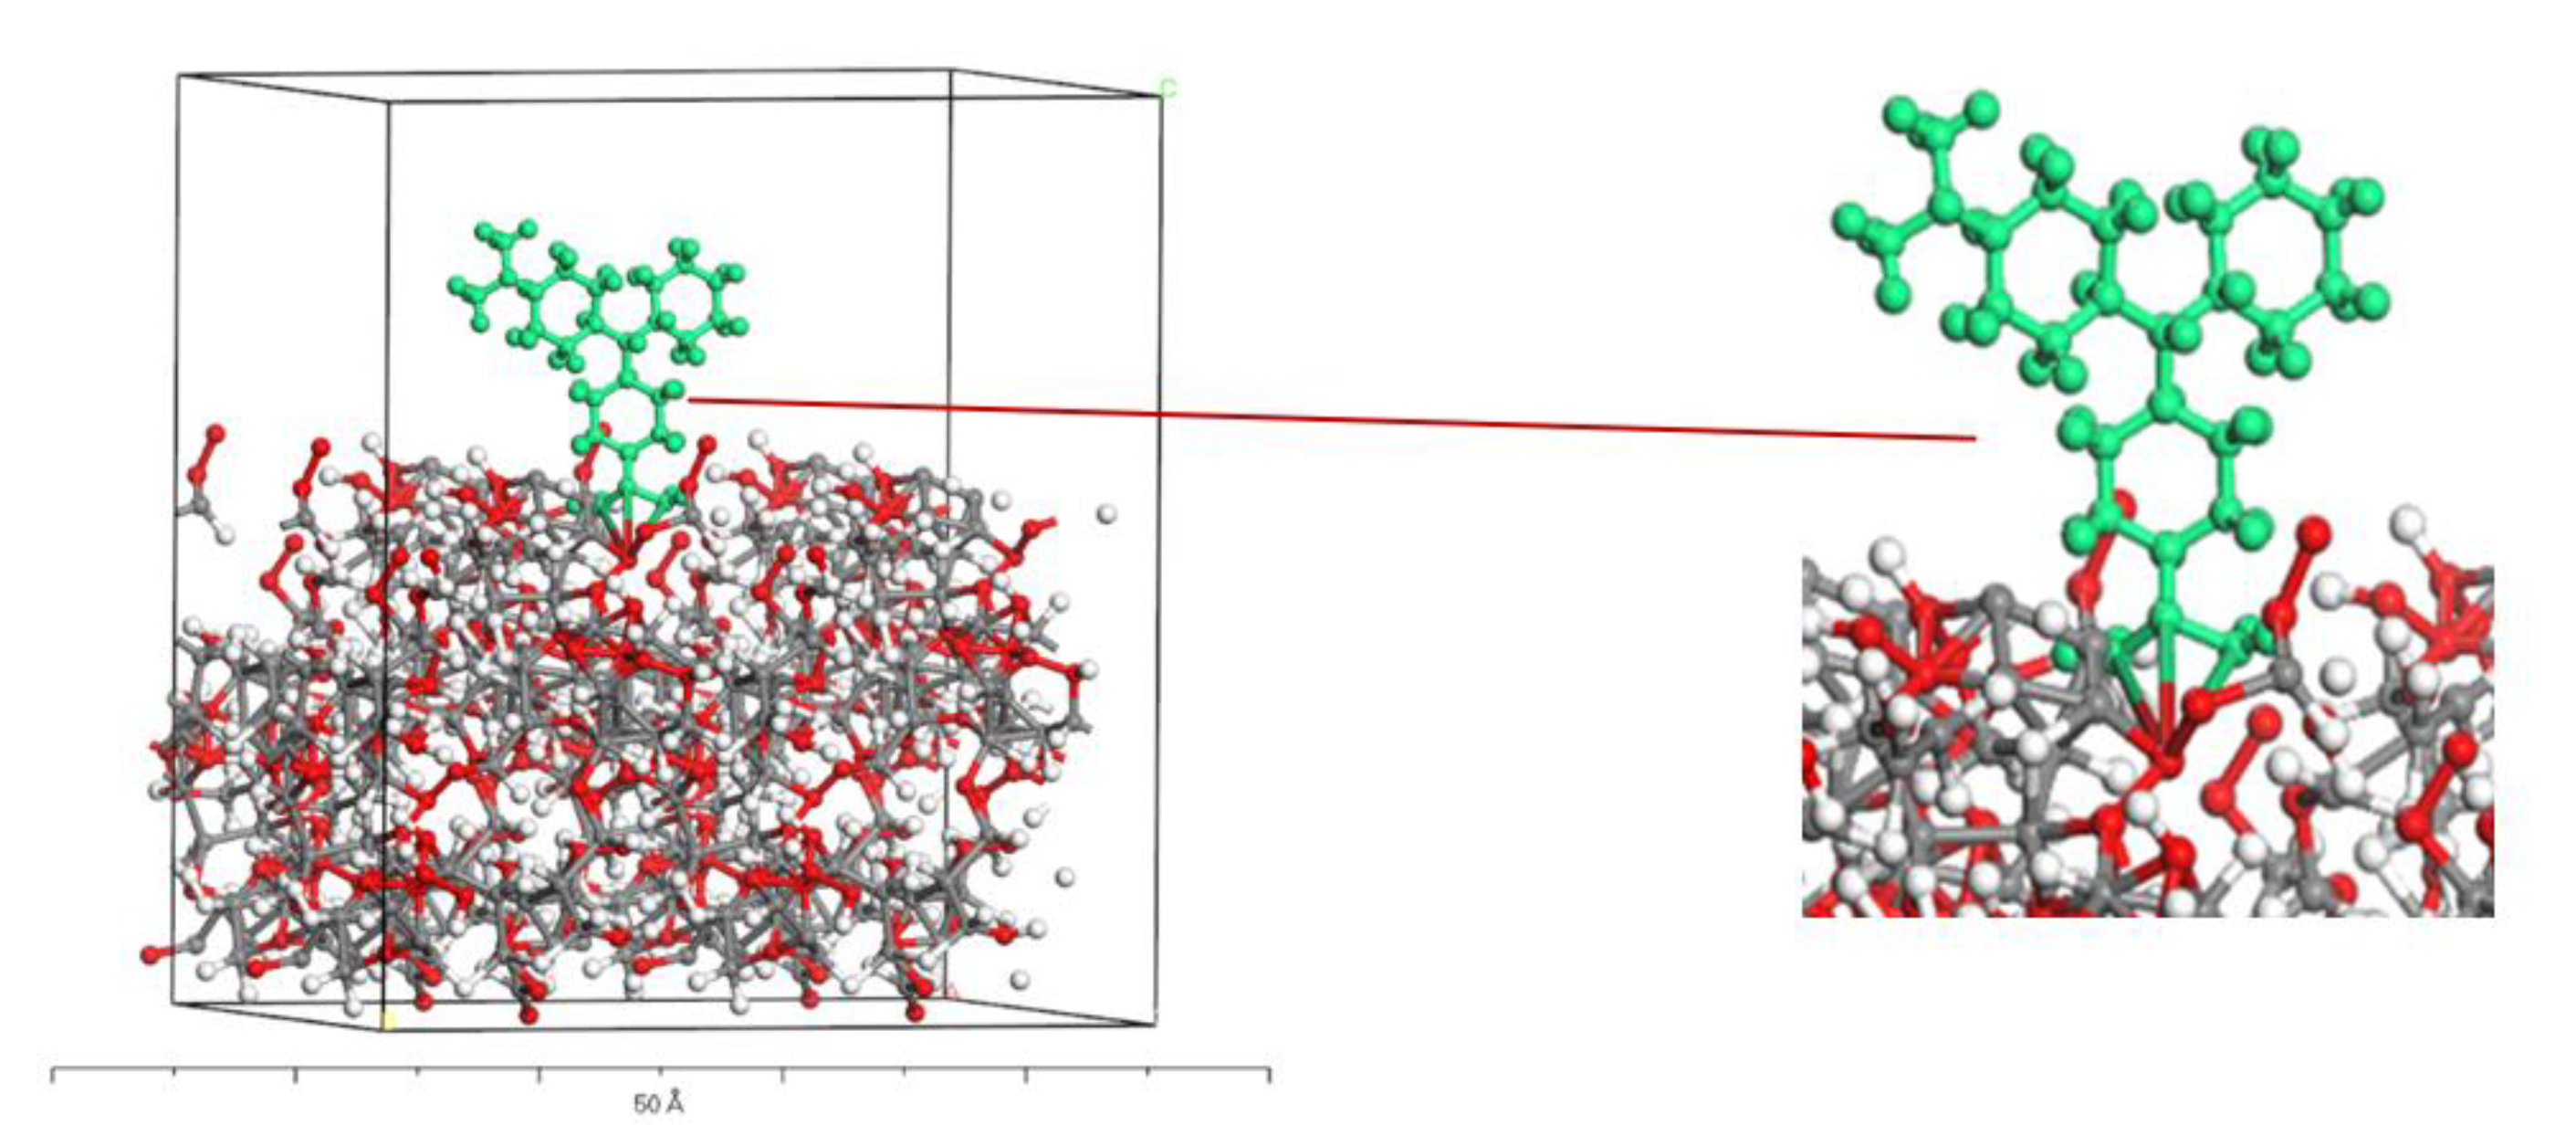
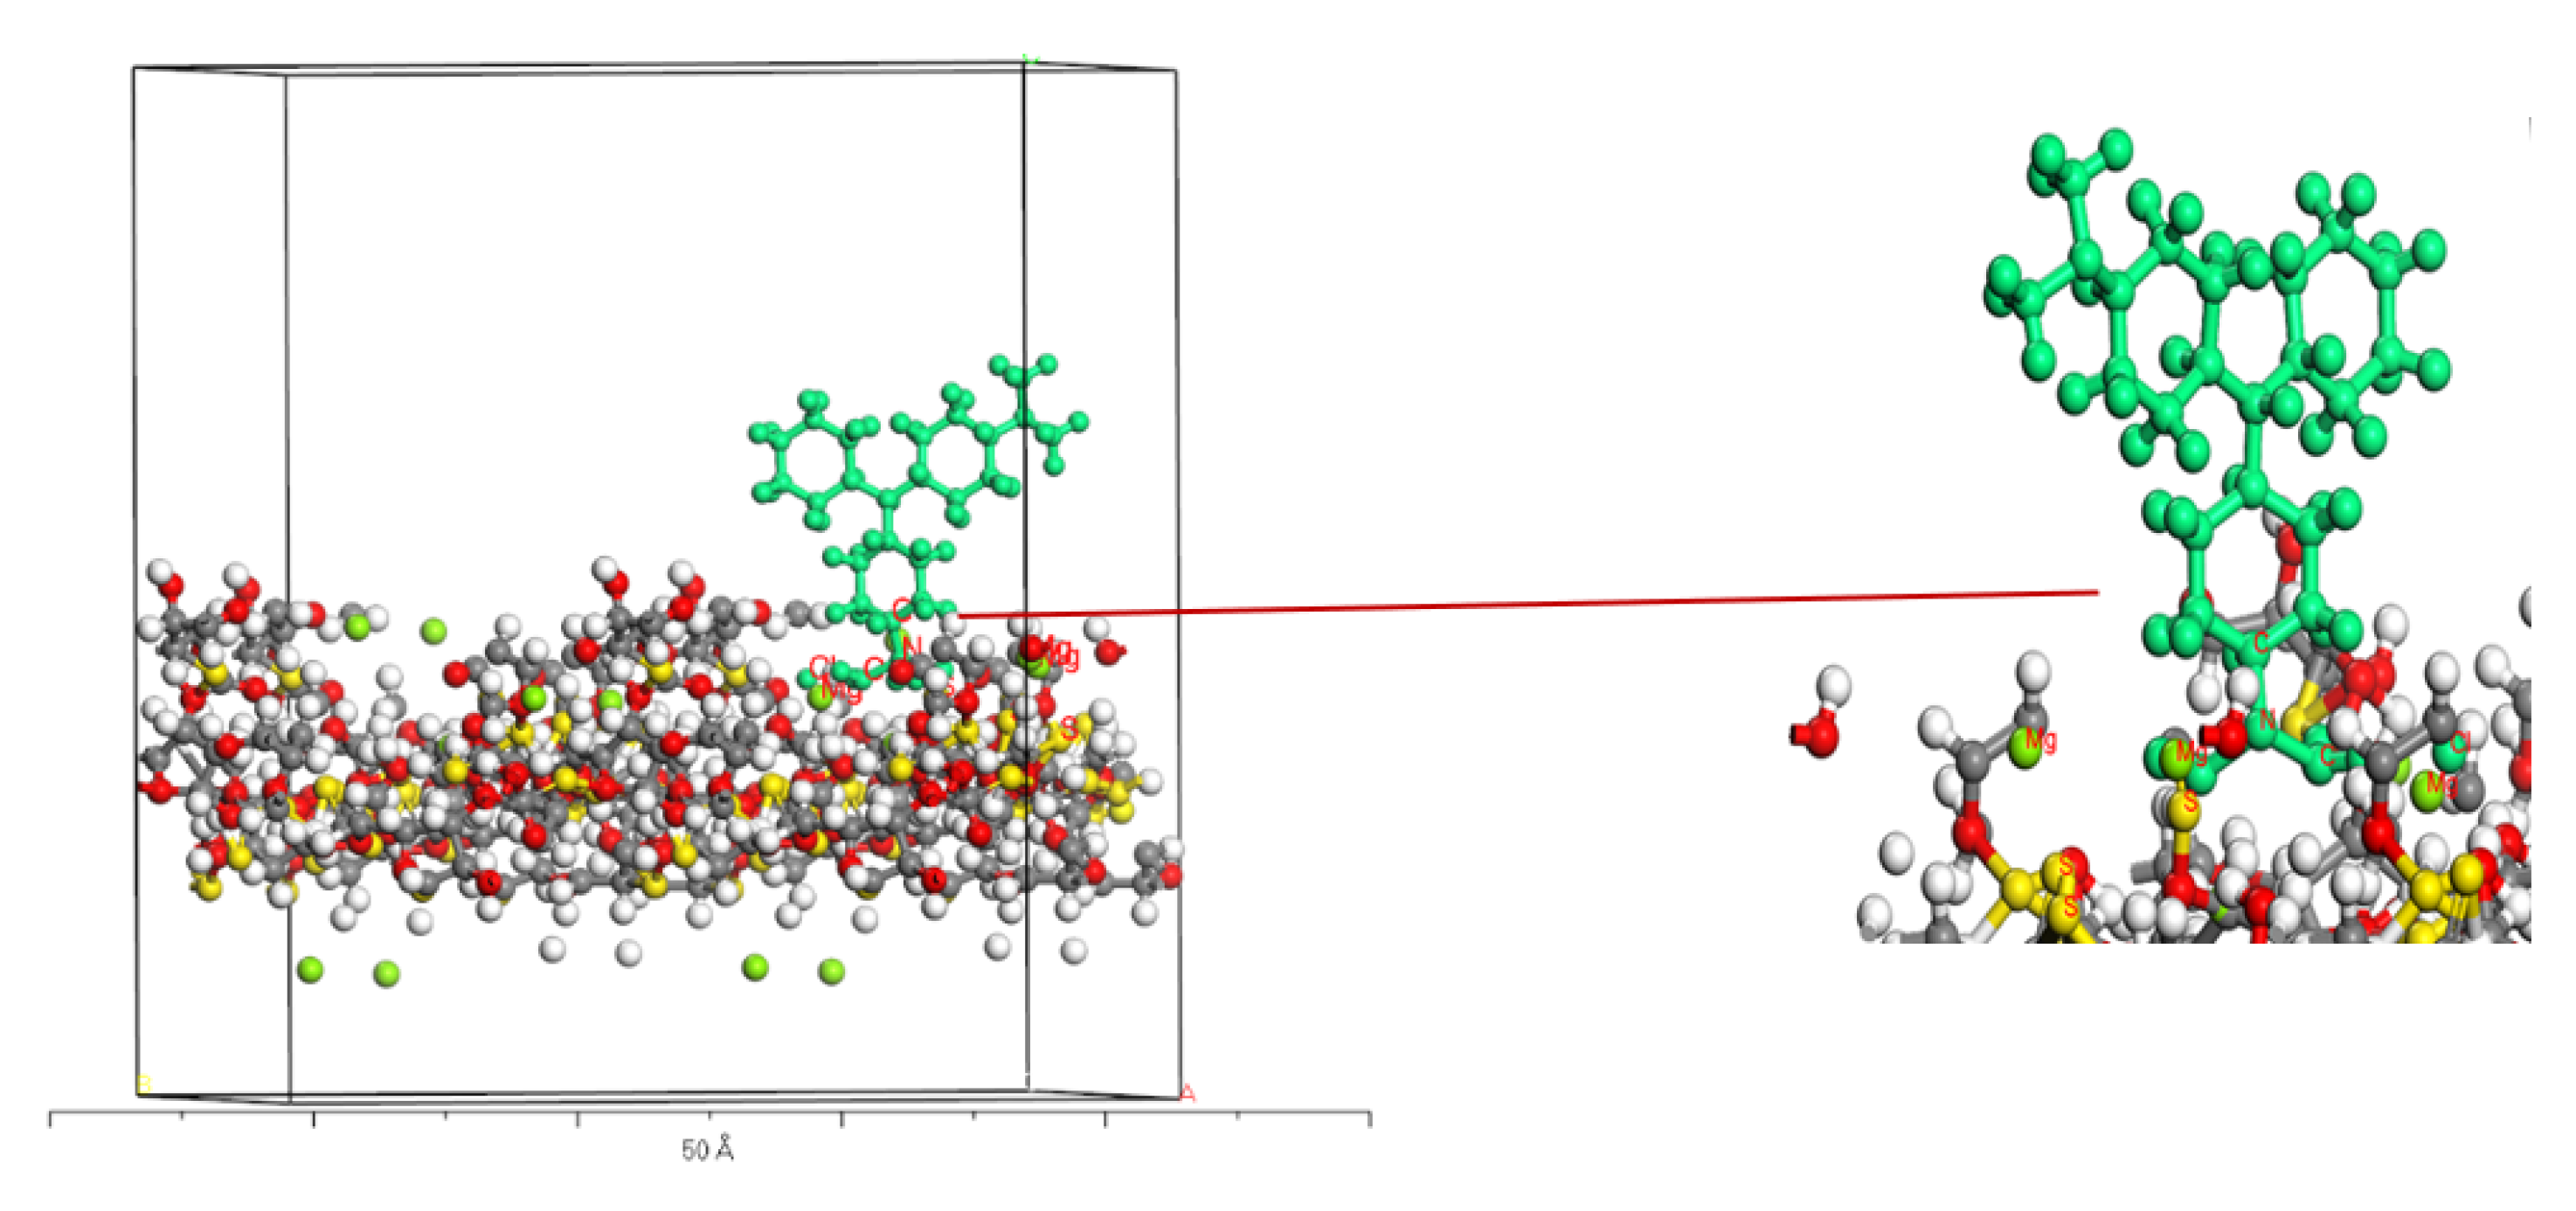
Figure 18 shows the adsorption heat of seven kinds of stochastic simulated adsorption configurations of DG and MDG fibers (−1 1 0) surface-adsorbed on MG molecules, and Figure 19 shows the simulated adsorption of MG molecules on the surface of DG fibers (−1 1 0) surface adsorption model of configuration B. Figure 20 is an adsorption model of the simulated adsorption configuration c of the MDG (−1 1 0) surface-adsorbed MG molecule. MG molecule is labeled as the green molecule. The adsorption energy is the total energy of the system, i.e., after adsorption minus the energy before adsorption. The more negative the adsorption energy, the easier it is to adsorb MG.
Adsorption heat of the MDG (−1 1 0) surface was higher than the DG (−1 1 0) surface, which indicates that MDG more likely to adsorbs MG than DG, and the adsorption heat was uniformly arranged (Figure 18). The adsorption energy of DG fiber, adsorption configuration B and MDG fiber adsorption configuration C reached −83.13 kcal/mol and −277.57 kcal/mol, respectively. The DG heat increased by 3.34 times after MDG. Adsorption configuration B of the MG molecule on the DG is an upright adsorption configuration, and the MG molecule tends to adsorb directly above the surface of the DG cellulose, referred to as the top position on the surface of the DG molecule –OH (Figure 19). Oxygen-containing functional groups showed no obvious change in the position. The structure of DG fibers is tight, and the groups can easily form hydrogen bonds between molecules. It can be seen that DG and MG are physically adsorbed, exhibiting weak chemical adsorption.
The adsorption configuration of the MG molecule on the DG is also an upright adsorption configuration, and the MG molecule tends to adsorb to the midpoint of most adjacent monomer on the surface of MDG fiber (the bridge position), which is mainly assisted by the MG molecule (Figure 20). The auxiliary group is –N (CH2CH3)2. In Figure 20, Cl- of MG is close towards the Mg+ direction of MDG, thus -N+(CH2CH3)2 is more stably attached to the surface of the anionic MDG [55], and each chemical addition of C=S in the MDG fiber molecule has strong chemical adsorption, therefore the MG molecule has stronger affinity for MDG.
Generally, the absolute value of the adsorption energy was greater than 40 kcal/mol for chemical adsorption, but remained less than 40 kcal/mol for physical adsorption. The highest and lowest adsorption heats of the DG (−1 1 0) surface adsorption MG molecule a~g configuration were −83.13 kcal/mol and −5.49 kcal/mol, respectively, indicating the presence of chemisorption. However, the physical adsorption was dominant; the highest and lowest adsorption heat of the MDG (−1 1 0) surface adsorption MG molecule a~g configuration was −277.57 kcal/mol and −17.46 kcal/mol, respectively. It showed that chemical adsorption was main phenomena, but some physical adsorption was also noted. The simulation results were consistent with the results obtained by previous experiments. Results were in accordance with the adsorption pseudo-second order. The adsorption on the substrate was more stable when adsorption energy was more negative, i.e., MDG was more likely to adsorb MG molecules than DG, and the adsorption to MDG was very stable This was due to the strong hydrogen bonding between DG molecules, therefore it was difficult to generate chemical bonds in molecules. The smaller the adsorption energy, the greater the desorption energy, which means that the desorption ability was stronger. The simulation also indirectly showed that the MDG fiber molecules have strong adsorption-desorption potential, which provides a realistic basis for the future adsorption and utilization of distiller’s grains.
3.10. Adsorption Simulation Interaction Energy
The adsorption model of DG and MDG molecules and MG molecules in a water molecular system was established in the amorphous cell module according to the previous experimental ratio. The density distribution of MG molecules in solution system was simulated at 298 K. The system was annealed from 1 × 10⁵ K to 100 K. When the energy convergence reached 1 × 10⁻⁴ kcal/mol, the simulation was considered to be completed.
Table 6 shows the adsorption density distribution of MG molecules adsorbed by DG and MDG in aqueous solution, the number of MG molecules adsorbed by single cell, the van der Waal energy, the electrostatic energy, and the binding energy in the system. The yellow density is the adsorbed MG in the adsorption density distribution map. It can be seen that in the amorphous aqueous solution, the number of molecules adsorbing MG by DG and MDG is two and six, respectively, and the number of molecules adsorbed by single cell is the amount of adsorption, i.e., the amount of MDG adsorption is greater than DG adsorption (Table 6).
The binding energy of crystal is the difference between the total energy of an atom in a crystal when it is in a free state minus the total energy of the entire system when the crystal is stable [56]. The interfacial bonding energy is mainly due to the interaction between the interfaces. This effect is mainly the sum of van der Waals force and electrostatic action.
The binding energy of DG and MDG adsorption model after simulated annealing was 238.718 kcal/mol and 542.079 kcal/mol, respectively, and the binding energy of the MDG system was greater than the DG system (Table 6). The greater the binding energy, the more stable the system, i.e., the MDG adsorption by MG system in aqueous solution was more stable. The binding energy is related to the type of bond formation. DG was esterified with CS2 to form xanthate cellulose, which forms chemical bonds such as C-O, C-S, O-C=S, C=S. Therefore, the MDG system can be combined with DG.
3.11. Comparison of Adsorption Capacity of Various Adsorbents to Remove MG
Table 7 shows the comparison of various adsorbents and MDG maximum adsorption capacity for MG dyes reported in recent years. It can be seen from Table 7 that the maximum monolayer adsorption capacity of MG on MDG in this study was 367.39 mg/g, which is a higher adsorption capacity than other adsorption capacities. The results of this study indicate that MDG is a promising candidate adsorbent for the removal of MG from aqueous solutions, providing a new direction for the current treatment of printing and dyeing wastewater, and recycling of abandoned distiller’s grains.
4. Conclusions
In the present work, a novel MDG was successfully prepared from CS2-modified waste distillers’ grains. FTIR and XRD results evidenced that the groups in MDG have changed, but that modification treatment did not change the structure of cellulose. The adsorption results indicated that increase in adsorption time results in a gradual increase of adsorption capacity and removal rate until the equilibrium stage was attained after 240 min. The increase in initial concentration of MG in the wastewater resulted in an increase in adsorption capacity and a decrease in removal rate. The maximum removal rate was 96.51%, and after eight adsorption–desorption cycle experiments, the adsorption removal rate of MDG to MG dye remained at 82.6%. The kinetic studies indicated that adsorption mechanism of MDG, DG for MG was in accordance with the pseudo-second order kinetic model (R2 > 0.998) and k2 increased with rise in temperature. The Freundlich adsorption isotherm equation perfectly described the adsorption process of MDG, DG, and MG (R2 > 0.967). MDG has better adsorption capacity, up to 367.39 mg/g, and its maximum adsorption capacity for MG adsorption is greater than reported in other literatures. The thermodynamic analysis indicated that adsorption mechanism was a spontaneous (ΔG0 < 0), endothermic (ΔH0 > 0), and entropy increasing process (ΔS0 > 0). Through the molecular simulation adsorption process, it was confirmed that MDG adsorption of MG was mainly chemical adsorption. MDG was more likely to adsorb MG molecules than DG, and was most stable on the distiller’s fiber. The MDG is a promising candidate adsorbent for the removal of MG from aqueous solutions. It not only provides a high-efficiency and low-cost dye wastewater treatment option, but also provides a new direction for the recovery and reuse of waste distiller’s grains, which ultimately helps in achieving energy conservation, emission reduction, and environmental protection.
Author Contributions
Conceptualization, C.L. and C.W.; methodology, D.K. and X.M.; software, X.M.; resources, H.W.; writing—original draft preparation, D.K. and X.M.; writing—review and editing, D.K.; funding acquisition, X.Y., C.W. and H.W. All authors have read and agreed to the published version of the manuscript.
Funding
This research was funded by the Open Research Fund Program of Key Laboratory of Cleaner Production and Integrated Resource Utilization of China National Light Industry (CP-2018-YB2), Liquor making Biological Technology and Application of key laboratory of Sichuan Province (NJ2019-01), Key Laboratory of Wuliangye-flavor Liquor Solid-state Fermentation, China National Light Industry (2018JJ005).
Conflicts of Interest
The authors declare no conflict of interest.
References
- Wang, X.J.; Ullah, N.; Sun, X.C.; Guo, X.; Chen, L.; Li, Z.X.; Feng, X.C. Development and characterization of bacterial cellulose reinforced biocomposite films based on protein from buckwheat distiller’s dried grains. Int. J. Biol. Macromol. 2016, 96, 353–360. [Google Scholar] [CrossRef] [PubMed]
- Zuo, S.C.; Yang, H.Q.; Zou, W. Recent Progress on the Utilization of Distiller’s Grains: A Review. Food Ind. 2016, 37, 246–249. [Google Scholar]
- Rahmani, M.; Kaykhaii, M.; Sasani, M. Application of Taguchi L16 design method for comparative study of ability of 3A zeolite in removal of Rhodamine B and Malachite green from environmental water samples. Spectrochim. Acta Part A Mol. Biomol. Spectrosc. 2018, 188, 164–169. [Google Scholar] [CrossRef] [PubMed]
- Pei, C.; Han, G.; Zhao, Y.; Zhao, H.; Liu, B.; Cheng, L.; Yang, H.; Liu, S. Superior adsorption performance for triphenylmethane dyes on 3D architectures assembled by ZnO nanosheets as thin as ∼1.5 nm. J. Hazard. Mater. 2016, 318, 732–741. [Google Scholar] [CrossRef]
- Guadie, A.; Tizazu, S.; Melese, M.; Guo, W.; Ngo, H.H.; Xia, S. Biodecolorization of textile azo dye using Bacillus sp. strain CH12 isolated from alkaline lake. Biotechnol. Rep. 2017, 15, 92–100. [Google Scholar] [CrossRef] [PubMed]
- Dil, E.A.; Ghaedi, M.; Asfaram, A.; Mehrabi, F.; Bazrafshan, A.A. Optimization of process parameters for determination of trace Hazardous dyes from industrial wastewaters based on nanostructures materials under ultrasound energy. Ultrason. Sonochemistry 2018, 40, 238–248. [Google Scholar] [CrossRef]
- Goda, E.S.; Singu, B.S.; Hong, S.E.; Yoon, K.R. Good dispersion of poly(δ-gluconolactone)-grafted graphene in poly(vinyl alcohol) for significantly enhanced mechanical strength. Mater. Chem. Phys. 2020, 254, 123465. [Google Scholar] [CrossRef]
- Kadioglu, O.; Keskin, S. Efficient separation of helium from methane using MOF membranes. Sep. Purif. Technol. 2018, 191, 192–199. [Google Scholar] [CrossRef]
- Saffari, M.; Ebrahimi, A.; Langrish, T. Nano-confinement of acetaminophen into porous mannitol through adsorption method. Microporous Mesoporous Mater. 2016, 227, 95–103. [Google Scholar] [CrossRef]
- Zhou, Y.; Zhang, R.; Chen, K.; Zhao, X.; Gu, X.; Lu, J. Enhanced adsorption and photo-degradation of bisphenol A by β-cyclodextrin modified pine sawdust in an aquatic environment. J. Taiwan Inst. Chem. Eng. 2017, 78, 510–516. [Google Scholar] [CrossRef]
- Shehzad, K.; Xie, C.; He, J.; Cai, X.; Xu, W.; Liu, J. Facile synthesis of novel calcined magnetic orange peel composites for efficient removal of arsenite through simultaneous oxidation and adsorption. J. Colloid Interface Sci. 2018, 511, 155–164. [Google Scholar] [CrossRef]
- Wang, W.; Deng, S.; Li, D.; Ren, L.; Shan, D.; Wang, B.; Huang, J.; Wang, Y.; Yu, G. Sorption behavior and mechanism of organophosphate flame retardants on activated carbons. Chem. Eng. J. 2018, 332, 286–292. [Google Scholar] [CrossRef]
- Liu, J.; Wang, Z.; Li, H.; Hu, C.; Raymer, P.; Huang, Q. Effect of solid state fermentation of peanut shell on its dye adsorption performance. Bioresour. Technol. 2018, 249, 307–314. [Google Scholar] [CrossRef]
- Fito, J.; Tefera, N.; Van Hulle, S.W. Adsorption of distillery spent wash on activated bagasse fly ash: Kinetics and thermodynamics. J. Environ. Chem. Eng. 2017, 5, 5381–5388. [Google Scholar] [CrossRef]
- Noor, N.M.; Othman, R.; Mubarak, N.; Abdullah, E.C. Agricultural biomass-derived magnetic adsorbents: Preparation and application for heavy metals removal. J. Taiwan Inst. Chem. Eng. 2017, 78, 168–177. [Google Scholar] [CrossRef]
- Sayğılı, H.; Güzel, F. High surface area mesoporous activated carbon from tomato processing solid waste by zinc chloride activation: Process optimization, characterization and dyes adsorption. J. Clean. Prod. 2016, 113, 995–1004. [Google Scholar] [CrossRef]
- Yakout, S.M.; Hassan, M.R.; Abdeltawab, A.A.; Aly, M.I. Sono-sorption efficiencies and equilibrium removal of triphenylmethane (crystal violet) dye from aqueous solution by activated charcoal. J. Clean. Prod. 2019, 234, 124–131. [Google Scholar] [CrossRef]
- Bhowmik, M.; Deb, K.; Debnath, A.; Saha, B. Mixed phase Fe2O3/Mn3O4 magnetic nanocomposite for enhanced adsorption of methyl orange dye: Neural network modeling and response surface methodology optimization. Appl. Organomet. Chem. 2017, 32, e4186. [Google Scholar] [CrossRef]
- Bhowmik, M.; Debnath, A.; Saha, B. Fabrication of mixed phase calcium ferrite and zirconia nanocomposite for abatement of methyl orange dye from aqua matrix: Optimization of process parameters. Appl. Organomet. Chem. 2018, 32, e4607. [Google Scholar] [CrossRef]
- Bhowmik, M.; Debnath, A.; Saha, B. Fabrication of mixed phase CaFe2O4 and MnFe2O4 magnetic nanocomposite for enhanced and rapid adsorption of methyl orange dye: Statistical modeling by neural network and response surface methodology. J. Dispers. Sci. Technol. 2019, 41, 1937–1948. [Google Scholar] [CrossRef]
- Abu Elella, M.H.; Elhafeez, E.A.; Goda, E.S.; Lee, S.; Yoon, K.R. Smart bactericidal filter containing biodegradable polymers for crystal violet dye adsorption. Cellulose 2019, 26, 9179–9206. [Google Scholar] [CrossRef]
- Li, C.; Wu, N.; Zhang, M.; Wei, C.; Yan, F.; Wang, Z. Effects of E44 and KH560 modifiers on properties of distillers grains poly(butylene succinate) composites. Polym. Compos. 2018, 40, 1499–1509. [Google Scholar] [CrossRef]
- Wang, B.; Lian, G.; Lee, X.; Gao, B.; Li, L.; Liu, T.; Zhang, X.; Zheng, Y. Phosphogypsum as a novel modifier for distillers grains biochar removal of phosphate from water. Chemosphere 2019, 238, 124684. [Google Scholar] [CrossRef]
- Xu, Q.; Liu, T.; Li, L.; Liu, B.; Wang, X.; Zhang, S.; Li, L.; Wang, B.; Zimmerman, A.R.; Gao, B. Hydrothermal carbonization of distillers grains with clay minerals for enhanced adsorption of phosphate and methylene blue. Bioresour. Technol. 2021, 340, 125725. [Google Scholar] [CrossRef]
- Wang, H.; Xie, R.; Zhang, J.; Zhao, J. Preparation and characterization of distillers’ grain based activated carbon as low cost methylene blue adsorbent: Mass transfer and equilibrium modeling. Adv. Powder Technol. 2017, 29, 27–35. [Google Scholar] [CrossRef]
- Oliveira, K.R.; Segura, J.G.; Oliveira, B.A.; Medeiros, A.; Zimba, R.D.; Viegas, E.M. Distillers’ dried grains with soluble in diets for Pacu, Piaractus mesopotamicus juveniles: Growth performance, feed utilization, economic viability, and phosphorus release. Anim. Feed. Sci. Technol. 2020, 262, 114393. [Google Scholar] [CrossRef]
- Lee, C.; Morris, D.; Lefever, K.; Dieter, P. Feeding a diet with corn distillers grain with solubles to dairy cows alters manure characteristics and ammonia and hydrogen sulfide emissions from manure. J. Dairy Sci. 2020, 103, 2363–2372. [Google Scholar] [CrossRef]
- Zhang, Z.; Wang, Q.; Li, L.; Xu, G. Pyrolysis characteristics, kinetics and evolved volatiles determination of rice-husk-based distiller’s grains. Biomass-Bioenergy 2020, 135, 105525. [Google Scholar] [CrossRef]
- Tan, L.; Zhu, D.; Zhou, W.; Mi, W.; Ma, L.; He, W. Preferring cellulose of Eichhornia crassipes to prepare xanthogenate to other plant materials and its adsorption properties on copper. Bioresour. Technol. 2008, 99, 4460–4466. [Google Scholar] [CrossRef]
- Huang, Z.; Li, Y.; Chen, W.; Shi, J.; Zhang, N.; Wang, X.; Li, Z.; Gao, L.; Zhang, Y. Modified bentonite adsorption of organic pollutants of dye wastewater. Mater. Chem. Phys. 2017, 202, 266–276. [Google Scholar] [CrossRef]
- Elwakeel, K.Z.; Guibal, E. Arsenic(V) sorption using chitosan/Cu(OH)2 and chitosan/CuO composite sorbents. Carbohydr. Polym. 2015, 134, 190–204. [Google Scholar] [CrossRef]
- Bao, S.; Tang, L.; Li, K.; Ning, P.; Peng, J.; Guo, H.; Zhu, T.; Liu, Y. Highly selective removal of Zn(II) ion from hot-dip galvanizing pickling waste with amino-functionalized Fe3O4@SiO2 magnetic nano-adsorbent. J. Colloid Interface Sci. 2016, 462, 235–242. [Google Scholar] [CrossRef]
- Lonappan, L.; Rouissi, T.; Brar, S.K.; Verma, M.; Surampalli, R.Y. An insight into the adsorption of diclofenac on different biochars: Mechanisms, surface chemistry, and thermodynamics. Bioresour. Technol. 2018, 249, 386–394. [Google Scholar] [CrossRef] [Green Version]
- Nishiyama, Y.; Langan, P.; Chanzy, H. Crystal Structure and Hydrogen-Bonding System in Cellulose Iβ from Synchrotron X-ray and Neutron Fiber Diffraction. J. Am. Chem. Soc. 2002, 124, 9074–9082. [Google Scholar] [CrossRef]
- Gurina, D.; Surov, O.; Voronova, M.; Zakharov, A.; Kiselev, M. Water Effects on Molecular Adsorption of Poly(N-vinyl-2-pyrrolidone) on Cellulose Nanocrystals Surfaces: Molecular Dynamics Simulations. Materials 2019, 12, 2155. [Google Scholar] [CrossRef] [Green Version]
- Zhang, S.; Tang, C.; Xie, J.; Zhou, Q. Improvement of thermal stability of insulation paper cellulose by modified polysiloxane grafting. Appl. Phys. Lett. 2016, 109, 172902. [Google Scholar] [CrossRef]
- Zhou, W.; Zhu, D.; Langdon, A.; Li, L.; Liao, S.; Tan, L. The structure characterization of cellulose xanthogenate derived from the straw of Eichhornia crassipes. Bioresour. Technol. 2009, 100, 5366–5369. [Google Scholar] [CrossRef]
- French, A.D. Idealized powder diffraction patterns for cellulose polymorphs. Cellulose 2013, 21, 885–896. [Google Scholar] [CrossRef]
- Liu, M.; Zhao, Z.; Yu, W. Citric acid modified wood membranes for efficient adsorption of tetracycline: Effect of alkali pretreatment concentration and adsorption mechanism. Chem. Eng. J. 2020, 393, 124748. [Google Scholar] [CrossRef]
- Sun, S.; Yu, Q.; Li, M.; Zhao, H.; Wu, C. Preparation of coffee-shell activated carbon and its application for water vapor adsorption. Renew. Energy 2019, 142, 11–19. [Google Scholar] [CrossRef]
- Chakraborty, A.; Sun, B. An adsorption isotherm equation for multi-types adsorption with thermodynamic correctness. Appl. Therm. Eng. 2014, 72, 190–199. [Google Scholar] [CrossRef]
- Tiwari, D.; Bhunia, H.; Bajpai, P.K. Adsorption of CO2 on KOH activated, N-enriched carbon derived from urea formaldehyde resin: Kinetics, isotherm and thermodynamic studies. Appl. Surf. Sci. 2018, 439, 760–771. [Google Scholar] [CrossRef]
- Ahmed, M.; Islam, A.; Asif, M.; Hameed, B. Human hair-derived high surface area porous carbon material for the adsorption isotherm and kinetics of tetracycline antibiotics. Bioresour. Technol. 2017, 243, 778–784. [Google Scholar] [CrossRef]
- Jiang, Z.; Hu, D. Molecular mechanism of anionic dyes adsorption on cationized rice husk cellulose from agricultural wastes. J. Mol. Liq. 2018, 276, 105–114. [Google Scholar] [CrossRef]
- Li, Y.; Zhao, B.; Zhang, L.; Han, R. Biosorption of copper ion by natural and modified wheat straw in fixed-bed column. Desalination Water Treat. 2013, 51, 5735–5745. [Google Scholar] [CrossRef]
- Mohamed, M.H.; Dolatkhah, A.; Aboumourad, T.; Dehabadi, L.; Wilson, L.D. Investigation of templated and supported polyaniline adsorbent materials. RSC Adv. 2014, 5, 6976–6984. [Google Scholar] [CrossRef]
- Nazir, M.A.; Yasar, A.; Bashir, M.A.; Siyal, S.H.; Najam, T.; Javed, M.S.; Ahmad, K.; Hussain, S.; Anjum, S.; Hussain, E.; et al. Quality assessment of the noncarbonated-bottled drinking water: Comparison of their treatment techniques. Int. J. Environ. Anal. Chem. 2020, 1–12. [Google Scholar] [CrossRef]
- Ayub, A.; Irfan, A.; Raza, Z.A.; Abbas, M.; Muhammad, A.; Ahmad, K.; Munwar, A. Development of poly(1-vinylimidazole)-chitosan composite sorbent under microwave irradiation for enhanced uptake of Cd(II) ions from aqueous media. Polym. Bull. 2021, 1–21. [Google Scholar] [CrossRef]
- Ahmad, K.; Shah, H.-U.; Parveen, S.; Aziz, T.; Naseem, H.A.; Ashfaq, M.; Rauf, A. Metal Organic Framework (KIUB-MOF-1) as Efficient Adsorbent for Cationic and Anionic Dyes from Brackish Water. J. Mol. Struct. 2021, 1242, 130898. [Google Scholar] [CrossRef]
- Shah, H.U.R.; Ahmad, K.; Naseem, H.A.; Parveen, S.; Ashfaq, M.; Rauf, A.; Aziz, T. Water stable graphene oxide metal-organic frameworks composite (ZIF-67@GO) for efficient removal of malachite green from water. Food Chem. Toxicol. 2021, 154, 112312. [Google Scholar] [CrossRef]
- Naseem, H.A.; Aziz, T.; Shah, H.-U.; Ahmad, K.; Parveen, S.; Ashfaq, M. Rational synthesis and characterization of medicinal phenyl diazenyl-3-hydroxy-1h-inden-1-one azo derivatives and their metal complexes. J. Mol. Struct. 2020, 1227, 129574. [Google Scholar] [CrossRef]
- Ahmad, K.; Nazir, M.A.; Qureshi, A.K.; Hussain, E.; Najam, T.; Javed, M.S.; Shah, S.S.A.; Tufail, M.K.; Hussain, S.; Khan, N.A.; et al. Engineering of Zirconium based metal-organic frameworks (Zr-MOFs) as efficient adsorbents. Mater. Sci. Eng. B 2020, 262, 114766. [Google Scholar] [CrossRef]
- Stromer, B.S.; Woodbury, B.; Williams, C.F. Tylosin sorption to diatomaceous earth described by Langmuir isotherm and Freundlich Isotherm models. Chemosphere 2018, 193, 912–920. [Google Scholar] [CrossRef]
- Bajaj, K.; Sakhuja, R. Benzotriazole: Much More Than Just Synthetic Heterocyclic Chemistry. zole: Much more than just synthetic heterocyclic chemistry. In The Chemistry of Benzotriazole Derivatives; Springer: Cham, Switzerland, 2015; pp. 235–283. [Google Scholar] [CrossRef]
- Dong, R.Y.; Dong, Y.; Li, Q.; Wan, C. Ballistic-diffusive phonon transport in cellulose nanocrystals by ReaxFF molecular dynamics simulations. Int. J. Heat Mass Transf. 2019, 148, 119155. [Google Scholar] [CrossRef]
- Široká, B.; Manian, A.P.; Noisternig, M.F.; Henniges, U.; Kostic, M.; Potthast, A.; Griesser, U.J.; Bechtold, T. Wash-dry cycle induced changes in low-ordered parts of regenerated cellulosic fibers. J. Appl. Polym. Sci. 2012, 126, E397–E408. [Google Scholar] [CrossRef]
- Rajabi, M.; Mahanpoor, K.; Moradi, O. Preparation of PMMA/GO and PMMA/GO-Fe3O4 nanocomposites for malachite green dye adsorption: Kinetic and thermodynamic studies. Compos. Part B Eng. 2019, 167, 544–555. [Google Scholar] [CrossRef]
- Zhang, X.; Yu, H.; Yang, H.; Wan, Y.; Hu, H.; Zhai, Z.; Qin, J. Graphene oxide caged in cellulose microbeads for removal of malachite green dye from aqueous solution. J. Colloid Interface Sci. 2014, 437, 277–282. [Google Scholar] [CrossRef]
- Gharbani, P. Synthesis of polyaniline-tin(II)molybdophosphate nanocomposite and application of it in the removal of dyes from aqueous solutions. J. Mol. Liq. 2017, 242, 229–234. [Google Scholar] [CrossRef]
- Altintig, E.; Onaran, M.; Sarı, A.; Altundag, H.; Tuzen, M. Preparation, characterization and evaluation of bio-based magnetic activated carbon for effective adsorption of malachite green from aqueous solution. Mater. Chem. Phys. 2018, 220, 313–321. [Google Scholar] [CrossRef]
- Mashkoor, F.; Nasar, A. Preparation, characterization and adsorption studies of the chemically modified Luffa aegyptica peel as a potential adsorbent for the removal of malachite green from aqueous solution. J. Mol. Liq. 2018, 274, 315–327. [Google Scholar] [CrossRef]
- Jiang, F.; Dinh, D.M.; Hsieh, Y.-L. Adsorption and desorption of cationic malachite green dye on cellulose nanofibril aerogels. Carbohydr. Polym. 2017, 173, 286–294. [Google Scholar] [CrossRef] [PubMed] [Green Version]
- Arabkhani, P.; Asfaram, A. Development of a novel three-dimensional magnetic polymer aerogel as an efficient adsorbent for malachite green removal. J. Hazard. Mater. 2019, 384, 121394. [Google Scholar] [CrossRef] [PubMed]
- Mobarak, M.; Mohamed, E.A.; Selim, A.Q.; Eissa, M.; Seliem, M.K. Experimental results and theoretical statistical modeling of malachite green adsorption onto MCM–41 silica/rice husk composite modified by beta radiation. J. Mol. Liq. 2018, 273, 68–82. [Google Scholar] [CrossRef]
Figure 1.
The preparation of MDG.

Figure 2.
DG fiber (−1 1 0) surface optimized cell structure. (a) front view, (b) Top view.

Figure 3.
Cell structure of MDG fiber (−1 1 0) surface optimization. (a) front view, (b) Top view.

Figure 4.
(a) MG molecules (b) MDG fiber optimized configuration.

Figure 5.
(a) FTIR spectra of DG and MDG (b) XRD patterns of DG and MDG.

Figure 6.
EDS images of (a) DG and (b) MDG.

Figure 7.
SEM images of (a) DG and (b) MDG.

Figure 8.
(a) N2 adsorption-desorption isotherm and (b) pore size distribution of DG and MDG.

Figure 9.
(a) Effect of pH on adsorption performance of MDG and (b) zeta potential analysis of DG and MDG.
Figure 9.
(a) Effect of pH on adsorption performance of MDG and (b) zeta potential analysis of DG and MDG.

Figure 10.
The photograph of (a) MG solution, (b) DG, and (c) MDG adsorption of MG solution.

Figure 11.
Effect of the amount of adsorbent on the adsorption performance of MDG.

Figure 12.
Regeneration properties of MDG.

Figure 13.
The effect of time on adsorption capacity at different temperatures.

Figure 14.
(a) Pseudo-first order and (b)pseudo-second order and (c) intra-particle diffusion kinetic models of MDG on adsorption of MG solution at different temperatures.
Figure 14.
(a) Pseudo-first order and (b)pseudo-second order and (c) intra-particle diffusion kinetic models of MDG on adsorption of MG solution at different temperatures.


Figure 15.
The effect of initial concentration of MG on (a) adsorption capacity and (b) adsorption removal rate at different temperatures.
Figure 15.
The effect of initial concentration of MG on (a) adsorption capacity and (b) adsorption removal rate at different temperatures.

Figure 16.
Langmuir, Freundlich, and Temkin isotherm model of MDG on adsorption of MG solution at (a) 298K, (b) 303K and (c) 308K.
Figure 16.
Langmuir, Freundlich, and Temkin isotherm model of MDG on adsorption of MG solution at (a) 298K, (b) 303K and (c) 308K.

Figure 17.
Thermodynamic analysis of MDG on adsorption of MG solution at different temperatures.

Figure 18.
Adsorption energy of different adsorption configurations of MG molecules adsorbed by DG/MDG fiber (−1 1 0) surface.
Figure 18.
Adsorption energy of different adsorption configurations of MG molecules adsorbed by DG/MDG fiber (−1 1 0) surface.

Figure 19.
DG fiber (−1 1 0) surface and single MG molecular simulation (structure B) adsorption configuration.
Figure 19.
DG fiber (−1 1 0) surface and single MG molecular simulation (structure B) adsorption configuration.

Figure 20.
MDG fiber (−1 1 0) surface and single MG molecular adsorption simulation (structure C) configuration.
Figure 20.
MDG fiber (−1 1 0) surface and single MG molecular adsorption simulation (structure C) configuration.


Table 1.
The pore structure parameters of DG and MDG.
| Sample | BET Surface Area (m2/g) | Pore Volume (cm3/g) | Average Pore Size (nm) |
|---|---|---|---|
| DG | 1.12 | 6.4 × 10⁻⁵ | 29.47 |
| MDG | 3.54 | 12.1 × 10⁻⁵ | 21.03 |
Table 2.
The adsorption performance parameters of DG and MDG on MG solution.
| Sample | η(%) | qe(mg/g) |
|---|---|---|
| DG | 50.04 | 7.67 |
| MDG | 96.38 | 14.78 |
Table 3.
Adsorption kinetic model parameters of Pseudo-first kinetic model pseudo-second kinetic model and intra-particle diffusion kinetic mode.
Table 3.
Adsorption kinetic model parameters of Pseudo-first kinetic model pseudo-second kinetic model and intra-particle diffusion kinetic mode.
| Table. | qe,exp | First-Order Kinetic Model | Second-Order Kinetic Model | Intra-Particle Diffusion Kinetic Model | ||||||
|---|---|---|---|---|---|---|---|---|---|---|
| k1 | qe,ca | R2 | k2 | qe,cal | R2 | kd | qe,cal | R2 | ||
| 298K | 37.50 | 0.009 | 1.79 | 0.141 | 0.006 | 38.01 | 0.998 | 0.195 | 34.69 | 0.967 |
| 303K | 38.01 | 0.007 | 0.36 | −0.090 | 0.029 | 38.08 | 0.999 | 0.181 | 35.43 | 0.935 |
| 308K | 38.19 | 0.003 | 0.97 | −0.097 | 0.287 | 37.66 | 0.999 | 0.028 | 38.14 | 0.969 |
Table 4.
Langmuir, Freundlich, and Temkin adsorption isotherm model parameters.
| T(K) | Langmuir Equation | Freundlich Equation | Temkin Equation | ||||||
|---|---|---|---|---|---|---|---|---|---|
| qm(mg/g) | KL(mL/g) | R2 | KF(mg/g) | 1/nF | R2 | αT(L/mg) | βT(J/mol) | R2 | |
| 298 | 261.48 | 0.042 | 0.938 | 21.87 | 0.52 | 0.972 | 0.36 | 41.24 | 0.925 |
| 303 | 280.68 | 0.038 | 0.944 | 18.41 | 0.58 | 0.992 | 0.35 | 39.41 | 0.921 |
| 308 | 367.39 | 0.017 | 0.945 | 17.35 | 0.58 | 0.984 | 0.37 | 43.74 | 0.893 |
Table 5.
Adsorption thermodynamic parameters.
| C0/(mg·L−1) | ΔH0/(kJ·mol−1) | ΔS0/(J·mol·K) | ΔG0/(kJ·mol−1) | ||
|---|---|---|---|---|---|
| 298 K | 303 K | 308 K | |||
| 200 | 22.54 | 91.39 | −4.76 | −5.01 | −5.68 |
| 400 | 0.45 | 12.56 | −3.16 | −3.64 | −3.28 |
| 600 | 12.82 | 51.46 | −2.46 | −3.28 | −2.97 |
Table 6.
DG and MDG AC simulated adsorption interaction.
| DG Adsorption Model | MDG Adsorption Model | |
|---|---|---|
| Adsorption density configuration |  |  |
| Single cell adsorption molecule numbers | 2 | 6 |
| Van der Waal (kcal/mol) | −82.482 | −421.565 |
| Static energy (kcal/mol) | −156.236 | −120.514 |
| Binding energy (kcal/mol) | 238.718 | 542.079 |
Table 7.
Comparison of the developed MDG with the other reported materials for removal of MG.
| Adsorbent | Dye | Adsorption Efficiency | qmax (mg/g) | Reference |
|---|---|---|---|---|
| Poly (methyl methacrylate)/graphene oxide-Fe3O | MG | 92% | 3–3.5 | [57] |
| GO/cellulose bead composite (5 wt%-GOCB) composite | MG | >96% | 17.86 | [58] |
| PANI-HCl/TMP nanocomposite | MG | 75–100% | 78.9 | [59] |
| Magnetic Activated Carbon | MG | 96% | 106.5 | [60] |
| NaOH modified Luffa aegyptiaca peel | MG | 90% | 161 | [61] |
| Ultra-light weight aerogels | MG | 92% | 212.7 | [62] |
| Three D MBCNF/GOPA | MG | 93% | 270.27 | [63] |
| β–MCM-41 silica/RH composite | MG | 29.68–97.11% | 285 | [64] |
| Modified distiller’s grains(MDG) | MG | 96.51% | 367.39 | This study |
Publisher’s Note: MDPI stays neutral with regard to jurisdictional claims in published maps and institutional affiliations. |
© 2022 by the authors. Licensee MDPI, Basel, Switzerland. This article is an open access article distributed under the terms and conditions of the Creative Commons Attribution (CC BY) license (https://creativecommons.org/licenses/by/4.0/).
Share and Cite
MDPI and ACS Style
Li, C.; Kong, D.; Yao, X.; Ma, X.; Wei, C.; Wang, H. Adsorption Characteristics and Molecular Simulation of Malachite Green onto Modified Distillers’ Grains. Water 2022, 14, 171. https://doi.org/10.3390/w14020171
AMA Style
Li C, Kong D, Yao X, Ma X, Wei C, Wang H. Adsorption Characteristics and Molecular Simulation of Malachite Green onto Modified Distillers’ Grains. Water. 2022; 14(2):171. https://doi.org/10.3390/w14020171
Chicago/Turabian StyleLi, Chengtao, Deyi Kong, Xiaolong Yao, Xiaotao Ma, Chunhui Wei, and Hong Wang. 2022. "Adsorption Characteristics and Molecular Simulation of Malachite Green onto Modified Distillers’ Grains" Water 14, no. 2: 171. https://doi.org/10.3390/w14020171
Note that from the first issue of 2016, this journal uses article numbers instead of page numbers. See further details here.