
Economic Contributions of Visitor Spending in Ocean Recreation in the Florida Keys National Marine Sanctuary


School of Natural Resources, West Virginia University, Morgantown, WV 26506, USA
*
Author to whom correspondence should be addressed.
Water 2022, 14(2), 198; https://doi.org/10.3390/w14020198
Submission received: 26 October 2021
/
Revised: 20 December 2021
/
Accepted: 7 January 2022
/
Published: 11 January 2022
(This article belongs to the Special Issue The Blue Economy: Evaluating the Human Benefits from and Pressures on Marine and Coastal Environments)
Abstract
:Understanding the economic value of marine sanctuaries such as the Florida Keys National Marine Sanctuary (FKNMS) is important to justify public and private investments and to provide information to support management activities and understand their role in the nation’s blue economy. Very few studies have employed economic contribution analysis in examining economic value, even though it is more useful in influencing the behaviors of decision makers. This study therefore employs such a methodology to determine the economic importance of tourism and visitor spending in the sanctuary to Monroe County, Florida’s economy. Visitors who came to the area for ocean recreation and tourism spent a total of USD 1.7 billion, which translates to a contribution of 19,688 total jobs, USD 752 million in total labor income, USD 1.2 billion in total value added, and USD 2 billion in total output to the region. With regard to the spending of snorkelers and divers only, total spending is about USD 1.07 billion, contributing about 12,441 total jobs, USD 466 million in total labor income, USD 767 million in total value added, and USD 1.2 billion in total output. Ocean recreation is therefore an important economic driver in the region and efforts should be directed at protecting the diverse and sensitive ecosystem of the sanctuary.
1. Introduction
There has been growing interest in quantifying the ocean economy due to its role in local, national, and international economies. It has been suggested that ocean-based industries have potential contributions to the global economy in terms of value added and employment, contributing more than double to global value added or reaching over USD 3 trillion between 2010 and 2030 [1]. In another study, the annual gross marine product value based on the value of the oceans’ total assets globally was estimated to be at least USD 2.5 trillion per year [2]. This includes direct output of the ocean from marine fisheries and the coastal ecosystem, tourism, carbon absorption, and marine trade and transport. However, sustainable and healthy oceans and marine resources are needed for a vibrant ocean economy. Funds or “ocean finance” are therefore needed for investing in governance and initiatives that promote sustainable management of the ocean and its resources [3]. However, current investments in these areas are inadequate due to insufficient public and private funding. For example, funding for effective management of MPAs in the Mediterranean is about USD 776 million short per year [4]. Furthermore, only 2.3% of declared MPAs globally receive adequate funding to be fully protected [5]. The overall contribution of MPAs to the ocean economy needs to be understood and measured more comprehensively than it currently is to receive appropriate and adequate funds [3].
In the United States (U.S.), national marine sanctuaries are a category of MPAs that were specifically established to protect unique and nationally significant marine resources. Marine sanctuaries are part of a larger network called the National Marine Sanctuary System consisting of fifteen national marine sanctuaries and two marine national monuments and encompassing more than 600,000 square miles of marine and Great Lakes waters [6]. Conservation, research and monitoring, and educational and outreach efforts are being carried out in the system by working with diverse partners and stakeholders. Through the National Marine Sanctuaries Act, these areas are being protected not only to preserve the scenic beauty, biodiversity, and historical connections that they provide, but also for their role in promoting economic development in local economies through recreation and tourism. Just like the economic significance of MPAs globally, these national marine sanctuaries in the U.S. hold potential to generate billions of dollars in value for local economies across many sectors (e.g., tourism, research, diving, etc.) each year, contributing to the region and the nation’s ocean economy.
Given the ecological and economic importance of marine sanctuaries, these areas must be protected and managed, but such efforts require considerable investments by both federal and local governments, local partners, and stakeholders. Therefore, understanding the economic value of marine sanctuaries is not only important to justify public and private investments and to provide information to support management activities [7], but understanding their overall contribution to the ocean economy is important to secure adequate funding for their sustainable management. In addition, marine sanctuary resources are economic resources that are scarce and have competing uses; thus, determining value can inform policy makers and other management decision makers of the tradeoffs of alternative uses or economic importance of different choices [8]. There are different methods available to determine the value of natural and environmental resources (e.g., marine sanctuaries), including cost–benefit analysis (CBA), economic impact analysis/contribution analysis, cost-effectiveness analysis, and natural resource damage assessment. The approach chosen depends on “what decision makers want to know, the kind of analysis a statute might call for, and just what gains and losses can be measured” [9]. If the interest is determining total societal values, CBA analysis is usually used. However, if the interest is determining the economic impact to demonstrate a financial contribution to the local community, economic impact/contribution analysis is more appropriate [10]. Most studies related to coastal areas have focused on valuing ecosystem services using CBA, but there is little evidence that these results are used to inform decision-making processes [11,12]. Contribution analyses are found to be more useful in influencing behaviors of decision makers and stakeholders. Contribution analysis has been found to be a more effective communication of economic value, as it touches on job contributions, which decision makers and stakeholders find to be useful in gaining support for actions protecting these reserves and investing in them [12]. It is important to note the difference between economic contribution and economic impact. Economic contribution and economic impact have been used interchangeably in some instances, which could be misleading. Economic contribution is the gross change in economic activity associated with an industry, event, or policy in a region, while economic impact is the net change in new economic activity associated with an industry, event, or policy in that region [13]. That is, economic contribution simply tracks the gross economic activity associated with ocean recreation as dollars cycle through the region’s economy, while economic impact looks at new revenues from ocean recreation that would not be in the region were it not for the sanctuary.
Economic contribution analyses have been used to examine the economic importance of tourism and visitor spending in state and national parks and outdoor recreation activities [10,14,15,16,17,18], but few studies have examined the economic contributions or impacts of MPAs and other similar natural areas [12,19,20]. Even fewer studies on actual economic contributions of the national marine sanctuaries are available. For example, the economic contribution to regional economies of Hawaiian Islands Humpback Whale National Marine Sanctuary and Stellwagen Bank National Marine Sanctuary were examined but focused on whale watching only [21,22]. A more recent study on Channel Islands National Sanctuary was also conducted but only focused again on whale watching [23]. While whale watching contributes to the regional economies of these sanctuaries, other ocean recreation activities also play an important role in the regional economies of national marine sanctuaries. Visitor studies [24,25,26,27] that track the number of visitors and visitor spending have been conducted in the Florida Keys National Marine Sanctuary (FKNMS) in Monroe County, Florida, but these studies focused mostly on trips to the sanctuary in general (both land-based and water-based activities); however, it is interesting to examine the role of ocean recreation given the popularity of the area in providing ocean recreation and tourism activities.
FKNMS is one of the important economic drivers of the region’s economy, providing a variety of ocean recreation and tourism activities such as scuba diving, snorkeling, swimming, fishing, and scenic viewing. Thus, the main research question this study seeks to answer is what is the magnitude of the contribution of FKNMS to the region’s economy from ocean recreation? This is addressed through the following specific objectives:
- Examine the spending patterns of visitors who are involved in ocean recreation in the FKNMS.
- Estimate the economic contribution of visitor spending on ocean recreation in FKNMS to the local economy.
Studies such as this can provide governments with “baseline information on the economic contribution from oceans for national ocean investment, planning and protection strategies” [28] and can be used to justify adequate funding for MPAs. This is particularly important for FKNMS, as its protected waters play ecologically and economically important roles not only regionally but nationally and, therefore, continued investment in its protection is critical. In addition, adequate funding is important to increase the competencies in sustainably managing FKNMS for a sustainable ocean economy in the region.
2. Materials and Methods
The succeeding subsections describe the project study area and the methods employed to address the objectives.
2.1. Study Area
The study area is the Florida Keys National Marine Sanctuary located in Monroe County, Florida. FKNMS is one of 15 national marine sanctuaries in the U.S., which protects 3800 square nautical miles of state and federal waters surrounding the Florida Keys, from south of Miami westward to encompass the Dry Tortugas, excluding Dry Tortugas National Park. It was designated a national marine sanctuary in 16 November 1990 and is jointly managed by the National Oceanic and Atmospheric Administration (NOAA) and the state of Florida [7]. This marine sanctuary includes North America’s only coral barrier reef, extensive seagrass bed, mangrove-fringed islands, and more than 6000 species of marine life, and it protects pieces of the country’s history such as shipwrecks and other archeological treasures. Figure 1 shows the location of FKNMS including the cities and representative island districts in the area.
2.2. Economic Contribution Analysis Method
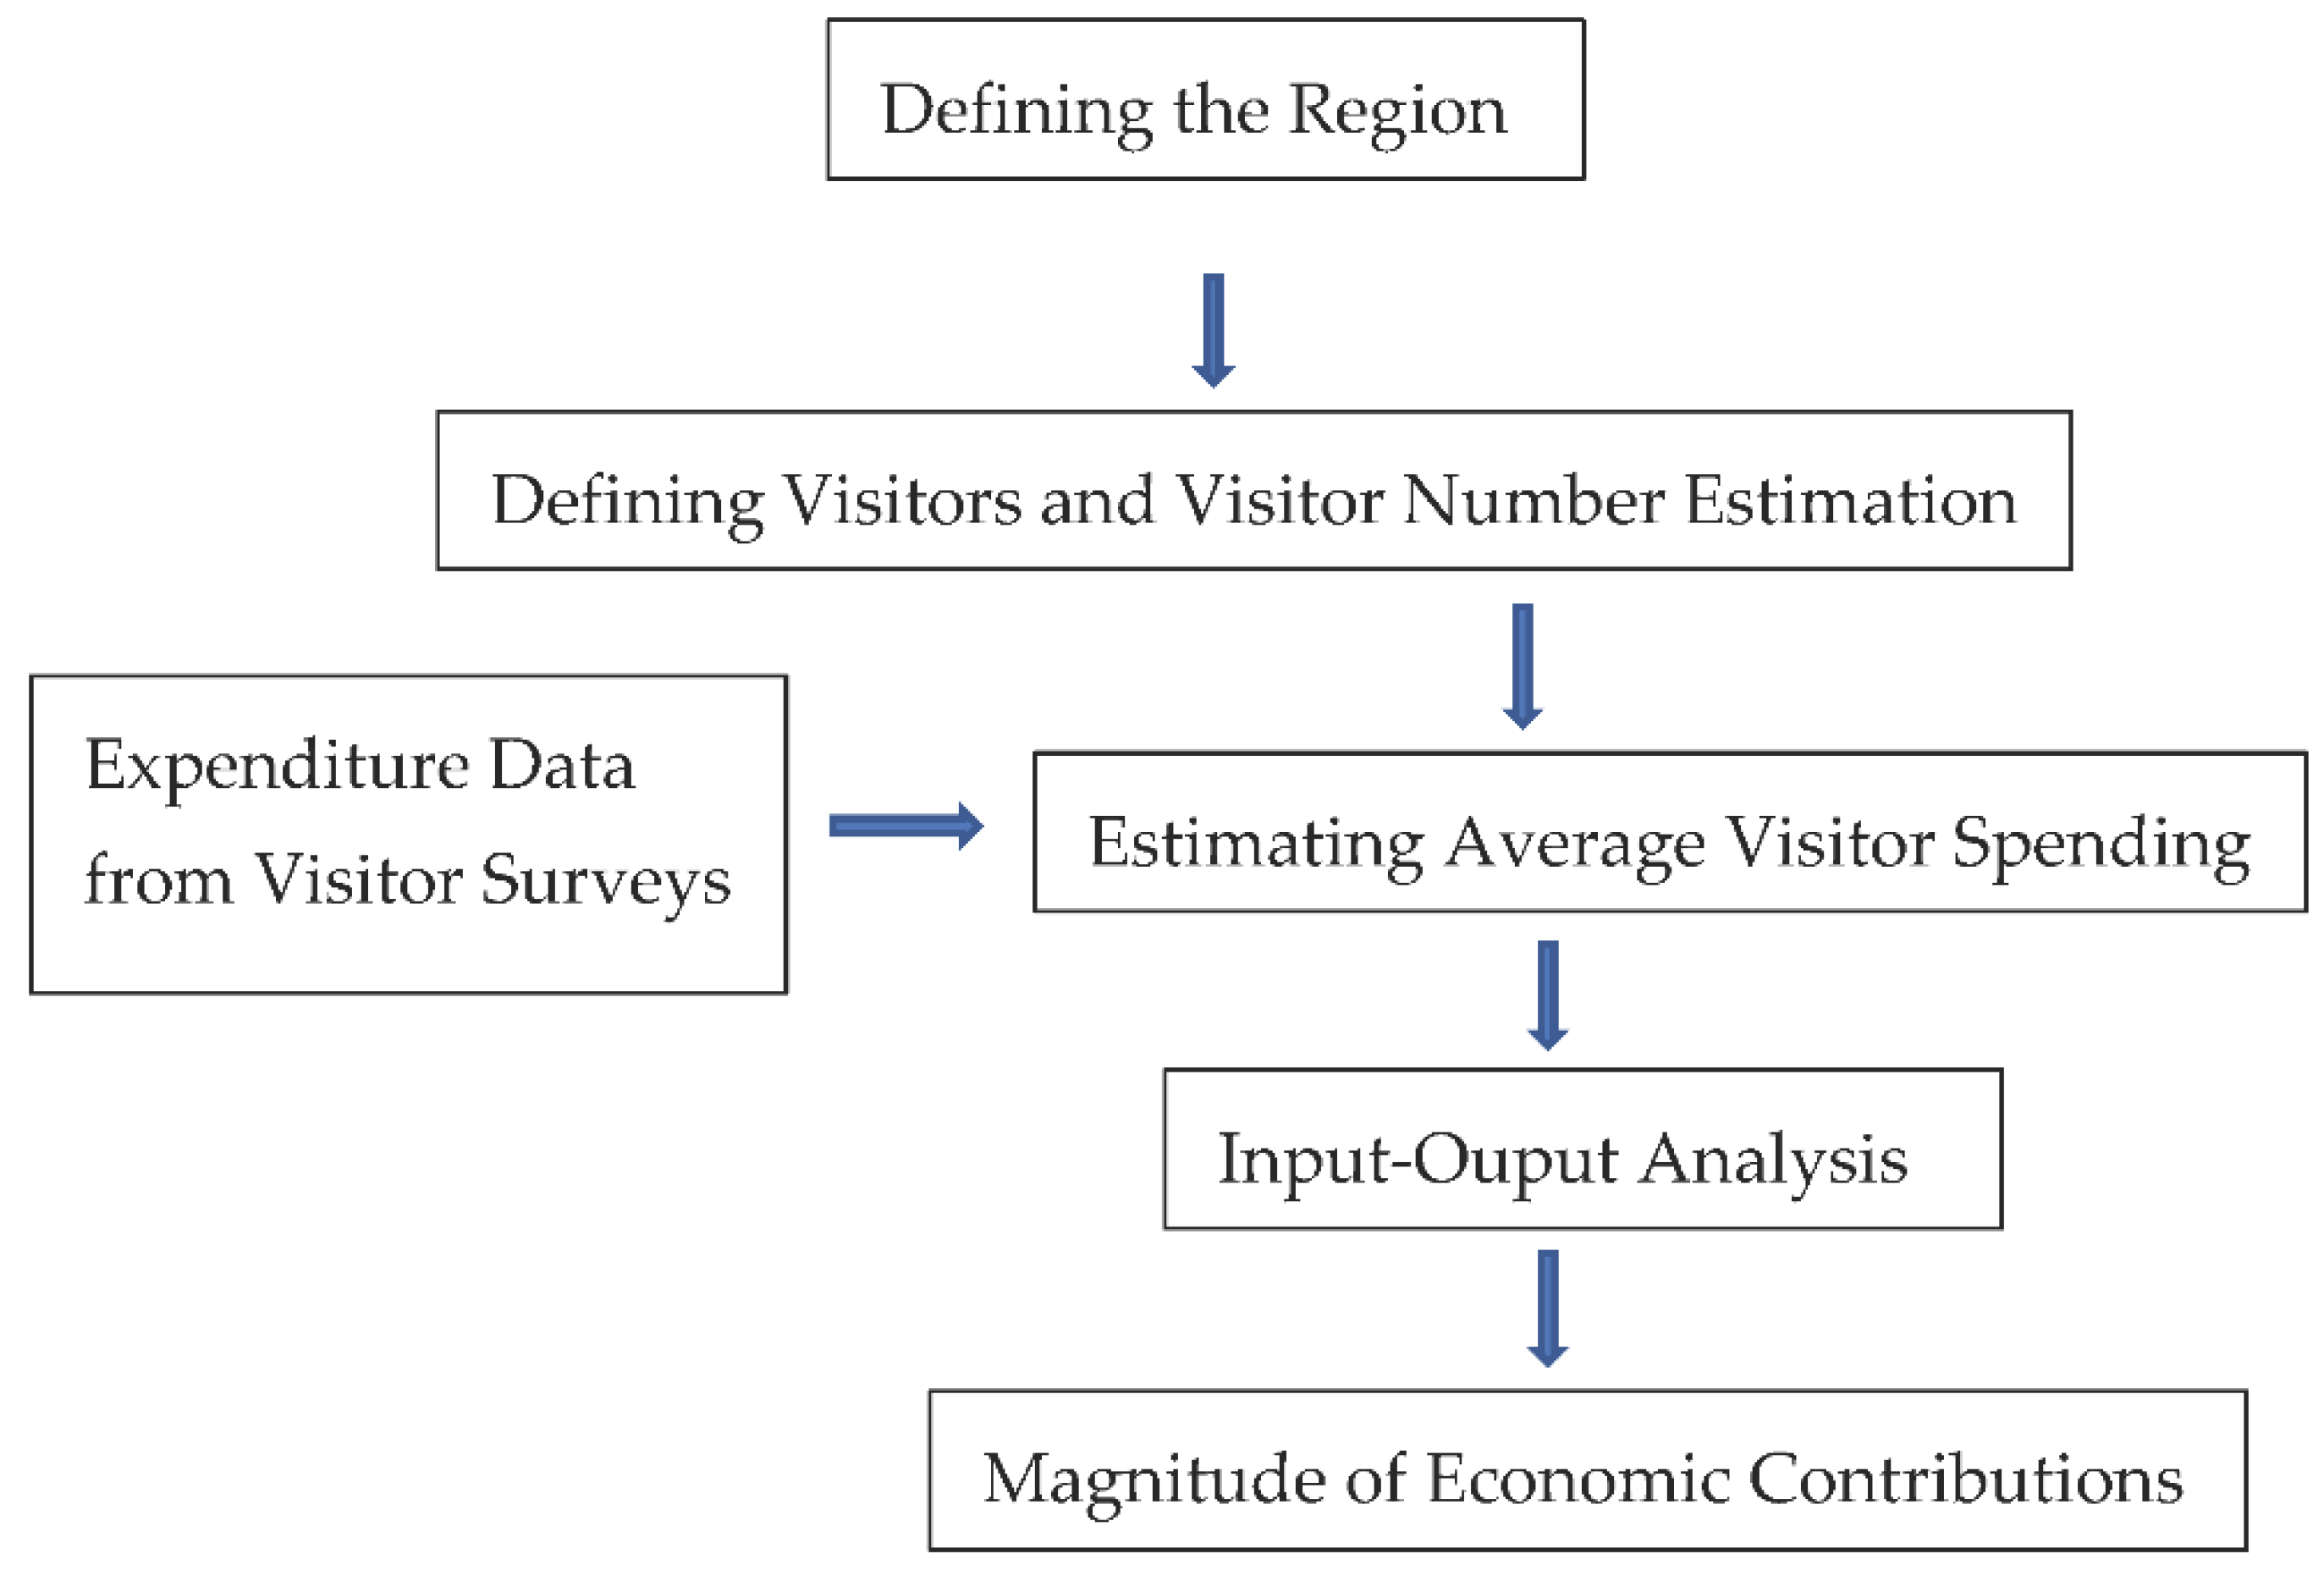
To address the objectives of this study, economic contribution analysis, which is an input–output modelling technique based on the Leontief model, was employed. The flow-chart (Figure 2) below illustrates how this methodology works [15,29]:
The economic contribution of visitor spending on all ocean recreation activities associated with the FKNMS was estimated, as well as the economic contribution that is attributable to diving and snorkeling only. Snorkeling and diving are popular activities in the sanctuary. In 2019, about 53% of the visitors to the sanctuary participated in snorkeling and about 21% participated in diving [30].
2.2.1. Defining the Region
It is important to define the “region” of analysis in an input–output model. In this case, the region is the county where the FKNMS is located, which is Monroe County, Florida.
2.2.2. Defining Visitors and Visitor Number Estimation
For economic contribution analysis, “visitors” include both local and non-local residents; thus, this study includes all visitors to the FKNMS who participated in ocean recreation whether they are permanent residents, seasonal residents, or visitors to Monroe County. Ocean recreation in this study refers to activities that are in the water not including swimming very close to the shore. Examples would be fishing, diving, snorkeling, and boating. The average number of visitors annually in the area from 2014–2018 was about 5.04 million [31]. However, these include all visitors who participated in both land-based and water-based/ocean-based recreation. Since this study focuses only on ocean recreation, the percentage of visitors that engaged in ocean recreation was used to calculate how many of the 5.04 million total visitors were engaged in ocean recreation. About 46% of the total visitors in FKMNS participated in ocean recreation in 2019 [29]. Using this percentage, this corresponds to about 2.3 million visitors who participated in ocean recreation in the study. Similarly, the total number of visitors who participated in snorkeling and diving was estimated based on the percentage of visitors who participated in these activities. About 37% of the total visitors participated in snorkeling or diving in 2019 [29], equivalent to about 1.86 million visitors. These visitor estimates were used as the total visitor inputs for the contribution analyses.
2.2.3. Expenditure Data from Visitor Surveys
With regard to visitor spending, 2 sets of visitor surveys were conducted to collect expenditure data:
- (1)
- Visitor survey for visitors who participated in all ocean recreation activities—this survey instrument was developed as a way to inform visitor counting across remote protected areas in ocean settings. The survey was designed to work within the NMS-COUNT process [32] and was more focused on identifying general user characteristics with respect to visitation patterns, trip characteristics, and expenditures.
- (2)
- Visitor survey for visitors who participated in diving and snorkeling—this survey instrument was designed to collect similar visitor data and characteristics related to trip patterns and expenditures in the Florida Keys, but was focused on users who identified as snorkelers and/or scuba divers. This survey was deployed as a way to collect more activity-focused data to assist the Monroe County Tourism Development Council in addressing their objectives to better understand those activity segments related to tourism expenditures in the Florida Keys.
The survey data collection methodology included online surveys that were distributed using Qualtrics survey software. This study followed the Dillman method [33], which describes the most desirable web surveying practices to minimize bias and error sources. The distributions began in May 2020 to collect 2019 expenditure data, using email addresses that were sent to contacts obtained from the Florida Fish and Wildlife Conservation Commission for people who held natural resource-related licenses or permits related to ocean activities (fishing, crabbing, boating, etc.) in 2019–2020. Each email included a personalized link to the survey hosted online by Qualtrics, and a description of the purpose of the project and the data collection. Further distributions and reminder messages were sent within following weeks. The last distribution was sent in July 2020. The total potential audience size for both survey instruments based upon relevant email contacts was 89,078 across all distributions. However, there was a percentage of email addresses that bounced and another percentage of emails addresses that failed. As indicated in the Dillman method, we sent one reminder email to the unfinished respondents once a week, for two weeks (i.e., every distribution had two reminders). From the larger potential audience size, 3063 effective survey contacts were established. Effective survey contacts are represented as those recipients who received the email to a legitimate email address and opened the email (was not sent to junk mail folder, etc.). From those effective survey contacts, we received 2421 completed surveys across both survey instruments, for an effective response rate of 79%.
The average level of spending of the visitors in the local area was calculated from the expenditure data collected from the surveys. Since respondents reported group expenditures for a typical visit or trip to the FKNMS, per person per trip expenditures were calculated by dividing the average group spending by the average number of people in a group, which is about 4 persons. Other visitor studies in the area also reported an average of 4 people or visitors in a party or group [29]. Average expenditures were calculated for each expenditure category reported by the respondents. However, for expenditures categorized as “Other Expenses”, these were allocated to an appropriate specific category (e.g., lodging, food, etc.) based on the description given by the respondents. If no description was provided, the expenditure was allocated equally to the different categories where the respondent had reported expenses. Allocating expenses to a specific category is necessary for conducting contribution analysis. Average visitor spending by season and by areas in the FKNMS was calculated and compared using ANOVA and Tukey’s HSD test. In addition to information on visitor spending, divers and snorkelers were also specifically asked how much more they would be willing to spend if additional funds went to coral restoration and cleanup of trash/marine debris. Average additional spending values were compared between permanent residents/seasonal residents and nonresidents using t-tests.
2.2.4. Input–Output Analysis
IMPLAN economic modeling software was used to perform the input–output analysis to estimate economic contributions with 2017 IMPLAN (Version 3.1) data. IMPLAN is an input–output modeling system based on the work of Nobel Laureate Wassily Leontief (Leontief model) from the 1930s that maps out the buy–sell relationships of industries, households, and governments in the economy using annual, regional data so users can predict how specific economic changes will impact a given regional economy or estimate the effect of past or existing economic activity [34]. That is, it allows for the estimation of the impact or contribution of potential, forgone, or existing economic activities in a given region. IMPLAN expands upon the traditional input–output model by including transactions between industries and institutions and between institutions themselves, thereby capturing all monetary transactions in a given time period, or what is called the Social Accounting Matrix (SAM) model [35]. Models can be customized through the selection of the IMPLAN dataset, the modeling approach with which the regional purchasing coefficients are constructed, and the customization of the Social Accounting Matrix (SAM) that underlies the input–output model. Once the model is built, the industry is defined by choosing any number of 536 individual IMPLAN sectors, where each sector corresponds with one or more North America Industrial Classification System (NAICS) sectors.
Results in IMPLAN for contribution analyses are reported in different economic measures in terms of their direct, indirect, and induced effects. Direct contributions are those that are made directly by the primary industry of study’s operation to meet the final demand for its output. Indirect contributions are those that arise through inter-industry activity that occurs as secondary industries respond to the demand for inputs by the primary industry. Lastly, induced contributions are those that arise from the spending of personal income by the employees and proprietors of businesses within the primary and secondary industries. The sum of these contributions, therefore, make up the total contribution or the gross change in a region’s economy that can be attributed to the primary industry of study [35]. The relationship between an industry’s direct effects and its total effects is represented through an associated multiplier statistic. Through the use of the Social Accounting Matrix (SAM), IMPLAN input–output models are built upon Type SAM multipliers, calculated by dividing the total effects by the direct effects. Type SAM multipliers are a comprehensive representation of the magnitude of the “ripple” effects that are created though the broader economy by direct industry activity. Direct, indirect, and induced effects are reported by IMPLAN for the following measures of industry-specific activity:
- Employment: The number of full-time and part-time jobs.
- Output: The value of industry production or industry sales.
- Value added: The difference between an industry’s output and the cost of its intermediate inputs, which consists of employee compensation, proprietor income, indirect business taxes, and other property-type income.
- Employee compensation: The total payroll cost of wage and salary to the employer.
3. Results
Results of the study are presented below, including visitor expenditures, other spending patterns of visitors, and economic contributions.
3.1. Visitor Expenditures
Individual visitor expenditures collected from the visitor survey of people who engaged in ocean recreation in 2019 (e.g., swimming, fishing, boating, diving, snorkeling) and the corresponding IMPLAN sectors for each expenditure category are presented in Table 1. A typical visitor who came to the FKNMS for ocean recreation in 2019 spent an average of USD 743 per trip or about USD 1.7 billion for all visitors. A majority of the expenditures were spent on lodging (28%) followed by food at restaurants and fees for charter fishing, both at 13% of the total expenditures. Another significant component of total expenditure is local transportation at 10%. Per person expenditures of visitors who came to the FKNMS for snorkeling and diving, and the corresponding IMPLAN sector for each expenditure category, are presented in Table 2. Snorkelers and divers spent about an average of USD 575.79 per person per trip or about USD 1.07 billion in total in terms of spending by all snorkelers and divers. The largest expenditure category for snorkelers and divers is lodging, at 36%, followed by food at restaurants at 16%. Food at grocery stores and local fuel are both at 12% of total expenditures, while local transportation comprised only 3% of total expenditures.
3.2. Other Spending Patterns of Visitors
Spending patterns of visitors by island district and season are presented in Table 3, Table 4, Table 5 and Table 6. With respect to visitors who come to the area for ocean recreation, spending is significantly higher in Key West and Marathon Key and other locations, averaging about USD 209 per person. Visitors spent significantly less in North Key Largo/Old Rhodes Key, averaging only USD 57 per person. For snorkelers and divers, spending was significantly higher in Islamorada/Upper Matecumbe Key, averaging about USD 172 per visitor per trip. Spending in other areas in FKNMS ranged from just under USD 50 to just under USD 100 per person.
With regard to spending by season, spending was significantly higher during the summer, spring, and winter months compared to fall season for visitors who engaged in ocean recreation activities. Specifically, spending during the summer, spring, and winter months ranged from about USD 197 to USD 477 per person, while spending in the fall was about USD 164 per person. However, for snorkelers and divers, spending was significantly higher during the summer months compared to the other seasons, averaging about USD 110 per person per trip. Spending during the spring, fall, and winter months for this group of visitors ranged from USD 44 to USD 75 per person.
Snorkelers and divers were also asked about how much more they would be willing to spend on a single dive/snorkel trip if these additional funds went to coral resptoration and cleanup of trash/marine debris. The average additional amount that permanent/temporary residents and vistors were willing to spend is presented in Table 7. Additional spending for coral restoration was not significantly different between permanent/temporary residents and nonresidents. However, with regard to additional spending for cleanup of trash/marine debris, permanent/temporary residents were willing to spend significantly more compared to nonresidents, averaging about USD 66 in additional spending per person per trip compared to only USD 42 for nonresidents.
3.3. Economic Contributions
Economic contributions of visitors in FKNMS who engaged in ocean recreation are presented in Table 8. These visitors contributed a total of 19,668 jobs to Monroe County and about USD 752 million in total labor income, about USD 1.2 billion in total value added, and USD 2 billion in total output. Economic contributions of divers and snorkelers are presented in Table 9. Divers and snorkelers in the FKNMS in 2019 contributed a total of 12,441 jobs in Monroe County. In terms of total labor income, value added, and output, these segments of visitors contributed about USD 466 million, USD 767 million, and USD 1.2 billion, respectively, to the local economy. Type SAM mulipliers or the “ripple” effects that are created by the direct industry activity, for both sets of visitors for all categories of impacts, are all below 2. For example, the output multiplier of 1.54 means that a USD 1 increase in sales will result in a total of USD 1.54 increase in output in the region.
4. Discussion
The blue economy is a “growth opportunity for both states and national economies” [36]. The ocean plays a significant role in the nation’s blue economy, contributing about USD 307 billion to U.S. GDP and supporting 3.3 million jobs [37]. Tourism and recreation make up 73% of that total employment contribution and 42% of the GDP. Florida’s ocean and coastal resources play a significant role in the state’s blue economy. For example, Florida is second to only California as a top contributor in ocean tourism and recreation jobs and GDP across the country. Ocean tourism and recreation also make up the majority (71%) of the state’s economic contribution among the various industries connected to the state’s ocean and coastal resources [36]. FKNMS, with its vast marine resources, contributes to the state’s blue economy. This study examines the spending patterns of visitors to the FKNMS as well the as economic contributions of visitor spending in Monroe County, FL, which is the region of analysis. While economic contributions of tourism and visitor spending in the region have been evaluated [27,29], this study focuses on a major component of tourism offered by the FKNMS—ocean recreation and tourism. It shows how spending on ocean recreation and tourism provided by the various resources within the FKNMS stimulates the local economy and is therefore an important driver of economic growth in the region.
The findings of this study illustrate that visitors who came in the area for ocean recreation and tourism spent a total of USD 1.7 billion. A previous study reported total spending in the region for both land-based and ocean-based activities to be at USD 2.4 billion [29]. Since this study focuses only on ocean-based recreation, total spending is less than that reported in the region. Thus, while the FKNMS offers many activities for tourists, ocean recreation and tourism are significant components, comprising about 88% of total estimated tourism spending in the region. With regard to spending of snorkelers and divers, total spending is about USD 1.07 billion or about 45% of the total estimated tourism spending in the region. In terms of spending by category, the findings from this study are consistent with other studies [26,27,29] in the region, which show that visitors spend most on lodging and food. The same is true for snorkelers and divers. In terms of spending by island district, ocean recreation visitors spent the most in the Key West and Marathon Island areas. In 2018, Key West and Marathon Island also received the most visitor spending at USD 1.1 billion and USD 457 million, respectively [29]. This information indicates the relative significance of these island districts in the FKNMS regional economy. With regard to spending by season, visitors spent considerably more in the summer months, which is expected as there are more activities available for visitors to engage in and the occurrence of traditional vacation periods for people in North America. Information on seasonal variation in tourism demand is an important consideration when managing destinations [38]. Since summer months are a key tourist season in the area, visitor experiences during this season can play a major role in influencing the economic contribution of tourism in recreation in the region.
The National Marine Sanctuary System has an annual program budget around USD 55 million [39], and the FKNMS sanctuary receives about USD 5 million annually for its management. Given its economic significance to the region, it warrants continued support from the government. The USD 1.7 billion in spending from 2.3 million visitors in the FKNMS on ocean-based recreation results in about USD 2 billion in total output that stays in the region. Other MPAs in the U.S. that have fewer total visitors (400,000–1,000,000 visitors) reported an economic contribution in the range of USD 46–57 million [12]. The results from this study therefore highlight the importance of the FKNMS in providing ocean recreation and tourism in the region. More specifically, the economic contributions of spending on ocean recreation and tourism are significant to the contribution of all tourism and recreation spending in the area. For example, in terms of total employment, ocean recreation and tourism contribute about 19,668 jobs in Monroe County compared to 26,500 total jobs from spending in all tourism and recreation activities [29]. Thus, about 74% of the jobs created by tourist spending can be attributed to ocean recreation and tourism or about 36% can be attributed specifically to snorkelers and divers. In terms of total labor income and value added, spending on ocean recreation and tourism represents 80% (or 49% for snorkelers and divers) and 66% (or 42% for snorkelers and divers), respectively, of the economic contributions from all tourism and recreation spending.
Snorkeling and diving are major ocean-based activities in FKNMS, with significant economic contributions relative to all ocean-based activities in the region. For example, the results show that the total economic contribution of snorkeling and diving is about 60–64% of the total economic contributions from all ocean-based activities in terms of jobs, labor income, value added, and output. A previous study focusing only on reef-related snorkeling and diving also showed that Monroe County is one of the top-ranking counties in terms of its economic impacts on the local economy [40]. Diving and snorkeling therefore represent important economic resources not only for the region but for the state. There are about 2.7 to 3.5 million active scuba divers and about 11 million snorkelers in the U.S. [41]. Participation in these activities is expected to grow as other sectors (e.g., commercial fishing) of the marine economy continue to decline in value [42]. FKNMS can benefit from this given its popularity among divers and snorkelers.
Ocean recreation is therefore an important economic driver in Monroe County and efforts should be directed at protecting the diverse and sensitive ecosystem of the sanctuary. The economy of the region is certainly dependent upon the health of the ecosystem of the sanctuary. Visitor experiences for ocean recreation activities rely heavily on the ecosystem services provided by the sanctuary; thus, maintaining the health of the FKNMS should be a priority. However, several factors such as loss of coral, seagrass, and mangrove ecosystems; pollution from nutrients and marine debris; and climate change in general threaten the health of the FKNMS [27]. Clean up and restoration efforts are therefore important for the sanctuary to continue to play its role in providing a consistent source of jobs, wages, and economic output not only to the region but to the entire state of Florida. In fact, visitors are willing to spend an additional amount of money for restoration and cleanup efforts. For example, our study shows that snorkelers and divers are willing to pay an extra USD 44–57 per person per trip for coral restoration, and USD 42–66 per person for cleanup efforts. Permanent and temporary residents are even more invested in cleanup efforts, as they are willing to pay more compared to nonresidents.
One of the key issues with conducting economic contribution analysis is making sure accurate visitor expenditure data are collected. Survey data collection was originally planned to be onsite interviews. For more reliable expenditure data, surveys should focus on interviewing visitors as they leave the venue [43]. However, when the COVID-19 pandemic began, surveys were developed for remote distribution (e.g., email). As a result, some expenditure data may not have been accurately reported.
5. Conclusions
This study particularly highlights the economic contribution of ocean-based recreation, which is a significant components of the ocean economy. Results of the study shows that ocean recreation due to the presence of FKNMS in the region contributes significantly more to the region’s economy compared to other tourism-related activities (e.g., land-based) in the area. Management efforts should focus on visitor experiences on ocean recreation and community development activities should focus on sectors that provide services to the various ocean-based activities in the area.
Maintaining demand for ocean tourism in the area by making sure the health of the marine ecosystems is being taken into consideration is therefore important for the area to continue to play its role as a significant economic driver of the region. The results of this study can be used to inform policy makers, managers, and other stakeholders of the sanctuary about its economic importance. This will influence investment and budget decisions, which can further impact the health of the environment and economy of the region. This is particularly important as MPAs are usually not adequately funded to be managed sustainably.
To understand the role of the entire Natural Marine Sanctuary System in the nation’s ocean economy, future efforts should focus on quantifying the economic contributions of the system to the nation’s economy to gain support for government and private funding for these areas. There is currently limited information on the economic values of these sanctuaries. Moreover, the impact of the COVID-19 global pandemic that started in 2020 should also be examined at as it affected tourist travel and therefore tourist spending. In addition, it will also be interesting to investigate the role of the shadow economy in the region in the context of revenues generated from tourism activities (e.g., tax revenues, labor income, etc.) and how it affects budget allocations, as it may impose negative externalities and can therefore have an impact on the contribution of ocean-based tourism activities in the region’s economy. Such analyses will help contribute to a more comprehensive understanding of the economic dynamics of protected marine areas such as FKNMS, and may be scalable to other places in the world, as challenging decisions must be made to allocate funding for conservation, management, and the development of such resources.
Author Contributions
Conceptualization, K.G., R.A. and R.B.; methodology, K.G. and R.A.; software, K.G.; validation, K.G., R.A. and R.B.; formal analysis, K.G.; investigation, K.G., R.A. and R.B.; resources, R.B.; data curation, K.G. and R.A.; writing—original draft preparation, K.G.; writing—review and editing, K.G., R.A. and R.B.; visualization, K.G.; supervision, R.B.; project administration, R.B.; funding acquisition, R.B. All authors have read and agreed to the published version of the manuscript.
Funding
This research was funded by the National Marine Sanctuary Foundation, award number 19-04-B-210.
Institutional Review Board Statement
The data collection in this study was conducted in accordance with University IRB protocol 1902446184 for human subjects survey research.
Informed Consent Statement
Informed consent was obtained from all subjects involved in the study.
Data Availability Statement
The data are not publicly available due to privacy concerns of participants.
Acknowledgments
The authors would like to thank staff at the NOAA Office of National Marine Sanctuaries for their helpful support of the project.
Conflicts of Interest
The funders had no role in the design of the study; in the collection, analyses, or interpretation of data; in the writing of the manuscript, or in the decision to publish the results.
References
- Nguyen, A.T. The Relationship between Tourism and Economic Growth: Evidence from Oceania. J. Tour. Manag. Res. 2020, 7, 32–41. [Google Scholar] [CrossRef] [Green Version]
- Hoegh-Guldberg, O. Reviving the Ocean Economy: The Case for Action—2015; WWF International: Gland, Switzerland; Geneva, Switzerland, 2015. [Google Scholar]
- Sumaila, U.R.; Walsh, M.; Hoareau, K.; Cox, A.; The, L.; Abdallah, P.; Akpalu, W.; Anna, Z.; Benzaken, D.; Crona, B.; et al. Financing a Sustainable Ocean Economy. Nat. Commun. 2021, 12, 3259. [Google Scholar] [CrossRef]
- Binet, T.; Diazabakana, A.; Hernandez, S. Sustainable Financing of Marine Protected Areas in the Mediterranean: A Financial Analysis. Vertigo Lab, MedPAN, RAC/SPA, WWF Mediterranean. 2015. Available online: http://www.rac-spa.org/sites/default/files/doc_medmpanet/final_docs_regional/55_study_on_the_sustainable_financing_of_mediterranean_mpas.pdf (accessed on 25 October 2021).
- Sala, E.; Lubchenco, J.; Grorud-Colvert, K.; Novelli, C.; Roberts, C.; Sumaila, U.R. Assessing Real Progress Towards Effective Ocean Protection. Mar. Policy 2018, 91, 11–13. [Google Scholar] [CrossRef]
- National Oceanic and Atmospheric Administration. National Marine Sanctuaries Home Page. Available online: http://sanctuaries.noaa.gov (accessed on 30 August 2021).
- Leeworthy, V. Economic Impact of Tourist and Resident Uses of Coastal Resources in the Florida Keys: Survey Methods and Impact Assessment Methodology. In Florida Coastal Environmental Resources: A Guide to Economic Valuation and Impact Analysis; Letson, D., Milon, J.W., Eds.; Florida Sea Grant College Program: Gainesville, FL, USA, 2002; ISBN 0-916287-52-1. [Google Scholar]
- Letson, D. Principles of Economic Valuation. In Florida Coastal Environmental Resources: A Guide to Economic Valuation and Impact Analysis; Letson, D., Milon, J.W., Eds.; Florida Sea Grant College Program: Gainesville, FL, USA, 2002; ISBN 0-916287-52-1. [Google Scholar]
- Letson, D. Methods of Economic Analysis. In Florida Coastal Environmental Resources: A Guide to Economic Valuation and Impact Analysis; Letson, D., Milon, J.W., Eds.; Florida Sea Grant College Program: Gainesville, FL, USA, 2002; ISBN 0-916287-52-1. [Google Scholar]
- Saayman, M.; Saayman, A. Estimating the Economic Contribution of Visitor Spending in the Kruger National Park to the Regional Economy. J. Sustain. Tour. 2006, 14, 67–81. [Google Scholar] [CrossRef]
- Torres, C.; Hanley, N. Communicating Research on the Economic Valuation of Coastal and Marine Ecosystem Services. Mar. Policy 2017, 75, 99–107. [Google Scholar] [CrossRef] [Green Version]
- Stokes-Cawley, O.; Stroud, H.; Lyons, D.; Wiley, P.; Goodhue, C. Economic Contribution Analysis of National Estuarine Research Reserves. Water 2021, 13, 1596. [Google Scholar] [CrossRef]
- Watson, P.; Wilson, J.; Thilmany, D.; Winter, S. Determining the Economic Contribution and Impacts: What is the Difference and Why Do We Care? J. Reg. Anal. Policy 2007, 37, 140–146. [Google Scholar]
- Fesenmaier, D.R.; Joneds, L.; Um, S.; Ozuna, T. Assessing the Economic Impact of Outdoor Recreation Travel to Texas Gulf Coast. J. Travel Res. 1989, 28, 18–23. [Google Scholar] [CrossRef]
- Munn, I.A.; Hussain, A.; Spurlock, S.; Henderson, J.E. Economic Impact of Fishing, Hunting, and Wildlife-Associated Recreation Expenditures on the Southeast U.S. Regional Economy: An Input-Output Analysis. Hum. Dimens. Wildl. 2010, 15, 433–449. [Google Scholar] [CrossRef]
- Mowen, A.; Trauntvein, N.; Stynes, D. The Economic Significance and Impact of Pennsylvania State Parks: An Updated Assessment of 2010 Park Visitor Spending on the State and Local Economy; The Pennsylvania State University: University Park, PA, USA, 2012. [Google Scholar]
- Koontz, L.; Thomas, C.C.; Zieler, P.; Olson, J.; Meldrum, B. Visitor Spending Effects: Assessing and Showcasing America’s Investment in National Parks. J. Sustain. Tour. 2017, 25, 1865–1876. [Google Scholar] [CrossRef]
- Highfil, T.; Franks, C. Measuring the U.S. outdoor recreation economy, 2012–2016. J. Outdoor Recreat. Tour. 2019, 27, 100233. [Google Scholar] [CrossRef]
- Pendleton, L.; Krowicki, F.; Strosser, P.; Hallet-Murdock, J. Assessing the Economic Contribution of Marine and Coastal Ecosystem Services in the Sargasso Sea; NI R14-05; Duke University: Durham, NC, USA, 2014. [Google Scholar]
- Smith, M.D.; Wilen, J.E. Economic Impacts of Marine Reserves: The Importance of Spatial Behavior. J. Environ. Econ. Manag. 2003, 46, 183–206. [Google Scholar] [CrossRef] [Green Version]
- Utech, D. Valuing Hawai‘i’s Humpback Whales: The Economic Impact of Humpbacks on Hawai‘i’s Ocean Tour Boat Industry. In The Economic Contribution of Whalewatching to Regional Economies: Perspectives from Two National Marine Sanctuaries; Marine Sanctuaries Conservation Series MSD-00-2; U.S. Department of Commerce, National Oceanic and Atmospheric Administration, Marine Sanctuaries Division: Silver Spring, MD, USA, 2000. [Google Scholar]
- Hoagland, P.; Meeks, A.E. The Demand for Whalewatching at Stellwagen Bank National Marine Sanctuary. In The Economic Contribution of Whalewatching to Regional Economies: Perspectives from Two National Marine Sanctuaries; Marine Sanctuaries Conservation Series MSD-00-2; U.S. Department of Commerce, National Oceanic and Atmospheric Administration, Marine Sanctuaries Division: Silver Spring, MD, USA, 2000. [Google Scholar]
- Shea, R.; Schwarzmann, D.; Leeworthy, V.; Hastings, S.; Knapp, L.; Tracy, S. Whale Watching in Channel Islands National Marine Sanctuary: Understanding Passengers and Their Economic Contributions; National Marine Sanctuaries Conservation Series ONMS-21-08; U.S. Department of Commerce, National Oceanic and Atmospheric Administration, Office of National Marine Sanctuaries: Washington, DC, USA, 2021.
- Leeworthy, V.R.; Loomis, D.K.; Paterson, S.K. Visitor Profiles: Florida Keys/Key West 2007–2008. In Linking the Economy and the Environment of Florida Keys/Key West; National Oceanic and Atmospheric Administration, National Ocean Service, Office of National Marine Sanctuaries: Silver Spring, MD, USA, 2010. [Google Scholar]
- Leeworthy, V.R. Visitor Study: Selected Comparisons 1995-06 and 2007-08. In Linking the Economy and the Environment of Florida Keys/Key West; National Oceanic and Atmospheric Administration, National Ocean Service, Office of National Marine Sanctuaries: Silver Spring, MD, USA, 2010. [Google Scholar]
- Leeworthy, V.R.; Ehler, R. Economic Contribution of Recreating Visitors to the Florida Keys/Key West 2007-08. In Linking the Economy and the Environment of Florida Keys/Key West; National Oceanic and Atmospheric Administration, National Ocean Service, Office of National Marine Sanctuaries: Silver Spring, MD, USA, 2010. [Google Scholar]
- TBD Economics, LLC. TBD Economics Home Page. Available online: https://www.tbdeconomics.com/projects (accessed on 20 August 2021).
- Kildow, J.T.; McIlgorm, A. The Importance of Estimating the Contribution of the Oceans to National Economies. Mar. Policy 2010, 34, 367–374. [Google Scholar] [CrossRef]
- Insights, Inc. Monroe County, Florida Home Page. Available online: https://www.monroecounty-fl.gov/DocumentCenter/View/28944/2020-TDC-VPS-County-Wide-ANNUAL-Summary-FINAL-03242021?bidId= (accessed on 21 August 2021).
- Crompton, J.L. The Fundamental Principles of Economic Impact Studies. In Measuring the Economic Impact of Park and Recreation Services; National Recreation and Park Association: Ashburn, VA, USA, 2010. [Google Scholar]
- Rockport Analytics, LLC. Monroe County Florida Hoe Page. Available online: https://www.monroecounty-fl.gov/DocumentCenter/View/21667/Economic-Impact-of-Tourism-in-The-Florida-Keys-?bidId= (accessed on 20 August 2021).
- Burns, R.C.; Andrew, R.G.; Allen, M.E.; Schwarzmann, D.; Cardozo, M.J. Conceptualizing the National Marine Sanctuary Visitor Counting Process for Marine Protected Areas. J. Ecotourism 2020, 19, 362–372. [Google Scholar] [CrossRef]
- Dillman, D.A.; Bowker, D.K. The Web Questionnaire Challenge to Survey Methodologists. In Dimensions of Internet Science; Reips, U.D., Bosnjak, M., Eds.; Pabst Science Publishers: Lengerich, Germany, 2001. [Google Scholar]
- Clouse, C. IMPLAN Home Page. Available online: https://support.implan.com/hc/en-us/articles/360038285254-How-IMPLAN-Works (accessed on 5 September 2021).
- Henderson, J.E.; Joshi, O.; Tanger, S.M.; Boby, L.; Hubbard, W.; Pelkki, M.; Hughes, D.W.; McConnell, E.; Miller, W.; Nowak, J.; et al. Standard Procedures and Methods for Economic Impact and Contribution Analysis in the Forest Products Sector. J. For. 2017, 115, 112–116. [Google Scholar] [CrossRef]
- Florida Ocean Alliance, Florida Ocean Alliance Home Page. Available online: http://www.floridaoceanalliance.org/wp-content/uploads/2020/07/FOA-Strategic-Policy-Plan_063020a.pdf (accessed on 20 September 2021).
- National Oceanic and Atmospheric Administration (NOAA). National Ocean Service Home Page. Available online: https://oceanservice.noaa.gov/facts/oceaneconomy.html (accessed on 5 October 2021).
- Choe, Y.; Kim, H.; Joun, H. Differences in Tourists Behaviors across the Seasons: The Case of Northern Indiana. Sustainability 2019, 11, 4351. [Google Scholar] [CrossRef] [Green Version]
- National Academy of Public Administration Home Page. Available online: https://s3.us-west-2.amazonaws.com/napa-2021/studies/NAPA-ONMS-Final-Report-3.30.21_Title-Update-5.11.21.pdf (accessed on 25 October 2021).
- Wallmo, K.; Edwards, P.; Steinback, D.; Wusinich-Mendez, D.; Allen, M. Economic Impact Analysis of Snorkeling and Scuba Diving in Florida Reefs; NOAA Technical Memorandum CRCP 42; NOAA National Ocean Service, National Coral Reef Conservation Program: Silver Springs, MD, USA, 2021.
- Diving Equipment & Marketing Association (DEMA). DEMA Home Page. Available online: https://www.dema.org/store/download.aspx?id=7811B097-8882-4707-A160-F999B49614B6 (accessed on 1 October 2021).
- Pendleton, L.H. Available online: https://dfg.ca.gov/mlpa/pdfs/binder3diii.pdf (accessed on 20 September 2021).
- Frechtling, D.C. An Assessment of Visitor Expenditure Methods and Models. J. Travel Res. 2006, 45, 26–35. [Google Scholar] [CrossRef]
Figure 1.
Overview map of the focal study area in the southern portion of Florida, USA (inset), with the Florida Keys National Marine Sanctuary (FKNMS) boundary shown.
Figure 1.
Overview map of the focal study area in the southern portion of Florida, USA (inset), with the Florida Keys National Marine Sanctuary (FKNMS) boundary shown.

Figure 2.
Steps in economic contribution analysis.


Table 1.
Individual expenditures per trip of visitors who engaged in ocean recreation activities in the Florida Keys National Marine Sanctuary, 2019.
Table 1.
Individual expenditures per trip of visitors who engaged in ocean recreation activities in the Florida Keys National Marine Sanctuary, 2019.
| Expenditure Category | Value | IMPLAN Sector |
|---|---|---|
| Lodging (hotel, condo, rental, camping, etc.) | USD 209.63 | 499 |
| Gift shop items/souvenirs | USD 39.40 | 405 |
| Food at restaurants | USD 97.51 | 501 |
| Food at grocery stores | USD 70.15 | 400 |
| Local fuel expenses | USD 73.86 | 402 |
| Local automobile transportation (Uber, taxi, rental car, etc.) | USD 25.87 | 412 |
| Sightseeing and entertainment (recreation activities, tours, excursions, etc. | USD 44.56 | 496 |
| Equipment for personal/private recreation (fishing/diving gear, etc.) | USD 55.14 | 404 |
| Fees for charter fishing | USD 95.22 | 414 |
| Fees for charter diving/snorkeling | USD 31.77 | 414 |
| Total | USD 743.14 |
Table 2.
Individual expenditures per trip of snorkelers and divers in the Florida Keys National Marine Sanctuary, 2019.
Table 2.
Individual expenditures per trip of snorkelers and divers in the Florida Keys National Marine Sanctuary, 2019.
| Expenditure Category | Value | IMPLAN Sector |
|---|---|---|
| Lodging (hotel, condo, rental, camping, etc.) | USD 207.52 | 499 |
| Gift shop items/souvenirs | USD 35.81 | 405 |
| Food at restaurants | USD 90.71 | 501 |
| Food at grocery stores | USD 67.22 | 400 |
| Local fuel expenses | USD 69.40 | 402 |
| Local automobile transportation (Uber, taxi, rental car, etc.) | USD 19.47 | 412 |
| Sightseeing and entertainment (recreation activities, tours, excursions, etc.) | USD 42.28 | 496 |
| Rental equipment for diving and snorkeling | USD 43.39 | 443 |
| Total | USD 575.79 |
Table 3.
Individual expenditures per trip by island district in the Florida Keys National Marine Sanctuary for ocean recreation, 2019.
Table 3.
Individual expenditures per trip by island district in the Florida Keys National Marine Sanctuary for ocean recreation, 2019.
| Area | Average Expenditure 1 |
|---|---|
| Key West/Marathon Island/Other | USD 209.24 a |
| Islamorada/Upper Matecumbe Key | USD 184.99 ab |
| Key Largo | USD 136.32 ab |
| Tavernier/Plantation Key | USD 79.23 bc |
| North Key Largo/Old Rhodes Key | USD 56.74 c |
1 Means with same letter are not significantly different at α = 0.10.
Table 4.
Individual expenditures per trip of snorkelers and divers by island district in the Florida Keys National Marine Sanctuary, 2019.
Table 4.
Individual expenditures per trip of snorkelers and divers by island district in the Florida Keys National Marine Sanctuary, 2019.
| Area | Average Expenditure 1 |
|---|---|
| Islamorada/Upper Matecumbe Key | USD 172.53 a |
| Key West/Marathon Island/Other | USD 94.54 b |
| Key Largo | USD 74.17 b |
| Tavernier/Plantation Key | USD 53.09 b |
| North Key Largo/Old Rhodes Key | USD 47.60 b |
1 Means with same letter are not significantly different at α = 0.10.
Table 5.
Individual expenditures per trip by season of visitors who engaged in ocean recreation in the Florida Keys National Marine Sanctuary for ocean recreation, 2019.
Table 5.
Individual expenditures per trip by season of visitors who engaged in ocean recreation in the Florida Keys National Marine Sanctuary for ocean recreation, 2019.
| Area | Average Expenditure 1 |
|---|---|
| Winter (December–February) | USD 477.34 a |
| Summer (June–August) | USD 281.10 a |
| Spring (March–May) | USD 197.31 a |
| Fall (September–November) | USD 163.89 b |
1 Means with same letter are not significantly different at α = 0.10.
Table 6.
Individual expenditures per trip by season of snorkelers and divers in the Florida Keys National Marine Sanctuary, 2019.
Table 6.
Individual expenditures per trip by season of snorkelers and divers in the Florida Keys National Marine Sanctuary, 2019.
| Area | Average Expenditure 1 |
|---|---|
| Summer (January–August) | USD 109.80 a |
| Spring (March–May) | USD 74.61 b |
| Fall (September–November) | USD 61.54 b |
| Winter (December–February) | USD 43.92 b |
1 Means with same letter are not significantly different at α = 0.10.
Table 7.
Additional spending for coral restoration/cleanup of trash/marine debris of snorkelers and divers in the Florida Keys National Marine Sanctuary, 2019.
Table 7.
Additional spending for coral restoration/cleanup of trash/marine debris of snorkelers and divers in the Florida Keys National Marine Sanctuary, 2019.
| Spending Category | Average Spending of Permanent/Temporary Residents | Average Spending of Nonresidents |
|---|---|---|
| Coral Restoration 1 | USD 57.37 | USD 43.80 |
| Cleanup of Trash/Marine Debris 2 | USD 65.96 | USD 42.15 |
1 Means between permanent/temporary residents and nonresidents are not significantly different at α = 0.10. 2 Means between permanent/temporary residents and nonresidents are significantly different at α = 0.10.
Table 8.
Economic contributions of visitors who enagaged in ocean recreation activities in Florida Keys National Marine Sanctuary, Monroe County, FL (Results in 2021 U.S. Dollars).
Table 8.
Economic contributions of visitors who enagaged in ocean recreation activities in Florida Keys National Marine Sanctuary, Monroe County, FL (Results in 2021 U.S. Dollars).
| Impact Type | Employment | Labor Income (USD MM) | Value Added (USD MM) | Output (USD MM) |
|---|---|---|---|---|
| Direct Effect | 14,303 | 532.6 | 797.9 | 1330.8 |
| Indirect Effect | 2981 | 127.0 | 204.0 | 388.3 |
| Induced Effect Total Effect | 2384 19,668 | 92.2 751.8 | 187.8 1189.7 | 330.2 2049.3 |
| Type SAM Multipliers | 1.37 | 1.41 | 1.49 | 1.54 |
Table 9.
Economic contributions of divers and snorkelers in Florida Keys National Marine Sanctuary, Monroe County, FL (Results in 2021 U.S. Dollars).
Table 9.
Economic contributions of divers and snorkelers in Florida Keys National Marine Sanctuary, Monroe County, FL (Results in 2021 U.S. Dollars).
| Impact Type | Employment | Labor Income (USD MM) | Value Added (USD MM) | Output (USD MM) |
|---|---|---|---|---|
| Direct Effect | 9448 | 349.6 | 545.7 | 837.3 |
| Indirect Effect | 1516 | 58.9 | 105.3 | 201.0 |
| Induced Effect Total Effect | 1477 12,441 | 57.1 465.6 | 116.3 767.4 | 204.6 1242.9 |
| Type SAM Multipliers | 1.32 | 1.33 | 1.41 | 1.48 |
Publisher’s Note: MDPI stays neutral with regard to jurisdictional claims in published maps and institutional affiliations. |
© 2022 by the authors. Licensee MDPI, Basel, Switzerland. This article is an open access article distributed under the terms and conditions of the Creative Commons Attribution (CC BY) license (https://creativecommons.org/licenses/by/4.0/).
Share and Cite
MDPI and ACS Style
Gazal, K.; Andrew, R.; Burns, R. Economic Contributions of Visitor Spending in Ocean Recreation in the Florida Keys National Marine Sanctuary. Water 2022, 14, 198. https://doi.org/10.3390/w14020198
AMA Style
Gazal K, Andrew R, Burns R. Economic Contributions of Visitor Spending in Ocean Recreation in the Florida Keys National Marine Sanctuary. Water. 2022; 14(2):198. https://doi.org/10.3390/w14020198
Chicago/Turabian StyleGazal, Kathryn, Ross Andrew, and Robert Burns. 2022. "Economic Contributions of Visitor Spending in Ocean Recreation in the Florida Keys National Marine Sanctuary" Water 14, no. 2: 198. https://doi.org/10.3390/w14020198
Note that from the first issue of 2016, this journal uses article numbers instead of page numbers. See further details here.