Article

Integration of Numerical Models and InSAR Techniques to Assess Land Subsidence Due to Excessive Groundwater Abstraction in the Coastal and Lowland Regions of Semarang City

1
Department of Hydraulic and Ocean Engineering, National Cheng Kung University, No. 1 University Road, Tainan 701, Taiwan
2
Civil Engineering Department, Universitas Jenderal Soedirman, Jl. HR Bunyamin, Purwokerto 53122, Indonesia
3
Department of Geodetic Engineering, Universitas Gadjah Mada, Jl. Grafika No. 2 Bulaksumur, Yogyakarta 55281, Indonesia
4
Center for Disaster Studies, Universitas Gadjah Mada, Yogyakarta 55281, Indonesia
5
Research Center for Geotechnology, Research Organization for Earth Sciences, National Research and Innovation Agency (BRIN), Jl. Sangkuriang, Kompleks LIPI, Kota Bandung 40135, Indonesia
6
Department of Civil Engineering, Universitas Diponegoro, Jl. Prof. Soedarto, Tembalang, Semarang 50275, Indonesia
*
Author to whom correspondence should be addressed.
Water 2022, 14(2), 201; https://doi.org/10.3390/w14020201
Submission received: 6 December 2021 / Revised: 4 January 2022 / Accepted: 7 January 2022 / Published: 11 January 2022
(This article belongs to the Special Issue Urban Hydrogeology Studies)

Abstract

:
This study was carried out to assess land subsidence due to excessive groundwater abstraction in the northern region of Semarang City by integrating the application of both numerical models and geodetic measurements, particularly those based on the synthetic aperture radar interferometry (InSAR) technique. Since 1695, alluvial deposits caused by sedimentations have accumulated in the northern part of Semarang City, in turn resulting in changes in the coastline and land use up to the present. Commencing in 1900, excessive groundwater withdrawal from deep wells in the northern section of Semarang City has exacerbated natural compaction and aggravated the problem of land subsidence. In the current study, a groundwater model equivalent to the hydrogeological system in this area was developed using MODFLOW to simulate the hydromechanical coupling of groundwater flow and land subsidence. The numerical computation was performed starting with the steady-state flow model from the period of 1970 to 1990, followed by the model of transient flow and land subsidence from the period of 1990 to 2010. Our models were calibrated with deformation data from field measurements collected from various sources (e.g., leveling, GPS, and InSAR) for simulation of land subsidence, as well as with the hydraulic heads from observation wells for simulation of groundwater flow. Comparison of the results of our numerical calculations with recorded observations led to low RMSEs, yet high R2 values, mathematically indicating that the simulation outcomes are in good agreement with monitoring data. The findings in the present study also revealed that land subsidence arising from groundwater pumping poses a serious threat to the northern part of Semarang City. Two groundwater management measures are proposed and the future development of land subsidence is accordingly projected until 2050. Our study shows quantitatively that the greatest land subsidence occurs in Genuk District, with a magnitude of 36.8 mm/year. However, if the suggested groundwater management can be implemented, the rate and affected area of land subsidence can be reduced by up to 59% and 76%, respectively.

1. Introduction

Land subsidence refers to a gradual or sudden vertical deformation of the ground surface, which is usually economically and socially detrimental since it often inevitably leads to structural damages to buildings and public infrastructure, as well as expands the flood inundation area [1,2,3]. Land subsidence may occur due to natural and anthropogenic (manmade) processes. The former (natural factors) includes fault compaction and tectonic movement, etc., whereas the latter (anthropogenic factors) includes excessive extraction of subsurface fluids (e.g., groundwater, oil, and gas), building loads on the ground surface, and so on [4,5,6,7,8,9].
Numerous studies have been extensively conducted to explore the physical mechanisms behind land subsidence arising from natural compaction. Gambolati and Teatini [10] employed a 1-D nonlinear finite element model to investigate soil compaction induced by groundwater flow through an isothermal sedimentary basin subjected to a continuous vertical sedimentation process to mimic the evolution of the accreting Quaternary column. Zoccarato et al. [8] used an adaptive finite-element mesh to analyze the development and evolution of the Mekong Delta in Vietnam and then described accretion and natural consolidation to characterize delta dynamics. Aside from natural compaction, another crucial natural factor that brings about land subsidence is tectonic movement. Tectonic subsidence is most common in subduction zones. This can be seen in the Pingtung Plain, Taiwan [11], which has a very active subduction zone and is prone to land subsidence. In addition, groundwater extraction frequently exacerbates land subsidence in this area. The impact of soil texture, cyclic loading, and gravitational body force on one-dimensional consolidation of unsaturated and saturated soils was quantitatively examined in a series of papers by Lo et al. [12,13,14]. Employing the theory of poroelasticity, Lo et al. [15,16] have recently formulated a boundary-value problem based on a set of coupled partial differential equations to numerically model the spatial and temporal distribution of excess pore water and air pressures in a two-layer soil system with an upper unsaturated zone and a lower saturated zone caused by external loads.
Land subsidence can be induced not only by natural sources, but also by human intervention. Since 1935, Beijing, China’s capital city, has been experiencing ground subsidence, with at least five significant sites. Yang and Ke [17] concluded that the rapid urban-area development in Beijing increased the density of multi-story buildings, which accelerated the occurrence of land subsidence, as evidenced by a time series of surface displacement data recorded from the Persistent Scatterer Interferometry Synthetic Aperture Radar (PSInSAR). Excessive groundwater pumping, on the other hand, is perhaps the most significant human intervention that gives rise to land subsidence. In fact, land subsidence resulting from groundwater removal has been a central problem in many regions over the world, including San Francisco Bay and the Florida Everglades in the United States [18], Romagna in Italy [5], central Taiwan [19], Esna City in Egypt [20], Bangkok in Thailand [21], central Saudi Arabia [22], Tehran in Iran [23], and Shanghai in China [24].
Land subsidence is an active study issue that involves various disciplines since it typically gives rise to large economic losses and disperses around the world. Several studies on land subsidence have been conducted using geodetic measurement techniques such as leveling, GPS, and satellite image (e.g., InSAR) to monitor surface deformations. Geodetic measurements are very useful in quantifying and interpreting the magnitude of land subsidence [25,26,27,28,29]. In addition to monitoring ground surface deformation, the technique of GPS and InSAR can also be used to assess the hydraulic head and aquifer system parameters for a regional area suffering from land subsidence [30,31,32,33,34].
Field experiments are another technique to gain physical insight into the behaviors of land sinking [35,36], but, they are often time-consuming and expensive. Therefore, numerical modeling that usually takes little time and is more cost-effective has become a preferred method for understanding and estimating the vertical deformation of the ground surface in local regions [37,38,39]. The integration of numerical simulation and field measurement is shown to be powerful because the implementation of both approaches can support the assessment process of land subsidence in a comprehensive framework that can systematically link its causes and effects.
The present study focuses on the northern part of Semarang City, which is located on the northern coast of Indonesia’s Java Island. Land subsidence is a common phenomenon there and has been monitored using different geodetic measurements, including leveling, GPS, and satellite images [40,41,42,43,44]. Natural compaction and excessive groundwater pumping are the main causes of land subsidence in Semarang City [43,45], which has been taking place for over a century [46]. Land subsidence due to natural compaction in the study area has been investigated by Sarah, et al. [47]. It is revealed that natural compaction is prevalent in the Demak region (east of the study area), but that this is not been the case in Semarang City. The rapid piezometric drop in Semarang city has drained the excess pore pressure developed during deposition so that the current land subsidence is entirely due to groundwater exploitation. Measurement of active tectonic role to land subsidence using GNSS data sets [48] revealed that during 2011–2017, the rate of tectonic subsidence in Semarang City was 3–5 mm/year. Considering that the subsidence rate exceeds the natural displacement rate by an order of magnitude, the calibration process has not been affected by natural displacements.
Several sub-districts in Semarang City have undergone over-exploitation of groundwater resources, which has evidently given rise to extreme declines in groundwater elevations and has thus been regarded as the main cause of land subsidence there [49]. Field observations have indicated that several housing estates in the northern part of Semarang City are found to be experiencing land subsidence. People in the area have no alternative but to move and leave their homes as a result of land subsidence. Figure 1 depicts several houses in Genuk District that have been affected by land subsidence. Figure 1a shows that in the areas where land subsidence is occurring, the ground elevation of the houses is lower than the road elevation, resulting in heavy inundation during the rainy season. The picture clearly points out that newer houses must raise their base elevation to be at or above the road level. Figure 1b illustrates the current condition of an older house whose window elevation is the same as the ground elevation due to land subsidence.
In Indonesia, the availability of groundwater observation data and land subsidence monitoring data is still very limited. The use of satellite imaging, leveling, and GPS in land subsidence monitoring and assessment is also still separate. Furthermore, most groundwater and land subsidence studies in Indonesia, particularly in Semarang City, have been limited to individual hydrogeological, geomatics, and soil compression models, with no study combining different models to test their relationship and predict changes in groundwater that cause variations in land subsidence. Furthermore, a well-structured regulatory mechanism that can effectively and significantly reduce the negative impacts of land subsidence is required. The current study was thus undertaken to start from establishing a physically-consistent framework for numerically modeling the phenomenon of land subsidence caused by groundwater abstraction that occurs in the northern part of Semarang City. Our model was verified by monitoring data of crustal deformation obtained from leveling, GPS, and Sentinel-1 InSAR in Semarang City. The InSAR analysis generates a time series of deformations and corresponding speeds in the study area, which are also used for calibration. Next, the prediction of future land subsidence with and without groundwater management measures was performed based on our well-validated numerical model. Lastly, the effectiveness of the proposed regulatory policies was quantitatively evaluated in terms of reductions in the affected area of land subsidence in spatial and temporal scales.

2. Study Area

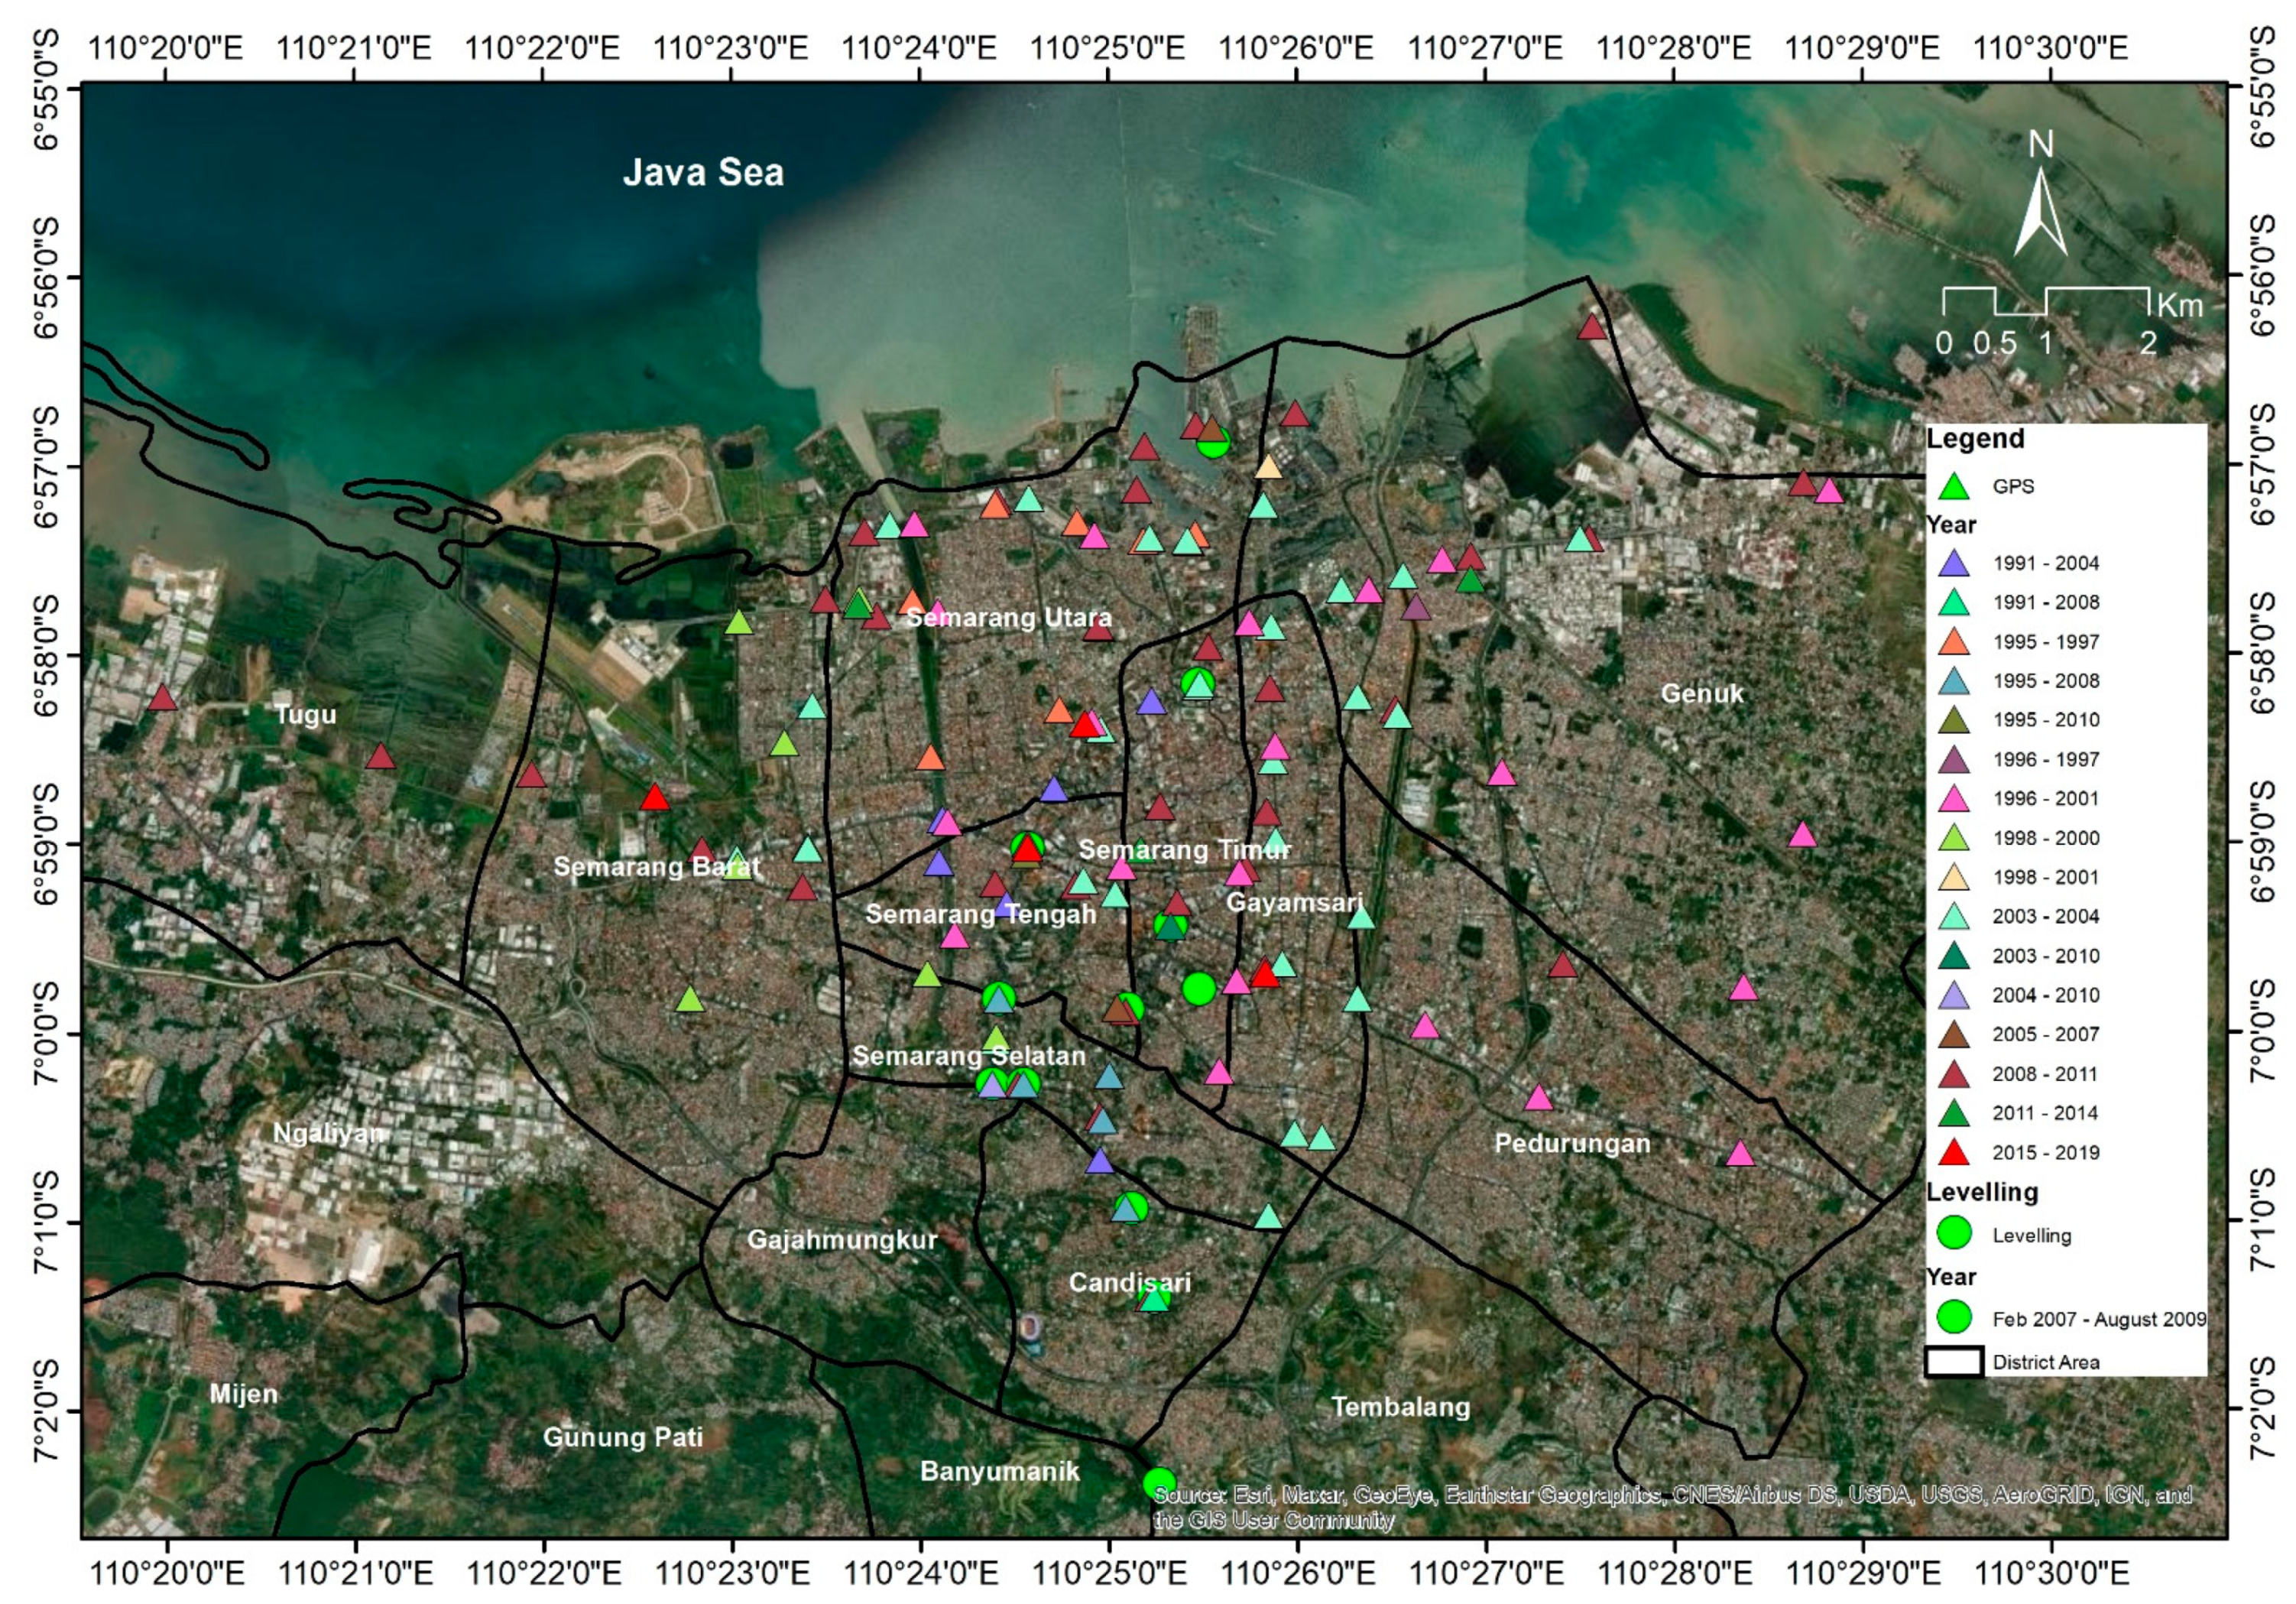
2.1. Focus of Study Area

Semarang City is the capital of Central Java Province and also the fifth largest city in Indonesia. Semarang City is divided into 16 sub-districts: Mijen, Gunungpati, Banyumanik, Gajah Mungkur, Semarang Selatan, Candisari, Tembalang, Pedurungan, Genuk, Gayamsari, Semarang Timur, Semarang Utara, Semarang Tengah, Semarang Barat, Tugu, and Ngaliyan. Among these sub-districts, Tugu, Semarang Barat, Semarang Utara, Semarang Tengah, Semarang Timur, Gayamsari, Genuk, and the northern part of Pedurungan are located in the study area (i.e., the northern part of Semarang City). According to field observations, Genuk, the northern part of Semarang Utara, Gayamsari, and Semarang Timur are experiencing land subsidence. The study area, as shown in Figure 2, spans 23.5 km × 10.5 km and is situated between 6°50′–7°10′ S and 109°35′–110°50′ E, near to the Java Sea.

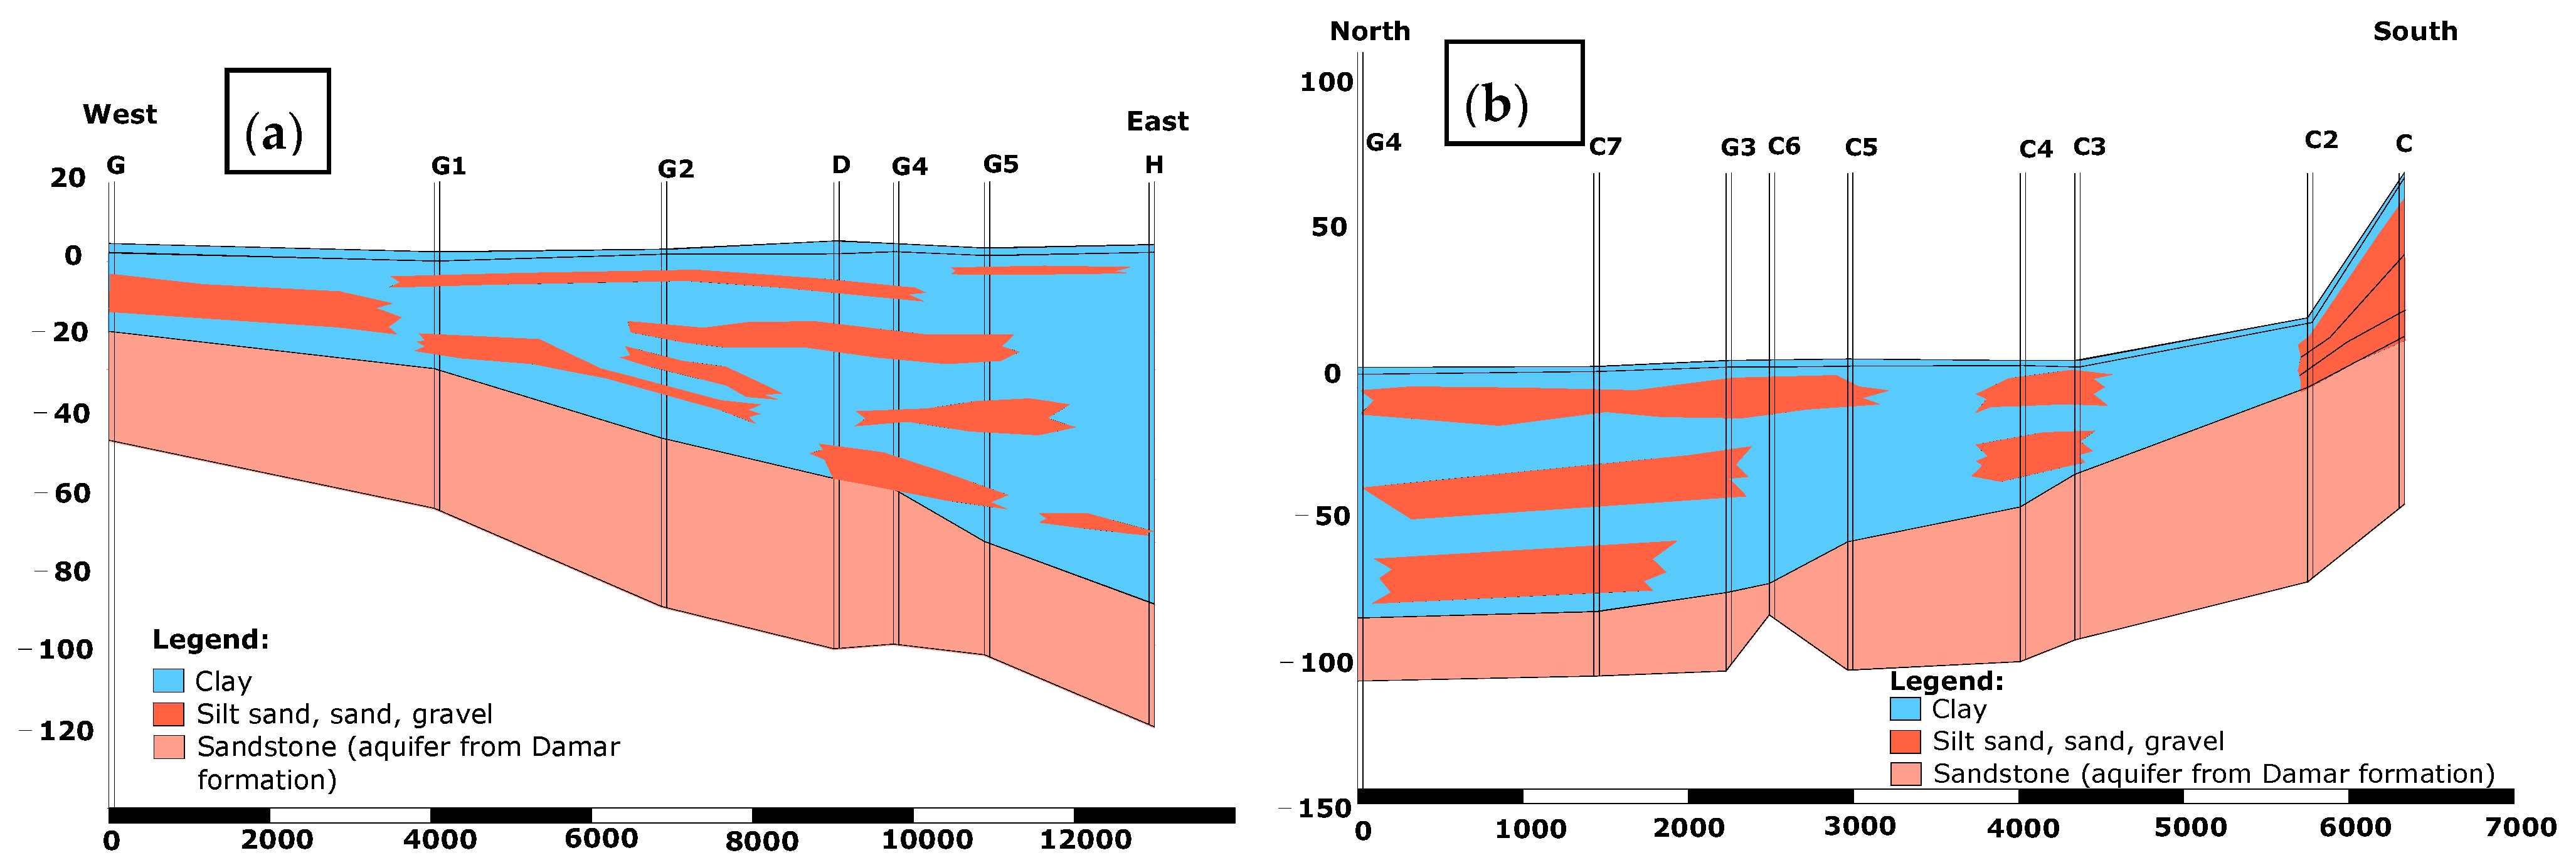
2.2. Geological Setting

Geologically, the northern part of Semarang city is situated in an alluvial plain that is bounded to the north by the Java Sea and to the south by the Semarang highland. The north plain in this area is composed of a thick sequence of Holocene alluvial deposits (Qa) and the south highland comprises Quartenary volcanic rocks (QTd) and Tertiary sedimentary formation (Tmpk) [50]. The geological formations in the northern area of Semarang City are strongly affected by the sedimentation process and shoreline changes. The heterogeneity of subsurface is influenced by the sea-level fluctuation from the last glacial maximum until the Holocene transgression, as explained in Sarah et al. [47]. The rapid advancement of the shoreline indicates the rapid deposition of the Semarang alluvial deposit, forming soft clayey sediment on the upper part of the subsurface. In the eighth century, Semarang City originated from a cluster of small islands off the coast of Pragota (now Bergota) [51]. The coastline changes result from the sedimentation process. Old topographical maps revealed that the Semarang shoreline advanced 8–12 m/year from 1695–1940. Figure 3a shows that an 884 m advancement took place over 1847–1991 [52]. It appears that accretion of 884 m occurred over 144 years, implying that sedimentation in the northern part of Semarang City was extensive during this time period.
Figure 3b provides an evolution of the coastal accretion and retreat processes for changes in shoreline from 1984 to 2016 based on satellite images. The coastal shoreline in 1984 was accreting towards the sea. This phenomenon was influenced by natural sedimentation and intensive reclamation for land development that began in the 1980s [53]. The shoreline position in 1994 was similar to that in 1984. Slight advancement was found near the west canal (Kanal Barat), possibly due to an increase of sedimentation discharge from the headwater. An examination of the shoreline in 2004 showed that land subsidence may have affected the coastal morphology. Shoreline retreat was observed at the western and eastern sections. The combined influence of sea-level rise and land subsidence caused the seawater to transgress the land; thus, the west and east coastal lands are susceptible to inundation. This was not seen in the center part, because some flood protection systems were built for the city center. The dyke, canals, and polder pumping system help prevent the city from the multiple disasters of subsidence, coastal flood (rob), and seasonal flood during the rainy season. In 2016, the shoreline retreated further in the western part, implying a more aggravating impact of land subsidence and sea-level rise. The 2016 shoreline position in the city center remained similar to 2014 and only some slight advancements were observed near the west canal, Semarang Port, and east Kaligawe industrial complex. The small shoreline advances were due to sediment discharge from the west and east canals, as well as reclamation work in the port, trade zone, housing, and industrial complex.
Figure 4 presents a geological map of Semarang City, which is one part of the Semarang-Demak groundwater basin [50]. The lithological point and axes are elaborated in Figure 5. The northern region of Semarang City is mainly composed of alluvial deposits (Qa) due to the existence of a sedimentation process that also causes changes in the coastline. The thickness of the alluvial deposit ranges from 20 to 100 m, becoming thicker to the north and east (Figure 5). The bulk of the sediments in the basin consists essentially of grey, very soft clay, and silt, with abundant calcareous and shell fragments. Tons of sands and gravels are found at various depths from 5 to 80 m (Figure 5a,b). At the southern highland, thin clay and silt overlay alluvial fans of sand and gravel (Figure 5b). Apart from Qa, Semarang City has Pleistocene sediments (in the form of the Damar Formation, Qtd), which were generated by sedimentations due to variations in sea level in at least the past 500 years or approximately in the middle of the 14th century [54], caused by transgression and regression processes that form deltas and tidal deposits [45].
The stratigraphy in Figure 5 is divided into three units, clay to silty clay (Unit 1), sand lenses (Unit 2), and volcanic sandstone (Unit 3). The clay unit has a soft to medium consistency with an N-SPT value of 1–9. The sand lenses are medium dense (n-spt value 17–22), and the volcanic sandstone is dense to very dense (n-spt value >30). The geotechnical properties are derived from borehole investigations in Terboyo and North Semarang, and laboratory analysis [45]. Compressibility of the aquitard units was derived from 1-D oedometer tests [55] and hydraulic conductivity was obtained from the falling head permeability test [56]. Properties of the coarse-grained sediments are characterized based on their grain-size composition [57]. The geotechnical properties for the subsurface units are presented in Table 1.

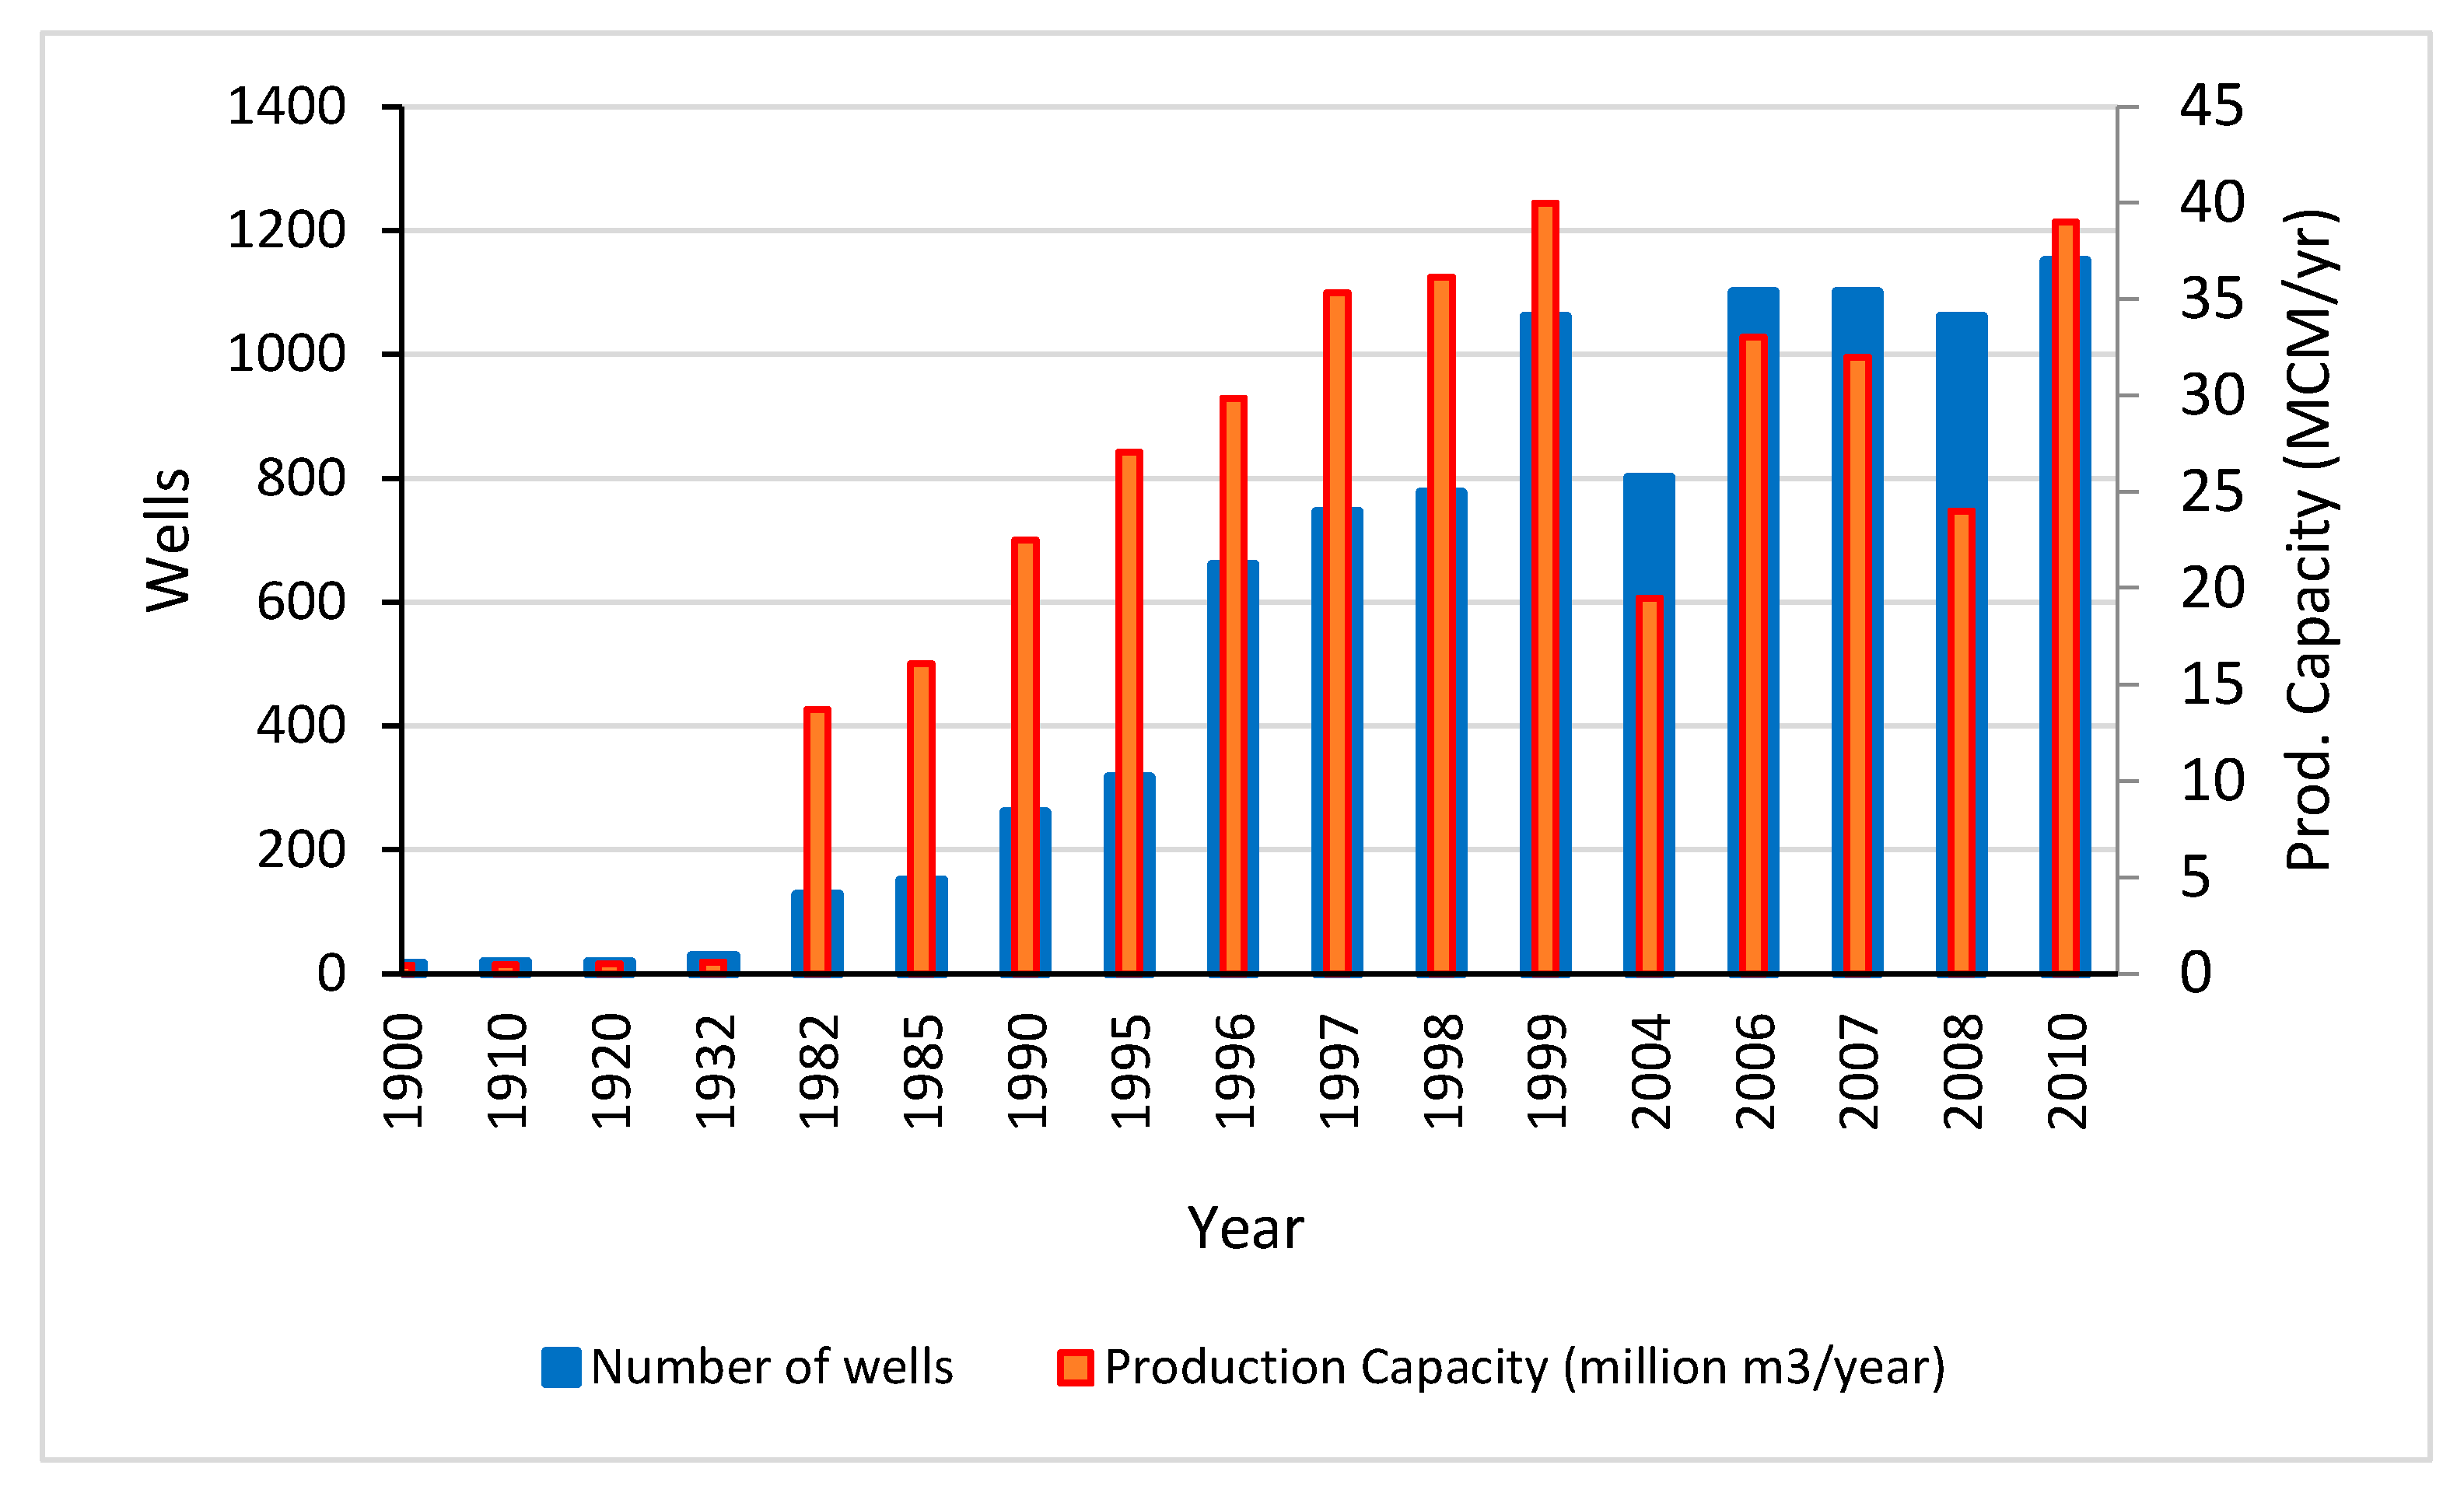
2.3. Hydrogeological Setting

The groundwater basin of the northern region of Semarang City, a part of the Semarang-Demak groundwater basin, is composed of unconfined and confined aquifers. The former (unconfined aquifer) is near the ground surface, with the groundwater table in direct contact with the atmosphere. The latter (confined aquifer) is separated from the unconfined aquifer by an impermeable barrier and is in compressed or semi-stressed status, consisting of lenses of sand and gravel that are covered by a layer of clay or sandy loam [53].
A hydrogeological evaluation to quantify interstitial fluid movements in aquifer layers needs a numerical representation of the groundwater flow regime. The hydrogeological dataset being inputted into our numerical models was collected from a geoelectric field study conducted in February 2019, as well as borehole works from a variety of sources, including the Balai Besar Wilayah Sungai (BBWS) Pemali-Juana, and Marsudi [53]. The lithology of the Semarang groundwater basin is illustrated in Figure 5.
The confined aquifer in the northern part of Semarang City is made up of two formations, i.e., the sandstone and conglomerates of the Damar formation along with the alluvial fan, as well as lenses of sand and gravel of the Garang deltaic deposit. The Garang delta was developed from the former river channels during the deposition of the deltaic deposit. In the Damar delta, groundwater flows from the volcanic rocks in the southern hills to the sedimentary basin in the north Semarang. The Damar formation has long served as a reliable source of fresh groundwater, mostly exploited by industries using deep wells at depths of 60–180 m. The Garang delta is also exploited by wells, but to a lesser degree due to its limited lateral extent. The numbers of registered wells and their output capacity are presented in Figure 6.
In Semarang City, field investigation reveals that regional groundwater flows from the south-southwest to the north-northeast through the deposits of gravel lens and sand lens. As a result, the groundwater level tends to fall to the north-northeast, with the conical decline’s center pointing towards LIK Kaligawe. Pump wells have been considerably used to extract groundwater in Semarang City and have two types, i.e., dug wells (shallow wells) and boreholes (deep wells). Boreholes, with depths ranging from 60 to 180 m, are positioned in a confined aquifer and often utilized for industrial purposes, whereas dug wells are typically installed by locals for their daily needs. In 1900, the number of pump wells in Semarang City was first reported, but these data are only available until 2010. Figure 6 shows the production capacity and the total number of groundwater wells [53,58,59,60], indicating that both the number and capacity of wells are increasing every year. Previous groundwater monitoring showed that the groundwater condition in Semarang city is already stressed. Over-exploitation of groundwater resources caused the formation of a cone of depressions that was first observed in 1984, but widened southward in 2010. Groundwater over-withdrawal also leads to the lowering of the piezometric pressure, thus increasing the effective stress of the aquifer system. However, due to the low permeability of the aquitard layer, the dewatering process is delayed, thus giving rise to gradual land subsidence. When the pore pressure decrease is smaller than the preconsolidation stress of the aquitard, the phenomenon of small, elastic, reversible subsidence occurs [61]. On the contrary, when the pore pressure drop is larger than the preconsolidation stress, it induces large, inelastic, irreversible subsidence.

3. Ground Deformation

3.1. Leveling and GPS Survey for Land Subsidence Monitoring

Land subsidence measurements were taken in the northern part of Semarang City by several institutes. Land subsidence was measured at 137 locations intermittently from 1991 to 2019 [62]. However, because the measurements (leveling and GPS) were carried out by different agencies and not synergized with each other, the measurement data at each point were not recorded continuously, but instead only for very short periods of time. Accordingly, in the current study, the data from the monitoring points of land subsidence that are close to each other, which are measured at different years, are used for calibration of the numerical model. Figure 7 depicts the time scale and period of leveling and the GPS survey points for land subsidence monitoring.

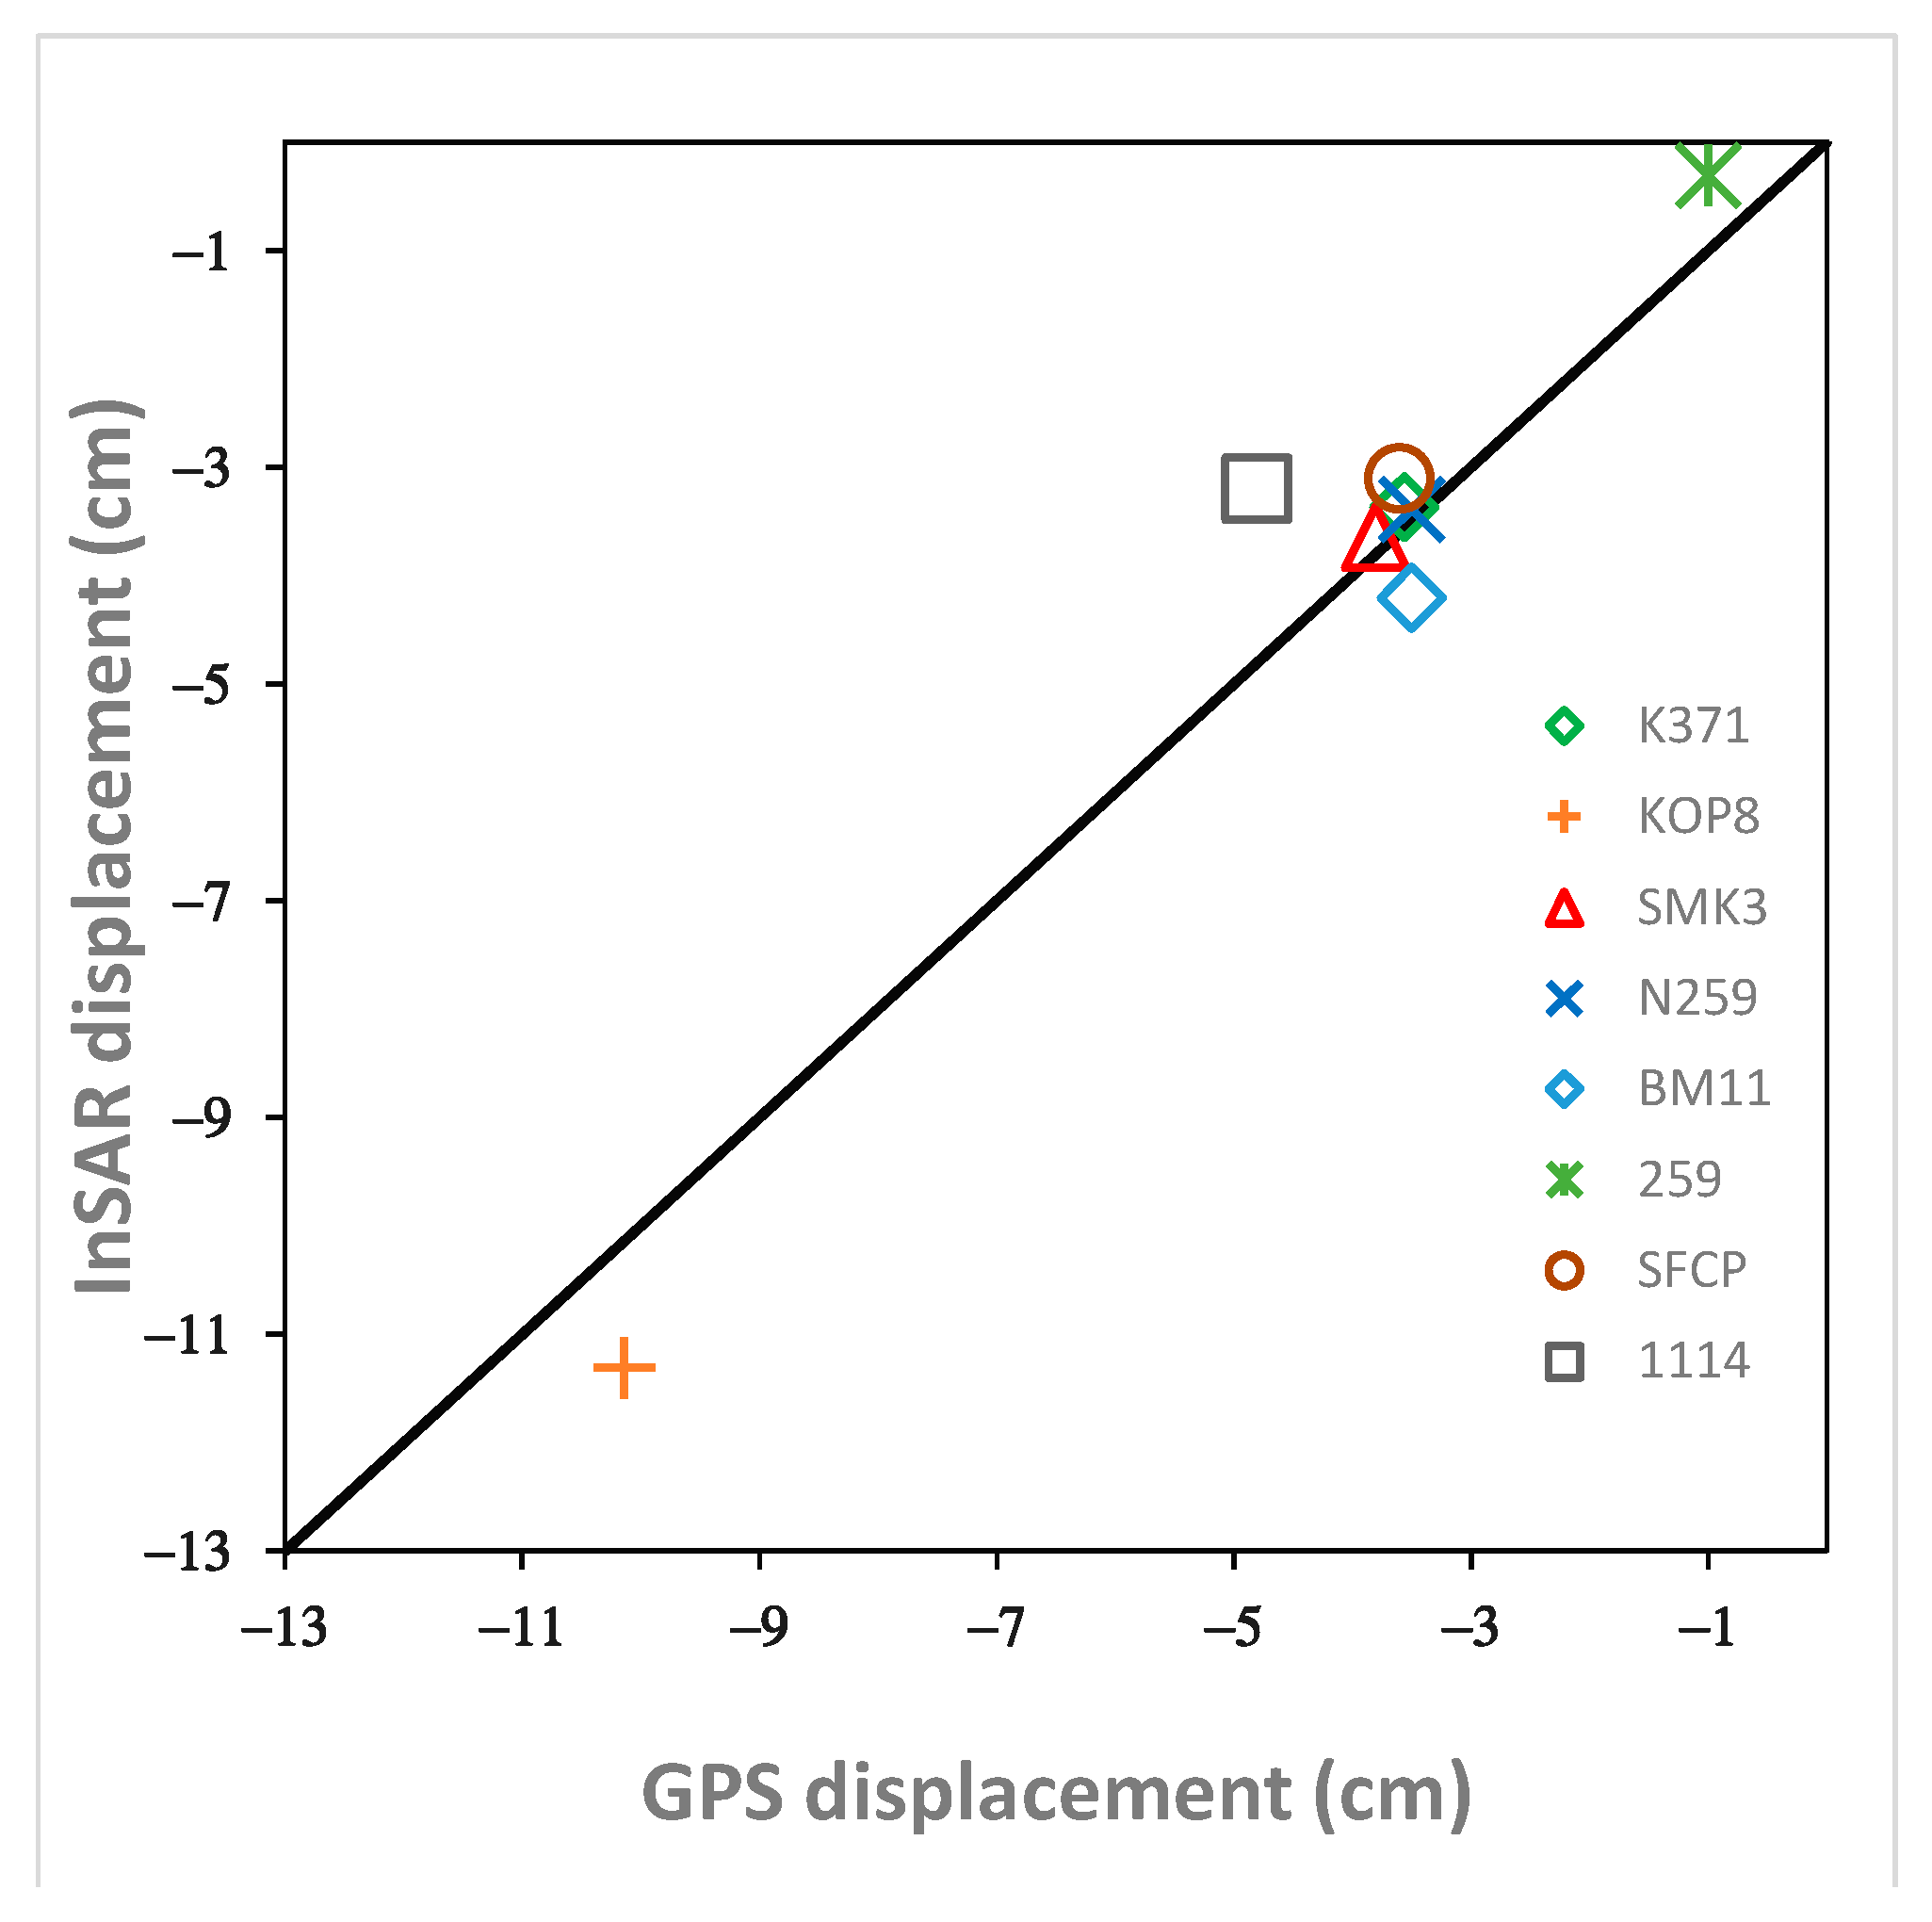
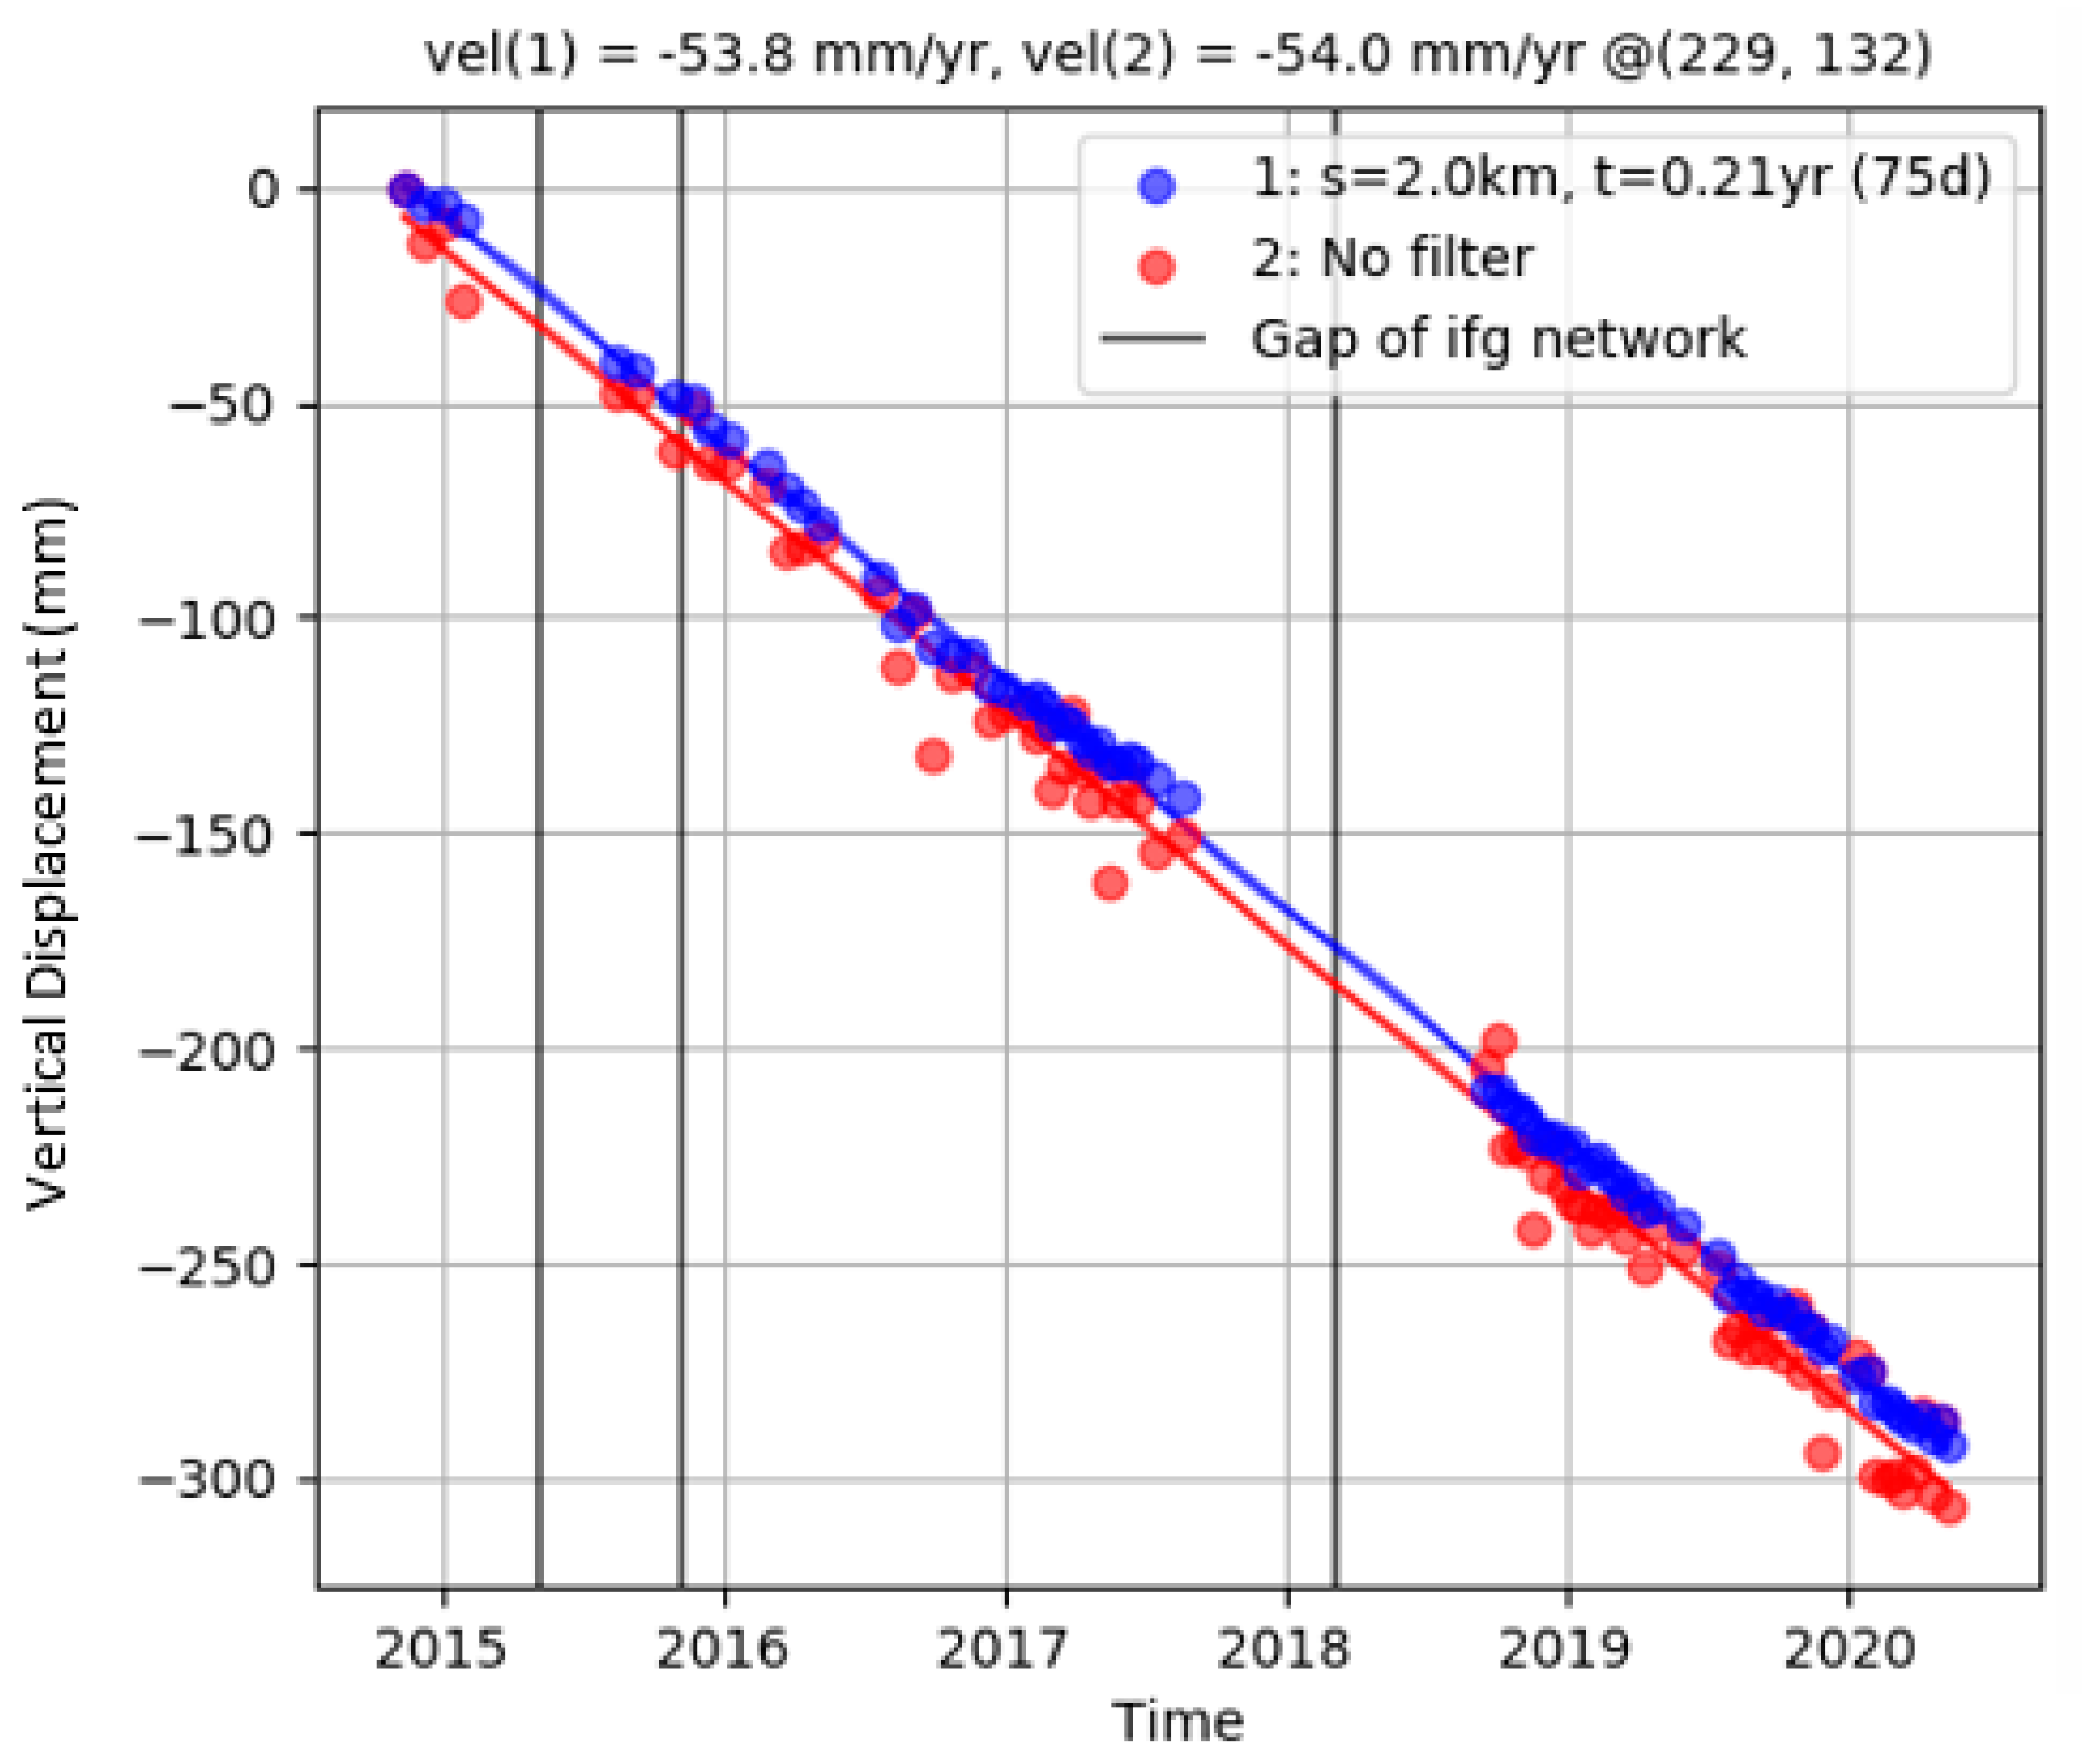
3.2. Interferometric Synthetic Aperture Radar (InSAR) Data and Processing

The most widely applied technologies for monitoring ground subsidence may be leveling and GPS, although their usage is still restricted due to a lack of geographic samples and expensive cost [63], which accordingly makes it difficult to undertake long-term monitoring of land subsidence. InSAR technology has been developed in recent years to tackle this issue [25]. Although this satellite-derived radar imaging has the potential to become a formidable tool for providing low-cost, continuous ground movement data over a vast area [64], the method of assessing ground deformation using InSAR image suffers from low accuracy because of the spatial-temporal decorrelation of the distance between objects and satellite orbits, high land cover complexity, and signal interference caused by air conditions [63,64,65,66].
DInSAR (Differential InSAR) is a technique for generating a large-scale map of line-of-sight (LOS) components using highly precise displacements [67]. A multitemporal deformation map, as well as many differential interferograms of the same zone from separate tempo acquisitions, must be considered. The short baseline subset (SBAS) and the persistent scatterer interferometric synthetic aperture radar (PSInSAR) are two sophisticated DInSAR algorithms that can be used to monitor the deformation of the earth’s surface over time. SBAS is carried out by using a mixture of differential interferograms produced by data pairs with a modest orbital separation (baseline) [68]. PSInSAR is based on phase characteristics and detects low-amplitude pixels with phase stability that are not found by conventional amplitude-based methods. It also uses spatially-correlated phases rather than historical phases so that the variables can be examined across time [69]. Consequently, the SBAS and PSInSAR algorithms are applied to address the problem of inaccuracies that may occur while using InSAR to detect land subsidence.
The InSAR data used in this study was taken from Sentinel-1 between 2015 and 2020 (https://comet.nerc.ac.uk/comet-lics-portal/, accessed date: 25 June 2020), with frame ID 076D_09725_121107 covering Central Java Province. The boundary of the area covers 6°50′0″–7°10′0″ S and 110°12′0″–110°37′0″ E, and more than 100 InSAR images were used in the analysis. An open-source program called LiCSBAS was applied in the present study to execute the InSAR time series analysis using LiCSAR products [70]. Generic Atmospheric Correction Online Service (GACOS) was used to correct atmospheric inaccuracies appearing in SBAS-InSAR [71]. Due to the correctness and coverage of unwrapped data, as well as loop closure control, inaccurate unwrapped data must be recognized and removed in the time series analysis. GACOS atmospheric products employ the interpolation technique of iterative tropospheric decomposition (ITO) to remove elevation-related and turbulent signals from the zenith total delay (ZTO) and then provide high-resolution tropospheric delay maps for InSAR and other data [71].
SBAS-InSAR is an analytical method for the multi-image InSAR time series to generate an estimation of the deformation of the earth’s surface by combining interferometric pairs from small time-space baselines. Land subsidence detection and monitoring using SBAS-InSAR has now become predominant. The analysis starts with N + 1 SAR pictures taken at ordered times (t0, …, tN) and is based on the same area. Assuming that each acquisition can interfere with other images, each SB subset thus must have at least two acquisitions, giving rise to the following inequality for the number of potential differential interferograms M [68]:
N + 1 2 M N ( N + 1 2 )
Using the estimated generic j-interferogram of the SAR acquisition at times t A   and t B ,   the topographic phase component removal in the azimuth pixels and coordinate range ( x , r ) can be described as follows:
Φ j ( x , r ) = Φ ( t B , x , r ) Φ ( t A , x , r ) 4 π λ [ d ( t B , x , r ) d ( t A , x , r ) ]
where d ( t B , x , r ) and ( t A , x , r ) are the cumulative line-of-sight (LOS) deformations at time tA and tB with respect to the reference instant t0 and λ is the transmitted signal’s center wavelength. Consequently, one can obtain d ( t 0 , x , r ) 0 , and it is fair to identify d ( t i , x , r ) as the required deformation time series, with i = 1, …, N. Assume Φ ( t i , x , r ) to be the corresponding phase component; therefore, we have Φ ( t i , x , r ) 4 π d ( t B , x , r ) λ .
Based on a series of displacement results, an SB inversion was performed on the interferogram network to estimate the velocity of a surface pixel over time. It is assumed that an M-unwrapped interferogram stack d = [ d 1 , ,   d M ] T was generated from N images acquired at ( t 0 , , t N 1 ) incremental displacement vector m = [ m 1 , ,   m N 1 ] T (i.e., mi is the incremental displacement between time ti−1 and ti), and can be extracted by solving Equation (3):
d = G m
where G is an M × (N − 1) zero architecture matrix representing the interferogram network relationship with incremental displacements, and the unwrapped interferogram (difference between two acquisitions) is the sum of the corresponding incremental displacements [72]. Cumulative displacements (i.e., displacement time series) are calculated by adding the incremental displacements for each acquisition. The mean displacement velocity is then computed based on at least the quadrature of the cumulative displacements.
The NSBAS approach [73] was used, which imposes a temporary limitation to obtain a more practical time series of the displacement even with a disconnected network.
[ d 0 ] = [ [               G       0     0 ] [ 1 0 0 t 1 1   t 2 1 1   0 1 1 1 t N 1 1 ] ] [ m v c ]
A linear displacement (d = vt + c) is assumed if “γ“ is the scaling (weighting) element in the temporal constraints. The low time limit has little effect on the solution within the network’s linked components (e.g., 0.0001). As a result, the time restriction component only affects the connection via network gaps. Equation (4) can be used for pixels with fully connected networks as well as pixels with gaps.
Due to the limitation of interferometric phases, phase unwrapping was applied to quantify the absolute value of the phase with respect to a reference point inside the interferogram [74]. In the loop closure and mask time series phase, the mask was created utilizing multiple noise indices acquired at earlier stages for the time series and speed of displacement. If the value of any noise indicator for that pixel was greater than or less than the threshold set, that pixel was masked. The generated time series also includes several noise-related conditions, such as residual tropospheric noises, ionospheric noises, and orbital errors. A space-time filter can be utilized to isolate these components from the displacement time series (i.e., high-pass time and low-pass space) [75].

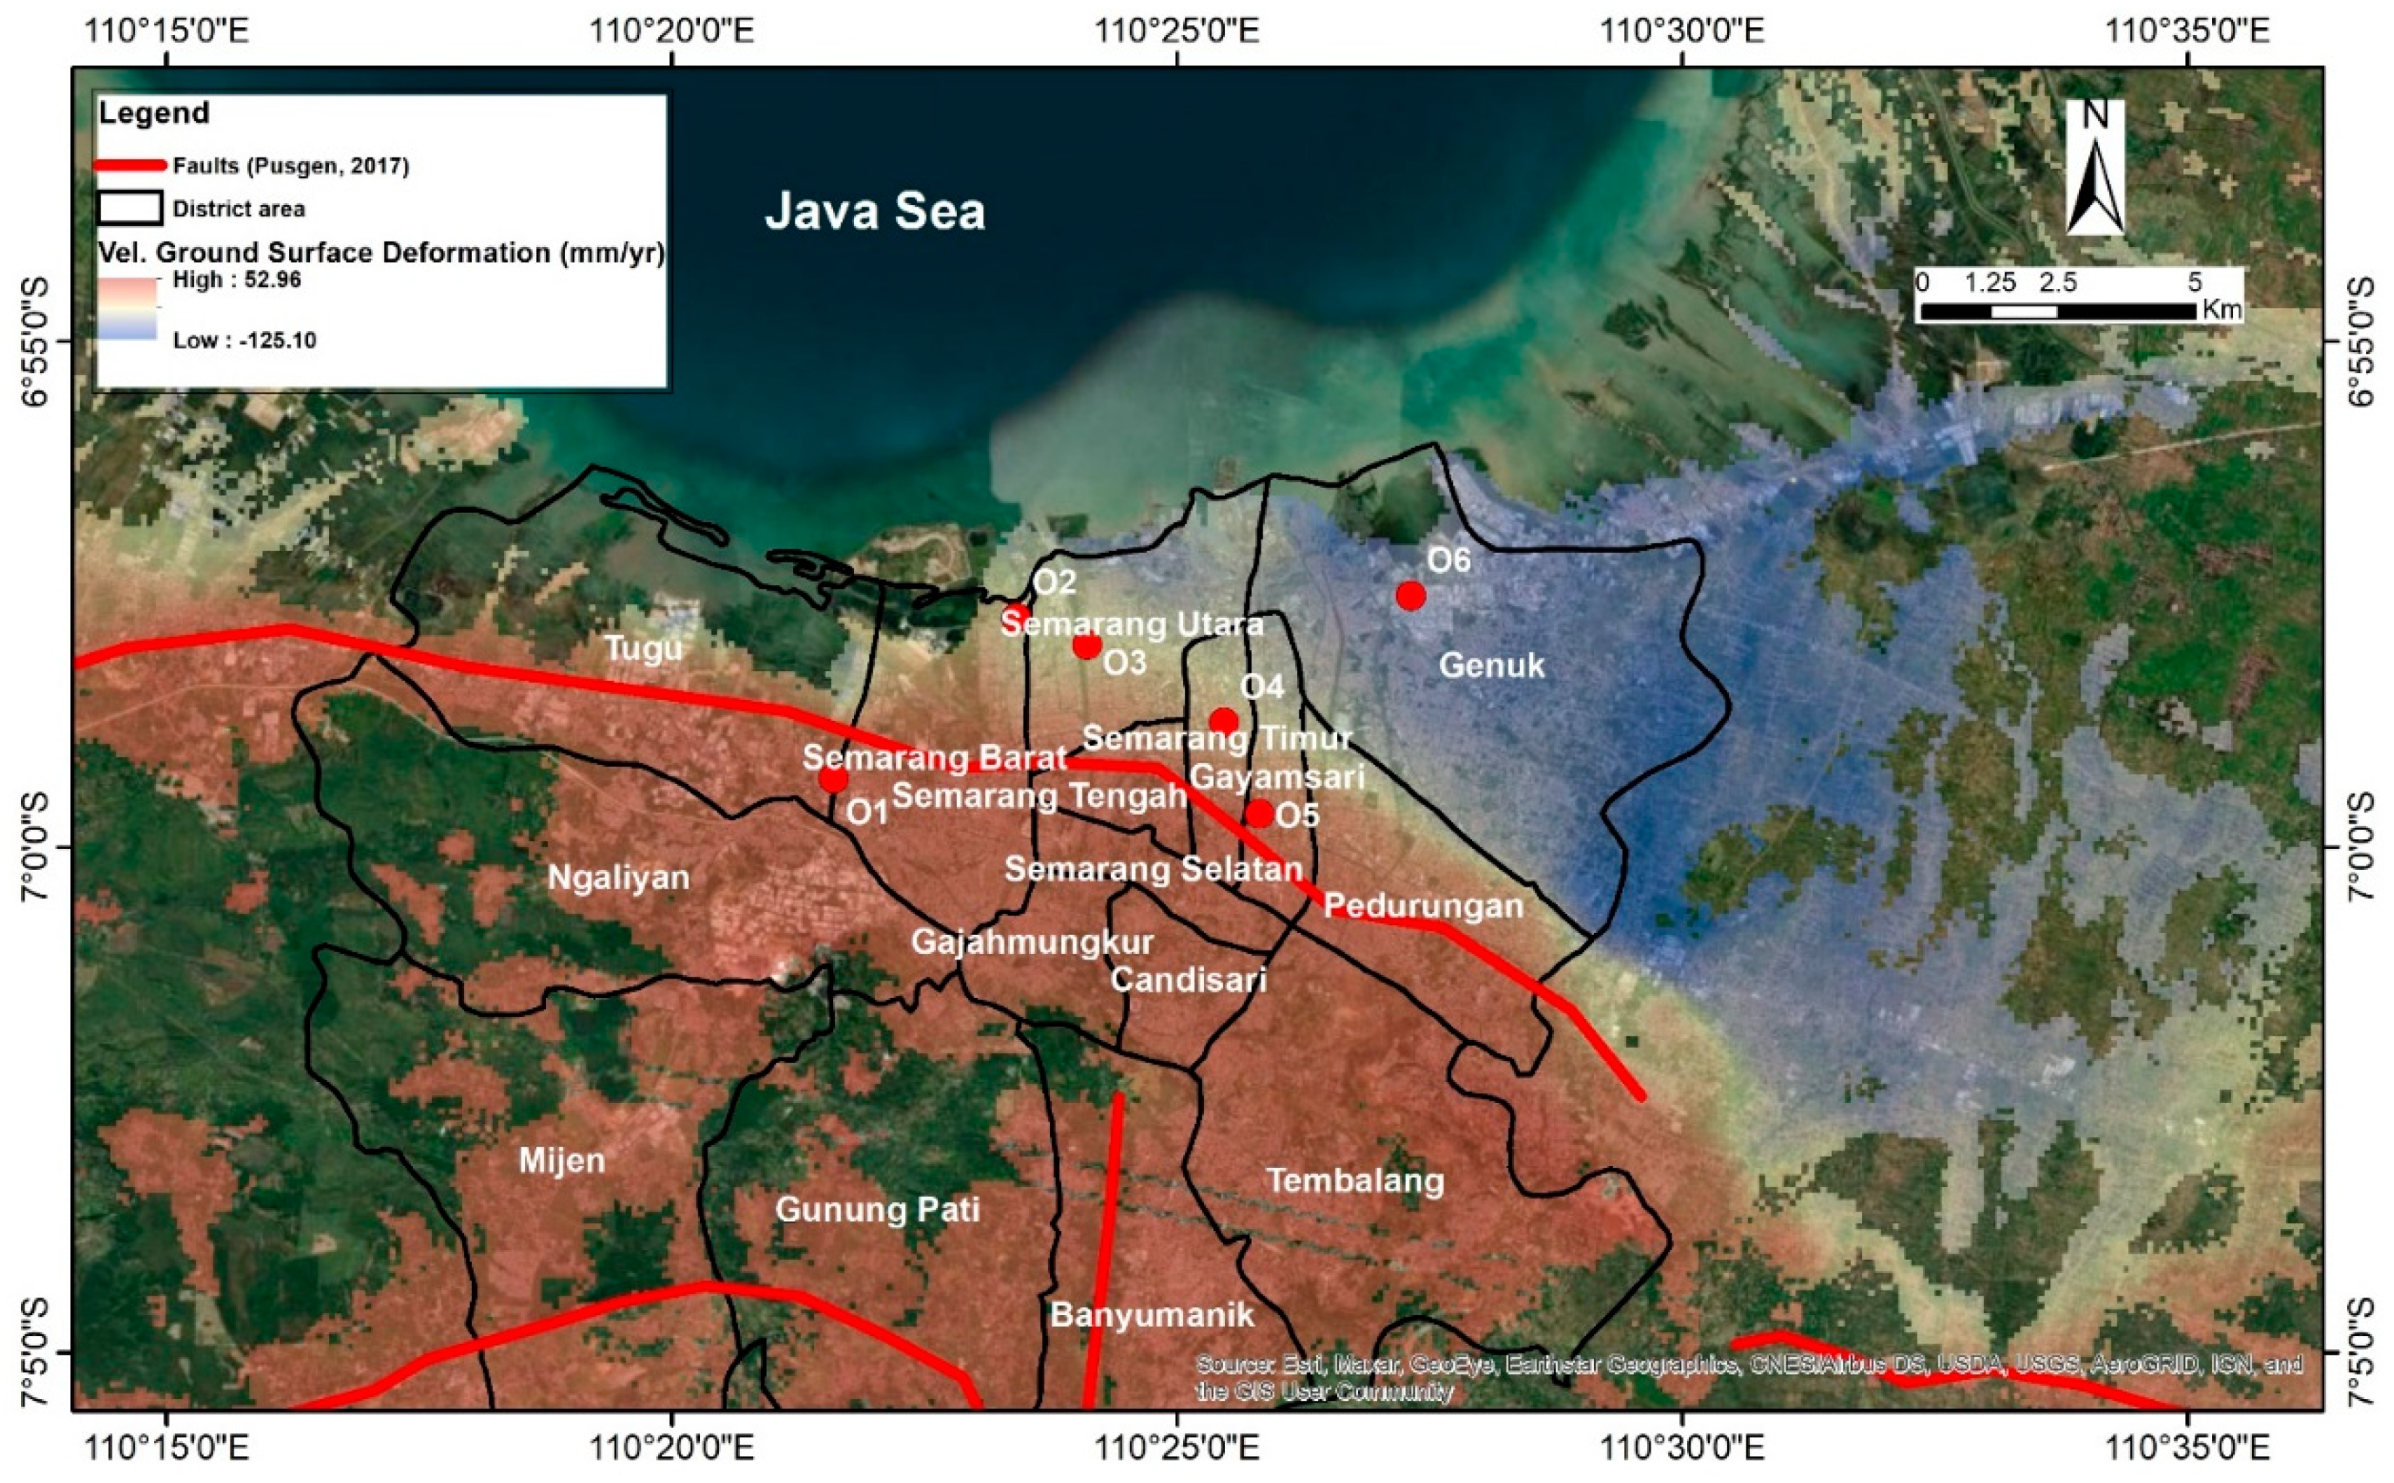
3.3. Land Deformation Mapping

High-precision subsidence mapping can be obtained using a satellite-based technique based on SAR using the DInSAR method. The DInSAR method is based on analyzing SAR images to identify surface changes to sub-centimeters along the sensor’s line of sight to the target, or Line of Sight (LOS), in order to calculate the LOS displacement value. LOS is the surface displacement between the satellite and the ground pixel in the azimuth direction along the flight path. The method is commonly used to estimate vertical displacement is to divide the LOS displacement obtained from DInSAR by the cosine of the incidence angle, assuming no horizontal movement occurs [76]. Furthermore, by using the least-squares algorithm, which is a matrix approach that aims to estimate the unknown parameters, during the inversion process, the displacement time series (in millimeters) can be obtained. After obtaining the displacement time series, a regression is performed to determine the annual average rate of land subsidence.
Before mapping land deformations, InSAR vertical displacement must be validated with GPS station measurements. There are several GPS points in the InSAR image frame, but many of them do not have enough temporal overlap with the InSAR 2015–2020 time series. Only the GPS points of K371, KOP 8, SMK 3, N259, BM11, 259, SFCP, and 1114 have temporal overlap with InSAR time series. Figure 8 depicts an InSAR validation for 2015–2020 with displacements monitored using GPS for 2015–2019. When compared to GPS monitoring results, it appears that in Figure 8, the InSAR displacement is in good agreement with an RMSE of 0.810 cm and R2 of 0.949.
Figure 9 gives a map of the deformation velocity generated by the InSAR analysis in the northern section of Semarang City from 2015 to 2020. Inspecting Figure 9, it can be noted that the most significant deformation occurs in the north-east part of Semarang City, with a rate above 80 mm/year, whereas the west and southern parts of Semarang City are dominated by an uplift rate up to 20 mm/year. Figure 10 illustrates a time series of the deformation with and without a spatial time filter at the black dot in Figure 9 in more detail. The time series of the black dot in Figure 9 reveals that the magnitude of land subsidence was roughly 300 mm from 2015 to 2020.
A plot was constructed from the base map to determine the position of land deformation and uplift in northern Semarang City, creating a deformation map as shown in Figure 11. By inspecting Figure 11, one can observe that the highest deformation occurs in Genuk District, followed by Semarang Utara District and parts of Semarang Timur and Gayamsari Districts. Meanwhile, Semarang Timur and Gayamsari, as well as practically all of Tugu, Semarang Barat, Semarang Tengah, Semarang Selatan, Pedurungan, Gajahmungkur, Candisari, Tembalang, and Ngaliyan’s sub-districts experience the uplift status. The vertical uplift in the southwest part of Semarang City may be related to thrust faults in Semarang City, which is the part of the Baribis–Kendeng active fault [77].

4. Groundwater and Land Subsidence Numerical Model

4.1. Groundwater and Geotechnical Subsidence Equation

Groundwater and land subsidence behaviors have been evaluated extensively and quantitatively using numerical modeling. In the current study, the groundwater flow analysis was performed with the flow package in MODFLOW, while the land subsidence analysis was carried out with the SUB (Subsidence and Aquifer-System Compaction) package. The SUB package can be applied to simulate both elastic (recoverable) and inelastic (non-recoverable) interbed compactions with either no or delayed drainage.
The partial differential equation that combines Darcy’s Law with mass balance for describing a three-dimensional groundwater movement in MODFLOW takes the form:
x ( K x x h x ) + y ( K y y h x ) + z ( K z z h z ) W = S s h t
where x, y, and z express Cartesian coordinates; Kxx, Kyy, and Kzz designate the tensor components of hydraulic conductivity in the x, y, and z axes; W represents the volumetric flux of water sources and (or) sinks per unit volume; Ss denotes specific storage; and h signifies hydraulic head.
The mechanism of vertical soil deformation induced by groundwater pumping is similar to that of soil consolidation acted upon by vertical load compression, in which the cause of consolidation is an increase in vertical effective stress and is then followed by a reduction in pore volume. However, in the former, excessive groundwater extraction leads to a decrease in pore water pressure and in turn raises effective stress, thus bringing about a decrease in pore volume [33,78].
According to Terzaghi’s effective stress concept, this can be mathematically written as:
σ i j = σ i j δ i j u
where σ i j is the effective stress tensor component; σ i j is the total geostatic stress tensor component; δ i j is the Kronecker delta function where δ i j = 1   i f   i = j   o r   δ i j = 0   i f   i j ; u is the fluid pore pressure; i and j represent the Cartesian coordinates x, y, and z. For 1D vertical stress problems, the equation reduces to:
σ z z = σ z z u
The general equation that evaluates the thickness of compaction or expansion, Δb, between intervals tn−1 and tn can be written as
Δ b = 0.434 b 0 ( 1 + e 0 ) σ [ C n ( σ n ; σ c , n 1 ; ) + C r ( σ c , n 1 ; σ n 1 ; ) ] C n = { C c , σ n ; > σ c , n 1 ; C r , σ n ; < σ c , n 1 ;
where e0 is an initial void ratio, b0 is initial thickness, σ′ is effective stress, σ n 1 ; and σ n ; are the effective stresses at tn−1 and tn, respectively; σ c , n 1 ; is the preconsolidation stress at tn−1. The relationship of σ n ; to σ c , n 1 ; is used to decide whether the value of C n is C c or C r . The equation provides a quantitative estimate of settlements in over-consolidated sediments, those in normally-consolidated sediments, and those in sediments under transition from the over-consolidated state to the normally-consolidated state.

4.2. Groundwater and Geotechnical Subsidence Equation

The land subsidence process involves the hydro-mechanical coupling between the flow of groundwater and the deformation of the solid matrix in the aquifer system. Our models are rigorously established in a physically-consistent manner with the land subsidence monitoring results from GPS and InSAR. A predictive model for future development of land subsidence is then constructed based on groundwater usage regulations adopted by Lo et al. [49]. In contrast to Lo et al. [49], who used a grid measuring 250 m × 250 m to perform a numerical simulation of the groundwater model and its management, the simulation in this study used a grid measuring 100 m × 100 m. Furthermore, more aquifer parameter data were collected and input for modeling land subsidence. Since the northern part of Semarang City is part of the Semarang groundwater basin, a conceptual model for the groundwater and land subsidence model was made for the entire Semarang groundwater basin. Figure 12 is a schematic of the computational cell of a groundwater model for the Semarang City groundwater basin. The height of the cell is equivalent to the vertical depth of the soil layer at each site. Following the geological investigation presented in Figure 5, the model’s z-axis complies with the stratigraphic condition that is made up of three layers, consisting of (1) upper aquitard intercalated with (2) sand and gravel lenses, and (3) the Damar Formation at the base.
The boundary conditions for the numerical simulation of the Semarang groundwater basin are prescribed as (1) a no-flow boundary in some southern parts that reflect the existence of impermeable rocks and reverse faulting, (2) a groundwater divide boundary in the southwest part (extending from the south to the north), and (3) a constant head boundary in the north, west, and east parts due to sea and rivers.
The topographic data used in the numerical simulation are cited from DEM produced by DEMNAS Indonesia with a resolution of 0.27 arc-sec ≈ 8.325 m, while the data for the coordinates of the well are taken from the Mining and Energy Agency of Central Java Province, and the tidal data is the average tide of 1.07 m from the Meteorology and Geophysics Agency.
Semarang, similar to other Indonesian cities, has two seasons, i.e., dry and wet (rainy). The dry season lasts from April to September, while the wet season begins in October and ends in March. The average annual temperature in Semarang City is 28.08 °C, with a humidity of 76.61%. In Semarang City, annual rainfall ranges from 1500 to 3000 mm. Rainfall during the rainy season recharges groundwater and also causes river overflows and floods [79]. However, we did not include the effects of river overflow and flooding as specified head conditions due to insufficient data. Rainfall data recorded by the Indonesian Water Resource Agency, Public Work Department, are used for recharge input data from 1970 to 2010. Mangkang Barat/West Mangkang River, Mangkang Timur/East Mangkang River, Garang River, and Canal Timur/East Canal River are all included in the model and are prescribed as the boundary conditions (IBOUND). The piezometric level of the Damar aquifer in Semarang City drops rapidly and has surpassed the aquitard past maximum effective stress, and the demand for groundwater from the Damar aquifer was assumed constant during the dry and wet season.
The aquifer of Semarang City is separated into 20 hydrogeological polygons to input the hydrogeological parameters into the numerical model, as shown in Figure 12. The hydrogeological polygons separating sections were initially obtained by borehole and laboratory data in Table 1. The values of the elastic skeletal storage coefficient (Sfe) and inelastic skeletal storage coefficient (Sfv) are used for the no-delay interbed layer, whereas vertical K (hydraulic conductivity), elastic particular storage, and inelastic specific storage are integrated into the delay interbed layer. For modeling purposes, the initial properties were adjusted to satisfy the model calibration, as summarized in Table 2. In this modeling, a delayed bed was assigned for Unit-1 as justified by its behavior as an aquitard. Unit-2 and 3 were assigned non-delay beds and Sfe and Sfv were set equal to establish elastic behavior.

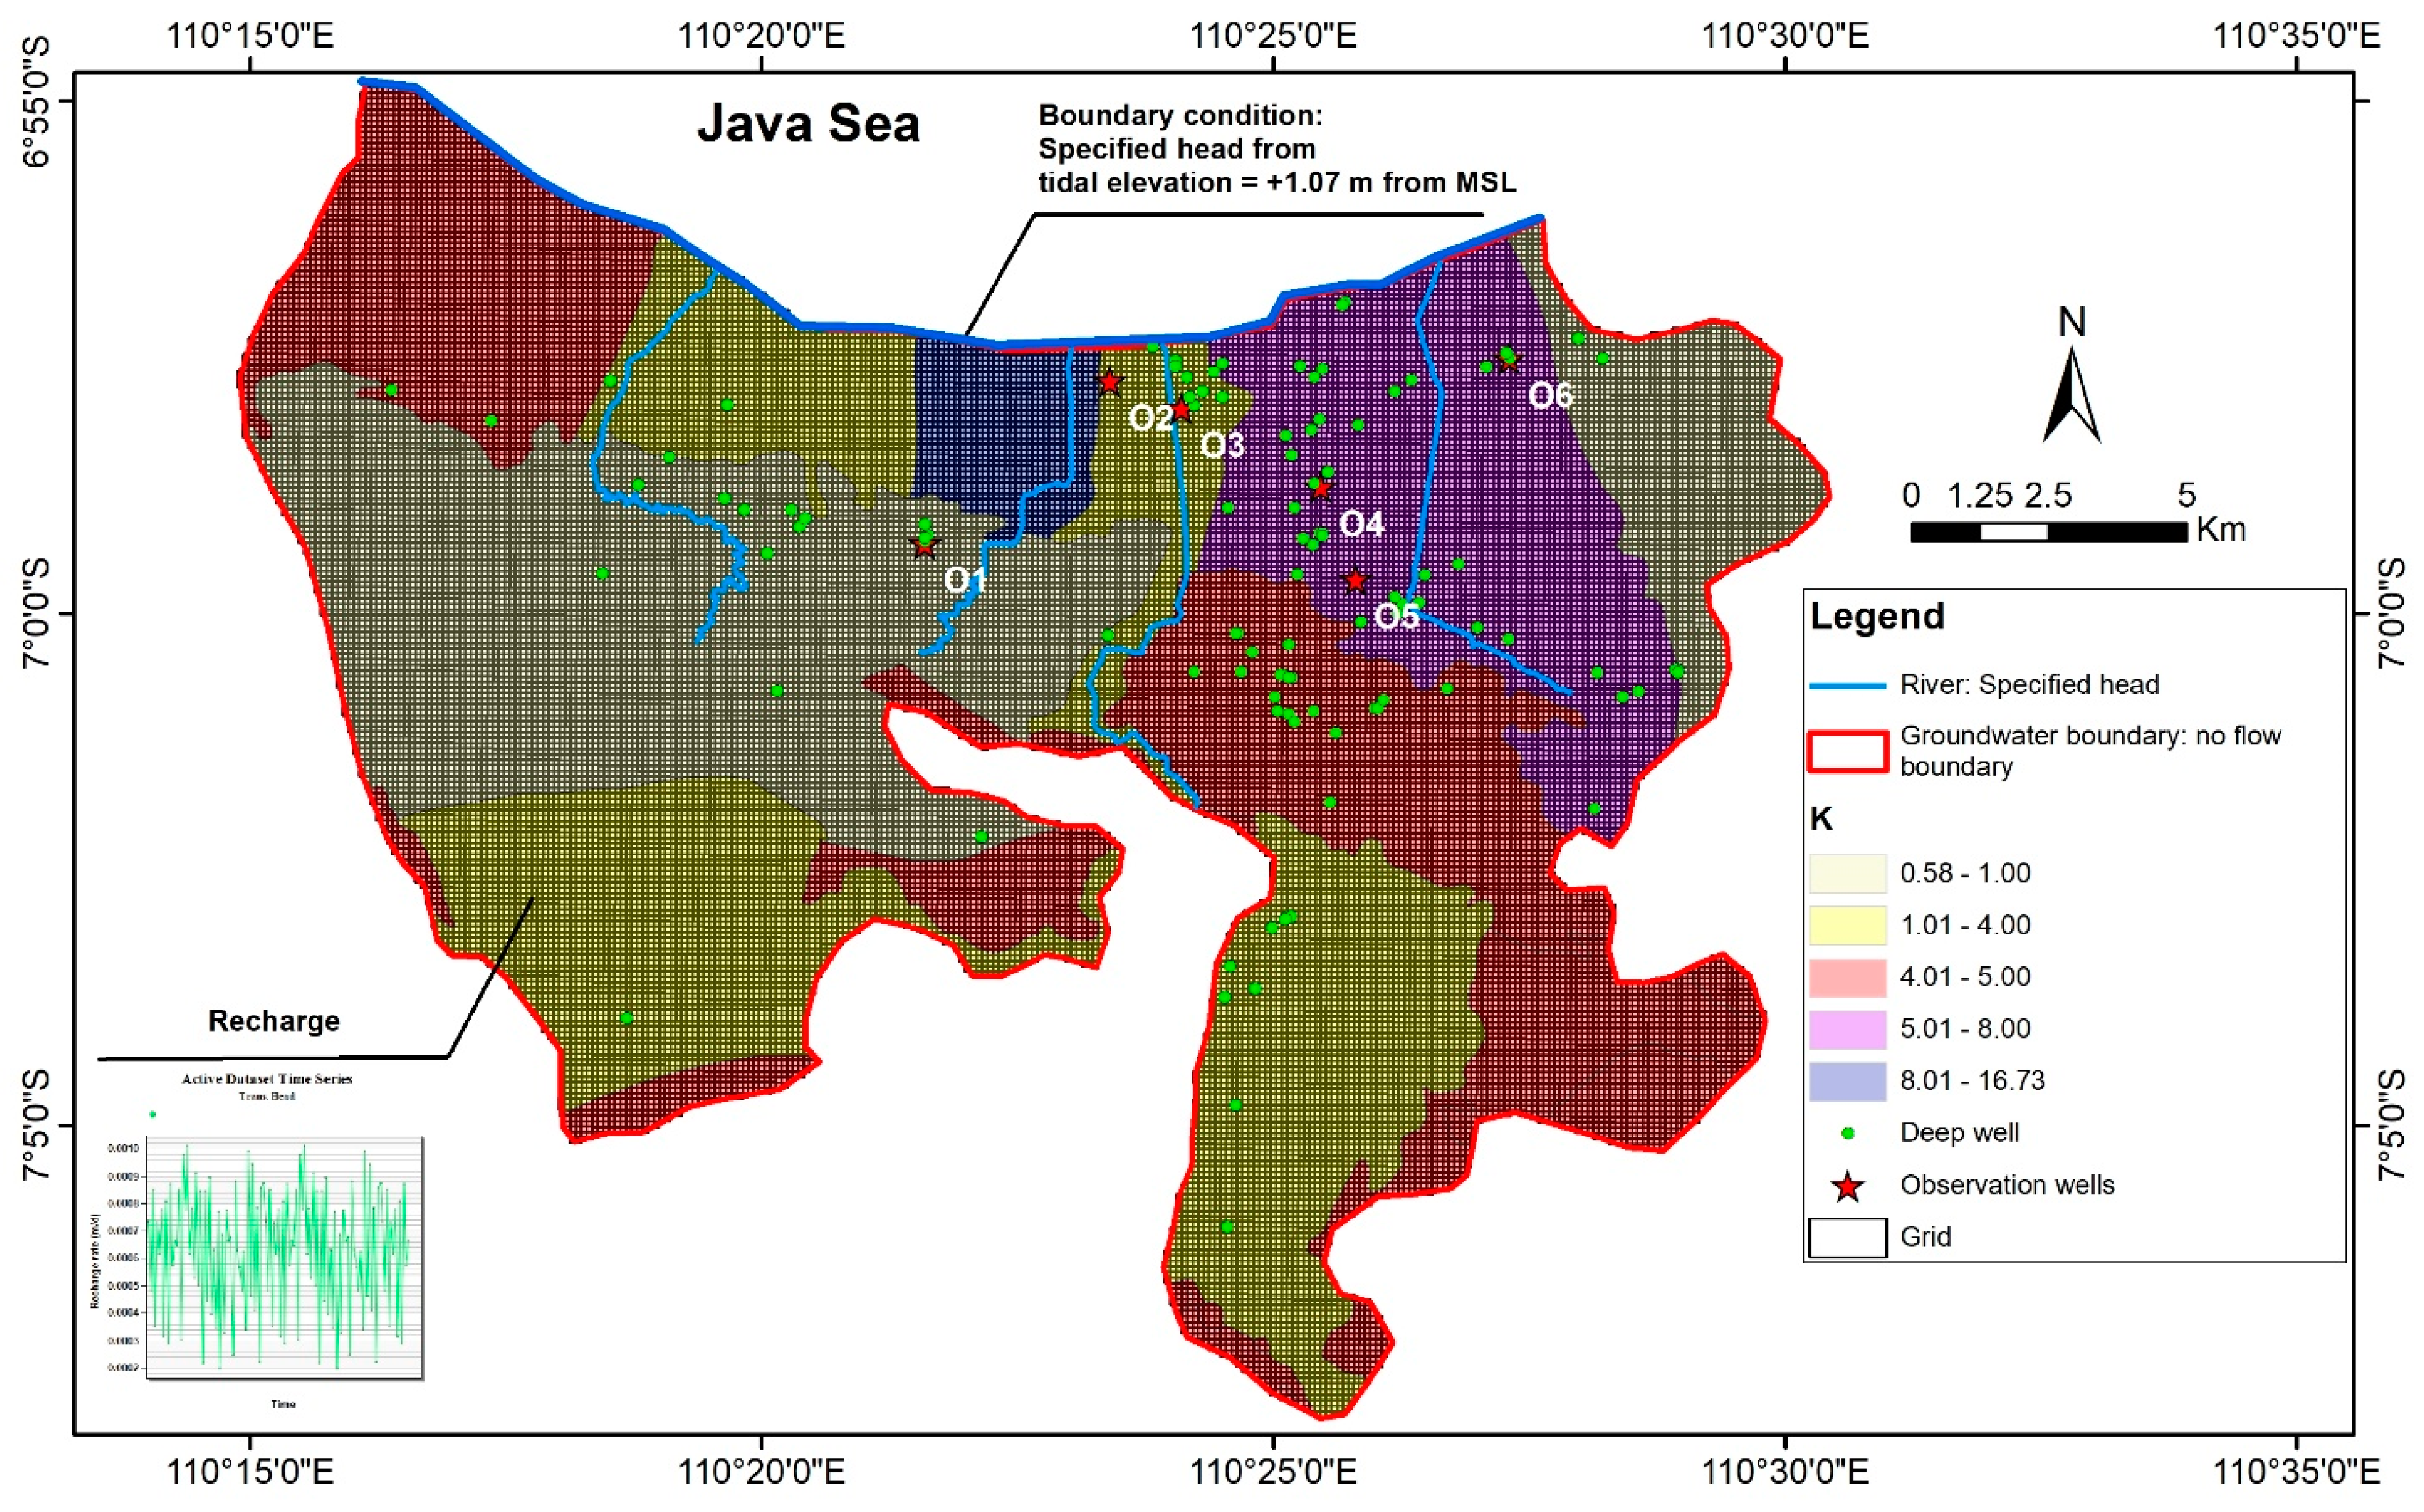
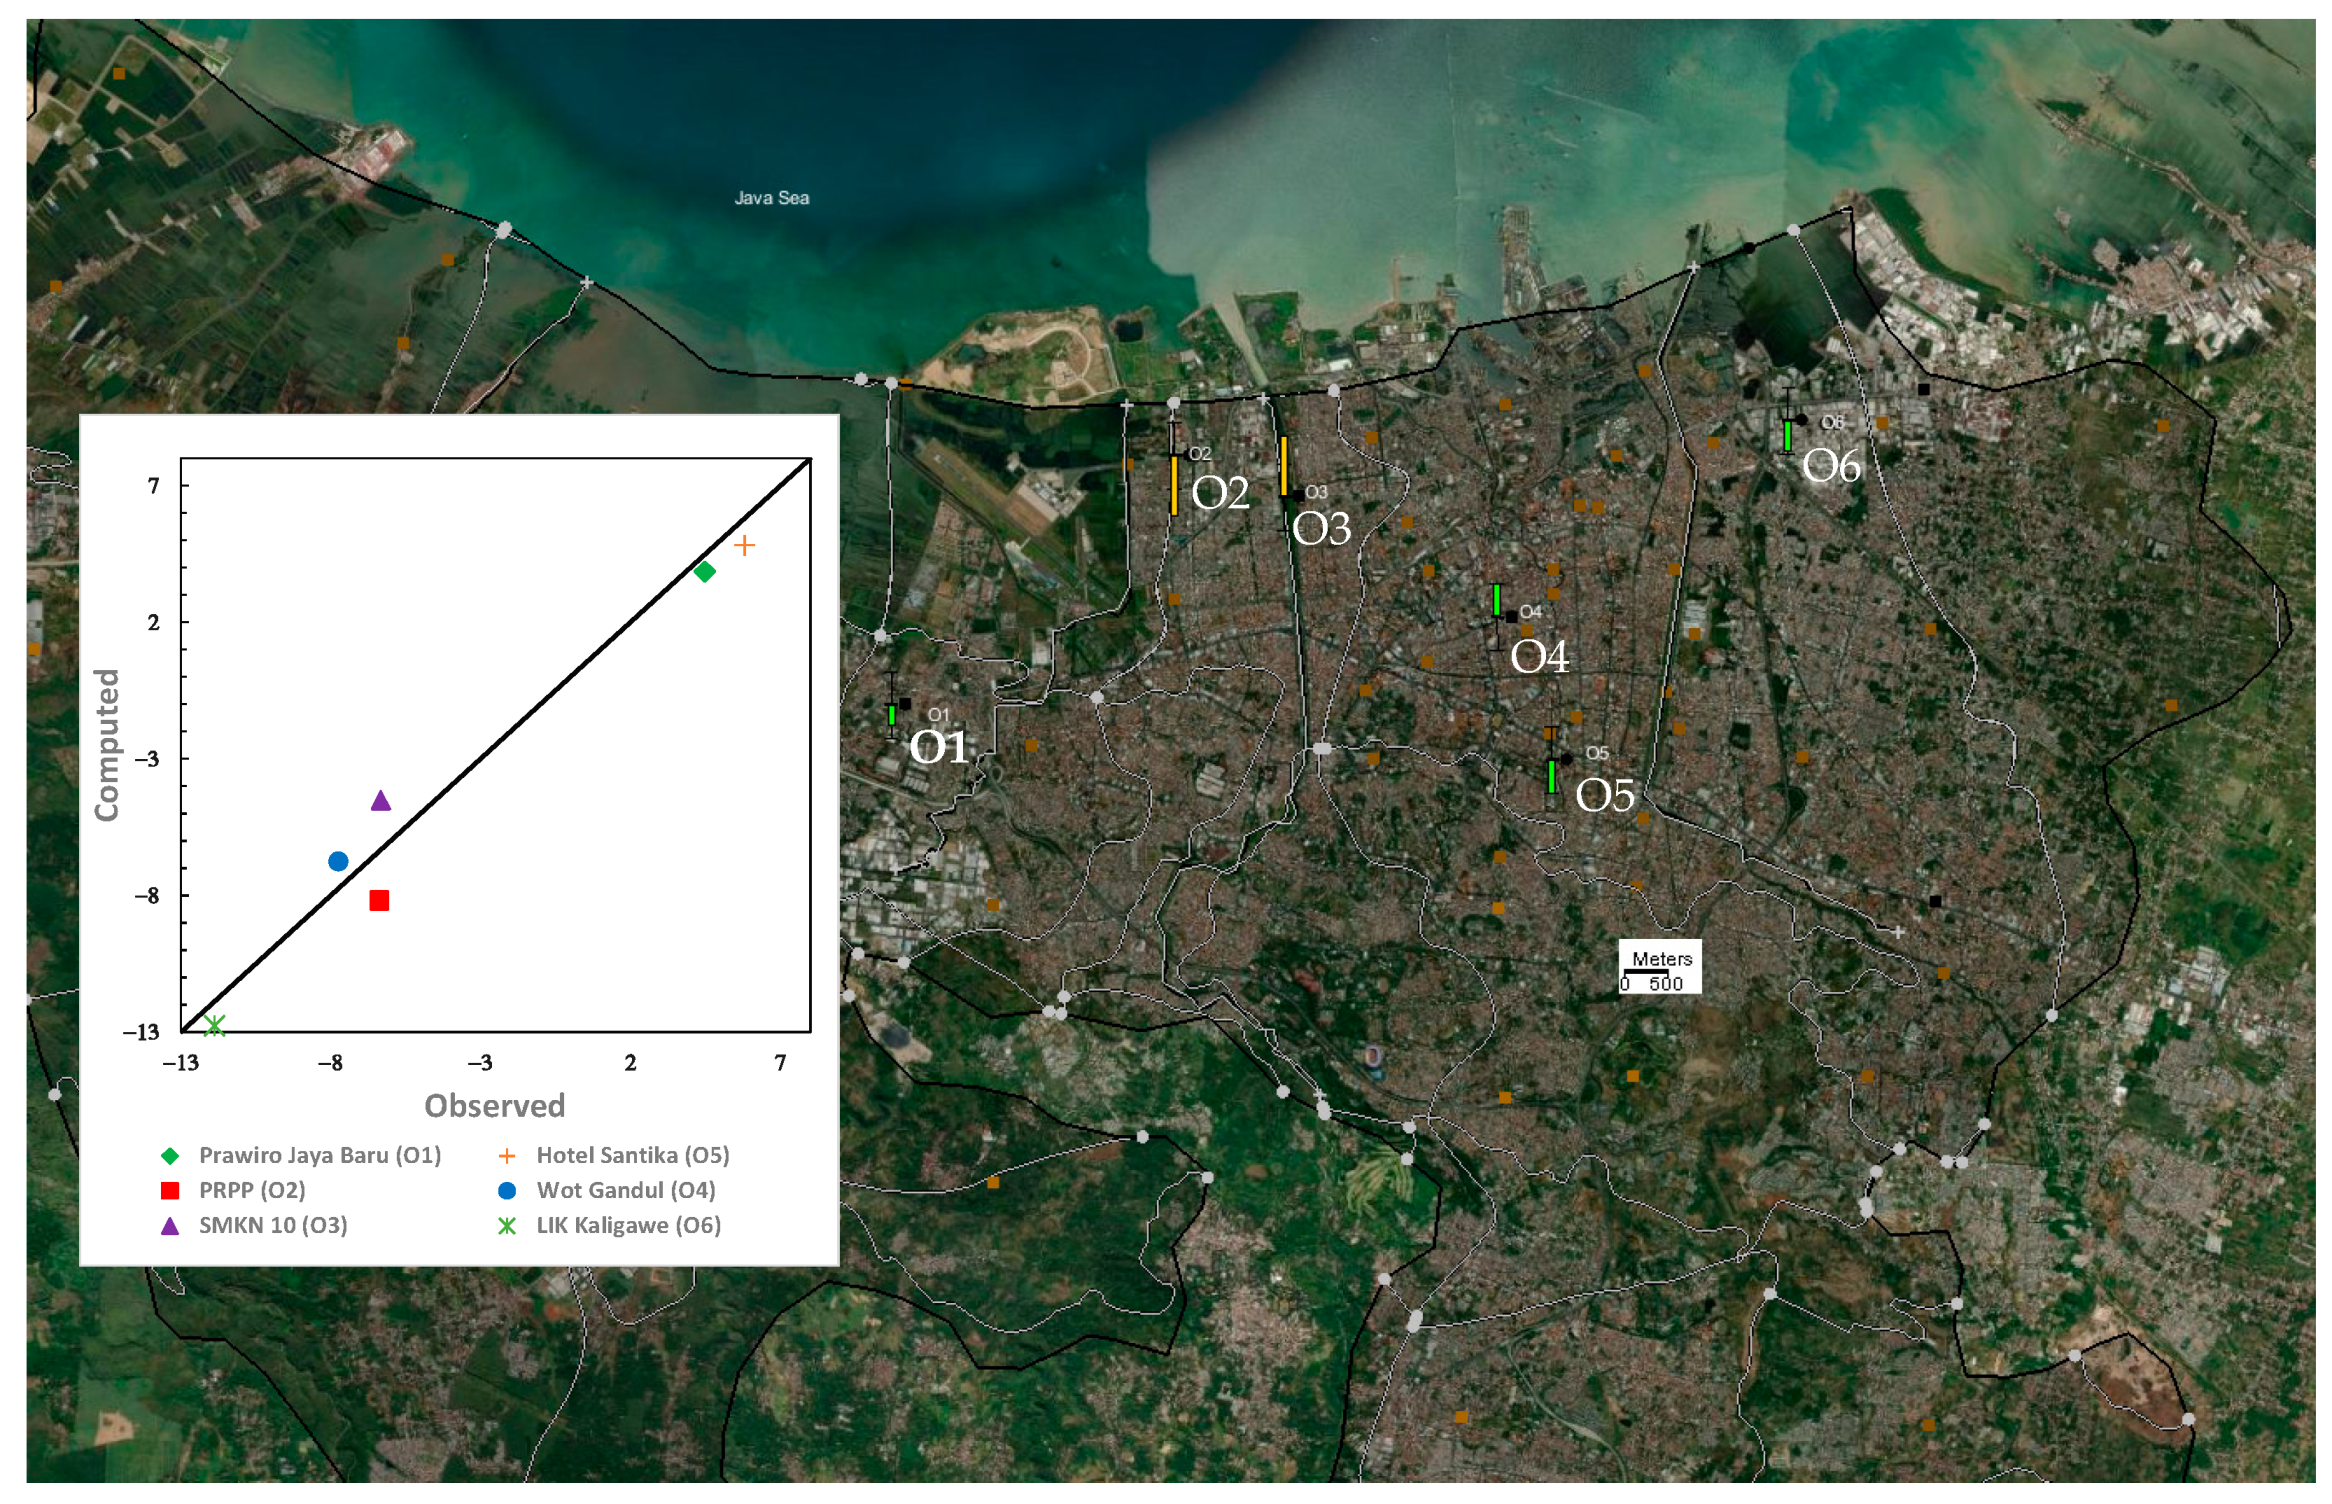
4.3. Groundwater Numerical Model for the Steady-State Flow Model

The steady-state flow model was utilized to ensure that the hydrogeological input data are rational before they are next applied as the initial condition for the transient flow model. In the steady-state flow model, the values of appropriate input parameters for all grids, such as recharge and hydraulic conductivity, are determined to guarantee that the computed head in the model is able to match the observed head accurately. The steady-state flow model was performed based on the period of 1970 to 1990. Since the steady-state conditions do not take into account the temporal changes, the calibration of the steady-state process used the average observed data from 1970–1990 obtained from observation wells to assess whether the developed model is in agreement with field measurements. There are 54 observation wells in Semarang City. Unfortunately, much recorded data at observation wells have been lost. To this end, the model in this work was calibrated and verified using data from six observation wells, i.e., Prawiro Jaya Baru (O1), PRPP (O2), SMKN 10 (O3), Wot Gandul (O4), Santika Hotel (O5), and LIK. Kaligawe (O6).
To reduce the difference between the calculated and measured heads, a number of trial-and-error attempts were made to calibrate the hydraulic conductivity and recharge within the range of their theoretical values. The calibration results between the computed and observed values are depicted in Figure 13. It can be seen that values are close to the 45° line on the graph, mathematically pointing out a perfect correspondence between the computed head and the observed head. The colored bars represent the magnitude of the error at each observation well, with green color indicating that the error value is less than 1 m, yellow color indicating that the error value is between 1 m and 2 m, and red color indicating that the error value is greater than 2 m.
Figure 13 shows that the correlation value is very close to the 45° line at all observation wells. The value of Root Mean Square Error (RMSE) computed for all observation wells is 1.270 m. The individual discrepancy in water head for Prawiro Jaya Baru (O1), PRPP (O2), SMKN 10 (O3), Wot Gandul (O4), Hotel Santika (O5), and LIK Kaligawe (O6) are 0.618 m, 1.805 m, 1.812 m, 0.995 m, 0.980 m, and 0.597 m, respectively. Among them, the values at Wells O2 and O3 are relatively larger. Considering that the distance of the O2 and O3 observation wells to the boundary conditions is 0.29 km and 1.56 km, respectively, it is possible that the specified head boundary has a strong influence on the observation wells.

4.4. Groundwater and Land Subsidence in the Past

After the steady-state flow model was precisely calibrated, simulation and calibration were then undertaken for the model of transient flow and land subsidence to analyze the effect of groundwater flow due to pumping on land subsidence. The recharge rate utilized in the transient flow model was based on precipitation data from 1990 to 2010. Calibration of the transient flow model was conducted based on the period from 1990 to 2010, whereas the period from 2010 to 2020 was subsequently applied for validation. As achieved in the steady-state flow model, the computed groundwater level was thus compared with the observed level in the historical record of six observation wells from 1990 to 2010. The calibration of land subsidence magnitude was performed with the recorded data at the GPS measurement stations around the four observation wells (O2, O3, O4, and O6) since the other two observation wells are far from the GPS measurement points. Land subsidence data from 1990 to 2014 were utilized for land subsidence calibration. In addition to the GPS measurement, InSAR data were also used for calibration and validation. The use of InSAR can bridge the gaps between the leveling and GPS methods, and can provide the latest deformation because the satellite image is available until 2020. Figure 14 shows the subsidence contour map at the end of 2010 based on the simulation result, as well as the comparison of the computed and observed groundwater heads from 1990 to 2010. Figure 15 presents a graphic representation of the simulation result of land subsidence at O2, O3, O4, and O6, as well as the calibration with various geodetic measurements.
Figure 14 reveals that the most significant drop in land subsidence and groundwater level in 2010 occurred in Semarang Utara and Genuk sub-districts, whereas there was a vertical uplift in the southwest part of Semarang City. The values of RMSE for the calibration of groundwater level calculated in the transient flow model at O1 to O6 are 0.42 m, 1.91 m, 1.82 m, 1.76 m, 0.86 m, and 1.1 m, respectively, while the coefficient of determination (R2) takes the value of 0.6, 0.84, 0.91, 0.8, 0.75, and 0.98 at O1 to O6, correspondingly. One can also find from Figure 15 that the highest land subsidence in 2020 still took place in the northeast region of Semarang City. The RMSE values for calibrating the simulation of land subsidence at O2, O3, O4, and O6 are 5.88 cm, 7.34 cm, 7.32 cm, and 2.17 cm, respectively, while the R2 values at these four observation wells are 0.91, 0.97, 0.99, and 0.99, correspondingly. This implies in the mathematical sense that the land subsidence model is in good agreement with field measurements. InSAR was also utilized to calibrate the land subsidence model when no land subsidence monitoring data from leveling or GPS was available, as done in Figure 15.
Figure 15 also reveals the fact that O2 (PRPP) at the northwest region of Semarang City and O6 (Kaligawe) at the northeast suffered from the greatest land subsidence. It can also be observed that the linear portion of the subsidence curves in Figure 15 represents the fast subsidence rate during 1990–2000. The subsidence patterns follow the groundwater withdrawal trend as observed in Wotgandul and Kaligawe. Different patterns are shown in the northwest area (PRPP and SMKN); the fast subsidence rate occurred from 1990 to 2000, but subsidence appears to decelerate afterward while groundwater levels were still falling. These differences are possibly due to the heterogeneity of the subsurface stratigraphy and hydraulic conductivity. In addition, a physical explanation behind this phenomenon can be explored by revisiting Figure 5, which shows that the sand lenses within the alluvial deposit are more intensive in the northwestern part. These sand layers act as drainage paths that accelerate pore pressure dewatering of the clayey soil, causing fast subsidence during the early period of a piezometric drop. Further decrease in piezometric levels thus creates smaller subsidence due to the dissipation depletion of excess pore water pressure. Therefore, land subsidence alleviated after 2010, partially because further lowering of piezometric levels did not surpass the soil preconsolidation pressure, in turn leading to a smaller subsidence rate. Preconsolidation pressures of the subsurface clay were measured by oedometer tests from undisturbed samples retrieved from borehole SMG-01 (northeast Semarang) and SMG-02 (northwest Semarang). The clay layers in SMG-01 are underconsolidated to normally consolidated, while the clay layers in SMG-02 are overconsolidated up to 40 m depth and normally consolidated at the depth of 50–60 m. The critical groundwater level required by the clay layer to undergo inelastic compaction was calculated from its preconsolidation pressure. It was shown that the piezometric groundwater level in the northeast has surpassed the critical groundwater level; therefore, inelastic compaction occurs. Meanwhile, in the northwest, the piezometric groundwater level is still above the critical groundwater level; hence, the subsidence is small.
Figure 15 also depicts that in Wot Gandul and Kaligawe, land subsidence was found to accelerate after 2010. This can be physically illustrated by the fact that groundwater piezometric levels have dropped beyond the recent preconsolidation pressure, thus causing fast, irreversible subsidence. A detailed examination of Figure 14 indicates that every 1 m drop of a piezometric level can result in an approximately −0.1 m vertical settlement.
To validate the simulation results, simulated subsidence was compared to subsidence based on InSAR analysis at points other than observation points. Figure 16 depicts sample points for detecting land subsidence using InSAR and simulated subsidence.
According to Figure 16, the simulated subsidence versus InSAR in the northern part of Semarang is close to the 45° line and has a small RMSE value (below 2 cm), whereas the RMSE values in the east-south area (Points 4 and 6) are quite large (above 2 cm) and quite far from the 45° line. The east-south compaction rate has a high RMSE value, which could be attributed to the onset of the subsidence process and the difference in time spans used in the two types of data sets in the area. The land subsidence simulation was carried out by taking a period of 30 years starting in 1990 and ending in 2020, whereas InSAR only examined the period 2015–2020. Based on the land subsidence simulation, the piezometric pressure in the east-south part of the simulation was drastically reduced at the start of the simulation. This is consistent with the piezometric contours of the Damar Formation aquifer [80], as well as the very large decrease in piezometric pressure of the Damar Formation aquifer until 1997, followed by a slower decrease [45]. However, when compared to the GPS measurement results for subsidence, the simulation results in the area have similar values.

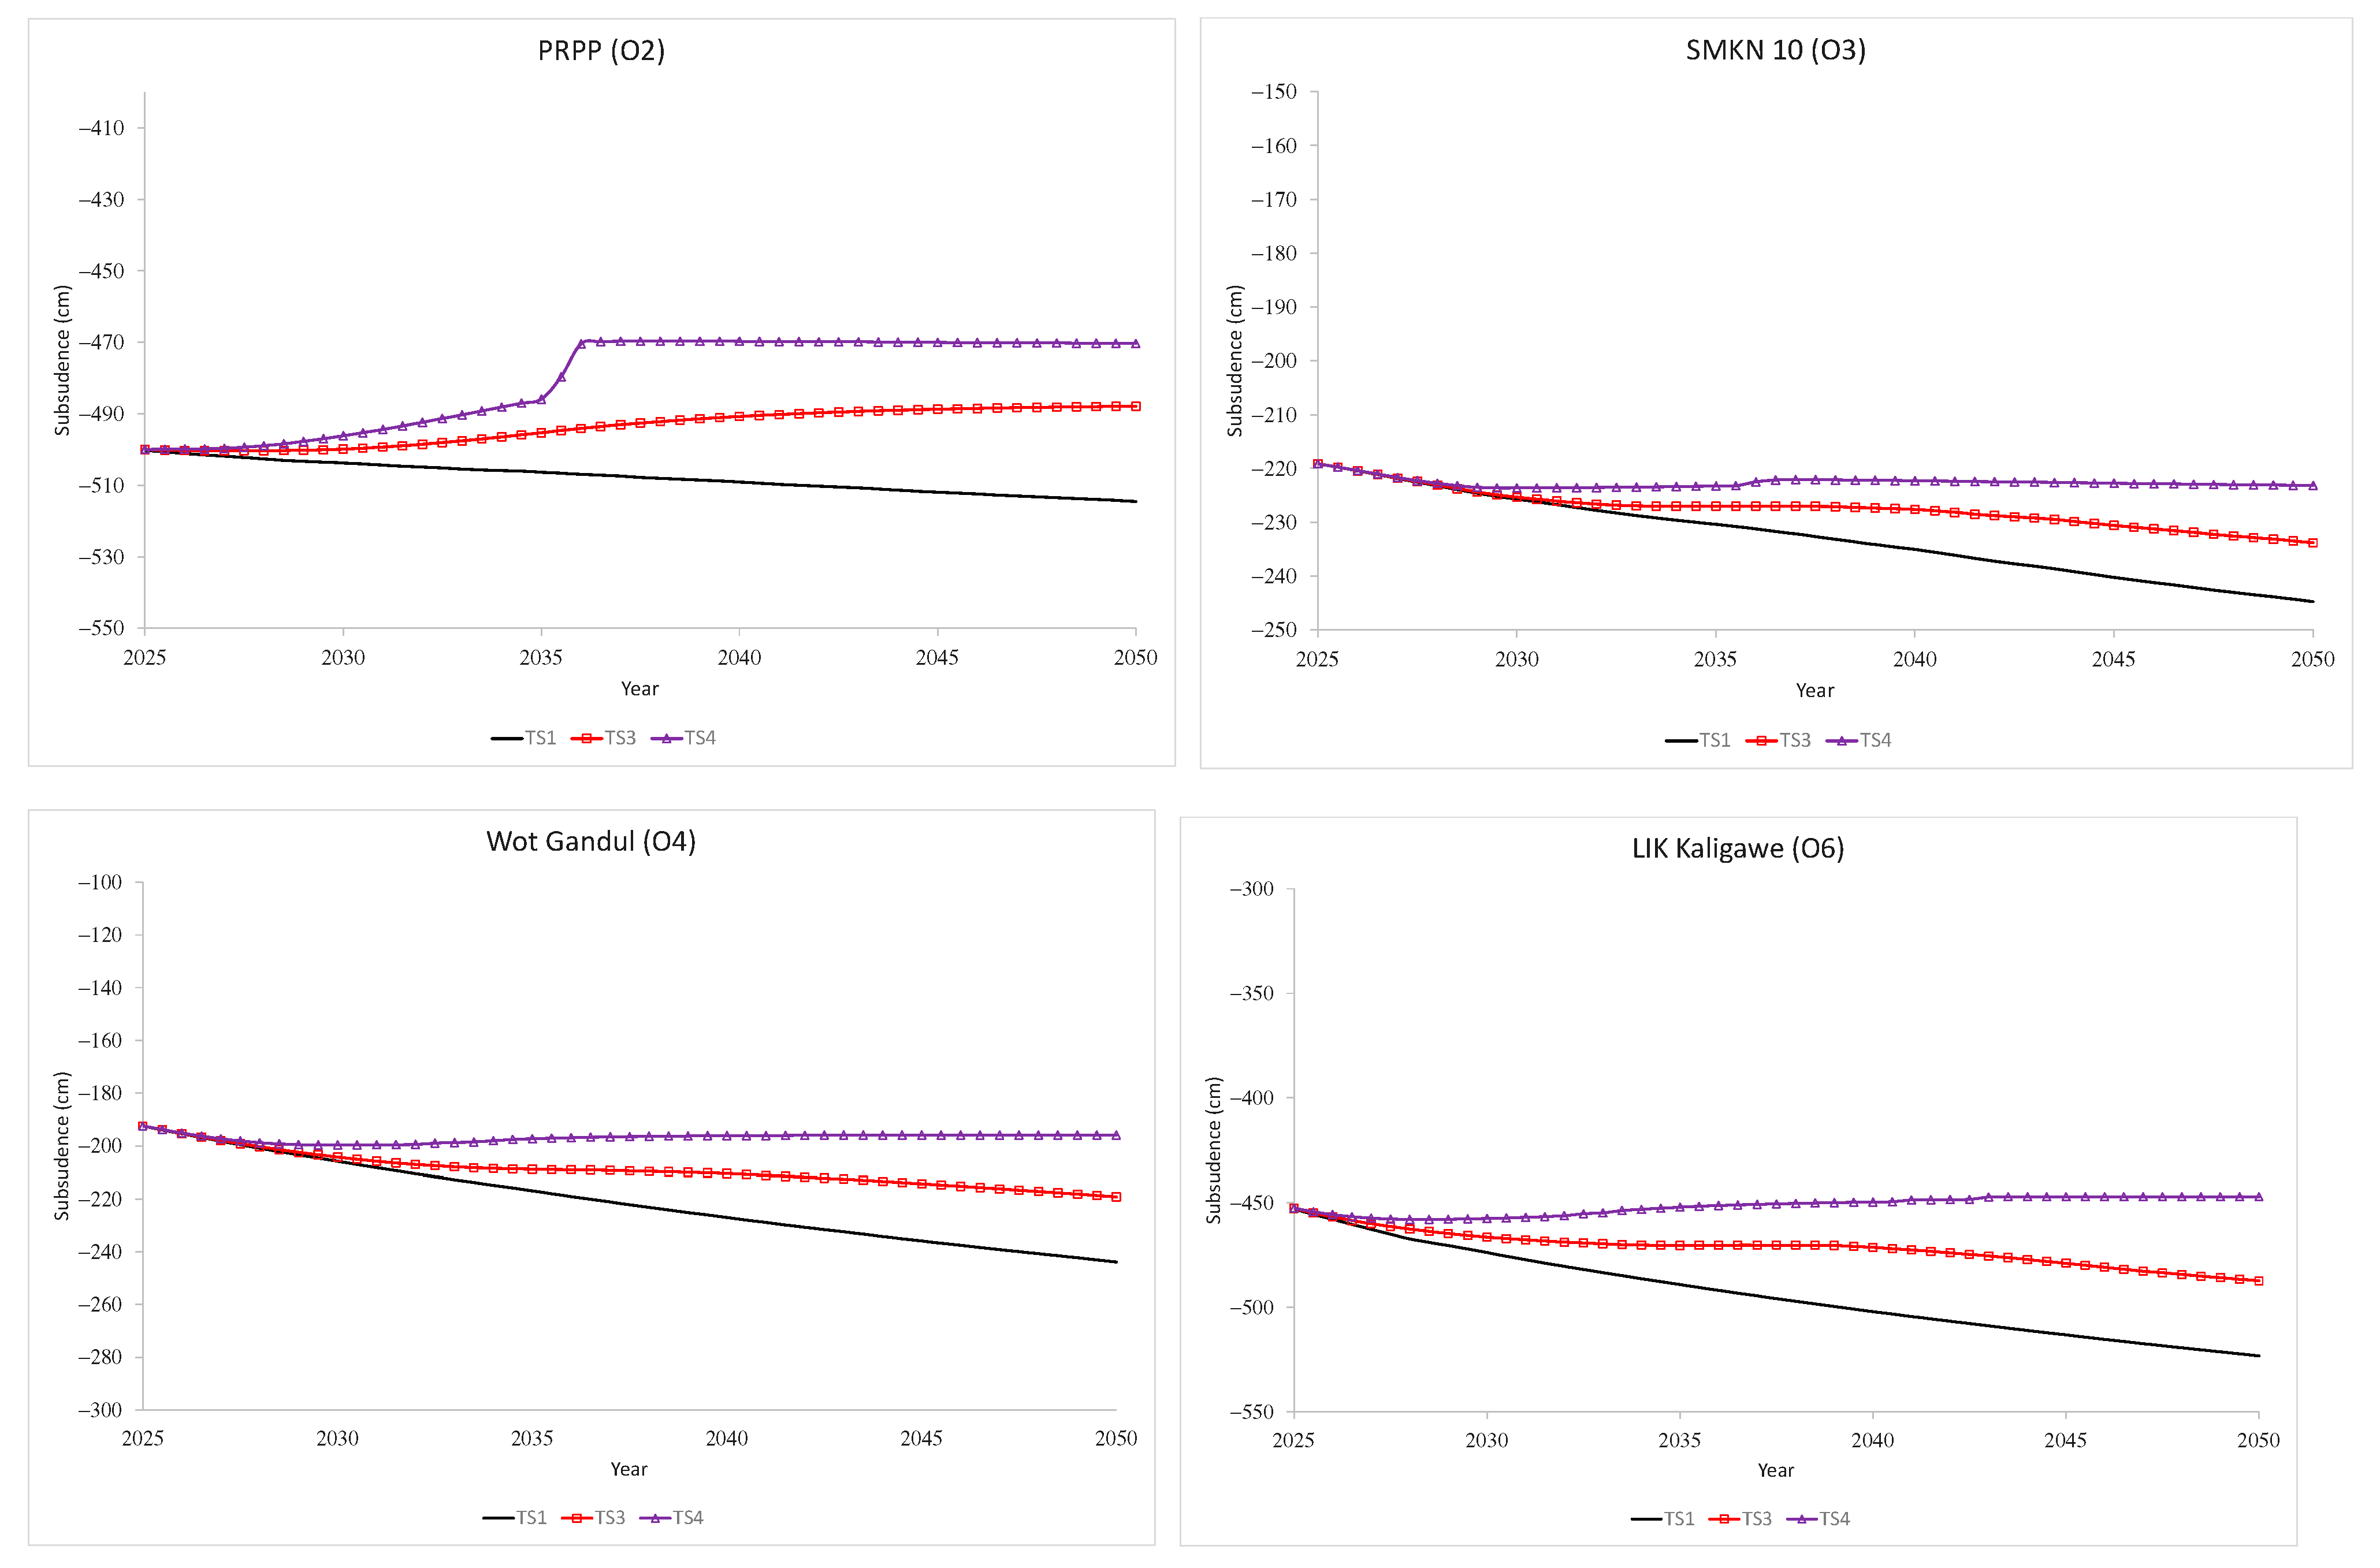
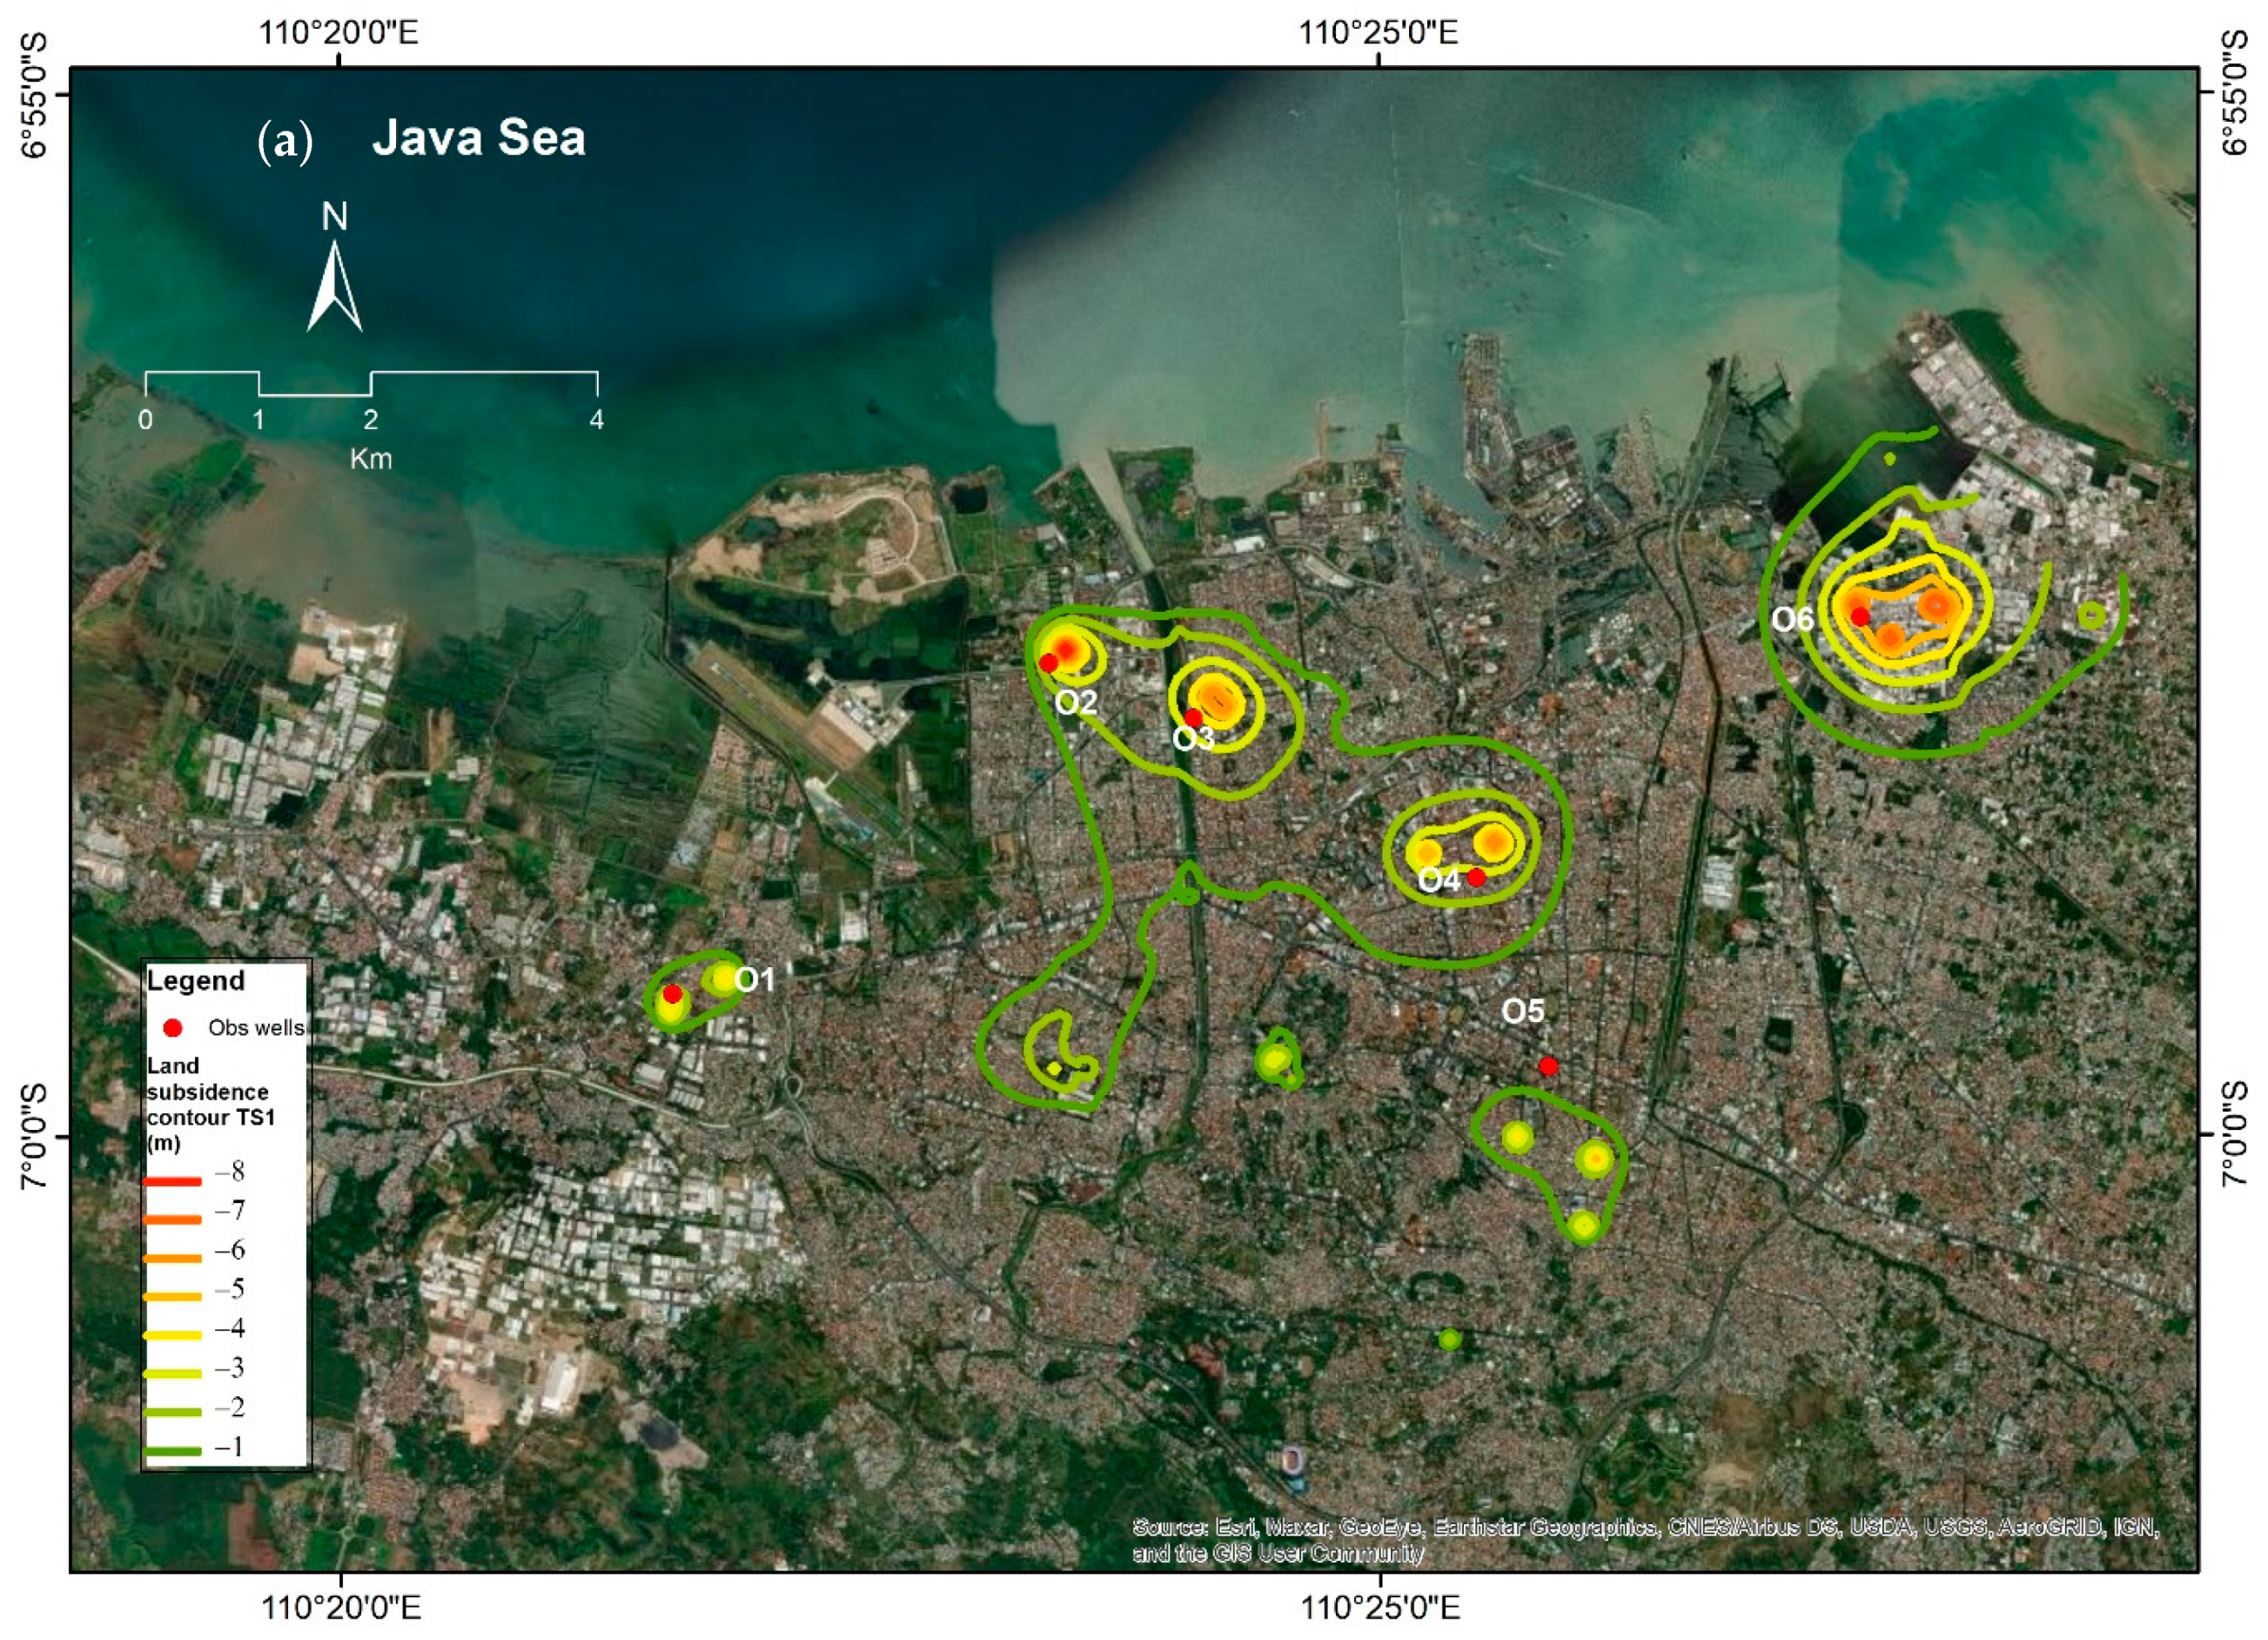
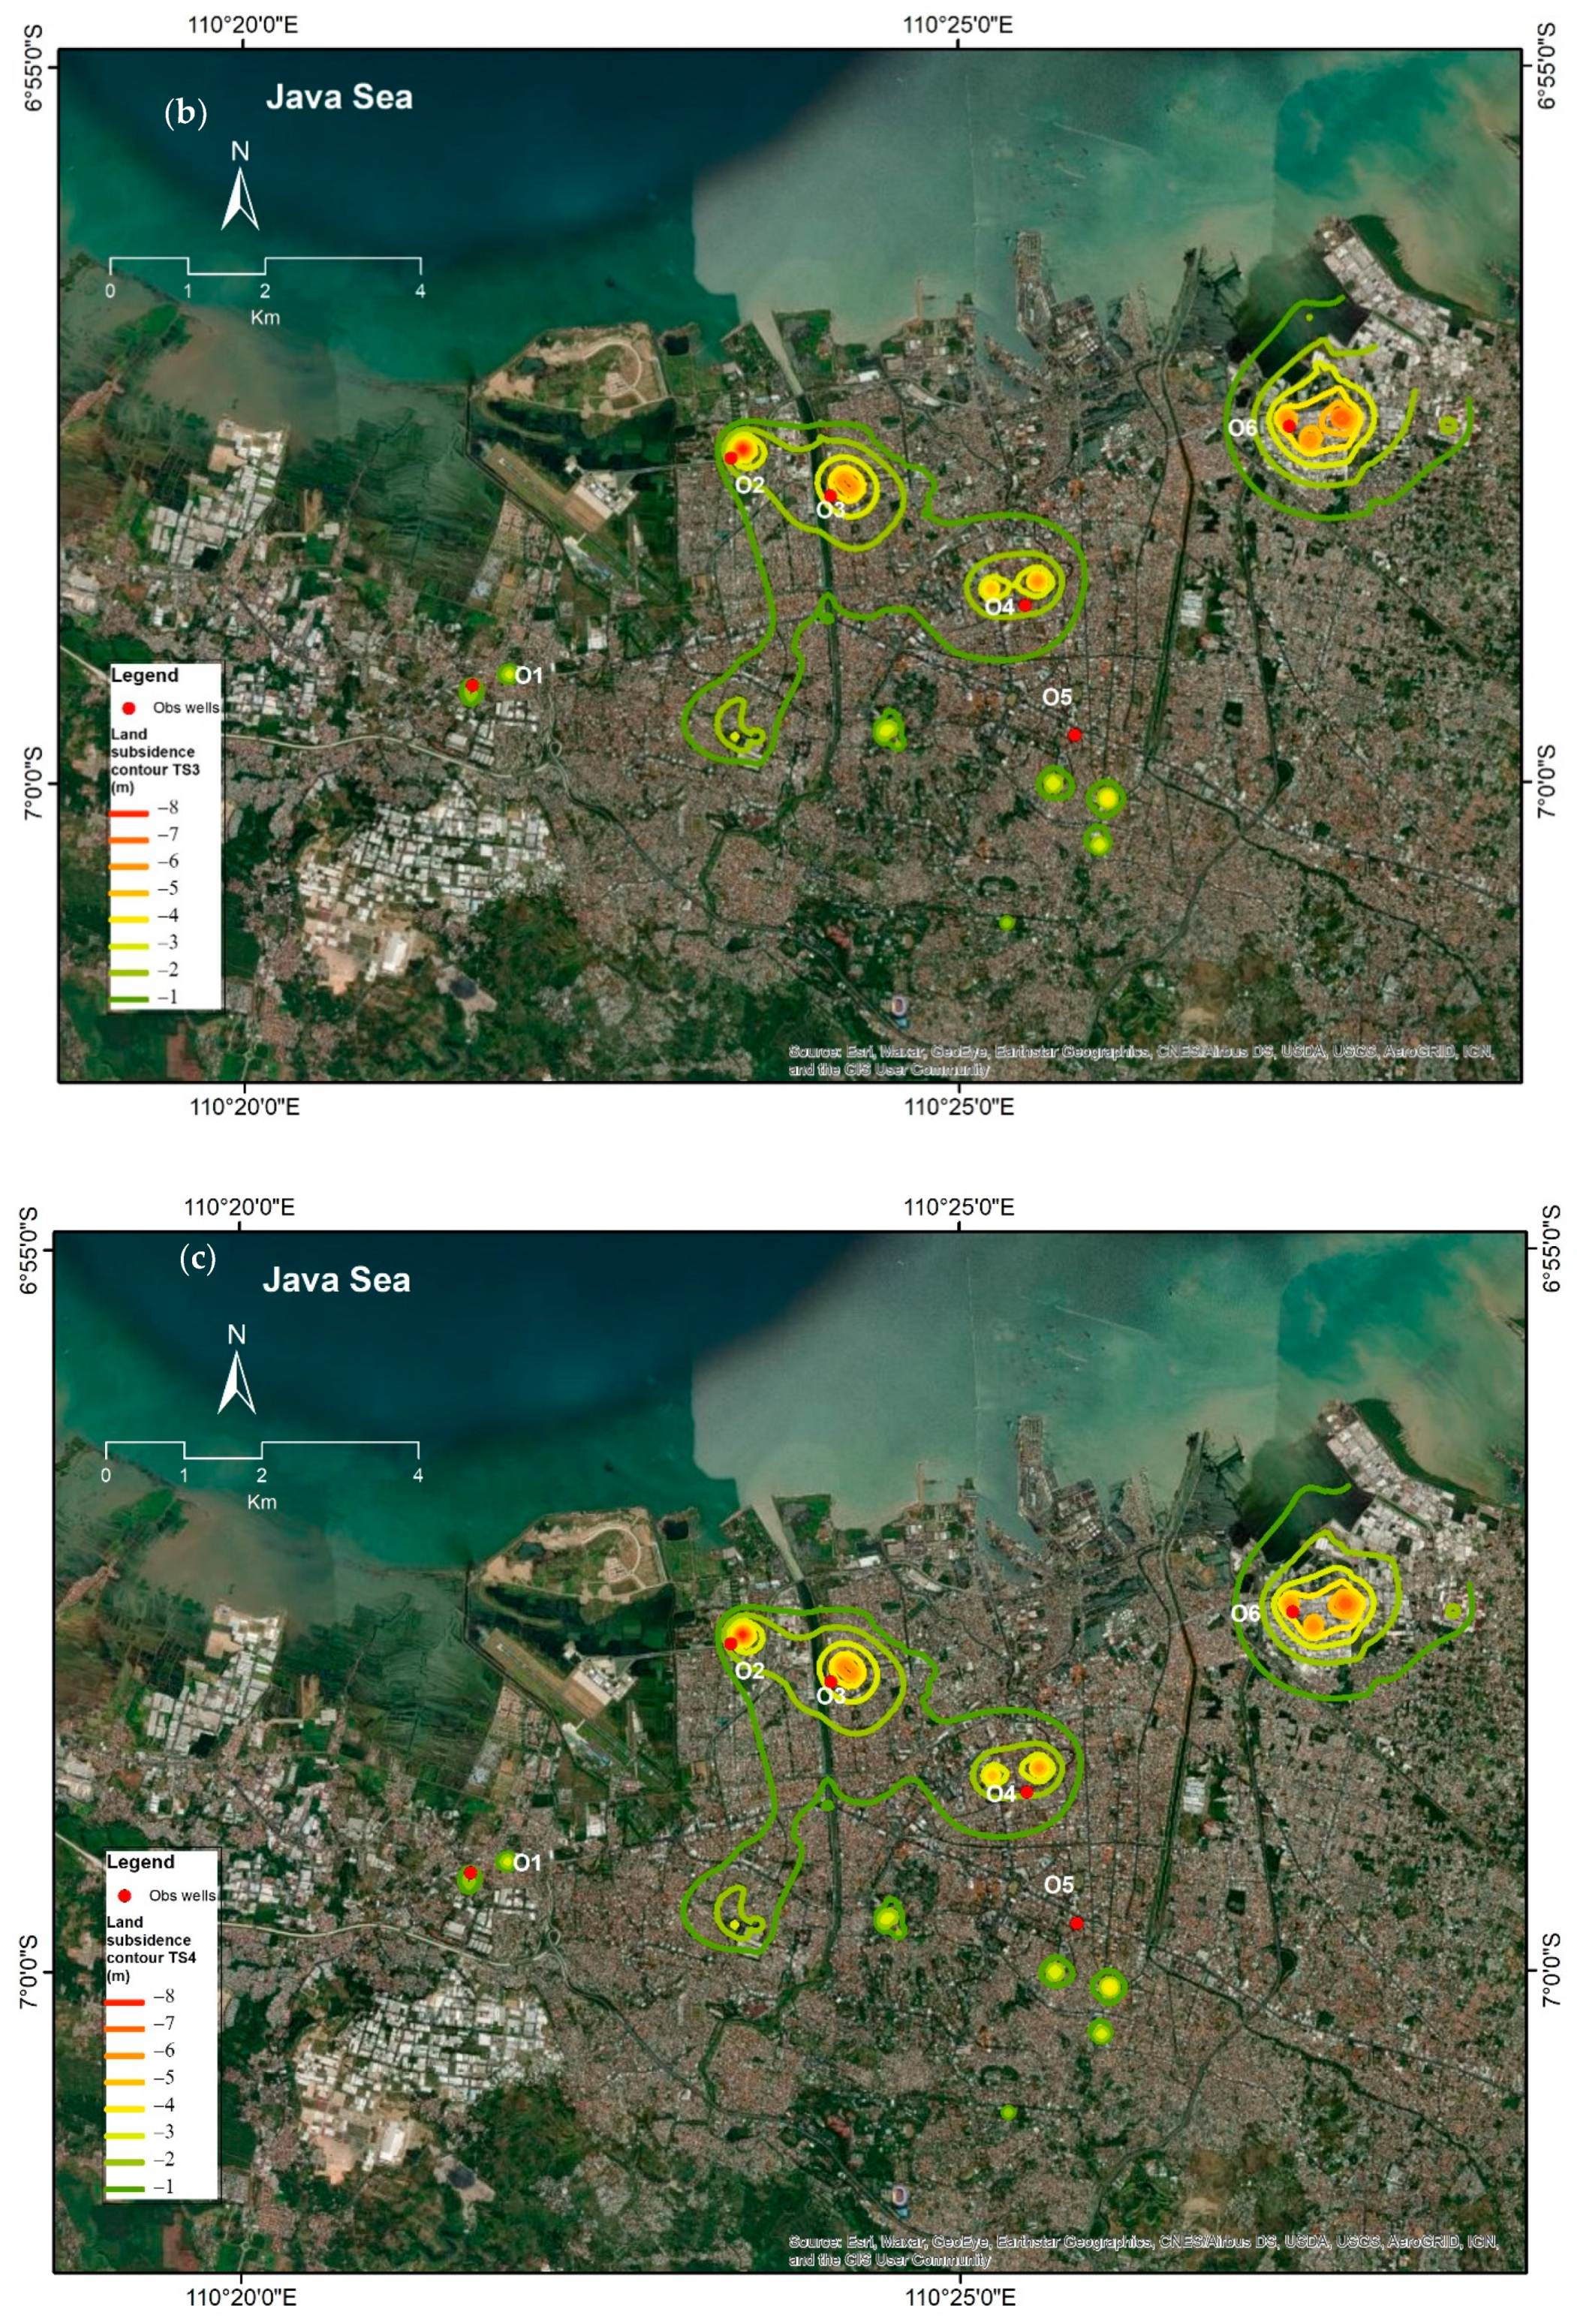
4.5. Future Projection of Land Subsidence

This section concerns whether the problem of land subsidence will worsen if groundwater over-extraction continues in the northern part of Semarang City. A further assessment was thus conducted to predict the future development of land subsidence, after which the countermeasures for managing the problem of drops in regional groundwater level and resulting land subsidence are recommended. Lo et al. [49] have recently conducted a numerical study to provide future predictions of groundwater levels under different scenarios based on the implementation of various management measures. Their results show that among three proposed management measures (i.e., TS2, TS3, and TS4), a regulation strategy to reduce by 10% both the number and production capacity of deep wells from 2035 to 2050 has the most significant effect on groundwater restoration.
The same two scenarios (TS3, and TS4) for controlling groundwater pumping used by Lo et al. [49] were adopted and then performed in the land subsidence simulation in this study. The TS3 and TS4 scenarios were compared with the TS1 scenario without any management measure to quantify the effectiveness of these two management strategies on land subsidence. The TS1 scenario is a direct projection of land subsidence from the trend line (calculated in Lo et al. [49]) of the output capacity of deep wells from 2010 to 2050. The TS3 and TS4 scenarios are the representations as a consequence of a reduction in the number of deep wells and their production capacity by 5% and 10%, respectively, annually from 2025 to 2034, and then maintaining their number and capacity from 2035 to 2050. Figure 16 depicts the simulation results of land subsidence from 2010 to 2050 at O2, O3, O4, and O6. The contour maps of land subsidence in 2050 are presented in Figure 16 for TS1, TS3, and TS4, respectively.
A comparison of Figure 15 and Figure 17 reveals that the subsidence trend at PRPP (O2) and SMKN 10 (O3) subject to the TS1 scenario until 2050 takes a similar path to Figure 15, with rates of 10.8 mm/year and 11.98 mm/year, respectively. Higher rates of land subsidence were found at Wot Gandul (O4) (25.83 mm/year) and Kaligawe (O6) (36.8 mm/year). When the control measures (i.e., TS3 and TS4) are put in place, the subsidence degree at PRPP (O2) shows a rebound of around 10 to 27 cm at the end of 2050 as compared to 2020. A slowing down of subsidence rates from 2020 to 2050 can be also observed at SMKN 10 (O3) (26.03% and 51.42% under the TS3 and TS4 scenarios, respectively), Wot Gandul (O4) (27.27% and 53.03%, respectively), and LIK Kaligawe (O6) (27.87% and 59.08%, respectively). However, at PRPP (O2), we found that variations in effective stress due to changes in groundwater level do not surpass its preconsolidation pressure; therefore, the reduction in subsidence rates when the groundwater level is raised under the TS3 and TS4 scenarios would not be significant, while in other places, the rebound of the groundwater level is capable of reducing the subsidence rate.
Particular attention should be directed again to Figure 17 and Figure 18, where two groundwater management strategies are demonstrated to indeed mitigate the further development of land subsidence. A quantitative analysis based on these figures is presented in Table 3, summarizing the results of the specified analysis for each scenario in Figure 15 and Figure 16. The affected area of land subsidence is divided into four regions: Region 1 is around Prawiro Jaya Baru (O1), Region 2 is around PRPP (O2), SMKN 10 (O3), and Wot Gandul (O4), Region 3 is around Hotel Santika (O5), and Region 4 is around LIK Kaligawe (O6). Among these regions, Region 2 has the greatest subsidence area. The percentage of decrease in the affected area (an area that has subsidence of more than 1 cm) of land subsidence is 2–75% if the TS3 scenario is taken, while the TS4 scenario is more effective with the percentage being 11–76%. Irrespective of the TS3 and TS4 scenarios, the greatest decrease in the affected area of land subsidence among all regions occurs in Region 1, with values up to 74.85% and 75.60% under the TS3 and TS4 scenarios, respectively. However, reducing land subsidence in Region 2 is critical and can yield the greatest economic benefits, since many commercial centers and government agencies, such as national-scale, city-scale, and neighborhood-scale trade zones, industry, and government offices, as well as high-density housing, are located in this region.

5. Conclusions

The northern part of Semarang City that is formed by alluvial deposits is prone to land subsidence, which has been exacerbated by over-drafting groundwater from deep wells in recent decades. To quantitatively analyze and model this problem, a systematic investigation of land subsidence caused by excessive groundwater abstraction was carried out in the current study using MODFLOW’s flow and subsidence packages integrated with the recorded data obtained from groundwater level observation, leveling, GPS, and InSAR. The precise calibration and validation of our model were achieved excellent agreement with field measurements, and it was then applied to project future developments of subsidence and groundwater level in 2050.
To mitigate the negative consequences of land subsidence in the future, two groundwater regulatory strategies are proposed. Our results indicate that the subsidence rate can fall from 26% to 59% in different regions with the introduction of these two measures. It is also shown that although Genuk sub-district (LIK Kaligawe) has a land subsidence rate of 36.8 mm/year, these measures can reduce the subsidence rate by up to 59%. The maximum reduction in the affected area of land subsidence was demonstrated to occur in Region 1 (around Prawiro Jaya Baru), where the affected area can be decreased by up to 75%. Since the northern part of Semarang City is experiencing land subsidence and is located in the coastal area, we strongly suggest that evaluation and prediction of the risk of coastal flooding due to land subsidence and global sea-level rise should be at the forefront of future research.

Author Contributions

Conceptualization, W.L. and S.N.P.; methodology, W.L. and S.N.P.; software, S.N.P.; validation, W.L. and S.N.P.; formal analysis, S.N.P.; investigation, S.N.P. and B.G.D.; resources, W.L.; data curation, D.S. and S.; writing—original draft preparation, S.N.P.; writing—review and editing, W.L. and D.S.; visualization, S.N.P.; supervision, W.L.; funding acquisition, W.L. All authors have read and agreed to the published version of the manuscript.

Funding

This research received no external funding.

Data Availability Statement

DEM data can be found here: http://tides.big.go.id/DEMNAS/ (accessed on 19 November 2019). InSAR data is Sentinel-1 data from 2015–2020 (https://comet.nerc.ac.uk/comet-lics-portal/, accessed on 25 June 2020), with frame ID 076D_09725_121107 covering Central Java Province. Rainfall data can be obtained on request from the Water Resource Agency, Public Work Department of Indonesia. Soil property data can be obtained on request from the Mining and Energy Agency of Central Java Province. Well locations and discharge data can be obtained on request from the Mining and Energy Agency of Central Java Province. Observation well locations and groundwater level data can be obtained on request from the Center for Groundwater and Environmental Geology, Ministry of Energy, and Mineral Resources. Hydrogeological data can be obtained on request from BBWS Pemali–Juana, Ministry of Public Work, Mining and Energy Agency of Central Java Province, Department of Geology, Diponegoro University.

Acknowledgments

The author would like to thank the Research and Community Service Institution (LPPM) Jenderal Sudirman University for technical support. We also appreciate the Water Resource Agency of the Public Work Department of Indonesia, the Center for Groundwater and Environmental Geology of the Ministry of Energy and Mineral Resources of Indonesia, and the Potential Analysis of Groundwater of the Department of Energy and Mineral Resources of Central Java Province for providing their data in the study area for analysis.

Conflicts of Interest

The authors declare no conflict of interest.

References

  1. Ezquerro, P.; Guardiola-Albert, C.; Herrera, G.; Fernández-Merodo, J.A.; Béjar-Pizarro, M.; Bonì, R. Groundwater and Subsidence Modeling Combining Geological and Multi-Satellite SAR Data over the Alto Guadalentín Aquifer (SE Spain). Geofluids 2017, 2017, 1359325. [Google Scholar] [CrossRef]
  2. Keith, J.; Larson, K.J.; Marino, M. Numerical Simulation of Land Subsidence in the Los Banos-Kettleman City Areal California Environmental Engineering; The UC Center for Water Resources: Berkeley, CA, USA, 2001. [Google Scholar]
  3. Sarah, D.; Satriyo, N.A.; Mulyono, A. Preliminary Study of Estimating Physical Losses Due to Land Subsidence in Semarang City (in Bahasa Indonesia). In Proceedings of the Presentation of Research Results of the Geological Research Center LIPI (Prosiding Pemaparan Hasil Penelitian Pusat Penelitian Geologi LIPI), Bandung, Indonesia, 2–3 December 2014; pp. 37–45. [Google Scholar]
  4. Carminati, E.; Di Donato, G. Separating Natural and Anthropogenic Vertical Movements in Fast Subsiding Areas: The Po Plain (N. Italy) Case. Geophys. Res. Lett. 1999, 26, 2291–2294. [Google Scholar] [CrossRef]
  5. Gambolati, G.; Teatini, P.; Tomasi, L.; Gonella, M. Coastline Regression of the Romagna Region, Italy, Due to Natural and Anthropogenic Land Subsidence and Sea Level Rise. Water Resour. Res. 1999, 35, 163–184. [Google Scholar] [CrossRef]
  6. Hu, R.L.; Yue, Z.Q.; Wang, L.C.; Wang, S.J. Review on Current Status and Challenging Issues of Land Subsidence in China. Eng. Geol. 2004, 76, 65–77. [Google Scholar] [CrossRef]
  7. Teatini, P.; Tosi, L.; Strozzi, T. Quantitative Evidence That Compaction of Holocene Sediments Drives the Present Land Subsidence of the Po Delta, Italy. J. Geophys. Res. Solid Earth 2011, 116, 1–10. [Google Scholar] [CrossRef]
  8. Zoccarato, C.; Minderhoud, P.S.J.; Teatini, P. The Role of Sedimentation and Natural Compaction in a Prograding Delta: Insights from the Mega Mekong Delta, Vietnam. Sci. Rep. 2018, 8, 11437. [Google Scholar] [CrossRef] [PubMed]
  9. Lo, W.-C.; Sposito, G.; Chu, H. Poroelastic Theory of Consolidation in Unsaturated Soils. Vadose Zone J. 2014, 13, vzj2013.07.0117. [Google Scholar] [CrossRef]
  10. Gambolati, G.; Teatini, P. Coastline Evolution of the Upper Adriatic Sea Due to Sea Level Rise and Natural and Anthropogenic Land Subsidence; Singh, V.P., Ed.; Kluwer Academic Publishers: Dordrecht, The Netherlands, 1998. [Google Scholar]
  11. Tran, D.-H.; Wang, S.-J. Land subsidence due to groundwater extraction and tectonic activity in Pingtung Plain, Taiwan. Proc. Int. Assoc. Hydrol. Sci. 2020, 382, 361–365. [Google Scholar] [CrossRef] [Green Version]
  12. Lo, W.-C.; Lee, J.-W. Effect of water content and soil texture on consolidation in unsaturated soils. Adv. Water Resour. 2015, 82, 51–69. [Google Scholar] [CrossRef]
  13. Lo, W.-C.; Sposito, G.; Lee, J.-W.; Chu, H. One-dimensional consolidation in unsaturated soils under cyclic loading. Adv. Water Resour. 2016, 91, 122–137. [Google Scholar] [CrossRef]
  14. Lo, W.C.; Chao, N.C.; Chen, C.H.; Lee, J.W. Poroelastic Theory of Consolidation in Unsaturated Soils Incorporating Gravitational Body Forces. Adv. Water Resour. 2017, 106, 121–131. [Google Scholar] [CrossRef]
  15. Lo, W.; Borja, R.I.; Deng, J.-H.; Lee, J.-W. Analytical solution of soil deformation and fluid pressure change for a two-layer system with an upper unsaturated soil and a lower saturated soil under external loading. J. Hydrol. 2020, 588, 124997. [Google Scholar] [CrossRef]
  16. Lo, W.C.; Borja, R.I.; Deng, J.H.; Lee, J.W. Poroelastic Theory of Consolidation for a Two-Layer System with an Upper Unsaturated Soil and a Lower Saturated Soil under Fully Permeable Boundary Conditions. J. Hydrol. 2021, 596, 125700. [Google Scholar] [CrossRef]
  17. Yang, Q.; Ke, Y. Relationship between Urban Construction and Land Subsidence in Beijing Region. In Proceedings of the 22nd International Congress on Modelling and Simulation, MODSIM 2017, Tasmania, Australia, 3–8 December 2017; pp. 1020–1026. [Google Scholar]
  18. USGS. Land Subsidence in the United States; Galloway, D., David, R., Jones, D.R., Ingebritsen, S.E., Eds.; USGS Circular: Denver, CO, USA, 1999.
  19. Hung, W.-C.; Hwang, C.; Liou, J.-C.; Lin, Y.-S.; Yang, H.-L. Modeling aquifer-system compaction and predicting land subsidence in central Taiwan. Eng. Geol. 2012, 147–148, 78–90. [Google Scholar] [CrossRef]
  20. Al-Sittawy, M.; Gad, S.; Fouad, R.; Nofal, E. Assessment of soil subsidence due to long-term dewatering, Esna city, Egypt. Water Sci. 2019, 33, 40–53. [Google Scholar] [CrossRef] [Green Version]
  21. Zeitoun, D.G.; Wakshal, E. Land Subsidence Analysis in Urban Areas; Springer: New York, NY, USA, 2013. [Google Scholar]
  22. Othman, A.; Abotalib, A.Z. Land subsidence triggered by groundwater withdrawal under hyper-arid conditions: Case study from Central Saudi Arabia. Environ. Earth Sci. 2019, 78, 243. [Google Scholar] [CrossRef]
  23. Mahmoudpour, M.; Khamehchiyan, M.; Nikudel, M.R.; Ghassemi, M.R. Numerical simulation and prediction of regional land subsidence caused by groundwater exploitation in the southwest plain of Tehran, Iran. Eng. Geol. 2016, 201, 6–28. [Google Scholar] [CrossRef]
  24. Shen, S.-L.; Xu, Y.-S. Numerical evaluation of land subsidence induced by groundwater pumping in Shanghai. Can. Geotech. J. 2011, 48, 1378–1392. [Google Scholar] [CrossRef]
  25. Zhang, Y.; Liu, Y.; Jin, M.; Jing, Y.; Liu, Y.; Liu, Y.; Sun, W.; Wei, J.; Chen, Y. Monitoring Land Subsidence in Wuhan City (China) Using the SBAS-INSAR Method with Radarsat-2 Imagery Data. Sensors 2019, 19, 743. [Google Scholar] [CrossRef] [Green Version]
  26. Lanari, R.; Casu, F.; Manzo, M.; Lundgren, P. Application of the SBAS-DInSAR Technique to Fault Creep: A Case Study of the Hayward Fault, California. Remote Sens. Environ. 2007, 109, 20–28. [Google Scholar] [CrossRef]
  27. Motagh, M.; Djamour, Y.; Walter, T.; Wetzel, H.-U.; Zschau, J.; Arabi, S. Land subsidence in Mashhad Valley, northeast Iran: Results from InSAR, levelling and GPS. Geophys. J. Int. 2007, 168, 518–526. [Google Scholar] [CrossRef]
  28. Aditiya, A.; Takeuchi, W.; Aoki, Y. Land Subsidence Monitoring by InSAR Time Series Technique Derived From ALOS-2 PALSAR-2 over Surabaya City, Indonesia. IOP Conf. Ser. Earth Environ. Sci. 2017, 98, 12010. [Google Scholar] [CrossRef] [Green Version]
  29. Mateos, R.M.; Ezquerro, P.; Luque-Espinar, J.A.; Pizarro, M.B.; Notti, D.; Azañón, J.M.; Monserrat, O.; Herrera, G.; Fernández-Chacón, F.; Peinado, T.; et al. Multiband PSInSAR and long-period monitoring of land subsidence in a strategic detrital aquifer (Vega de Granada, SE Spain): An approach to support management decisions. J. Hydrol. 2017, 553, 71–87. [Google Scholar] [CrossRef]
  30. Yi, S.; Wang, Q.; Sun, W. Predictability of Hydraulic Head Changes and Characterization of Aquifer System and Fault Properties from InSAR Derived Ground Deformation. J. Geophys. Res. Solid Earth 2014, 119, 6572–6590. [Google Scholar]
  31. Rezaei, A.; Mousavi, Z.; Khorrami, F.; Nankali, H. Inelastic and elastic storage properties and daily hydraulic head estimates from continuous global positioning system (GPS) measurements in northern Iran. Hydrogeol. J. 2020, 28, 657–672. [Google Scholar] [CrossRef]
  32. Bonì, R.; Cigna, F.; Bricker, S.; Meisina, C.; McCormack, H. Characterisation of hydraulic head changes and aquifer properties in the London Basin using Persistent Scatterer Interferometry ground motion data. J. Hydrol. 2016, 540, 835–849. [Google Scholar] [CrossRef] [Green Version]
  33. Loáiciga, H.A. Consolidation Settlement in Aquifers Caused by Pumping. J. Geotech. Geoenviron. Eng. 2013, 139, 1191–1204. [Google Scholar] [CrossRef]
  34. Chen, J.; Knight, R.; Zebker, H.A.; Schreüder, W.A. Confined aquifer head measurements and storage properties in the San Luis Valley, Colorado, from spaceborne InSAR observations. Water Resour. Res. 2016, 52, 3623–3636. [Google Scholar] [CrossRef] [Green Version]
  35. Cao, Y.; Wei, Y.-N.; Fan, W.; Peng, M.; Bao, L. Experimental study of land subsidence in response to groundwater withdrawal and recharge in Changping District of Beijing. PLoS ONE 2020, 15, e0232828. [Google Scholar]
  36. Gong, X.; Geng, J.; Sun, Q.; Gu, C.; Zhang, W. Experimental study on pumping-induced land subsidence and earth fissures: A case study in the Su-Xi-Chang region, China. Bull. Int. Assoc. Eng. Geol. 2020, 79, 4515–4525. [Google Scholar] [CrossRef]
  37. Shen, S.-L.; Xu, Y.-S.; Hong, Z.-S. Estimation of Land Subsidence Based on Groundwater Flow Model. Mar. Georesour. Geotechnol. 2006, 24, 149–167. [Google Scholar] [CrossRef]
  38. Galloway, D.; Sneed, M. Analysis and simulation of regional subsidence accompanying groundwater abstraction and compaction of susceptible aquifer systems in the USA. Boletín Sociedad Geológica Mexicana 2013, 65, 123–136. [Google Scholar] [CrossRef]
  39. Thu, T.M.; Fredlund, D.G. Modelling Subsidence in the Hanoi City Area, Vietnam. Can. Geotech. J. 2000, 37, 621–637. [Google Scholar] [CrossRef]
  40. Gumilar, I.; Abidin, H.Z.; Sidiq, T.P.; Andreas, H.; Maiyudi, R.; Gamal, M. Mapping and Evaluating the Impact of Land Subsidence In Semarang (Indonesia). Indones. J. Geospat. 2013, 2, 26–41. [Google Scholar]
  41. Abidin, H.Z.; Andreas, H.; Gumilar, I.; Sidiq, T.P.; Gamal, M.; Murdohardono, D.; SUpriyadi, S.; Fukuda, Y. Studying Land Subsidence in Semarang (Indonesia) Using Geodetic Methods. In Proceedings of the FIG Congress, Facing the Challenges—Building the Capacity, Sydney, Australia, 11 April 2010. [Google Scholar]
  42. Lubis, A.M.; Sato, T.; Tomiyama, N.; Isezaki, N.; Yamanokuchi, T. Ground subsidence in Semarang-Indonesia investigated by ALOS–PALSAR satellite SAR interferometry. J. Southeast Asian Earth Sci. 2011, 40, 1079–1088. [Google Scholar] [CrossRef]
  43. Marfai, M.A.; King, L. Monitoring land subsidence in Semarang, Indonesia. Environ. Earth Sci. 2007, 53, 651–659. [Google Scholar] [CrossRef]
  44. Kuehn, F.; Albiol, D.; Cooksley, G.; Duro, J.; Granda, J.; Haas, S.; Hoffmann-Rothe, A.; Murdohardono, D. Detection of land subsidence in Semarang, Indonesia, using stable points network (SPN) technique. Environ. Earth Sci. 2010, 60, 909–921. [Google Scholar] [CrossRef]
  45. Sarah, D. Natural Compaction of Semarang Demak Alluvial Deposit. Ph.D. Thesis, Institut Teknologi Bandung: Bandung, Indonesia, 2019; Unpublished. (In Bahasa Indonesia). [Google Scholar]
  46. Abidin, H.; Andreas, H.; Gumilar, I.; Sidiq, T.; Fukuda, Y. Land subsidence in coastal city of Semarang (Indonesia): Characteristics, impacts and causes. Geomat. Nat. Hazards Risk 2013, 4, 226–240. [Google Scholar] [CrossRef] [Green Version]
  47. Sarah, D.; Hutasoit, L.M.; Delinom, R.M.; Sadisun, I.A. Natural Compaction of Semarang-Demak Alluvial Plain and Its Relationship to the Present Land Subsidence. Indones. J. Geosci. 2020, 7, 273–289. [Google Scholar] [CrossRef]
  48. Andreas, H.; Abidin, H.Z.; Sarsito, D.A.; Meilano, I.; Susilo, S. Investigating the Tectonic Influence to the Anthropogenic Subsidence along Northern Coast of Java Island Indonesia Using GNSS Data Sets. E3S Web Conf. 2019, 94, 04005. [Google Scholar] [CrossRef]
  49. Lo, W.; Purnomo, S.N.; Sarah, D.; Aghnia, S.; Hardini, P. Groundwater Modelling in Urban Development to Achieve Sustainability of Groundwater Resources: A Case Study of Semarang City, Indonesia. Water 2021, 13, 1395. [Google Scholar] [CrossRef]
  50. Thaden, R.E.; Sumardirdja, H.; Richards, P.W. Geological Map of Semarang-Magelang Quadrangle, Java, Scale 1:100.000; Geological Research and Development Centre: Bandung, Indonesia, 1996. [Google Scholar]
  51. Rukayah, R.S.; Abdullah, M. The Glory of Semarang Coastal City in the Past, Multi-Ethnic Merchants and Dutch Commerce. J. Southwest Jiaotong Univ. 2019, 54, 54. [Google Scholar] [CrossRef]
  52. Tobing, M.H.L.; Syarief, E.A.; Murdohardono, D. Engineering Geological Investigation of Subsidence in Semarang and Its Surroundings, Central Java Province; Geological Environment Center, Geological Agency: Bandung, Indonesia, 2000; (In Bahasa Indonesia).
  53. Marsudi. Prediction of Land Subsidence Rate in Semarang Alluvial Plain, Central Java. Ph.D. Thesis, Institut Teknologi Bandung: Bandung, Indonesia, 2000; Unpublished. (In Bahasa Indonesia).
  54. VanBemmelen, R.W. The Geology of Indonesia. General Geology of Indonesia and Adjacent Archipelagoes. Gov. Print. Off. Hague 1949, 545–547, 545–562. [Google Scholar]
  55. Badan Standardisasi Nasional. SNI 2812: One-Dimensional Soil Consolidation Test Method; National Standardization Agency of Indonesia: Jakarta, Indonesia, 2011; (In Bahasa Indonesia).
  56. Badan Standardisasi Nasional. SNI 03-6870: How to Test Water Passing in the Laboratory for Fine-Grained Soils with High Pressure Drops; National Standardization Agency of Indonesia: Jakarta, Indonesia, 2002; (In Bahasa Indonesia).
  57. Badan Standardisasi Nasional. SNI 3423: How to Test Soil Grain Size Analysis; National Standardization Agency of Indonesia: Jakarta, Indonesia, 2008; pp. 1–27, (In Bahasa Indonesia).
  58. Mining and Energy Agency of Central Java Province and Directorate of Geological Environment and Mining Areas. Overview of Groundwater System Configuration. In Final Report: Study on the Configuration and Zoning of Underground Water in the Semarang–Demak, Subah, and Karanganyar–Boyolali, Central Java Province; Mining and Energy Agency of Central Java Province: Semarang, Indonesia, 2003; (In Bahasa Indonesia). [Google Scholar]
  59. Mining and Energy Agency Central Java Province (DESDM Provinsi Jawa Tengah). Recapitulation of Water Calculation and Water Acquisition Value 2001–2010. Internal Report; Mining and Energy Agency: Banjarnegara, Central Java, Indonesia, 2012; Unpublished; (In Bahasa Indonesia).
  60. Tirtomihardjo, H. Groundwater Resource Potential in Indonesia and Their Management. Presentation Report; Mining and Energy Agency: Jakarta, Indonesia, 2011; Unpublished; (In Bahasa Indonesia).
  61. Holzer, T.L.; Galloway, D.L.; Ehlen, J.; Haneberg, W.C.; Larson, R.A. Impacts of land subsidence caused by withdrawal of underground fluids in the United States. Hum. Geol. Agents 2005, XVI, 87–99. [Google Scholar]
  62. CTI Engineering International Co., L.& A. Final Report on Land Subsidence Survey: Part II River Improvement Works, Water Resources Development & Land Subsidence Survey under JICA Loan IP-534; Directorate General of Water Resources, Ministry of Public Works and Housing od Central Java: Semarang, Indonesia, 2016.
  63. Luo, Q.; Perissin, D.; Lin, H.; Zhang, Y.; Wang, W. Subsidence Monitoring of Tianjin Suburbs by TerraSAR-X Persistent Scatterers Interferometry. IEEE J. Sel. Top. Appl. Earth Obs. Remote Sens. 2014, 7, 1642–1650. [Google Scholar] [CrossRef]
  64. Yan, S.; Liu, G.; Deng, K.; Wang, Y.; Zhang, S.; Zhao, F. Large deformation monitoring over a coal mining region using pixel-tracking method with high-resolution Radarsat-2 imagery. Remote Sens. Lett. 2016, 7, 219–228. [Google Scholar] [CrossRef]
  65. Samsonov, S.; D’Oreye, N.; Smets, B. Ground deformation associated with post-mining activity at the French–German border revealed by novel InSAR time series method. Int. J. Appl. Earth Obs. Geoinf. 2013, 23, 142–154. [Google Scholar] [CrossRef]
  66. Jia, H.; Liu, L. A technical review on persistent scatterer interferometry. J. Mod. Transp. 2016, 24, 153–158. [Google Scholar] [CrossRef] [Green Version]
  67. Catalão, J.; Nico, G.; Lollino, P.; Conde, V.; Lorusso, G.; Silva, C. Integration of InSAR Analysis and Numerical Modeling for the Assessment of Ground Subsidence in the City of Lisbon, Portugal. IEEE J. Sel. Top. Appl. Earth Obs. Remote Sens. 2015, 9, 1663–1673. [Google Scholar] [CrossRef]
  68. Berardino, P.; Fornaro, G.; Lanari, R.; Sansosti, E. A new algorithm for surface deformation monitoring based on small baseline differential SAR interferograms. IEEE Trans. Geosci. Remote Sens. 2002, 40, 2375–2383. [Google Scholar] [CrossRef] [Green Version]
  69. Hooper, A.; Zebker, H.; Segall, P.; Kampes, B. A new method for measuring deformation on volcanoes and other natural terrains using InSAR persistent scatterers. Geophys. Res. Lett. 2004, 31, L23611. [Google Scholar] [CrossRef]
  70. Morishita, Y.; Lazecky, M.; Wright, T.J.; Weiss, J.R.; Elliott, J.R.; Hooper, A. LiCSBAS: An Open-Source InSAR Time Series Analysis Package Integrated with the LiCSAR Automated Sentinel-1 InSAR Processor. Remote Sens. 2020, 12, 424. [Google Scholar] [CrossRef] [Green Version]
  71. Wang, Q.; Yu, W.; Xu, B.; Wei, G. Assessing the Use of Gacos Products for Sbas-Insar Deformation Monitoring: A Case in Southern California. Sensors 2019, 19, 3894. [Google Scholar] [CrossRef]
  72. Schmidt, D.A.; Bürgmann, R. Time-Dependent Land Uplift and Subsidence in the Santa Clara Valley, California, from a Large Interferometric Synthetic Aperture Radar Data Set Time-Dependent Land Uplift and Subsidence in the Santa Clara Valley, California, from a Large Interferometr. J. Geophys. Res. 2003, 108, 1–13. [Google Scholar]
  73. Agram, P.; Jolivet, R.; Simons, M. Generic InSAR Analysis Toolbox (GIAnT)–User Guide, ed. Available online: http://earthdef.caltech.edu (accessed on 31 May 2021).
  74. Andaryani, S.; Nourani, V.; Trolle, D.; Dehghani, M.; Asl, A.M. Assessment of land use and climate change effects on land subsidence using a hydrological model and radar technique. J. Hydrol. 2019, 578, 124070. [Google Scholar] [CrossRef]
  75. Hooper, A.; Bekaert, D.; Spaans, K.; Arıkan, M. Recent advances in SAR interferometry time series analysis for measuring crustal deformation. Tectonophysics 2012, 514–517, 1–13. [Google Scholar] [CrossRef]
  76. Hu, J.; Li, Z.-W.; Ding, X.; Zhu, J.; Zhang, L.; Sun, Q. Resolving three-dimensional surface displacements from InSAR measurements: A review. Earth-Sci. Rev. 2014, 133, 1–17. [Google Scholar] [CrossRef]
  77. PUSGEN. Peta Sumber Dan Bahaya Gempa Indonesia Tahun 2017 (Map of Indonesia Earthquake Sources and Hazards in 2017); National Earthquake Study Center, Center for Research and Development of Housing and Settlements: Jakarta, Indonesia, 2017; (In Bahasa Indonesia).
  78. Zhang, Y.; Xue, Y.; Wu, J.; Wang, H.; He, J. Mechanical modeling of aquifer sands under long-term groundwater withdrawal. Eng. Geol. 2012, 125, 74–80. [Google Scholar] [CrossRef]
  79. Purnomo, S.N.; Lo, W.C. Estimation of Groundwater Recharge in Semarang City, Indonesia. IOP Conf. Ser. Mater. Sci. Eng. 2020, 982, 012035. [Google Scholar] [CrossRef]
  80. Taufiq Nz, A.; Solihin, I.; Wahyudin. Map of the Groundwater Conservation Zone of the Semarang Demak Basin in 2010; Geological Environment Center, Geological Agency: Bandung, Indonesia, 2010; (In Bahasa Indonesia).
Figure 1. (a) An old house in a housing area that has been impacted by land subsidence, thus resulting in the ground elevation of the houses is lower than the road elevation, (b) the current condition of an older house whose window elevation is the same as the ground elevation due to land subsidence.
Water 14 00201 g001
Figure 2. The study area (the northern part of Semarang City).
Water 14 00201 g002
Figure 3. (a) Coast line changes of an 884 m advancement that took place over 1847–1991, (b) evolution of the coastal accretion and retreat processes for changes in shoreline from 1984 to 2016.
Water 14 00201 g003
Figure 4. Geological map of Semarang City.
Water 14 00201 g004
Figure 5. (a) The lithology of the northern region of Semarang City from west to east, (b) The lithology of the northern region of Semarang City from north to south.
Water 14 00201 g005
Figure 6. The number of registered deep wells in Semarang City and their output capacity.
Water 14 00201 g006
Figure 7. Leveling and GPS measuring points.
Water 14 00201 g007
Figure 8. InSAR vertical displacement vs. GPS displacement.
Water 14 00201 g008
Figure 9. The deformation velocity map.
Water 14 00201 g009
Figure 10. A time series of the deformation.
Water 14 00201 g010
Figure 11. The deformation map in the northern part of Semarang City based on InSAR.
Water 14 00201 g011
Figure 12. Schematic of the computational cell of the Semarang groundwater basin.
Water 14 00201 g012
Figure 13. Calibration results of the steady-state flow model.
Water 14 00201 g013
Figure 14. Land subsidence contour map in 2010 and comparison of computed groundwater levels with measurements.
Water 14 00201 g014
Figure 15. Calibration for the simulation of land subsidence.
Water 14 00201 g015aWater 14 00201 g015b
Figure 16. Simulated subsidence vs. InSAR.
Water 14 00201 g016
Figure 17. The simulation results of land subsidence from 2010 to 2050 at O2, O3, O4, and O6.
Water 14 00201 g017
Figure 18. The contour maps of land subsidence in 2050 under (a) TS1, (b) TS3, and (c) TS4 scenarios.
Water 14 00201 g018aWater 14 00201 g018b
Table 1. The geotechnical properties.
Stratigraphic UnitNatural Unit Weight (γn) (kN/m3)Initial Void Ratio Compressibility Index Coefficient of Recompression Modulus of Elasticity (E) (kPa)Hydraulic Conductivity (k) (m/s)
(e0)(cc)(cr)
Clay to silty clay (Unit-1)15–171.2–1.70.35–0.740.10–0.171468–20001.68 × 10−10–6.54 × 10⁻⁹
Sand lenses (Unit-2)17–191.5–2.00.41–0.770.11–0.184000–50001.59 × 10−6–5.03 × 10⁻⁵
Volcanic sandstone (Unit-3)21–251.56–2.160.45–0.80.13–0.26900–70001.20 × 10−6–2.20 × 10⁻⁵
Table 2. Hydrogeological model parameter.
Stratigraphic UnitHydraulic Conductivity (k) (m/s)SfeSfv
Clay to silty clay (Unit-1)1.68 × 10⁻¹⁰–6.54 × 10−95.56 ×10−31.31 ×10⁻²
Sand lenses (Unit-2)1.59 × 10⁻⁶–5.03 × 10−52.45 ×10−32.45 ×10⁻³
Volcanic sandstone (Unit-3)1.20 × 10⁻⁶–2.20 × 10−51.42 ×10−31.42 ×10⁻³
Table 3. Reduction in the affected area of land subsidence.
RegionThe Affected Area of Land Subsidence (km2)Reduction in the Affected Area
TS3–TS1 (%)
Reduction in the Affected Area
TS4–TS1 (%)
Land Use
TS1TS3TS4
10.470.120.12−74.85%−75.60%Government offices, city-scale trade zone, and low-density housing
210.9110.559.53−3.30%−12.64%National-scale trade zone, city-scale trade zone, neighborhood-scale trade zone, industry, government offices, high-density housing
31.060.430.29−59.55%−72.38%Sub-city-scale trade zone, neighborhood-scale trade zone
46.326.165.60−2.47%−11.28%Industry, higher education, medium-density housing
Publisher’s Note: MDPI stays neutral with regard to jurisdictional claims in published maps and institutional affiliations.

