
Spatial–Temporal Distribution of the Euphausiid Euphausia pacifica and Fish Schools in the Coastal Southwestern East Sea
by
 and
and
Hyungbeen Lee
1, 
Junghwa Choi
2,
Yangjae Im
3,
Wooseok Oh
4,
Kangseok Hwang
5 and
Kyounghoon Lee
6,* 1
Fisheries Resources Research Center, National Institute of Fisheries Science, Tongyeong 53064, Korea
2
Resources and Environment Research Division, Jeju Fisheries Research Institute, National Institute of Fisheries Science, Jeju 63068, Korea
3
Fisheries Resources Management Division, National Institute of Fisheries Science, Busan 46083, Korea
4
Division of Fisheries Science, Chonnam National University, Docter’s Course, Yeosu 59696, Korea
5
Dokdo Fisheries Research Center, National Fisheries Research & Development Institute, Pohang 37709, Korea
6
Department of Marine Technology, Chonnam National University, Yeosu 59626, Korea
*
Author to whom correspondence should be addressed.
Water 2022, 14(2), 203; https://doi.org/10.3390/w14020203
Submission received: 30 November 2021
/
Revised: 6 January 2022
/
Accepted: 9 January 2022
/
Published: 11 January 2022
(This article belongs to the Special Issue Species Richness and Diversity of Aquatic Ecosystems)
Abstract
:The spatial and temporal distribution of euphausiid krill Euphausia pacifica (Crustacea: Malacostraca) and of fish schools were observed along acoustic transects at the southwestern East Sea coastline of Korea. Two-frequency (38- and 120-kHz) acoustic backscatter data were examined from April to July 2010. A decibel identification window (SV 120–38) and school detection algorithm identified Euphausia pacifica and fish schools in the acoustic backscatter, respectively. The E. pacifica was regularly observed in middle of southern waters, where phytoplankton was abundant during spring, and irregularly during summer, when phytoplankton was homogeneously distributed. Using the distorted-wave Born approximation model, the acoustic density we calculated of E. pacifica was higher in spring (April: 75.9 mg m−2, May: 85.3 mg m−2) than in summer (June: 71.4 mg m−2, July: 54.1 mg m−2). The fish schools observed by the acoustic data tended to significantly increase from spring to summer. Although major fish species, such as anchovies and herring, fed on copepods and euphausiids in the survey area, the temporal and spatial distribution of E. pacifica was weakly correlated with the distribution of the fish schools. These findings aid in our understanding of the temporal and spatial distribution dynamics of euphausiids and fish schools in the food web of the coastal southwestern East Sea.
1. Introduction
The East Sea is a semi-enclosed deep marginal sea in the northwestern Pacific with seasonal varying water conditions such as deep water circulation, a polar front, upwelling, and eddies due to the warm and saline equatorial waters of the Tsushima Current and cold coastal water of the North Korean Cold Current [1]. Frequent coastal upwelling and eddies caused by the well-defined oceanographic processes were also observed in the coast of the East Sea [2]. The southwestern region is one of the most productive regions in the East Sea, with extensive phytoplankton blooms consistently detected during spring and summer via satellite-based ocean color sensors [3]. The region supports high primary and secondary production, making it an important nursery ground for many invertebrates and fish stocks [4]. In addition, more than 50% of the total fishery production of korea was caught in the upwelling area, which only occupies 0.1% of the ocean [5]. The seasonal variation of the marine environment directly affects the distribution of all marine organisms, such as zooplankton and fish. Therefore, it is important to understand pelagic food web dynamics in this region.
The euphausiid E. pacifica Hansen, the North pacific krill, links the primary producers to higher predators in short and efficient food chains in the northwestern Pacific Ocean, including the East Sea [6]. This energy transfer from primary producers to top predators is strongly linked to the nutrient availability and physical properties of the water masses underlying the food web. Zooplankton, such as euphausiid krill and copepods, are highly abundant mid-trophic level organisms in the region and cause significant grazing pressure, which can be linked to heightened phytoplankton productivity. To understand the role of E. pacifica, it is important to determine the overall density, spatial and temporal distribution variability, and how the populations are controlled by environmental conditions. While the concept of a simple zooplankton-dominated food web may hold true for limited spatial and temporal scales, it is clear that fish distribution is regionally and seasonally important [7]. Fish provide a major alternative trophic pathway for a zooplankton-based system and are key members of mesopelagic communities. The various water conditions formed in the East Sea provide abundant food during the transportation and growth of migratory species, such as mackerels, horse mackerels, and sauries in the East China Sea to the East Sea [8]. In turn, they could play a significant role in the pelagic energy budget in the East Sea.
Acoustic systems, which have been ubiquitously utilized in surveillance, are considered the best tool for rapid high-resolution detection of zooplankton and fish [9,10,11]. Recently, various types of acoustic surveys have expanding worldwide. Long-term monitoring often uses acoustic systems such as ADCP (Acoustic Doppler Current Profiler) and WBAT (Wideband Acoustic Transceiver), or acquire data in wide waters at low cost using unmanned aerial vehicles such as underwater gliders and AUVs (Autonomous Underwater Vehicles) [12,13,14,15]. Acoustic surveys using research vessels serve to determine the temporal and spatial distribution of zooplankton and fish abundance at the same time [16,17]. Target identification methods and fish school detection modules using multi-frequency echo-sounders are often used to identify the zooplankton and fish in ecology studies as well as their spatial and temporal distribution and abundance variation. In our study, an 77 acoustic method was used to identify the relationship between zooplankton and fish in 78 the coastal southwestern East Sea.
To determine the spatial–temporal distribution and overlap between E. pacifica and fish schools in relation to seasonal variations in the environmental conditions in the coastal southwestern East Sea, an acoustic survey was conducted using a multi-frequency acoustic system from spring to summer of 2010.
2. Materials and Methods
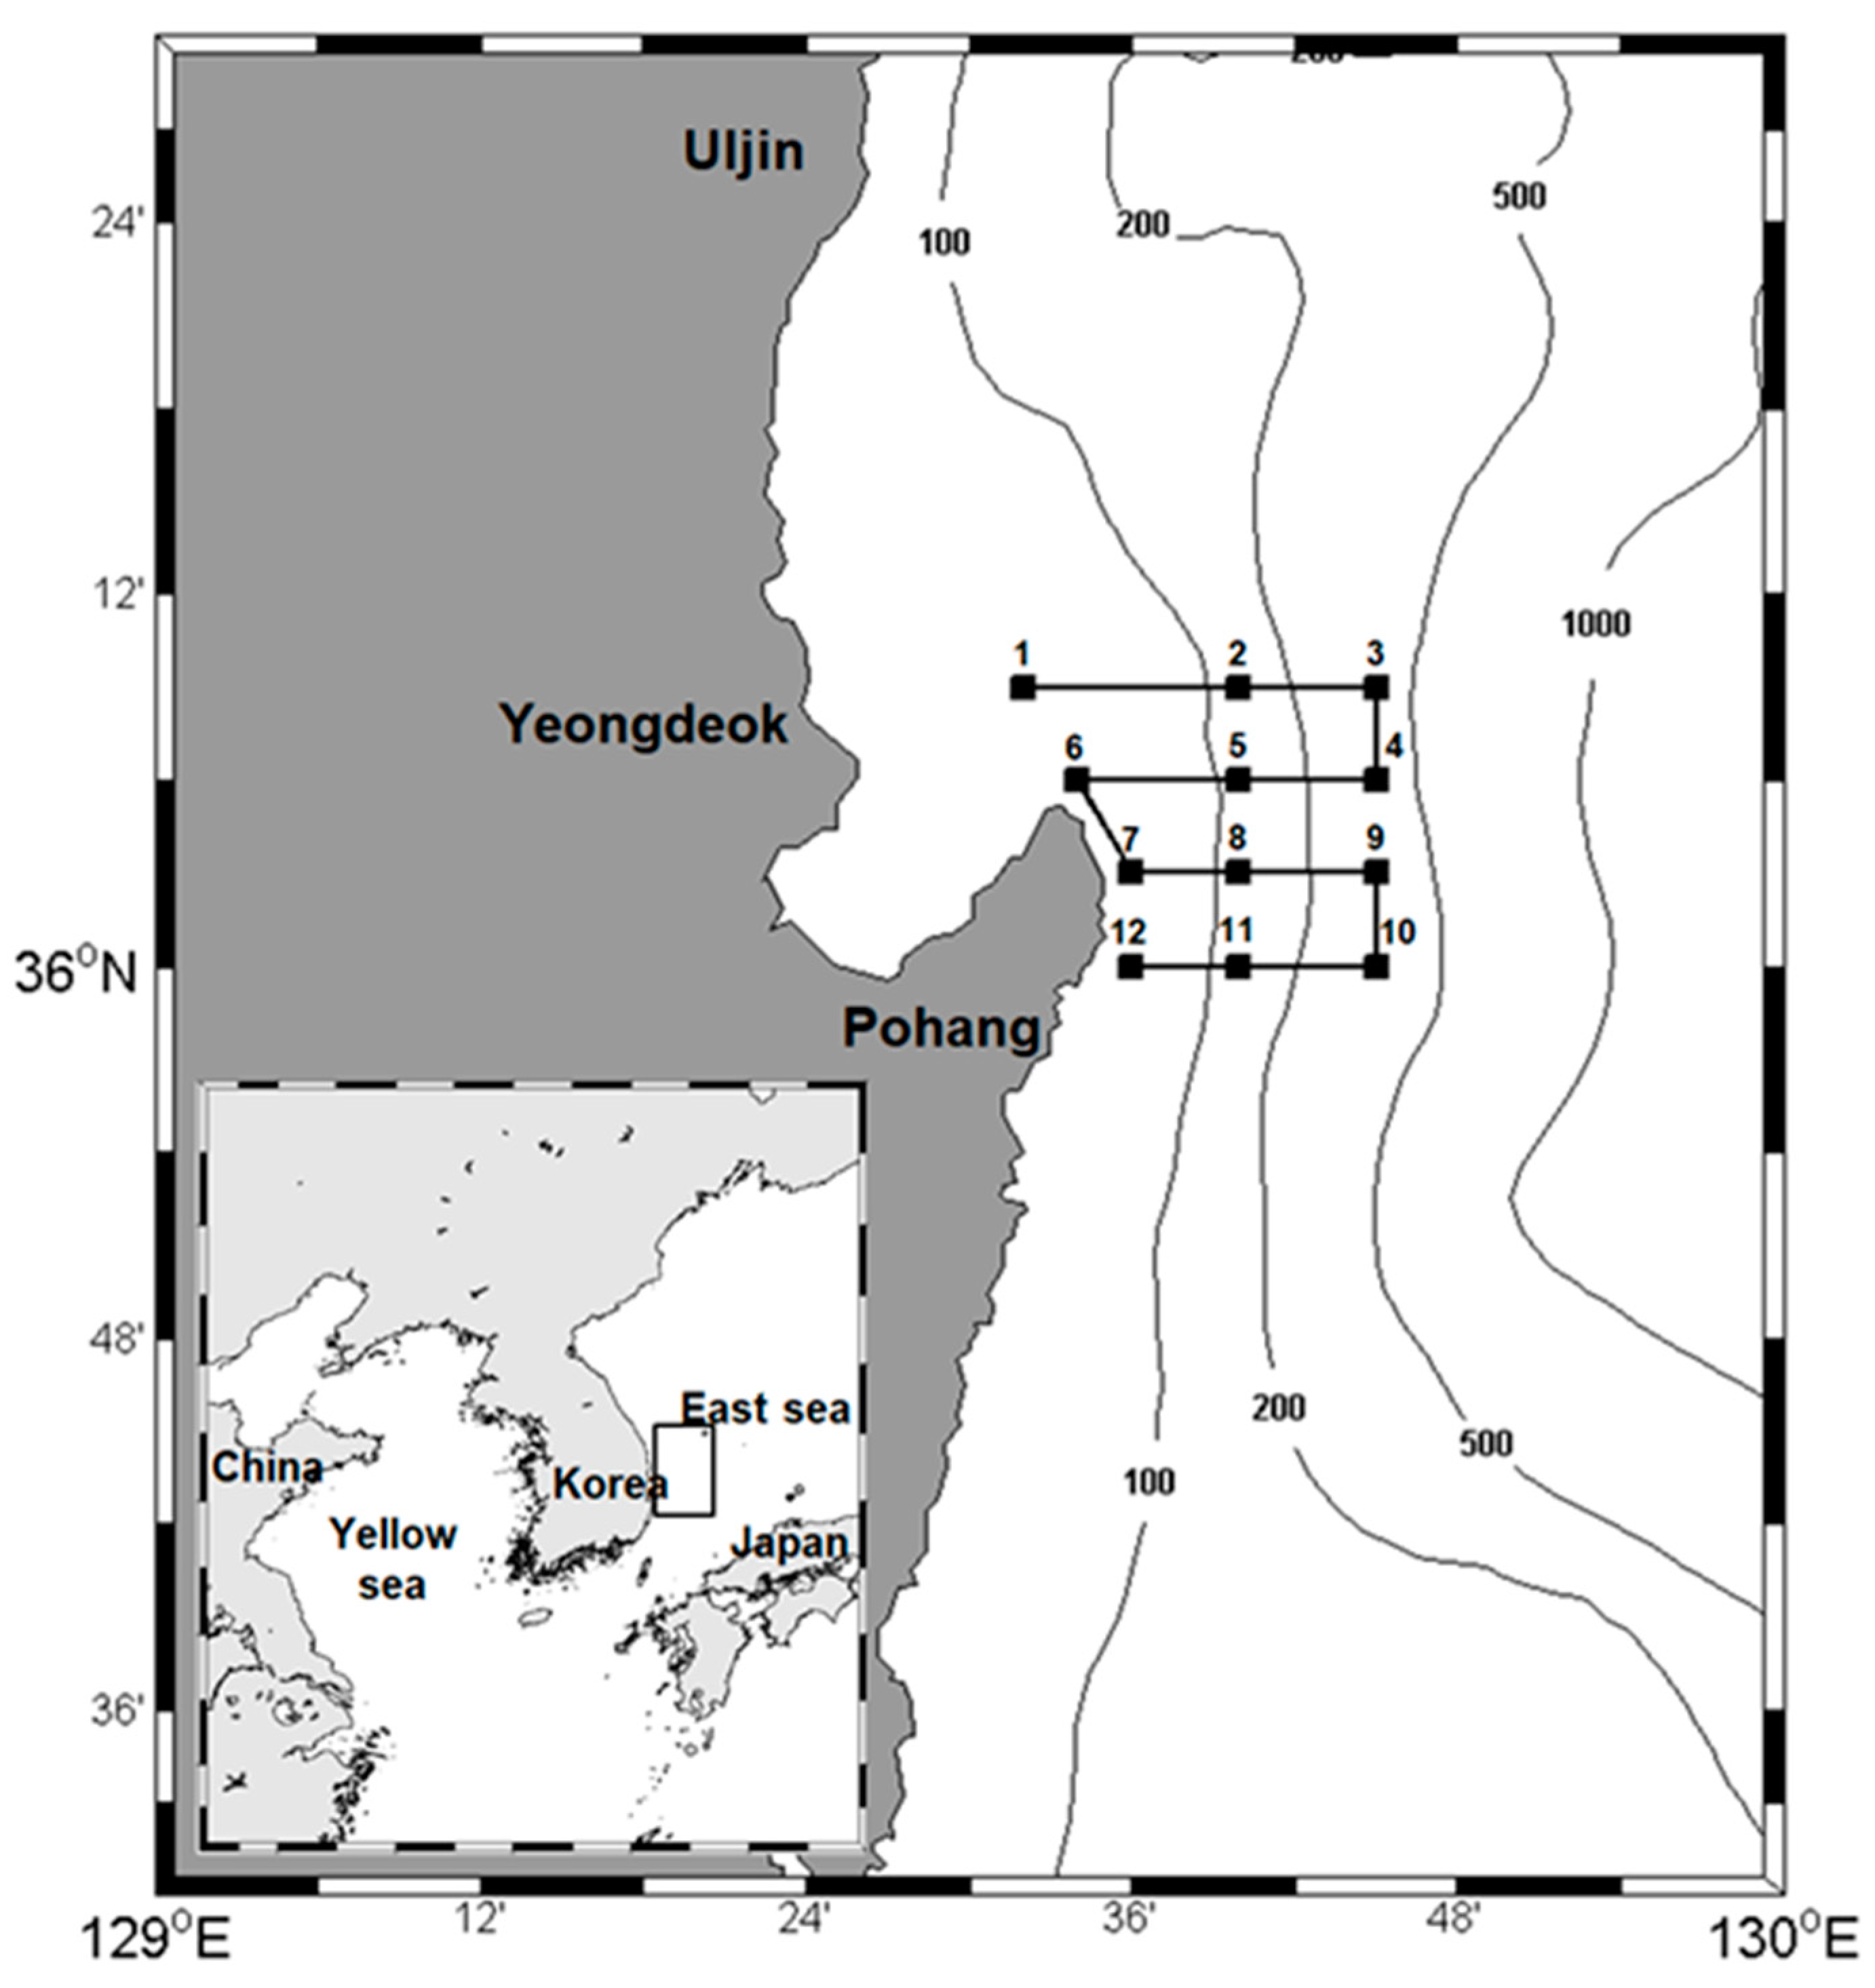
Oceanographic, biological, and acoustic data were collected at 12 stations in the coastal southwestern East Sea from April to July, 2010, on the R/V Tamgu 13 (Figure 1). Each month, four transects were completed during the daytime of 2 days in April, May, and June and 1 day and night in July (Table 1).
Hydrographic variables were measured at stations along each transect using a calibrated conductivity-temperature-depth (CTD) system (Ocean Seven 305 Plus, Idronaut S.R.L, Italy). The distributions of Chl a (a proxy for phytoplankton biomass) were estimated based on satellite data collected, including the duration of each cruise. The Chl a was estimated from an 8-day composite of Moderate Resolution Imaging Spectroradiometer (MODIS) Aqua Level 3 data (4-km resolution), which was obtained from the Goddard Space Flight Center [18].
Net hauls were conducted along each station with a RN80 (mouth diameter of 0.8 m, 500-μm mesh). Oblique tows from near the bottom to the surface were performed, with an average towing speed of 3 knots (range: 2–4 knots). Each net was equipped with a flowmeter to estimate the filtered water volume. The zooplankton samples for identification were immediately fixed and preserved in 4–5% buffered formalin. In the laboratory, their lengths were measured from the front of the eye to the tip of the telson [19]. The length−frequency distributions were estimated based on all collected samples. The net hauls were targeted to parameterize the acoustic model used to estimate the density, using the length−frequency distribution of E. pacifica.
Volume backscattering data (SV, dB re 1 m−1) were collected using a Simrad EK60 scientific echosounder system configured with 38- and 120-kHz split-beam transducers, which were calibrated by following standard procedures (Table 2) [20]. The ping rate varied from 1.0 s, with a pulse length of 0.512 ms. The nominal vessel speed for data collection on each transect was approximately 6 knots to ensure data quality.
The acoustic data were processed using the Myriax Echoview software (V. 8.0). Volume backscattering strength data were collected along the transect periods between stations. Non-biological signals, such as surface bubbles, bottom, and false bottom echoes, were identified and excluded. The background noise was removed using the time-varied gain threshold function. The ping by ping data were resampled to 1 m (vertical) by 185.2 m (0.1 n∙mi, horizontal) and imported into a Matlab program for further processing. The SV at 120 kHz (SV 120 kHz) above −90 dB was selected to demonstrate the vertical and spatial distribution of the acoustic scatterer, while the SV 120 kHz from small zooplankton, such as copepods, was removed. The SV 120 kHz above the −90 dB integration threshold in 1 m by 1 m bins were assigned to E. pacifica using a two-frequency (SV 120–38 kHz) variable dB window identification technique [21], integrated from 3 m below the transducer (5 m below the surface) to 2–200 m above the seabed, along each transect within the SV 120–38 kHz ranges. This resulted in a Nautical Area Scattering Coefficient (NASC, m2 nmi−2), and was converted to E. pacifica density using the validated physics-based target strength (TS) model called the distorted-wave Born approximation (DWBA). The DWBA was parameterized using the literature values of the sound contrast density and speed for E. pacifica in the southwestern East Sea [22]. The orientation distribution was N [30.4°, 19.9°] [23].
The E. pacifica length−frequency probability density functions (PDFs) were used to derive the weighted mean backscattering cross-sectional area (σ, m2 E. pacifica−1) on a per animal basis.
σ = 4π × 10TS/10
These were also used to calculate weighted mean wet masses per animal (W; g E. pacifica −1) using the mass-to-length relationship calculation [24].
W = 1.184 × TL0.179
Acoustic density (b, g wet mass m−2) was calculated by multiplying the 120 kHz NASC attributed to E. pacifica by the weighted mean mass W divided by the weighted σ [25].
b = NASC × ∑fi × W (TLi)/∑fi × σ (TLi) (g wet mass E. pacifica−1)
A school detection algorithm was applied to the corrected single ping noise 38 kHz echogram data eliminated using the Myriax Echoview “School detection module,” which employed a SHAPES (Shoal Analysis and Patch Estimation System) algorithm [26]. With a maximum ping interval of 1.0 s and a survey speed of 6 knots, the minimum horizontal resolution was approximately 3 m. The minimum total school length was set to 6 m, which was double the minimum horizontal resolution. The transmitted pulse duration was 0.512 ms, resulting in an approximate pulse length of 0.75 m, and a minimum vertical distance between two resolved targets of 37.5 cm. The minimum total school height was set to 1 m, which was more than double the minimum level of resolution. Therefore, the minimum school candidate length and height were set to 3 m and 1 m, respectively. The minimum volume backscattering strength of one fish per m3 of water was greater than that of E. pacifica (~−50 dB for a fish with a 3.5-mm swim bladder) [27]. Thus, fish schools were identified and corrected with a threshold level of −50 dB. Physical and acoustic descriptors of the detected schools, such as school length, corrected thickness, depth, NASC, and GPS, were exported from the 38 kHz data.
3. Results
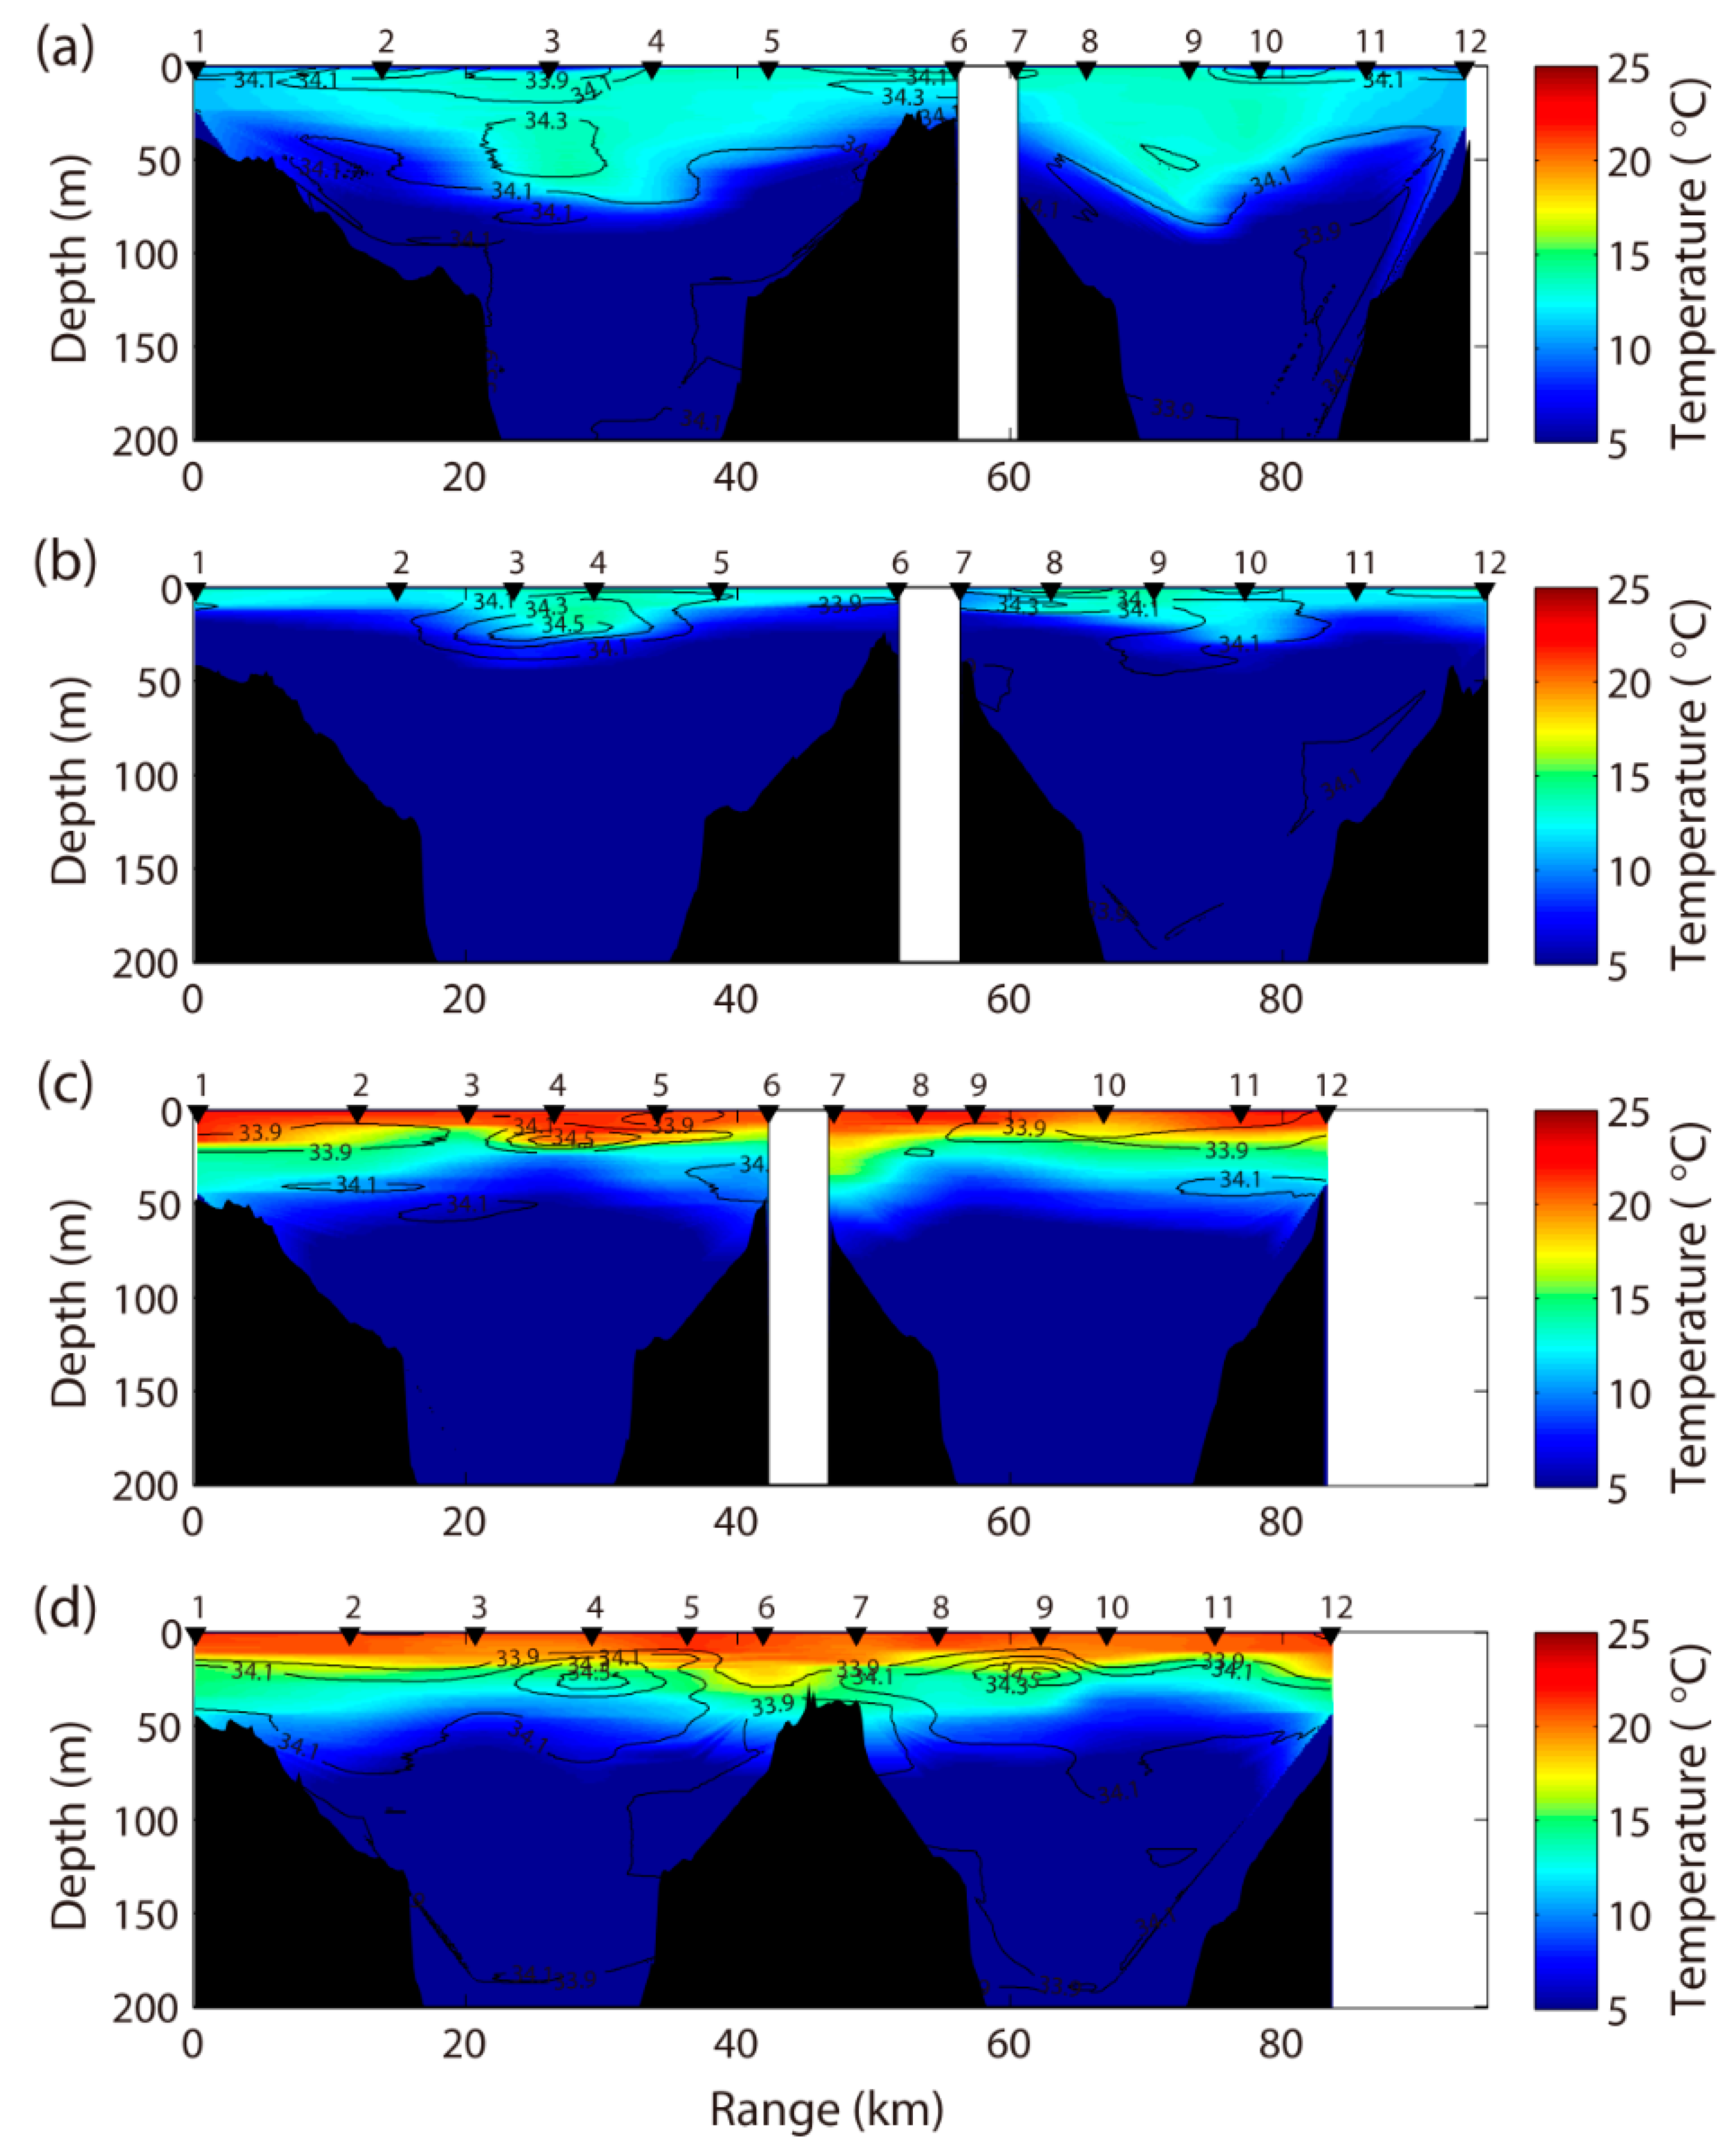
Twelve stations were undertaken during the four cruises (Table 1). The vertical structure of water temperature and salinity represent the seasonal variations along the coastal southwestern East Sea from April to July 2010 (Figure 2). The surface temperature gradually increased from April to July, which ranged from 10.0 to 21.7 °C. In April, the water temperature from the surface to 200 m or 2 m above the seabed ranged from 1.5 to 14.1 °C, and water salinity ranged from 33.8 to 34.4 psu. The vertical structure of the water column can be used to identify the location of mesoscale eddies in the ocean [28]. The offshore near St. 3 and St. 9 were composed of a thick lens of warm water, which displaced the main thermocline downward. The temperature in May was higher than that in April, and a small eddy was confirmed near St. 3 and St. 4, similar to that in April. In June and July, water temperatures > 20 °C and salinity of 33.9–34.5 psu characterized the central part of the surface layer, owing to the high temperature and increased solar radiation.
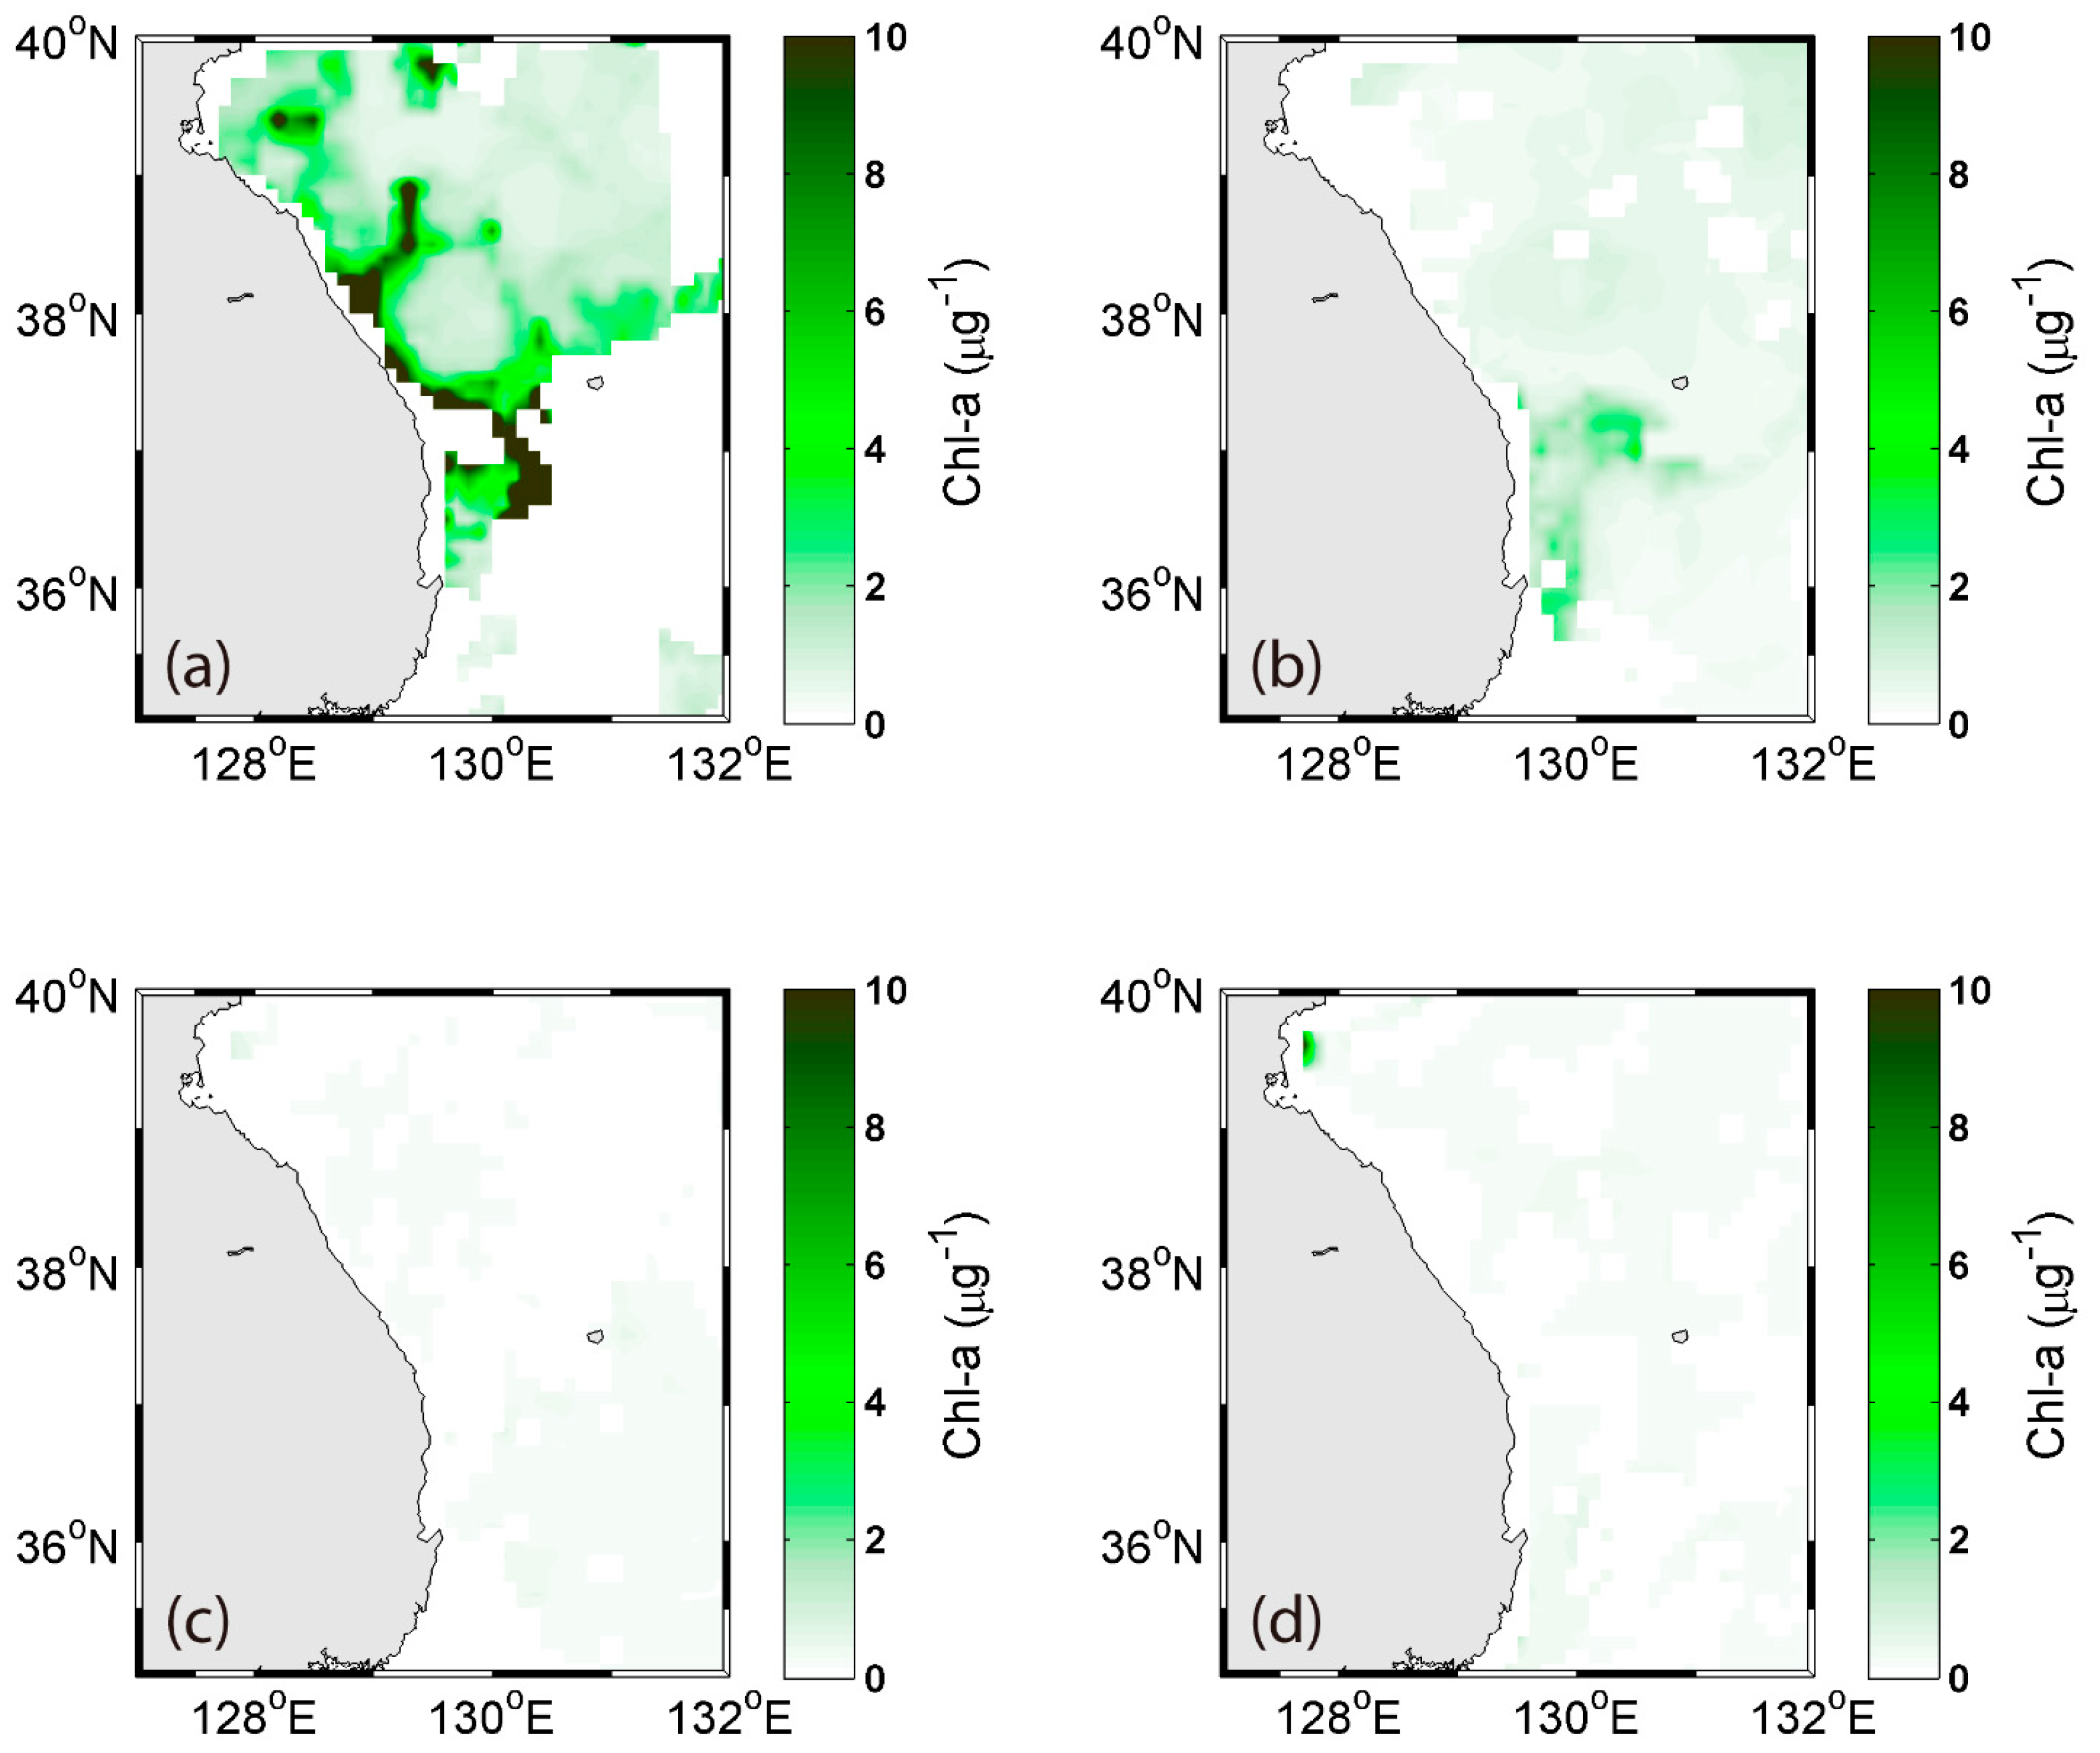
The 8-day Chl a distribution from the MODIS data from April to July 2010 were averaged (Figure 3). The biggest phytoplankton biomass was detected during April. After April, the primary productivity rapidly decreased in the offshore region, and was relatively slow in the coastal regions during summer. In May, the Chl a was detected near the southern acoustic transect of the survey area. The bloom rapidly declined between May and July. In summer, the Chl a concentration was low in the East Sea because of the strong stratification in the upper mixed layer (<10–20 m) [29].
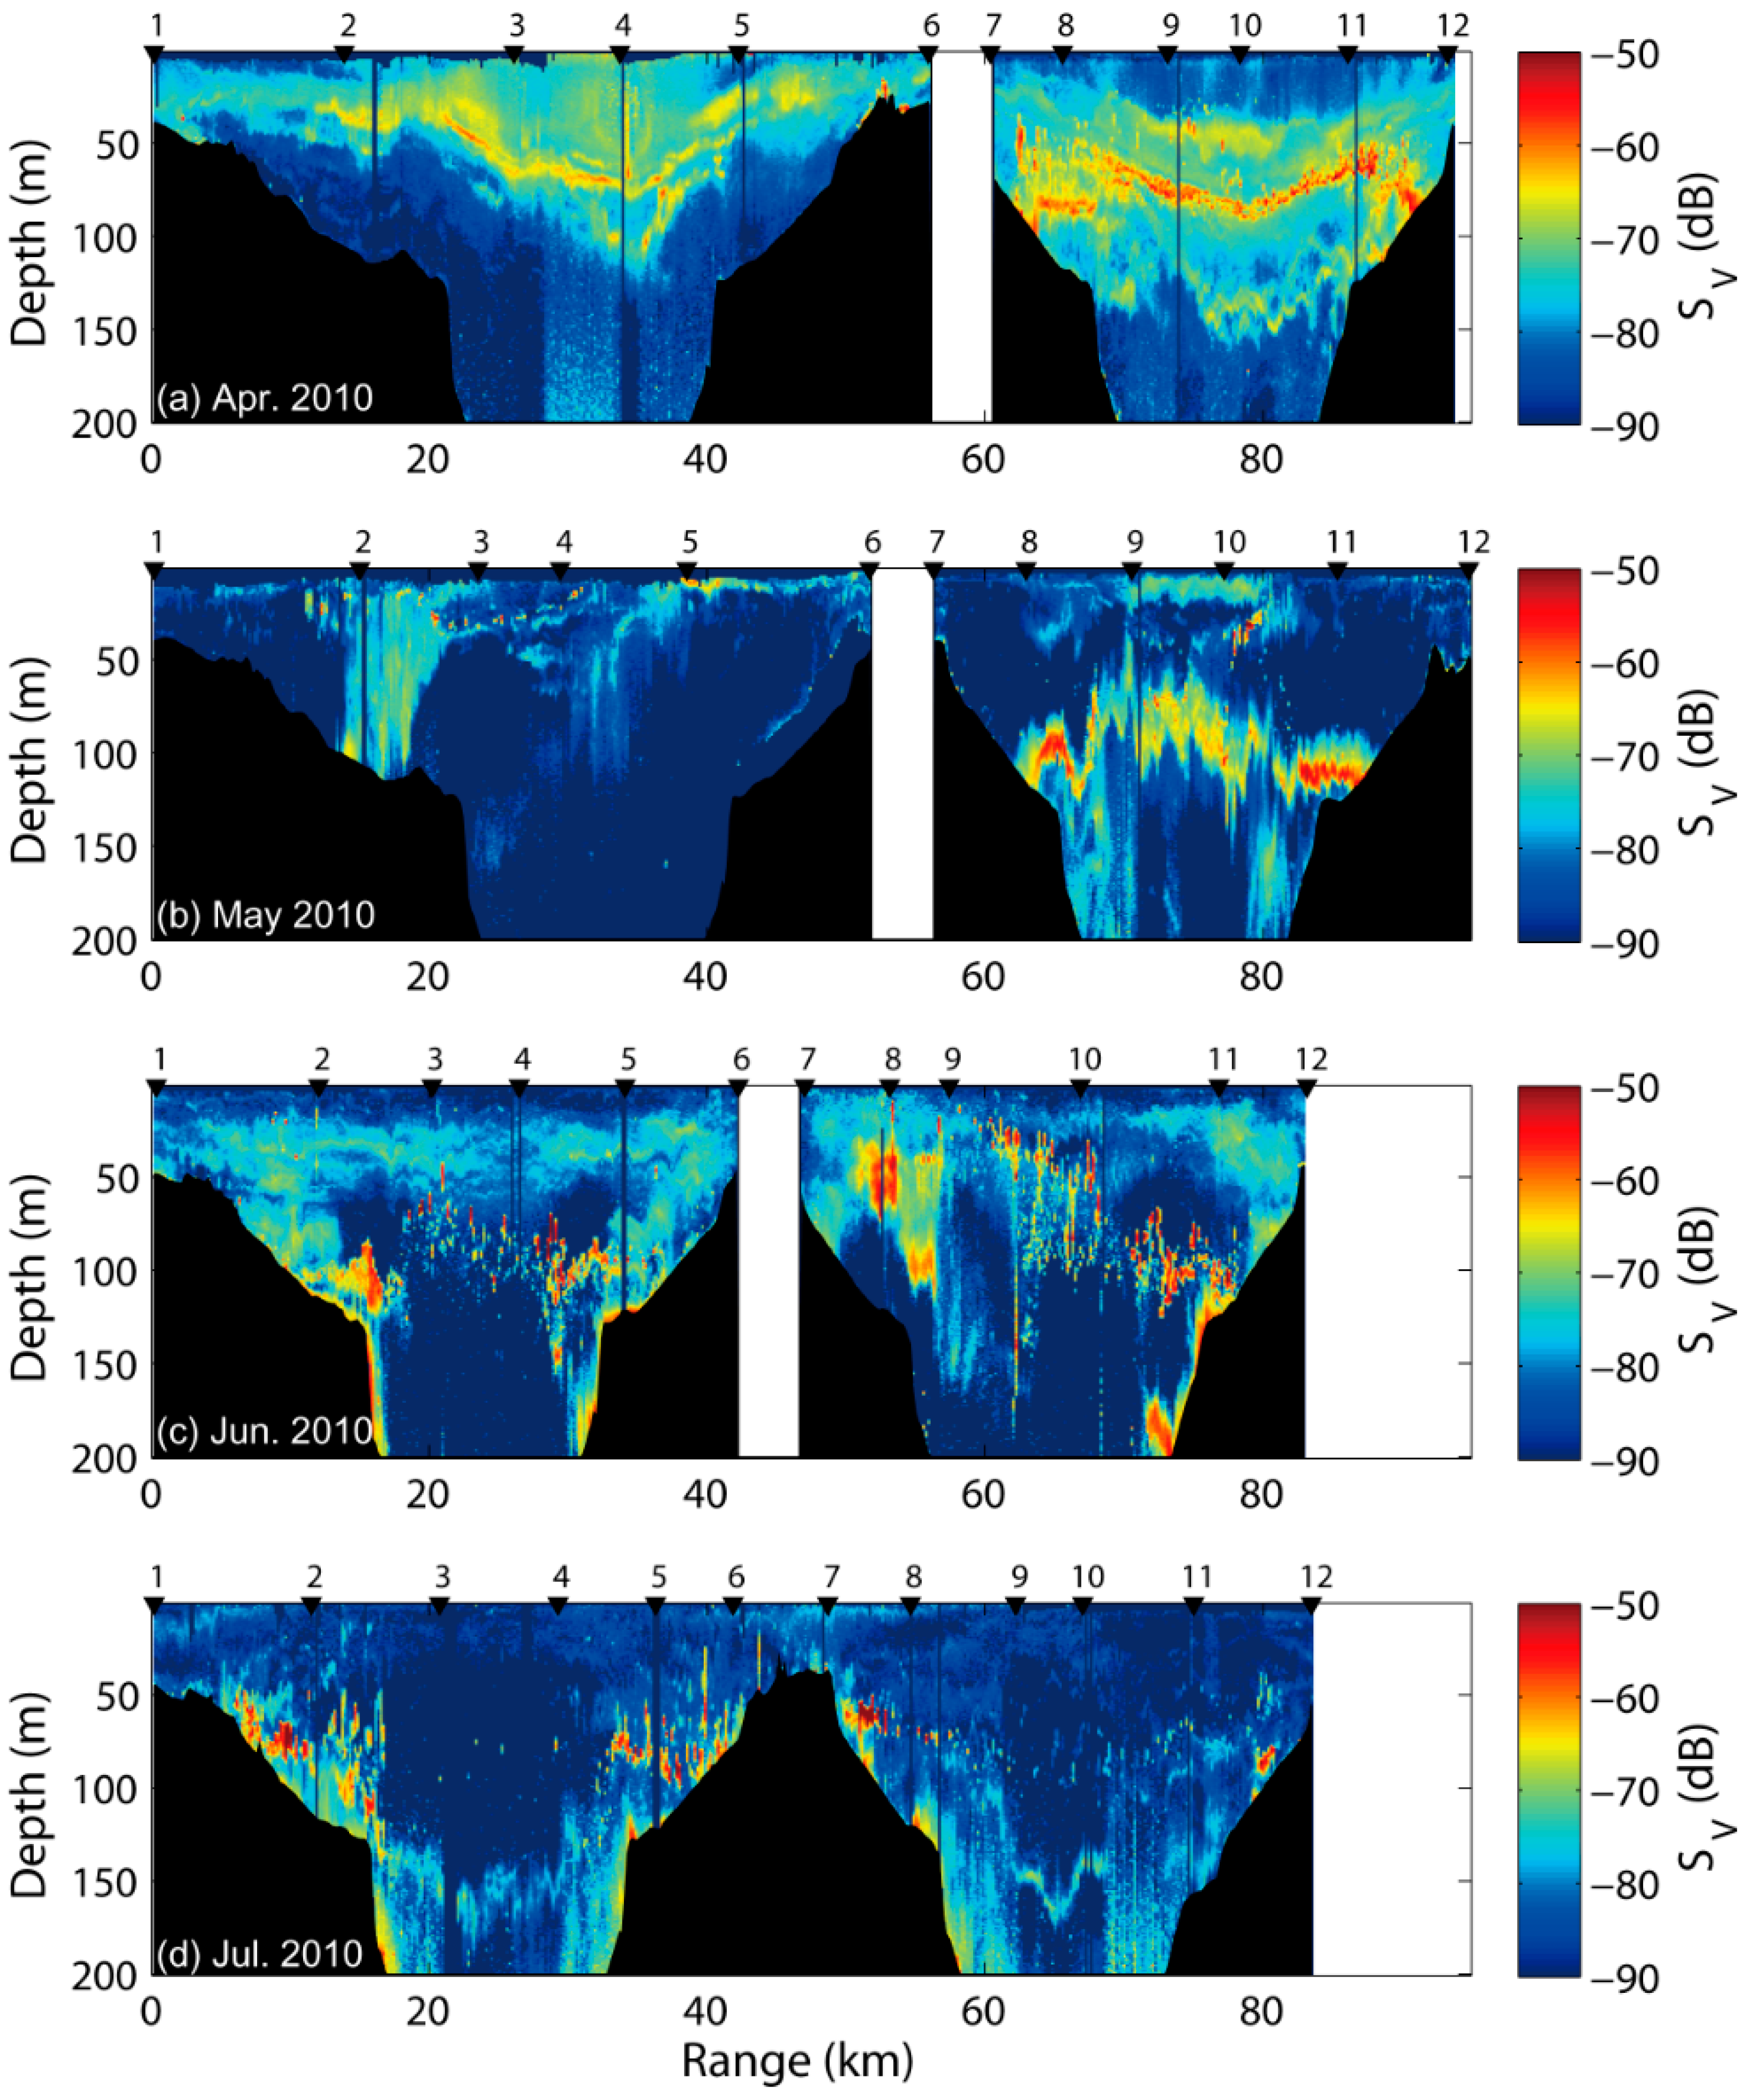
The acoustic data at 120 kHz were obtained along the seasonal transects, with the scattering layer in the coastal southwestern East Sea (Figure 4). The scattering layer with SV values between −90 and −50 dB was observed mainly at depths between 20 and 200 m along each transect. In terms of the temporal and spatial distribution, zooplankton and fish schools in the survey area fluctuated with seasonal variation and were affected by changes in depth. In April and May, a strong scattering layer with SV values between −72 and −54 dB was distributed near the middle layer and formed an almost constant horizontal layer. In June and July, fish school signals were frequently detected at −62.1 to −39.5 dB. However, a relatively weak scattering layer of <−65 dB was identified from mesozooplankton, compared to that in the spring season.
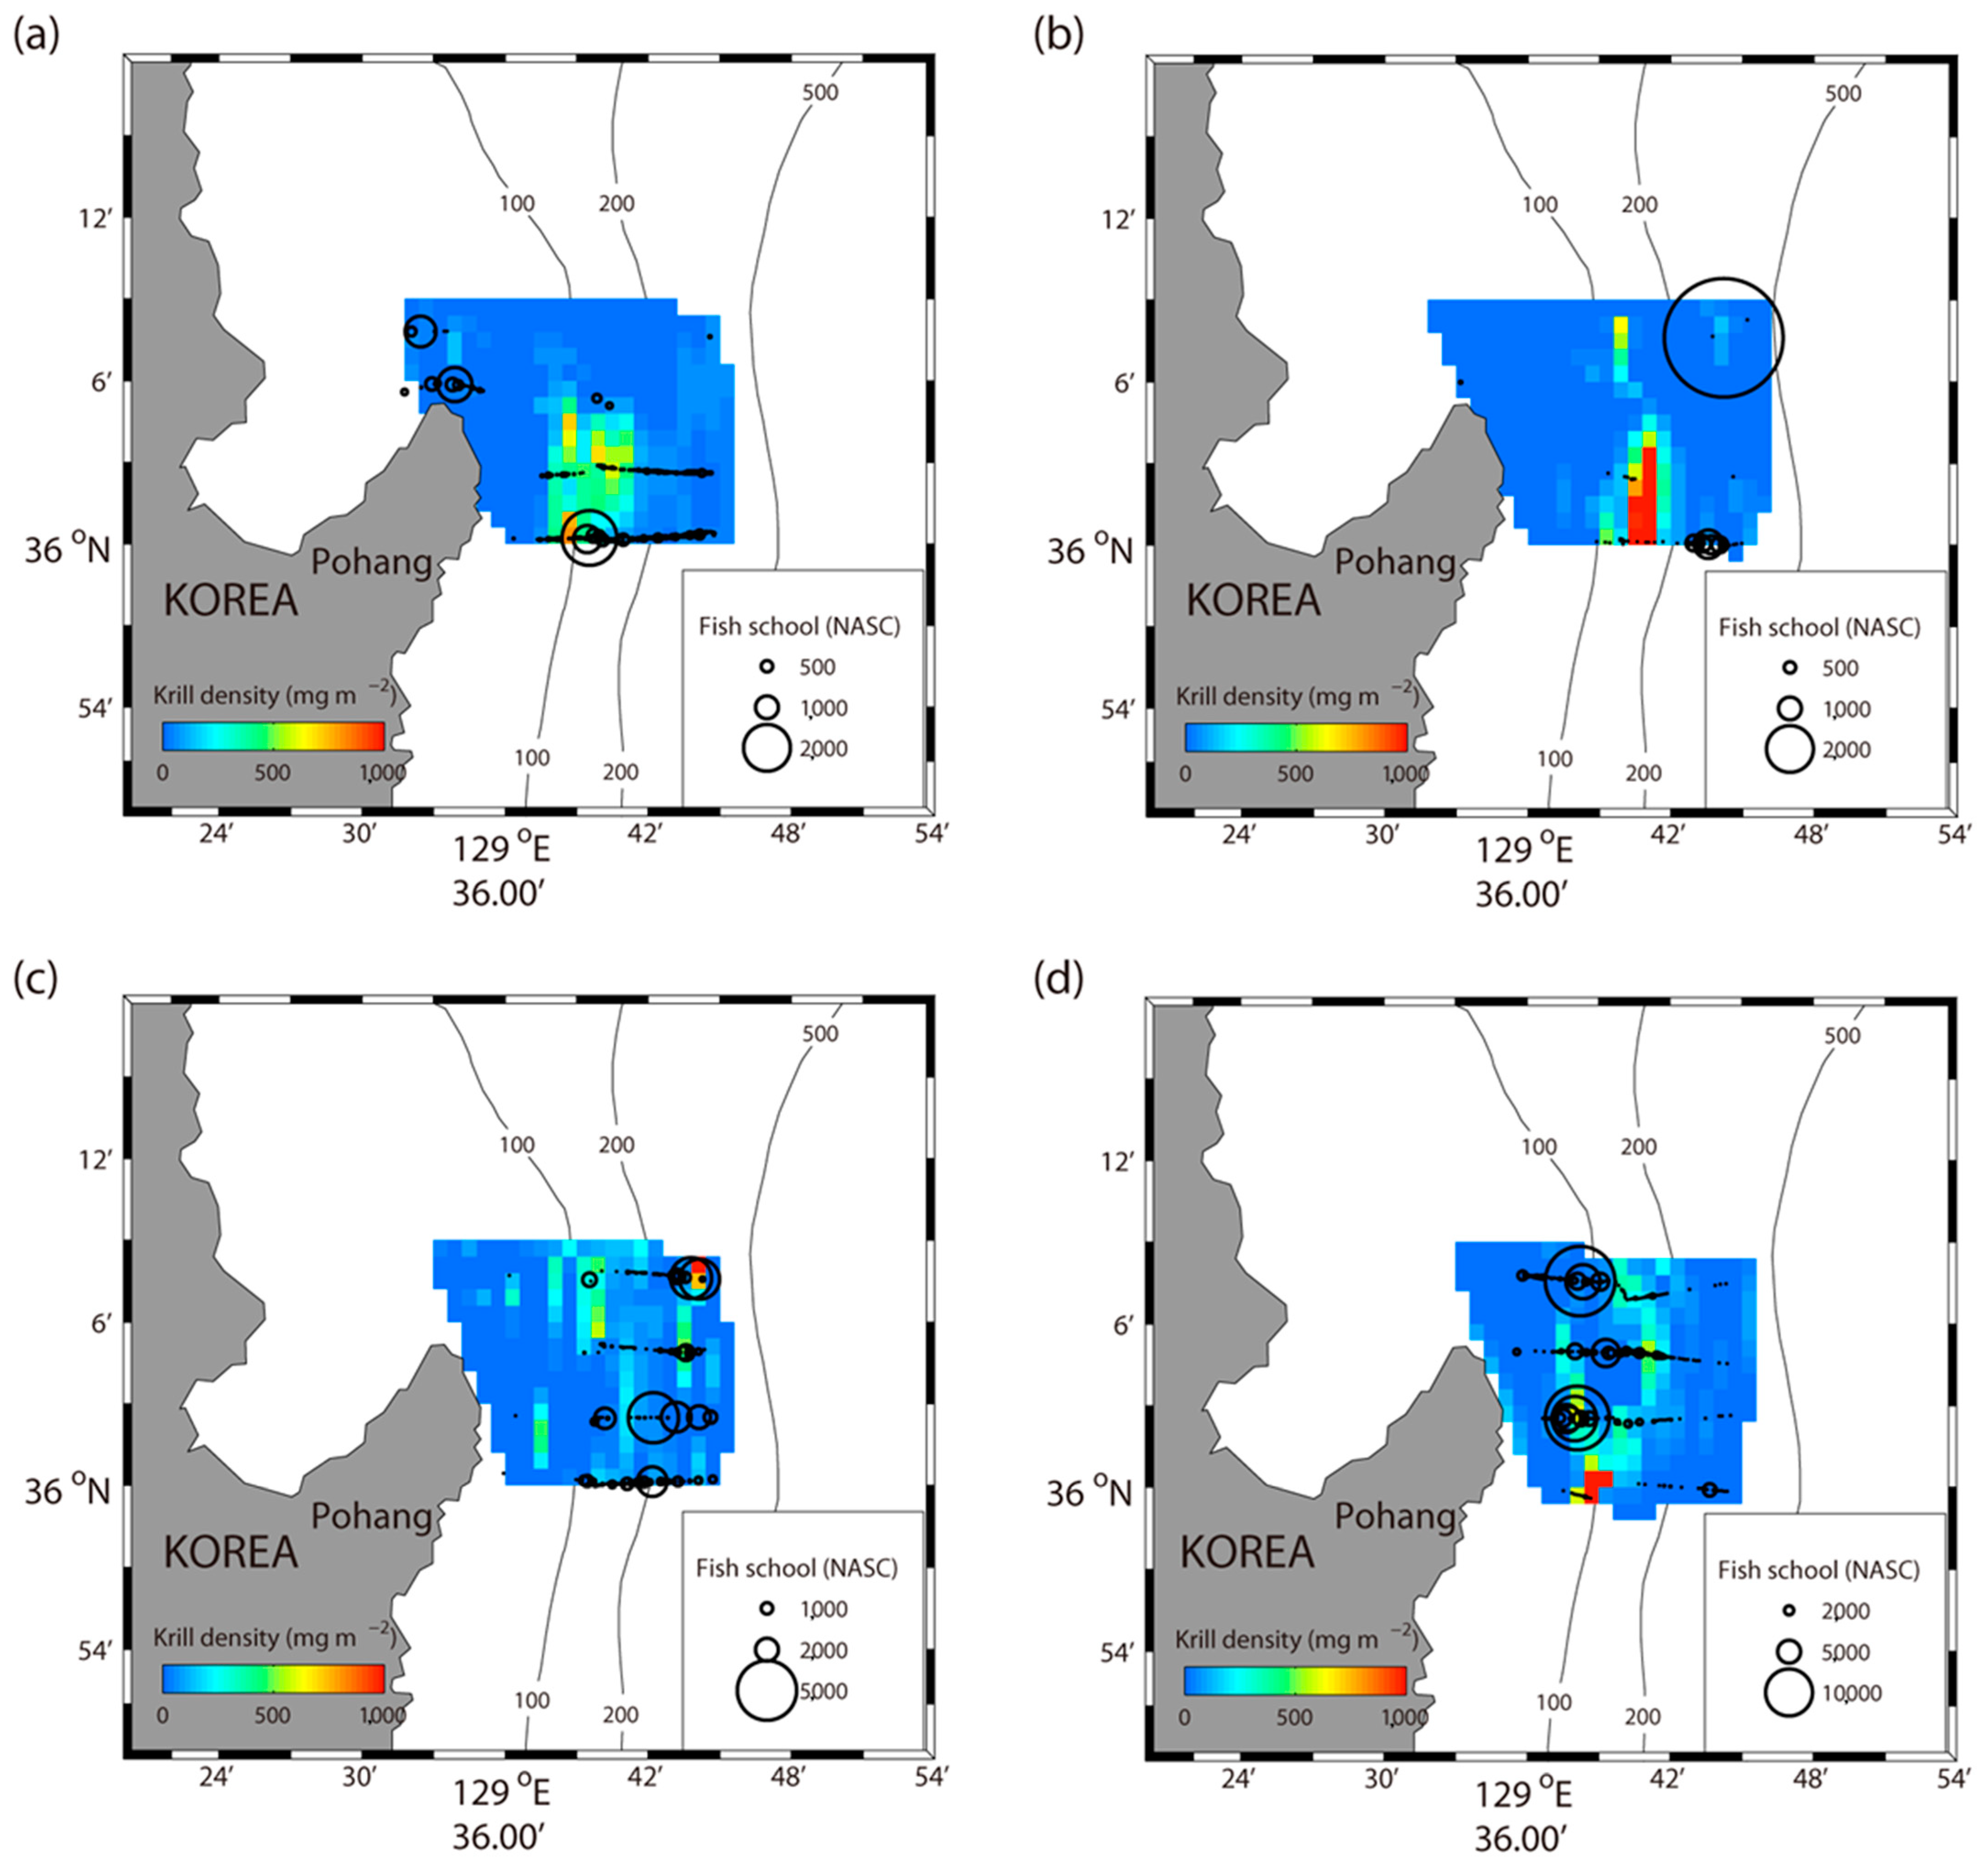
To visualize the overlap of E. pacifica and fish schools in space, the combined densities of E. pacifica (mg m−2) and fish schools (m2 nmi−2) were plotted over the 4 survey months (Figure 5). In April and May, the high density of E. pacifica was confirmed near the south-central region of the survey area. On the contrary, the distribution was irregular in June and July. The euphausiid Euphaisia pacifica can feed on a diverse array of food types, such as diatom [30,31], small copepod [32,33], and anchovy larvae [34]. During spring, E. pacifica was found to be concentrated in the south-central region of the survey area, which had heavily distributed Chl a, according to the satellite-based data (Figure 3). On the contrary, during summer, when Chl a is low, the krill seems to spread across based on the food activities in the survey area. The relative distribution of fish schools varied every month, but tended to significantly increase from spring to summer.
The acoustic density of E. pacifica was estimated using a dual frequency identification window. The E. pacifica adult length−frequency distribution (Figure 6) was used to calculate the dB windows used in the identification process for the acoustic data. The E. pacifica was predominant for 4 months, and the total length ranged from 11 to 24 mm with a mean of 17.2 mm (SD = 1.7 mm). From April to July, the length distribution was 16.5 mm, 17.9 mm, 17.8 mm, and 19.3 mm, respectively. The resultant SV 120–38 kHz and dB identification window used to identify E. pacifica was 13.0–19.1 dB, for calculations using the minimum and maximum lengths of E. pacifica. The estimated mean and median of the E. pacifica density using 120 kHz TS from the monthly length−frequency functions for each survey are presented in Table 3. In May, the highest weighted mean density of 85.33 mg−2 was calculated. April and June had similar weighted mean densities of 75.92 and 71.44 mg−2, respectively, while July had a weighted mean acoustic density of only 54.10 mg−2.
A total of 409 fish schools were identified in SV 38 kHz: 88 in April, 66 in May, 139 in June, and 116 in July (Figure 7). In April, the fish schools were located in narrow regions with a similar depth (mean of 61.3 m) and a low mean acoustic backscatter (467.8 m2 nmi−2). In May, the fish schools were located in broader and shallower regions (mean of 58.1 m) than in April, and coexisted with small and large acoustic backscatters (1423.5 m2 nmi−2). The fish schools in June were deeper (mean of 66.0 m) than those in May. In July, the greatest number of schools were observed, with the highest mean acoustic backscatter (1774.9 m2 nmi−2); a greater proportion of the schools were deeper, as reflected by the greater median depth (76.3 m), than in the other months. The dimensions of the fish schools were not significantly different between seasons; the mean school length was 92.4 m, 23.8 m, 44.1 m, and 35.1 m from April to June, while the thickness was 8.8 m, 6.4 m, 9.5 m, and 9.4 m, respectively. In April and May, the fish schools were distributed at relatively low latitudes, whereas after June, the fish schools tended to move to higher latitudes. From April to June, fish schools were relatively distributed in the offshore region; however, they were widely distributed in the inshore region in July.
4. Discussion
Acoustic surveys are commonly used to map and assess the biomass of a variety of fish schools and zooplankton [35]. Net estimates are typically lower and frequently unrelated to acoustic estimates of density, and suffer from avoidance issues, differing catchability, distribution heterogeneity, and low sampling volume. The accuracy of an E. pacifica density estimate is closely proportional to the accuracy of the TS when using acoustic scattering models. Only a small number of mesozooplankton, including E. pacifica, were collected due to avoidance; thus, the analysis was conducted only on the acoustic density of E. pacifica using the length distribution. It is considered that additional studies should be performed based on accurate sampling methods. The application of the DWBA requires information on the orientation distribution and acoustic properties (the density contrast, g, and the speed of sound contrast, h) of E. pacifica. However, based on previous studies conducted on the same species and survey area, the orientation distribution and acoustic properties of E. pacifica have no significant effect on the results of a study [22,23].
Areas with high E. pacifica density were observed in the coastal southwestern East Sea, and these did not overlap with areas of high fish school density. There was a weak correlation between E. pacifica and fish distribution. Stronger acoustic levels and larger fish school sizes were detected in summer than in spring. Due to their small mouths and poor ability to swim, small fish and larvae fed on zooplankton, such as Copepoda and Amphipoda, near their habitat [36]. In contrast, medium- and large-sized fish ate the E. pacifica and other small fish [37]. It was difficult to analyze the exact correlation based on the current results because there was no exact fish length distribution.
Although we can understand the distribution of fish schools by acoustic backscatter, there were limitations in identifying fish species. The monthly catch from April to July for the entire southeast East Sea was >2.5 times larger than that in other months (Korean value information services; http://kosis.kr accessed on 5 September 2021). The major species caught were anchovies, herrings, and mullets. Anchovies were caught with a high distribution of 52.6% of the total catch in the East Sea. The larval anchovy Engraulis japonicus Temminck & schlegel, 1846 on the coast of Korea fed primarily on copepods and tintinnids [38], while adult anchovies fed on E. pacifica [39]. Herring larvae also fed on Copepoda, while adults fed on both Copepoda and Euphausiacea [39]. Therefore, the spatial distribution between E. pacifica and fish schools was less correlated because the larvae consumed the copepods.
The acoustic transects were performed during day and night. Diel migration can influence the estimates of zooplankton density. However, the mean Sv at 38 and 120 kHz echograms did not show diel variation between day and night (Mann−Whitney U-test, p < 0.05). In addition, it was difficult to determine the accurate diel variation since the depth of the water varies from 32 m to 200 m in the survey transects. Thus, given the lack of evidence of diel variation, the day and night data were pooled to estimate E. pacifica density in the coastal southwestern East Sea.
Two calanoid copepods (Paracalanus parvus s. l. and Oithona similis) and E. pacifica followed a distribution in relation to the environmental features of the East Sea during spring and summer [40,41]. The TS is fundamental in estimating the number of targets in acoustic data. Currently, the most common method to estimate the copepod and E. pacifica population is the DWBA model. The total length of P. parvus and Oithona similis was less than 2 mm in the East Sea. The contribution of these copepods in acoustic data was negligible (less than −90 dB) due to the low mean-target strength (<−100 dB for 4.65-mm-long copepod at 120 kHz) [42].
We examined the characteristics of the multi-frequency data to identify E. pacifica that dominated the 120 kHz acoustic backscatter for all seasons in the East Sea, and whether they changed between seasons. Based on acoustic density with single zooplankton, it is possible to analyze multi-frequency in the Antarctic Ocean and Scotia Sea [7,29]. On the contrary, various zooplankton and fish coexist in the survey area. Other zooplankton, excluding E. pacifica, can be almost completely removed based on the threshold level. There is a possibility that acoustic scattering from small fish, such as anchovy larvae, were mixed with the acoustic signal, while E. pacifica larvae data were removed with copepods, based on the threshold level. However, it has no significant impact on the temporal and spatial distribution of E. pacifica in this study.
Although the coastal upwelling at the eastern coast of the East Sea shows seasonal and inter-annual changes, it usually occurs during periods of south or southwest wind, increasing basic Chl a [29]. Phytoplankton are generally considered as the primary food source of zooplankton, thereby influencing zooplankton growth and development rates [43]. In the East Sea, the phytoplankton bloom is regularly observed to be strong during spring and weak during fall [24]. During the survey period, the eddies in the stations and the heavily distributed Chl a, as determined by satellite data, were confirmed in April and May. However, it was difficult to establish a correlation between phytoplankton and E. pacifica distributions, and the density varied due to the discontinuous nature of the study. Therefore, we need to monitor the seasonal and inter-annual patterns and the density of zooplankton over long periods with environmental changes using a moored acoustic system. This could provide insight into the possible causes of variation of these factors, which cannot be achieved with regular ship-based sampling [12,44].
Few studies have examined the spatial and temporal distribution of E. pacifica and fish schools in the coastal southwestern East Sea. In this study, we utilized a dB window to identify E. pacifica and the acoustic backscatter attributed to fish schools in different seasons. We also attempted to predict the distribution of fish schools. The acoustic methods implemented aided in the identification of seasonal trends related to density or geographic location and provided information on varying seasonal behavior. The seasonal reorganization of the distribution of these key food web species highlights the need for inter-annual studies.
5. Conclusions
We conducted acoustic surveys using multi-frequencies on the spatial distribution of euphausiids and fish schools monthly from spring to summer in the coastal southwestern East Sea, where the marine environment highly dynamic. The euphausiid E. pacifica signals extracted through acoustic data processing were distributed in the center of the south part in the survey area during the spring season, with many phytoplankton identified in satellite data. On the other hand, in the summer, when the phytoplankton was homogeneously distributed, E. pacifica was distributed randomly in the area. The spatial distribution of the fish schools’ signals were not highly correlated with the distribution of E. pacifica. At the time of the survey, anchovy and herring, which are major pelagic species, were the main prey for the E. pacifica, in addition to copepods, according to the growth stage, showing no correlation with the spatial distribution of E. pacifica. In the future, it will be necessary for spatiotemporal studies of copepods, E. pacifica, and fish schools by including higher frequencies. This study is meaningful to examine the spatiotemporal distribution of plankton and fish groups using multiple frequencies.
Author Contributions
Conceptualization, H.L. and J.C.; methodology, H.L. and J.C.; software, W.O.; validation, Y.I. and K.H.; formal analysis, W.O.; investigation, H.L.; resources, K.H.; data curation, H.L.; writing—original draft preparation, H.L.; writing—review and editing, H.L.; visualization, H.L.; supervision, K.L.; project administration, J.C.; funding acquisition, K.H. All authors have read and agreed to the published version of the manuscript.
Funding
This research was supported by the National Institute of Fisheries Science (R2022030), Korea and was partially supported by the Ecosystem Structure and Function of Marine Protected Area (MPA) in Antarctica project (PM21060) funded by the Ministry of Oceans and Fisheries (20170336), Korea.
Institutional Review Board Statement
Not applicable.
Informed Consent Statement
Not applicable.
Data Availability Statement
Not applicable.
Acknowledgments
This research was supported by the National Institute of Fisheries Science (R2022030), Korea and was partially supported by the Ecosystem Structure and Function of Marine Protected Area (MPA) in Antarctica project (PM21060) funded by the Ministry of Oceans and Fisheries (20170336), Korea. We are grateful to the editor and anonymous reviewers for their insightful comments that greatly helped to clarify and refine the paper.
Conflicts of Interest
The authors declare no conflict of interest.
References
- Won, J.-H.; Lee, Y.-W. Spatiotemporal Variations of Marine Environmental Parameters in the South-western Region of the East Sea. Sea 2015, 20, 16–28. [Google Scholar] [CrossRef]
- Lee, J.C.; Na, J.Y. Structure of Upwelling off the Southease Coast of Korea. J. Korean Soc. Oceanogr. 1985, 20, 6–19. [Google Scholar]
- Kim, H.-C.; Yoo, S.; Oh, I.S. Relationship between phytoplankton bloom and wind stress in the sub-polar frontal area of the Japan/East Sea. J. Mar. Syst. 2007, 67, 205–216. [Google Scholar] [CrossRef]
- Sutor, M.; Cowles, T.; Peterson, W.; Pierce, S. Acoustic observations of finescale zooplankton distributions in the Oregon upwelling region. Deep. Sea Res. Part II Top. Stud. Oceanogr. 2005, 52, 109–121. [Google Scholar] [CrossRef]
- Ryther, J.H. Photosynthesis and Fish Production in the Sea. Science 1969, 166, 72–76. [Google Scholar] [CrossRef] [PubMed] [Green Version]
- Moku, M.; Kawaguchi, K.; Watanabe, H.; Ohno, A. Feeding habits of three dominant myctophid fishes, Diaphus theta, Stenobrachius leucopsarus and S. nannochir, in the subarctic and transitional waters of the western North Pacific. Mar. Ecol. Prog. Ser. 2000, 207, 129–140. [Google Scholar] [CrossRef] [Green Version]
- Fielding, S.; Watkins, J.L.; Collins, M.A.; Enderlein, P.; Venables, H.J. Acoustic determination of the distribution of fish and krill across the Scotia Sea in spring 2006, summer 2008 and autumn 2009. Deep Sea Res. Part II Top. Stud. Oceanogr. 2012, 59-60, 173–188. [Google Scholar] [CrossRef]
- Cho, K.D.; Kim, S.W.; Kang, G.H.; Lee, C.I.; Kim, D.S.; Choi, Y.S.; Choi, K.H. Relationship between fishing condition of common squid and oceanic condition in the East Sea. J. Korean Soc. Mar. Environ. Saf. 2004, 10, 61–67. [Google Scholar]
- Clay, C.S.; Medwin, H.; Urick, R.J. Acoustical Oceanography: Principles and Applications. Phys. Today 1978, 31, 71. [Google Scholar] [CrossRef]
- Holliday, D.V. Bioacoustical oceanography at high frequencies. ICES J. Mar. Sci. 1995, 52, 279–296. [Google Scholar] [CrossRef]
- MacLennan, D.N.; Holliday, D.V. Fisheries and plantton acoustics: Past, present, and future. ICES J. Mar. Sci. 1996, 53, 513–516. [Google Scholar] [CrossRef] [Green Version]
- La, H.S.; Ha, H.; Kang, C.; Wahlin, A.; Shin, H. Acoustic backscatter observations with implications for seasonal and vertical migrations of zooplankton and nekton in the Amundsen shelf (Antarctica). Estuar. Coast. Shelf Sci. 2015, 152, 124–133. [Google Scholar] [CrossRef]
- Lee, H.; Choi, J.; Moon, S.; Lee, K.; Oh, W.; Im, Y.; Hwang, K.; Kim, D. Small-Scale Spatiotemporal Pattern in the Spawning of Pacific Herring (Clupea pallasii) in the Jinhae Bay, Korea, Estimated Using Hydroacoustic Survey. Appl. Sci. 2021, 11, 2058. [Google Scholar] [CrossRef]
- Reiss, C.S.; Cossio, A.M.; Walsh, J.; Cutter, G.R.; Watters, G.M. Glider-Based Estimates of Meso-Zooplankton Biomass Density: A Fisheries Case Study on Antarctic Krill (Euphausia superba) Around the Northern Antarctic Peninsula. Front. Mar. Sci. 2021, 8, 256. [Google Scholar] [CrossRef]
- Benoit-Bird, K.J.; Waluk, C.M. Remote acoustic detection and characterization of fish schooling behavior. J. Acoust. Soc. Am. 2021, 150, 4329–4342. [Google Scholar] [CrossRef] [PubMed]
- Basilone, G.; Ferreri, R.; Barra, M.; Bonanno, A.; Pulizzi, M.; Gargano, A.; Fontana, I.; Giacalone, G.; Rumolo, P.; Mazzola, S.; et al. Spawning ecology of the European anchovy (Engraulis encrasicolus) in the Strait of Sicily: Linking variations of zooplankton prey, fish density, growth, and reproduction in an upwelling system. Prog. Oceanogr. 2020, 184, 102330. [Google Scholar] [CrossRef]
- Holland, M.M.; Everett, J.D.; Cox, M.J.; Doblin, M.A.; Suthers, I.M. Pelagic forage fish distribution in a dynamic shelf ecosystem—Thermal demands and zooplankton prey distribution. Estuar. Coast. Shelf Sci. 2021, 249, 107074. [Google Scholar] [CrossRef]
- McClain, C.R. Science quality SeaWiFS data for global biosphere research. Sea Technol. 1998, 39, 10–16. [Google Scholar]
- Morris, D.; Watkins, J.L.; Ricketts, C.; Buchholz, F.; Priddle, J. An assessment of the merits of length and weight measurements of Antarctic krill Euphausia superba. BAS Bull. 1988, 79, 27–50. [Google Scholar]
- Foote, K.G. Spheres for calibrating an eleven-frequency acoustic measurement system. ICES J. Mar. Sci. 1990, 46, 284–286. [Google Scholar] [CrossRef]
- CAAMLR. Commission for the Conservation of Antarctic Marine Living Resources Home Page. 2010. Available online: https://www.ccamlr.org/en/sc-camlr-xxix (accessed on 30 September 2011).
- Mukai, T.; Iida, K.; Ando, Y.; Mikami, H.; Maki, Y.; Matsukura, R. Measurements of swimming angles, density, and sound speed of the krill euphausia pacifica for target strength estimation. In Proceedings of the Oceans ’04 MTS/IEEE Techno-Ocean ’04 (IEEE Cat. No.04CH37600), Kobe, Japan, 9–12 November 2004; Volume 1, pp. 383–388. [Google Scholar] [CrossRef]
- Miyashita, K.; Aoki, I.; Inagaki, T. Swimming behaviour and target strength of isada krill (Euphausia pacifica). ICES J. Mar. Sci. 1996, 53, 303–308. [Google Scholar] [CrossRef]
- Kim, H.-S.; Ju, S.-J.; Ko, A.-R. Comparisons of Feeding Ecology of Euphausia pacifica from Korean Waters Using Lipid Composition. Ocean Polar Res. 2010, 32, 165–175. [Google Scholar] [CrossRef]
- Reiss, C.S.; Cossio, A.M.; Loeb, V.; Demer, D.A. Variations in the biomass of Antarctic krill (Euphausia superba) around the South Shetland Islands, 1996–2006. ICES J. Mar. Sci. 2008, 65, 497–508. [Google Scholar] [CrossRef] [Green Version]
- Coetzee, J. Use of a shoal analysis and patch estimation system (SHAPES) to characterise sardine schools. Aquat. Living Resour. 2000, 13, 1–10. [Google Scholar] [CrossRef]
- Johnson, R.K. Erratum: “Sound scattering from a fluid sphere revisited” [J. Acoust. Soc. Am. 61, 375–377 (1977)]. J. Acoust. Soc. Am. 1978, 63, 626. [Google Scholar] [CrossRef]
- McGillicuddy, D.; Johnson, R.; Siegel, D.A.; Michaels, A.F.; Bates, N.R.; Knap, A.H. Mesoscale variations of biogeochemical properties in the Sargasso Sea. J. Geophys. Res. Space Phys. 1999, 104, 13381–13394. [Google Scholar] [CrossRef] [Green Version]
- Yoo, S.; Park, J. Why is the southwest the most productive region of the East Sea/Sea of Japan? J. Mar. Syst. 2009, 78, 301–315. [Google Scholar] [CrossRef]
- Lasker, R. Feeding, Growth, Respiration, and Carbon Utilization of a Euphausiid Crustacean. J. Fish. Res. Board Can. 1966, 23, 1291–1317. [Google Scholar] [CrossRef]
- Parsons, T.R.; Lebrasseur, R.J.; Fulton, J.D. Some Observations on the Dependence of Zooplankton Grazing on the Cell Size and Concentration of Phytoplankton Blooms. J. Oceanogr. 1967, 23, 10–17. [Google Scholar] [CrossRef] [Green Version]
- Nakagawa, Y.; Ota, T.; Endo, Y.; Taki, K.; Sugisaki, H. Importance of ciliates as prey of the euphausiid Euphausia pacifica in the NW North Pacific. Mar. Ecol. Prog. Ser. 2004, 271, 261–266. [Google Scholar] [CrossRef] [Green Version]
- Ohman, M.D. Omnivory by Euphausia pacifica: The role of copepod prey. Mar. Ecol. Prog. Ser. 1984, 19, 125–131. [Google Scholar] [CrossRef]
- Theilacker, G.H.; Lasker, R. Laboratory Studies of Predation by Euphausiid Shrimps on Fish Larvae. In The Early Life History of Fish; Springer: Berlin/Heidelberg, Germeny, 1974; pp. 287–299. [Google Scholar]
- Hewitt, R.P.; Watkins, J.; Naganobu, M.; Sushin, V.; Brierley, A.S.; Demer, D.; Kasatkina, S.; Takao, Y.; Goss, C.; Malyshko, A.; et al. Biomass of Antarctic krill in the Scotia Sea in January/February 2000 and its use in revising an estimate of precautionary yield. Deep Sea Res. Part II Top. Stud. Oceanogr. 2004, 51, 1215–1236. [Google Scholar] [CrossRef]
- Gerking, S. Feeding Ecology of Fish; Academic Press: San Diego, CA, USA, 1994. [Google Scholar] [CrossRef]
- Castro, J. Feeding ecology of chub mackerel Scomber japonicus in the Canary Islands area. S. Afr. J. Mar. Sci. 1993, 13, 323–328. [Google Scholar] [CrossRef]
- Kim, H.J.; Jeong, J.M.; Park, J.H.; Baeck, G.W. Feeding Habits of Larval Japanese Anchovy Engraulis japonicus in Eastern Jinhae Bay, Korea. Korean J. Fish. Aquat. Sci. 2017, 50, 92–97. [Google Scholar] [CrossRef] [Green Version]
- Kim, M.J.; Youn, S.H.; Kim, J.-Y.; Oh, C.-W. Feeding Characteristics of the Japanese Anchovy, Engraulis japonicus According to the Distribution of Zooplankton in the Coastal Waters of Southern Korea. Environ. Biol. Res. 2013, 31, 275–287. [Google Scholar] [CrossRef]
- Lee, C.R.; Park, C.; Moon, C.H. Appearance of cold water and distribution of zooplankton off Ulsan-Gampo area, eastern coastal area of Korea. Sea 2004, 9, 51–63. [Google Scholar]
- Mauchline, J. The biology of mysids and euphausiids. Part 2. The biology of euphausids. Adv. Mar. Biol. 1980, 18, 372–623. [Google Scholar]
- Hwang, B.-K.; Shin, H.-O.; Lee, D.-J.; Lee, Y.-W. Examination of Theoretical Acoustic Scattering Models for Copepods in an Acoustical Zooplankton Biomass Survey. Korean J. Fish. Aquat. Sci. 2010, 43, 380–385. [Google Scholar] [CrossRef]
- Whitehouse, M.J.; Atkinson, A.; Ward, P.; Korb, R.E.; Rothery, P.; Fielding, S. Role of krill versus bottom-up factors in controlling phytoplankton biomass in the northern Antarctic waters of South Georgia. Mar. Ecol. Prog. Ser. 2009, 393, 69–82. [Google Scholar] [CrossRef] [Green Version]
- Cisewski, B.; Strass, V.; Rhein, M.; Krägefsky, S. Seasonal variation of diel vertical migration of zooplankton from ADCP backscatter time series data in the Lazarev Sea, Antarctica. Deep Sea Res. Part I Oceanogr. Res. Pap. 2010, 57, 78–94. [Google Scholar] [CrossRef] [Green Version]
Figure 1.
Study area showing the acoustic transects (black line), CTD stations (black square), and net stations (black square) in the coastal southwestern East Sea, Korea. Bathymetric contours are at 100, 200, 500, and 1000 m.
Figure 1.
Study area showing the acoustic transects (black line), CTD stations (black square), and net stations (black square) in the coastal southwestern East Sea, Korea. Bathymetric contours are at 100, 200, 500, and 1000 m.

Figure 2.
Vertical section of water temperature (°C, color shading) and salinity (contour line) from April to July 2010 in the coastal southwestern East Sea. April (a); May (b); June (c); July (d).
Figure 2.
Vertical section of water temperature (°C, color shading) and salinity (contour line) from April to July 2010 in the coastal southwestern East Sea. April (a); May (b); June (c); July (d).

Figure 3.
Monthly 8-day average of Chl a concentration from the MODIS Aqua Ocean color data in (a) 15–22 April, (b) 17–24 May, (c) 10–17 June, and (d) 12–19 July 2010 in the coastal southwestern East Sea.
Figure 3.
Monthly 8-day average of Chl a concentration from the MODIS Aqua Ocean color data in (a) 15–22 April, (b) 17–24 May, (c) 10–17 June, and (d) 12–19 July 2010 in the coastal southwestern East Sea.

Figure 4.
Echograms of the top 200 m of the water column at 120 kHz from April to July 2010. Lower threshold is −90 dB in the coastal southwestern East Sea.
Figure 4.
Echograms of the top 200 m of the water column at 120 kHz from April to July 2010. Lower threshold is −90 dB in the coastal southwestern East Sea.

Figure 5.
Map of the monthly concentration of Euphausia pacifica and fish schools. Sizes of the black circles correspond to the concentration of fish schools in the transects where acoustic data were collected. Interpolated measurements of E. pacifica are shown in the background. April (a); May (b); June (c); July (d).

Figure 6.
Length−frequency distributions of Euphausia pacifica adults in the East Sea. Gray bars represent the length−frequency distribution in four surveys. The lines indicate the length−frequency distribution from April to July 2010.
Figure 6.
Length−frequency distributions of Euphausia pacifica adults in the East Sea. Gray bars represent the length−frequency distribution in four surveys. The lines indicate the length−frequency distribution from April to July 2010.

Figure 7.
Fish school parameter mean (dashed line), median (solid line), 25th and 75th percentiles (grey box), and outliers (red plus) of (a) school depth (m), (b) school length (m), (c) school thickness (m), (d) acoustic backscatter at 38 kHz (NASC, m2 nmi−2), and (e) latitude and (f) longitude of fish schools in the coastal southwestern East Sea.


Table 1.
Details of each acoustic transect survey from April to July 2010.
| Cruise | Transect Start Time (YYYY/MM/DD, UTC) | Transect End Time (YYYY/MM/DD, UTC) | Distance (km) | Geographical Feature |
|---|---|---|---|---|
| April | 15 April 2010, 09:00 | 15 April 2020, 14:08 | 55.93 | St.1~St.6 |
| 16 April 2010, 02:40 | 16 April 2010, 07:07 | 33.15 | St.7~St.12 | |
| May | 17 May 2010, 07:10 | 17 May 2010, 12:24 | 51.67 | St.1~St.6 |
| 19 May 2010, 23:17 | 20 May 2010, 04:46 | 38.71 | St.7~St.12 | |
| June | 14 June 2010, 07:38 | 14 June 2010, 12:13 | 42.04 | St.7~St.12 |
| 15 June 2010, 03:17 | 15 June 2010, 08:12 | 36.30 | St.1~St.6 | |
| July | 18 July 2010, 00:41 | 18 July 2010, 09:22 | 83.52 | St.1~St.12 |
Table 2.
Calibration specifics for transceivers (EK60).
| Frequency (kHz) | 38 | 120 |
| Transmitted power (W) | 1000 | 500 |
| Pulse duration (ms) | 0.512 | 0.512 |
| Two-way beam angle (dB) | −15.50 | −20.80 |
| Receiver bandwidth (kHz) | 2.43 | 3.03 |
| Transducer gain (dB) | 21.61 | 25.46 |
| 3-dB Beam angle (along/athwart) (°) | 12.07/11.77 | 6.41/6.39 |
| SA correction | −0.79 | −0.37 |
Table 3.
Mean (standard deviation, SD) and median (standard error, SE) of Euphausia pacifica density (g m−2), integrated from 20 m to the bottom from April to July, 2010. The monthly densities were estimated from the 120-kHz SV data using multi-frequency analysis methods.
Table 3.
Mean (standard deviation, SD) and median (standard error, SE) of Euphausia pacifica density (g m−2), integrated from 20 m to the bottom from April to July, 2010. The monthly densities were estimated from the 120-kHz SV data using multi-frequency analysis methods.
| Date | 120 kHz Mean TS | E. pacifica Density (mg m−2) | |
|---|---|---|---|
| Mean (SD) | Median (SE) | ||
| April, 2010 | −85.86 dB | 75.92 (126.52) | 33.12 (5.62) |
| May, 2010 | −84.33 dB | 85.33 (252.24) | 0.00 (11.21) |
| June, 2010 | −84.44 dB | 71.44 (130.45) | 18.53 (5.80) |
| July, 2010 | −82.94 dB | 54.10 (157.67) | 3.08 (7.01) |
Publisher’s Note: MDPI stays neutral with regard to jurisdictional claims in published maps and institutional affiliations. |
© 2022 by the authors. Licensee MDPI, Basel, Switzerland. This article is an open access article distributed under the terms and conditions of the Creative Commons Attribution (CC BY) license (https://creativecommons.org/licenses/by/4.0/).
Share and Cite
MDPI and ACS Style
Lee, H.; Choi, J.; Im, Y.; Oh, W.; Hwang, K.; Lee, K. Spatial–Temporal Distribution of the Euphausiid Euphausia pacifica and Fish Schools in the Coastal Southwestern East Sea. Water 2022, 14, 203. https://doi.org/10.3390/w14020203
AMA Style
Lee H, Choi J, Im Y, Oh W, Hwang K, Lee K. Spatial–Temporal Distribution of the Euphausiid Euphausia pacifica and Fish Schools in the Coastal Southwestern East Sea. Water. 2022; 14(2):203. https://doi.org/10.3390/w14020203
Chicago/Turabian StyleLee, Hyungbeen, Junghwa Choi, Yangjae Im, Wooseok Oh, Kangseok Hwang, and Kyounghoon Lee. 2022. "Spatial–Temporal Distribution of the Euphausiid Euphausia pacifica and Fish Schools in the Coastal Southwestern East Sea" Water 14, no. 2: 203. https://doi.org/10.3390/w14020203
Note that from the first issue of 2016, this journal uses article numbers instead of page numbers. See further details here.