
Assessment of Flood Risk Map under Climate Change RCP8.5 Scenarios in Taiwan


National Science and Technology Center for Disaster Reduction, New Taipei City 23143, Taiwan
*
Author to whom correspondence should be addressed.
Water 2022, 14(2), 207; https://doi.org/10.3390/w14020207
Submission received: 24 November 2021
/
Revised: 22 December 2021
/
Accepted: 5 January 2022
/
Published: 11 January 2022
(This article belongs to the Special Issue Mitigation Techniques for Water-Induced Natural Disasters: The State of the Art)
Abstract
:Climate change has exerted a significant global impact in recent years, and extreme weather-related hazards and incidents have become the new normal. For Taiwan in particular, the corresponding increase in disaster risk threatens not only the environment but also the lives, safety, and property of people. This highlights the need to develop a methodology for mapping disaster risk under climate change and delineating those regions that are potentially high-risk areas requiring adaptation to a changing climate in the future. This study provides a framework of flood risk map assessment under the RCP8.5 scenario by using different spatial scales to integrate the projection climate data of high resolution, inundation potential maps, and indicator-based approach at the end of the 21st century in Taiwan. The reference period was 1979–2003, and the future projection period was 2075–2099. High-resolution climate data developed by dynamic downscaling of the MRI-JMA-AGCM model was used to assess extreme rainfall events. The flood risk maps were constructed using two different spatial scales: the township level and the 5 km × 5 km grid. As to hazard-vulnerability(H-V) maps, users can overlay maps of their choice—such as those for land use distribution, district planning, agricultural crop distribution, or industrial distribution. Mapping flood risk under climate change can support better informed decision-making and policy-making processes in planning and preparing to intervene and control flood risks. The elderly population distribution is applied as an exposure indicator in order to guide advance preparation of evacuation plans for high-risk areas. This study found that higher risk areas are distributed mainly in northern and southern parts of Taiwan and the hazard indicators significantly increase in the northern, north-eastern, and southern regions under the RCP8.5 scenario. Moreover, the near-riparian and coastal townships of central and southern Taiwan have higher vulnerability levels. Approximately 14% of townships have a higher risk level of flooding disaster and another 3% of townships will become higher risk. For higher-risk townships, adaptation measures or strategies are suggested to prioritize improving flood preparation and protecting people and property. Such a flood risk map can be a communication tool to effectively inform decision- makers, citizens, and stakeholders about the variability of flood risk under climate change. Such maps enable decision-makers and national spatial planners to compare the relative flood risk of individual townships countrywide in order to determine and prioritize risk adaptation areas for planning spatial development policies.
1. Introduction
The number of extreme climate events is increasing and such events will become more frequent and severe in many parts of the world due to impact of climate change [1,2,3,4,5]. In recent years extreme weather events have become the norm. Extreme precipitation is a major causal factor of natural disasters. The number of hydro-meteorological disasters will also increase, as a result of the increased frequency and longevity of more intense extreme rainfall events, such as floods, landslides, and water scarcity after rain-on-snow events [6,7,8,9,10,11,12,13,14,15]. The increased frequency of floods already causes great economic losses and casualties under climate change [16,17,18]. Extreme rainfall events will become more frequent under climate change scenarios, and the possibility of flood risk will increase significantly. Disaster risk is defined as the potential disaster losses in lives, health, status, livelihoods, property, and services which could occur to a particular community or society over some specified future time period [19].
Flood risk assessment is an important issue in understanding extreme rainfall varieties and reducing flood impacts [20,21,22,23,24,25,26]. Flood risk maps are an essential tool to help planners and decision-makers to better understand the spatial distribution of hypothetical flood characteristics more directly and easily and to provide necessary information for many strategies for mitigating and managing flood and setting policies for land development and insurance [27,28,29,30,31,32,33,34].
Based on a survey of previous studies, methods of flood risk assessment can be divided into two main approaches. One approach involves using numerical models (e.g., hydrology and hydraulic models) to simulate the extent and depth of the flooding impact based on historical rainfall events with different return period or extreme rainfall events under climate change [14,15,16,17,20,21,22]. This approach, which can assess the detailed spatial and temporal changes of flooding on the local scale, e.g., watersheds, urban areas, is limited by the inefficiency and cost of simulation. Another approach involves using indicators to assess flood risk. Many studies have compared geographic information systems (GIS) and Analytical Hierarchy Process (AHP) or Multi-criteria Analysis (MCA) to estimate current and future flood risk maps [33,34,35,36,37,38,39,40,41]. The flood risk maps were presented on different scales, e.g., global, regional, local, and basin scales [42,43,44,45,46,47]. Most of flood risk maps on the global and national scale risk scales only showed occurrence frequency and severity of extreme rainfall (hazard of flood); they could not take physical processes and detailed problems of local flooding into account. Merz et al. [34] discussed flood risk mapping on the local scale, including the challenges, and proposed a systematic presentation of flood hazards, vulnerabilities, and flood risks, spanning from flood danger maps to damage risk maps. Consequently, most flood risk mapping approaches were focused on the local scale to assist flood management because it can be help planners to develop land use and improve planning the local flood prevention to protect people and property.
The definition of flood risk, which is a function of the flood hazard, vulnerability, and exposure, was applied to assess flood risk maps in the above-previous researches based on United Nations International Strategy for Disaster Reduction (UNISDR) [19] and The Intergovernmental Panel on Climate Change (IPCC) SREX report [48]. The IPCC report discussed the effects of natural and human-induced climate change on extreme climate incidents, as well as on the exposure and vulnerability of human societies and natural ecosystems. Reduction of disaster risks needs to include decreasing vulnerability and exposure and mitigating the impact of weather and climate incidents. The vulnerability is a critical factor affecting disaster risk and its impact. Hence, how to apply rainfall data under climate change scenarios to simulate the physical mechanism and process of flooding on national scale reasonably will be a critical issue.
Applying the indicator-based method, previous studies, combined the AHP and GIS to assess flood hazard risk and classify risk levels in order to provide flood mitigation strategies for decision-makers [39,40,41,42,43,44,45,46,47]. However, besides the exposure indicator usually in the vulnerability evaluation, too many indicators were included in the assessment of flood risk by most of the indicator-based method studies. It is difficult to distinguish the variability of hazard, vulnerability, and exposure indicators in flood risk maps under climate change. Moreover, the decision-makers and interdisciplinary users cannot clearly distinguish those indictors (factors) which cause high risks in seeking to adopt appropriate adaptation measures for specific high-risk areas. The exposure indicator cannot be divided into different aspects, such as crop, transportation, financial assets, in the risks noted by users of different disciplines. For this reason, this study will only focus on three indictors-- hazard, exposure and vulnerability indictors. The definition of flood risk will be based on the concept of risk used in the IPCC report [48]. The decision-makers and interdisciplinary users can plan reduction measures of flood risk based on vulnerability and exposure maps.
Many studies explored the potential impact of climate change by applying rainfall results of general circulation model (GCMs) with resolution of 100–200 km directly [49,50]. But, the spatial resolution remains insufficient for describing the local weather with complex terrain and climate characteristics. Huang et al. [51] estimated the risk of magnitude and frequency changes of extreme precipitation under Rcp8.8 scenarios. Cabrera et al. [45] applied the AHP and rainfall of GCMs projections from the Coupled Model Intercomparison Project Phase 5 (CMIP5) to evaluate impact on flood-prone in coastal areas, Philippines. Such studies cannot estimate extreme rainfall events which reflect the specific terrain and rainfall characteristics of a local area accurately by using global daily rainfall and only the hazard of rainfall was taken into consider in risk assessments. Janizadeh et al. [52] applied multi-indicators in mapping the spatial and temporal variability of flood hazard effects on the basin scale under RCP 2.6 and RCP 8.5 scenarios. Although the climate scenarios were taken into consideration in this study, there were too many indictors to reflect variability of flood risk factor accurately. Moreover, this study only focused on the local scale to assist flood hazard. It cannot be applied to compare flood risk level of different regions on national scale. The extreme events cannot be estimated precisely due to the coarse spatial resolution of the GCMs. So, it is difficult to evaluate disaster risk maps of extreme events impacts under climate change on a regional scale [45,46]. For small island areas like Taiwan, in particular, that is only about 3600 km2 in area, there are only 2~4 grid points in low-resolution climate data. In order to solve the problem of coarse spatial resolution, this study used an atmospheric general circulation model (AGCM) developed by the Meteorological Research Institute (MRI) of the Japan Meteorological Agency (JMA) (hereinafter referred to as MRI-JMA-AGCM) [53] to assess the probability of extreme rainfall by dynamic downscaling [54]. After dynamic downscaling, the rainfall data of 5 km resolution could be applied to estimate the hazard indicators of flood risk.
The above-mentioned hazard assessment approaches left some gaps in flood risk maps that need to be addressed. For example, the hydrology numerical model approaches only evaluated historical extreme events and did not predict rainfall due to the impact of climate change on the national scale; the results of coarse spatial resolution of flood risk maps on the national scale could not be applied to regional and local land plans; moreover, combinations of GIS and AHP approaches incorporated many indictors to produce flood risk maps but which lacked the variability of extreme rainfall under climate change impact so that decision-makers and planners could not apply the result to reduce the vulnerability or exposure of individuals facing impacts of climate change. Moreover, the interdisciplinary users could not apply the flood risk maps to overlay maps of different exposure indicators. In order to close the gaps in the above-mentioned research and provide users with a useful flood risk map which is simple, clear, and easy to understand, the present study used high-resolution climate data of dynamic downscaling to improve the insufficient spatial analysis and the inability to capture the characteristics of local extreme rainfall, as well as applying the indicator-based method to improve inability to rapidly simulate the flooding process of a country with numerous extreme rainfall events of climate change.
The inundation potential maps of the Water Resources Agency (WRA) [55] were used to reflect magnitude of physical vulnerability in order to address the deficiencies of the indicator-based method owing to its inability to simulate the extent and depth of the flooding in wide areas with detailed hydrology and hydraulic model numerical models. In order to facilitate disaster management and effective use of the flood risk map, the maps were shown by administrative districts on the national scale. The flood risk map also can be a communication tool to help decision-makers, citizens, and stakeholders to better understand the variability of flood risk under climate change. The map would enable decision-makers to compare the relative flood risk of individual townships across the countrywide and determine and prioritize adaptation areas and for preventing flood impacts. National spatial planners can apply such maps in planning spatial development policies and preparing disaster prevention. In addition, the present study establishes the flood hazard-vulnerability (H-V) map of 5 km grids. This map format is more flexible and allows do overlay mapping in different fields for specific user needs. The H-V map was applied to overlay the spatial distribution of crops for the case study. Because most national land-use planners and financial industry managers cannot deal with the plenitude of climate situation data or apply numerical models (e.g., hydrological, hydrodynamic and hydraulic models) to simulate impact of flood, a simple flood risk map under climate change that can be applied to mapping in the different fields is essential. Such flood risk maps and the H-V maps can provide assessment information for financial industry managers to efficiently assess the Task Force on Climate-Related Financial Disclosures (TCFD).
The present study considers two hypotheses: (1) the spatial unit of the flood risk map is township. That is, the level of flood risk at the township level is the same; (2) the indictors of vulnerability and exposure are also are assumed the same in the future.
2. Study Area
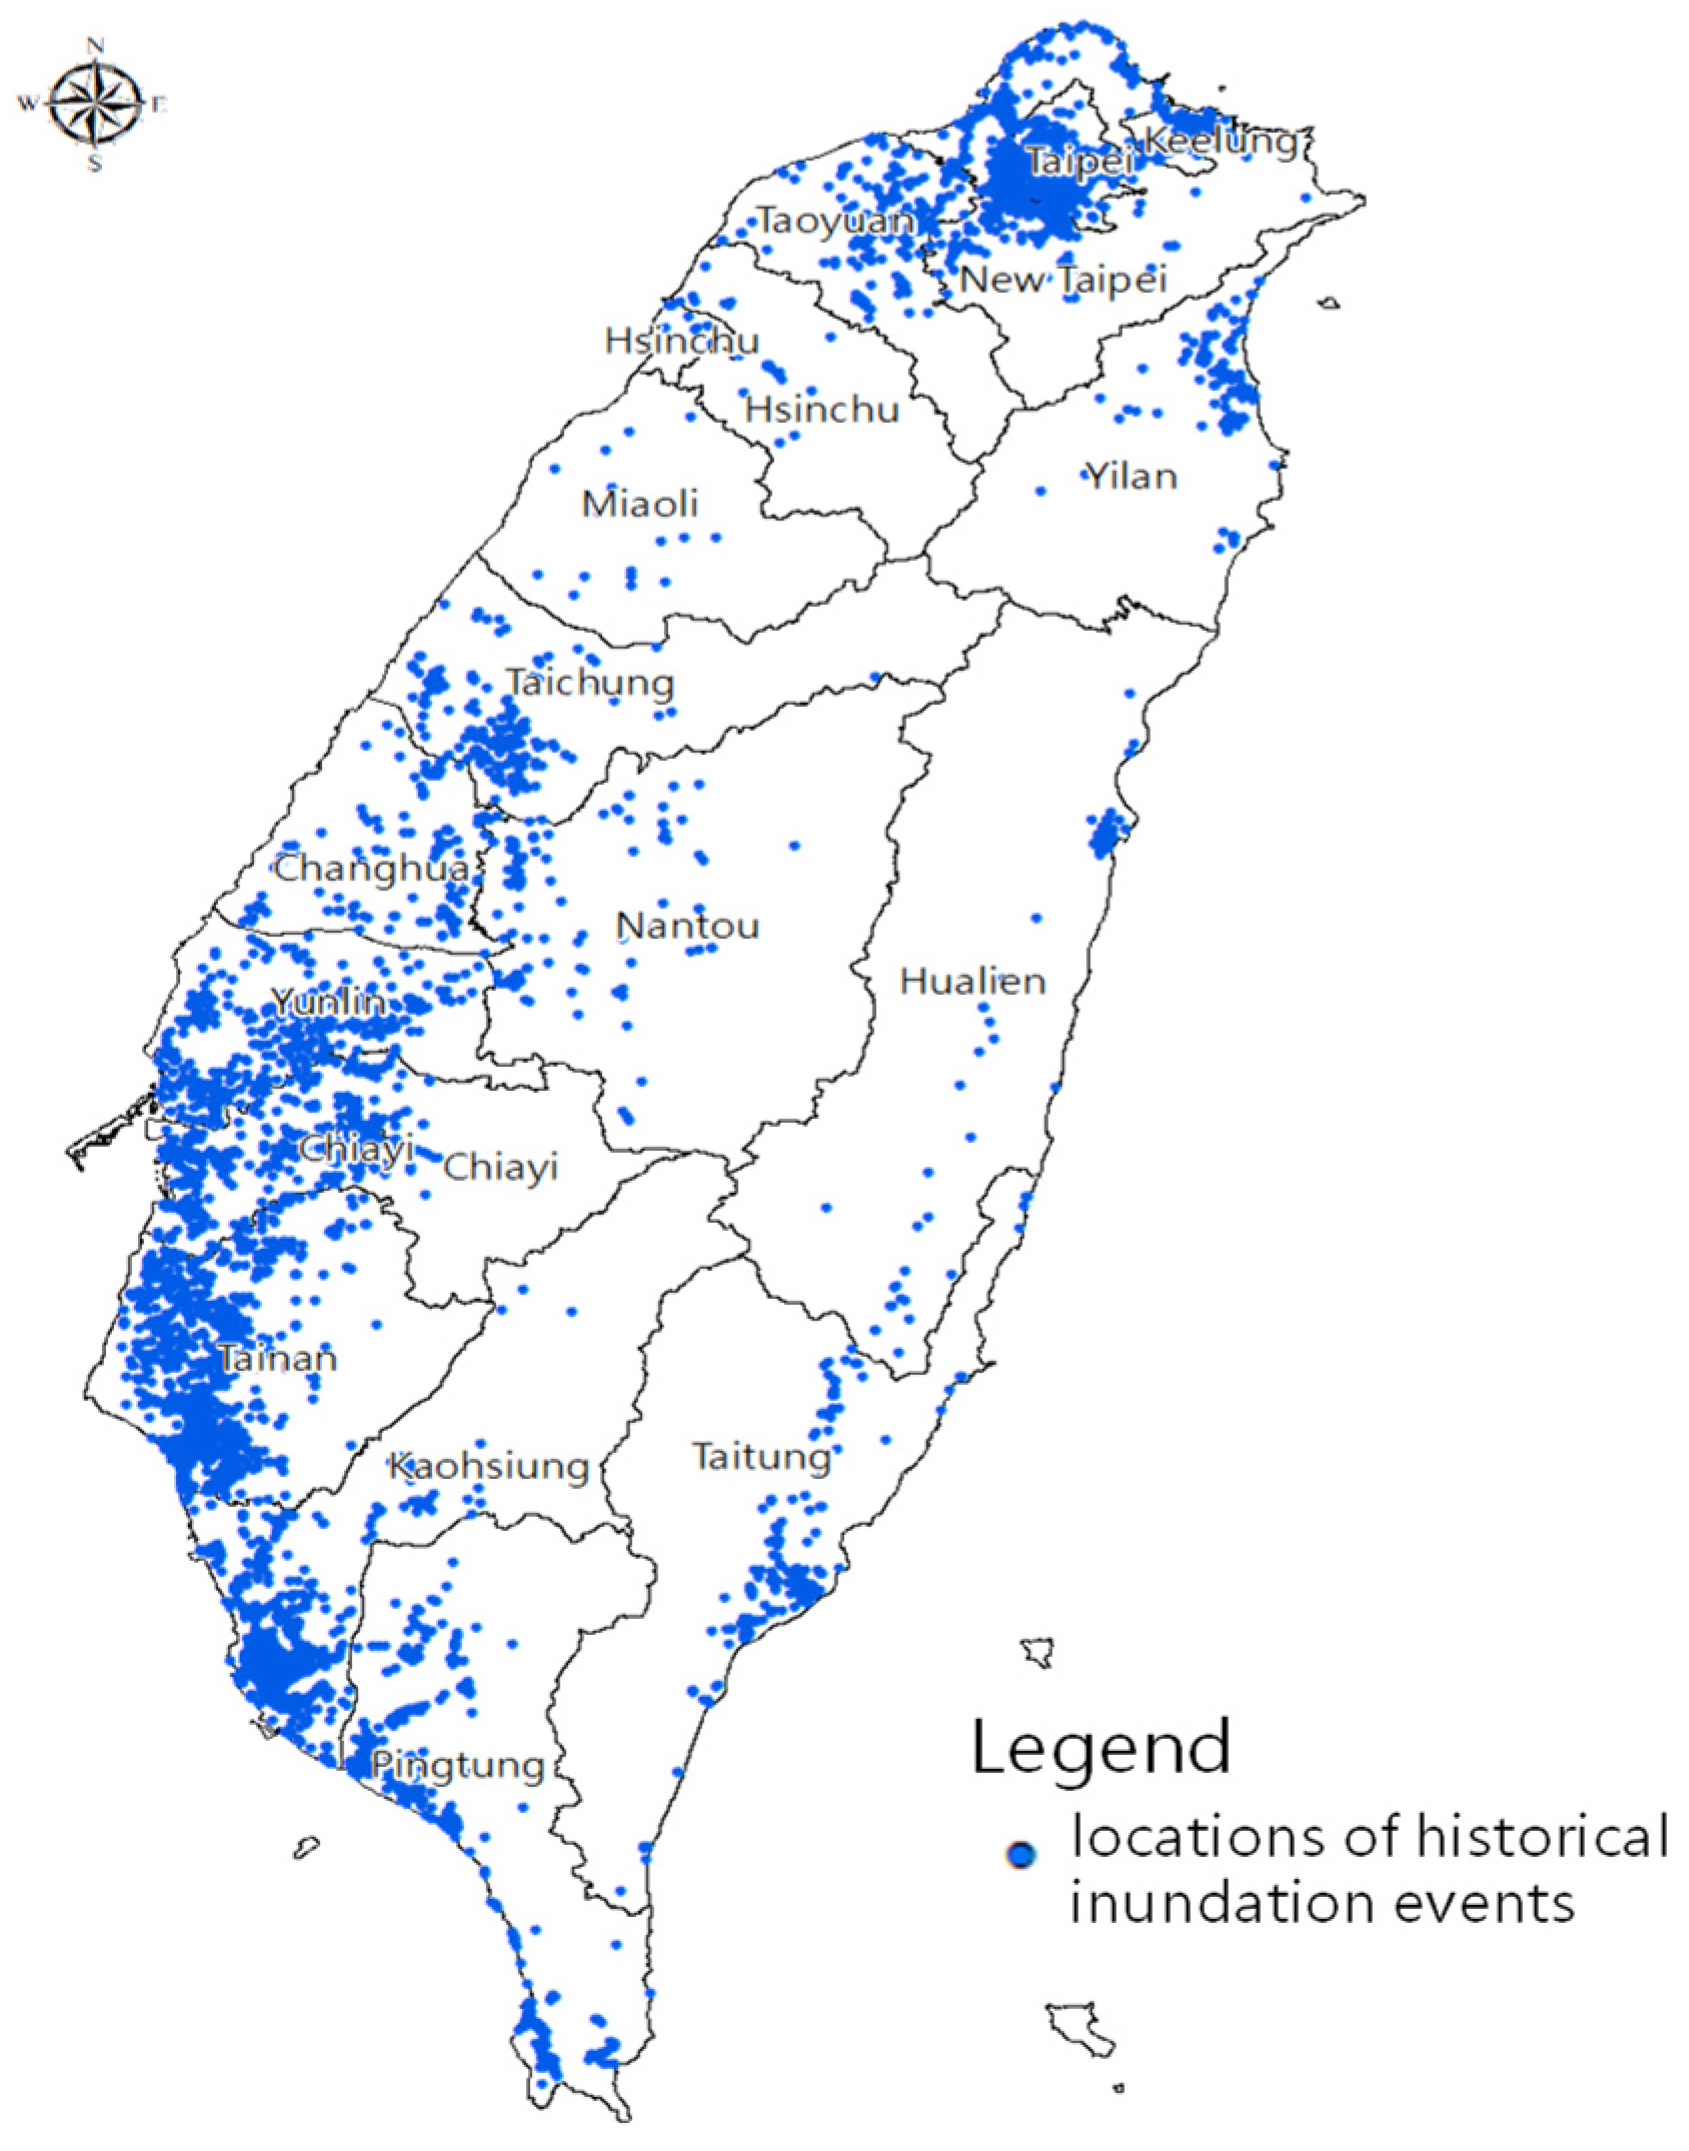
Taiwan is located along the path of typhoons in the West Pacific Ocean, surrounded by the sea. The land area is approximately 36,000 km2 and the population 23 million population. There is higher population density in urban areas in western Taiwan. On average, 3 to 4 typhoons strike Taiwan during June through September each year. An invading typhoon always brings heavy rainfall which often causes serious flooding disasters. Many inundation events occurred in recent decades in western and southern Taiwan [56] as shown in Figure 1. The frequency of extreme rainfall events in Taiwan has increased in recent decades and the frequency of the occurrence of strong typhoons and the intense rainfall associated with typhoon events will also increase under the impact of climate change [57,58,59]. Liu, et al. [57] showed the increase of extreme precipitation events correlated with global temperature increases.
The extreme rainfall under climate change could cause severe natural disasters, e.g., urban flooding, coastal flooding, overtopping, landslides, post-event water scarcity, reservoir siltation, etc. [22,60,61,62,63,64]. The risk of the stream flow rate exceeding the design flood would increase due to increased extreme rainfall under climate change [61]. Hsu, et al. [64] presented the impacts of sea level rise along the mid-western coast of Taiwan under climate change and the adaptations that should be made to improve the flood prevention measures based on the risk map of coastal townships.
Some studies on flood risk assessment utilized GIS, AHP, and hydrological and hydraulic models in a combined way in case studies of small areas in Taiwan [60,61,62,63,64,65,66,67]. Few studies have assessed the impact of climate change, and the characteristics of extreme rainfall with high spatial resolution due to climate change scenarios have not been taken into consideration in flood risk assessments in administrative areas. Moreover, the risk maps were evaluated in specific study areas, such as basin, urban, and coastal township. They could not be used to compare the risk levels of different townships on the nationwide scale.
In order to improve the limitation of flood risk map evaluation which was coarse spatial resolution, inability to simulate in wide areas under climate change, inability to simulate flooding with numerical models, and inability to distinguish indictors for users in previous studies. Therefore, this study provides a framework of flood risk map assessment for inundation townships under the RCP8.5 scenario by using high resolution rainfall data of dynamic downscaling and inundation potential maps to provide users a useful flood risk map on administrative districts scale which could overlay maps in different fields for specific user needs. The detail of study mythology is shown next section.
3. Methodology
The present study proposed a framework for integrating indictors of the flood risk maps and to taking regional extreme rainfall characteristics into account. The baseline period and the late 21st century period were applied to compare the variability of flood risk due to RCP 8.5 scenario. In this study, flood risk was composed of hazard, vulnerability, and exposure indexes based on the above-mentioned definition of disaster risk [19,48] and it emphasized the potential damage caused to natural systems and human society by climate change. Hazards include the factors and degrees of natural variation of disaster events, such as disasters caused by strong rainfall and increased numbers of typhoons; greater hazard indicates higher risk. Vulnerability is defined as the extent and depth of possible inundation under certain rainfall events. Exposure is defined as possible impact populations. The indicator-based method and GIS are used to evaluate flood risk maps based on above-previous researches [24,68,69,70,71], but the AHP method was not included in the indicator assessments. Only three indictors (hazard, vulnerability, and exposure indexes) are assessed and discussed in this study. In order to avoid too many indictors that would make it difficult for decision-makers or interdisciplinary users to plan flood reduction measures based on variability of vulnerability and exposure indictors. Rainfall data which was high resolution after dynamical downscaling was used to assess the probability of occurrences of extreme rainfall, as a hazard indictor in a risk map of inundation townships in Taiwan under RCP8.5 scenario. The flood risk map was shown by the administrative division (township scale) and the H-V map was shown by 5 km grid scales in countrywide.
In engineering and natural sciences, risk is defined as a function of hazard, exposure, and vulnerability [19,72], though the terms are sometimes differently defined by different researchers [13,48,55,73]. This study adopted the aforementioned definition of flood risk and constructed disaster risk maps under a climate change scenario. The flood risk map of this study included hazard, vulnerability and exposure indicators. Equation (1) was used to develop the flood risk indicator, where (i) hazard is extreme rainfall frequency, (ii) vulnerability is the potential inundation area and depth [55], and (iii) exposure is population density.
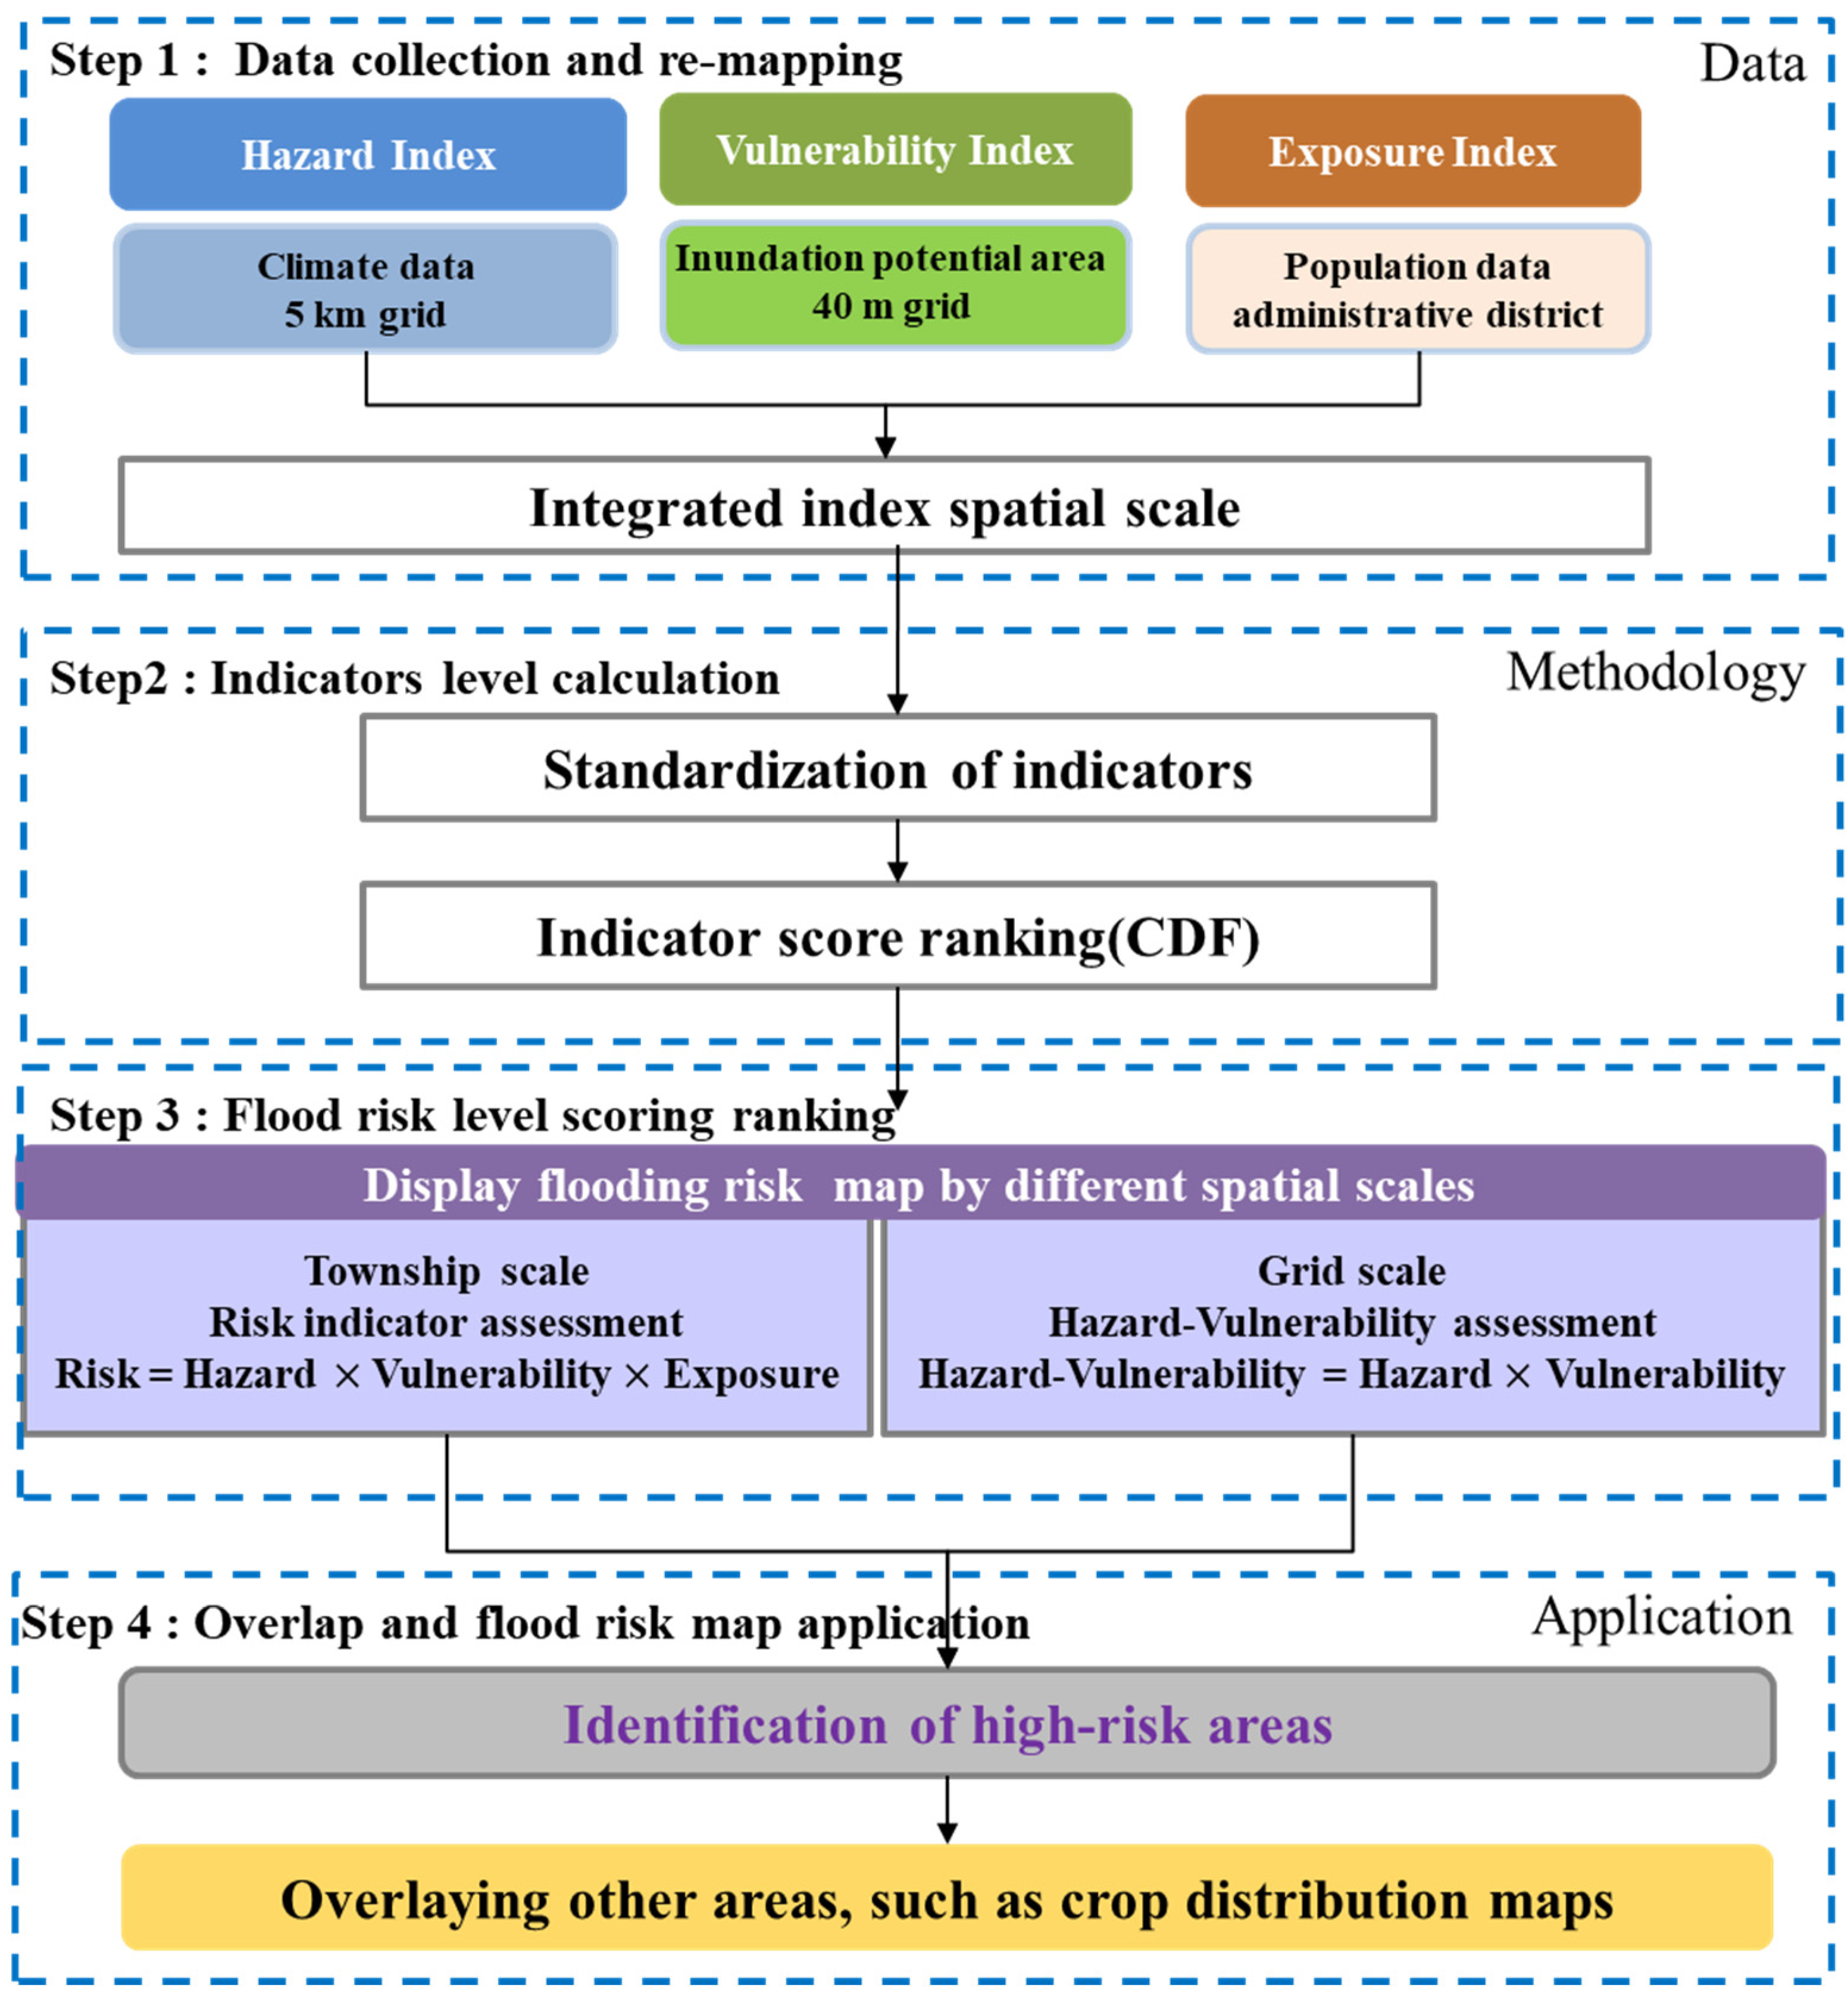
The methodology of flood risk assessment and application of overlay mapping, for simplicity, were divided into four steps. The flowchart in Figure 2 illustrated the research process. The first step was data collection and conversion to GIS for each indicator. All layers of the various data sets, including 5 km grids of climate data, administrative divisions, and 40 m grids, had the same spatial scale inset by GIS. The disaster risk maps under the impact of climate change in this study were compiled on the township and 5 km grid scales, and they can be used to determine the risk of individual townships and spatial units. The second step was the calculation of indicators, which included the standardization of indicators and ranking of the scores of the cumulative probability function (CDF) of each indicator. The third step was the risk level calculation and the display of flood risk maps on different spatial scales. Two kinds of maps for display were developed in this study. One was the township scale. It presented flood risk maps composed from hazard, vulnerability and exposure indicators. The other was the grid scale. This map displayed flood H-V maps composed from hazard and vulnerability alone. The final step was the overlay mapping and application of risk maps from different fields, such as crop distribution maps. Based on the flood risk maps, the spatial distribution of hotspot areas could be recognized clearly by decision-makers and managers. More detailed explanations of each step are provided in the following section.
3.1. Data Collection and Re-Mapping
To calculate the hazard level of changing climate, the hourly precipitation downscaled from the climate projections of the MRI-JMA-AGCM was used [53]. The periods of climate projections used in this study are 1979–2003 for baseline period and 2075–2099 for future with RCP8.5 scenario. Dynamical downscaling was needed to represent the extreme precipitation associated with the complicated topography of Taiwan. The Weather Research and Forecasting (WRF) model of the US National Center for Atmospheric Research (NCAR) with 5 km horizontal resolution was employed to execute dynamical downscaling for Taiwan area [54].
In this study, flood risk maps and H-V maps in two spatial scales, the township scale and the 5 km × 5 km grid scale, considering climate change scenarios were created to suit different user’s needs—such as research, analysis, or territory planning. All data needed for making risk maps were re-mapped into individual grids and townships. The maps using the same 5 km × 5 km grids as the precipitation projection can show the overall spatial distribution of risks.
The townships are units of administrative districts, risks on township maps can be easily identified and implemented for adaptation for local governments. But, there is a disadvantage of spatial generalization in the large area townships, it means the level of hazard and vulnerability indicator will be the same for the entire township.
3.2. Indicators Level Calculation
Hazard is defined as the factors and levels of natural variability of the occurrence of disasters. Some examples of hazards are heavy rainfall, prolonged precipitation, frequent typhoons, and extreme weather conditions. Vulnerability refers to susceptibility to the impact of climate change hazards, whereas exposure refers to the vulnerability of people and things to disasters. The assessment in this study was performed by defining disaster risk indicators. Specifically, this study determined how the indicators should be calculated and then classified the levels. The type of data, the analysis method, and the years of the data used for calculating the indicators are described as follows for each indicator.
3.2.1. Hazard Component
This study considered only the impact of climate change in terms of climate, so it only analyzed the impact of changes in the rainfall characteristics on flood risk. Frequency analysis of precipitation was used to evaluate the occurrence probabilities of 24-h rainfall exceeding 600 mm occurring in the 25-year base and future periods. Fitting the probability distributions of precipitation to the Pearson type III distributions was done in each grid point. The obtained occurrence probabilities (24-h rainfall >600 mm) were classified into different levels to calculate the hazard indicator. Conventional rainfall frequency analysis were implemented as follows. Annual maximum 24-h rainfall series of different grid points were fitted to the Pearson type III distribution (PT3) which was well validated with Goodness-of-Fit tests [74] among observations of 144 rain gauges in Taiwan, by method of moments to estimate parameters of expected value and variance. Considering the correction of the coefficient of skewness (Cs) for small sample size (n), the estimate of Cs would be given by Cs’ [75].
3.2.2. Vulnerability Component
The vulnerability indicator of flood risk maps was developed with reference to the national flood potential maps of Taiwan [55], which were established by the WRA during 2014–2016. Physically based computational model SOBEK developed by Deltares was used to evaluate the potential inundation of all districts in Taiwan. The latest geographic and hydrologic data were collected for development of a flood inundation map, including 1 m~5 m spatial-resolution DEM, river cross section, hydraulic structures, regional drainage channel, urban sewer system, LULC condition, coastal dyke, designed rainfall events and designed tide levels [76]. The values of validating indicators (probability of detection and scale of accuracy) of flood simulations with specific historical typhoon and heavy rainfall events were higher than the standard threshold defined by WRA of Taiwan. Therefore, the inundation potential maps were recommended for application in response and evacuation operations to reduce disaster damage and protect people’s lives and property during typhoon and storm events. The flood potential maps provided possible inundation depths and areas, simulated under certain rainfall scenarios. Flood vulnerability was analyzed using the inundation potential maps of the scenario of a quantitative rainfall volume of 600 mm. The inundation potential map had five levels of flood water depth: from level 1 (0.3–0.5 m) to level 5 (>3 m) (http://103.253.146.123/wra/riskmap-dev/flood, accessed on 30 August 2021). An inundation score was calculated for each township, and these inundation scores were then normalized and classified into one of the five levels for construction of the flood vulnerability maps.
3.2.3. Exposure Component
Exposure refers to people’s susceptibility to disasters. People were defined as all residents who required protection. Considering possible future changes in the structure of the population, this study adopted current demographic data from the Ministry of the Interior [77]. Population density represents the number of subjects who will potentially be impacted by a flood. Population density is calculated as township population/township area (km2). The population at the end of the century was analyzed using the same data as that of the near future. Population densities were divided into levels 1~5, in which level 5 represents the largest population impacted by flooding. Results were generated for the baseline period and the end of the 21st century.
The indicator was population density; a higher population density was considered to entail greater exposure, based on the fact that disasters have greater effects on more densely populated areas. The exposure indicator was mainly indicated by township population density, in which a higher population density indicates a more severe impact when a disaster occurs.
The spatial distributions of the hazard indicator and vulnerability indicator were integrated to determine the H-V maps with 5 km grids. Then the risk maps were determined by the spatial distributions of the hazard indicator, vulnerability indicator and exposure indicator at the township level. Since the three indicators have different units, all factors were indicated as risk indicators, and each indicator was calculated and standardized as the z-score in Equation (3). Then the Cumulative Distribution Function (CDF) was applied to divide the five levels.
where x is the value of the indicator, M is the mean, and SD is the standard deviation. Calculation of the risk map indicators involved dividing the original values of hazard, vulnerability, and exposure into five quantiles, that is, levels 1~5, where a higher level indicated higher hazard and vulnerability based on the CDF. After the levels of the indicators were calculated, the three indicators were multiplied with equal weights to gain the flood risk indicators. The risk values were further divided into five quantiles, with a higher level indicating higher disaster risk.
3.3. Flood Risk Level and Display
For comparison of the impacts of climate change in different periods, risk maps for the two periods (baseline period and the late 21st century are shown together. Since the number of townships impacted by a disaster may vary, a mere ranking of the townships cannot fully depict high-risk areas. This study therefore compared the range of townships affected by different characteristics. For example, there were 270 affected townships in the flood risk map. These 270 townships were divided into five risk levels, while the remaining townships (88 townships) were excluded and are shown in white.
Different spatial scales were created to provide flood risk maps and H-V maps that could be customized to suit users’ needs—whether in research, analysis, or territorial planning. The flood risk map under the impact of climate change in this study was compiled at the township level, and it can be used to determine the risks of individual townships. The 5 km grid was used to display the H-V maps.
3.4. Application of Flood Risk Maps
The flooding H-V maps were compiled based on hazard indicators and vulnerability indicators on the 5 km grid scale. The H-V maps can overlay mapping with different exposure components, such as land use data, crop distribution, and population information. Such overlaying can provide indications of what is exposed to flooding. For example, crop yields could be affected by extreme rainfall and flooding. To prevent this, agricultural decision-makers could plan adjustments to agriculture or improve flood prevention facilities to reduce the impact on crops located in high-level areas of the H-V maps.
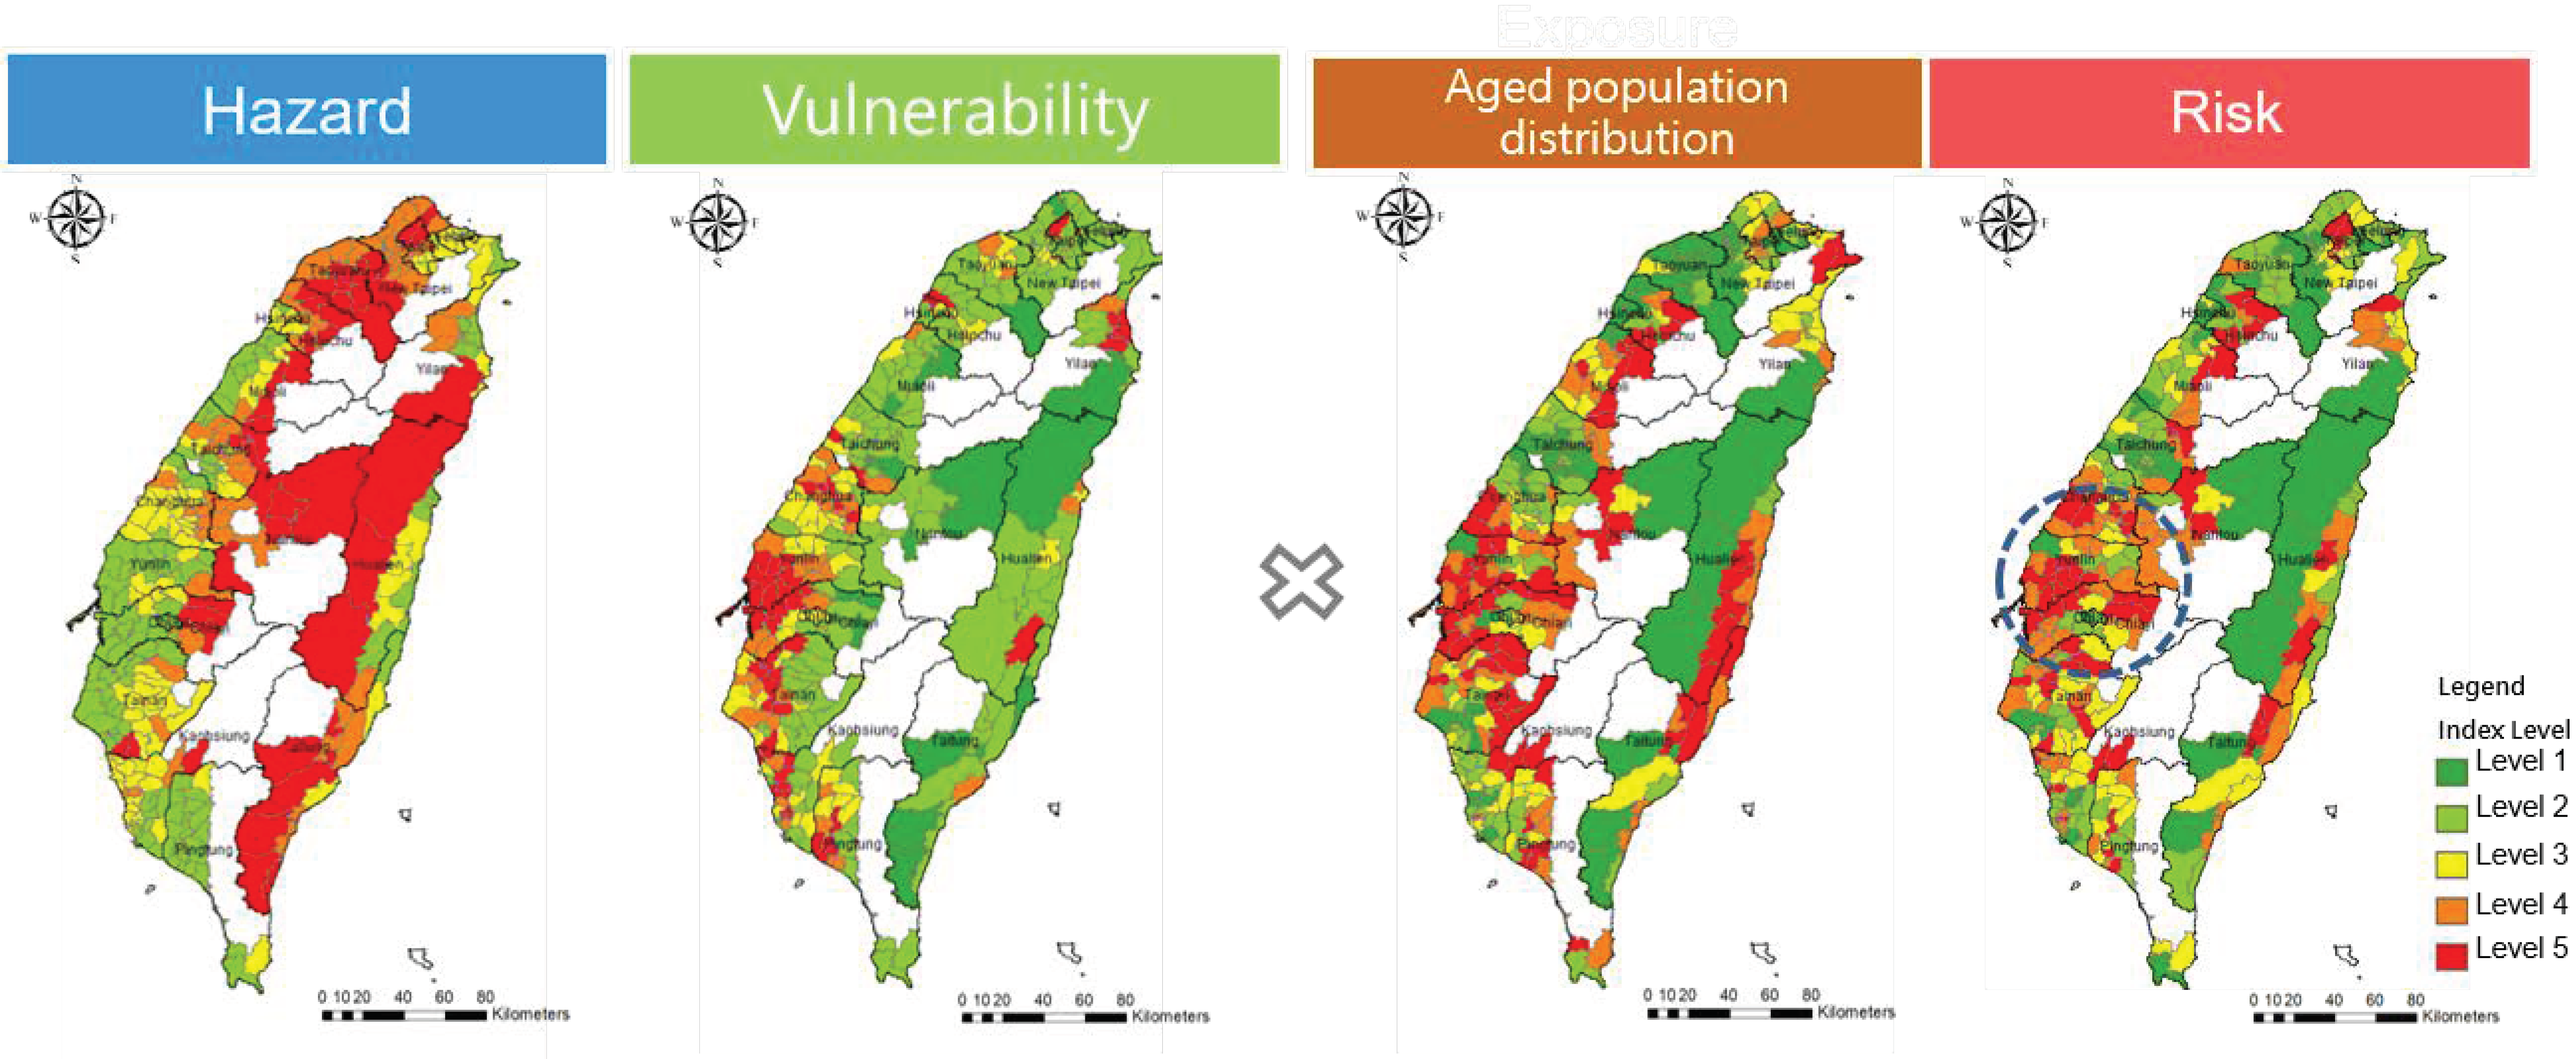
In addition, population density can be used to determine the affected population on the flooding disaster risk map. For this, the elderly population distribution is applied as an exposure indicator for evaluation of the flood risk map on the township scale. Such maps can be used to prepare evacuation plans for high-risk areas.
The distribution of hotspots is based on a comprehensive evaluation of the above-mentioned factors. Hotspot areas on the township scale are at level 5 on the flooding disaster risk scale. Although adaptation indicators are not included, the hotspots should be given priority when implementing adaptation strategies. Adaptation indicators can be added into evaluations of the risk map when suitable indicators are found in the future.
4. Results and Discussion
The results are grouped into two sections. First, we present the flood H-V and risk maps (Section 4.1). The maps show changes in the distribution of disaster hotspots between the baseline and the late 21st century so that decision-makers can evaluate the impacts of climate change and formulate climate change adaptation strategies. The application of the flood risk and H-V maps is presented in Section 4.2.
4.1. Flood Risk Maps on Different Scales
With regard to the impact of extreme rainfall on flood, in this study, the threshold for the hazard indicator of flood was 24-h accumulated rainfall exceeding 600 mm. This threshold is the amount of rainfall that most often causes a flood in Taiwan.
4.1.1. Flood H-V Maps
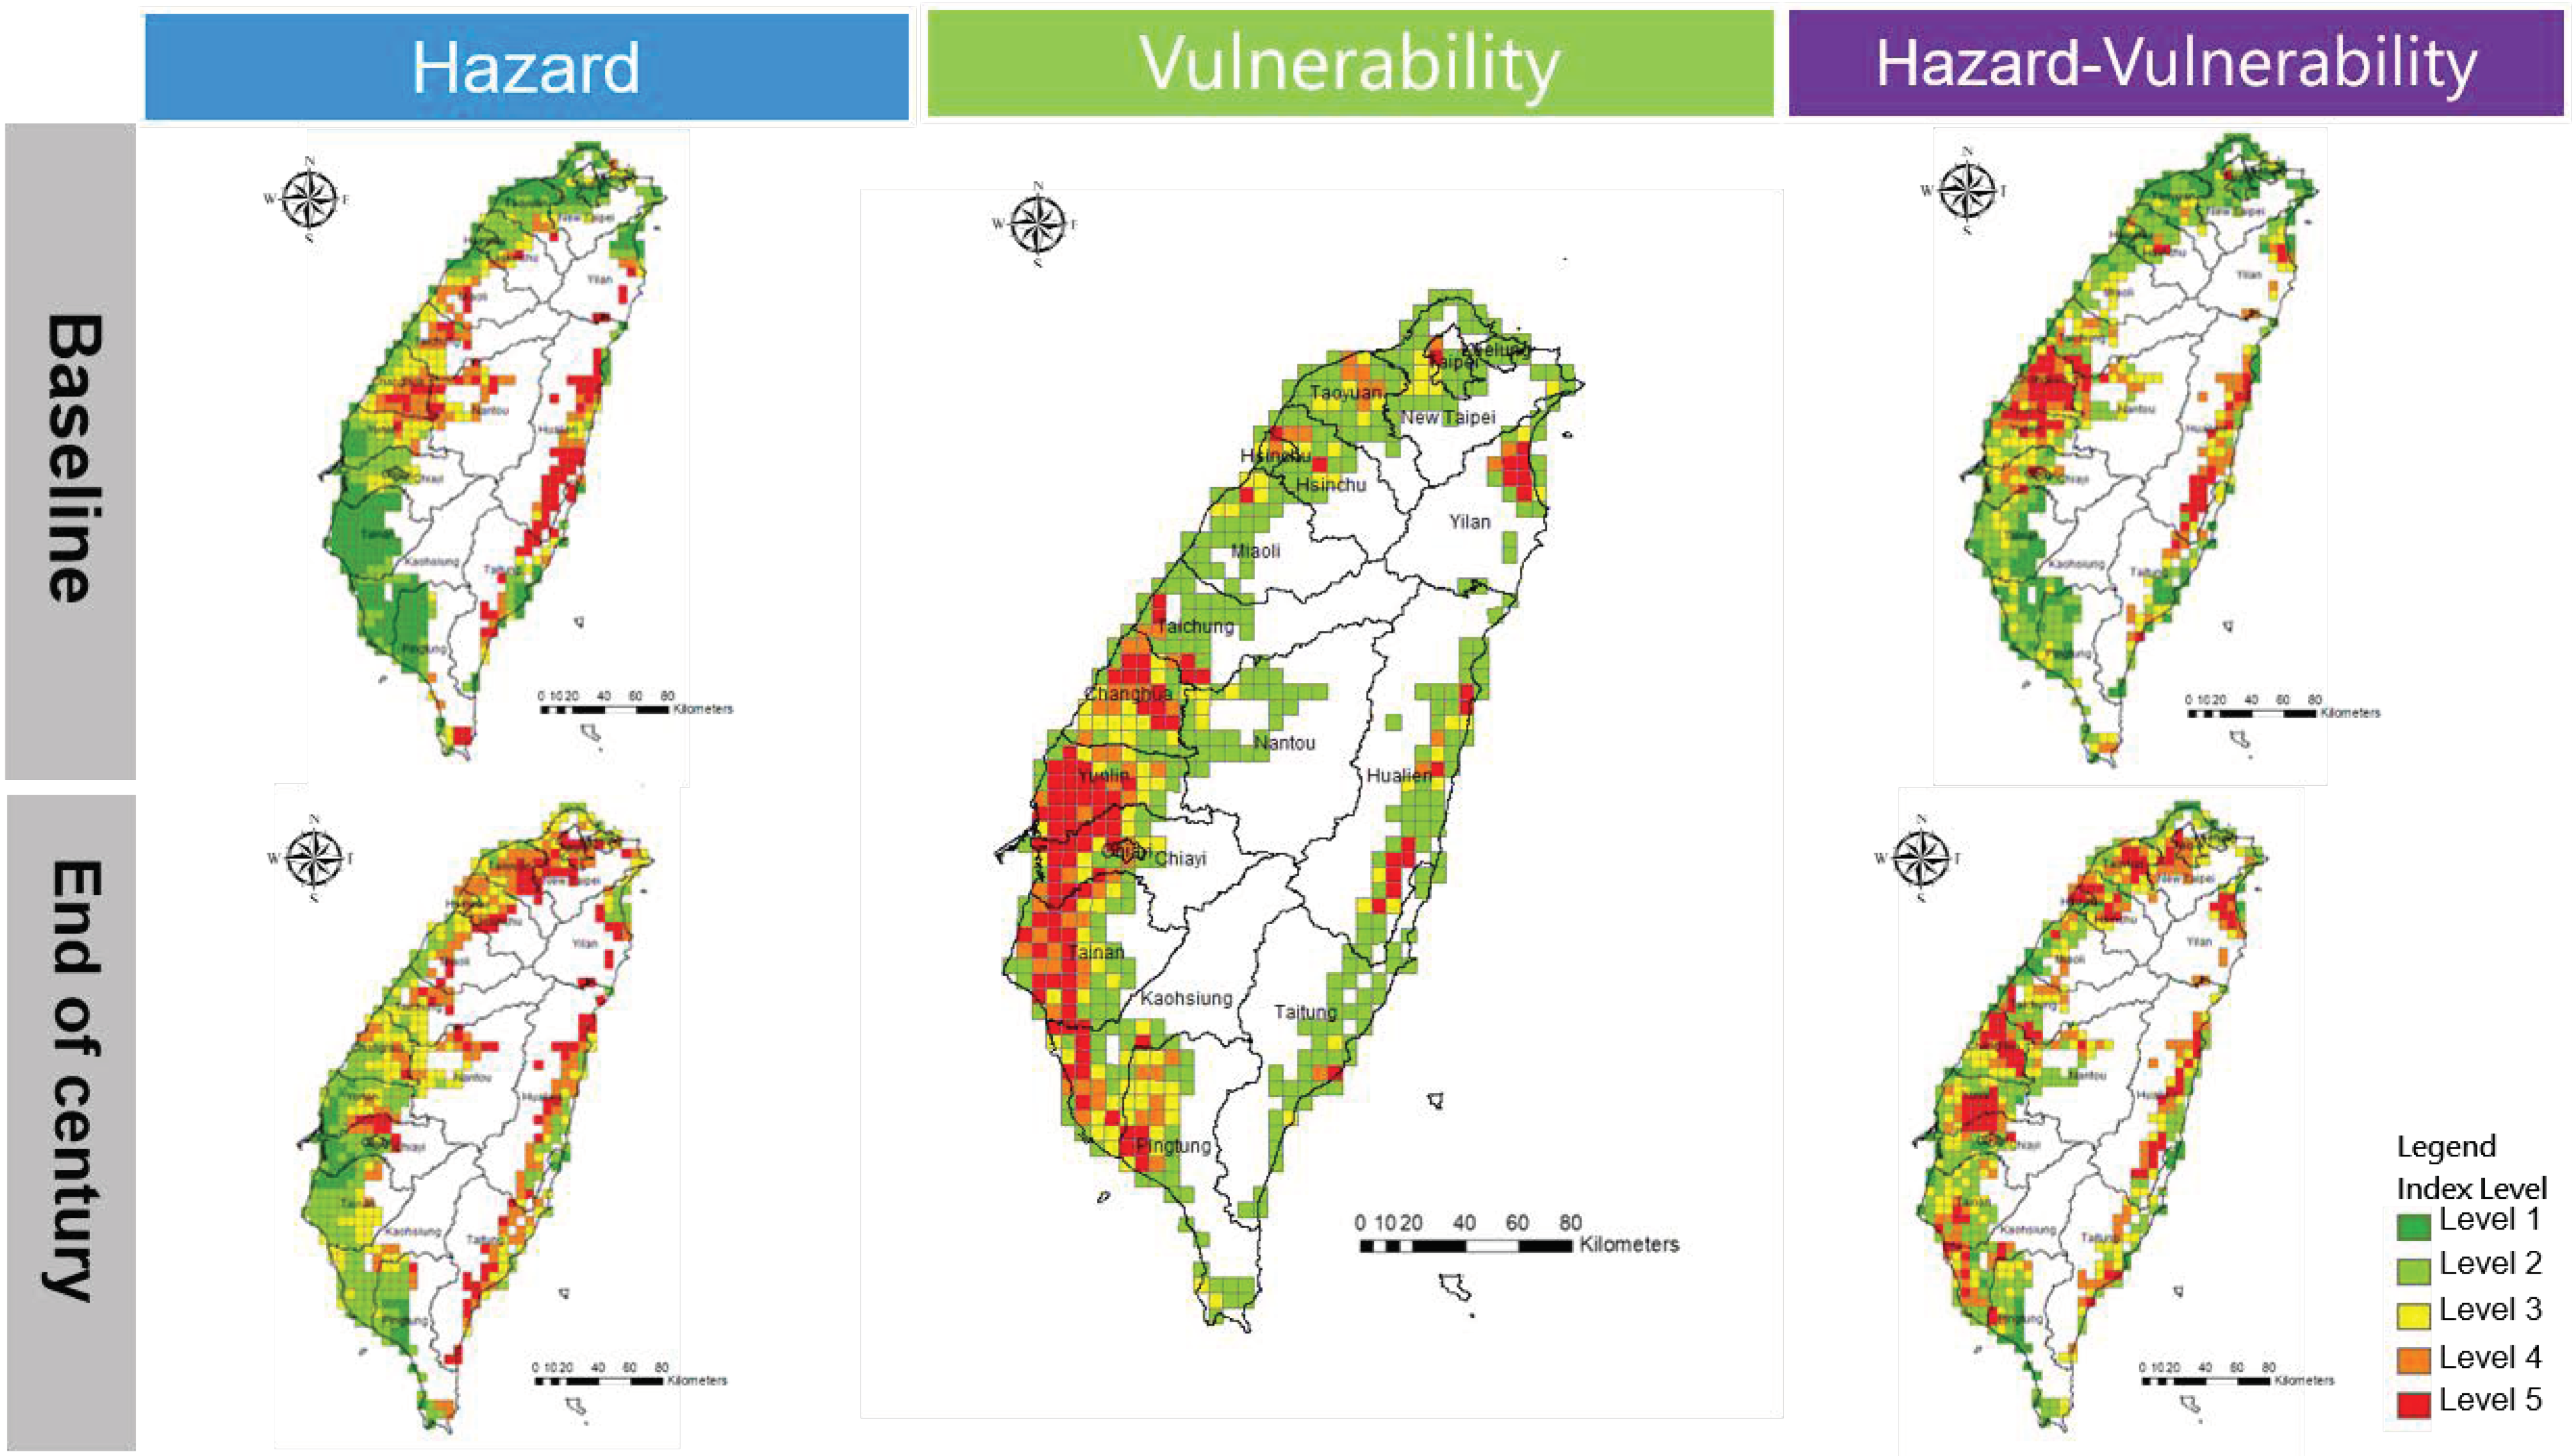
The flood H-V maps within the potential area under the RCP8.5 scenario on the 5 km grid scale are shown in Figure 3. The distribution of hazard indicators shows the probability of the occurrence of extreme rainfall. The hazard indicators were higher in the central and eastern regions of Taiwan during the baseline period (1985–2003). Moreover, the hazard indicators will significantly increase and extend into the northern, north-eastern, and southern regions of Taiwan by the end of the century (2075–2099).
The vulnerability indicator map shows a higher level of flooding vulnerability in the coastal areas of central and southern Taiwan. It was assumed that the future vulnerability is the same as the current vulnerability. Flood hazards and vulnerability on the flood H-V maps are higher in western Taiwan at the end of the century. According to the projection, the flood H-V level will increase for all municipalities. Those with the greatest increases in flood H-V levels will be Keelung City, Taipei City, Hsinchu City and County, Miaoli County, Taichung City, Changhua County, and Pingtung County.
Because the exposure indicator was not considered in Figure 3, the flood H-V map can be overlapped with maps geared toward different purposes—such as land use, industrial use, or agricultural use—to determine whether the land to be used for a given purpose is in a high flood H-V area.
4.1.2. Flood Risk Maps
The flood risk maps of administrative districts are shown on the township scale in Figure 4. The maps on the township scale were distinguished into northern, central, southern, and eastern Taiwan for illustration. Comparison between the baseline and the end of the century indicated higher probabilities of extreme rainfall for coastal townships in eastern Taiwan at the end of the century, while the northern and southern regions of Taiwan will have greater changes in hazard levels.
The vulnerability map allows the comparison of the inundation vulnerability of townships. A greater inundation vulnerability entails a greater possibility of a greater water depth or a greater inundation impact on the township. The near-riparian and coastal townships of central and southern Taiwan have higher vulnerability levels.
The exposure map also shows the population densities of townships. The population is concentrated mostly in the metropolitan areas of the six municipalities (Taipei City, New Taipei City, Taoyuan City, Taichung City, Tainan City, Kaohsiung City) of northern, central and southern Taiwan. Taipei City and Kaohsiung City are the most densely populated urban areas in Taiwan. The central region has a higher flood risk due to high hazards, high vulnerability, and high population density in the baseline period. According to the map, at the end of the century, as the level of hazard increases in the townships of northern and southern Taiwan, the risk level of flooding disasters will increase.
The projection indicates increased flood risk levels for all municipalities. The cities with the greatest increases at the end of the century appear to be Keelung City, Miaoli County, Taichung City, Changhua City, Yunlin County, Chiayi County and City, Tainan City, and Pingtung County. This finding is based primarily on the results showing that (1) the projected model for hazards indicated an increased probability of extreme rainfall, (2) those areas were shown to have high vulnerability, and (3) those areas are the most densely populated.
The administrative districts are easier to apply and manage for decision-makers, but one shortcoming of using townships as the spatial units is spatial generalization (Figure 4). For example, most of land is located in mountainous areas or at higher elevations in the Siulin township of the Hulan county of eastern Taiwan, while the high level of flooding risk is located in low-lying near-riparian areas in the township area (Figure 3 Flood H-V). As a result, the whole township has a high hazard level on the administrative district scale. Risk maps on the township scale can be applied for relative risk identification, but they cannot to be applied directly to land planning. Land planners and decision-makers need detailed analysis of flood risks on the regional scale.
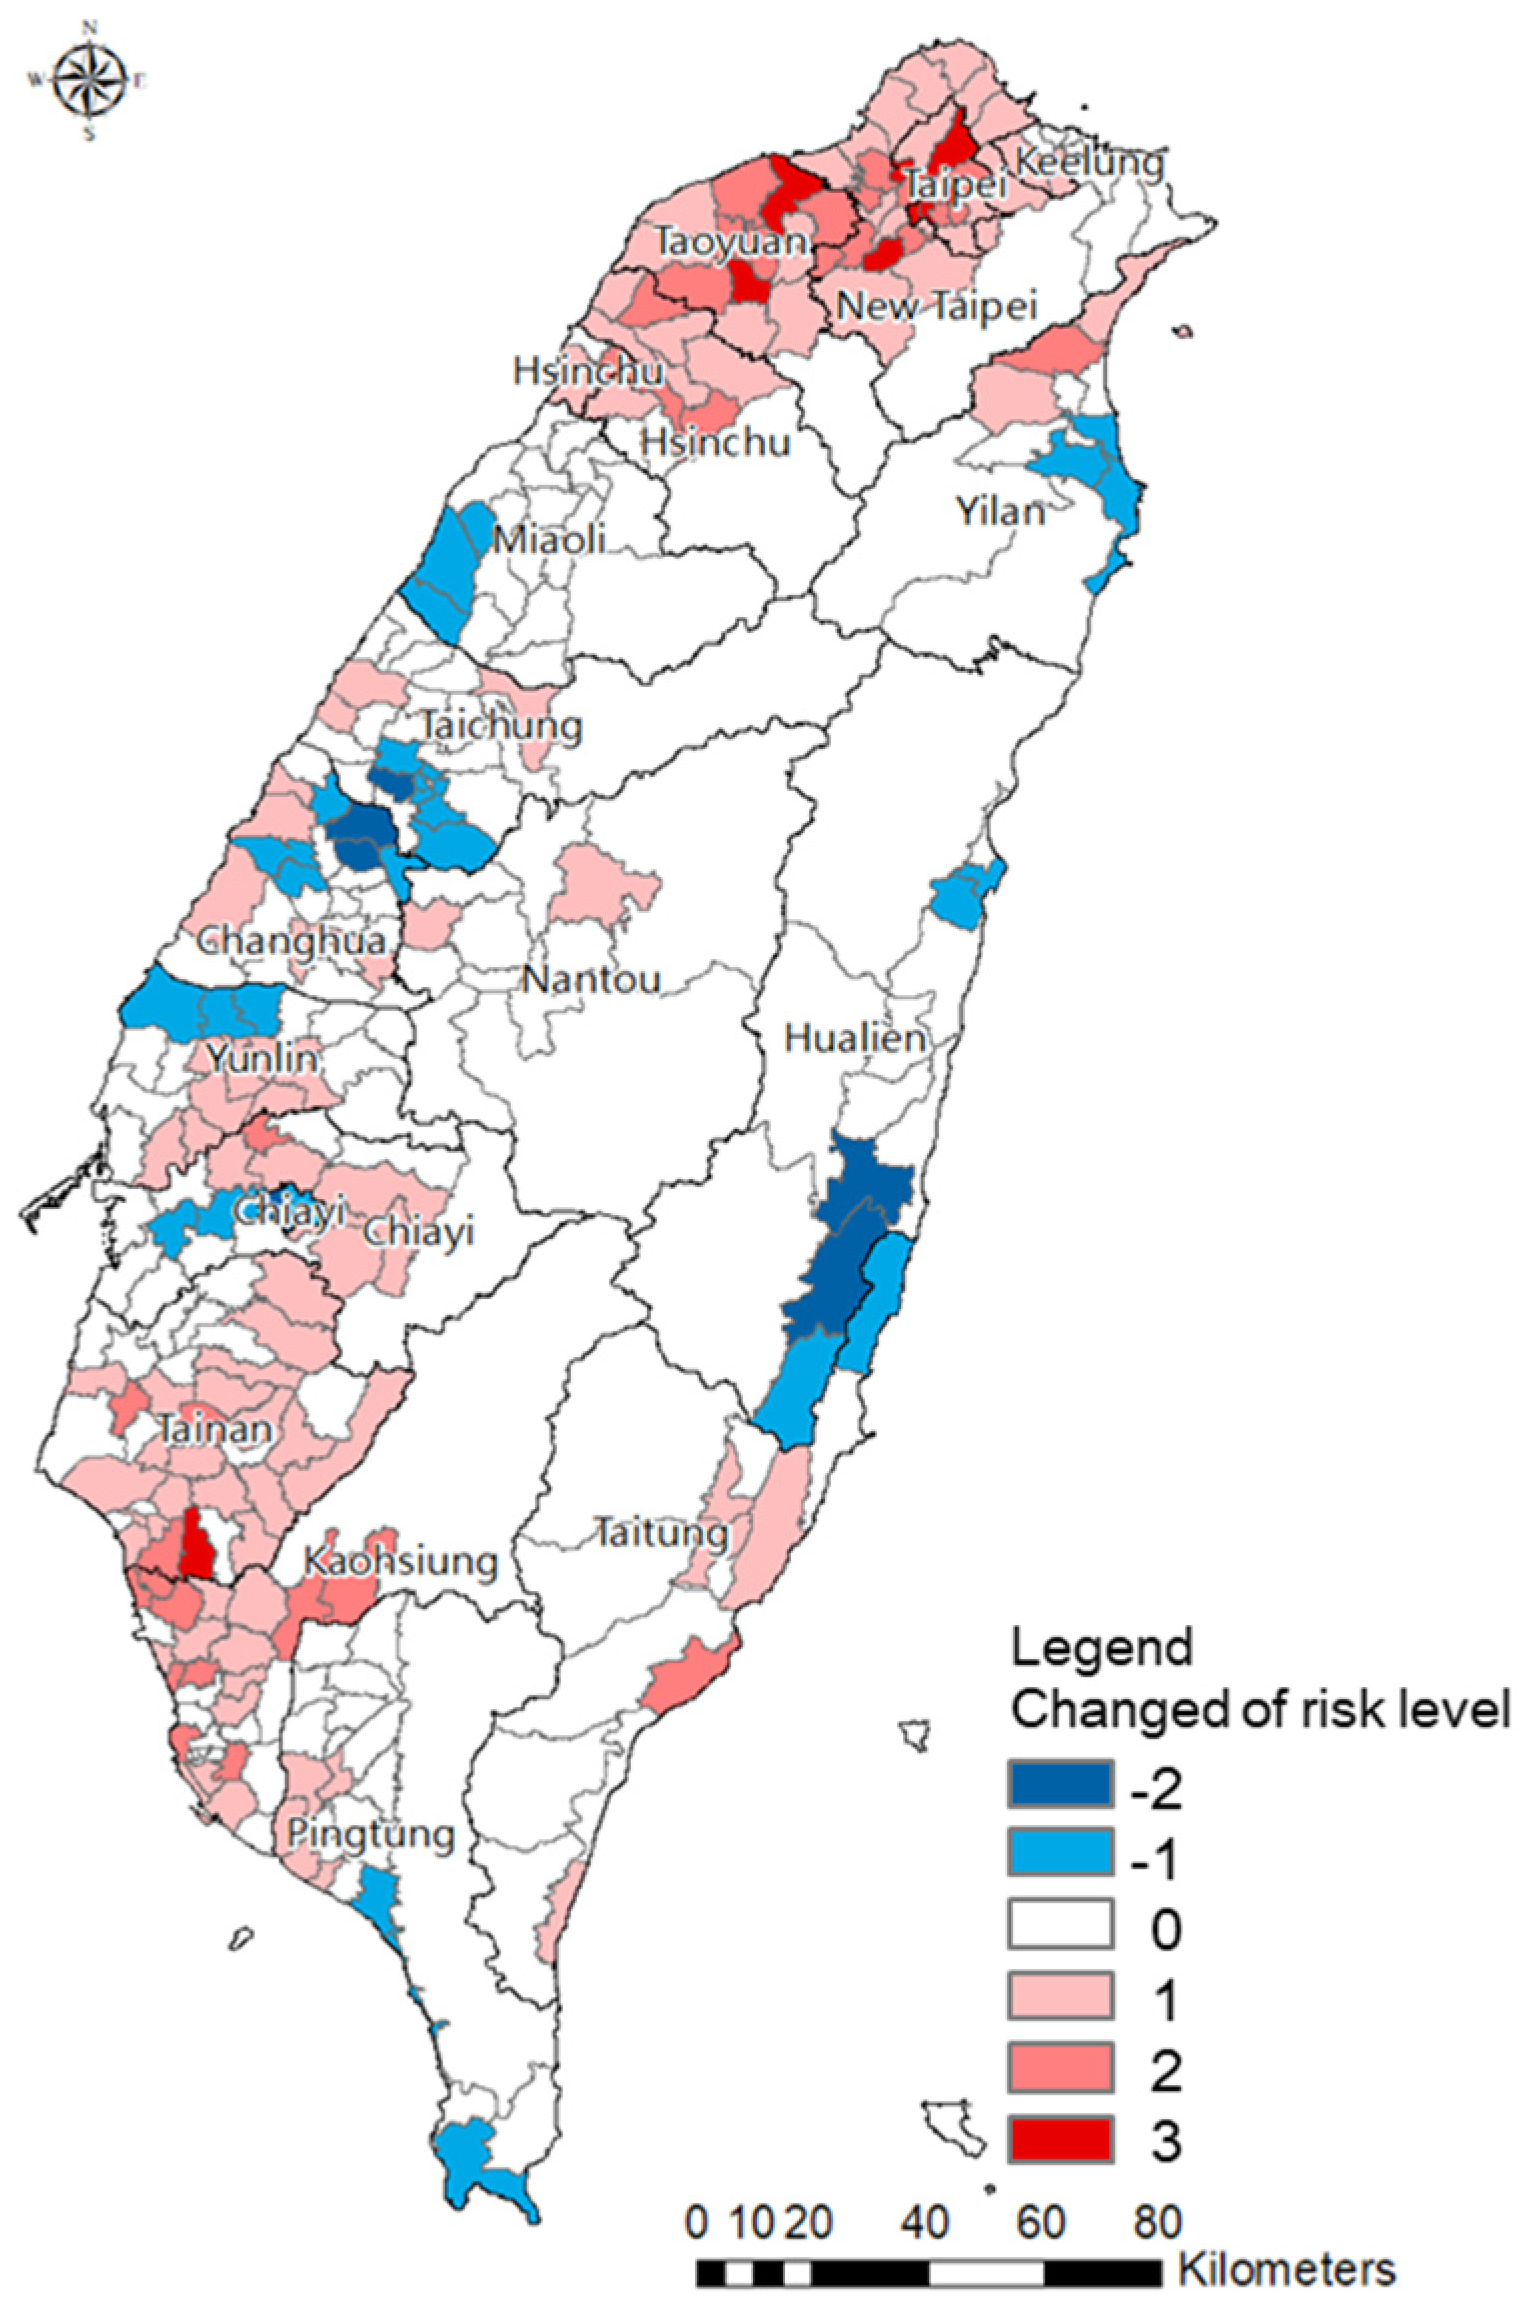
Figure 5 and Table 1 show the changes of the risk level of flooding disasters for each township under RCP8.5 climate change scenario. In Figure 5, the red color area indicates townships where the risk level will increase in the future. There are about 140 townships in Taiwan. The blue color area indicates townships where the risk level will decrease. There are about 36 townships where the risk level will decrease. The white area indicates townships where the risk level will remain unchanged. The flood risk level has increased significantly in townships in northern and southern Taiwan, while some townships in central and eastern Taiwan had decreased risk levels. The hazard (occurrence probability of extreme rainfall events) will lead to increase risk level of flood due to climate change scenarios, especially in townships with are higher vulnerability.
The limitation of this study is that the vulnerability and exposure indictors remain the same in the future, so the changes of the risk level of flooding disasters is mainly affected by variations of the hazard indicator. The changes of future flood risk level were divided into two categories in Table 1. One category is townships where the risk level of flooding disaster is higher, including those with percentile numbers steady at the same higher risk level (approximately 6%) and those that remained the higher risk level (8%). Besides, the decision-makers have to pay attention to the 3% of townships that will become higher risk and the 1% of townships that even will decrease one level of risk but still in higher risk areas. In addition, about 39% townships where is the low risk level in baseline and at the end of century. Decision-makers and land planners will need to assess detailed impacts and then take adaptive measures or priority strategies in higher risk townships.
4.2. Application of Food Disaster Risk Map
The application of the flood risk maps and H-V maps is shown in Figure 6 and Figure 7. Figure 6 presents the risk map on the township scale for the end of this century, and the elderly population distribution is applied as an exposure indicator for preparing evacuation plans in advance for high-risk areas. Changhua, Yunlin and ChiaYi in central and southern Taiwan have both high vulnerability indicators and high proportions of elderly residents, so the flood risk is higher in these areas.
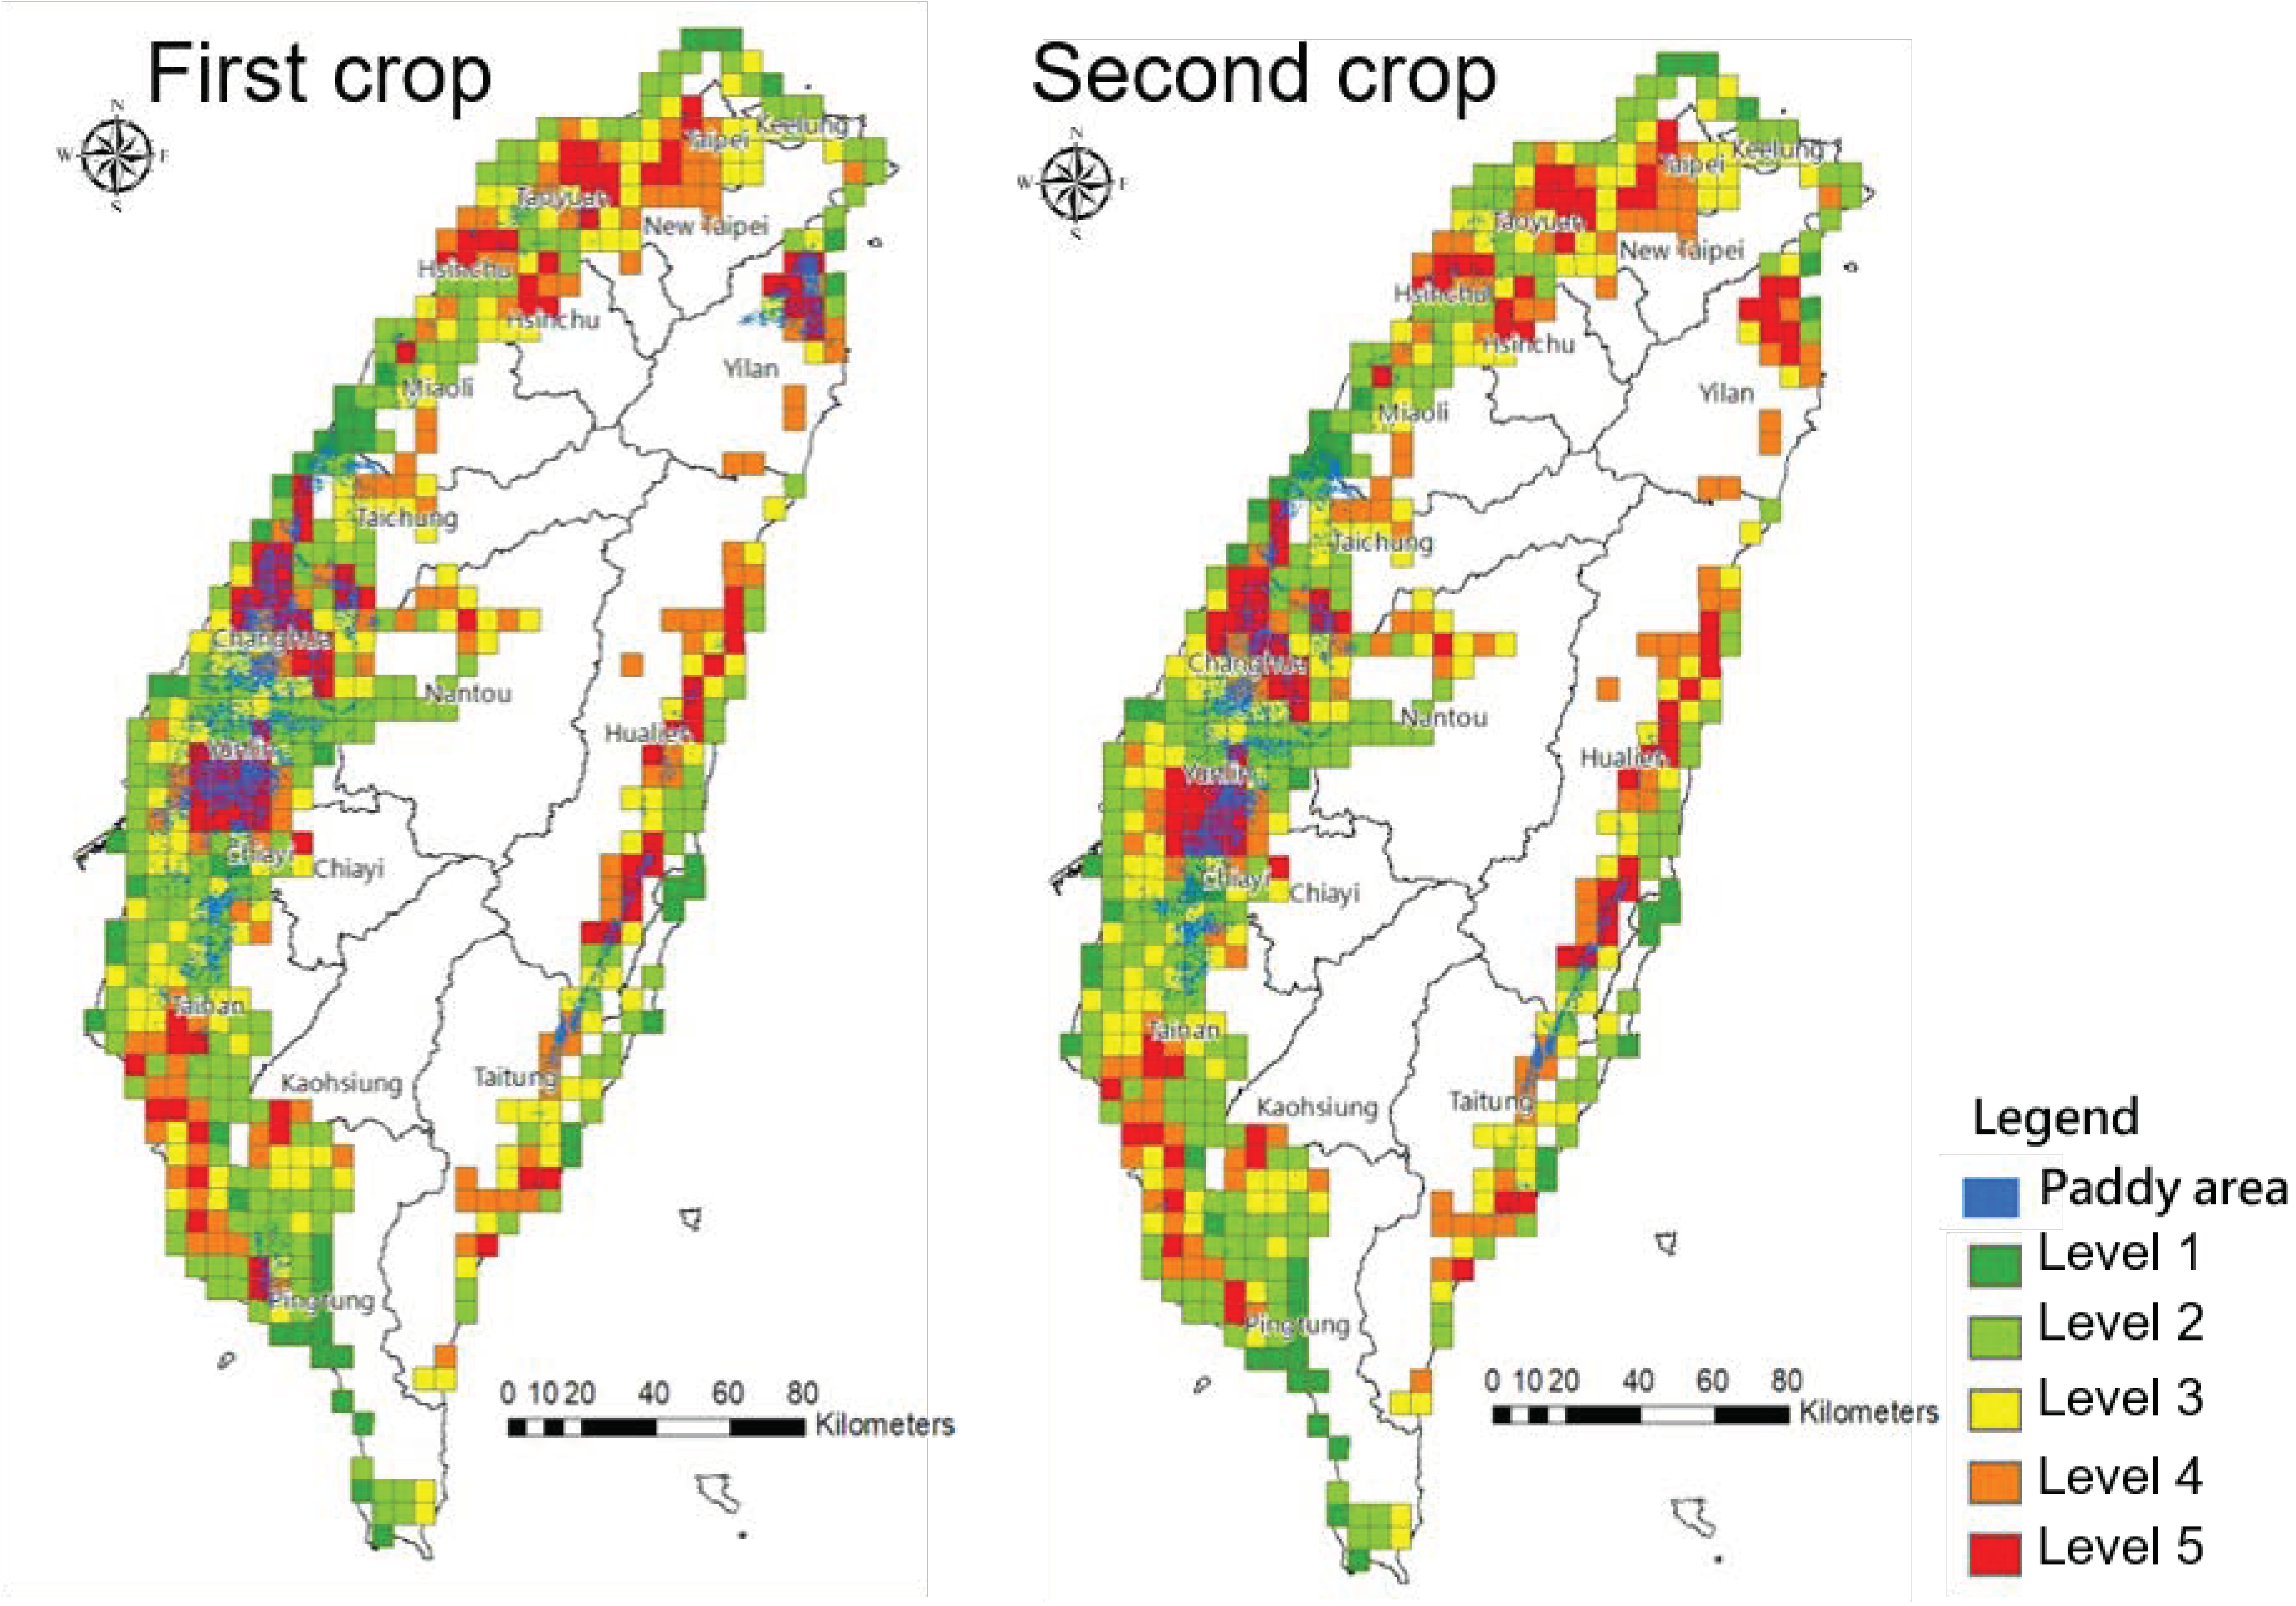
Figure 7 shows the flooding H-V map overlay with the spatial distribution of rice crops in different periods to understand whether rice cultivation areas are located in areas with higher flood risk. With this information, relevant adjustment measures can be planned in advance to cope with future flooding caused by extreme rainfall due to climate change. Rice cultivation is mainly concentrated in central and southern Taiwan, and the second and first crops are mainly in the Yilan region of eastern Taiwan.
5. Conclusions and Recommendations
The present study establishes a framework for flood risk map assessment under the RCP8.5 scenario by using different spatial scales to integrate the projection climate data of high resolution, inundation potential maps, and the indicator-based method. In order to improve the limitation of evaluation of flood risk map in Taiwan, including (i) coarse spatial resolution and the inability to capture the characteristics of local extreme rainfall, (ii) inability to simulate the flooding process of wide areas with numerous extreme rainfall events under climate change, (iii) the deficiencies of the indicator-based method owing to its inability to simulate flooding with numerical models, and (iv) users unclearly distinguish those indictors which cause high risks.
The three indicators of flood risk map were based on risk concept of the IPCC. The risk maps of administrative districts on the country scale can help decision-makers and national land use planners to understand the variety of flood risk due to climate change simply, clearly and easily. The Hazard-Vulnerability (H-V) map can be applied to overlay mapping on different scales to further solve the problem that interdisciplinary users are unable to distinguish variability of hazard, vulnerability, and exposure indicator in flood risk maps under climate change.
The study found that the flood risk levels with the greatest severity are in the coastal townships of Changhua, Yunlin, Chiayi, and Tainan. These areas will require early planning of flood countermeasures as well as flood prevention strategies, to reduce the flood risk. Approximately 14% of townships are at the higher risk level for flood while 3% of townships will become higher risk under climate change.
According to the driving force indicator (hazard indicator), central and eastern Taiwan were identified as areas with high hazard–vulnerability levels in the baseline period. In the GCM projection, however, the areas with high H-V at the end of the century will be central and southern Taiwan. The H-V map can be overlaid with maps geared for different purposes—including land use, industrial use, or agricultural use—to determine whether the land to be used for a given purpose is in a high H-V area.
Flood risk and H-V maps with relatively higher risk areas can help decision- makers, citizens, and stakeholders effectively communicate and prioritize measures for adapting to climate change. For high-risk locations, the priorities can be to reduce vulnerability and exposure and implement improvements in flood prevention, such as the upgrading and maintenance of flood infrastructure, or even non-structural flood mitigation, land use planning controls, and early warning systems.
In future studies, the daily climate data of multi-model statistical downscaling under different climate change scenarios, e. g. RCP2.6, RCP4.5 and RCP6.0 could be used to estimate the probability of occurrence of hazards. Multi-GCM can reduce the uncertainty by employing a single-GCM (MRI-JMA-AGCM). More studies will be required to assess the uncertainties of spatial resolution and the projection of climate data, as well as provide flood risk maps of higher spatial resolution and adaptation indicators to help policy-makers to evaluate urban planning and development in future work.
Author Contributions
Conceptualization, Y.-M.C. and Y.-J.C.; methodology, validation and formal analysis, H.-J.L. and J.-J.L.; investigation and data curation, H.-J.L. and C.-T.C.; writing—original draft preparation, Y.-J.C., writing—review and editing, Y.-J.C., J.-J.L. and C.-T.C.; supervision, Y.-M.C. All authors have read and agreed to the published version of the manuscript.
Funding
This research received no external funding.
Institutional Review Board Statement
Not applicable.
Informed Consent Statement
Not applicable.
Data Availability Statement
Publicly available datasets were analyzed in the present study. The data can be found here: http://103.253.146.123/wra/riskmap-dev/flood/ (accessed on 23 November 2021).
Acknowledgments
We are grateful to the TCCIP (Taiwan Climate Change Projection and Information Platform Project) for providing the climate variable gridded data under climate change scenarios.
Conflicts of Interest
The authors declare no conflict of interest.
References
- Westra, S.; Alexander, L.V.; Zwiers, F.W. Global increasing trends in annual maximum daily precipitation. J. Clim. 2013, 26, 3904–3918. [Google Scholar] [CrossRef] [Green Version]
- Asadieh, B.; Krakauer, N. Global trends in extreme precipitation: Climate models versus observations. Hydrol. Earth Syst. Sci. 2015, 19, 877–891. [Google Scholar] [CrossRef] [Green Version]
- Wasko, C.; Sharma, A. Global assessment of flood and storm extremes with increased temperatures. Sci. Rep. 2017, 7, 7945. [Google Scholar] [CrossRef] [PubMed]
- Sezen, C.; Šraj, M.; Medved, A.; Bezak, N. Investigation of rain-on-snow floods under climate change. Appl. Sci. 2020, 10, 1242. [Google Scholar] [CrossRef] [Green Version]
- Grip, I.L.; Haghighatafshar, S.; Aspegren, H. A methodology for the assessment of compound sea level and rainfall impact on urban drainage networks in a coastal city under climate change. City Environ. Interact. 2021, 12, 100074. [Google Scholar] [CrossRef]
- Zisopoulou, K.; Panagoulia, D. An In-Depth Analysis of Physical Blue and Green Water Scarcity in Agriculture in Terms of Causes and Events and Perceived Amenability to Economic Interpretation. Water 2021, 13, 1693. [Google Scholar] [CrossRef]
- Efthimiou, N.; Likoudi, E.; Panagoulia, D.; Karavitis, C. Assessment of soil susceptibility to erosion using the EPM and RUSLE models: The case of Venetikos river catchment. Glob. NEST J. 2016, 18, 164–179. [Google Scholar] [CrossRef]
- Hamed, Z.S.; Abudu, S.; Alizadeh, R.; Soltanisehat, L.; Dilekli, N.; King, J.P. Integration of time series forecasting in a dynamic decision support system for multiple reservoir management to conserve water sources. Energy Sources Part A Recovery Util. Environ. Eff. 2018, 40, 1398–1416. [Google Scholar] [CrossRef]
- Acreman, M.; Sinclair, C. Classification of drainage basins according to their physical characteristics; and application for flood frequency analysis in Scotland. J. Hydrol. 1986, 84, 365–380. [Google Scholar] [CrossRef]
- Veijalainen, H.; Lotsari, E.; Alho, P.; Vehviläinen, B.; Käyhkö, J. National scale assessment of climate change impacts on flooding in Finland. J. Hydrol. 2010, 391, 333–350. [Google Scholar] [CrossRef]
- Yan, D.; Werners, S.E.; Ludwig, F.; Huang, H.Q. Hydrological response to climate change: The Pearl River, China under different RCP scenarios. J. Hydrol. 2015, 4, 228–245. [Google Scholar] [CrossRef] [Green Version]
- IPCC. The Fifth Assessment Report of the Intergovernmental Panel on Climate Change; IPCC: Geneva, Switzerland, 2014. [Google Scholar]
- Saldarriaga, J.; Salcedo, C.; Solarte, L.; Pulgarín, L.; Rivera, M.L.; Camacho, M.; Iglesias-Rey, P.L.; Martínez-Solano, F.J.; Cunha, M. Reducing Flood Risk in Changing Environments: Optimal Location and Sizing of Stormwater Tanks Considering Climate Change. Water 2020, 12, 2491. [Google Scholar] [CrossRef]
- Van Kempen, G.; van der Wiel, K.; Melsen, L.A. The impact of hydrological model structure on the simulation of extreme runoff events. Nat. Hazards Earth Syst. Sci. 2021, 21, 961–976. [Google Scholar] [CrossRef]
- Clifton, C.F.; Day, K.T.; Luce, C.H.; Grant, G.E.; Safeeq, M. Effects of climate change on hydrology and water resources in the Blue Mountains, Oregon, USA. Clim. Serv. 2018, 10, 9–19. [Google Scholar] [CrossRef]
- Hallegatte, S.; Green, C.; Nicholls, R.J.; Corfee-Morlot, J. Future flood losses in major coastal cities. Nat. Clim. Chang. 2013, 3, 802–806. [Google Scholar] [CrossRef]
- Jongman, B.; Ward, P.J.; Jeroen, C.J.H.A.J. Global exposure to river and coastal flooding: Long term trends and changes. Glob. Environ. Change Hum. Policy Dimens. 2012, 22, 823–835. [Google Scholar] [CrossRef]
- Alizadeh, R.; Lund, P.D.; Beynaghi, A.; Abolghasemi, M.; Maknoon, R. An integrated scenario-based robust planning approach for foresight and strategic management with application to energy industry. Technol. Forecast. Soc. Change 2016, 104, 162–171. [Google Scholar] [CrossRef]
- United Nations International Strategy for Disaster Reduction (UNISDR). GAR 2013—Global Assessment Report on Disaster Risk Reduction. From Share Risk to Shared Value: The Business Case for Disaster Risk Reduction; UNISDR: Geneva, Switzerland, 2013. [Google Scholar]
- Matheswaran, K.; Alahacoon, N.; Pandey, R.; Giriraj, A. Flood risk assessment in South Asia to prioritize flood index insurance applications in Bihar, India. Geomat. Nat. Hazards Risk 2019, 10, 26–48. [Google Scholar] [CrossRef] [Green Version]
- Gain, A.K.; Mojtahed, V.; Biscaro, C.; Balbi, S.; Giupponi, C. An integrated approach of flood risk assessment in the eastern part of dhaka city. Nat. Hazard 2015, 79, 1499–1530. [Google Scholar] [CrossRef] [Green Version]
- Liu, W.C.; Hsieh, T.H.; Liu, H.M. Flood Risk Assessment in Urban Areas of Southern Taiwan. Sustainability 2021, 13, 3180. [Google Scholar] [CrossRef]
- De Moel, H.; Jongman, B.; Kreibich, H.; Merz, B.; Penning-Rowsell, E.; Ward, P.J. Flood risk assessments at different spatial scales. Mitig. Adapt. Strateg. Glob. Change 2015, 20, 865–890. [Google Scholar] [CrossRef] [PubMed] [Green Version]
- Hadipour, V.; Vafaie, F.; Deilami, K. Coastal Flooding Risk Assessment Using a GIS-Based Spatial Multi-Criteria Decision Analysis Approach. Water 2020, 12, 2379. [Google Scholar] [CrossRef]
- Cai, S.; Fan, J.; Yang, W. Flooding Risk Assessment and Analysis Based on GIS and the TFN-AHP Method: A Case Study of Chongqing, China. Atmosphere 2021, 12, 623. [Google Scholar] [CrossRef]
- Yildirim, E.; Demir, I. An Integrated Flood Risk Assessment and Mitigation Framework: A Case Study for Middle Cedar River Basin, Iowa, USA. Int. J. Disaster Risk Reduct. 2021, 56, 102113. [Google Scholar] [CrossRef]
- Hirabayashi, Y.; Mahendran, R.; Koirala, S.; Konoshima, L.; Yamazaki, D.; Watanabe, S.; Kim, H.; Kanae, S. Global flood risk under climate change. Nat. Clim. Change 2013, 3, 816. [Google Scholar] [CrossRef]
- De Moel, H.; Aerts, J.C.J.H.; Koomen, E. Development of flood exposure in the Netherlands during the 20th and 21th century. Glob. Environ. Change 2011, 21, 620–627. [Google Scholar] [CrossRef]
- Mani, P.; Chatterjee, C.; Kumar, R. Flood hazard assessment with multiparameter approach derived from coupled 1D and 2D hydrodynamic flow model. Nat. Hazards 2014, 70, 1553–1574. [Google Scholar] [CrossRef]
- Bathrellos, G.D.; Karymbalis, E.; Skilodimou, H.D.; Gaki-Papanastassiou, K.; Baltas, E.A. Urban flood hazard assessment in the basin of Athens Metropolitan city, Greece. Environ. Earth Sci. 2016, 75, 319. [Google Scholar] [CrossRef]
- Garrote, J.; Diez-Herrero, A.; Escudero, C.; Garcia, I. A framework proposal for regional-scale flood-risk assessment of cultural heritage sites and application to the Castile and Leon Region (Central Spain). Water 2020, 12, 329. [Google Scholar] [CrossRef] [Green Version]
- Grezo, H.; Mocko, M.; Izsoff, M.; Vrbicanova, G.; Petrovic, F.; Stranak, J.; Muchova, Z.; Slamova, M.; Olah, B.; Machar, I. Flood risk assessment for the long-term strategic planning considering the placement of industrial parks in Slovakia. Sustainability 2020, 12, 4144. [Google Scholar] [CrossRef]
- Marco, J.B. Flood risk Mapping; Rossi, G., Harmancioğl, N., Yevjevic, V., Eds.; Springer: Dordrecht, The Netherlands, 1994. [Google Scholar] [CrossRef]
- Merz, B.; Thieken, A.; Gocht, M. Flood risk mapping at the local scale: Concepts and challenges. In Advances in Natural and Technological Hazards Research; Springer: Dordrecht, The Netherlands, 2007. [Google Scholar] [CrossRef]
- Müller, A.; Reiter, J.; Weiland, U. Assessment of urban vulnerability towards floods using an indicator-based approach—A case study for Santiago de Chile. Nat Hazards Earth Syst Sci. 2011, 11, 2107–2123. [Google Scholar] [CrossRef] [Green Version]
- Kappes, M.S.; Papathoma-Köhle, M.; Keiler, M. Assessing physical vulnerability for multi-hazards using an indicator-based methodology. Appl Geogr. 2012, 32, 577–590. [Google Scholar] [CrossRef]
- Ghanbarpour, M.R.; Salimi, S.; Hipel, K.W. A comparative evaluation of flood mitigation alternatives using GIS-based river hydraulics modelling and multicriteria decision analysis. J Flood Risk Manag. 2013, 6, 319–331. [Google Scholar] [CrossRef]
- Elsheikh, R.; Ouerghi, S.; Elhag, A. Flood Risk Map Based on GIS, and Multi Criteria Techniques (Case Study Terengganu Malaysia). J. Geogr. Inf. Syst. 2015, 7, 348–357. [Google Scholar] [CrossRef] [Green Version]
- Papaioannou, G.; Vasiliades, L.; Loukas, A. Multi-Criteria Analysis Framework for Potential Flood Prone Areas Mapping. Water Resour. Manag. 2015, 29, 399–418. [Google Scholar] [CrossRef]
- Rahmati, O.; Zeinivand, H.; Besharat, M. Flood hazard zoning in Yasooj region, Iran, using GIS and multi-criteria decision analysis. Geomatics, Nat. Hazards Risk 2016, 7, 1000–1017. [Google Scholar] [CrossRef] [Green Version]
- Martínez-Casasnovas, J.A.; Ramos, M.C.; Ribes-Dasi, M. Soil erosion caused by extreme rainfall events: Mapping and quantification in agricultural plots from very detailed digital elevation models. Geoderma 2002, 105, 125–140. [Google Scholar] [CrossRef]
- Veleda, V.; Martínez-Graña, A.M.; Santos-Francés, F.; Sánchez-San Roman, J.; Criado, M. Analysis of the Hazard, Vulnerability, and Exposure to the Risk of Flooding (Alba de Yeltes, Salamanca, Spain). Appl. Sci. 2017, 7, 157. [Google Scholar] [CrossRef] [Green Version]
- Zhang, J.; Xu, W.; Liao, X.; Zong, S.; Liu, B. Global mortality risk assessment from river flooding under climate change. Environ. Res. Lett. 2021, 16, 064036. [Google Scholar] [CrossRef]
- Arabameri, A.; Rezaei, K.; Cerda, A.; Conoscenti, C.; Kalantari, Z. A comparison of statistical methods and multi-criteria decision making to map flood hazard susceptibility in Northern Iran. Sci. Total Environ. 2019, 660, 443–458. [Google Scholar] [CrossRef]
- Cabrera, J.S.; Lee, H.S. Flood-prone area assessment using GIS-based multi-criteria analysis: A case study in Davao Oriental, Philippines. Water 2019, 11, 2203. [Google Scholar] [CrossRef] [Green Version]
- Chakraborty, S.; Mukhopadhyay, S. Assessing flood risk using analytical hierarchy process (AHP) and geographical information system (GIS): Application in Coochbehar district of West Bengal, India. Nat. Hazards 2019, 99, 247–274. [Google Scholar] [CrossRef]
- Toosi, A.S.; Calbimonte, G.H.; Nouri, H.; Alaghmand, S. River basin-scale flood hazard assessment using a modified multi-criteria decision analysis approach: A case study. J. Hydrol. 2019, 574, 660–671. [Google Scholar] [CrossRef]
- IPCC. Managing the Risks of Extreme Events and Disasters to Advance Climate Change Adaptation (SREX) Summary for Policy Makers; Cambridge University Press: Cambridge, UK; New York, NY, USA, 2012; 582 p. [Google Scholar]
- Roble, R.G.; Ridley, E.C. A thermosphere-ionosphere-mesosphere-electrodynamics general circulation model (TIME-GCM): Equinox solar cycle minimum simulations (30–500 km). Geophys. Res. Lett. 1994, 21, 417–420. [Google Scholar] [CrossRef]
- Lenderink, G.; Buishand, A.; Deursen, W.V. Estimates of future discharges of the river Rhine using two scenario methodologies: Direct versus delta approach. Hydrol. Earth Syst. Sci. 2007, 11, 1145–1159. [Google Scholar] [CrossRef]
- Huang, H.; Cui, H.; Ge, Q. Assessment of potential risks induced by increasing extreme precipitation under climate change. Nat. Hazards 2021, 108, 2059–2079. [Google Scholar] [CrossRef]
- Janizadeh, S.; Pal, S.; Saha, A.; Chowdhuri, I.; Ahmadi, K.; Mirzaei, S.; Mosavi, A.; Tiefenbacher, J. Mapping the spatial and temporal variability of flood hazard affected by climate and land-use changes in the future. J. Environ. Manag. 2021, 298, 113551. [Google Scholar] [CrossRef]
- Mizuta, R.; Yoshimura, H.; Murakami, H.; Matsueda, M.; Endo, H.; Ose, T.; Kamiguchi, K.; Hosaka, M.; Sugi, M.; Yukimoto, S.; et al. Climate simulations using MRI-AGCM3.2 with 20-km grid. J. Meteorol. Soc. Jpn. 2012, 90, 233–258. [Google Scholar] [CrossRef] [Green Version]
- Su, Y.F.; Cheng, C.T.; Liou, J.J.; Chen, Y.M. Bias correction of MRI-WRF dynamic downscaling datasets. Terr. Atmos. Ocean. Sci. 2016, 27, 649–657. [Google Scholar] [CrossRef] [Green Version]
- Water Resources Agency (WRA). Flood Potential Maps in Taiwan. Available online: http://103.253.146.123/wra/riskmap-dev/flood/ (accessed on 23 November 2021). (In Chinese).
- National Science and Technology Center for Disaster Reduction (NCDR). Disaster Potential Maps in Taiwan. Available online: https://dmap.ncdr.nat.gov.tw/ (accessed on 23 November 2021). (In Chinese)
- Liu, S.C.; Fu, C.; Shiu, C.J.; Chen, J.P.; Wu, F. Temperature dependence of global precipitation extremes. Geophys. Res. Lett. 2009, 36, L17702. [Google Scholar] [CrossRef] [Green Version]
- Su, S.H.; Kuo, H.C.; Hsu, L.H.; Yang, Y.T. Temporal and Spatial Characteristics of Typhoon Extreme Rainfall in Taiwan. J. Meteorol. Soc. Jpn. 2012, 90, 721–736. [Google Scholar] [CrossRef] [Green Version]
- Henny, L.; Thorncroft, C.D.; Hsu, H.H.; Bosart, L.F. Extreme Rainfall in Taiwan: Seasonal Statistics and Trends. J. Clim. 2021, 34, 4711–4731. [Google Scholar] [CrossRef]
- Chen, Y.M.; Chen, C.W.; Chao, Y.C.; Tung, Y.S.; Liou, J.J.; Li, H.C.; Cheng, C.T. Future Landslide Characteristic Assessment Using Ensemble Climate Change Scenarios: A Case Study in Taiwan. Water 2020, 12, 564. [Google Scholar] [CrossRef] [Green Version]
- Wei, H.P.; Yeh, K.C.; Liou, J.J.; Chen, Y.M.; Cheng, C.T. Estimating the Risk of River Flow under Climate Change in the Tsengwen River Basin. Water 2016, 8, 81. [Google Scholar] [CrossRef] [Green Version]
- Lee, T.L.; Chen, C.H.; Pai, T.Y.; Wu, R.S. Development of a Meteorological Risk Map for Disaster Mitigation and Management in the Chishan Basin, Taiwan. Sustainability 2015, 7, 962–987. [Google Scholar] [CrossRef] [Green Version]
- Huang, W.P.; Hsu, J.C.; Chen, C.S.; Ye, C.J. The Study of the Coastal Management Criteria Based on Risk Assessment: A Case Study on Yunlin Coast, Taiwan. Water 2018, 10, 988. [Google Scholar] [CrossRef] [Green Version]
- Hsu, T.W.; Shih, D.S.; Li, C.Y.; Lan, Y.J.; Lin, Y.C. A Study on Coastal Flooding and Risk Assessment under Climate Change in the Mid-Western Coast of Taiwan. Water 2017, 9, 390. [Google Scholar] [CrossRef]
- Water Resources Agency (WRA). 2018 Renew and Development of Decision-making Support Services for Flood Risk Maps; Water Resources Agency: Taichung, Taiwan, 2018; pp. 93–148. (In Chinese) [Google Scholar]
- Chen, Y.R.; Yeh, C.H.; Yu, B. Integrated application of the analytic hierarchy process and the geographic information system for flood risk assessment and flood plain management in Taiwan. Nat. Hazards 2011, 59, 1261–1276. [Google Scholar] [CrossRef] [Green Version]
- Hsu, W.K.; Huang, P.C.; Chang, C.C.; Chen, C.W.; Hung, D.M.; Chiang, W.L. An integrated flood risk assessment model for property insurance industry in Taiwan. Nat. Hazards 2011, 58, 1295–1309. [Google Scholar] [CrossRef]
- Weis, S.W.M.; Agostini, V.N.; Roth, L.M.; Gilmer, B.; Schill, S.R.; Knowles, J.E.; Blyther, R. Assessing vulnerability: An integrated approach for mapping adaptive capacity, sensitivity, and exposure. Clim. Change 2016, 136, 615–629. [Google Scholar] [CrossRef] [Green Version]
- Poulos, H.M. Spatially explicit mapping of hurricane risk in New England, USA using ArcGIS. Nat. Hazards 2010, 54, 1015–1023. [Google Scholar] [CrossRef]
- Romali, N.S.; Yusop, Z.; Ismail, A.Z. Application of HEC-RAS and Arc GIS for floodplain mapping in Segamat town, Malaysia. Int. J. GEOMATE 2018, 14, 125–131. [Google Scholar] [CrossRef]
- Inanloo, B.; Tansel, B.; Shams, K.; Jin, X.; Gan, A. A decision aid GIS-based risk assessment and vulnerability analysis approach for transportation and pipeline networks. Saf. Sci. 2016, 84, 57–66. [Google Scholar] [CrossRef]
- Kron, W. Flood Risk = Hazard × Exposure × Vulnerability; Science Press: New York, NY, USA, 2002; pp. 58–68. [Google Scholar] [CrossRef]
- De Moel, H.; van Alphen, J.; Aerts, J. Flood maps in Europe–methods, availability and use. Nat. Hazards Earth Syst. Sci. 2009, 9, 289–301. [Google Scholar] [CrossRef] [Green Version]
- Water Resources Bureau of the Ministry of Economic Affairs. Handbook of Hydrological Design in Taiwan; Water Resources Bureau of the Ministry of Economic Affairs: Taipei, Taiwan, 2001; pp. 7–11. (In Chinese) [Google Scholar]
- Wallis, J.R. Just a Moment. Water Resour. Res. 1974, 10, 211–219. [Google Scholar] [CrossRef] [Green Version]
- Doong, D.J.; Lo, W.; Vojinovic, Z.; Lee, W.L.; Lee, S.P. Development of a New Generation of Flood Inundation Maps—A Case Study of the Coastal City of Tainan, Taiwan. Water 2016, 8, 521. [Google Scholar] [CrossRef] [Green Version]
- Ministry of the Interior, Socio-Economic Database Common Platform. Available online: https://segis.moi.gov.tw/STAT/Web/Portal/GroupProfile/STAT_GroupProfileSTATClass.aspx (accessed on 23 November 2021). (In Chinese)
Figure 1.
Study area and locations of historical inundation events.

Figure 2.
The evaluation process for the flood risk map under a climate change scenario.

Figure 3.
Flood hazard-vulnerability map under the RCP8.5 scenario on the 5 km grid scale.

Figure 4.
Flood risk map under the RCP8.5 scenario on the township area scale.

Figure 5.
Changes of flood risk level under the RCP8.5 scenario.

Figure 6.
Flood risk map for elderly population distribution.

Figure 7.
Flood hazard-vulnerability map of crop impacts.


Table 1.
Variations of risk level of township numbers under the climate change scenario.
| Category of Risk | Changes of Risk Level | Percentage of the Numbers of Township |
|---|---|---|
| High risk level | Unchanged at high risk level (still at level 4 or level 5) | 6% |
| Changed to high risk level in the future (from low level to higher level) | 8% | |
| Increased three risk levels (from low level to higher) | 3% | |
| Decreased one risk level (from level 5 to level 4) | 1% | |
| Low risk level | Increased one level (from risk level 1 to level 2) | 9% |
| Unchanged low risk level (still at level 1 or level 2) | 39% | |
| Changed to low risk level in the future (from higher level to low level) | 2% | |
| Reduction of risk level (decreased 1 level) | 8% |
Publisher’s Note: MDPI stays neutral with regard to jurisdictional claims in published maps and institutional affiliations. |
© 2022 by the authors. Licensee MDPI, Basel, Switzerland. This article is an open access article distributed under the terms and conditions of the Creative Commons Attribution (CC BY) license (https://creativecommons.org/licenses/by/4.0/).
Share and Cite
MDPI and ACS Style
Chen, Y.-J.; Lin, H.-J.; Liou, J.-J.; Cheng, C.-T.; Chen, Y.-M. Assessment of Flood Risk Map under Climate Change RCP8.5 Scenarios in Taiwan. Water 2022, 14, 207. https://doi.org/10.3390/w14020207
AMA Style
Chen Y-J, Lin H-J, Liou J-J, Cheng C-T, Chen Y-M. Assessment of Flood Risk Map under Climate Change RCP8.5 Scenarios in Taiwan. Water. 2022; 14(2):207. https://doi.org/10.3390/w14020207
Chicago/Turabian StyleChen, Yun-Ju, Hsuan-Ju Lin, Jun-Jih Liou, Chao-Tzuen Cheng, and Yung-Ming Chen. 2022. "Assessment of Flood Risk Map under Climate Change RCP8.5 Scenarios in Taiwan" Water 14, no. 2: 207. https://doi.org/10.3390/w14020207
Note that from the first issue of 2016, this journal uses article numbers instead of page numbers. See further details here.