
Ammonium Nitrogen Streamflow Transport Modelling and Spatial Analysis in Two Chinese Basins


1
College of Environmental Science and Engineering, Nankai University, Tianjin 300350, China
2
Ecological Environment Monitoring and Scientific Research Center of Haihe River Basin and Beihai Sea Area, Ministry of Ecological Environment, Tianjin 300061, China
3
Shenzhen Qianming Technology Co., Ltd., Shenzhen 518000, China
4
Synthego Corporation, Redwood City, CA 94063, USA
*
Authors to whom correspondence should be addressed.
Water 2022, 14(2), 209; https://doi.org/10.3390/w14020209
Submission received: 20 November 2021
/
Revised: 21 December 2021
/
Accepted: 7 January 2022
/
Published: 11 January 2022
(This article belongs to the Special Issue Surface Water Quality Modelling)
Abstract
:Ammonium nitrogen (NH4+-N), which naturally arises from the decomposition of organic substances through ammonification, has a tremendous influence on local water quality. Therefore, it is vital for water quality protection to assess the amount, sources, and streamflow transport of NH4+-N. SPAtially Referenced Regressions on Watershed attributes (SPARROW), which is a hybrid empirical and mechanistic modeling technique based on a regression approach, can be used to conduct studies of different spatial scales on nutrient streamflow transport. In this paper, the load and delivery of NH4+-N in Poyang Lake Basin (PLB) and Haihe River Basin (HRB) were estimated using SPARROW. In PLB, NH4+-N load streamflow transport originating from point sources and farmland accounted for 41.83% and 32.84%, respectively. In HRB, NH4+-N load streamflow transport originating from residential land and farmland accounted for 40.16% and 36.75%, respectively. Hence, the following measures should be taken: In PLB, it is important to enhance the management of the point sources, such as municipal and industrial wastewater. In HRB, feasible measures include controlling the domestic pollution and reducing the usage of chemical fertilizers. In addition, increasing the vegetation coverage of both basins may be beneficial to their nutrient management. The SPARROW models built for PLB and HRB can serve as references for future uses for different basins with various conditions, extending this model’s scope and adaptability.
1. Introduction
An excess of nutrients, which are generated from point and non-point sources and are eventually transported to water bodies, has led to severe eutrophication throughout the world in recent years [1]. Eutrophication of water bodies causes toxic algal blooms, oxygen depletion, loss of biodiversity, and thereby, the degradation of water quality and aquatic ecosystem services [2]. Ammonium nitrogen (NH4+-N), which naturally arises from the decomposition of organic substances through ammonification, is a critical nutrient produced by human activities such as fertilizing, livestock breeding, and municipal wastewater treating. Synthetic nitrogen fertilizers are slightly absorbed by crops (about 10%), while large quantities of synthetic nitrogen are exported to aquatic systems through surface runoff and decomposed to NH4+-N [3]. Domestic and industrial wastewater are also important manners, by which NH4+-N enters into aquatic systems. Excessive NH4+-N leads to eutrophication, endangering aquatic species and polluting water sources [4]. Since NH4+-N has a tremendous influence on local water quality, it is vital for water quality protection to assess the amount, sources, and transport of NH4+-N [5].
Previous research has focused on the processes of NH4+-N stream transport. For instance, Jin et al. employed the Integrated Nitrogen Catchments (INCA-N) model to link upstream processes to downstream water quality of NH4+-N in the Hampshire Avon catchment [6]. Ervinia et al. applied the INCA-N model to identify the source and processes of NH4+-N in the Jiulong River Watershed (JRW) [7]. Zhang et al. employed QUAL2K model to explore the transport of NH4+-N in a creek watershed with sparse data in southeast of China [8]. Xue et al. simulated the land surface hydrological runoff and routing processes in the Xiaoqing River Basin and analysed the concentration of NH4+-N temporally and spatially, using the Soil and Water Assessment Tool (SWAT) model and HEC-RAS model [9]. Dai et al. assessed the sources and transport of ammonium nitrogen in a karst basin using the SPAtially Referenced Regressions on Watershed attributes (SPARROW) model [5].
Complex models, such as Agricultural Non-point Source (AGNPS), Hydrological Simulation Program FORTRAN (HSPF), INCA-N, and SWAT, which have been developed to evaluate water quality and sources of nutrients [10], have hefty data requirements [11] and are time-consuming processes [12]. Hybrid empirical and mechanistic models based on regression, such as the SPARROW model, can be used to conduct studies at different spatial scales on nutrient transport with smaller input datasets, such as data on nutrient load, nutrient sources, and landscape properties. Since it was first established by the U.S. Geological Survey (USGS) [13], SPARROW has been extensively applied in North America [14,15,16,17,18,19,20,21,22,23,24], Asia [25,26,27,28,29,30], New Zealand [31,32], Spain [33,34], and Brazil [35] with satisfactory performance. SPARROW has been employed in studies on regions of various sizes, from 153 km2 [36] to 3.2 million km2 [37]. Furthermore, the model performs well in both estimating the influences of human activities on the environment [38,39], and analyzing scenarios of climate change [40,41] or land use change [42,43].
Poyang Lake Basin (PLB) consists of five main river watersheds. Its water exchanges with Yangtze River after the streamflow of the five main rivers are injected into Poyang Lake, the largest freshwater lake in China [44]. PLB is a typical southern water basin in China, since it has a massive quantity of water and better water quality than northern water basins in China. Haihe River Basin (HRB), which contains seven major river watersheds, has a high population density and numerous large cities. Therefore, it plays an important role in the politics and economy of China [45]. The water quantity and quality of HRB is seriously affected by human activities, such as irrigation, fertilization, point sources, etc. The main purposes of this paper were to (1) establish SPARROW models in PLB and HRB and figure out the NH4+-N load and streamflow transport in these two basins; (2) compare NH4+-N load and streamflow transport between PLB and HRB and identify the distinctions between the two basins; (3) offer assistance in future control measures for better management in PLB and HRB.
2. Materials and Methods
2.1. Study Area
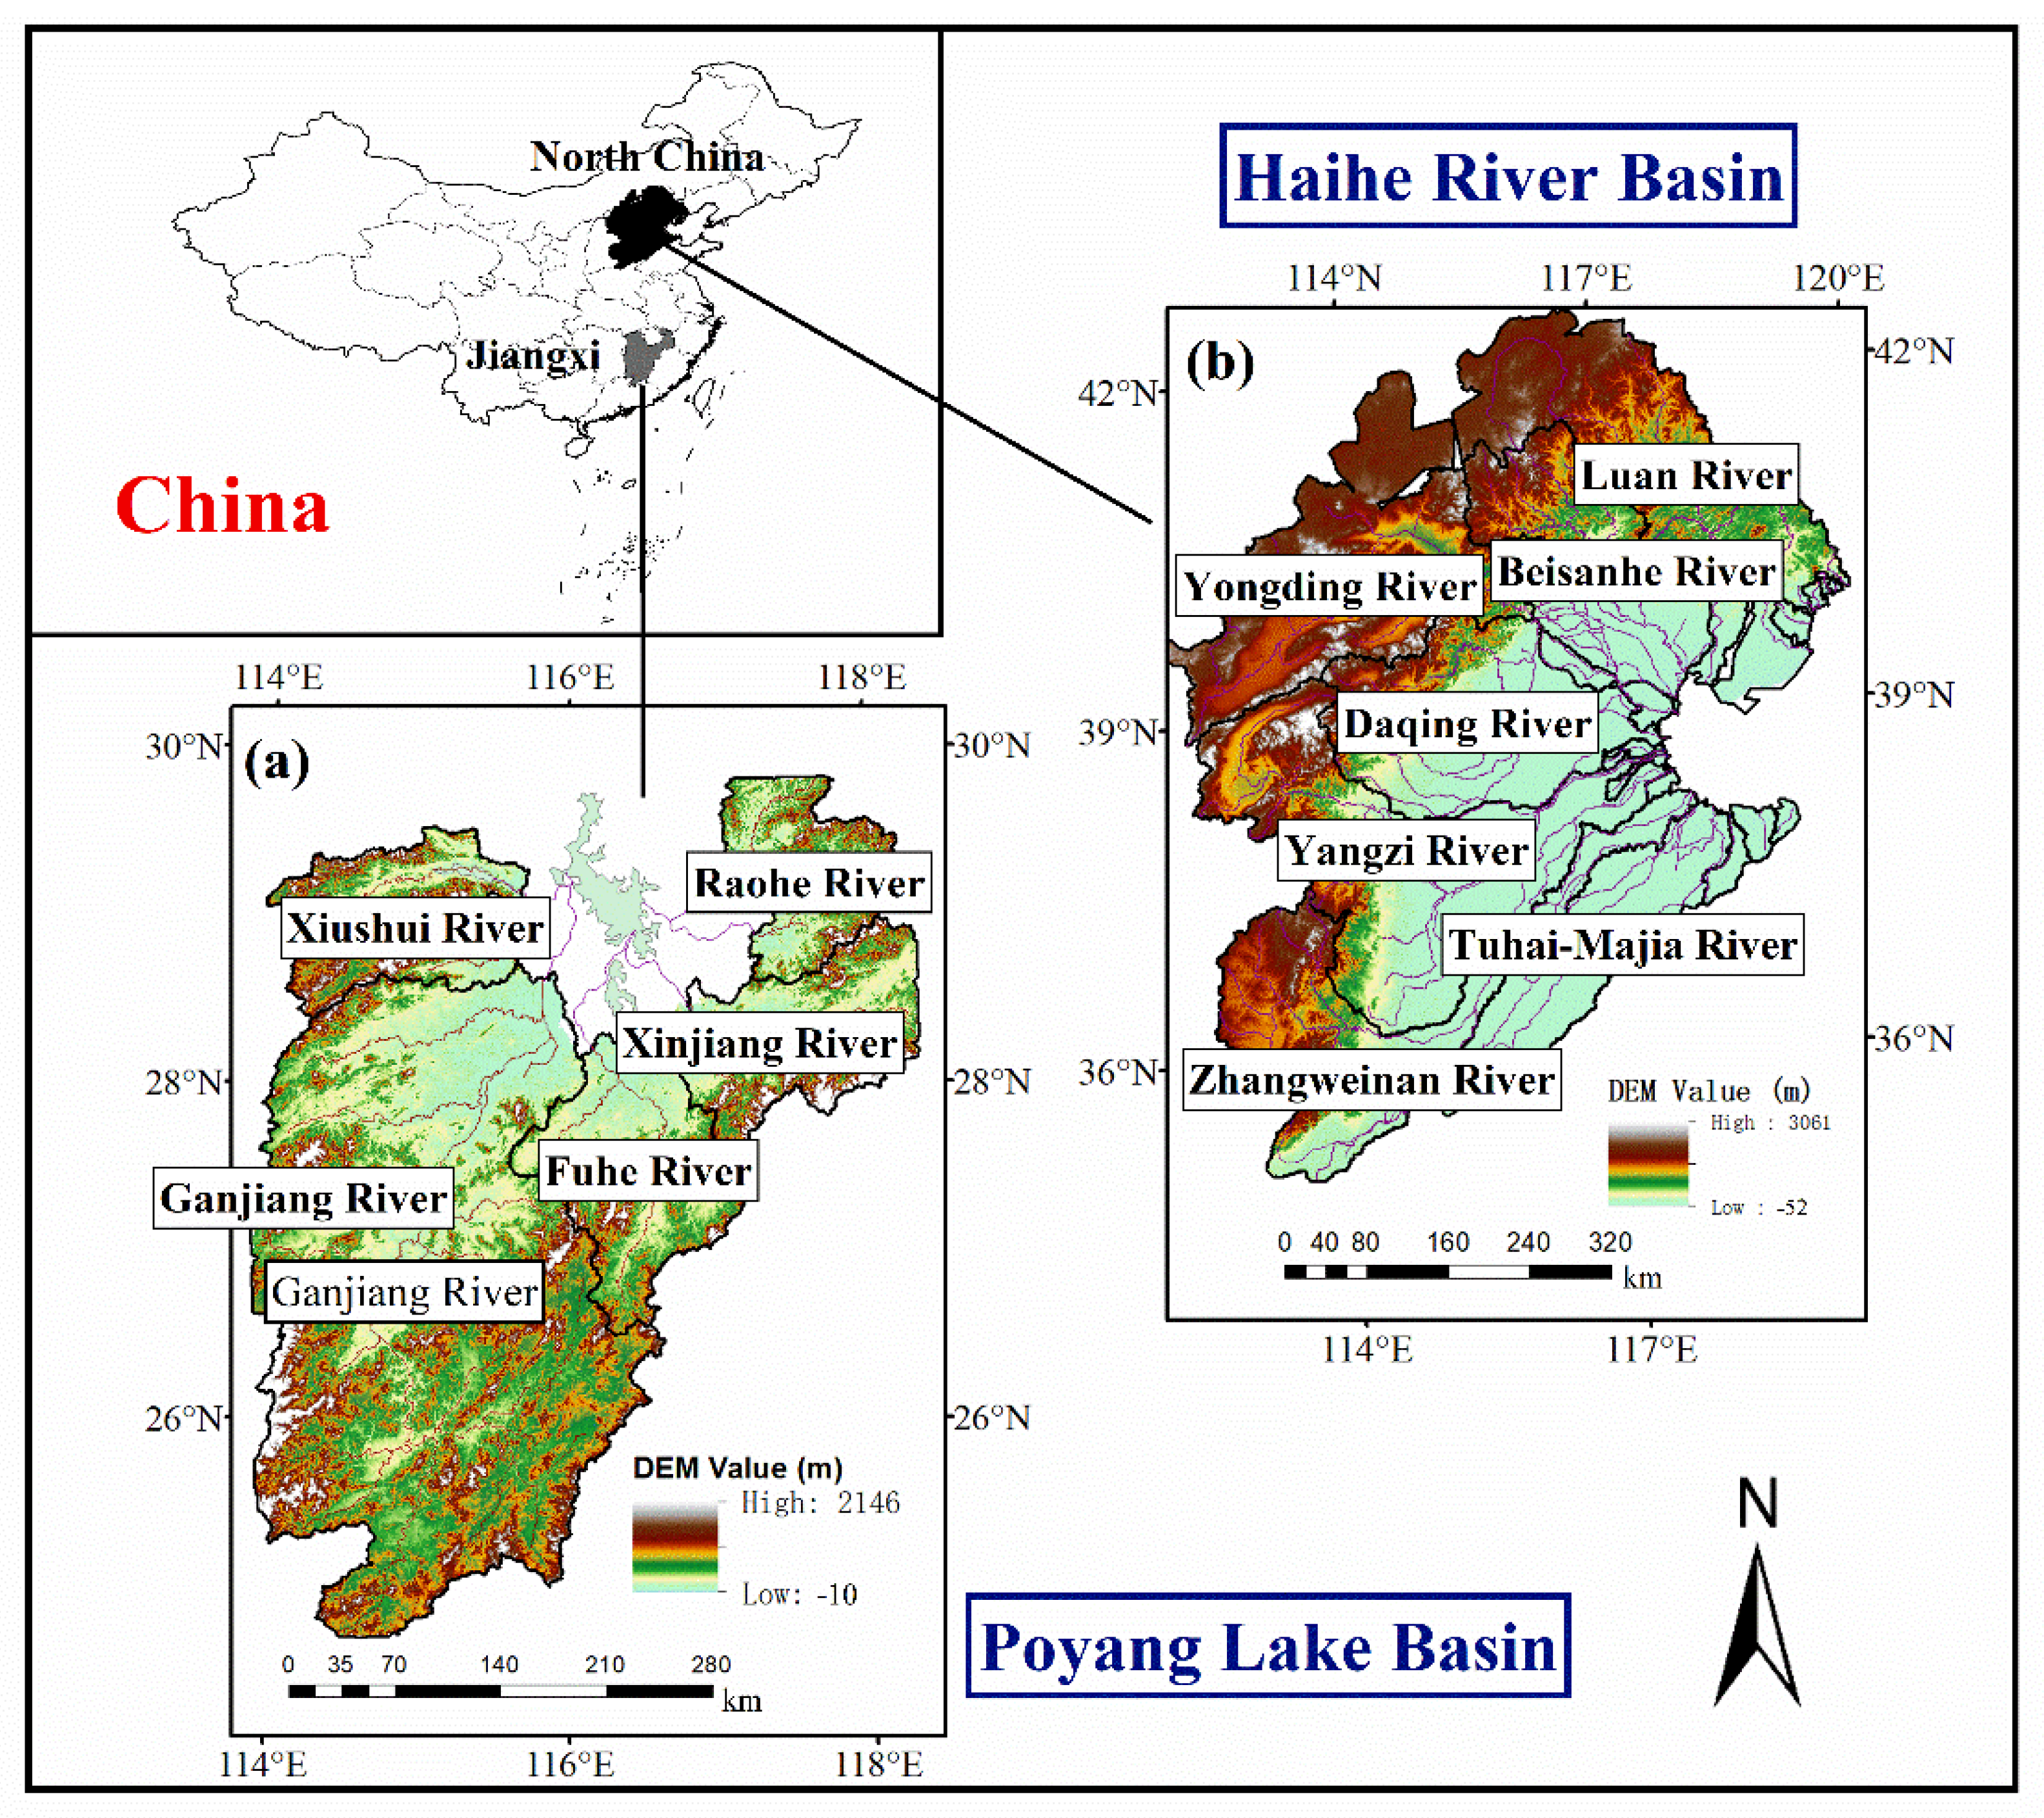
PLB is located in southern China, between 113° E–118° E and 24° N–30° N, as shown in Figure 1a. The drainage area of PLB is 162,271 km2, of which 156,743 km2 is located in Jiangxi Province (the total land area of Jiangxi Province is 166,946 km2), accounting for 97% of the drainage area of PLB and 94% of the total land area of Jiangxi Province [46]. PLB belongs to a subtropical warm and humid monsoon climate zone. The average annual temperature is about 16.3–19.5 °C, generally increasing from north to south. The vegetation type is subtropical, evergreen, broad-leaved forest. PLB is composed of five main tributary rivers, namely, Ganjiang River, Fuhe River, Xinjiang River, Raohe River, and Xiushui River, as well as several smaller rivers. These rivers finally flow into Poyang Lake, and the outflow of Poyang Lake inject into Yangtze River through the Hukou station. The span of PLB covers a length of 620 km from north to south and a width of 490 km from east to west. The basin is surrounded by mountains in the east, west, and south; has hills and valley plains crisscrossing the central part; and there is the Poyang Lake plain in the north. The terrain of PLB is high in the south and low in the north, which is conducive to water convergence.
The annual average total amount of water resources in PLB was 163.06 billion m3, while the annual average total amount of water uses is 17.67 billion m3 and the annual average quantity of wastewater is 4.39 billion m3. The total water resources of Ganjiang River, Fuhe River, Xinjiang River, Raohe River, and Xiushui River are 89.13, 20.19, 21.11, 15.77, and 16.86 billion m3, respectively. The average annual runoff in PLB into Poyang Lake is 142.73 billion m3. The annual average runoff totals of Ganjiang River, Fuhe River, Xinjiang River, Raohe River, and Xiushui River into Poyang Lake are 81.26, 16.20, 18.53, 14.04, and 12.70 billion m3, respectively.
HRB is located in northern China, between 112° E–120° E and 35° N–43° N, as shown in Figure 1b. The scope of HRB covers eight provinces (or cities). The total area of Beijing and Tianjin, 91% of the area of Hebei province, 38% of the area of Shanxi Province, 20% of the area of Shandong Province, 9.2% of the area of Henan province, 13,600 km2 of Inner Mongolia Autonomous Region, and 1700 km2 of Liaoning Province belong to Haihe River Basin—318,200 km2 in total. The climate of HRB is semi-humid and semi-arid. It is located in the temperate East Asian monsoon climate area. The annual average temperature is 1.5–14.0 °C [47]. The vegetation types in HRB are various due to the monsoon climate. HRB is constituted by seven major river watersheds, Luan River, Beisanhe River, Yongding River, Daqing River, Ziya River, Zhangweinan Canal, and Tuhai-Majia River. These rivers mostly flow from west to east, and finally discharge into Bohai Bay. HRB is bordered by the Shanxi Plateau and Yellow River Basin in the west, the Mongolia Plateau and the inland river basin in the north, the Yellow River in the south, and the Bohai Sea in the east. The total terrain of HRB is high in the northwest and low in the southeast, which is composed of three landforms: plateau, mountain, and plain. Plateaus and mountains are located in the north and west of HRB, covering an area of 189,400 km2, accounting for 60% of the basin area. The east and southeast of HRB are covered by a plain, which covers 128,400 km2, accounting for 40% of the basin’s area. The annual average total amount of water resources in HRB was 30.30 billion m3, while the annual average total amount of water uses is 37.00 billion m3 and the annual average quantity of wastewater is 5.98 billion m3. HRB belongs to an area with an extreme water shortage. The total amount of inter basin water transfer in HRB was 3.51 billion m3 (including the amount of water diverted from Yangtze River and Yellow River). The total water resources of Luanhe River, Beisanhe River, Yongding River, Daqing River, Ziya River, Zhangweinan Canal, and Tuhai-Majia River are 4.67, 4.38, 2.49, 4.65, 6.36, 4.41, and 3.32 billion m3, respectively. The average annual runoff in HRB into Bohai Bay was 3.51 billion m3. The annual average runoff totals of Luanhe River, Beisanhe River, Daqing River, Ziya River, and Tuhai-Majia River into Bohai Bay are 0.92, 1.05, 0.64, 0.34, and 0.54 billion m3, respectively. It is obvious that PLB has far more water resources than HRB, especially the amounts of water delivered to the outlets. Such difference might be explained by the lesser amounts of precipitation, the larger area of plain terrain, and the larger demand for water supply in HRB, leading to the lesser NH4+-N loads delivered to the outlets compared to PLB. The summary of water resources of the main rivers in PLB and HRB is in Tables S1 and S2.
2.1.1. Nutrient Sources
Point source data in 2017 of NH4+-N in PLB and HRB were provided by Chinese Research Academy of Environmental Sciences and Ecological Environment Monitoring and Scientific Research Center of Haihe River Basin and Beihai Sea Area, respectively. The load from point sources involved municipal and industrial wastewater treatment plants. The median annual load in PLB from point sources was 125,744 kg/year of NH4+-N, with a range of 4479–1,568,808 kg/year. The median annual load in HRB from point sources was 42,084 kg/year of NH4+-N, with a range of 0–2,952,298 kg/year.
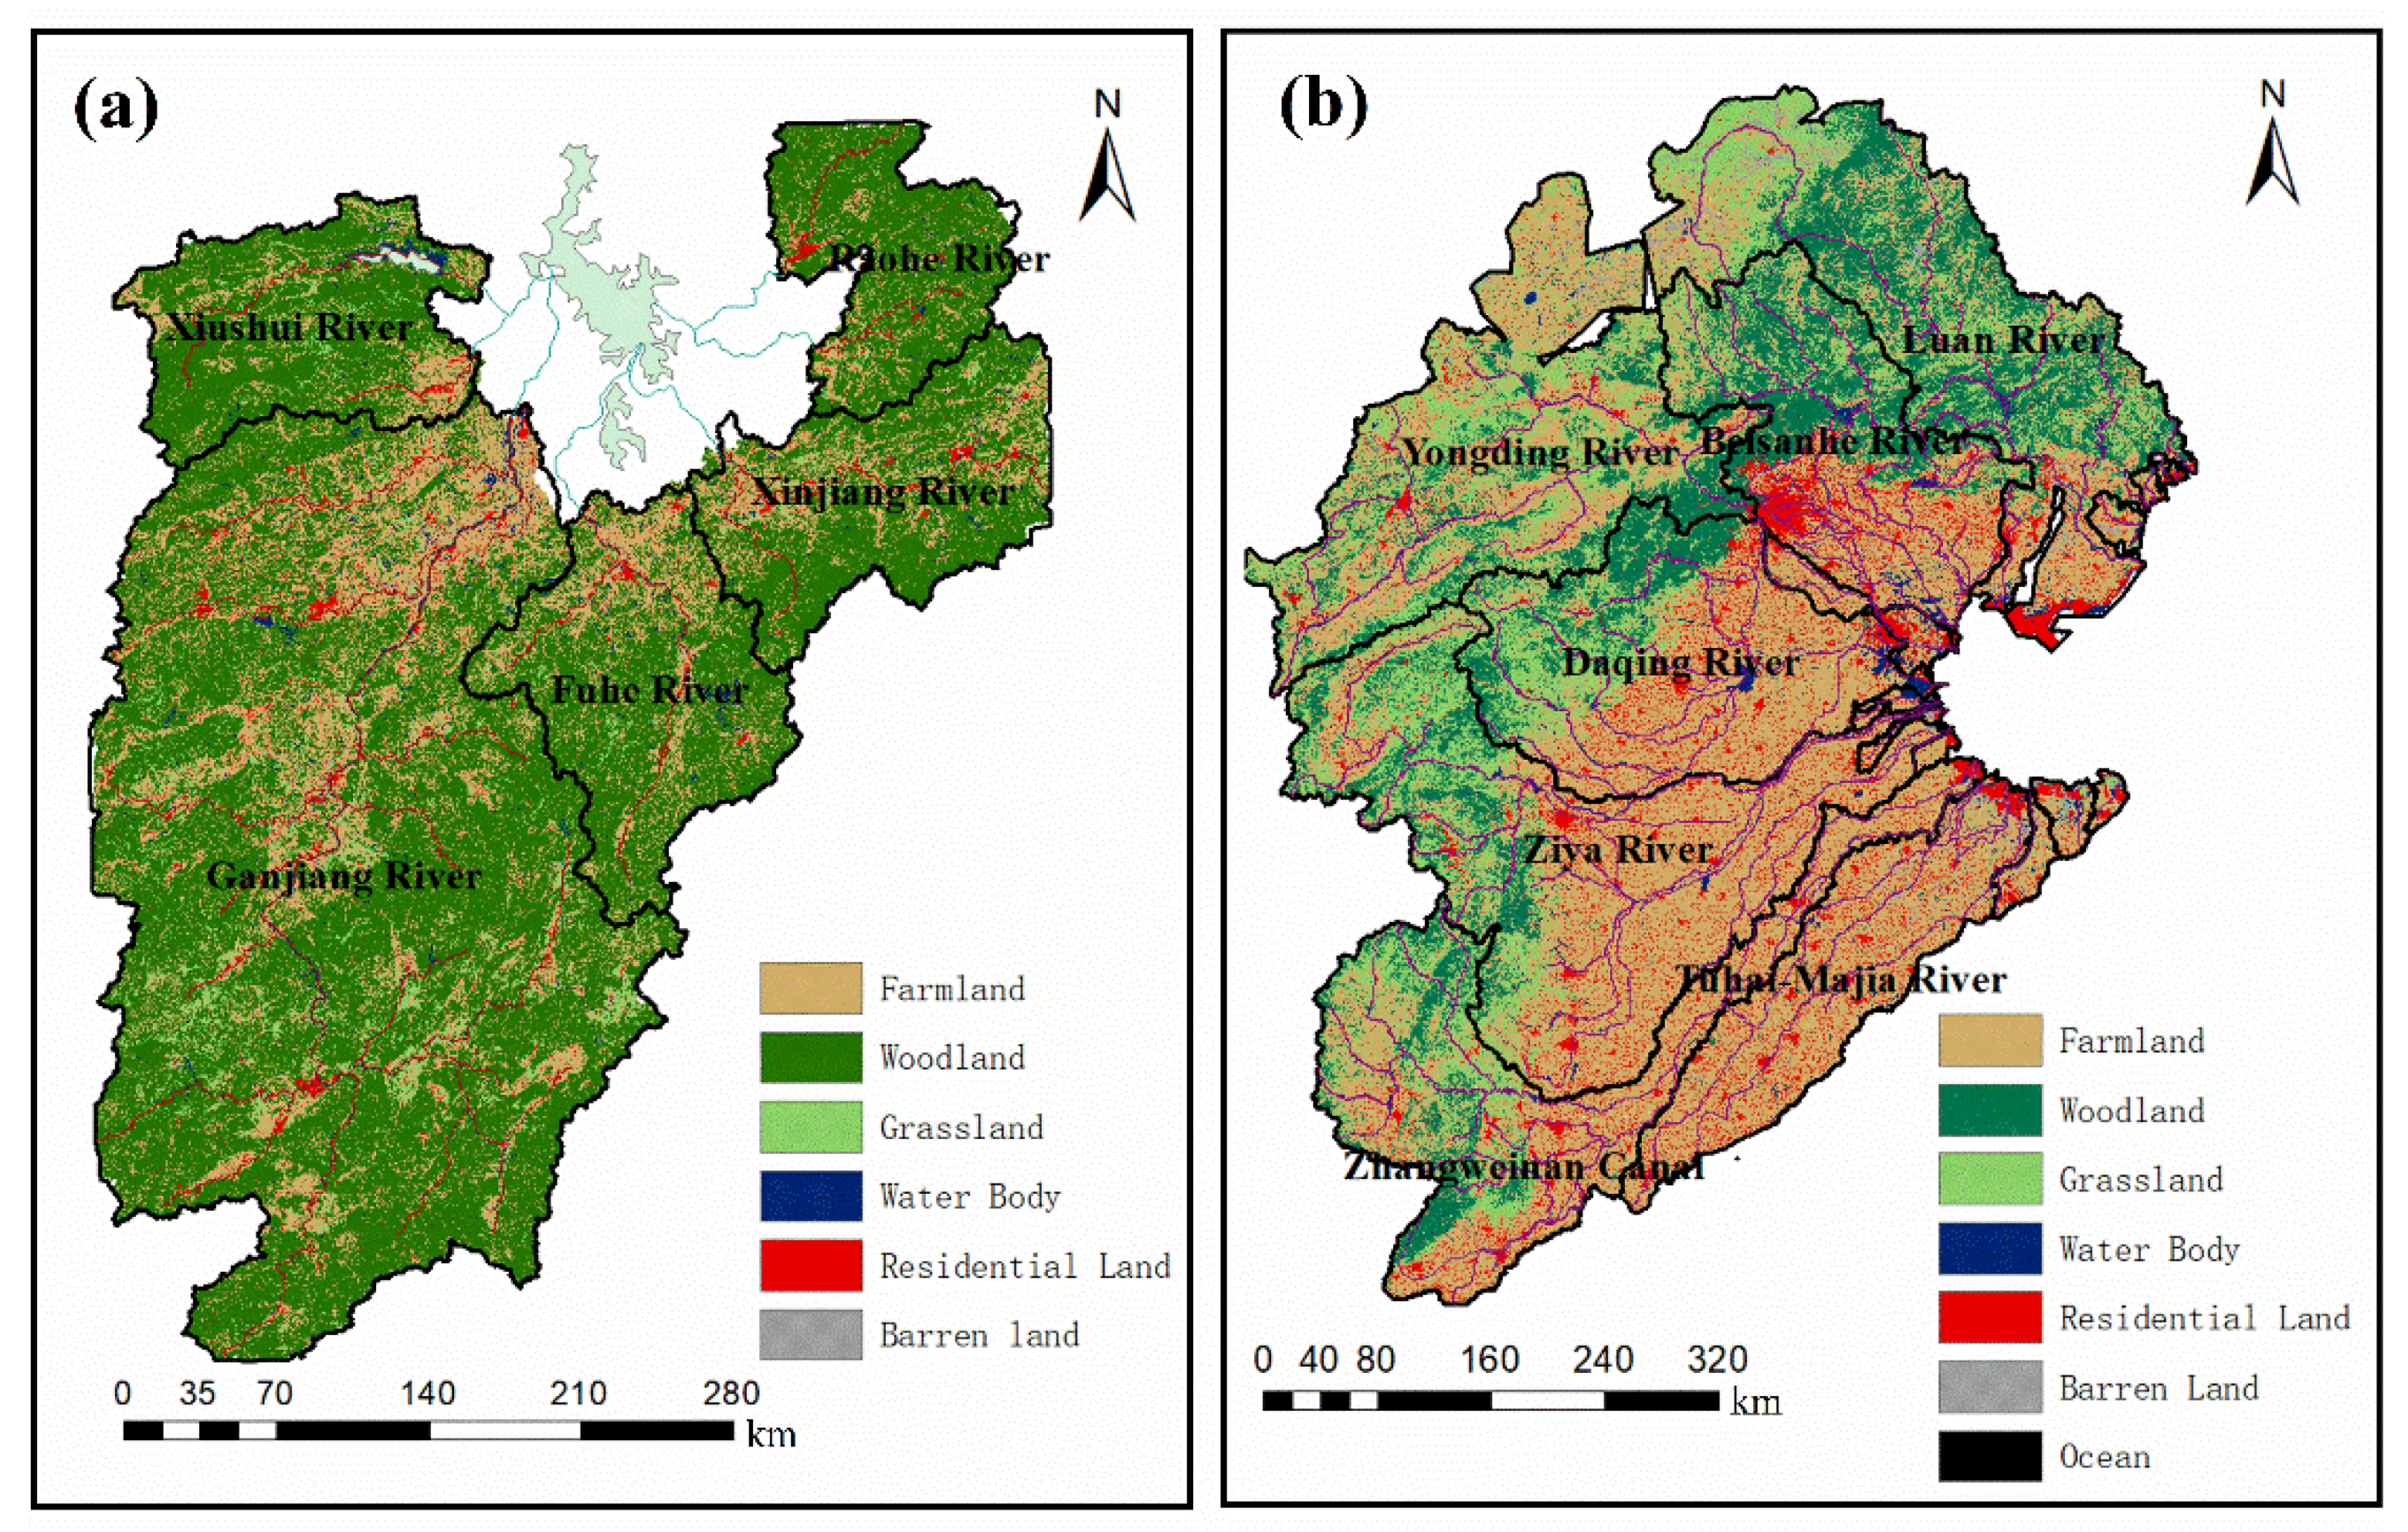
Farmland, woodland, grassland, and residential land were considered as non-point sources of nutrients [48]. Land use data in 2015 were acquired from the Data Center for Resources and Environmental Sciences of Chinese Academy of Sciences (https://www.resdc.cn/data.aspx?DATAID=184, accessed on 22 December 2020) and used to label farmland, woodland, grassland, water body, residential land, and barren land. In PLB, there were 24.60% farmland, 67.15% woodland, 4.20% grassland, 1.98% water body, 2.04% residential land, and 0.01% barren land, as shown in Figure 2a. In HRB, there were 49.03% farmland, 19.16% woodland, 18.45% grassland, 2.44% water body, 9.74% residential land, and 1.18% barren land, as shown in Figure 2b. It is clear that the areas of woodland and grassland in PLB were almost equal to those in HRB; and that the areas of farmland and residential land in PLB were far smaller than those in HRB.
2.1.2. River Network and Nutrient Load Estimates
The river network was obtained from the Digital Elevation Model (DEM) data (90 m × 90 m) of PLB and HRB by using ArcHydro tools; 85 and 310 stream reaches were delineated, respectively. The DEM data were downloaded from the Geospatial Data Cloud site, Computer Network Information Center, Chinese Academy of Sciences (http://www.gscloud.cn/sources/accessdata/306?pid=302, accessed on 28 December 2020).
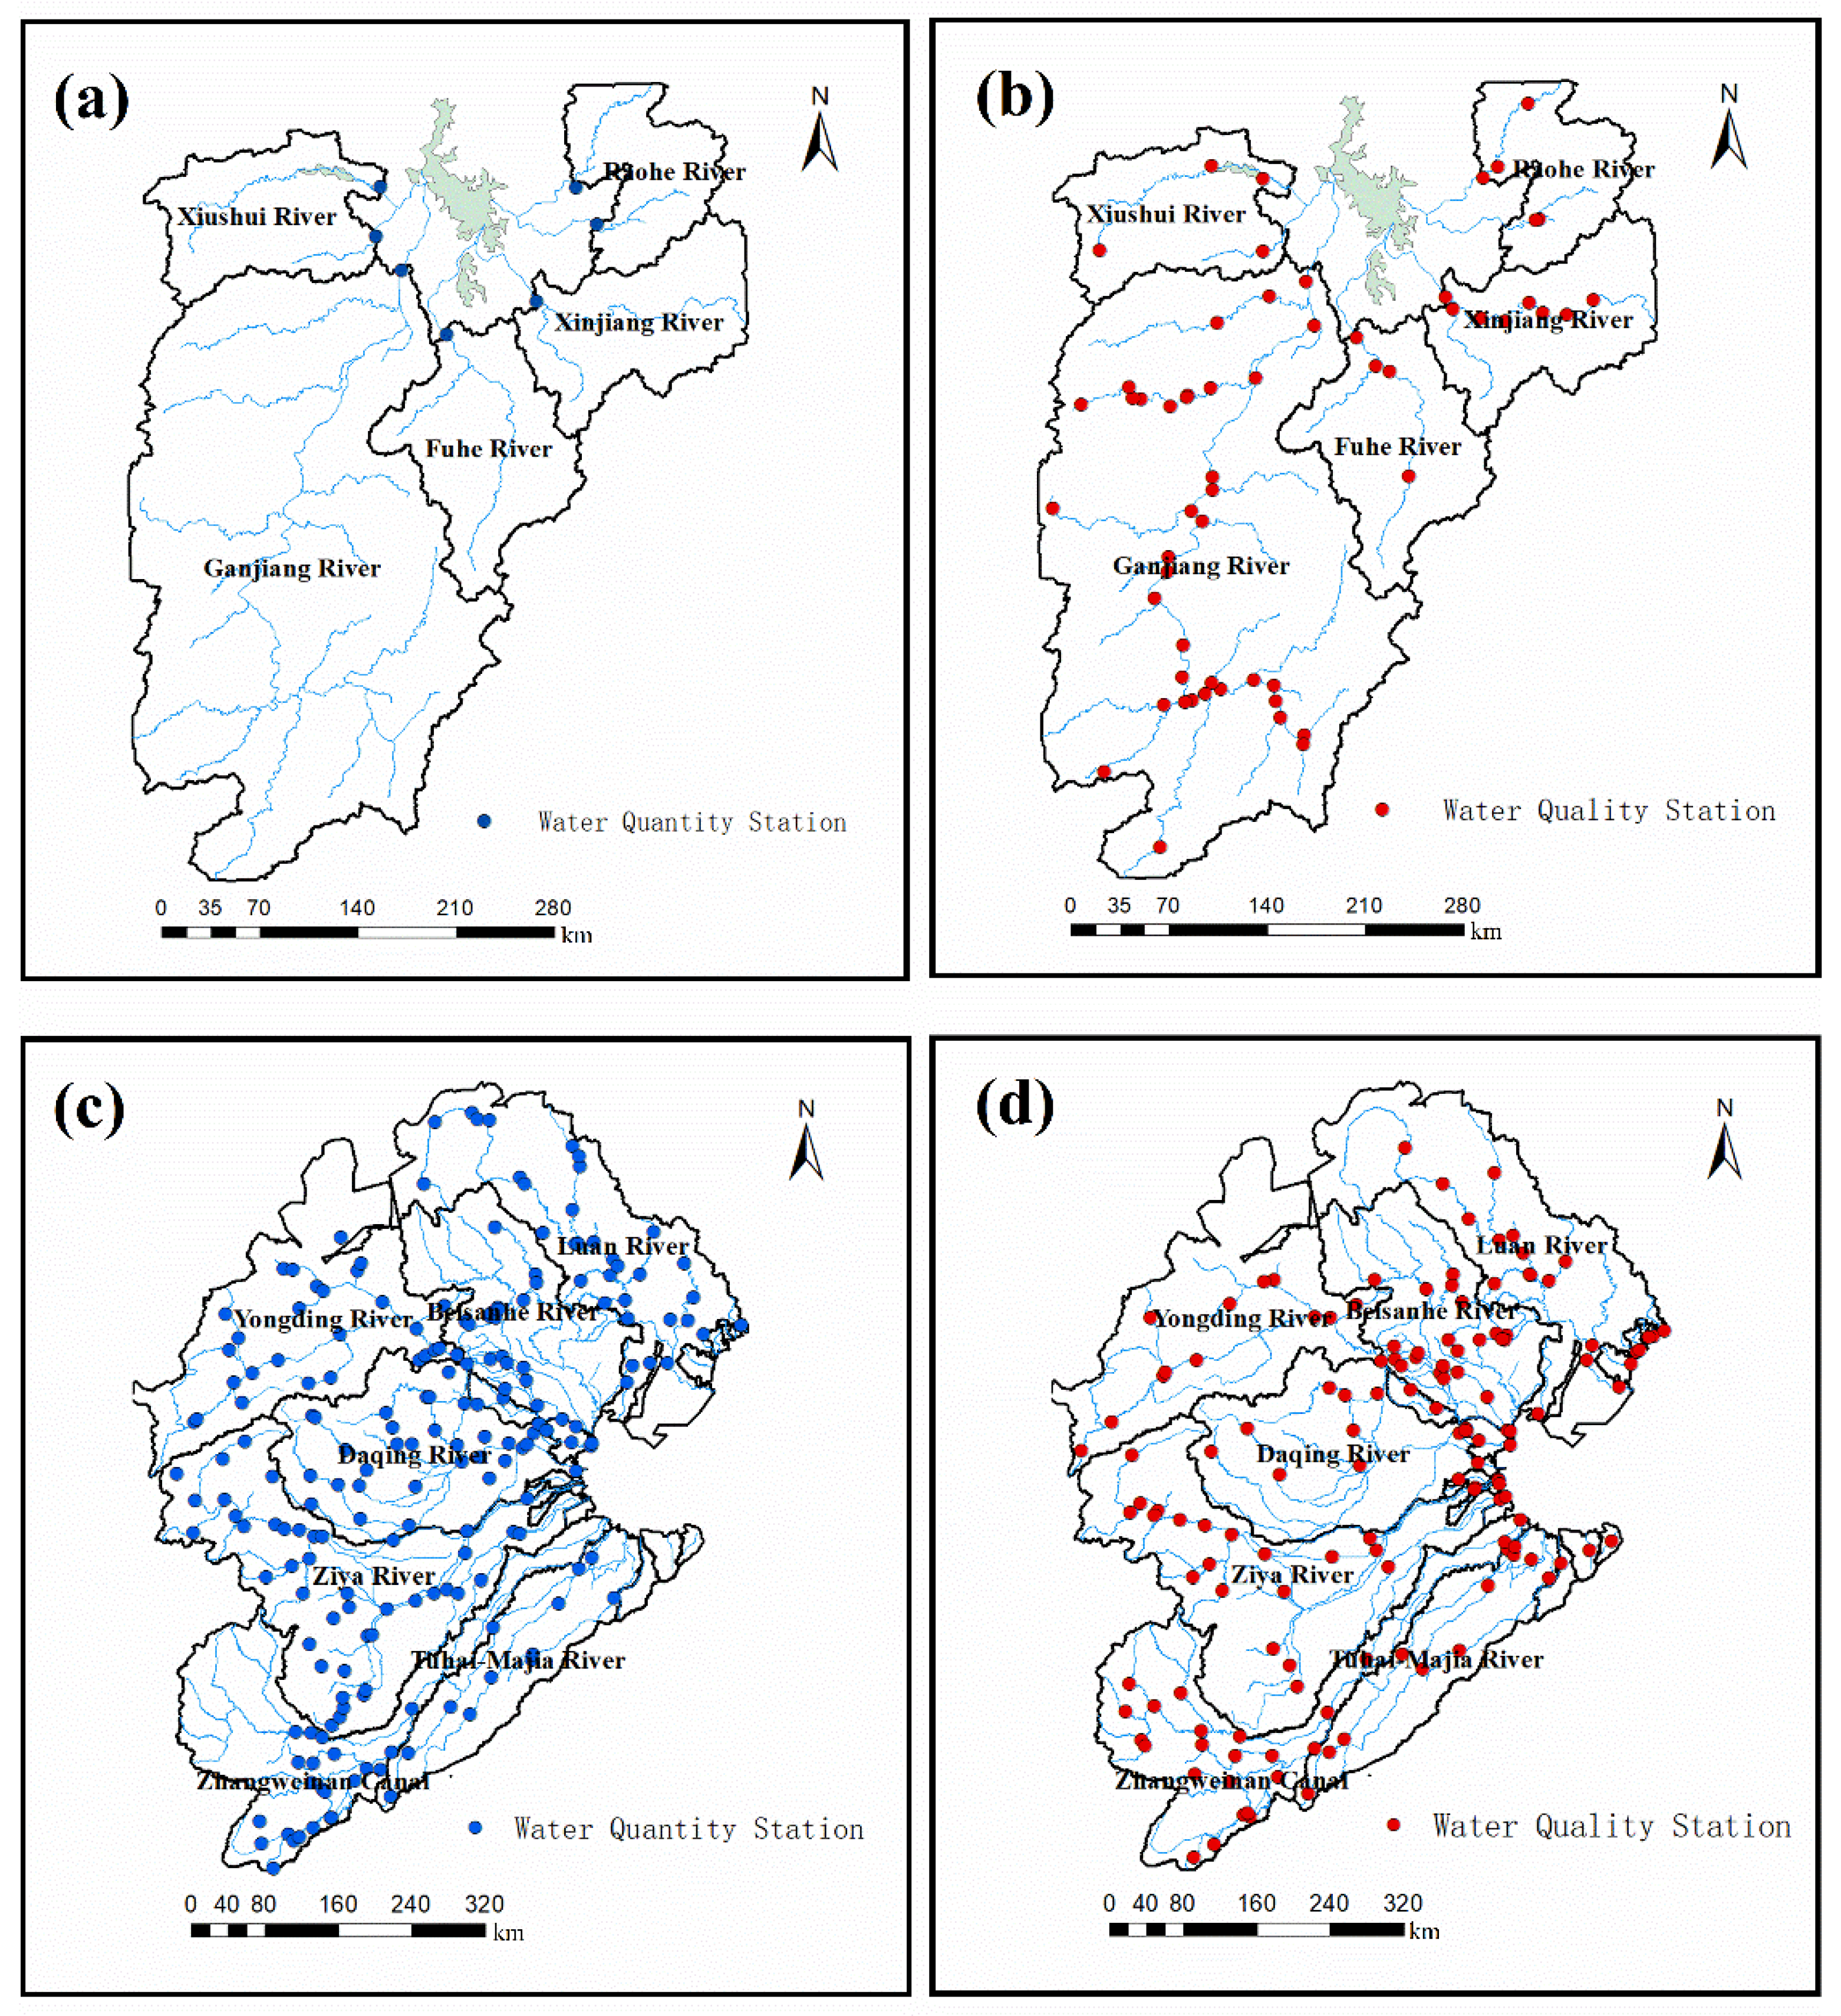
Streamflow data in 2017 were available from only Qiujing, Meigang, Wanjiabu, Hushan, Waizhou, Dufengkeng, and Lijiadu stations in PLB, which were provided by the Jiangxi Academy of Environmental Sciences. Streamflow at ungauged watersheds in PLB was estimated by using a GWLF model [49]. The version of the GWLF model used in this study was ReNuMa version 2.2.2 [50]. Streamflow data were available from 203 stations in HRB, which were provided by Ecological Environment Monitoring and Scientific Research Center of Haihe River Basin and Beihai Sea Area. Streamflow at ungauged watersheds in HRB was simulated by interpolation analysis using the GIS platform. Water quantity station distributions are shown in Figure 3a,c.
Water quality data in 2017 were provided monthly by the Jiangxi Academy of Environmental Sciences from 58 sites for PLB, and by Ecological Environment Monitoring and Scientific Research Center of Haihe River Basin and Beihai Sea Area from 144 sites for HRB. Water quality station distributions are shown in Figure 3b,d.
Annual nutrient loads of these sites were assessed as follows:
where is the Annual nutrient load of reach i, is simulated by the GWLF model (or interpolation analysis) as above, and represents the mean annual instream NH4+-N concentration.
2.1.3. Land-to-Water Delivery Variables
The model’s land-to-water delivery variables were mainly determined by the spatial attribute data. Annual average precipitation, annual average temperature, and slope were used in model calibration. The data of precipitation and temperature were downloaded from China Meteorological Data Service Centre (http://data.cma.cn/data/cdcdetail/dataCode/SURF_CLI_CHN_MUL_DAY_V3.0.html, accessed on 19 June 2020). The slope data were extracted from DEM. The data of delivery variables were transformed to the final type of SPARROW model by using GIS platform.
2.2. SPARROW Model
The total load leaving a given reach in the SPARROW model is considered as the sum of the load produced by itself and the load delivered from its upper stream [51]. The total load leaving reach i can be expressed mathematically as follows:
where Fi* is the total load leaving reach i (kg/year), is the load leaving upstream reaches from reach j, the set J(i) is all upstream reaches of reach i, δi is the proportion of load delivered to reach i contributed by adjacent upstream reaches, is a function of first-order loss processes related to stream size, and is the square root of .
Sn,j is the nutrient source n in reach i, NS is the total number of nutrient sources, is the coefficient of nutrient source n, and the land-to-water delivery term is defined as follows:
where is the land-to-water variable m within reach i, MD is the total number of delivery variables, is the coefficient of delivery variable m, and is the delivery index for judging whether source n uses delivery variable m or not.
Stream delivery function, considered as an attenuation process acting on flux, is formulated by a first-order reaction rate process. The proportion of the load remaining after the delivery to the outlet of reach i is expressed as an exponential function:
where is the average travelling time of a stream in reach i, which is classified as in-stream decay class c. c is the number of in-stream decay class c streams, CS is the total number of in-stream decay classes, and is the coefficient corresponding to average travelling time of stream. Two in-stream decay classes were used in the PLB and HRB SPARROW models.
The estimation method of the SPARROW model is a nonlinear weighted least squares (NWLS) algorithm performed by the SAS procedure PROC MODEL, based on Equation (2). NWLS, which is a robust technique to solve nonlinear problems, can be considered as an iterative linear estimation process, since it is related to the ordinary least squares [51]. Bootstrap analysis is used to validate the model and perform the uncertainty analysis. The bootstrap procedure is executed by randomly selecting with replacement monitored loads from the observations in the original calibration data set and fitting separate regression models to the resampled data [32].
2.3. GWLF Model
GWLF is a combined distributed/lumped parameter model [52], which simulates monthly and annual streamflow, sediment transport, and associated nitrogen and phosphorus fluxes. GWLF was designed to be used in mixed-use watersheds (such as urban, multiple agricultural land uses, and forested land use). Streamflow from each land use category is parameterized using a variation of the Soil Conservation Service (SCS) curve number formulation; erosion is generated using the Universal Soil Loss Equation (USLE). The wastewaters from residences are considered a septic system component in GWLF model. The Excel Solver is used to make calibration in GWLF [53].
3. Results
3.1. Calibration and Validation of GWLF Model
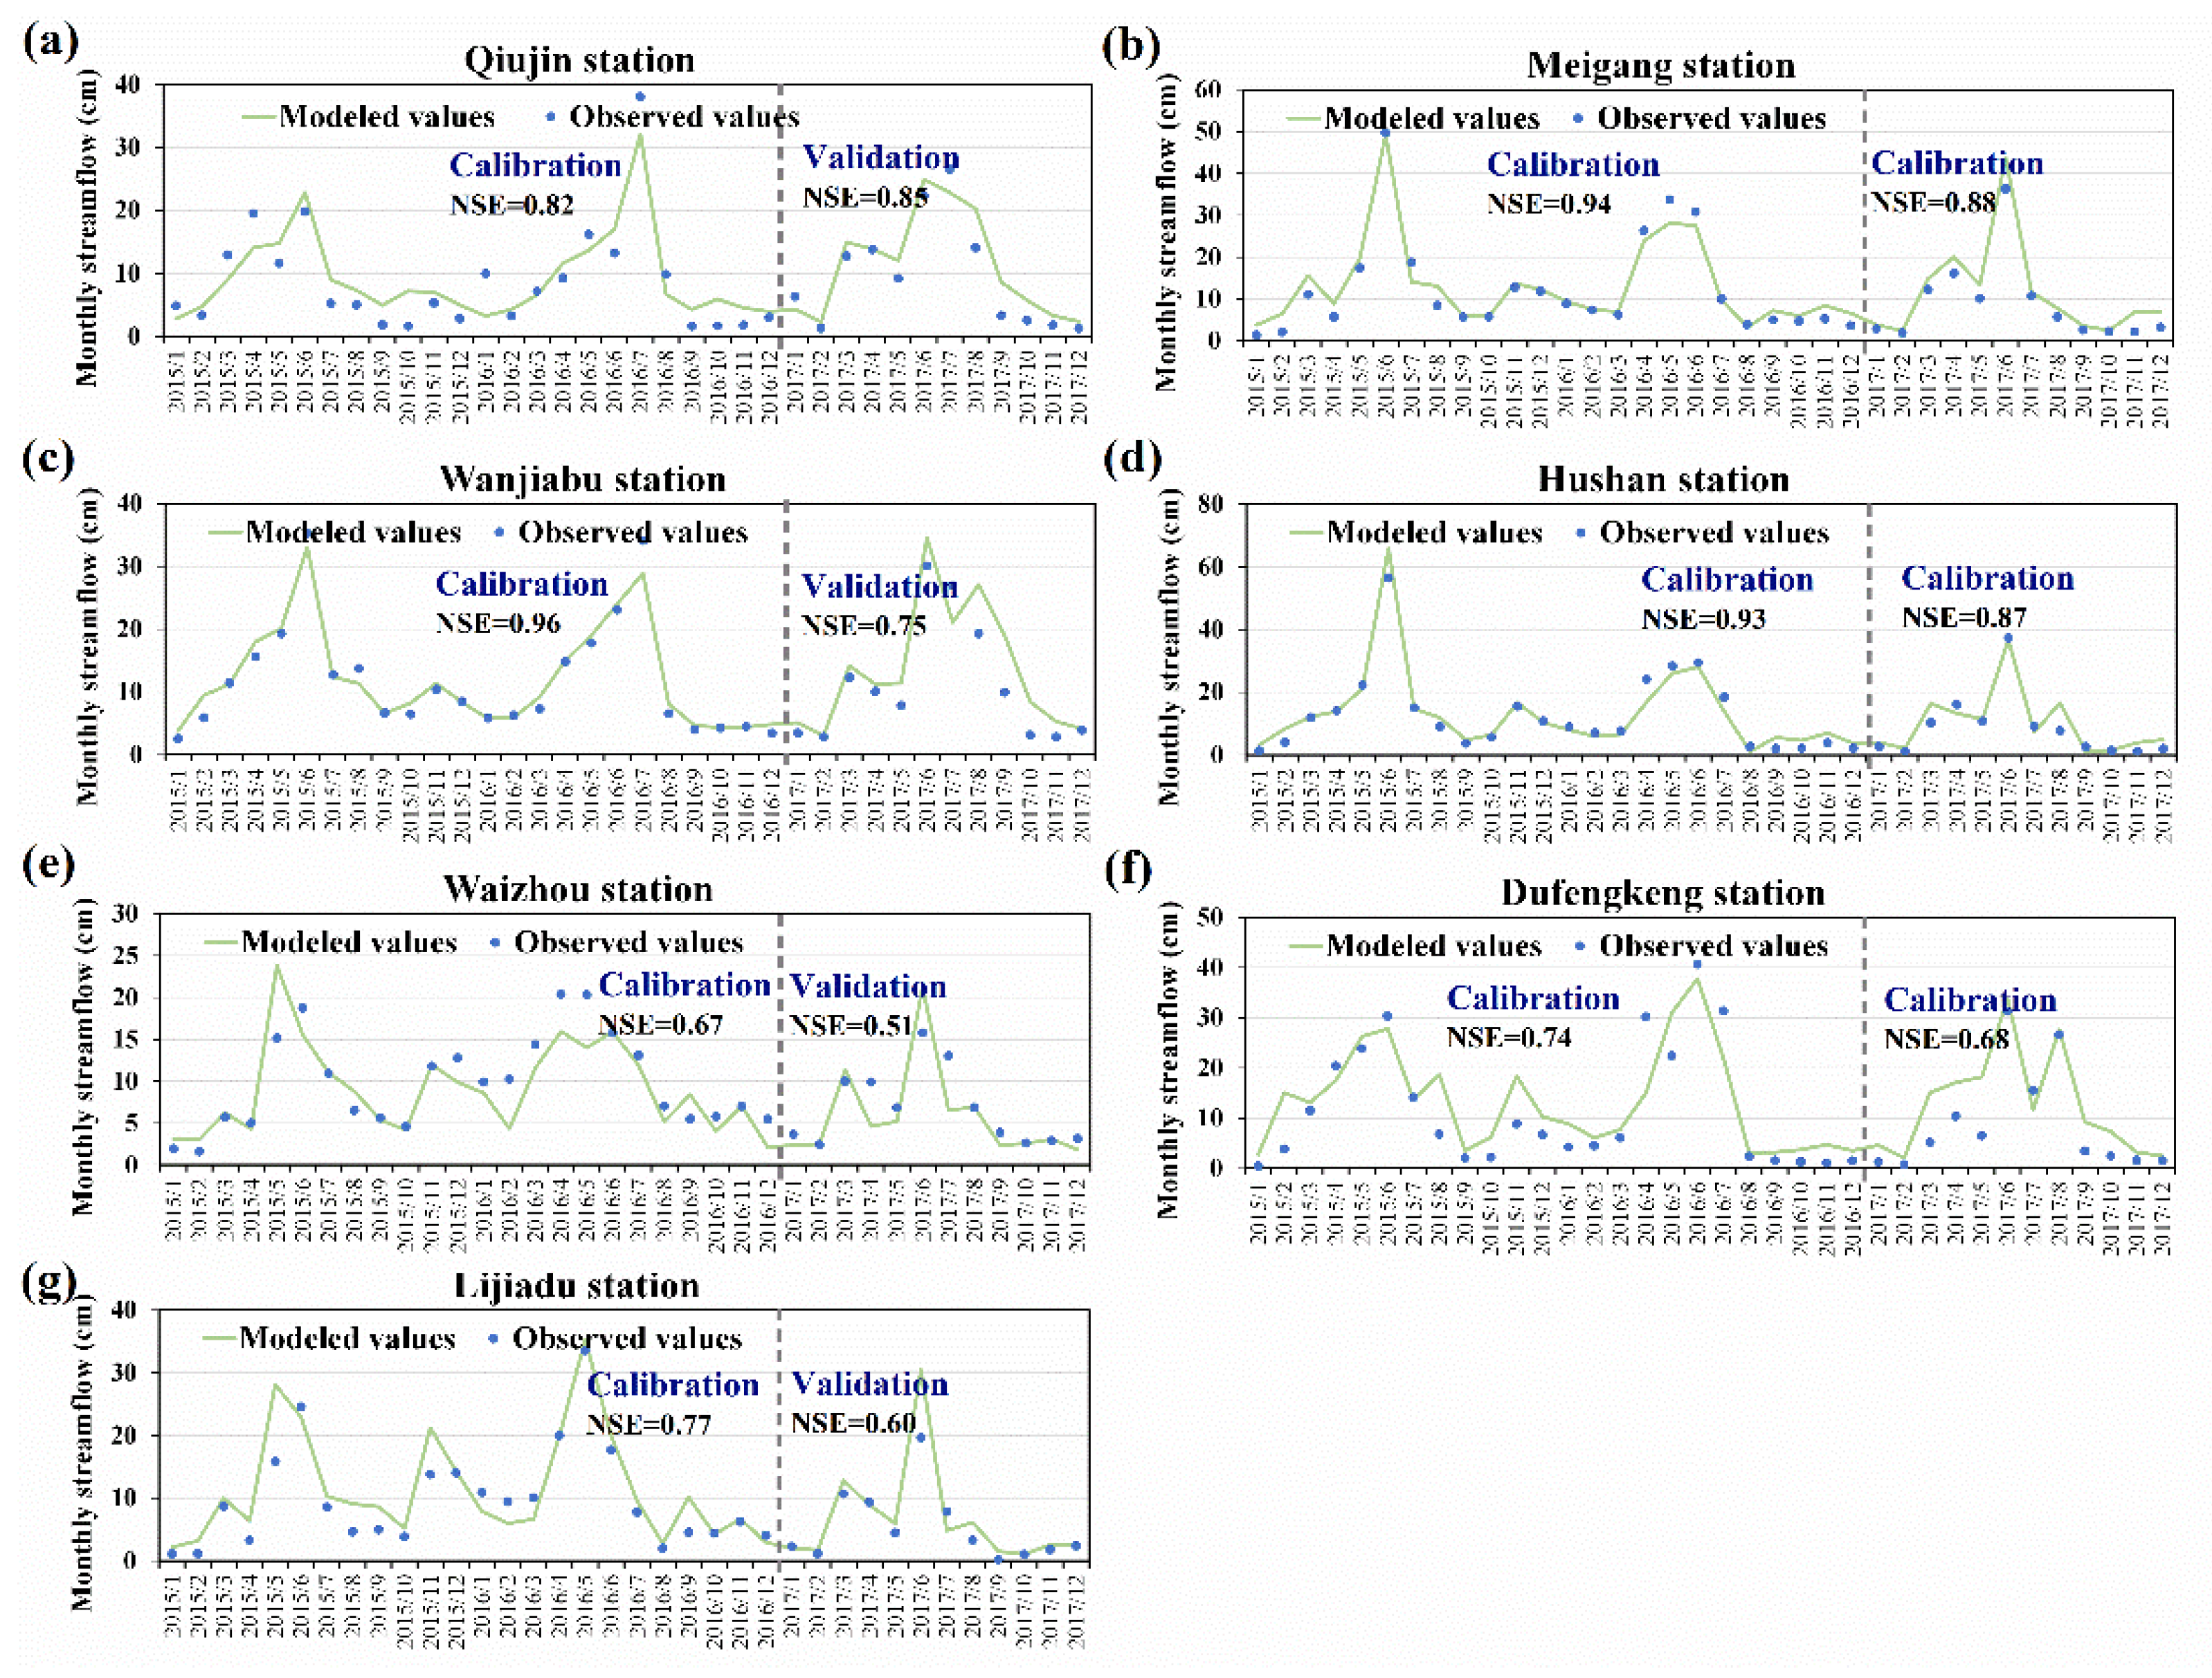
The period from 2015 to 2016 was chosen for model calibration, and 2017 was used for model validation of streamflow. The parameters used during calibration were recession coefficient, seepage coefficient, and SCS curve numbers of different land use types. The optimized parameters are listed in Table S3. The Nash–Sutcliffe efficiency (NSE) is provided to analysis the model performance. Figure 4 shows the results of calibration and validation at seven gauged stations in PLB. The NSE of calibration ranges from 0.67 to 0.96, while the NSE of validation ranges from 0.51 to 0.88. Such results indicate an acceptable predictive capability of GWLF to estimate streamflow.
3.2. Calibration of SPARROW Models and Uncertainty Analysis
3.2.1. Calibration of SPARROW Models
NWLS calibration of SPARROW models in 2017 was executed, based on 58 and 144 water quality stations in PLB and HRB, respectively. The correlation coefficient (R2), the mean square error (MSE), the root mean square error (RMSE), and the NSE (see Table 1) were assessed to evaluate the performances of the models.
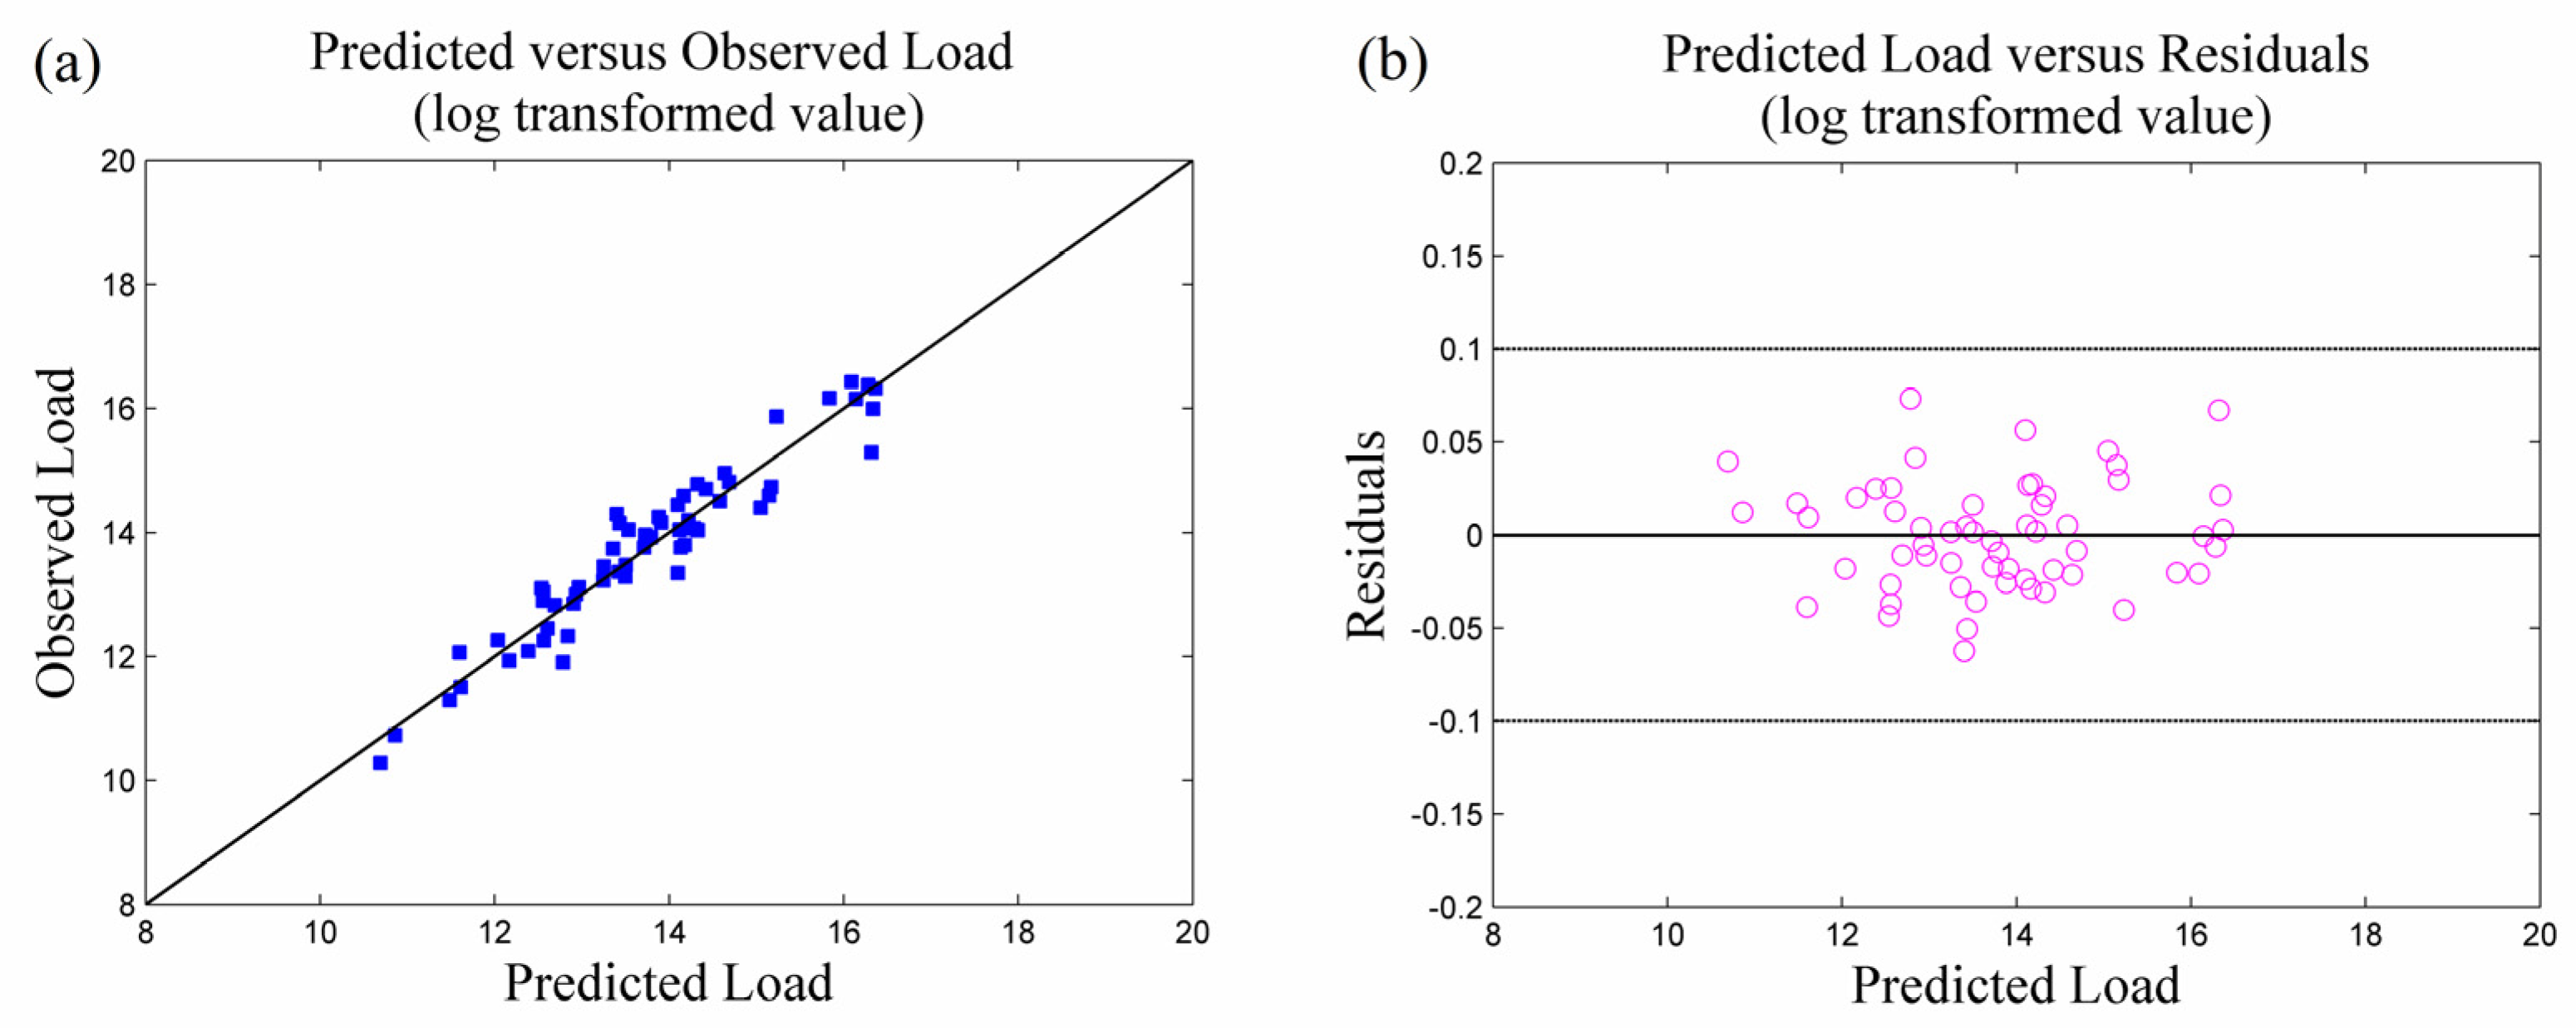
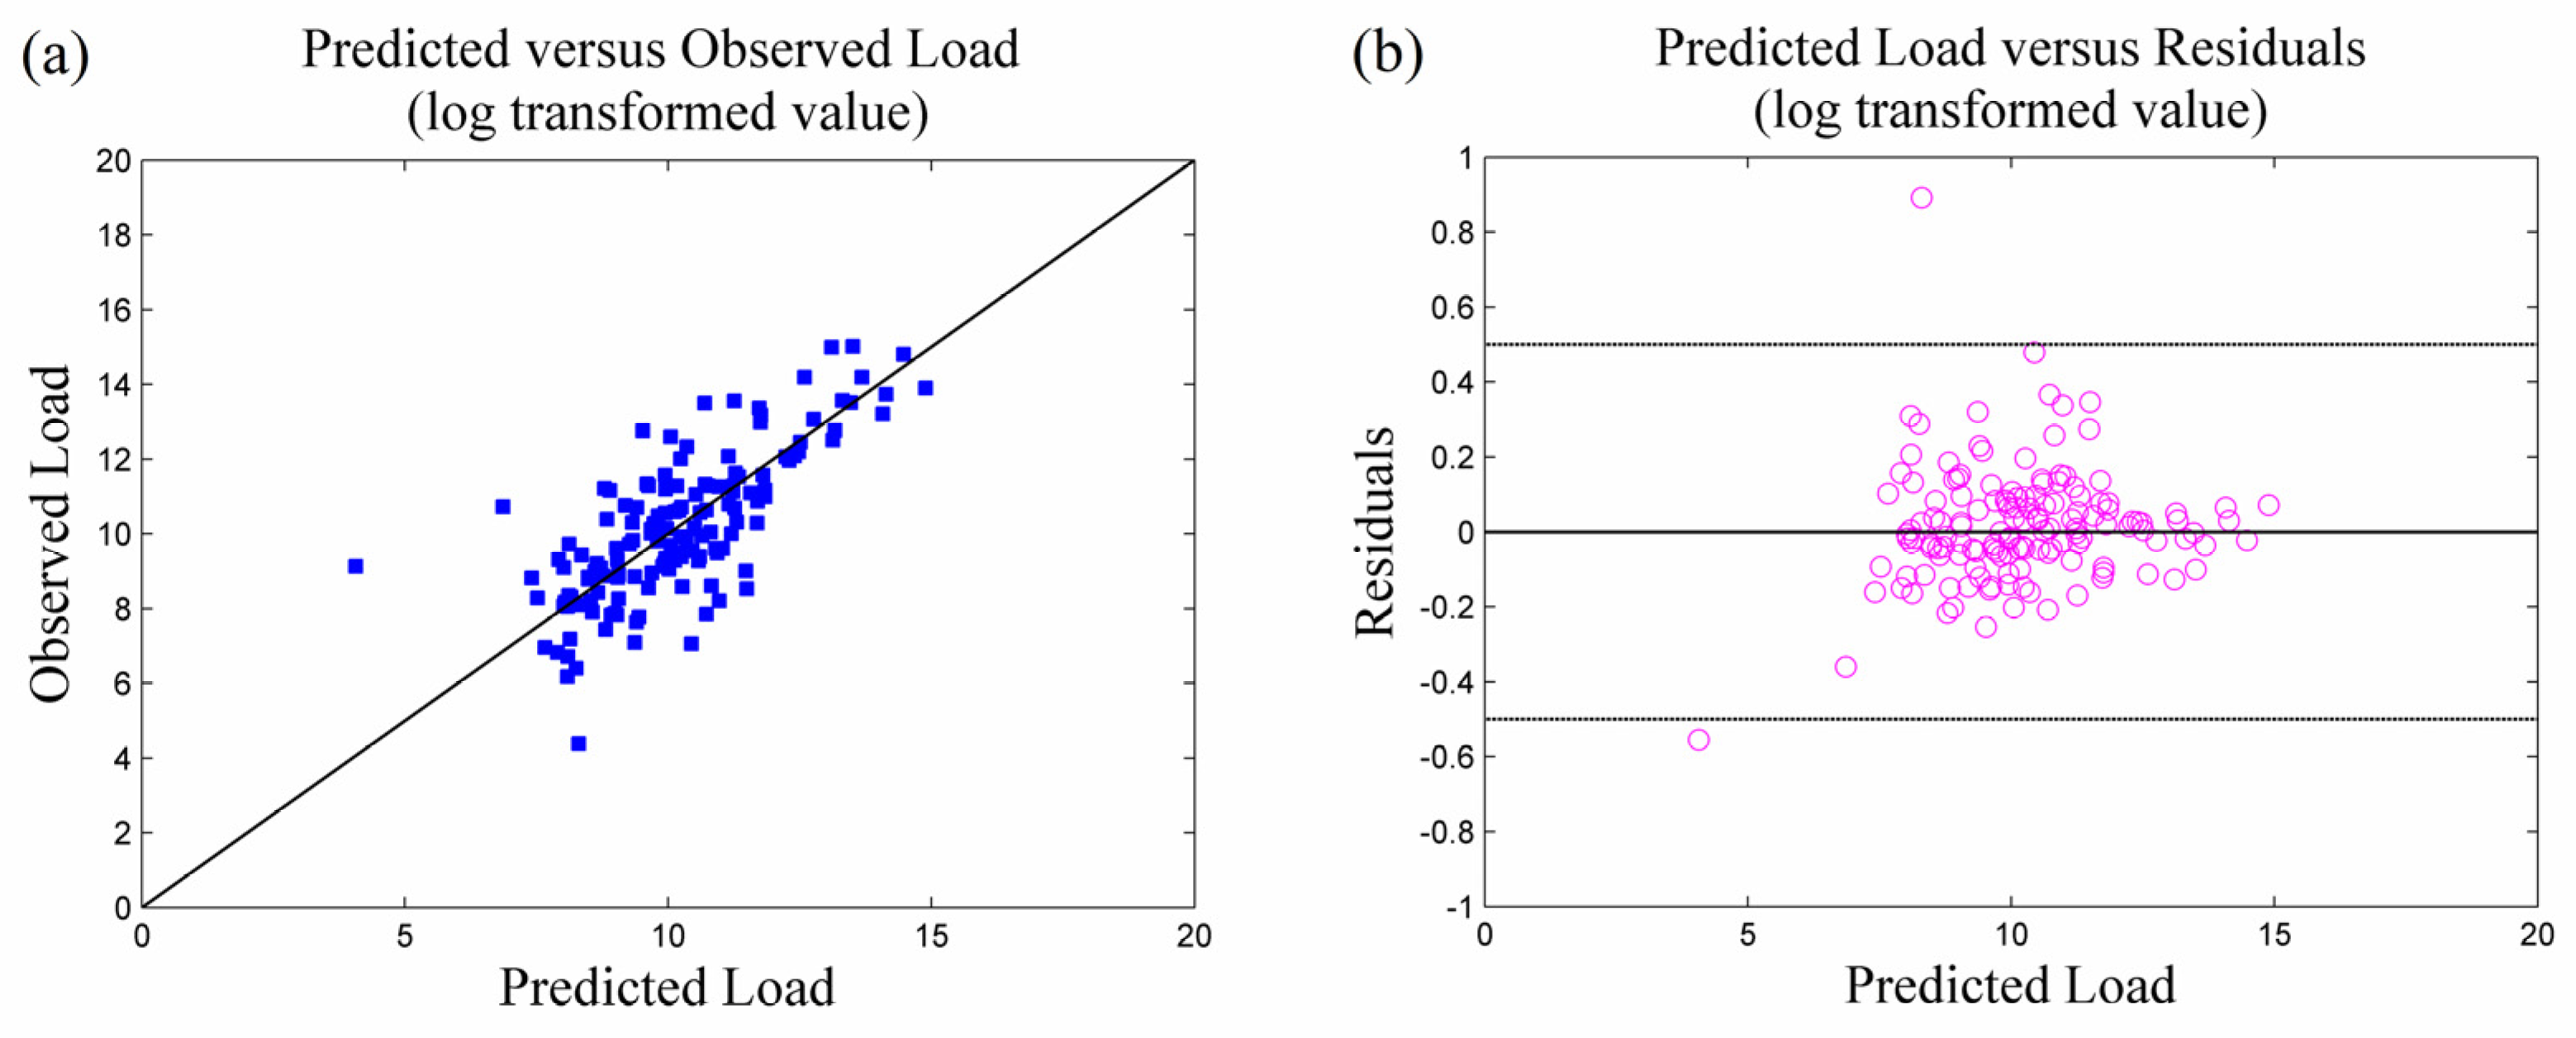
For the results of SPARROW models for PLB and HRB, the values of R2 were 0.89 and 0.53, respectively, which verified the acceptability of SPARROW models. MSE were 0.25 and 1.91, respectively. The RMSE for the models were around 0.50 and 1.38, respectively. Although the RMSE of HRB was significantly higher, similar values have been reported by other studies (RMSE = 1.40 [54], RMSE = 0.96 [16]). In addition, the NSE values were similar to the R2 values, which indicated the robustness of the models. Figure 5a and Figure 6a are scatterplots of predicted values versus observed values, in which the majority of the points are located in the vicinity of bisection. The scatterplots of residuals illustrated homoscedasticity (Figure 5b and Figure 6b). The aforementioned analysis implied rational performance of the SPARROW models.
3.2.2. Parameters and Uncertainty Analysis
The bootstrap method was used to perform uncertainty analysis of SPARROW model parameters. Point sources, farmland, woodland and grassland, and residential land were considered as the main NH4+-N sources. Table 2 and Table 3 show the evaluation of PLB and HRB, respectively. The coefficients of these sources all fell into the 90% confidence interval. The coefficients of farmland, woodland and grassland, and residential land were larger than 1, similar to the coefficients reported in other studies [55,56]. The coefficients of point sources were lower than 1, which suggested overestimates in the data of point sources.
Slope, average precipitation, and temperature were chosen as the land-to-water delivery variables for the SPARROW models. The coefficients of these sources all fell into the 90% confidence interval. Point sources and average precipitation showed statistical significance (p < 0.05) for PLB, while only average temperature showed statistical significance (p < 0.05) for HRB. Both stream decay variables lay in the 90% confidence intervals for PLB and HRB. Meanwhile, only the reach decay factor of a small river showed statistical significance (p < 0.05) for HRB.
3.3. Nutrient Estimates
3.3.1. Nutrient Load
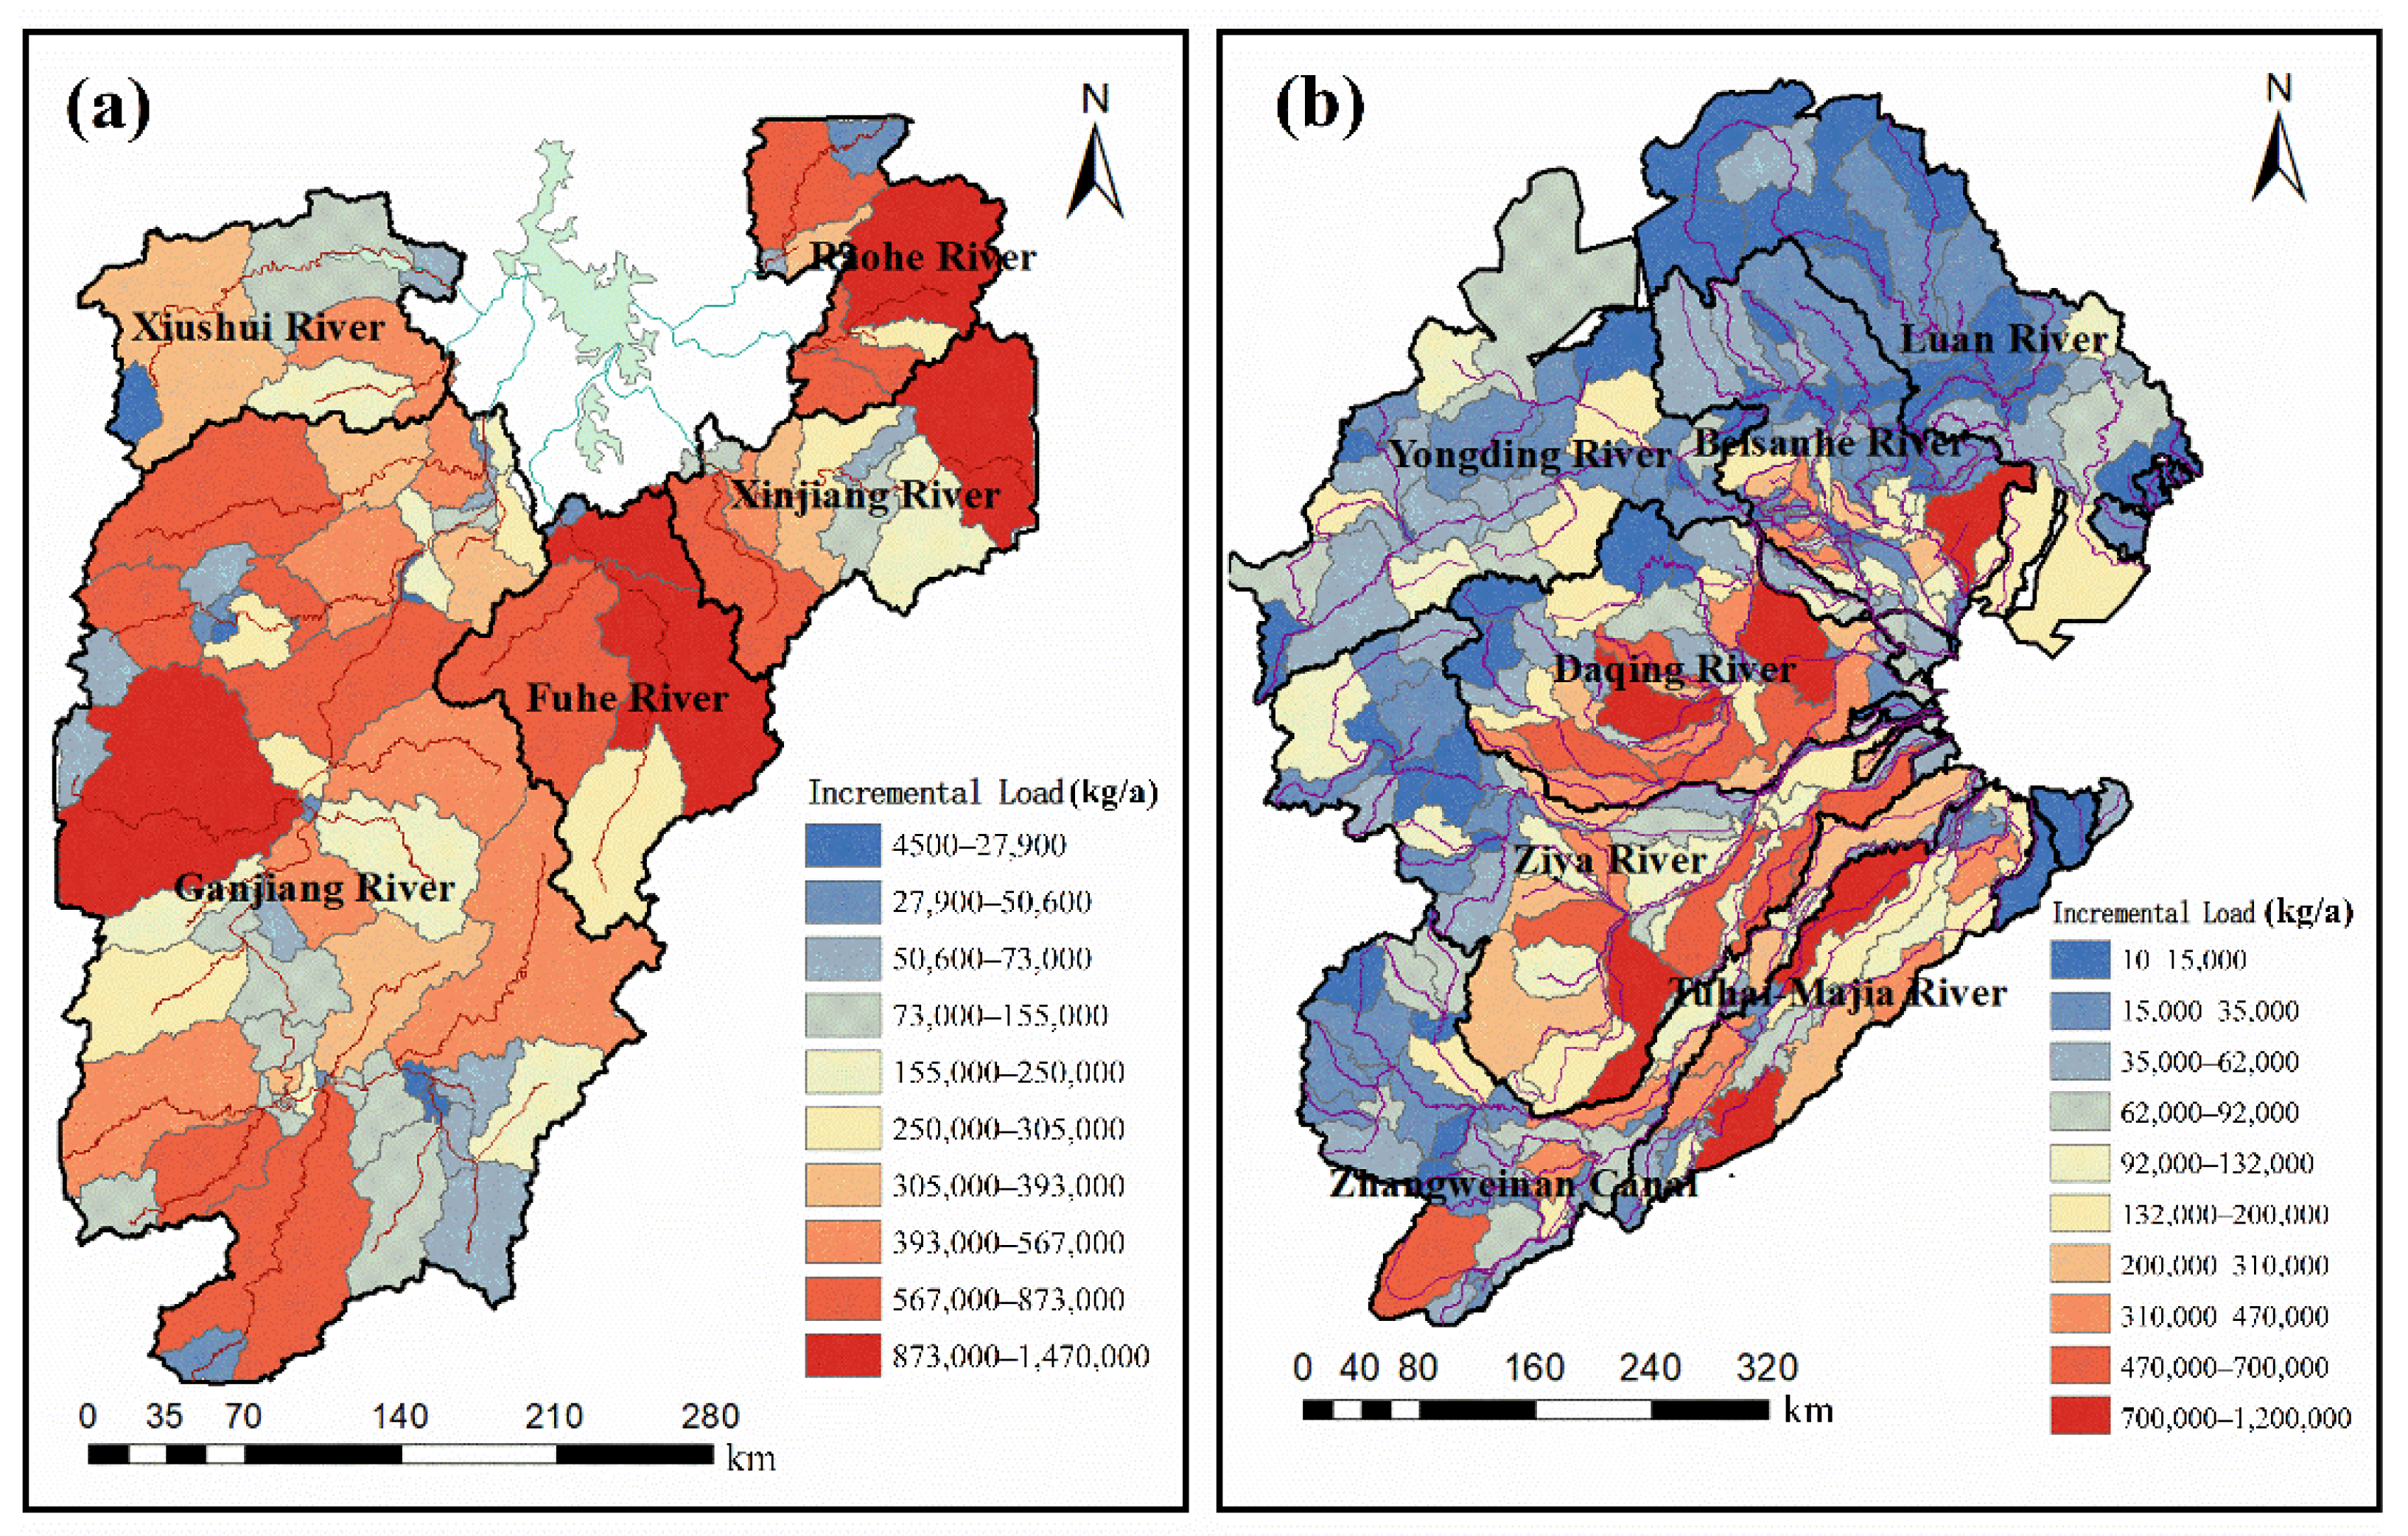
Figure 7a,b show the incremental loads of NH4+-N in each catchment in PLB and HRB. The incremental load ranged from 4513 to 1,468,867 kg/year in PLB. The middle reach of Ganjiang River delivered the maximum incremental NH4+-N load to Poyang Lake (Figure 7a). Fuhe River’s downstream catchment and the upstream reach of Raohe River had large load deliveries. The upstream reach of Xinjiang River and the downstream reach of Ganjiang River had large incremental load.
In HRB, the incremental load ranged from 10 to 1,121,252 kg/year (Figure 7b). The upstream reach of Daqing River had the maximum incremental NH4+-N load delivery. The upstream reach of Ziya River and the middle reach of Daqing River made large incremental NH4+-N load deliveries. The upstream reaches of Majia River, Beisanhe River, and Zhangweinan Canal; and the downstream portions of Beisanhe River and Tuhai River, had large incremental NH4+-N load.
3.3.2. Nutrient Sources
Nutrient source apportionment was analyzed for the major river watersheds in PLB and HRB (Table 4 and Table 5, respectively) [57]. On average, NH4+-N from point sources (industrial and sewage discharge), farmland, woodland and grassland, and residential land accounted for 43.09%, 32.14%, 10.70%, and 14.07%, respectively, in PLB. Point sources were the main NH4+-N sources in the Ganjiang, Fuhe, Xinjiang, and Xiushui River watersheds. In the Raohe River watershed, farmland was the dominant NH4+-N source.
In HRB, NH4+-N from point sources (industrial and sewage discharge), farmland, woodland and grassland, and residential land accounted for, on average, 23.51%, 38.48%, 4.14%, and 33.87%, respectively. In Luanhe, Yongding, Ziya, Zhangweinan Canal, and Tuhai-Majia River watersheds, farmland was the primary NH4+-N pollution source. In the Beisihe River watershed, residential land was the dominant NH4+-N source. Point sources were the main NH4+-N sources in the Daqing River watershed.
4. Discussion
4.1. Delivery Fraction
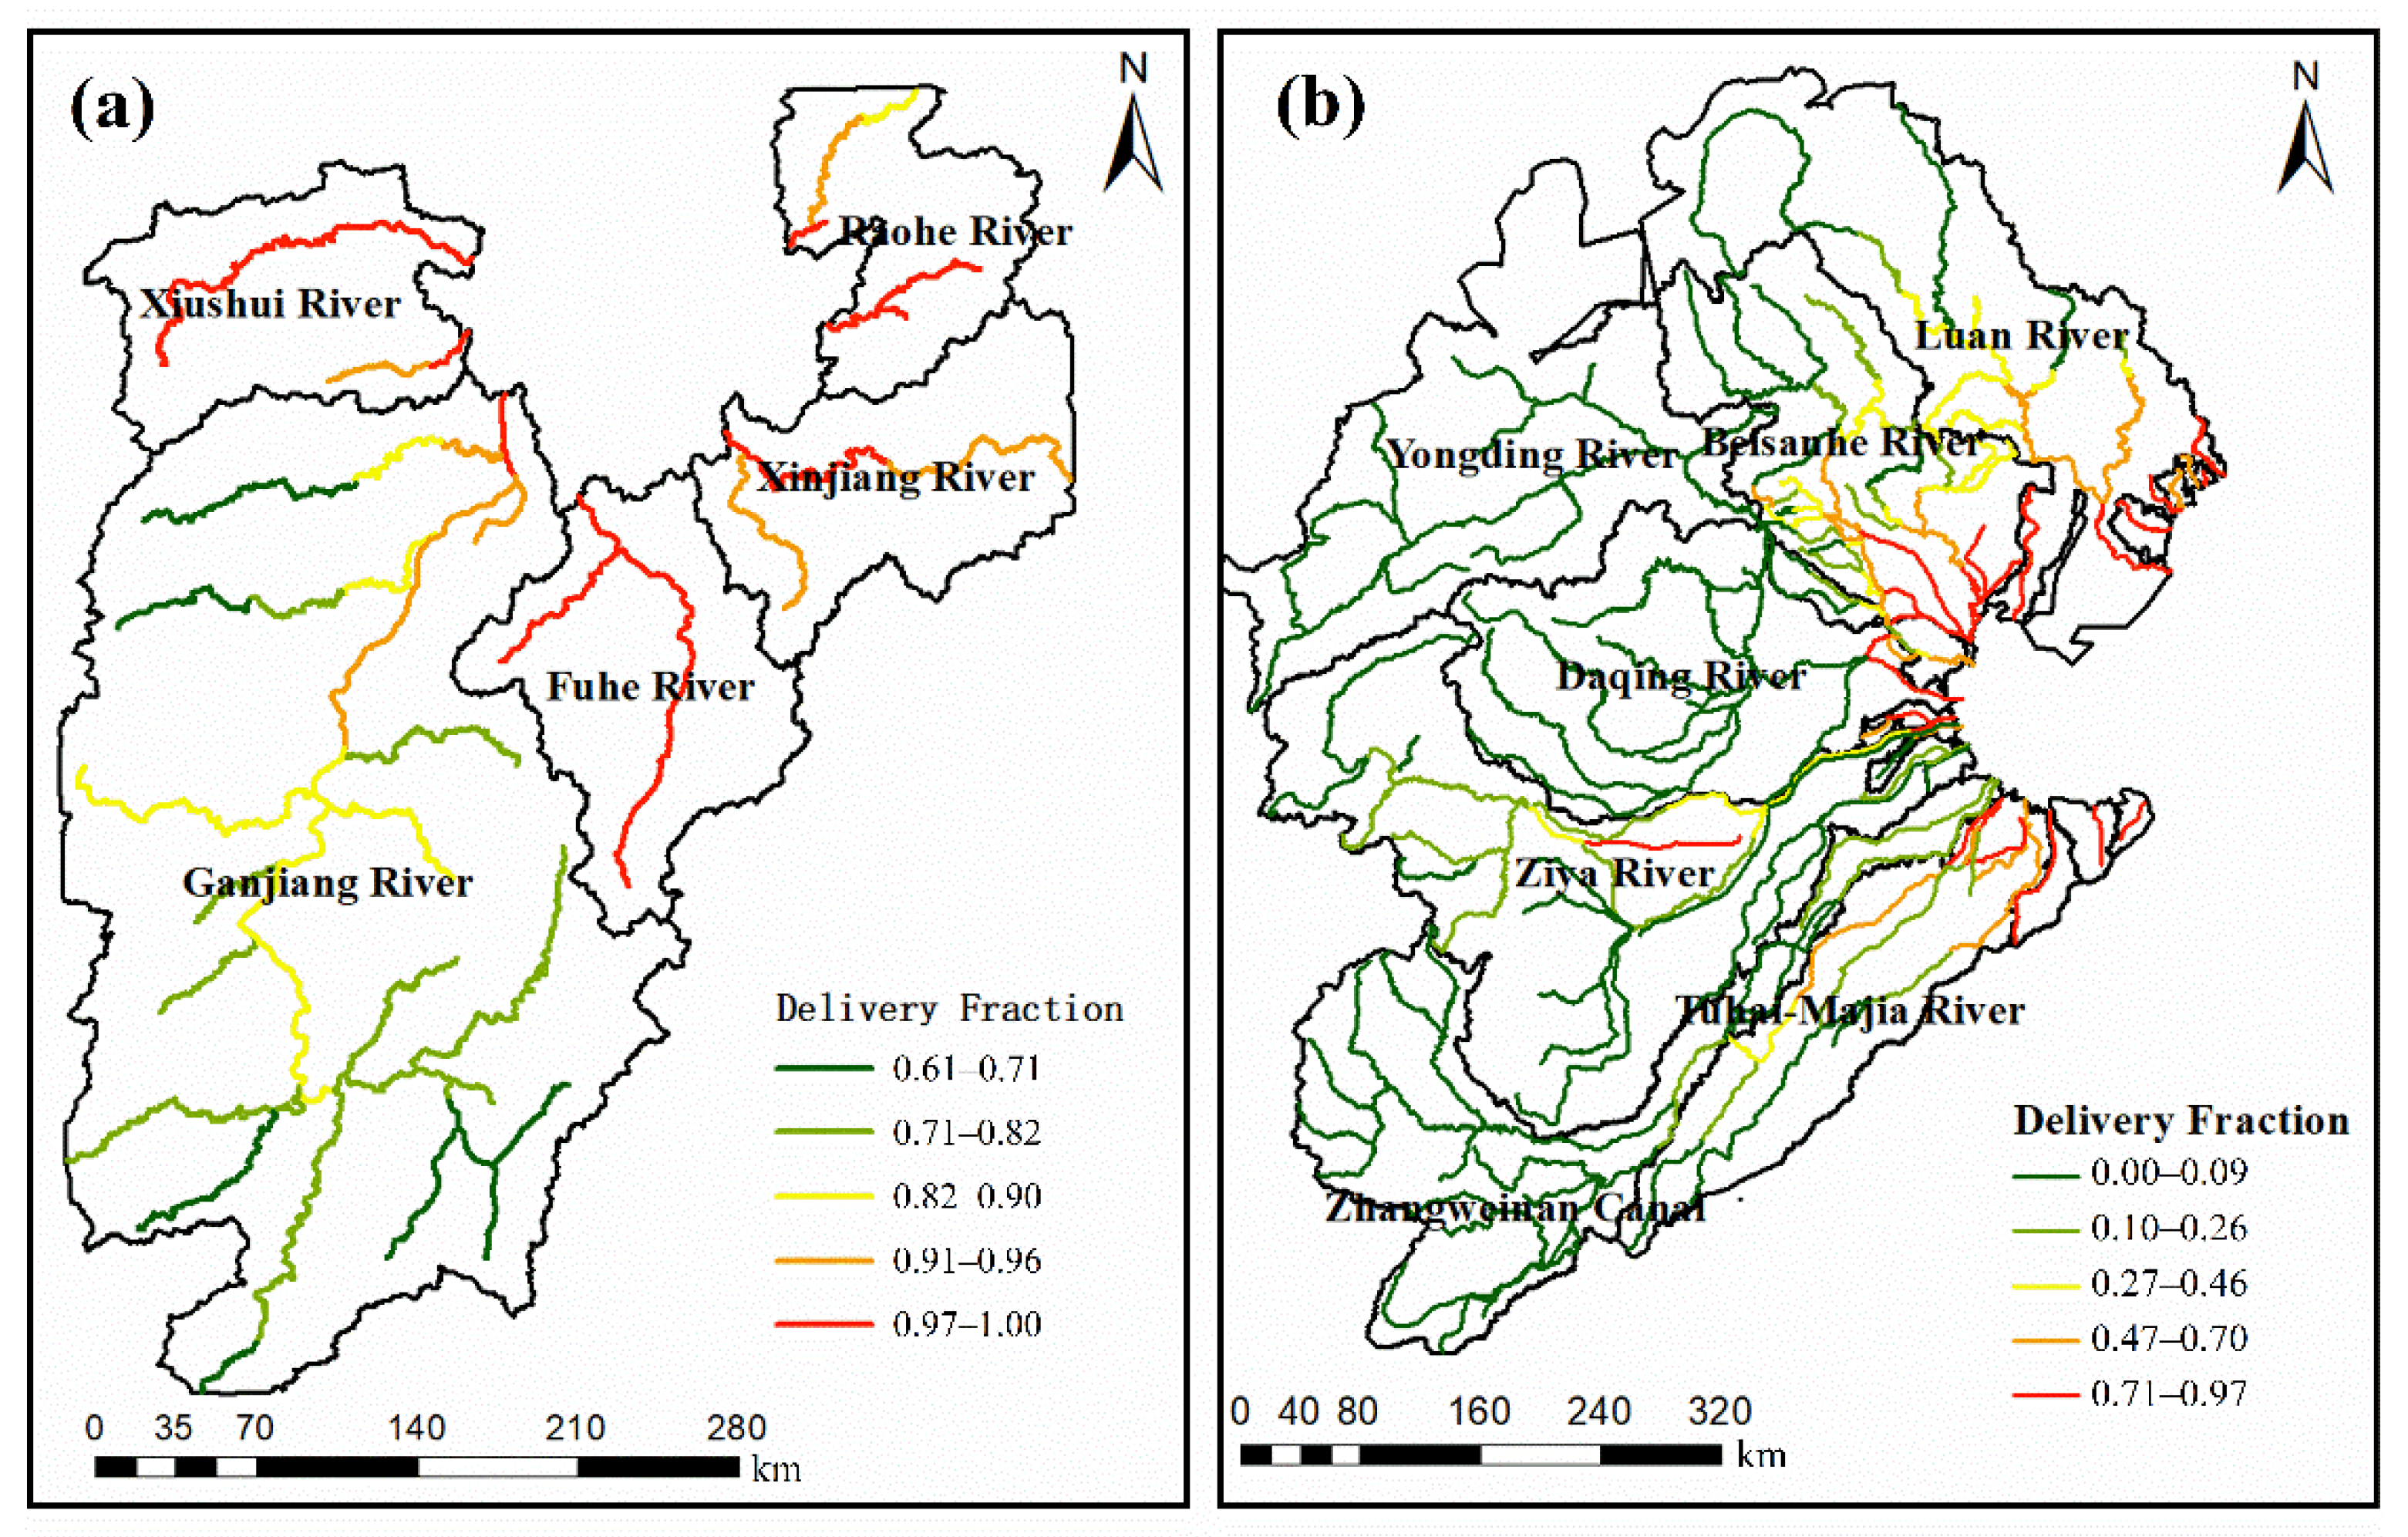
Figure 8 illustrates the fraction of the load that each reach delivered to the target reach through the drainage lines of rivers. The fraction of NH4+-N entering Poyang Lake from rivers ranged from 0.61 to 1.00, with an average of 0.86 (Figure 8a). Meanwhile, the fraction of NH4+-N entering Bohai Bay from rivers in HRB ranged from 0 to 0.99, with an average of 0.22 (Figure 8b). As shown in Figure 8, the delivery fraction of a specific reach is related to its distance to the target reach. In both basins, the delivery fraction decreases as the distance increases. The average delivery fraction of HRB is much lower than that of PLB, because the streamflow of PLB is much larger than that of HRB and the terrain of PLB is steeper than that of HRB.
4.2. Nutrient Delivery to Outlets
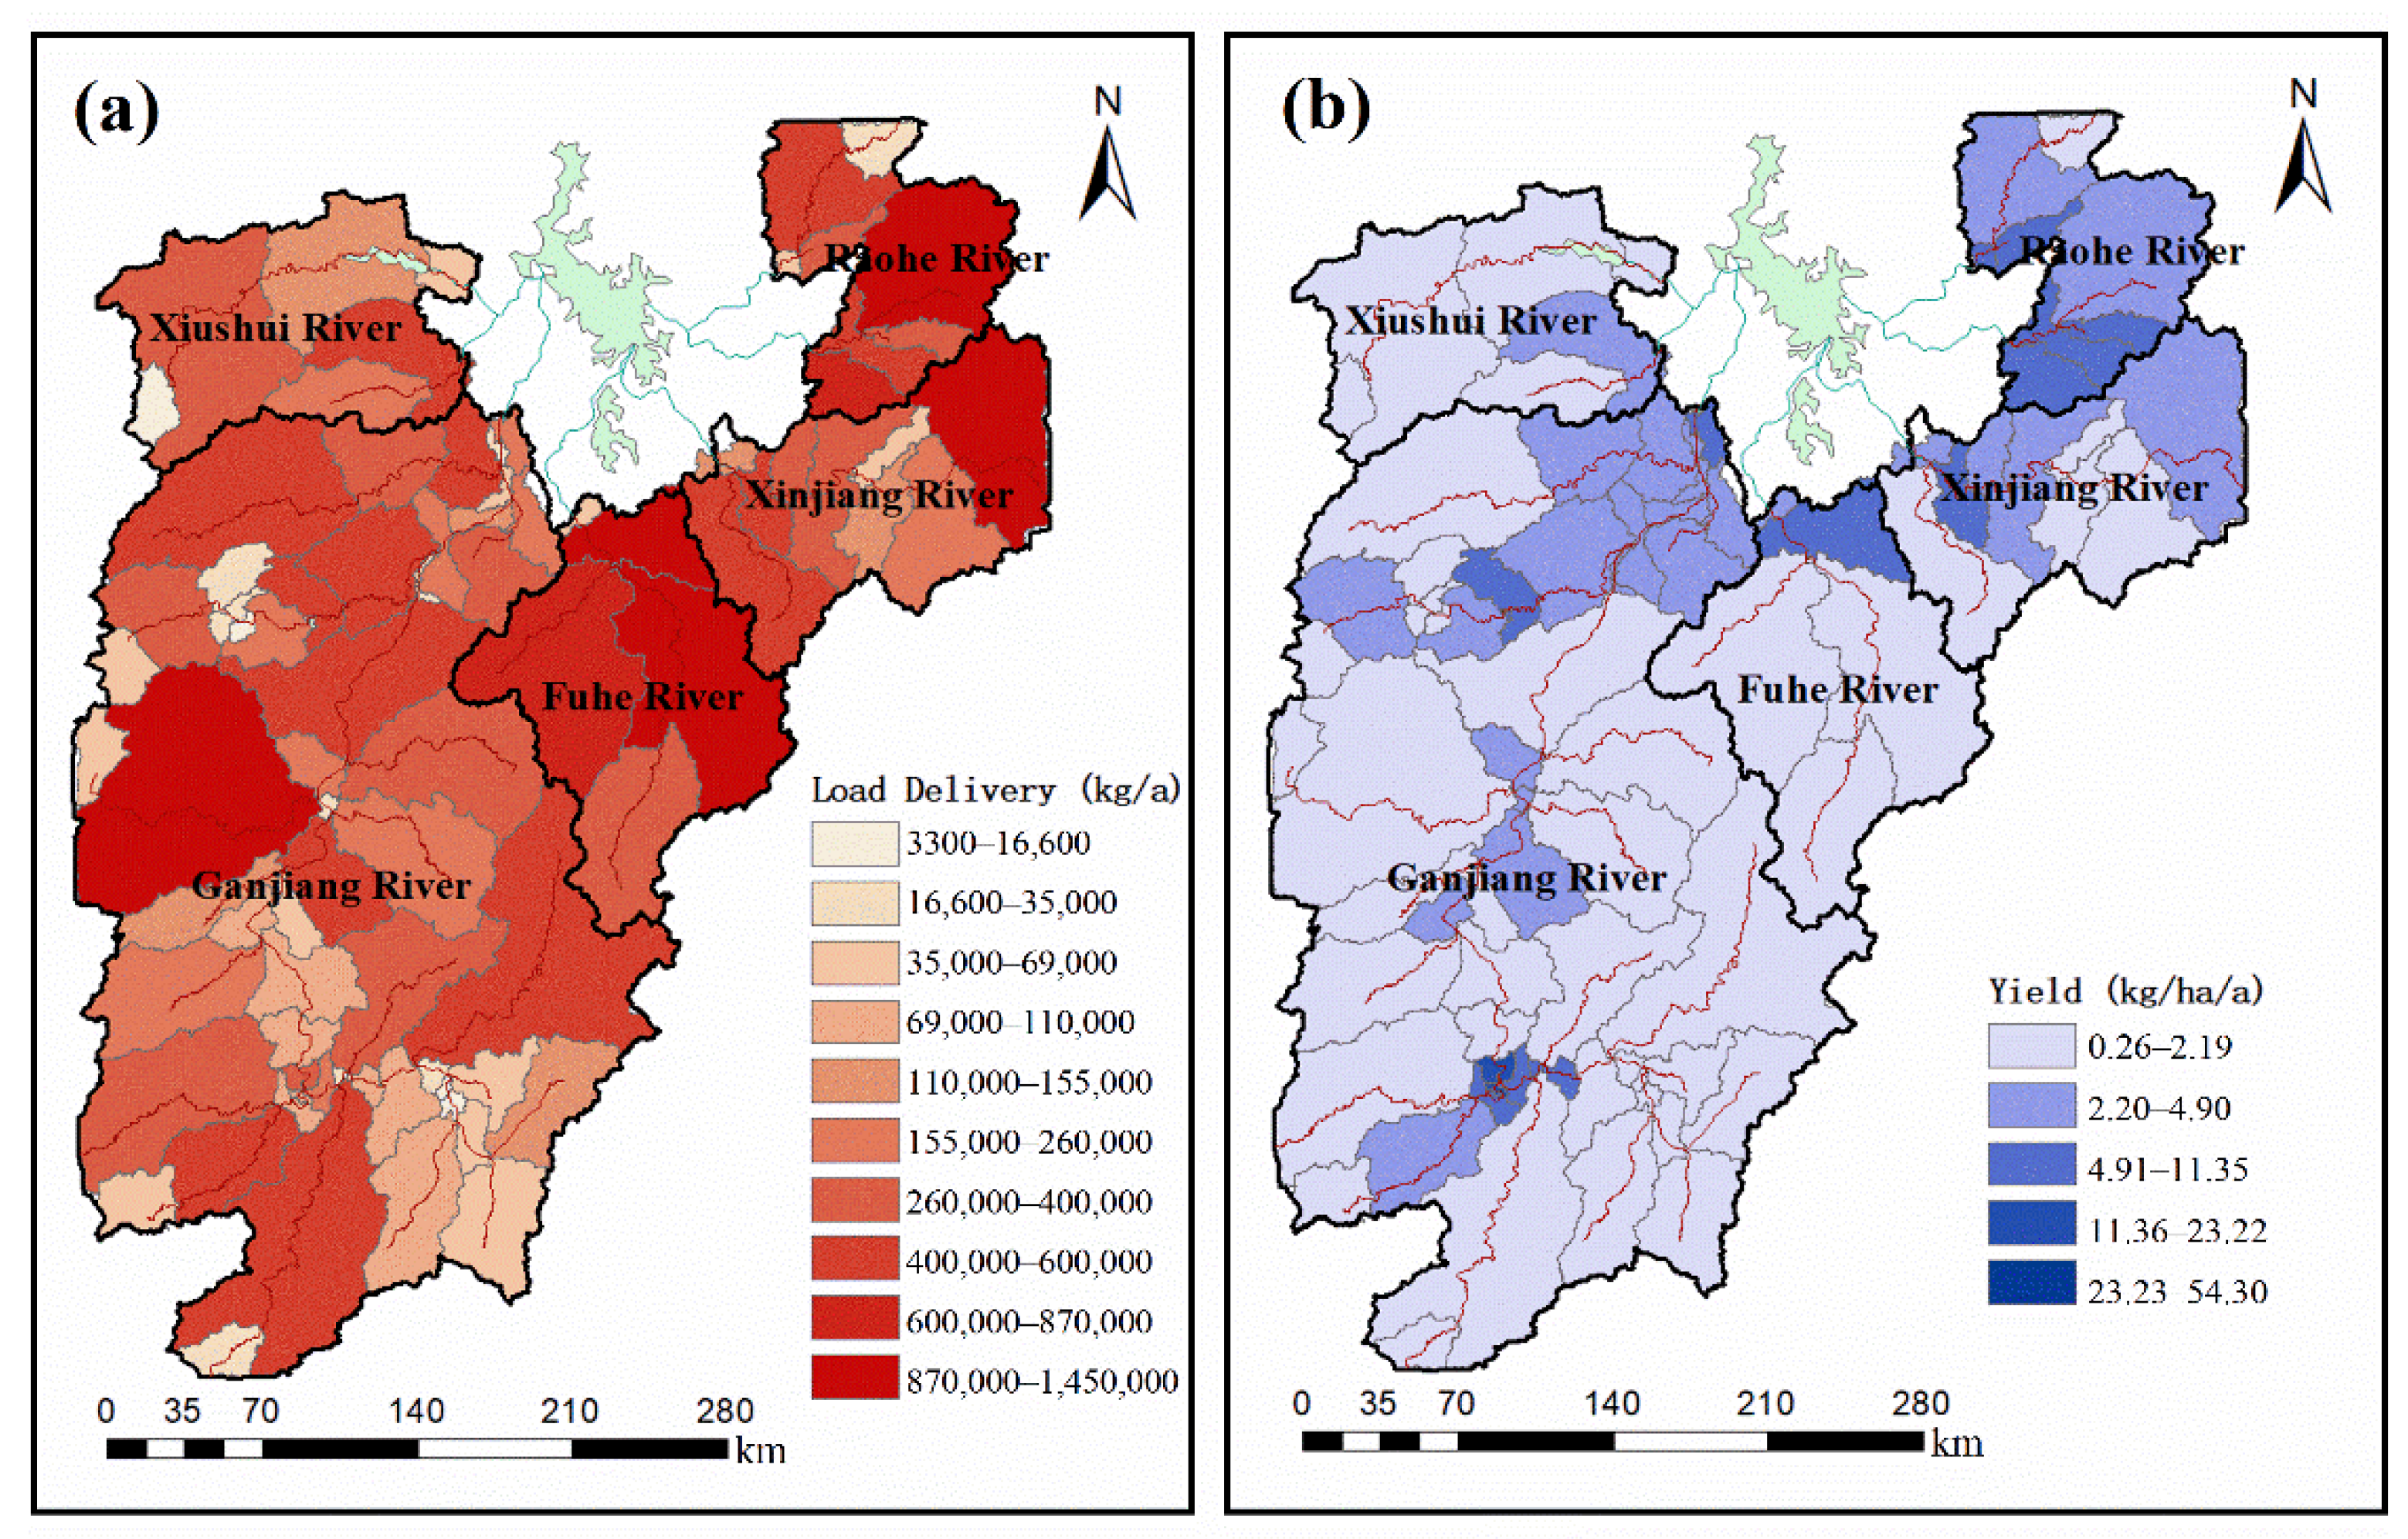
Figure 9 shows the loads and yields of NH4+-N delivered to the target outlets in each catchment in PLB. Figure 10 shows the loads and yields of NH4+-N delivered to the target outlets in each catchment in HRB. Fuhe River’s downstream catchment had the maximum incremental NH4+-N load delivered to Poyang Lake (Figure 9a). The middle reach of Ganjiang River and the upstream reach of Raohe River had large load deliveries. The upstream reach of Xinjiang River and the downstream reach of Xiushui River had large load deliveries.
The yield was calculated as the division of the incremental load of a specific reach delivered to the river watershed outlet by the incremental reach area. Yield reflects the intensity of NH4+-N transferred to the river watershed outlets. Such analysis helps to identify major contributing areas to the water quality of outlets. As shown in Figure 9b, the middle reach of Ganjiang River had the highest NH4+-N yields. The downstream portions of Ganjiang River, Fuhe River, Xinjiang River, and Raohe River had high incremental NH4+-N loads, but the downstream portion of Ganjiang River had a larger NH4+-N yield than the others. These regions belong to the central urban areas of major cities in Jiangxi Province, which is perhaps the reason why these catchments have high yields.
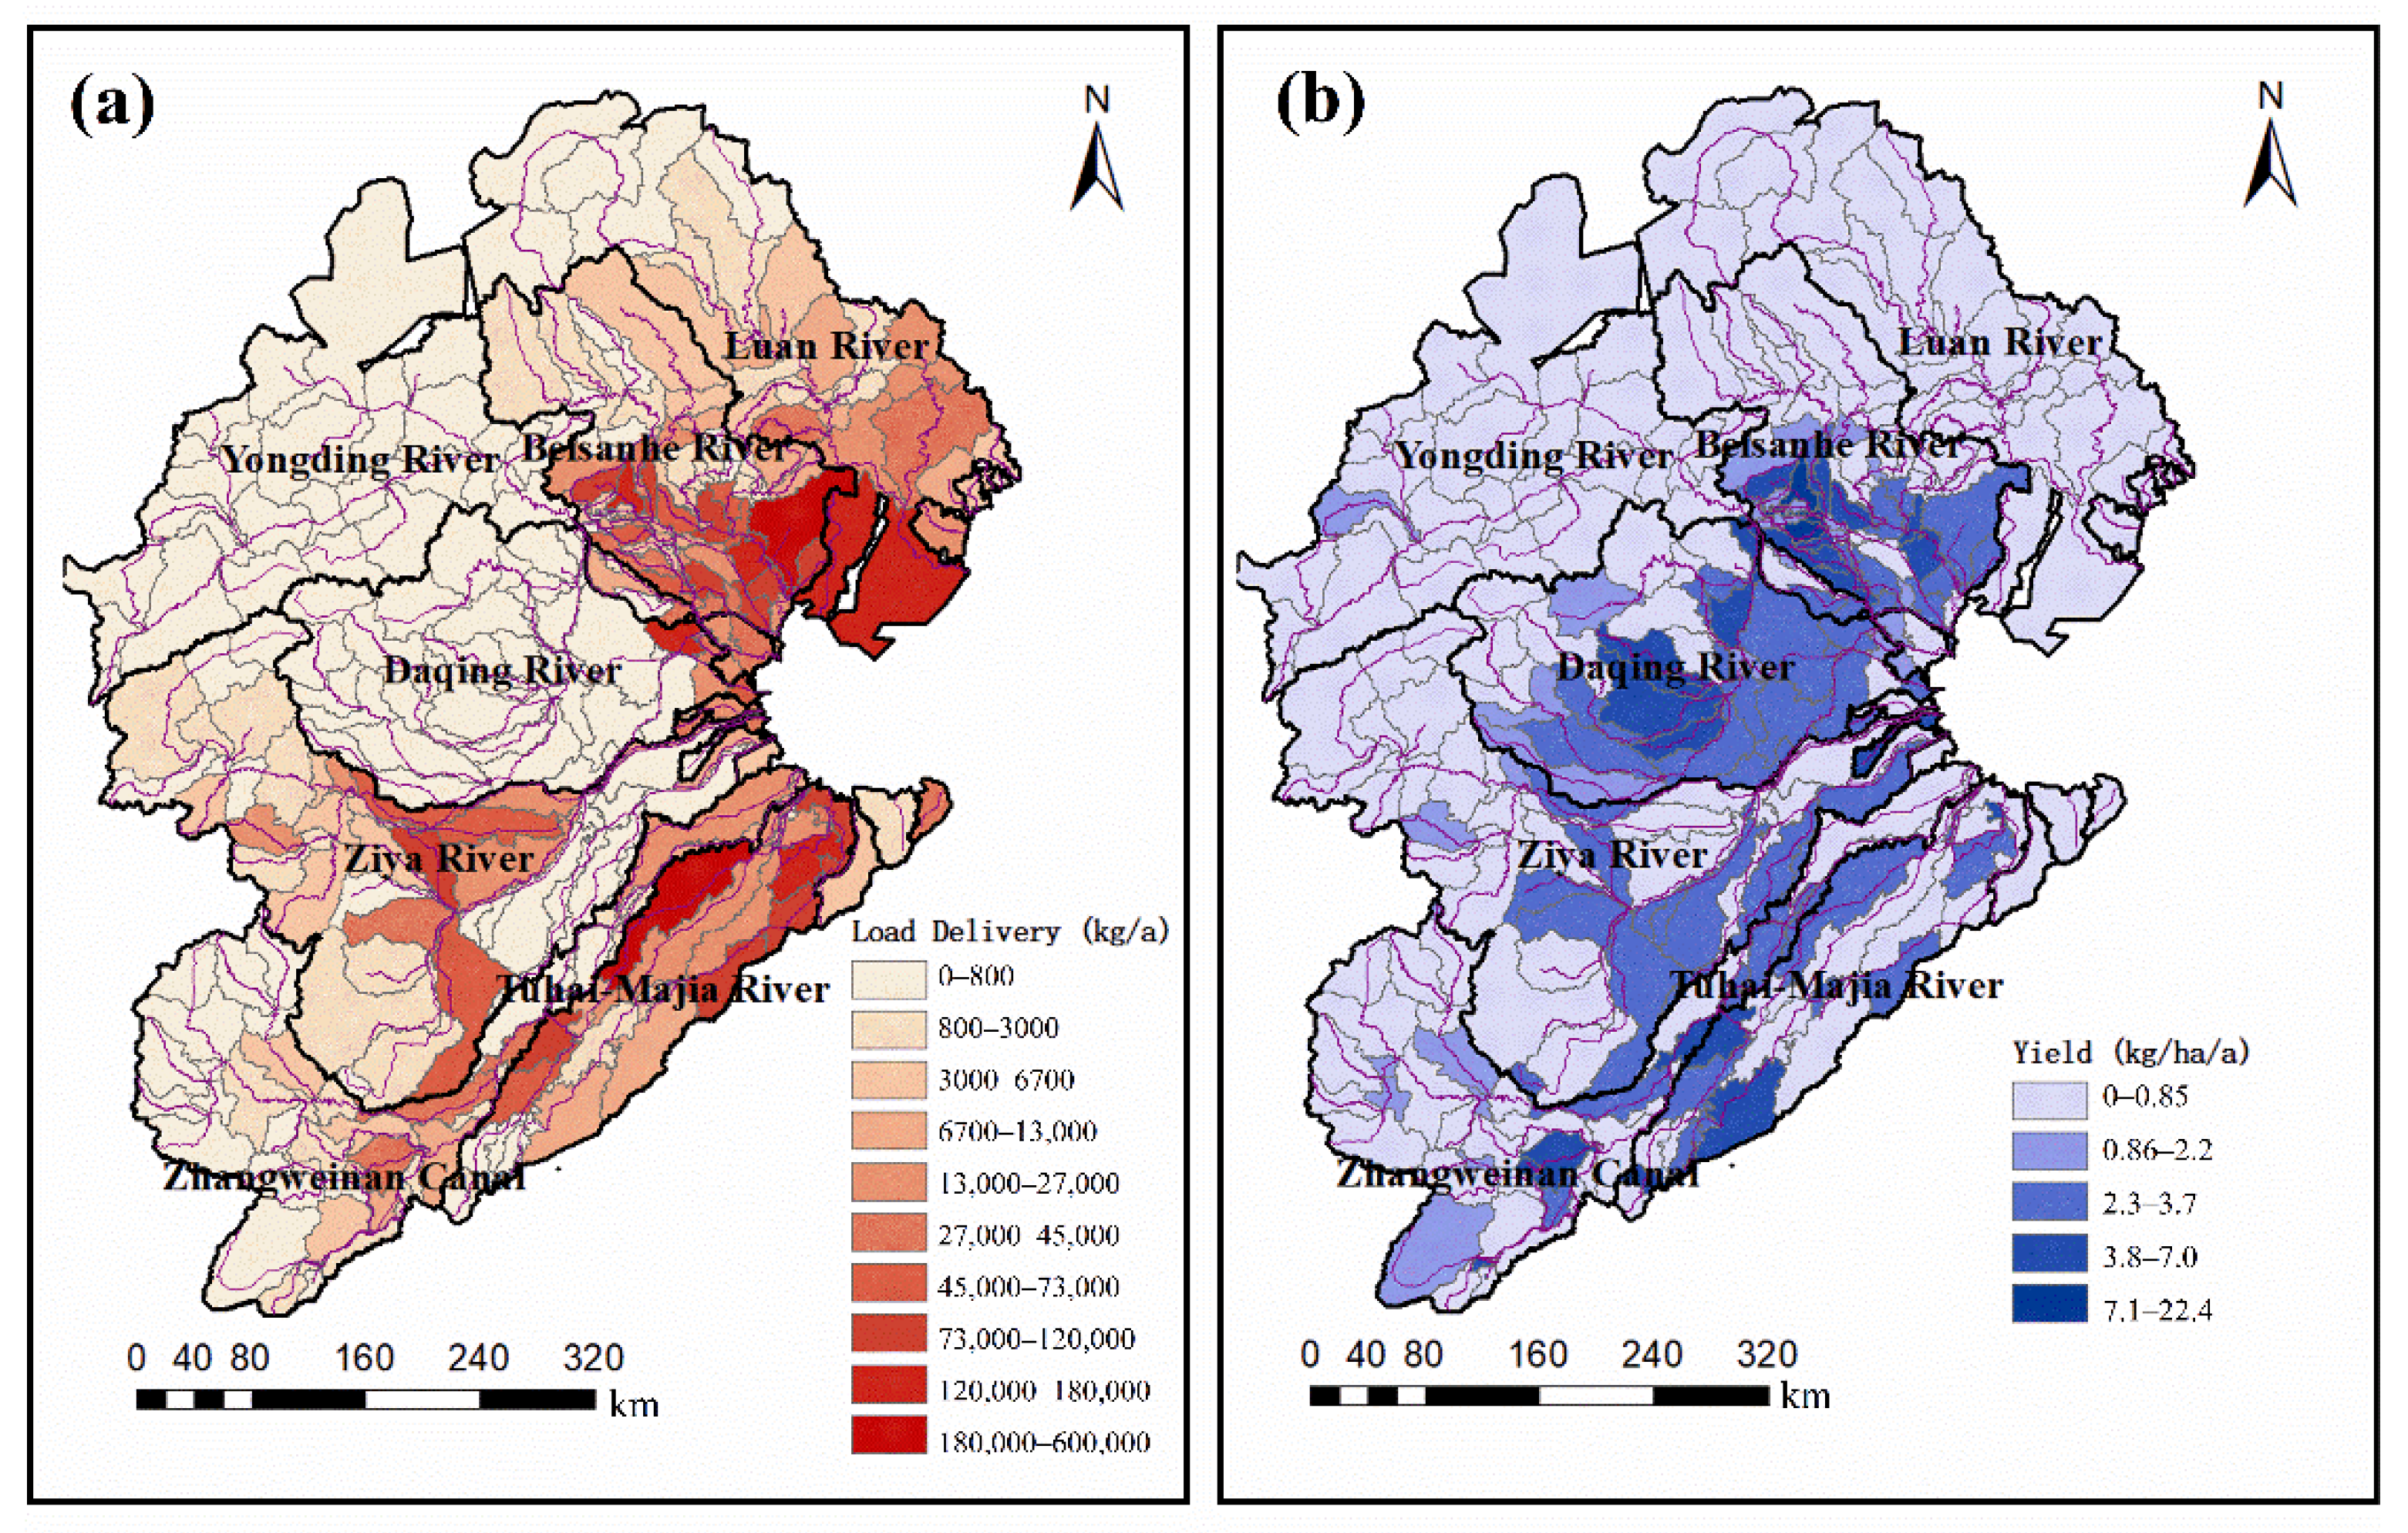
In HRB, the downstream reach of Beisanhe River had the maximum incremental NH4+-N load delivery (Figure 10a). The downstream reach of Tuhai-Majia River had a large incremental NH4+-N load delivery. The downstream reaches of Daqing River and Luan River had large incremental NH4+-N load deliveries.
As shown in Figure 10b, the downstream reach of Yongding River had the highest NH4+-N yield. The middle reaches of Beisanhe River and Daqing River had higher NH4+-N yield than their downstream reaches. The middle reaches of Zhangweinan Canal and Tuhai-Majia River also had high NH4+-N yields.
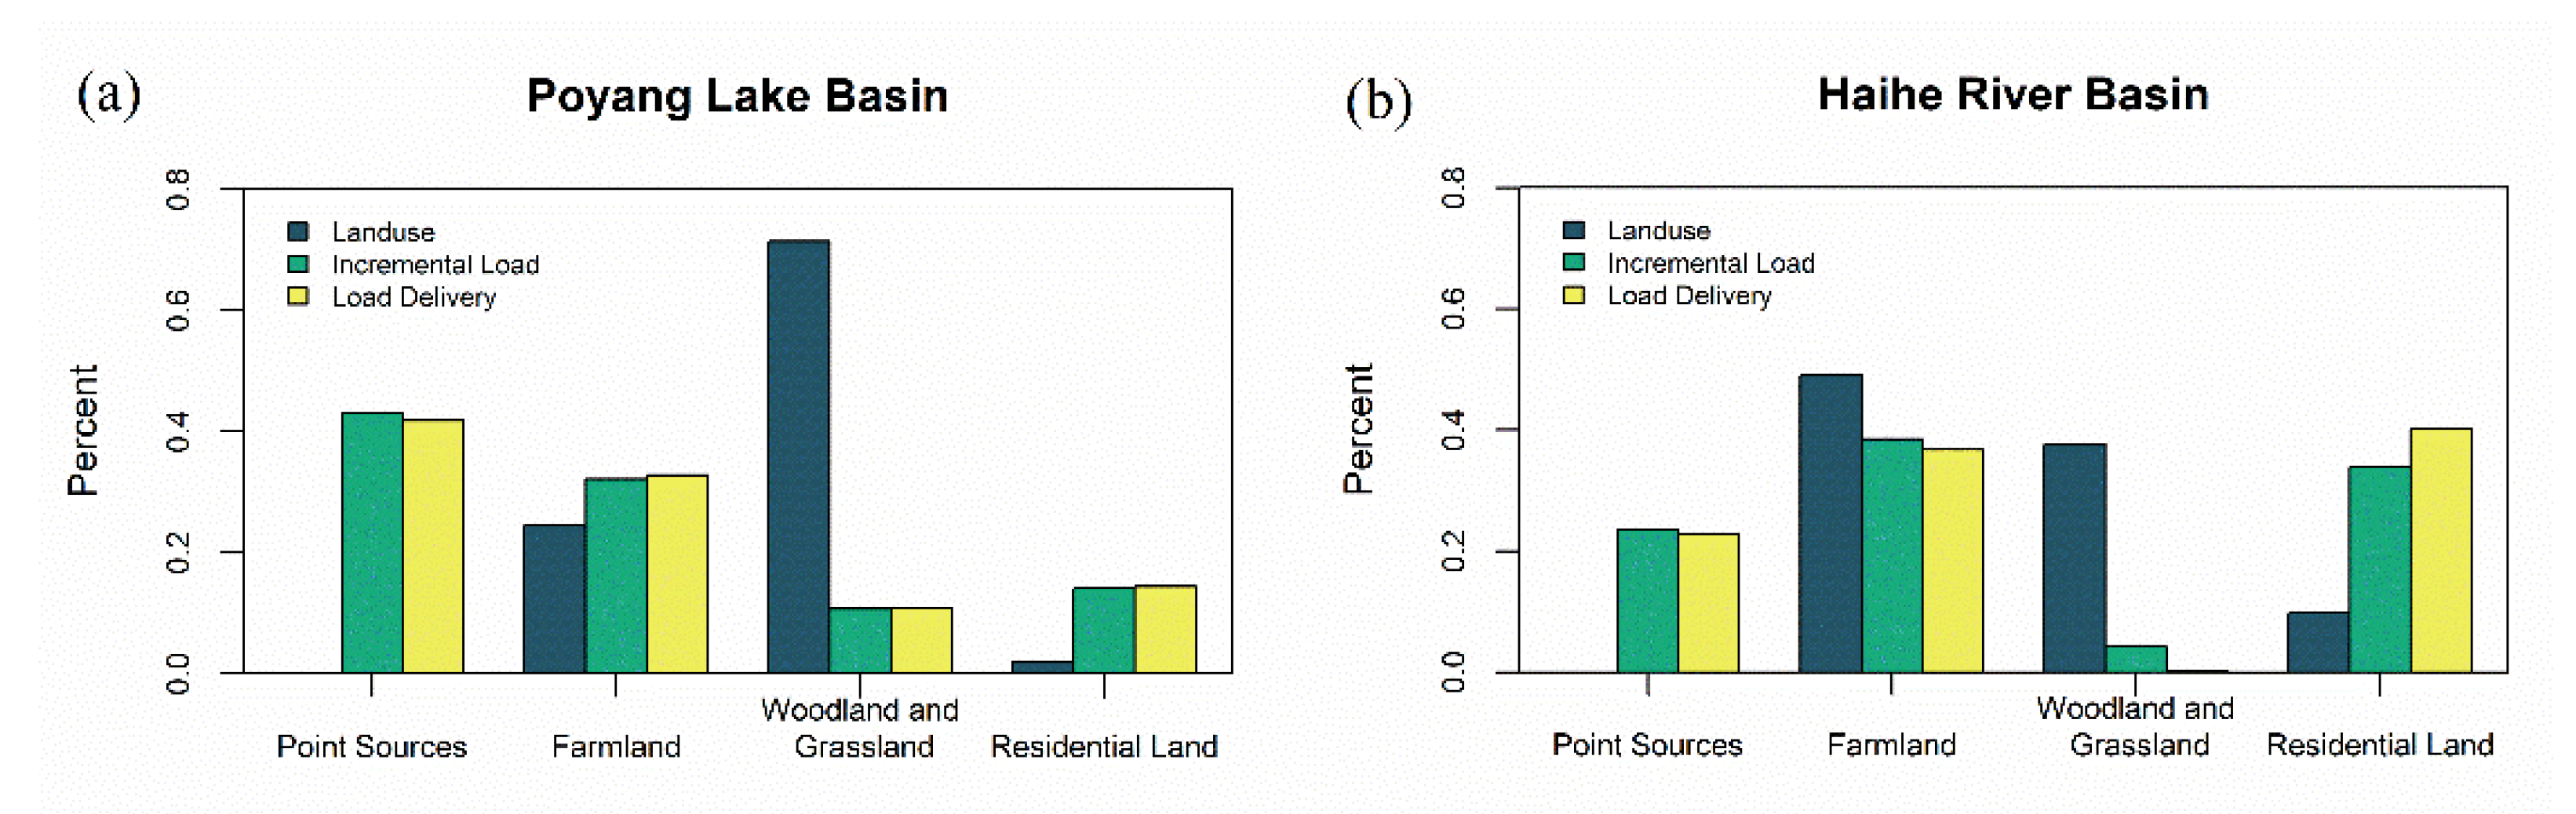
By combining incremental load, load delivery, and yield results, it could be found that the densely populated area in both PLB and HRB contributed the most to the NH4+-N load. However, the difference between the two basins was that the point sources of PLB played the dominant role in the transport of load delivery, whereas the residential land was the dominant sources of load delivery in HRB, as shown in Figure 11. The contributions of farmland in both basins cannot be omitted, either. In PLB, NH4+-N load delivery originating from point sources and farmland accounted for 41.83% and 38.84%, respectively. In HRB, NH4+-N load transport originating from residential land and farmland accounted for 40.16% and 36.75%, respectively.
The phenomenon above might be explained by the following reasons. Firstly, the proportion of residential land in HRB was much bigger than that in PLB, and thus the residential land contributed more to the load delivered to the outlets in HRB. Secondly, the streamflow of PLB is much larger than that of HRB, which leads to the decrease of NH4+-N removal in streamflow and makes the point sources the dominant sources in PLB. Lastly, the urbanization and point sources management of PLB might be inferior to those of HRB.
4.3. Strategy for Nutrient Management
Nutrient delivery abatement is vital for the water quality of the receiving waterbody. The results of SPARROW models in this study are meaningful for evaluating NH4+-N load transport, critical regions of high load delivery, and dominant nutrient sources.
Based on the studies above, policies of enhancement were proposed. Since PLB has more water resources and steeper terrain, some upstream and middle reaches still transport large amounts of NH4+-N load to the outlets, similar to the reaches around the lake. Therefore, it is crucial that more attention should be paid to the reaches around the lake and the upstream and middle reaches, which deliver a large amount of NH4+-N load to outlets, especially the centers of big cities. At the same time, the point sources and farmland were recognized as the dominant sources contributing to the load delivered to the outlets in PLB. Consequently, it is important to enhance the management of the point sources in these reaches, such as municipal and industrial wastewater. In addition, since PLB already contains high proportions of woodland and grassland, it is important to establish buffer zones along rivers by planting vegetation or building wetlands, in order to increase the absorption of NH4+-N.
Owing to relatively fewer water sources and more plain terrain in HRB, the middle and downstream reaches contributed more to the NH4+-N load delivered to the outlets. Hence, the management among these reaches should be enhanced. In HRB, the residential land and farmland both have critical positions in the delivery of NH4+-N loads to the outlets, due to the large amount of residential land and the high population density. Consequently, controlling the domestic pollution and reducing the usage of chemical fertilizers are feasible measures to be undertaken urgently. In addition, increasing the woodland and grassland coverage to enhance the retention of nutrients in land areas may be a sound measure to reduce the NH4+-N load delivered to the outlets.
5. Conclusions
The SPARROW model is a spatial explicitly method to address nutrient load and streamflow transport in watersheds. This study developed SPARROW models in two multi-rivers basins in China, which cover large areas in the north and south of China, respectively. These two basins have quite different conditions in many aspects, including weather, water resources, and land use. The SPARROW models were used to evaluate NH4+-N load streamflow transport, critical regions of high load delivery, and dominant nutrient sources in these two basins, which further provided basin-specific advice to the authorities. Based on the results of this study, the point sources and the farmland are the dominant source of NH4+-N entering Poyang Lake, while the residential land and farmland are the major sources of NH4+-N entering Bohai Bay. The following measures should be taken: In PLB, especially among the centers of big cities, it is important to enhance the management of the point sources, such as municipal and industrial wastewater. In addition, it is also advised to establish buffer zones along rivers by planting vegetation or building wetlands, in order to increase the absorption of NH4+-N. In HRB, controlling the domestic pollution and reducing the usage of chemical fertilizers are feasible measures that should be urgently considered. Moreover, increasing the woodland and grassland coverage to enhance the retention of nutrients in land areas may be a sound measure for the reduction of the NH4+-N load delivered to the outlets.
The SPARROW models built for PLB and HRB can serve as references for future uses for different basins with various conditions, extending this model’s scope and adaptability. Remarkably, at twice the size of PLB, HRB has more plain terrain, less water resources and more long-distance canals, which lead to more difficult in its modelling. Hence, the SPARROW model developed in HRB is a worthy possibility for similar research in future.
Supplementary Materials
The following are available online at https://www.mdpi.com/article/10.3390/w14020209/s1, Table S1: Summary of water resources of the main rivers in PLB, Table S2: Summary of water resources of the main rivers in HRB, Table S3: Parameters of GWLF models in PLB.
Author Contributions
Conceptualization, Y.W.; Data curation, H.C.; Formal analysis, J.Y.; Project administration, L.G.; Software, J.Y. and G.L.; Supervision, Y.W.; Visualization, H.C.; Writing—original draft, J.Y.; Writing—review & editing, P.W. All authors have read and agreed to the published version of the manuscript.
Funding
This research was funded by the Major Science and Technology Program for Water Pollution Control and Treatment (2017ZX07301-001).
Institutional Review Board Statement
Not applicable.
Informed Consent Statement
Not applicable.
Data Availability Statement
Publicly available datasets of water resources were analyzed in this study. This data can be found here: Haihe River Water Resources Bulletin 2017, http://www.hwcc.gov.cn/hwcc/static/szygb/gongbao2017/index.html (accessed on 19 November 2021); Jiangxi Water Resources Bulletin 2017, http://slt.jiangxi.gov.cn/resource/uploadfile/file/20180917/20180917112257428.pdf (accessed on 19 November 2021).
Acknowledgments
We wish to thank the Jiangxi Academy of Environmental Sciences for providing streamflow and water quality data of PLB.
Conflicts of Interest
The authors declare no conflict of interest.
References
- Bouraoui, F.; Grizzetti, B. Modelling mitigation options to reduce diffuse nitrogen water pollution from agriculture. Sci. Total Environ. 2014, 468, 1267–1277. [Google Scholar] [CrossRef]
- Chapra, S.C.; Robertson, A. Great Lakes Eutrophication: The Effect of Point Source Control of Total Phosphorus. Science 1977, 196, 1448–1450. [Google Scholar] [CrossRef]
- Xia, X.; Zhang, S.; Li, S.; Zhang, L.; Wang, G.; Zhang, L.; Wang, J.; Li, Z. The cycle of nitrogen in river systems: Sources, transformation, and flux. Environ. Sci. Processes Impacts 2018, 20, 863–891. [Google Scholar] [CrossRef] [PubMed]
- Manto, M.J.; Xie, P.; Keller, M.A.; Liano, W.E.; Pu, T.; Wang, C. Recovery of ammonium from aqueous solutions using ZSM-5. Chemosphere 2018, 198, 501–509. [Google Scholar] [CrossRef] [PubMed]
- Dai, Y.; Lang, Y.; Wang, T.; Han, X.; Wang, L.; Zhong, J. Modelling the sources and transport of ammonium nitrogen with the SPARROW model: A case study in a karst basin. J. Hydrol. 2021, 592, 125763. [Google Scholar] [CrossRef]
- Jin, L.; Whitehead, P.G.; Heppell, C.M.; Lansdown, K.; Purdie, D.A.; Trimmer, M. Modelling flow and inorganic nitrogen dynamics on the Hampshire Avon: Linking upstream processes to downstream water quality. Sci. Total Environ. 2016, 572, 1496–1506. [Google Scholar] [CrossRef] [Green Version]
- Ervinia, A.; Huang, J.; Zhang, Z. Nitrogen sources, processes, and associated impacts of climate and land-use changes in a coastal China watershed: Insights from the INCA-N model. Mar. Pollut. Bull. 2020, 159, 111502. [Google Scholar] [CrossRef]
- Zhang, Z.; Huang, J.; Xiao, C.; Huang, J.-C. A simulation-based method to develop strategies for nitrogen pollution control in a creek watershed with sparse data. Environ. Sci. Pollut. Res. 2020, 27, 38849–38860. [Google Scholar] [CrossRef]
- Xue, B.; Zhang, H.; Wang, Y.; Tan, Z.; Zhu, Y.; Shrestha, S. Modeling water quantity and quality for a typical agricultural plain basin of northern China by a coupled model. Sci. Total Environ. 2021, 790, 148139. [Google Scholar] [CrossRef] [PubMed]
- Wellen, C.C.; Shatilla, N.J.; Carey, S.K. Regional scale selenium loading associated with surface coal mining, Elk Valley, British Columbia, Canada. Sci. Total Environ. 2015, 532, 791–802. [Google Scholar] [CrossRef]
- Li, X.; Feng, J.; Wellen, C.; Wang, Y. A Bayesian approach of high impaired river reaches identification and total nitrogen load estimation in a sparsely monitored basin. Environ. Sci. Pollut. Res. 2017, 24, 987–996. [Google Scholar] [CrossRef] [PubMed]
- Yuan, L.; Sinshaw, T.; Forshay, K.J. Review of Watershed-Scale Water Quality and Nonpoint Source Pollution Models. Geosciences 2020, 10, 25. [Google Scholar] [CrossRef] [Green Version]
- Smith, R.A.; Schwarz, G.E.; Alexander, R.B. Regional interpretation of water-quality monitoring data. Water Resour. Res. 1997, 33, 2781–2798. [Google Scholar] [CrossRef] [Green Version]
- Alexander, R.B.; Smith, R.A.; Schwarz, G.E. Effect of stream channel size on the delivery of nitrogen to the Gulf of Mexico. Nature 2000, 403, 758–761. [Google Scholar] [CrossRef]
- Benoy, G.A.; Jenkinson, R.W.; Robertson, D.M.; Saad, D.A. Nutrient delivery to Lake Winnipeg from the RedAssiniboine River Basin—A binational application of the SPARROW model. Can. Water Resour. J. 2016, 41, 429–447. [Google Scholar] [CrossRef]
- Brakebill, J.W.; Ator, S.W.; Schwarz, G.E. Sources of Suspended-Sediment Flux in Streams of the Chesapeake Bay Watershed: A Regional Application of the SPARROW Model1. J. Am. Water Resour. Assoc. 2010, 46, 757–776. [Google Scholar] [CrossRef]
- Hoos, A.B.; McMahon, G. Spatial analysis of instream nitrogen loads and factors controlling nitrogen delivery to streams in the southeastern United States using spatially referenced regression on watershed attributes (SPARROW) and regional classification frameworks. Hydrol. Process. 2009, 23, 2275–2294. [Google Scholar] [CrossRef]
- Alexander, R.B.; Schwarz, G.E.; Boyer, E.W. Advances in Quantifying Streamflow Variability Across Continental Scales: 1. Identifying Natural and Anthropogenic Controlling Factors in the USA Using a Spatially Explicit Modeling Method. Water Resour. Res. 2019, 55, 10893–10917. [Google Scholar] [CrossRef] [Green Version]
- Alexander, R.B.; Schwarz, G.E.; Boyer, E.W. Advances in Quantifying Streamflow Variability Across Continental Scales: 2. Improved Model Regionalization and Prediction Uncertainties Using Hierarchical Bayesian Methods. Water Resour. Res. 2019, 55, 11061–11087. [Google Scholar] [CrossRef] [Green Version]
- Ator, S.W.; Garcia, A.M.; Schwarz, G.E.; Blomquist, J.D.; Sekellick, A.J. Toward Explaining Nitrogen and Phosphorus Trends in Chesapeake Bay Tributaries, 1992–2012. J. Am. Water Resour. Assoc. 2019, 55, 1149–1168. [Google Scholar] [CrossRef]
- Brown, J.B.; Sprague, L.A.; Dupree, J.A. Nutrient Sources and Transport in the Missouri River Basin, with Emphasis on the Effects of Irrigation and Reservoirs1. JAWRA J. Am. Water Resour. Assoc. 2011, 47, 1034–1060. [Google Scholar] [CrossRef] [Green Version]
- Rebich, R.A.; Houston, N.A.; Mize, S.V.; Pearson, D.K.; Ging, P.B.; Evan Hornig, C. Sources and Delivery of Nutrients to the Northwestern Gulf of Mexico from Streams in the South-Central United States1. JAWRA J. Am. Water Resour. Assoc. 2011, 47, 1061–1086. [Google Scholar] [CrossRef]
- Puri, D.; Borel, K.; Vance, C.; Karthikeyan, R. Optimization of a Water Quality Monitoring Network Using a Spatially Referenced Water Quality Model and a Genetic Algorithm. Water 2017, 9, 704. [Google Scholar] [CrossRef] [Green Version]
- Domagalski, J.; Saleh, D. Sources and Transport of Phosphorus to Rivers in California and Adjacent States, US, as Determined by SPARROW Modeling. J. Am. Water Resour. Assoc. 2015, 51, 1463–1486. [Google Scholar] [CrossRef]
- Duan, W.L.; He, B.; Takara, K.; Luo, P.P.; Nover, D.; Hu, M.C. Modeling suspended sediment sources and transport in the Ishikari River basin, Japan, using SPARROW. Hydrol. Earth Syst. Sci. 2015, 19, 1293–1306. [Google Scholar] [CrossRef] [Green Version]
- Li, X.; Wellen, C.; Liu, G.; Wang, Y.; Wang, Z.-L. Estimation of nutrient sources and transport using Spatially Referenced Regressions on Watershed Attributes: A case study in Songhuajiang River Basin, China. Environ. Sci. Pollut. Res. 2015, 22, 6989–7001. [Google Scholar] [CrossRef] [PubMed]
- Xu, Z.Z.; Ji, Z.X.; Liang, B.; Song, D.R.; Lin, Y.; Lin, J.G. Estimate of nutrient sources and transport into Bohai Bay in China from a lower plain urban watershed using a SPARROW model. Environ. Sci. Pollut. Res. 2021, 28, 25733–25747. [Google Scholar] [CrossRef]
- Li, G.; Wang, Q.; Liu, G.; Zhao, Y.; Wang, Y.; Peng, S.; Wei, Y.; Wang, J. A Successful Approach of the First Ecological Compensation Demonstration for Crossing Provinces of Downstream and Upstream in China. Sustainability 2020, 12, 6021. [Google Scholar] [CrossRef]
- Zhou, P.; Huang, J.; Hong, H. Modeling nutrient sources, transport and management strategies in a coastal watershed, Southeast China. Sci. Total Environ. 2018, 610, 1298–1309. [Google Scholar] [CrossRef] [PubMed]
- Wang, Y.; Ouyang, W.; Zhang, Y.; Lin, C.; He, M.; Wang, P. Quantify phosphorus transport distinction of different reaches to estuary under long-term anthropogenic perturbation. Sci. Total Environ. 2021, 780, 146647. [Google Scholar] [CrossRef]
- Elliott, A.H.; Alexander, R.B.; Schwarz, G.E.; Shankar, U.; Sukias, J.P.S.; McBride, G.B. Estimation of nutrient sources and transport for New Zealand using the hybrid mechanistic-statistical model SPARROW. J. Hydrol.–N. Z. 2005, 44, 1–27. [Google Scholar]
- Alexander, R.B.; Elliott, A.H.; Shankar, U.; McBride, G.B. Estimating the sources and transport of nutrients in the Waikato River Basin, New Zealand. Water Resour. Res. 2002, 38, 4-1–4-23. [Google Scholar] [CrossRef]
- Aguilera, R.; Marce, R.; Sabater, S. Linking in-stream nutrient flux to land use and inter-annual hydrological variability at the watershed scale. Sci. Total Environ. 2012, 440, 72–81. [Google Scholar] [CrossRef]
- Aguilera, R.; Marce, R.; Sabater, S. Modeling nutrient retention at the watershed scale: Does small stream research apply to the whole river network? J. Geophys. Res. Biogeosci. 2013, 118, 728–740. [Google Scholar] [CrossRef] [Green Version]
- Miller, M.P.; de Souza, M.L.; Alexander, R.B.; Sanisaca, L.G.; Teixeira, A.d.A.; Appling, A.P. Application of the RSPARROW Modeling Tool to Estimate Total Nitrogen Sources to Streams and Evaluate Source Reduction Management Scenarios in the Grande River Basin, Brazil. Water 2020, 12, 2911. [Google Scholar] [CrossRef]
- Zhang, W.; Li, H.; Kendall, A.D.; Hyndman, D.W.; Diao, Y.; Geng, J.; Pang, J. Nitrogen transport and retention in a headwater catchment with dense distributions of lowland ponds. Sci. Total Environ. 2019, 683, 37–48. [Google Scholar] [CrossRef] [PubMed]
- Robertson, D.M.; Saad, D.A. Nutrient Inputs to the Laurentian Great Lakes by Source and Watershed Estimated Using SPARROW Watershed Models1. JAWRA J. Am. Water Resour. Assoc. 2011, 47, 1011–1033. [Google Scholar] [CrossRef]
- Garcia, A.M.; Alexander, R.B.; Arnold, J.G.; Norfleet, L.; White, M.J.; Robertson, D.M.; Schwarz, G. Regional Effects of Agricultural Conservation Practices on Nutrient Transport in the Upper Mississippi River Basin. Environ. Sci. Technol. 2016, 50, 6991–7000. [Google Scholar] [CrossRef]
- Zhang, W.; Pueppke, S.G.; Li, H.; Geng, J.; Diao, Y.; Hyndman, D.W. Modeling phosphorus sources and transport in a headwater catchment with rapid agricultural expansion. Environ. Pollut. 2019, 255, 113273. [Google Scholar] [CrossRef]
- Robertson, D.M.; Saad, D.A.; Christiansen, D.E.; Lorenz, D.J. Simulated impacts of climate change on phosphorus loading to Lake Michigan. J. Great Lakes Res. 2016, 42, 536–548. [Google Scholar] [CrossRef] [Green Version]
- Alam, M.J.; Goodall, J.L.; Bowes, B.D.; Girvetz, E.H. The Impact of Projected Climate Change Scenarios on Nitrogen Yield at a Regional Scale for the Contiguous United States. J. Am. Water Resour. Assoc. 2017, 53, 854–870. [Google Scholar] [CrossRef]
- Morales-Marin, L.; Wheater, H.; Lindenschmidt, K.-E. Potential Changes of Annual-Averaged Nutrient Export in the South Saskatchewan River Basin under Climate and Land-Use Change Scenarios. Water 2018, 10, 1438. [Google Scholar] [CrossRef] [Green Version]
- Miller, M.P.; Capel, P.D.; Garcia, A.M.; Ator, S.W. Response of Nitrogen Loading to the Chesapeake Bay to Source Reduction and Land Use Change Scenarios: A SPARROW-Informed Analysis. J. Am. Water Resour. Assoc. 2020, 56, 100–112. [Google Scholar] [CrossRef]
- Zhang, Z.; Chen, X.; Xu, C.-Y.; Hong, Y.; Hardy, J.; Sun, Z. Examining the influence of river-lake interaction on the drought and water resources in the Poyang Lake basin. J. Hydrol. 2015, 522, 510–521. [Google Scholar] [CrossRef]
- Tang, W.; Zhang, W.; Zhao, Y.; Zhang, H.; Shan, B. Basin-scale comprehensive assessment of cadmium pollution, risk, and toxicity in riverine sediments of the Haihe Basin in north China. Ecol. Indic. 2017, 81, 295–301. [Google Scholar] [CrossRef]
- Zhao, G.; Hoermann, G.; Fohrer, N.; Zhang, Z.; Zhai, J. Streamflow Trends and Climate Variability Impacts in Poyang Lake Basin, China. Water Resour. Manag. 2010, 24, 689–706. [Google Scholar] [CrossRef]
- Li, F.; Zhan, C.; Xu, Z.; Jiang, S.; Xiong, J. Remote sensing monitoring on regional crop water productivity in the Haihe River Basin. J. Geogr. Sci. 2013, 23, 1080–1090. [Google Scholar] [CrossRef]
- Morales-Marin, L.A.; Wheater, H.S.; Lindenschmidt, K.E. Assessment of nutrient loadings of a large multipurpose prairie reservoir. J. Hydrol. 2017, 550, 166–185. [Google Scholar] [CrossRef]
- Haith, D.A.; Shoemaker, L.L. GENERALIZED WATERSHED LOADING FUNCTIONS FOR STREAM FLOW NUTRIENTS1. JAWRA J. Am. Water Resour. Assoc. 1987, 23, 471–478. [Google Scholar] [CrossRef]
- Sha, J.; Swaney, D.R.; Hong, B.; Wang, J.; Wang, Y.; Wang, Z.-L. Estimation of watershed hydrologic processes in arid conditions with a modified watershed model. J. Hydrol. 2014, 519, 3550–3556. [Google Scholar] [CrossRef]
- Schwarz, G.; Hoos, A.; Alexander, R.; Smith, R. The SPARROW Surface Water-Quality Model: Theory, Application and User Documentation; U.S. Geological Survey Techniques and Methods: Reston, VA, USA, 2006. [Google Scholar]
- Qi, Z.D.; Kang, G.L.; Chu, C.L.; Qiu, Y.; Xu, Z.; Wang, Y.Q. Comparison of SWAT and GWLF Model Simulation Performance in Humid South and Semi-Arid North of China. Water 2017, 9, 567. [Google Scholar] [CrossRef] [Green Version]
- Liu, X.; Wang, Y.; Feng, J.; Chu, C.; Qiu, Y.; Xu, Z.; Li, Z.; Wang, Y. A Bayesian modeling approach for phosphorus load apportionment in a reservoir with high water transfer disturbance. Environ. Sci. Pollut. Res. 2018, 25, 32395–32408. [Google Scholar] [CrossRef] [PubMed]
- Schwarz, G.E. A Preliminary SPARROW Model of Suspended Sediment for the Conterminous United States; U.S. Geological Survey Open-File Report 2008–1205; U.S. Geological Survey: Reston, VA, USA, 2008; p. 8. [Google Scholar]
- Saleh, D.; Domagalski, J. SPARROW Modeling of Nitrogen Sources and Transport in Rivers and Streams of California and Adjacent States, US. J. Am. Water Resour. Assoc. 2015, 51, 1487–1507. [Google Scholar] [CrossRef]
- Morales-Marin, L.A.; Wheater, H.S.; Lindenschmidt, K.E. Estimating Sediment Loadings in the South Saskatchewan River Catchment. Water Resour. Manag. 2018, 32, 769–783. [Google Scholar] [CrossRef]
- Detenbeck, N.E.; You, M.; Torre, D. Recent Changes in Nitrogen Sources and Load Components to Estuaries of the Contiguous United States. Estuaries Coasts 2019, 42, 2096–2113. [Google Scholar] [CrossRef]
Figure 1.
Location and Digital Elevation Model (DEM) of (a) PLB and (b) HRB.

Figure 2.
Land use distributions in (a) PLB and (b) HRB.

Figure 3.
Water quantity station distribution (a) and Water quality station distribution (b) in PLB, Water quantity station distribution (c) and Water quality station distribution (d) in HRB.
Figure 3.
Water quantity station distribution (a) and Water quality station distribution (b) in PLB, Water quantity station distribution (c) and Water quality station distribution (d) in HRB.

Figure 4.
Modeled versus Observed values of streamflow and NSE at (a) Qiujing, (b) Meigang, (c) Wanjiabu, (d) Hushan, (e) Waizhou, (f) Dufengkeng, and (g) Lijiadu.
Figure 4.
Modeled versus Observed values of streamflow and NSE at (a) Qiujing, (b) Meigang, (c) Wanjiabu, (d) Hushan, (e) Waizhou, (f) Dufengkeng, and (g) Lijiadu.

Figure 5.
Scatterplots of (a) predicted values versus observed values and (b) residuals in PLB.

Figure 6.
Scatterplots of (a) predicted values versus observed values and (b) residuals in HRB.

Figure 7.
Incremental loads (kg/a) of NH4+-N in (a) PLB and (b) HRB.

Figure 8.
Delivery fractions in (a) PLB and (b) HRB.

Figure 9.
(a) Loads and (b) yields of NH4+-N delivered to the target outlets in PLB.

Figure 10.
(a) Loads and (b) yields of NH4+-N delivered to the target outlets in HRB.

Figure 11.
Comparison of land use, incremental load, and load delivery among (a) PLB and (b) HRB.


Table 1.
Results of SPARROW models.
| Basin | Number of Observations | R2 | MSE | RMSE | NSE |
|---|---|---|---|---|---|
| PLB | 58 | 0.89 | 0.25 | 0.50 | 0.88 |
| HRB | 144 | 0.53 | 1.91 | 1.38 | 0.52 |
Table 2.
Evaluation of parameters in PLB.
| Model Parameter | Unit | Value | Standard Error | Unbiased Value | p-Value | Lower 90% CI | Upper 90% CI |
|---|---|---|---|---|---|---|---|
| Point sources | kg·year−1 | 0.532 | 0.196 | 0.518 | 0.009 | 0.204 | 0.878 |
| Farmland | kg·km−2·year−1 | 218.034 | 214.467 | 281.267 | 0.314 | −27.661 | 436.068 |
| Woodland and grassland | kg·km−2·year−1 | 24.413 | 41.268 | 31.735 | 0.557 | −3.313 | 48.826 |
| Residential land | kg·km−2·year−1 | 1101.034 | 2126.541 | −580.387 | 0.607 | −5085.246 | 2202.069 |
| Precipitation | cm | 0.003 | 0.001 | 0.003 | 0.002 | 0.002 | 0.004 |
| Slope | % | −0.060 | 0.100 | −0.087 | 0.551 | −0.215 | 0.007 |
| Small river | day−1 | 0.070 | 0.133 | 0.052 | 0.599 | −0.172 | 0.252 |
| Large river | day−1 | 0.017 | 0.104 | 0.008 | 0.873 | −0.207 | 0.139 |
Table 3.
Evaluation of parameters in HRB.
| Model Parameter | Unit | Value | Standard Error | Unbiased Value | p-Value | Lower 90% CI | Upper 90% CI |
|---|---|---|---|---|---|---|---|
| Point sources | kg·year−1 | 0.040 | 0.023 | 0.032 | 0.078 | 0.002 | 0.052 |
| Farmland | kg·km−2·year−1 | 26.838 | 15.649 | 23.760 | 0.089 | 2.564 | 45.117 |
| Woodland and grassland | kg·km−2·year−1 | 6.556 | 5.102 | 5.336 | 0.201 | −6.636 | 13.112 |
| Residential land | kg·km−2·year−1 | 114.065 | 61.755 | 116.572 | 0.067 | −9.354 | 226.851 |
| Precipitation | cm | 0.013 | 0.021 | 0.012 | 0.539 | −0.014 | 0.034 |
| Temperature | °C | 0.148 | 0.072 | 0.132 | 0.042 | −0.005 | 0.263 |
| Small river | day−1 | 0.438 | 0.084 | 0.423 | <0.05 | 0.300 | 0.635 |
| Large river | day−1 | 0.114 | 0.081 | 0.094 | 0.165 | −0.045 | 0.186 |
Table 4.
Nutrient sources’ fluxes and fractions in main rivers in PLB.
| River | Point Sources | Farmland | Woodland and Grassland | Residential Land | Total | |||||
|---|---|---|---|---|---|---|---|---|---|---|
| Flux (ton/a) | Fraction (%) | Flux (ton/a) | Fraction (%) | Flux (ton/a) | Fraction (%) | Flux (ton/a) | Fraction (%) | Flux (ton/a) | Fraction (%) | |
| Ganjiang | 7005 | 49.48 | 4193 | 29.61 | 1150 | 8.12 | 1811 | 12.79 | 14158 | 100.00 |
| Fuhe | 1478 | 44.87 | 1146 | 34.81 | 286 | 8.69 | 383 | 11.63 | 3293 | 100.00 |
| Xinjiang | 1593 | 48.33 | 972 | 29.48 | 259 | 7.86 | 473 | 14.33 | 3297 | 100.00 |
| Raohe | 656 | 15.18 | 1764 | 40.85 | 978 | 22.66 | 921 | 21.32 | 4318 | 100.00 |
| Xiushui | 628 | 48.56 | 397 | 30.67 | 146 | 11.32 | 122 | 9.46 | 1293 | 100.00 |
| Total | 11,359 | 43.09 | 8471 | 32.14 | 2820 | 10.70 | 3709 | 14.07 | 26,360 | 100.00 |
Table 5.
Nutrient sources’ fluxes and fractions of main rivers in HRB.
| River | Point Sources | Farmland | Woodland and Grassland | Residential Land | Total | |||||
|---|---|---|---|---|---|---|---|---|---|---|
| Flux (ton/a) | Fraction (%) | Flux (ton/a) | Fraction (%) | Flux (ton/a) | Fraction (%) | Flux (ton/a) | Fraction (%) | Flux (ton/a) | Fraction (%) | |
| Luan | 132 | 14.35 | 299 | 32.48 | 202 | 21.90 | 288 | 31.28 | 921 | 100.00 |
| Beisanhe | 1449 | 26.71 | 1421 | 26.20 | 241 | 4.44 | 2313 | 42.65 | 5424 | 100.00 |
| Yongding | 394 | 19.84 | 846 | 42.61 | 222 | 11.19 | 523 | 26.35 | 1985 | 100.00 |
| Daqing | 3260 | 38.44 | 2740 | 32.30 | 197 | 2.32 | 2284 | 26.93 | 8481 | 100.00 |
| Ziya | 926 | 14.10 | 3253 | 49.52 | 208 | 3.17 | 2182 | 33.21 | 6569 | 100.00 |
| Zhangweinan Canal | 527 | 12.48 | 1909 | 45.21 | 262 | 6.20 | 1525 | 36.11 | 4223 | 100.00 |
| Tuhai-Majia | 913 | 19.29 | 1976 | 41.74 | 7 | 0.15 | 1837 | 38.81 | 4734 | 100.00 |
| Total | 7602 | 23.51 | 12,444 | 38.48 | 1339 | 4.14 | 10,952 | 33.87 | 32,336 | 100.00 |
Publisher’s Note: MDPI stays neutral with regard to jurisdictional claims in published maps and institutional affiliations. |
© 2022 by the authors. Licensee MDPI, Basel, Switzerland. This article is an open access article distributed under the terms and conditions of the Creative Commons Attribution (CC BY) license (https://creativecommons.org/licenses/by/4.0/).
Share and Cite
MDPI and ACS Style
Yin, J.; Chen, H.; Wang, Y.; Guo, L.; Li, G.; Wang, P. Ammonium Nitrogen Streamflow Transport Modelling and Spatial Analysis in Two Chinese Basins. Water 2022, 14, 209. https://doi.org/10.3390/w14020209
AMA Style
Yin J, Chen H, Wang Y, Guo L, Li G, Wang P. Ammonium Nitrogen Streamflow Transport Modelling and Spatial Analysis in Two Chinese Basins. Water. 2022; 14(2):209. https://doi.org/10.3390/w14020209
Chicago/Turabian StyleYin, Jingchen, Haitao Chen, Yuqiu Wang, Lifeng Guo, Guoguang Li, and Puzhou Wang. 2022. "Ammonium Nitrogen Streamflow Transport Modelling and Spatial Analysis in Two Chinese Basins" Water 14, no. 2: 209. https://doi.org/10.3390/w14020209
Note that from the first issue of 2016, this journal uses article numbers instead of page numbers. See further details here.