
Significant Temporal and Spatial Variability in Nutrient Concentrations in a Chinese Eutrophic Shallow Lake and Its Major Tributaries


1
Jiangsu Provincial Key Laboratory of Environmental Engineering, Jiangsu Provincial Academy of Environmental Science, Nanjing 210036, China
2
State Key Laboratory of Lake Science and Environment, Nanjing Institute of Geography and Limnology, Chinese Academy of Sciences, Nanjing 210008, China
3
Annis Water Resources Institute, Grand Valley State University, Muskegon, MI 49441, USA
*
Author to whom correspondence should be addressed.
Water 2022, 14(2), 217; https://doi.org/10.3390/w14020217
Submission received: 18 November 2021
/
Revised: 8 January 2022
/
Accepted: 10 January 2022
/
Published: 12 January 2022
(This article belongs to the Section Water Quality and Contamination)
Abstract
:Sediment nutrients can be released to the surface water when hydraulic disturbance becomes strong in shallow lakes, which contributes to nutrient enrichment and subsequent lake eutrophication in the water column. To explore the seasonal variations and spatial distributions exhibited by nutrients in the water column, surface sediment, and pore water of Lake Yangcheng and its major tributaries, we determined the concentrations of nitrogen (N) and phosphorus (P) throughout the lake in different seasons of 2018. Total N (TN) and total P (TP) concentrations in the connected rivers were much greater than those in the lake, indicating that external loading greatly contributed to the nutrient enrichment. TN concentration in the water column was highest in the winter, whereas TP peaked in the summer. A similar temporal pattern was observed for TN and TP in the sediment with maxima in the winter and minima in the summer; however, nutrients in the pore water were highest in the summer, in contrast to the temporal variation in the sediment. Additionally, high TN values in the water column and high TP in the three compartments were distributed primarily in the west part of the lake, while high TN concentrations in the sediment and pore water were observed mainly in the east portion of the lake. According to the enrichment factor index (an indicator evaluating the nutrient enrichment by comparing the detected contents and standard values), nutrients in the lake sediment were severely enriched with TN and TP averaging 2195.8 mg/kg and 543.0 mg/kg, respectively. The vertical distribution of TN and TP generally exhibited similar decreasing patterns with an increase in sediment depth, suggesting mineralization of TN and TP by microbes and benthic organisms. More attention and research are needed to understand the seasonality of nutrient exchange across the sediment–water interface, especially in eutrophic lakes.
1. Introduction
In freshwater ecosystems, nutrient enrichment is a major environmental problem. Excessive loads of both nitrogen (N) and phosphorus (P) from external and internal sources can lead to a series of ecological impacts, such as deterioration of water quality [1,2], acceleration of water eutrophication [3], massive growth of phytoplankton [4,5], and the occurrence of harmful algal blooms [6] with the production of cyanotoxins [7]. While there is some debate as to whether nutrient control should focus on N or P, numerous studies have shown that dual reduction of nutrients is the most effective way to control the proliferation of cyanobacterial booms and restore ecosystem health in eutrophic lakes [1,2,8,9,10,11].
Nutrient control is necessary to improve lake water quality and ecosystem health, although identifying the appropriate management steps is not always straightforward. Nutrient sources, concentrations, and forms vary among lakes, suggesting that site-specific diagnoses are required to ensure suitable control strategies. Understanding nutrient sources, such as external loading from domestic pollution sources, agricultural land use, and industrial pollution, contributing to the increase of nutrients in the catchment, is especially important. Increases in amount of impervious surface area and application of N and P fertilizers for agriculture also stress aquatic resources [12]. This trend has led to increased nutrient-rich wastewater discharge and intensified nutrient runoff from landscapes. Despite strict nutrient management strategies, especially to reduce external nutrient loading, freshwater lakes still receive large amounts of nutrients from their tributaries [13]. Wastewater discharges remain a major source of excess nutrients in many regions of the world [14,15,16,17].
Surface sediment can adsorb and immobilize a certain amount of nutrients. However, sediment can also be a source of pollution when environmental conditions favor nutrient release. Internal nutrient loads, derived from sediment nutrient release, may be at least as important as external nutrient loads in the dynamics of nutrient concentrations in the water column [18]. In fact, significant amounts of nutrients can be released from the sediment to the water column when the wind is very strong and water disturbance is frequent, especially in shallow lakes [19,20]. The internal release of nutrients from the sediment can lead to a rapid increase in the concentrations of N and P in the water column, which contributes to water eutrophication and can promote the formation of algal blooms [19,21,22]. Thus, it is very useful to understand a lake’s sediment nutrient dynamics in order to improve water quality and control cyanobacterial blooms [13]. The analysis of lake sediment is a critical consideration when studying nutrient pollution in a specific area and assessing appropriate management strategies [23].
Given that each lake has a unique geographical background with a different history of nutrient inputs, as well as different surface areas, volumes, bathymetries, and hydraulic retention times, it is not surprising that the temporal pattern and spatial distribution of nutrient content and cycling varies among lake and river ecosystems, even those classified as eutrophic [24]. The temporal changes in N and P concentrations vary among seasons due to practices in the watershed, as well as nutrient uptake and utilization by bacteria, algae, and macrophytes. Within the lake, the water column, surface sediment, and pore water compartments are interdependent and connected by a variety of physical, hydrological, biological, and chemical processes [25]. For example, nutrient fluxes from pore water to surface water have been shown to be important in several studies [19,25,26]. Interstitial water is the main medium for material exchange between sediments and water bodies. The need to consider pore water and sediment chemistry in addition to surface water is amplified by the fact that surface water chemistry is temporally variable, with diurnal, seasonal, and annual variations in concentrations of some elements being driven by biological, hydrological, and chemical processes.
Lake Yangcheng is a medium-sized shallow lake that is connected to Lake Taihu, the third largest freshwater in China. It serves as an important drinking water source for Suzhou City, Jiangsu Province, China. The lake is famous for producing high-quality cultured Chinese mitten crab (Eriocheir sinensis; CMC), a well-known food in China [27]. Previous investigations indicated that due to external loading from surrounding rivers and Lake Taihu, nutrient concentrations are very high in the surface water and sediment of Lake Yangcheng [28,29]. In 2016, the percentages of pen aquaculture area were 40.38% in the east lake and 37.03% in the middle lake according to map extractions. The expansion of pen aquaculture was proven to have a significant positive correlation with nutrient enrichment, especially in the middle and east lake areas [30]. However, there is a lack of information on the dynamics and distributions of nutrients in the water column, surface sediment, and pore water of Lake Yangcheng. Depending on the limnological and meteorological conditions in the water, surface sediment can act as a source or a sink for nutrients and other elements. To facilitate more effective decision-making for both the management of nutrient enrichment and implementation of ecological restoration approaches in Lake Yangcheng, it is crucial to understand the dynamics of nutrient cycling in this shallow eutrophic lake.
In this study, a hypothesis is proposed for this shallow lake, which was divided into three lake areas. The west basin received most of the tributary nutrient loads and was not influenced by aquaculture, while the other two basins were impacted by several decades of history in pen aquaculture. It is expected that water quality in the west basin would be more coupled and positively correlated with the tributary loads, while a weaker coupling with the external loadings is expected for other two basins. Thus, the seasonal variations and spatial distributions of nutrients (including TN and TP) in the water column, surface sediment, and pore water of Lake Yangcheng are explored. In addition, the external nutrient loadings from eight connected rivers flowing into this lake are investigated and compared in different seasons. The ecological risks posed by nutrients in the surface sediments of different lake areas and inflowing rivers are also evaluated using the enrichment factor [31]. Finally, the vertical distributions of nutrient level in the deep sediment are also examined. Our ultimate goal is to provide scientifically justifiable recommendations for the management and treatment of excessive nutrients in this shallow lake.
2. Materials and Methods
2.1. Study Area and Sample Collection
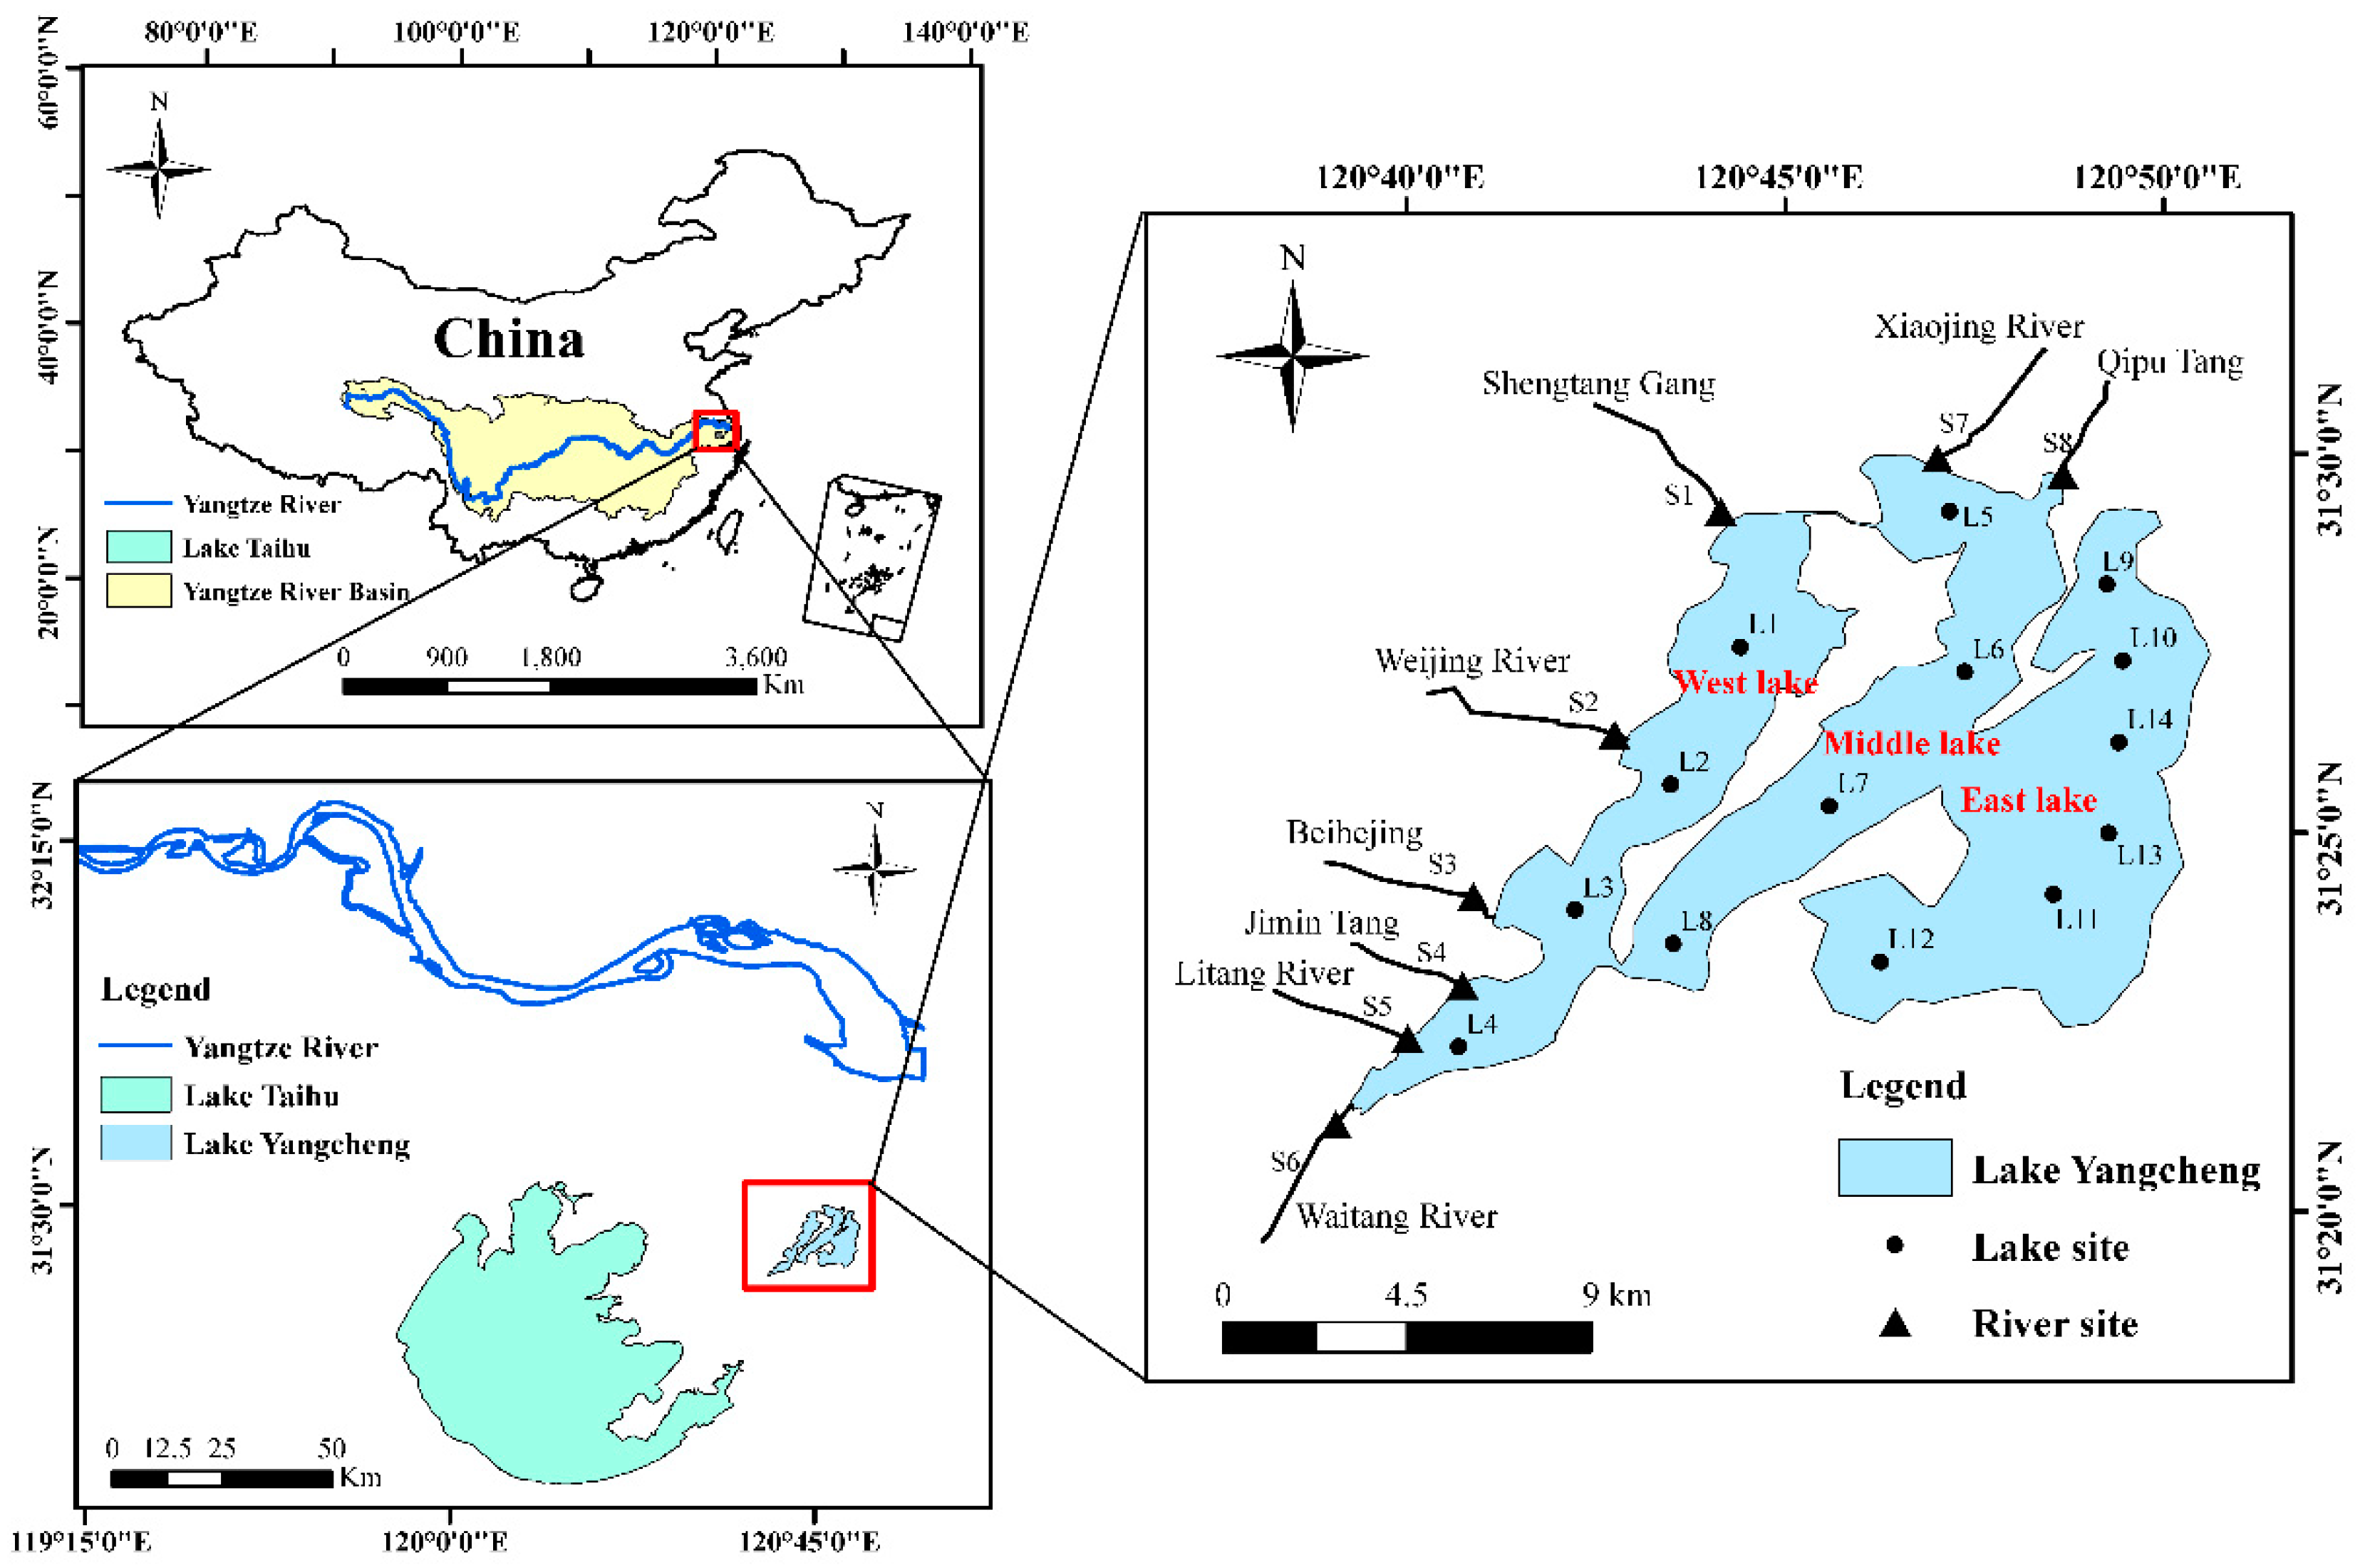
Lake Yangcheng (31°21′–31°30′ N, 120°39′–120°51′ E) is located to the northeast of the Lake Taihu Basin, China. It is the largest freshwater lake and the most important drinking water source in Suzhou City, Jiangsu Province (2018 population of 10.7 million people). The lake has a surface area of approximately 120 km2 and an average depth of 2.05 m, stretching for about 17 km from north to south and 11 km from east to west (Figure 1). It is divided into three parts by two nearly parallel narrow strips of land (Figure S1), including the west lake (sampling sites: L1, L2, L3, and L4), the middle lake (sampling sites: L5, L6, L7, and L8), and the east lake (sampling sites: L9, L10, L11, L12, L13, and L14; Figure 1). East lake is the biggest region with a surface area of 52.5 km2, followed by middle lake and west lake, covering areas of 34.6 km2 and 32.0 km2, respectively. The total volume of this lake is 2.22 × 10⁹ m3 and its hydraulic residence time was approximately 20 days in 2018.
In total, there are over 60 connected rivers in Lake Yangcheng, with the inflowing rivers mainly distributed in the west and north parts of the lake. The outflowing rivers are located in the east and south parts of the lake. To evaluate the influence of external loading on the lake nutrients, eight major connected rivers (S1: Shengtang Gang; S2: Weijing River; S3: Beihejing; S4: Jiming Tang; S5: Litang River; S6: Waitang River; S7: Xiaojing River; S8: Qipu Tang) were also monitored, with each sampling station located in the estuary of its corresponding river. The coordinates of sampling sites in the lake and its major tributaries are shown in Table S1. The Qipu River water diversion project was initiated in 2011 and finished in 2016, resulting in Yangtze River as an important water supply for Lake Yangcheng. Due to the implementation of this project, the lake residence period was shortened by half. The lake watershed covers an area of 614.45 km2, with the major land uses being residential (28.1%), lake surface area (23.4%), forest and grass (22.0%), culture pond surface area (18.9%), and cropland (7.5%). The lake catchment has a humid subtropical monsoonal climate, with an annual mean air temperature of about 15.7 °C and a monthly rainfall of 92.6 mm [29].
Seasonal samples were collected from 14 lake stations (L1–L14) and 8 river stations (S1–S8) in February, May, August, and October 2018. Water samples were collected from the surface layer (0–0.5 m depth) with a Plexiglas water sampler. One liter of water from each site was preserved in acid-washed dark plastic bottles pre-conditioned with lake water. Surface sediment samples (0–10 cm) were collected using a Petersen grab sampler and then sealed in clean polyethylene bags. The collected water and sediment samples were stored immediately in a portable refrigerator (around 4 °C), then transported to the laboratory as soon as possible and no later than 6 h after collection for further analysis. Approximately 200 mL of pore water from each sediment sample was obtained by centrifugation at 4000 rpm for 10 min. Overlying water and pore water were processed within 12 h after collection. In addition, sediment core samples (about 20 cm) were collected in February 2018 using a modified piston corer and placed into a stainless steel rack for transport. The cores were closed with rubber stoppers to avoid sediment oxidation during the sampling and transportation processes.
2.2. Chemical Analysis
Water temperature, dissolved oxygen (DO), pH, and conductivity were measured in situ using a multiparameter water quality sonde (YSI 6600 V2, Yellow Spring Instruments, Yellow Springs, OH, USA) and displayed in Tables S2–S4. Unfiltered water samples were analyzed for TN and TP by colorimetry after digestion with K2S2O8 and NaOH solutions [32]. Each sediment core was divided into six sections from top to bottom representing the 0–3 cm, 3–6 cm, 6–9 cm, 9–12 cm, 12–15 cm, and 15–18 cm depths, respectively. The levels of nutrients in the sediment were determined as follows: sediment samples were air dried; then stones and plant fragments were removed by passing the dried sample through a 150 μm sieve; then sediment was treated with distilled water to prepare a mixture of sediment and water. Finally, the concentrations of TN and TP were determined following high temperature digestion.
2.3. Nutrient Loading
Nutrient loads including TN and TP were quantified using river discharge and measured nutrient concentrations for each river [17]
where i represents different forms of nutrient; Q(t, k) is the quantity of flow in inflowing river k on time t; C(t, k, i) is the concentration of i in inflowing river k on time t; and F(i, t) is the external loading of i in rivers monitored in the study. Runoff data for each river were obtained from the Ministry of Water Resources, China. It is difficult to accurately estimate the lake’s nutrient loads due to its complex river network systems around the lake and sometimes bidirectional nature of their flow depending on tidal variations and gate controls. Hence, these loads are estimations, but are nonetheless important to better understand the dynamics of TN and TP in Lake Yangcheng. Finally, the seasonal fluxes of TN and TP were calculated by multiplying the seasonal discharge and corresponding nutrient concentrations. The annual loading of nutrients is the sum of loadings in four seasons.
2.4. Evaluation of Nutrient Contamination in the Sediment
An enrichment factor (EF) was calculated to assess the degree of nutrient enrichment in the sediments of Lake Yangcheng:
where Si refers to the single evaluation index; Ci is the concentration of nutrient examined in the sediment; and Cs is the standard value of the given nutrient. EF indicates the comprehensive pollution index; F indicates the average of different Si; and Fmax indicates the maximum of Si. In this study, F is the average of STN and STP and Fmax is the maximum of STN and STP.
2.5. Data Analysis
The geostatistical statistics function of ArcGIS 10.2 (Environmental Systems Research Institute Inc., Redlands, CA, USA) was used to analyze the spatial distribution of the nutrients in Lake Yangcheng. The inverse distance weighted interpolation method and the mask method were used to produce a grid map of sediment parameters [33]. Nutrient concentrations in the water column, sediment, and pore water for each sampling site were expressed as average values and standard deviation (SD) based on pooled samples. The one-way analysis of variance (ANOVA) with Fisher’s Protected Least Significant Difference (PLSD) post hoc test was performed to examine whether there were significant differences in the spatial distribution and temporal variation of nutrient concentrations. Differences were considered significant if p < 0.05. All statistical analyses were conducted using statistical software package SPSS Version 20.0 (SPSS Inc., Chicago, IL, USA).
3. Results
3.1. The Seasonal Variations of Nitrogen in the Lake
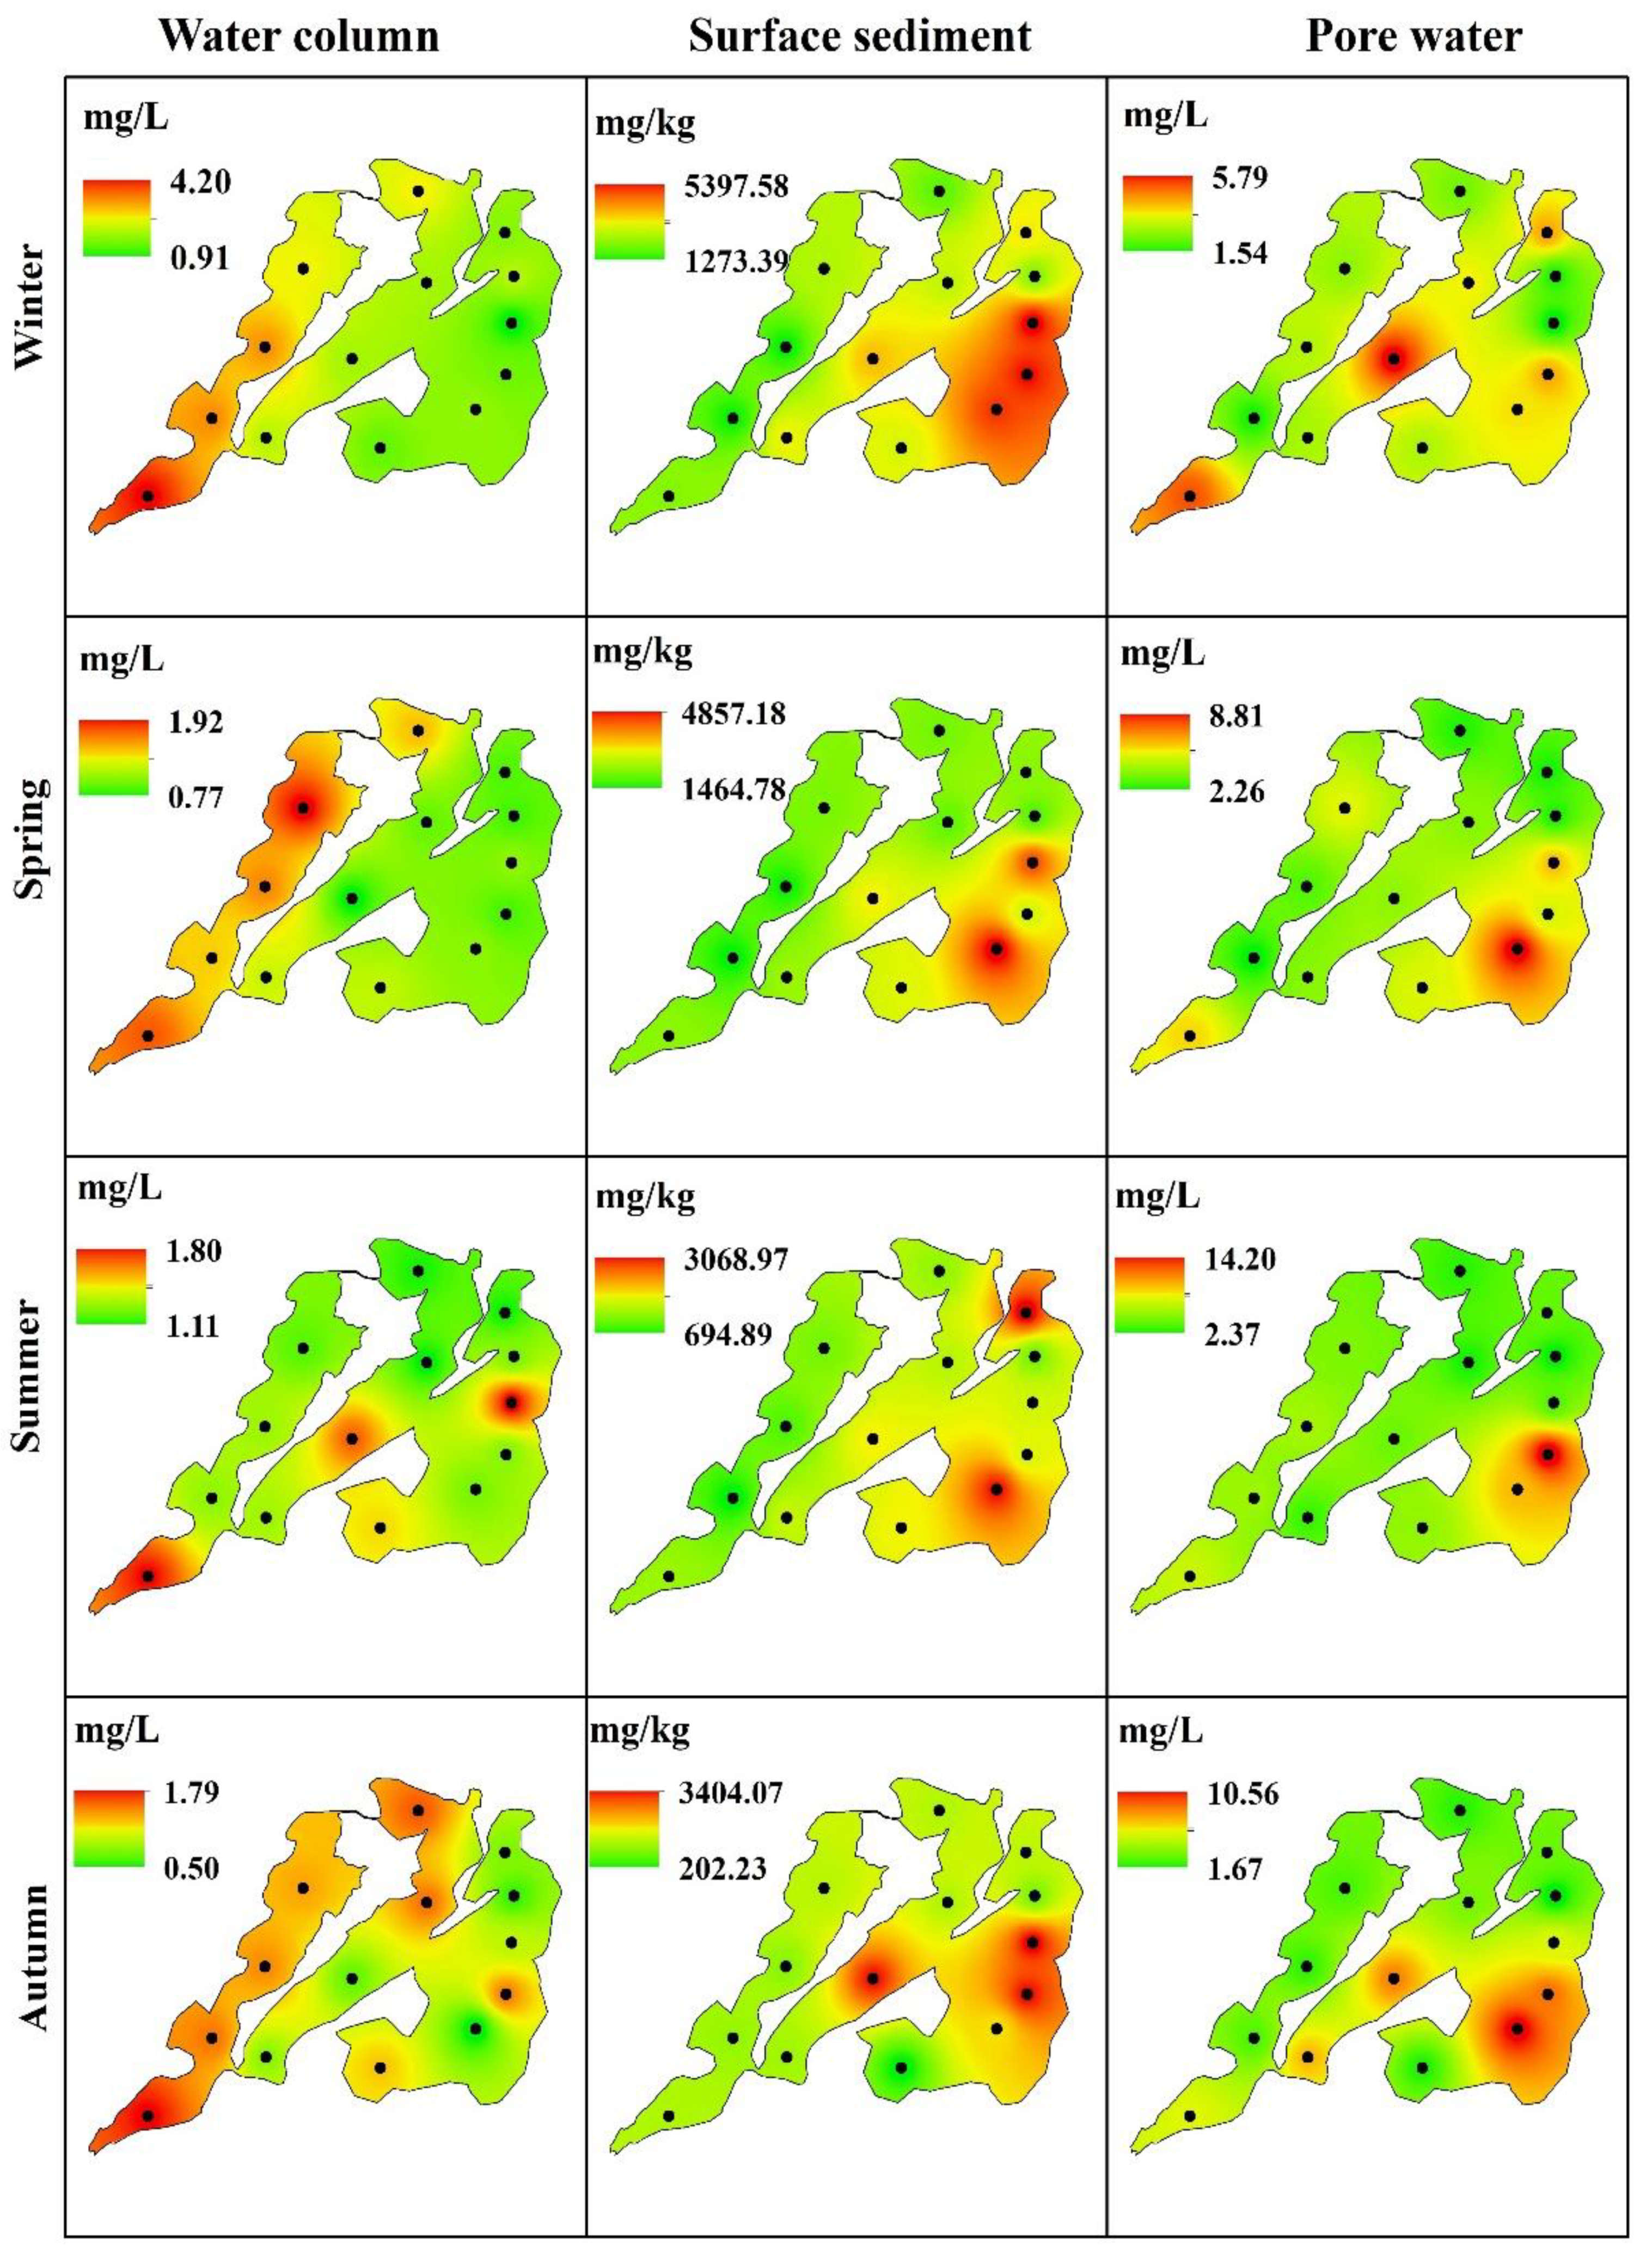
In general, there were significant differences (p < 0.05) in the seasonal variation and spatial distribution of TN concentrations in the water column and surface sediment of Lake Yangcheng (Table 2). No significant difference (p > 0.05) was observed in the pore water. For the water column, the average concentration of TN was highest in the winter (2.25 mg/L), followed by summer and spring, and lowest in the autumn (1.19 mg/L). The maximum TN was recorded in the winter of the west lake with a value of 4.2 mg/L (site L4), while the minimum was observed in the autumn of the east lake with a value of 0.5 mg/L (site L11).
For the surface sediment, TN concentrations peaked in the winter with an average value of 3046.7 mg/kg, followed by spring and autumn, and were lowest in the summer with an average of 1599.9 mg/kg. The maximum TN sediment value was recorded in the winter of east lake with a value of 5399.6 mg/kg (site L14), while the minimum value was observed in the autumn of the west lake with a value of 201.85 mg/kg (site L12). However, the seasonal variations of TN in the pore water were opposite of those in the surface sediment; the highest values were observed in summer with a mean of 5.26 mg/L, followed by autumn and spring, and the lowest were observed in winter with a mean value of 3.27 mg/L (Table 2 and Figure 2).
For the spatial distribution of TN concentrations in different parts of Lake Yangcheng, the maximum value in the water column was observed in the west section, followed by the middle, and the minimum in the east section. In contrast, for TN in the surface sediment, the maximum was observed in the east section, followed by the middle, and the lowest TN concentration was recorded in the west lake. TN concentrations in the pore water also showed slight differences, with the maximum observed in the east section, followed by the west, and the lowest in the middle section (Table 2 and Figure 2).
3.2. The Seasonal Variations of Phosphorus in the Lake
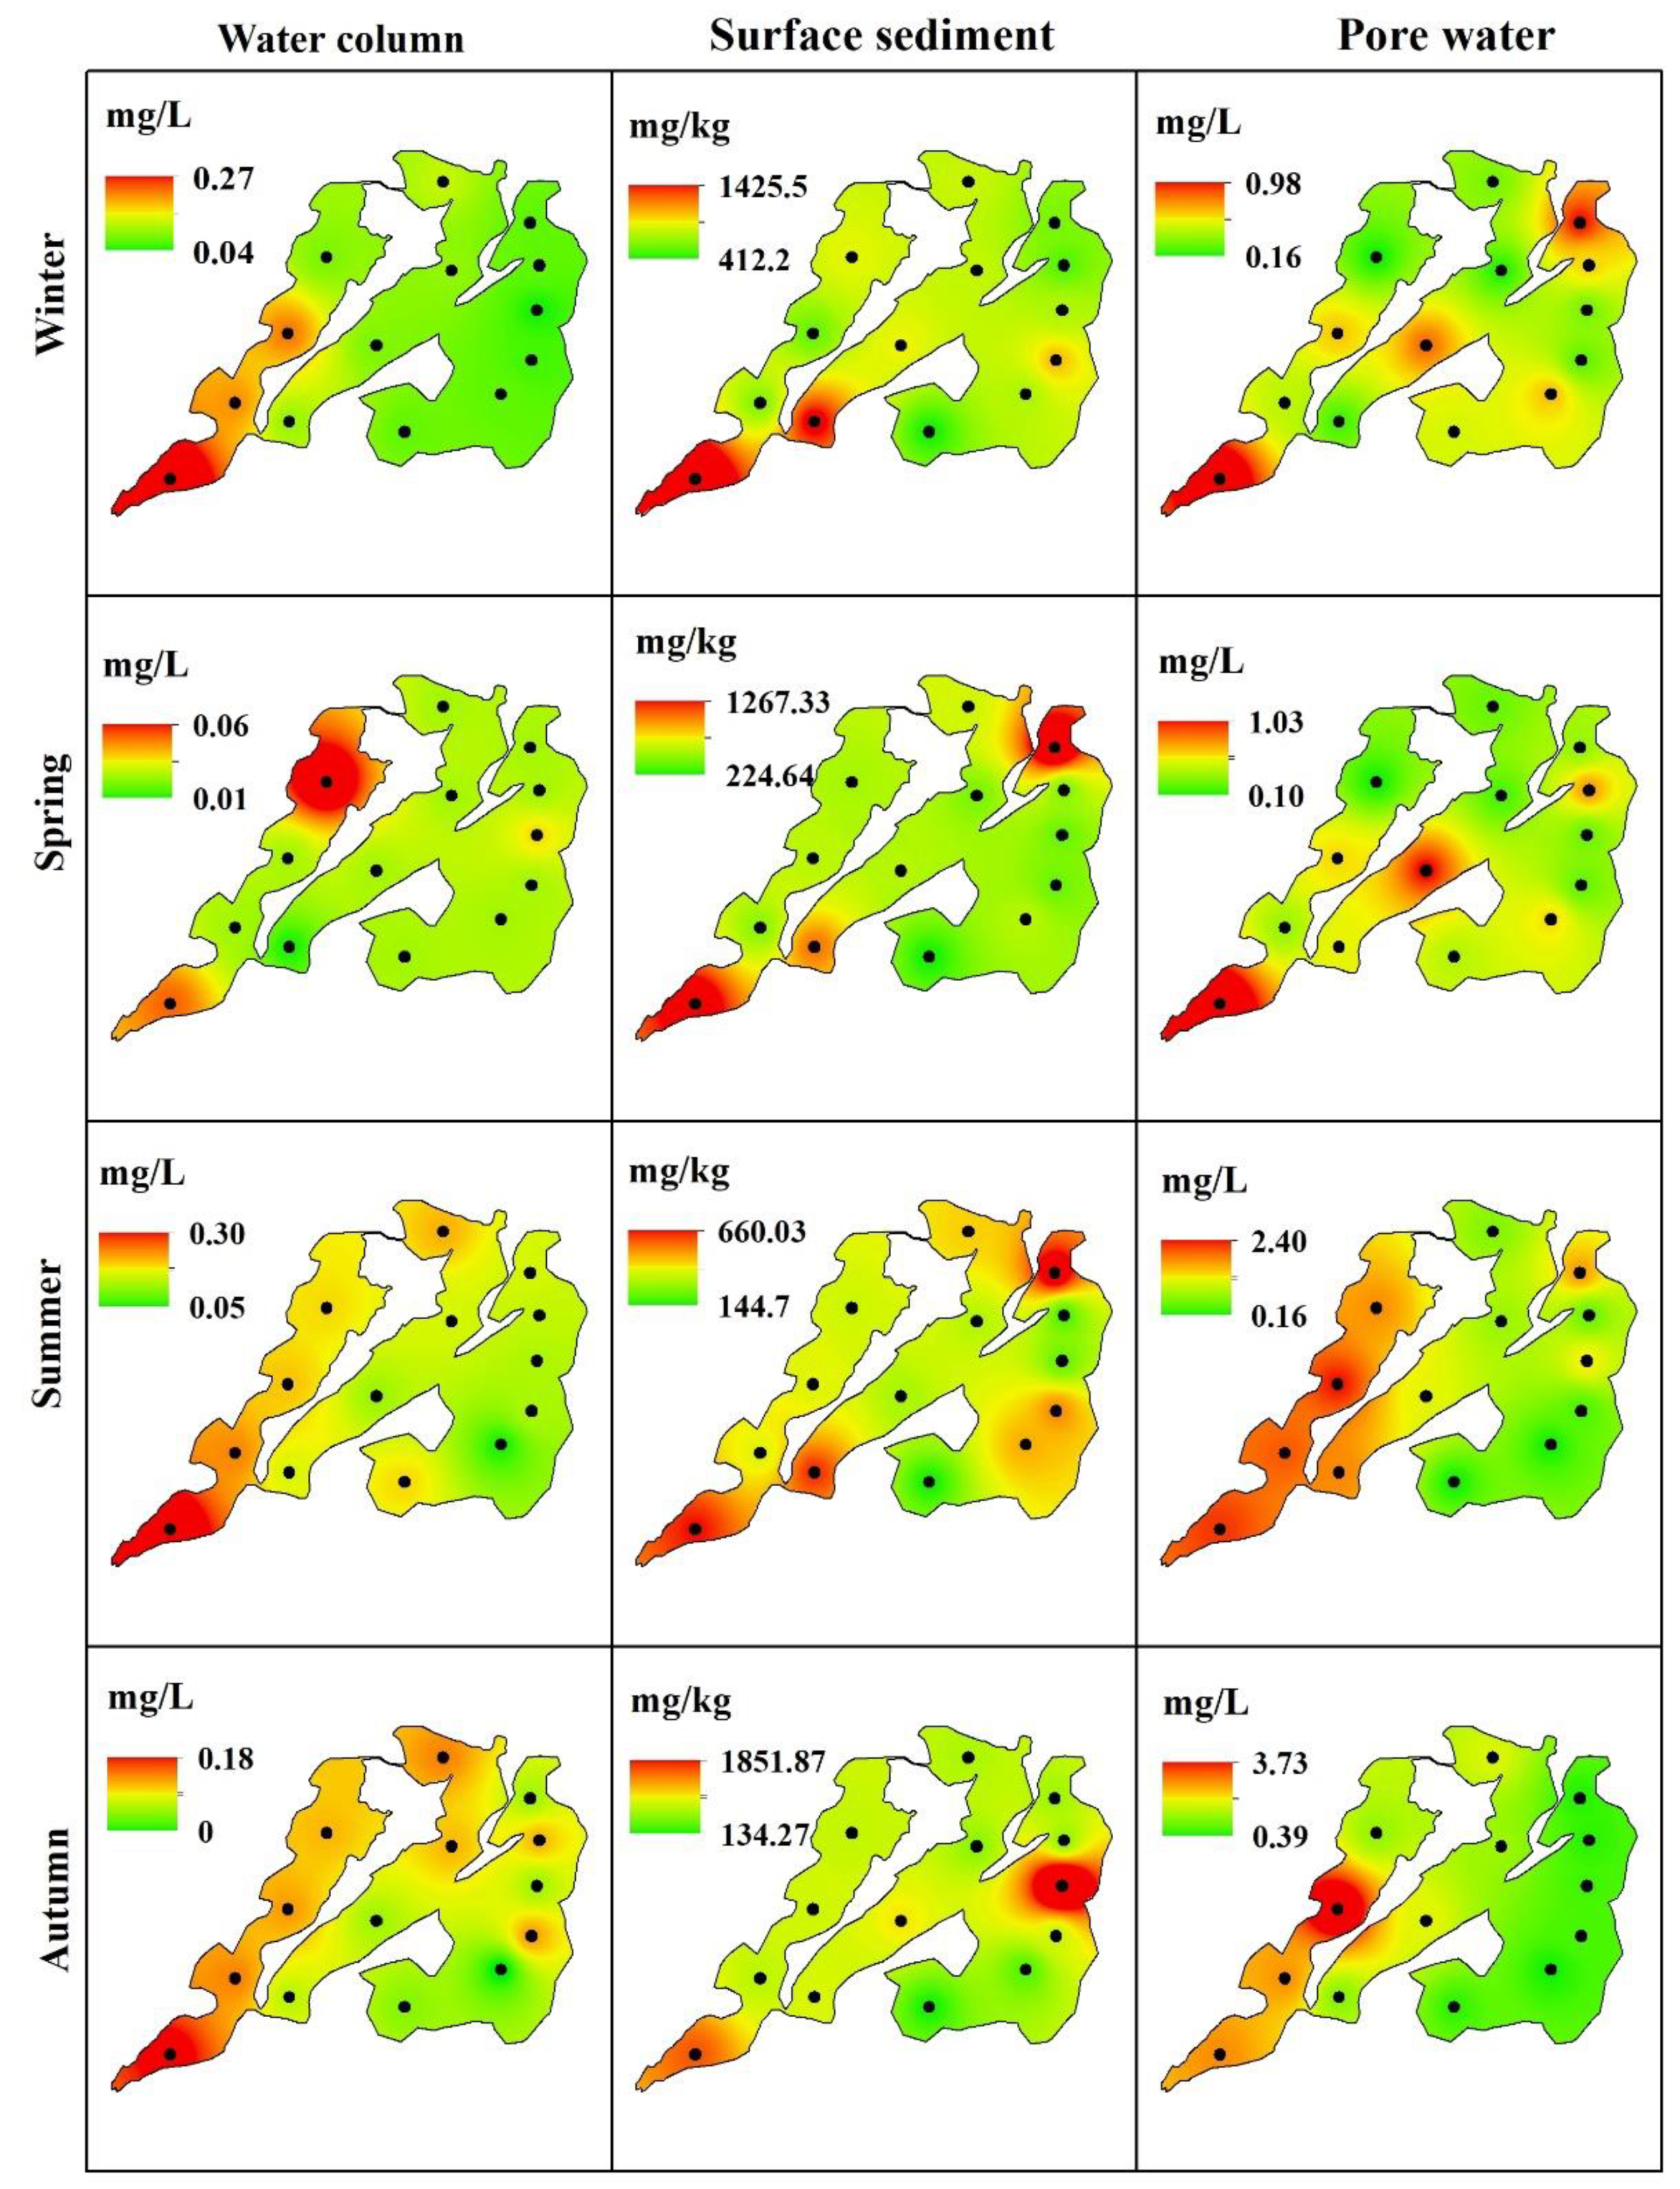
In contrast, there were significant differences (p < 0.05) in the seasonal variation and spatial distribution of TP concentrations in the water column and pore water of Lake Yangcheng (Table 3). No significant difference (p > 0.05) was observed in the surface sediment.
The seasonal variation and spatial distribution of TP concentrations differed from those exhibited by TN. For the water column, the average concentration of TP was the highest in the summer with a value of 0.15 mg/L, followed by winter (0.10 mg/L) and autumn (0.09 mg/L), and lowest in the spring with a value of 0.02 mg/L. The maximum TP was recorded in the summer in the west region with a value of 0.3 mg/L (site L4), while the minimum was almost zero in the autumn in east lake (site L11).
For the lake sediment, TP content was highest in the winter with an average of 721.9 mg/kg, followed by autumn (556.6 mg/kg) and spring (527.0 mg/kg). The lowest mean content of sediment TP was observed in the summer with a value of 366.4 mg/kg, which was the half of that in the winter (Table 3 and Figure 3). The temporal pattern of TP in the pore water was similar to that of TP in the water column, with highest values in summer, followed by autumn and winter, and lowest in the spring (Table 3).
3.3. The Seasonal Variations of Nutrients in the Rivers
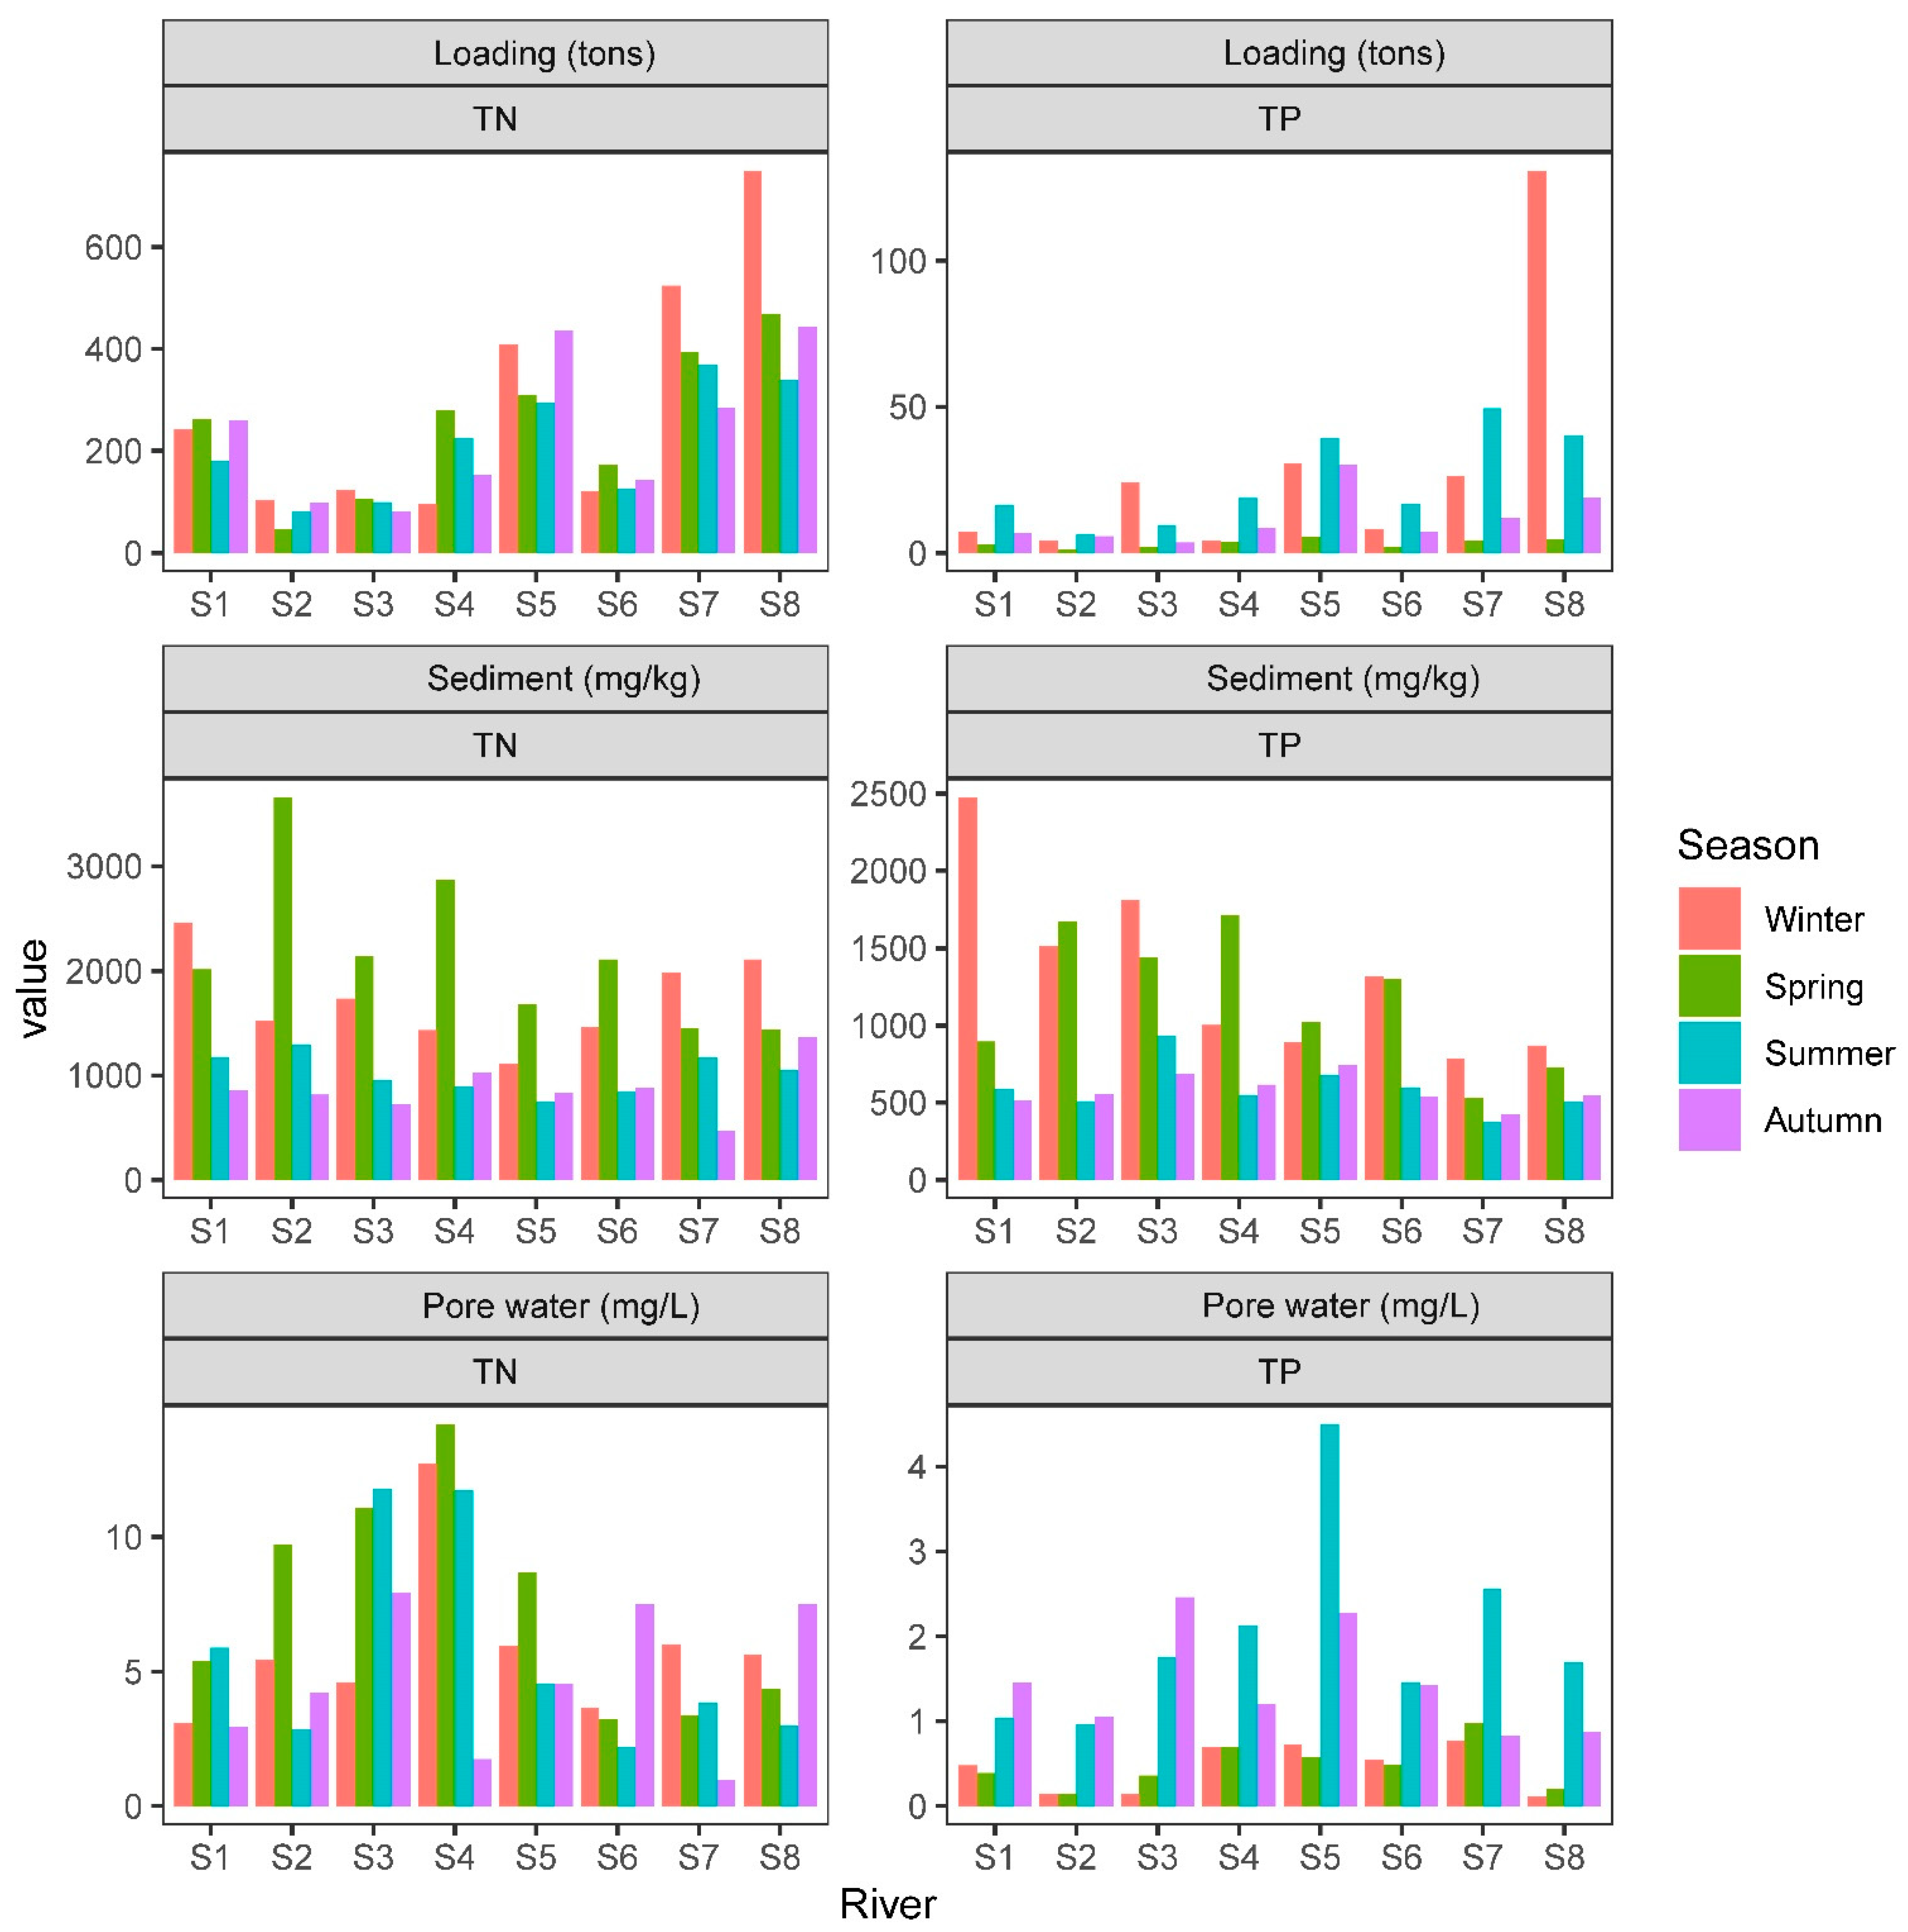
In general, there were differences in the concentrations of TN and TP in the eight inflowing rivers and over the four seasons (Figure S2). The results showed that TN concentrations in the inflows ranged from 2.03 to 3.44 mg/L, which is higher than the lake water column average of 1.5 mg/L. TP concentrations in the inflowing rivers ranged from 0.09 to 0.35 mg/L, which were also higher than the lake water column average of 0.09 mg/L (Figure S2). According to the seasonal variations in the external loading of each river, S8 was observed to have the highest total loading of four seasons for TN and TP. Winter contributed the most loading among four seasons, accounting for 30% for TN and 43% for TP. The total external loadings from these inflows were estimated as 8024 t/year for TN and 552 t/year for TP.
For the river sediment, the concentrations of TN in spring and winter were higher than those in autumn and summer, which is in accordance with the seasonal difference in lake sediment (Figure 2 and Figure 4). The maximum concentration of TN was recorded in the spring at S2, while the minimum value was observed in the autumn at S7. The average TN over the four seasons was highest at S2 (1821.1 mg/kg), while the lowest was observed at S5 (1092.2 mg/kg). The maximum concentration of TP was recorded in the winter at S1 (2474.3 mg/kg), while the minimum value was observed in the summer at S7 (376.89 mg/kg). Further, the concentrations of TP in winter and spring were higher than those in summer and autumn, which is similar with the seasonal difference in TN (Figure 4). The average value of TP over the four seasons was highest at S3 (1217.1 mg/kg), while the average TP was lowest at S7 (526.1 mg/kg).
The concentrations of TN and TP in the interstitial water from river sediment revealed there were different temporal patterns in nutrient concentrations (Figure 4). The maximum concentration of TN (14.19 mg/L) was recorded in the spring at S4, while the minimum value (0.98 mg/L) was observed in the autumn at S7. In general, the concentrations of TN in spring and winter were higher than those in summer and autumn. The average value of TN over four seasons was highest at S4 (10.10 mg/L), while the average TN was lowest at S7 (3.55 mg/L). The maximum concentration of TP (4.50 mg/L) was recorded in the summer at S5, while the minimum value (0.12 mg/L) was observed in the winter at S8. In general, the concentrations of TP in summer and autumn were higher than those in winter and spring. The average value of TP over the four seasons was highest at S5 (2.02 mg/L), while the average TP was lowest at S2 (0.58 mg/L).
3.4. Evaluation of Nutrient Contamination in the Surface Sediment
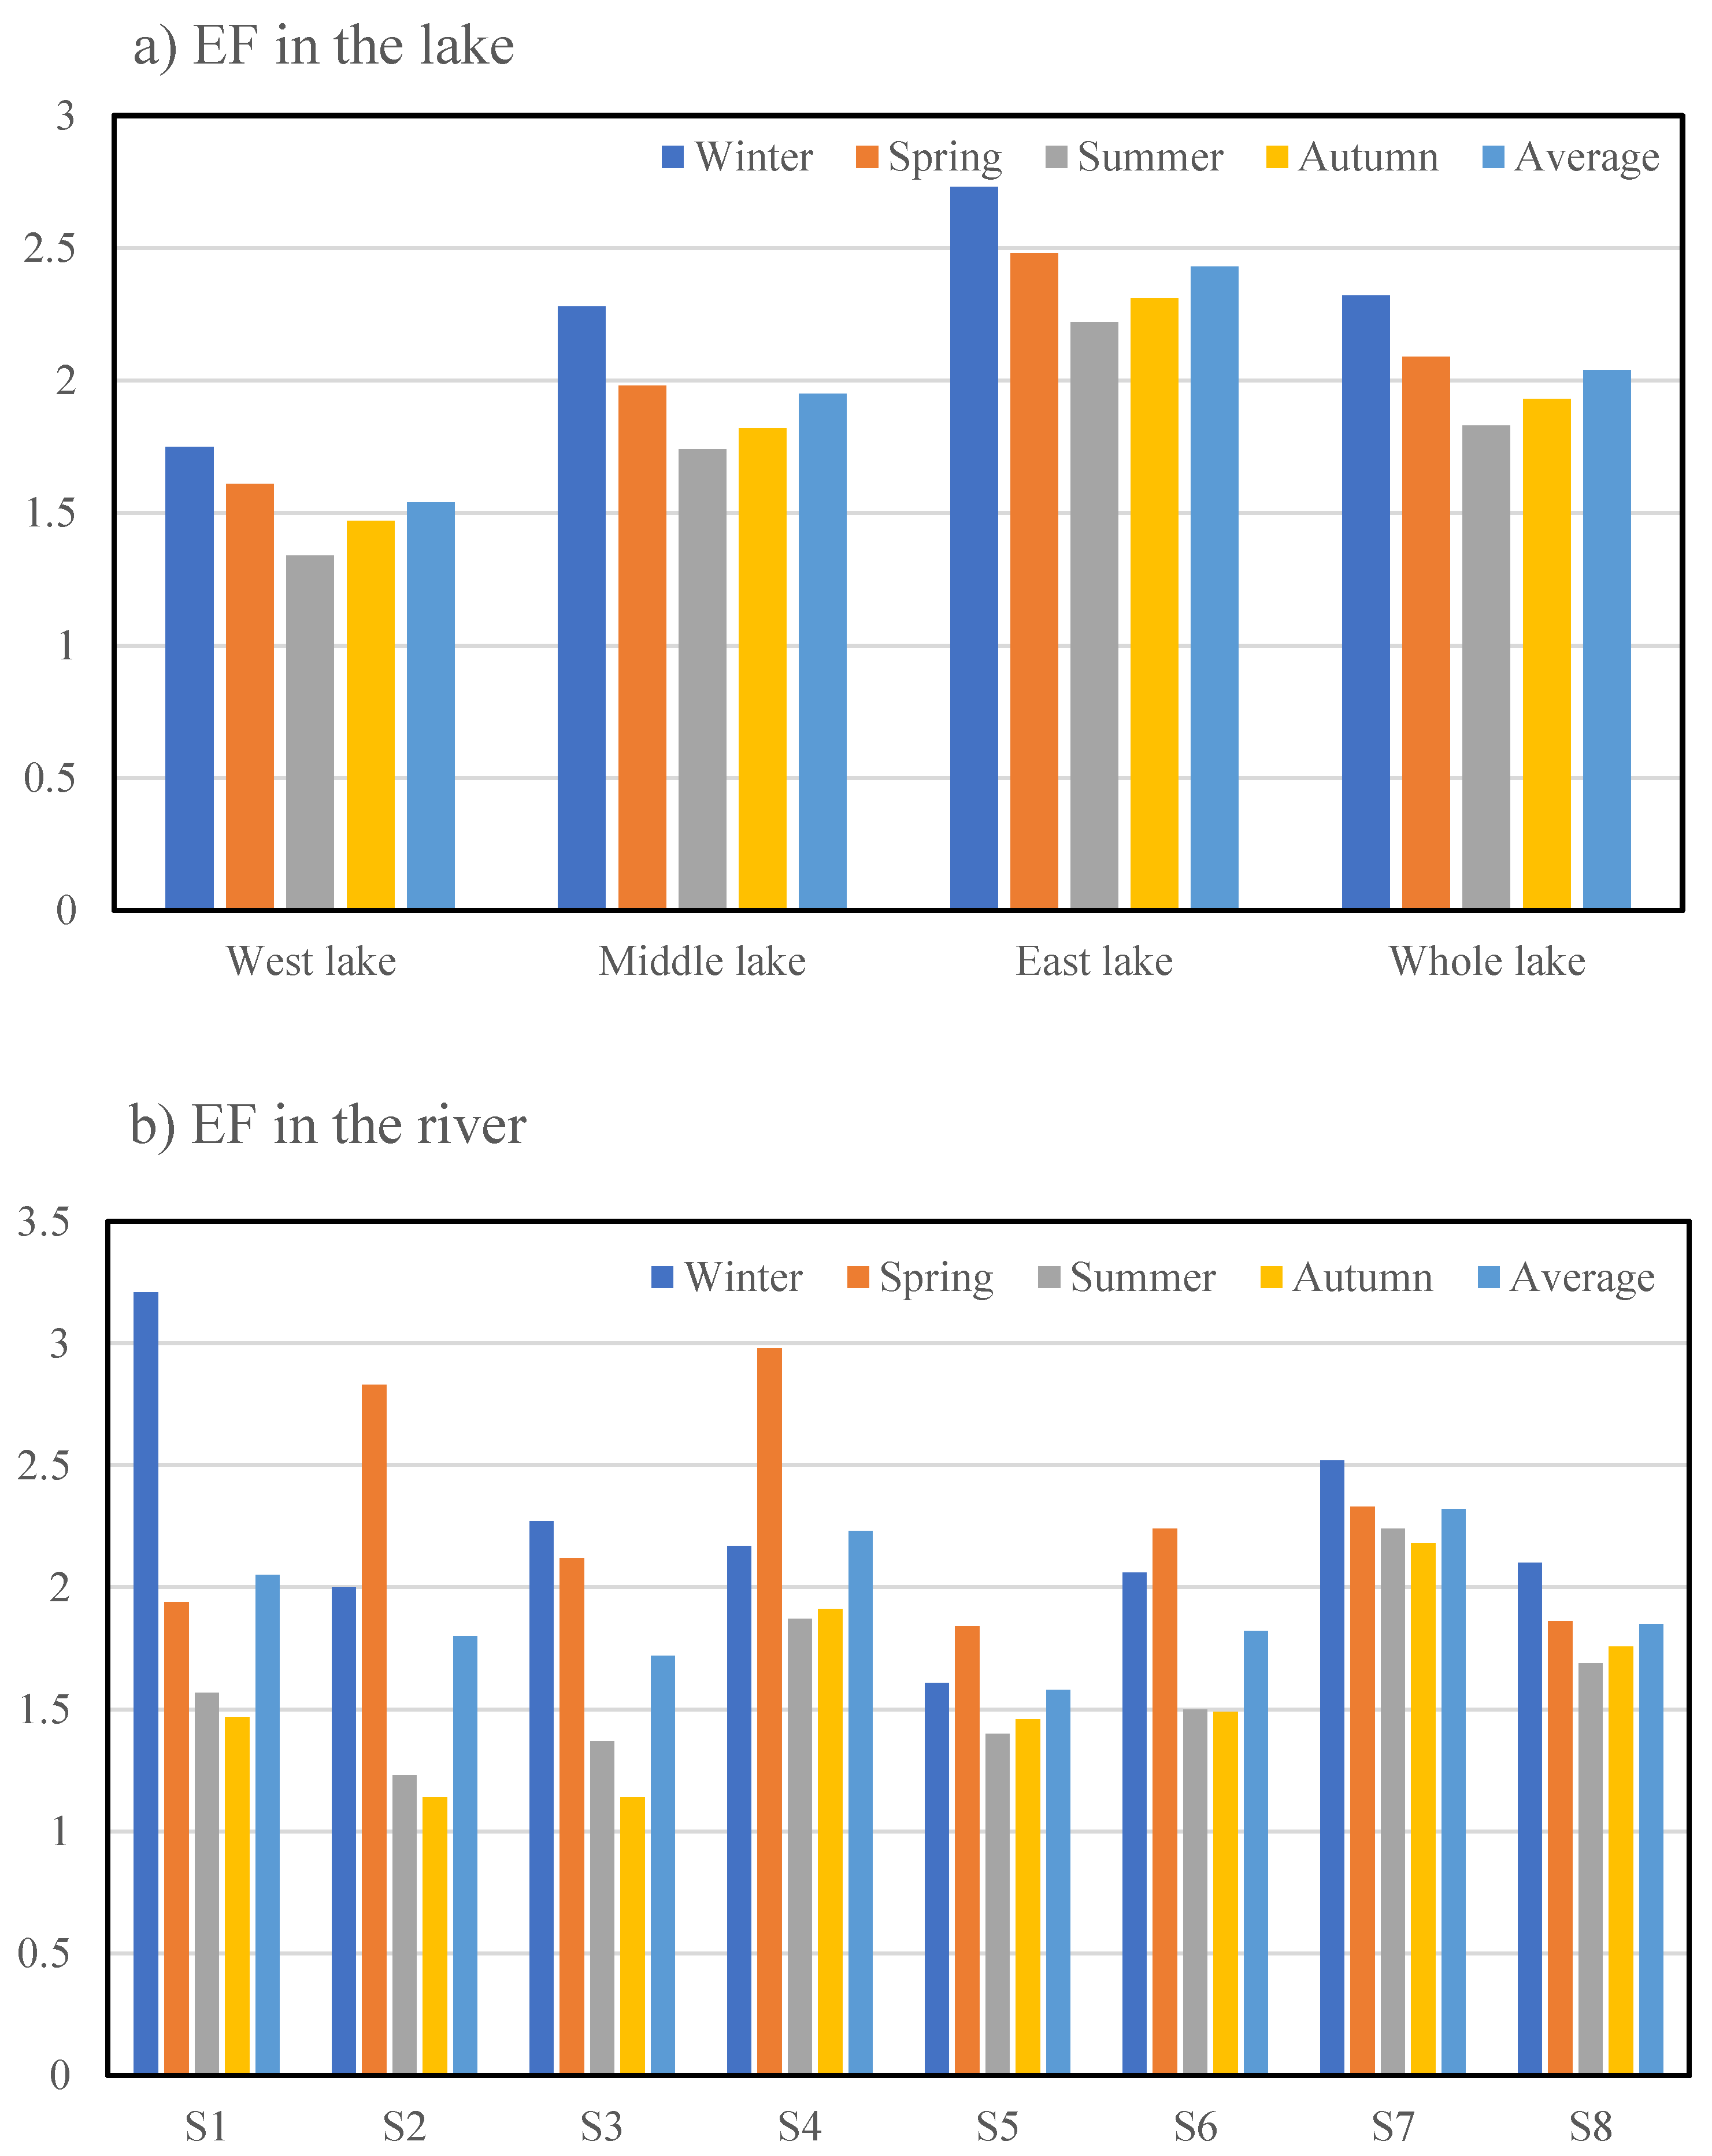
The nutrient contamination in the sediment was evaluated by EF in each season of the lake and connected rivers (Figure 5). The average EF for the entire lake was 2.04, which slightly exceeds the threshold of 2.0, indicating the nutrient pollution in Lake Yangcheng was severe (Figure 5a). EF also differed among lake areas. The nutrient contamination was most severe in the east lake (EF = 2.43), followed by the middle lake (EF = 1.95) and the west lake (EF = 1.54), which were both at the moderate level. The EF was highest at S7 (EF = 2.32), followed by S4 (EF = 2.23), S4 (EF = 2.23) and S1 (EF = 2.05); EF in these four rivers all exceeded 2.0, indicative of severe nutrient contamination (Figure 5b). The EF values in the remaining four rivers ranged from 1.58 to 1.85, suggesting moderate pollution. In addition, nutrient contamination in the lake and connected rivers showed similar temporal patterns, with the most severe impairment in winter and spring, and moderate impairment in summer and autumn (Figure 5).
3.5. The Vertical Dynamics of Nutrients in the Deep Sediment
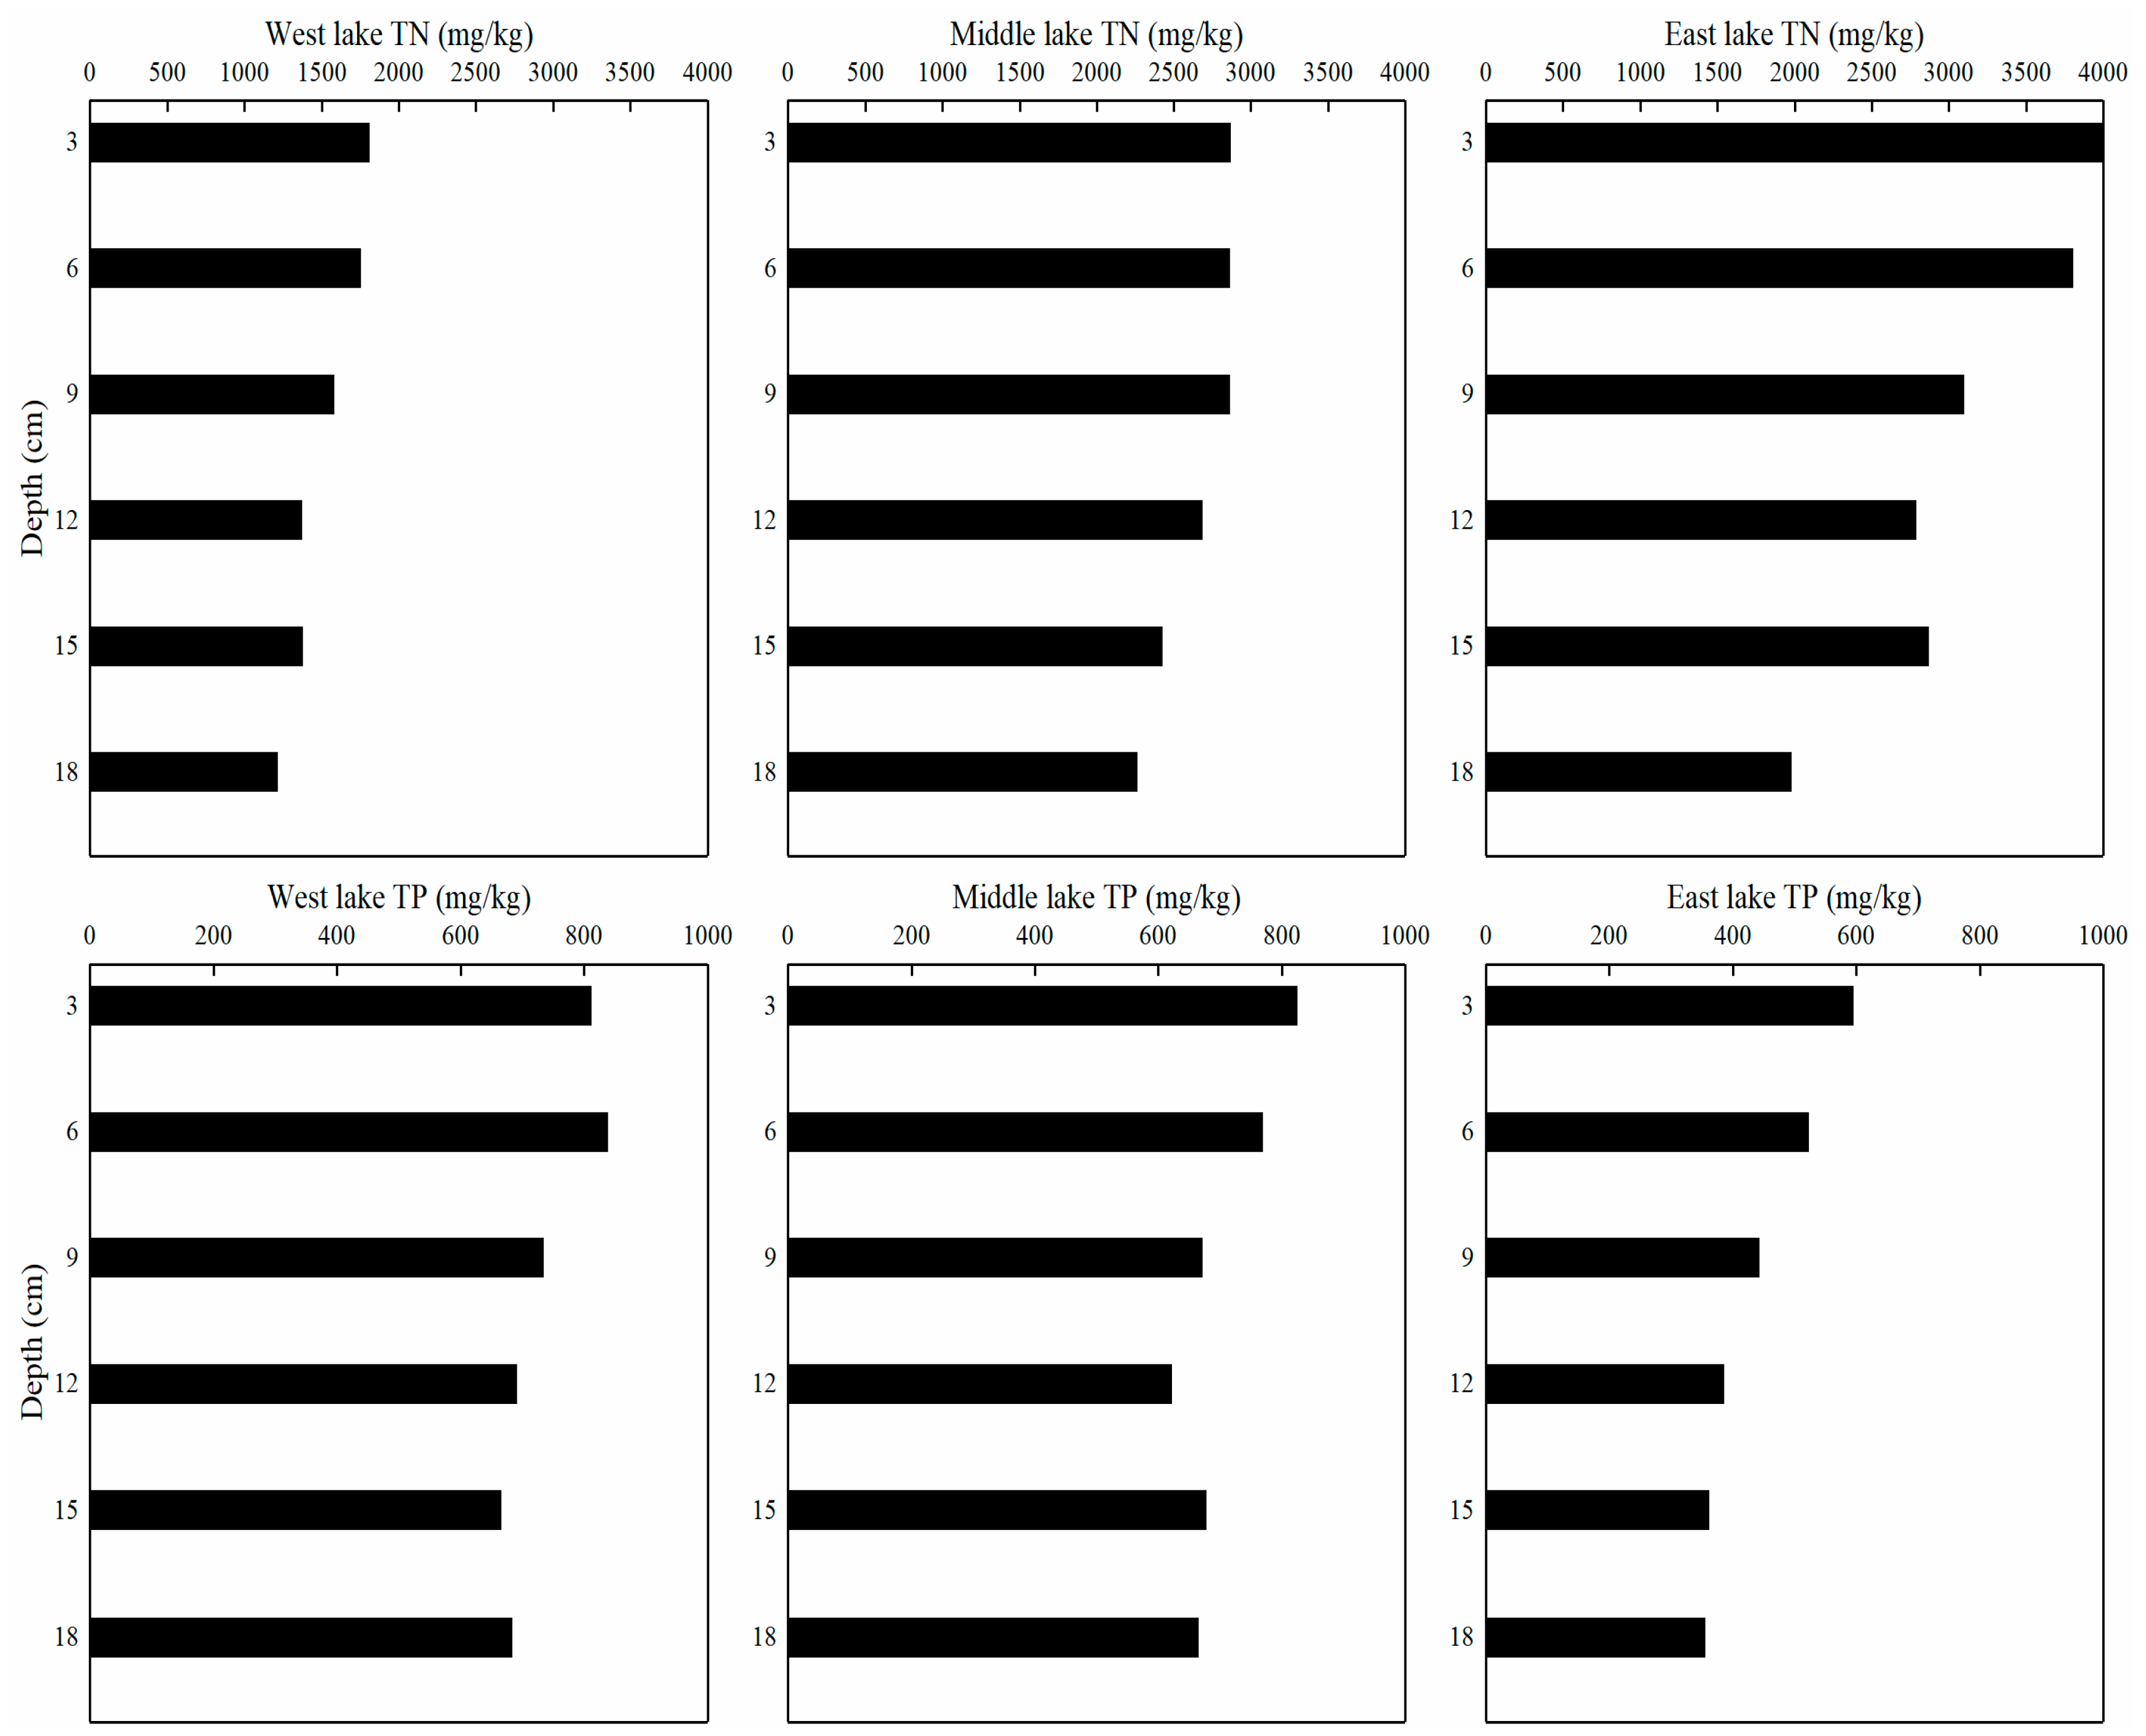
The concentrations of sediment TN and TP generally declined with depth (Figure 6). In the east lake, the content of TN at 3 cm depth was 3994.3 mg/kg, which was almost twice the concentration in the layer at 18 cm. In contrast, the content of TN in the west lake and middle lake ranged from 1806.40 mg/kg to 1214.63 mg/kg and from 2865.43 mg/kg to 2263.15 mg/kg, respectively. Thus, the decrease of TN with depth was observed in each lake area, but the magnitude of decline was greater at the east lake. The relative change of TP at different depths was similar to that of TN (Figure 6).
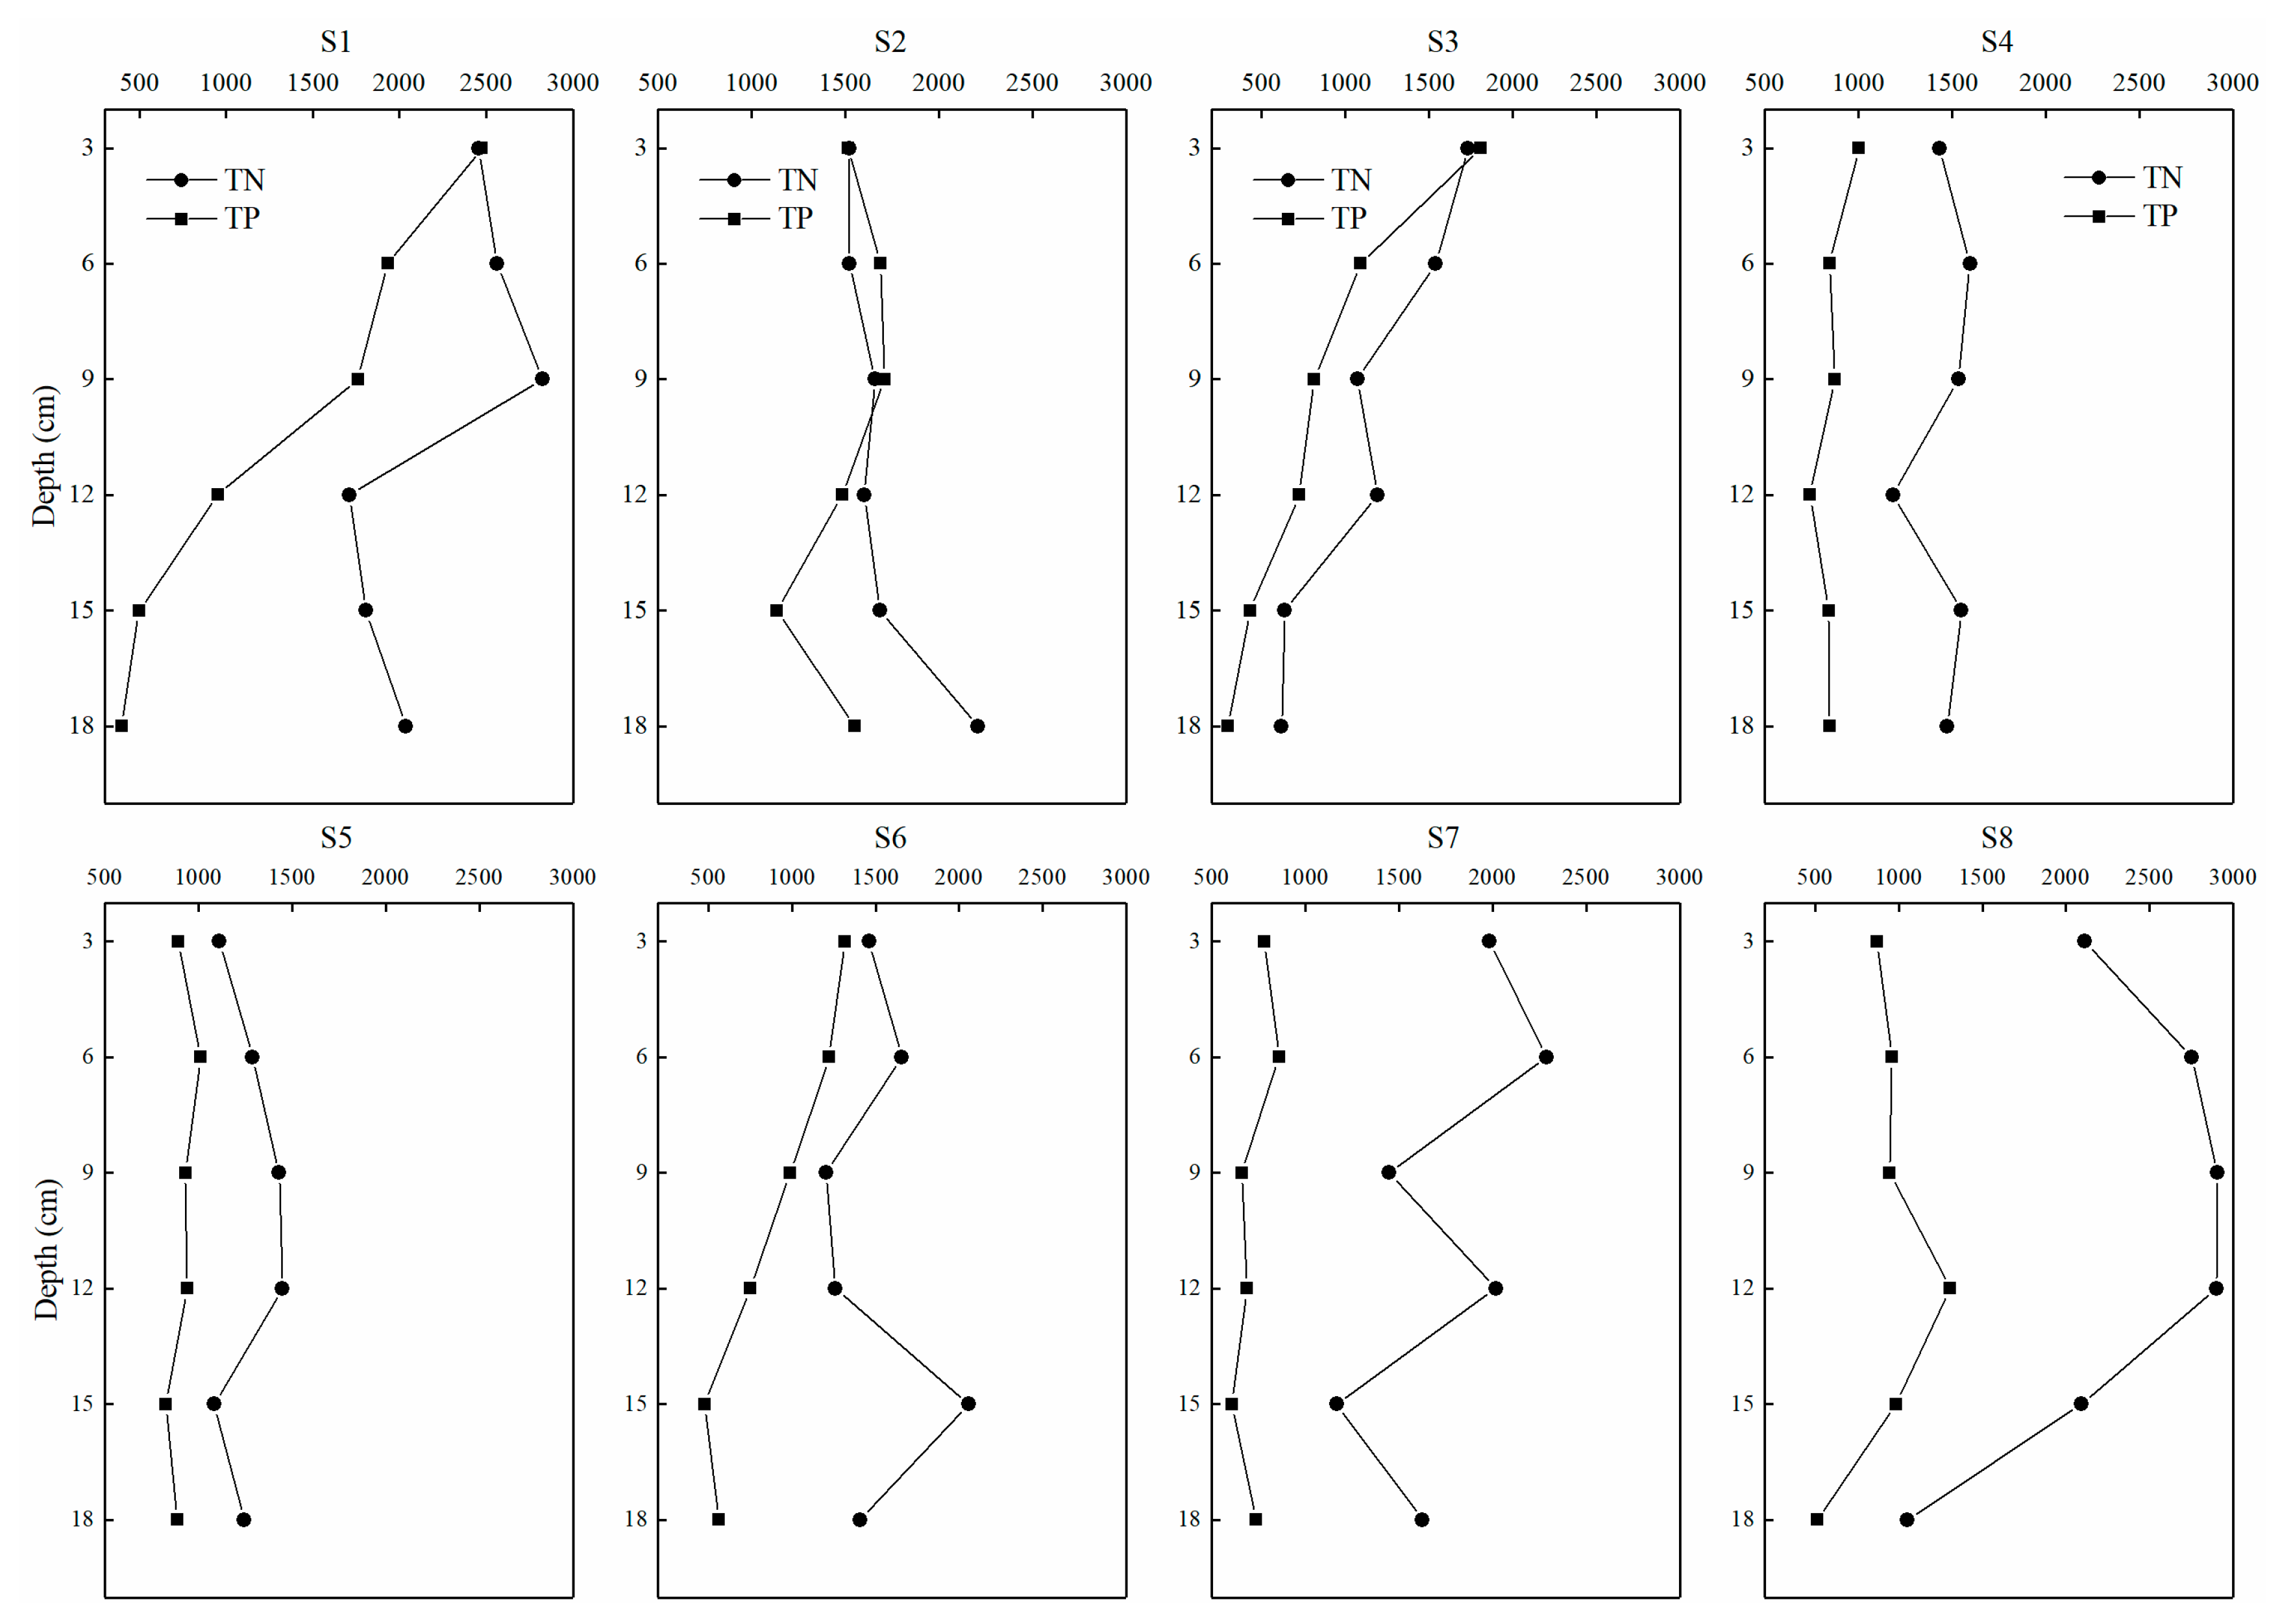
Furthermore, the concentrations of TN and TP exhibited three different patterns with the increase in river sediment depth (Figure 7). The first pattern was a distinct decrease of nutrient with depth, as seen for TP in S1 and for TN and TP in S3. The second pattern was an increase in nutrient content at shallow depths followed by a decline in deeper areas, as seen for TN in S1 and for TN and TP in S8. The third pattern was oscillating increases and decreases with depth, as observed for TN in S6 and TN and TP in S7.
4. Discussion
4.1. High Nutrient Levels and Seasonal Patterns of Nutrient Limitation in the Water Column
In recent years, the external and internal loading of nutrients and their potential ecological risks have received considerable attention because of their roles in the eutrophication and formation of dense algal blooms in freshwater lakes all over the world [19,22,25,34]. Even though efforts and actions have been undertaken by producers and government agencies to reduce external loading from domestic pollution sources, agricultural land use, and industrial pollution, their overall effectiveness is questionable. Even if successful, they do not address internal loading from the sediment, which can be another important source of nutrients [18]. Lake eutrophication has become a global environmental problem. According to a previous study, proposed nutrient criteria for TN and TP were 0.88 mg/L and 0.021 mg/L, respectively; levels above these figures may lead to the occurrence of cyanobacterial blooms [35]. In the current study, the average concentrations of TN and TP reached 1.5 mg/L and 0.09 mg/L, respectively, both of which exceed the aforementioned thresholds. Hence, Lake Yangcheng is at risk of severe harmful algal blooms (HABs).
The knowledge that a lake is susceptible to HABs is certainly useful, but from a lake management perspective, it is also important to know when the lake is most susceptible. It is well-documented that the rates and ratios of N and P supplies from both external loading and internal cycling can be highly seasonal [11]. In Lake Yangcheng, we observed a strong seasonal pattern of nutrient concentrations in the water column, with high TN in winter and high TP in summer, which was consistent with the seasonality of nutrient limitation. Nutrient dynamics in eutrophic lakes can vary seasonally, likely due to temperature and meteorological conditions, with P limitation often occurring in spring and winter and N limitation being observed in summer and fall when the environmental conditions are more conducive to phytoplankton growth [1,2,36].
4.2. Temporal Variations and Spatial Heterogeneity of Nutrients in the Lake Sediment
The present study also demonstrated that there were significant differences in the seasonal variations and spatial distribution of nutrients in the sediment of Lake Yangcheng. High TN contents in the sediment were usually observed in winter and spring, whereas low TN levels were recorded in summer and autumn. The seasonal dynamics of TN in the sediment were opposite to those of TN in the pore water. It is well known that N and P are the primary limiting factors influencing the growth of phytoplankton, especially cyanobacteria. In the warm seasons, phosphorus retained in the sediment may be released to the water column, supporting the development of algae [37]. Sediment P accumulation supports long-term internal loading, while N may be lost via denitrification, leading to perpetual N deficits. Other biogeochemical processes may further serve to reinforce seasonal dynamics of nutrients in the sediment [38]. The assimilation of nitrogen by cyanobacteria was the main pathway for nitrogen reduction in the surface layer, while denitrification played an important role both at the sediment–water interface and in the overlying water [38].
The TN levels in the surface sediments of Lake Yangcheng showed significant spatial heterogeneity, with high levels mainly concentrated in the east lake. This contrasts with the high TP concentrations found mainly in the west lake, where rivers flow into the lake. This difference in the spatial distribution of high TP and TN in the lake is attributable, in part, to the locations of high external loading but also from internal cycling patterns within the lake. Much of the lake’s TP is in the particulate fraction, which is susceptible to resuspension from wind-induced waves [39]. The percentage of pen aquaculture area exhibits significantly positive correlations with TN and TP according to a previous study in Lake Yangcheng [30]. Thus, the high nutrient levels in Lake Yangcheng may also be attributed to massive pen aquaculture in the lake, occupying an area of ~10.67 km2, accounting for approximately 10% of the entire lake. The crab breeding enterprise is mainly distributed in the east and middle parts of this lake, resulting in the production of TN and organic matter, which settles in the sediment [27]. Nitrogen is more likely to be transferred from water to sediment than from sediment to water. Therefore, due to many different forces working at various spatial and temporal scales, it is difficult to establish seasonal nutrient patterns on a lake-wide basis in large, shallow lakes [17].
4.3. The Influence of Rivers Runoff on the Distribution of Nutrients in the Lake
The identification of nutrient sources in the estuary of each inflowing river is critical for management needs. External nutrient loading from the eight connected rivers is an important factor influencing the enrichment of nutrients in the lake water. These sources are typically discharges from sewage treatment plants and industries as well as runoff from urban and agricultural areas. Increased nutrient levels lead to phytoplankton blooms and a subsequent reduction in DO levels and light penetration. Similarly, when rivers carry high levels of particulate nutrients into lakes, there is settling within the river mouths, as mixing zones result in greater particle settlement [40]. Impaired ecosystems often receive simultaneously high N and P inputs. We compared the external loadings of nutrients by major tributaries and internal loading by pen aquaculture in the middle and east lake areas. The net loadings of TN and TP were estimated as 268.5 kg/hm2 and 64.5 kg/hm2, respectively, according to a report from 2013 [41]. Thus, the loadings of TN should be 286.4 t and the loadings of TP should be 68.8 t, only accounting for 3.6% and 12.5% of the external loadings of nutrients, respectively. Consequently, in many situations, reducing both N and P from external inputs provides the best opportunity to reduce phytoplankton biomass and prevent nutrient problems from shifting to downstream systems. Driven by a combination of external discharge and internal processes, many freshwater systems are facing temporal alterations in nutrient concentrations and ratios [24].
One explanation for the abundant external nutrient inputs to Lake Yangcheng by the inflowing rivers is the undertaking of a diversion project. To improve the water quality and balance water resource demands of Lake Yangcheng, the Qipu River water diversion project was conducted to transport more water from the Yangtze River to the lake. Due to the expansion of S8, there was a substantial increase in velocity and discharge. Thus, the loadings from the Qipu River were the largest among all connected rivers. A previous study revealed that the best improvement of water quality happened when the water diversion volume ranged from 20 to 40 m3/s [42]. As a result, the water quality in the west part of Lake Yangcheng has improved while the middle and east lake regions have deteriorated. The diversion project halved the hydraulic retention time from the original 40 days. Hydrological alterations were usually associated with variation in the environmental conditions, having an influence on the structure and function of ecosystems. The potential ecological effects of the water conservancy project on Lake Yangcheng should be further evaluated in the future and perhaps modified to minimize negative impacts.
4.4. Nutrient Contamination and Their Vertical Distributions in the Deep Sediment
According to the enrichment factor index in the sediment, nutrient pollution in Lake Yangcheng is at a severe level. In recent years, the eutrophication of this shallow lake has become more severe, with more abundant algae and chlorophyll a concentrations [28]. The nutrients in the lake sediment usually result from both the mineralization of organic matter and external loading. With the rapid urbanization and economic development in Suzhou City, more pollution from aquaculture, agriculture, and sewage is being discharged into Lake Yangcheng. Additional studies and public engagement are needed to control the nutrient contamination being transporting to the lake via the rivers [43].
We also explored the vertical distribution of nutrients in different lake areas and their connected rivers. The concentrations of TN and TP in the deep sediment generally exhibited a decreasing pattern, which may be attributed to mineralization by microbes and benthic organisms. In shallow lakes, internal nutrient release can be induced by hydrodynamic disturbances, leading to the sudden increase nutrient concentrations in the overlying water [44]. The concentration gradient of nutrients in the surface sediment vs. the water column is a fundamental condition for diffusive internal loading [18]. The high concentrations of nutrients in the surface sediment made release more likely via either diffusion or resuspension. For shallow lakes like Lake Taihu and Lake Yangcheng, dredging is becoming an increasingly useful method to remove excessive nutrients from the lake ecosystem [26,45]. Therefore, while controlling the external loading through methods such as the control of wastewater sewage and nonpoint pollution is always an essential management strategy, a second important action is the ecological restoration of the catchment and lake ecosystem using best management practices and sediment dredging, respectively.
5. Conclusions
In summary, nutrient levels showed different seasonal patterns in the water column, with TN values highest in the winter and TP maximum in the summer in this eutrophic shallow lake. For the surface sediment, high concentrations of TN and TP were usually recorded in winter, followed by spring and autumn, with the lowest values recorded in summer. However, TN and TP concentrations in the pore water were highest in summer, unlike the temporal variations of nutrients in the lake sediment, which were highest in winter. In terms of spatial heterogeneity, more nutrient enrichment in the water column was distributed in the west portion of the lake, regardless of source or location. Further, high sediment TN values were mainly concentrated in the east lake, while high sediment TP levels were mainly observed in the west lake, which is similar to the spatial distribution of nutrients in the pore water. The total external loadings from these inflow rivers were estimated as 8024 t/year for TN and 552 t/year for TP. The inflowing rivers greatly contributed to the elevated nutrients in the water column, resulting in high concentrations of nutrients in the west lake, while the other two basins were impacted more by massive production in pen aquaculture. Additionally, nutrient contamination levels in the sediment of Lake Yangcheng were severe according to enrichment factor (EF), especially in the east part of the lake. With an increase in sediment depth, TN and TP concentrations exhibited similar decreasing patterns. Therefore, combined reductions to external loading and internal release are needed to control nutrient enrichment and improve water quality in these eutrophic and shallow lakes.
Supplementary Materials
The following supporting information can be downloaded at: https://www.mdpi.com/article/10.3390/w14020217/s1, Table S1: The coordinates of sampling sites in the lake and its major tributaries; Table S2: The Secchi disk depth (m) for each sampling sites in Lake Yangcheng; Table S3: The average and maximum depths for each lake basin in Lake Yangcheng; Table S4: The seasonal concentrations of dissolved oxygen in Lake Yangcheng; Figure S1: The locations of sampling sites and the range of pen aquaculture in Lake; Figure S2: The seasonal concentrations of nutrients in each river.
Author Contributions
X.S.; Formal analysis, data curation, writing—Original draft, visualization, Writing—Reviewing and editing. A.D.S.; Supervision, writing-reviewing and editing. Y.Z.; Writing—reviewing and editing. H.L.; Supervision, writing—reviewing and editing. D.W.; methodology, validation. All authors have read and agreed to the published version of the manuscript.
Funding
This research was supported by China Postdoctoral Science Foundation, grant number 2019M651754; Jiangsu Provincial Natural Science Foundation of China, grant number BK20210953, Open Research Fund of Jiangsu Province Key Laboratory of Environmental Engineering, grant numbers GYYS2021206, GYYS2021205, and ZX2018007; Taihu Lake water pollution control special funds, grant number TH2018402; and Major Science and Technology Program for Water Pollution Control and Treatment of China, grant number 2018ZX07208-007.
Institutional Review Board Statement
Not applicable.
Informed Consent Statement
Not applicable.
Data Availability Statement
All relevant data is within the manuscript.
Acknowledgments
The authors would like to acknowledge the assistance of Xiya Guo, Xiaoxiao Zhu, and Kai Zhu during the work of filed study and lab analysis.
Conflicts of Interest
The authors declare that they have no conflict of interest.
References
- Xu, H.; Paerl, H.W.; Qin, B.; Zhu, G.; Gaoa, G. Nitrogen and phosphorus inputs control phytoplankton growth in eutrophic Lake Taihu, China. Limnol. Oceanogr. 2010, 55, 420–432. [Google Scholar] [CrossRef] [Green Version]
- Paerl, H.W.; Scott, J.T.; McCarthy, M.J.; Newell, S.E.; Gardner, W.S.; Havens, K.E.; Hoffman, D.K.; Wilhelm, S.W.; Wurtsbaugh, W.A. It Takes Two to Tango: When and Where Dual Nutrient (N & P) Reductions Are Needed to Protect Lakes and Downstream Ecosystems. Environ. Sci. Technol. 2016, 50, 10805–10813. [Google Scholar] [CrossRef] [Green Version]
- Sinha, E.; Michalak, A.; Balaji, V. Eutrophication will increase during the 21st century as a result of precipitation changes. Science 2017, 357, 405–408. [Google Scholar] [CrossRef] [PubMed] [Green Version]
- Yang, B.; Jiang, Y.-J.; He, W.; Liu, W.-X.; Kong, X.-Z.; Jørgensen, S.E.; Xu, F.-L. The tempo-spatial variations of phytoplankton diversities and their correlation with trophic state levels in a large eutrophic Chinese lake. Ecol. Indic. 2016, 66, 153–162. [Google Scholar] [CrossRef] [Green Version]
- Jiang, Y.-J.; He, W.; Liu, W.-X.; Qin, N.; Ouyang, H.-L.; Wang, Q.-M.; Kong, X.-Z.; He, Q.-S.; Yang, C.; Yang, B.; et al. The seasonal and spatial variations of phytoplankton community and their correlation with environmental factors in a large eutrophic Chinese lake (Lake Chaohu). Ecol. Indic. 2014, 40, 58–67. [Google Scholar] [CrossRef]
- Harke, M.J.; Davis, T.W.; Watson, S.B.; Gobler, C.J. Nutrient-Controlled Niche Differentiation of Western Lake Erie Cyanobacterial Populations Revealed via Metatranscriptomic Surveys. Environ. Sci. Technol. 2016, 50, 604–615. [Google Scholar] [CrossRef]
- Davis, T.W.; Berry, D.L.; Boyer, G.L.; Gobler, C.J. The effects of temperature and nutrients on the growth and dynamics of toxic and non-toxic strains of Microcystis during cyanobacteria blooms. Harmful Algae 2009, 8, 715–725. [Google Scholar] [CrossRef]
- Su, X.; Steinman, A.D.; Oudsema, M.; Hassett, M.; Xie, L. The influence of nutrients limitation on phytoplankton growth and microcystins production in Spring Lake, USA. Chemosphere 2019, 234, 34–42. [Google Scholar] [CrossRef]
- Gobler, C.J.; Burkholder, J.M.; Davis, T.W.; Harke, M.J.; Johengen, T.; Stow, C.A.; Van de Waal, D.B. The dual role of nitrogen supply in controlling the growth and toxicity of cyanobacterial blooms. Harmful Algae 2016, 54, 87–97. [Google Scholar] [CrossRef] [PubMed]
- Smith, V.H.; Wood, S.A.; McBride, C.G.; Atalah, J.; Hamilton, D.P.; Abell, J. Phosphorus and nitrogen loading restraints are essential for successful eutrophication control of Lake Rotorua, New Zealand. Inland Waters 2016, 6, 273–283. [Google Scholar] [CrossRef] [Green Version]
- Andersen, I.M.; Williamson, T.J.; González, M.J.; Vanni, M.J. Nitrate, ammonium, and phosphorus drive seasonal nutrient limitation of chlorophytes, cyanobacteria, and diatoms in a hyper-eutrophic reservoir. Limnol. Oceanogr. 2019, 9999, 1–17. [Google Scholar] [CrossRef]
- Steinman, A.D.; Isely, E.S.; Thompson, K. Stormwater runoff to an impaired lake: Impacts and solutions. Environ. Monit. Assess. 2015, 187, 549. [Google Scholar] [CrossRef] [PubMed]
- Janssen, A.B.G.; de Jager, V.C.L.; Janse, J.H.; Kong, X.; Liu, S.; Ye, Q.; Mooij, W.M. Spatial identification of critical nutrient loads of large shallow lakes: Implications for Lake Taihu (China). Water Res. 2017, 119, 276–287. [Google Scholar] [CrossRef]
- Wijesiri, B.; Liu, A.; Deilami, K.; He, B.; Hong, N.; Yang, B.; Zhao, X.; Ayoko, G.; Goonetilleke, A. Nutrients and metals interactions between water and sediment phases: An urban river case study. Environ. Pollut. 2019, 251, 354–362. [Google Scholar] [CrossRef]
- Ylöstalo, P.; Seppälä, J.; Kaitala, S.; Maunula, P.; Simis, S. Loadings of dissolved organic matter and nutrients from the Neva River into the Gulf of Finland—Biogeochemical composition and spatial distribution within the salinity gradient. Mar. Chem. 2016, 186, 58–71. [Google Scholar] [CrossRef]
- Tang, C.; Li, Y.; Acharya, K. Modeling the effects of external nutrient reductions on algal blooms in hyper-eutrophic Lake Taihu, China. Ecol. Eng. 2016, 94, 164–173. [Google Scholar] [CrossRef] [Green Version]
- Zou, R.; Wu, Z.; Zhao, L.; Elser, J.J.; Yu, Y.; Chen, Y.; Liu, Y. Seasonal algal blooms support sediment release of phosphorus via positive feedback in a eutrophic lake: Insights from a nutrient flux tracking modeling. Ecol. Model. 2020, 416, 108881. [Google Scholar] [CrossRef]
- Steinman, A.D.; Spears, B. Internal Phosphorus Loading: Causes, Case Studies, and Management; J. Ross Publishing: Boca Raton, FL, USA, 2020. [Google Scholar]
- Ding, S.; Chen, M.; Gong, M.; Fan, X.; Qin, B.; Xu, H.; Gao, S.; Jin, Z.; Tsang, D.C.W.; Zhang, C. Internal phosphorus loading from sediments causes seasonal nitrogen limitation for harmful algal blooms. Sci. Total Environ. 2018, 625, 872–884. [Google Scholar] [CrossRef] [PubMed]
- Qin, B.; Hu, W.; Gao, G.; Luo, L.; Zhang, J. Dynamics of sediment resuspension and the conceptual schema of nutrient release in the large shallow Lake Taihu, China. Chin. Sci. Bull. 2004, 49, 54–64. [Google Scholar] [CrossRef]
- Søndergaard, M.; Bjerring, R.; Jeppesen, E. Persistent internal phosphorus loading during summer in shallow eutrophic lakes. Hydrobiologia 2013, 710, 95–107. [Google Scholar] [CrossRef]
- Wu, Z.; Liu, Y.; Liang, Z.; Wu, S.; Guo, H. Internal cycling, not external loading, decides the nutrient limitation in eutrophic lake: A dynamic model with temporal Bayesian hierarchical inference. Water Res. 2017, 116, 231–240. [Google Scholar] [CrossRef]
- Xu, F.-L.; Tao, S.; Dawson, R.W.; Xu, Z.R. The distributions and effects of nutrients in the sediments of a shallow eutrophic Chinese lake. Hydrobiologia 2003, 492, 85–93. [Google Scholar] [CrossRef]
- Wang, M.; Xu, X.; Wu, Z.; Zhang, X.; Sun, P.; Wen, Y.; Wang, Z.; Lu, X.; Zhang, W.; Wang, X.; et al. Seasonal Pattern of Nutrient Limitation in a Eutrophic Lake and Quantitative Analysis of the Impacts from Internal Nutrient Cycling. Environ. Sci. Technol. 2019, 53, 13675–13686. [Google Scholar] [CrossRef]
- Jiao, Y.; Yang, C.; He, W.; Liu, W.-X.; Xu, F.-L. The spatial distribution of phosphorus and their correlations in surface sediments and pore water in Lake Chaohu, China. Environ. Sci. Pollut. Res. 2018, 25, 25906–25915. [Google Scholar] [CrossRef]
- Yu, J.; Ding, S.; Zhong, J.; Fan, C.; Chen, Q.; Yin, H.; Zhang, L.; Zhang, Y. Evaluation of simulated dredging to control internal phosphorus release from sediments: Focused on phosphorus transfer and resupply across the sediment-water interface. Sci. Total Environ. 2017, 592, 662–673. [Google Scholar] [CrossRef]
- Liu, H.; Fu, C.; Ding, G.; Fang, Y.; Yun, Y.; Norra, S. Effects of hairy crab breeding on drinking water quality in a shallow lake. Sci. Total Environ. 2019, 662, 48–56. [Google Scholar] [CrossRef]
- Li, D.; Gu, A.Z.; He, M. Quantification and genetic diversity of total and microcystin-producing Microcystis during blooming season in Tai and Yang-cheng lakes, China. J. Appl. Microbiol. 2014, 116, 1482–1494. [Google Scholar] [CrossRef] [PubMed]
- Chen, L.; Zhang, Y.; Liu, Q.; Hu, Z.; Sun, Y.; Peng, Z.; Chen, L. Spatial variations of macrozoobenthos and sediment nutrients in Lake Yangcheng: Emphasis on effect of pen culture of Chinese mitten crab. J. Environ. Sci. 2015, 37, 118–129. [Google Scholar] [CrossRef]
- Luo, J.; Pu, R.; Ma, R.; Wang, X.; Lai, X.; Mao, Z.; Zhang, L.; Peng, Z.; Sun, Z. Mapping Long-Term Spatiotemporal Dynamics of Pen Aquaculture in a Shallow Lake: Less Aquaculture Coming along Better Water Quality. Remote Sens. 2020, 12, 1866. [Google Scholar] [CrossRef]
- Jiang, Y.; Wu, Z.; Zhao, Z.; Wang, X.; Liu, X.; Li, Q.; Cai, Y. Spatial Distribution and Pollution Assessment of Nitrogen, Phosphorus and Heavy Metals in Surface Sediments of Lake Yangcheng, Jiangsu Province, China. Res. Environ. Sci. (Chin.) 2016, 29, 1590–1599. [Google Scholar]
- Jin, X.; Tu, Q. The Standard Methods for Observation and Analysis in Lake Eutrophication; Chinese Environmental Science PresS: Beijing, China, 1990; pp. 138–207. [Google Scholar]
- Hou, D.; O’Connor, D.; Nathanail, P.; Tian, L.; Ma, Y. Integrated GIS and multivariate statistical analysis for regional scale assessment of heavy metal soil contamination: A critical review. Environ. Pollut. 2017, 231, 1188–1200. [Google Scholar] [CrossRef]
- Xu, T.; Yang, T.; Xiong, M. Time scales of external loading and spatial heterogeneity in nutrients-chlorophyll a response: Implication on eutrophication control in a large shallow lake. Ecol. Eng. 2020, 142, 105636. [Google Scholar] [CrossRef]
- Huo, S.; He, Z.; Ma, C.; Zhang, H.; Xi, B.; Xia, X.; Xu, Y.; Wu, F. Stricter nutrient criteria are required to mitigate the impact of climate change on harmful cyanobacterial blooms. J. Hydrol. 2019, 569, 698–704. [Google Scholar] [CrossRef]
- Xu, H.; Paerl, H.W.; Qin, B.; Zhu, G.; Hall, N.S.; Wu, Y. Determining Critical Nutrient Thresholds Needed to Control Harmful Cyanobacterial Blooms in Eutrophic Lake Taihu, China. Environ. Sci. Technol. 2015, 49, 1051–1059. [Google Scholar] [CrossRef]
- Zhou, X.; Chen, N.; Yan, Z.; Duan, S. Warming increases nutrient mobilization and gaseous nitrogen removal from sediments across cascade reservoirs. Environ. Pollut. 2016, 219, 490–500. [Google Scholar] [CrossRef]
- Shen, Y.; Huang, Y.; Hu, J.; Li, P.; Zhang, C.; Li, L.; Xu, P.; Zhang, J.; Chen, X. The nitrogen reduction in eutrophic water column driven by Microcystis blooms. J. Hazard. Mater. 2020, 385, 121578. [Google Scholar] [CrossRef]
- Wu, T.; Qin, B.; Brookes, J.D.; Yan, W.; Ji, X.; Feng, J. Spatial distribution of sediment nitrogen and phosphorus in Lake Taihu from a hydrodynamics-induced transport perspective. Sci. Total Environ. 2019, 650, 1554–1565. [Google Scholar] [CrossRef]
- Chomicki, K.M.; Howell, E.T.; Defield, E.; Dumas, A.; Taylor, W.D. Factors influencing the phosphorus distribution near the mouth of the Grand River, Ontario, Lake Erie. J. Great Lakes Res. 2016, 42, 549–564. [Google Scholar] [CrossRef]
- Zhou, L.; Gu, X.; Zeng, Q.; Mao, Z.; Sun, M.; Gao, H. Ecological culture effects of Eriocheir sinesis and the pollutant export in reclamation areas of Lake Gucheng, Jiangsu Province). J. Lake Sci. 2013, 25, 8. [Google Scholar]
- Gu, L.; Lai, X. Simulation study of water enviroment influence on Yangcheng Lake river networks by Qipu River water diversion project. Water Rresour. Prot. 2018, 34, 88–95. (In Chinese) [Google Scholar]
- Cheung, K.C.; Poon, B.H.T.; Lan, C.Y.; Wong, M.H. Assessment of metal and nutrient concentrations in river water and sediment collected from the cities in the Pearl River Delta, South China. Chemosphere 2003, 52, 1431–1440. [Google Scholar] [CrossRef]
- Qin, B.; Xu, P.; Wu, Q.; Luo, L.; Zhang, Y. Environmental issues of Lake Taihu, China. Hydrobiologia 2007, 581, 3–14. [Google Scholar] [CrossRef]
- Liu, C.; Zhong, J.; Wang, J.; Zhang, L.; Fan, C. Fifteen-year study of environmental dredging effect on variation of nitrogen and phosphorus exchange across the sediment-water interface of an urban lake. Environ. Pollut. 2016, 219, 639–648. [Google Scholar] [CrossRef] [PubMed]
Figure 1.
Maps showing the locations Lake Yangcheng in China and the sampling sites in this lake and its connected rivers (inflows) in this study.
Figure 1.
Maps showing the locations Lake Yangcheng in China and the sampling sites in this lake and its connected rivers (inflows) in this study.

Figure 2.
The seasonal variations of TN in the water column, surface sediment, and pore water displayed according to the values of 14 sampling sites in Lake Yangcheng. The colored areas indicate the concentrations of TN at the sampling sites. The color spectrum ranges from green (lowest) to red (highest).

Figure 3.
The seasonal variation of TP in the water column, surface sediment, and pore water displayed according to the values of 14 sampling sites in Lake Yangcheng. The colored areas indicate the concentrations of TP at the sampling sites. The color spectrum ranges from green (lowest) to red (highest).

Figure 4.
The seasonal variations of TN and TP loadings in each river for the first row; the seasonal concentrations of TN and TP in the river sediment and in the pore water for the middle and last row, respectively, including eight connected rivers flowing into Lake Yangcheng. Units located above each panel.

Figure 5.
The seasonal variation of nutrient pollution evaluated by enrichment factor (EF) in the surface sediment of (a) Lake Yangcheng including three lake regions and (b) eight connected (inflowing) rivers.
Figure 5.
The seasonal variation of nutrient pollution evaluated by enrichment factor (EF) in the surface sediment of (a) Lake Yangcheng including three lake regions and (b) eight connected (inflowing) rivers.

Figure 6.
The sediment concentration of TN and TP with depth in the three lake areas of Lake Yangcheng.
Figure 6.
The sediment concentration of TN and TP with depth in the three lake areas of Lake Yangcheng.

Figure 7.
TN and TP concentrations (unit: mg/kg) with depth of the sediment in the eight connected rivers.
Figure 7.
TN and TP concentrations (unit: mg/kg) with depth of the sediment in the eight connected rivers.


Table 1.
Standard and grades of comprehensive pollution in sediments.
| Level | STN | STP | FF | Status |
|---|---|---|---|---|
| 1 | STN < 1.0 | STP < 0.5 | FF < 1.0 | Clean |
| 2 | 1.0 ≤ STN ≤ 1.5 | 0.5 ≤ STP ≤ 1.0 | 1.0 ≤ FF ≤ 1.5 | Minor contamination |
| 3 | 1.5 < STN ≤ 2.0 | 1.0 < STP ≤ 1.5 | 1.5 < FF ≤ 2.0 | Moderate contamination |
| 4 | STN > 2.0 | STP > 1.5 | FF > 2.0 | Severe contamination |
Table 2.
The averages and standard deviation (SD) of TN concentrations in different seasons of the water column, surface sediment, and pore water in Lake Yangcheng. Different letters represent statistically significant differences according to Fisher’s PLSD test (p < 0.05). Upper case letters (row): among different areas (west, middle, and east); lower case letters (column): among different seasons (winter, spring, summer, and autumn).
| TN | Season | West Lake | Middle Lake | East Lake | Whole Lake |
|---|---|---|---|---|---|
| Water column (mg/L) | Winter | 3.38 ± 0.67 | 2.14 ± 0.33 | 1.57 ± 0.39 | 2.25 ± 0.89 a |
| Spring | 1.69 ± 0.20 | 1.11 ± 0.31 | 0.99 ± 0.13 | 1.22 ± 0.37 b | |
| Summer | 1.38 ± 0.26 | 1.30 ± 0.26 | 1.35 ± 0.25 | 1.35 ± 0.24 b | |
| Autumn | 1.56 ± 0.17 | 1.19 ± 0.48 | 0.96 ± 0.40 | 1.19 ± 0.43 b | |
| Average | 2.00 ± 0.26 A | 1.43 ± 0.20 B | 1.22 ± 0.09 B | 1.50 ± 0.38 | |
| Surface sediment (mg/kg) | Winter | 1806.4 ± 632.6 | 2865.4 ± 861.9 | 3994.3 ± 1396.1 | 3046.7 ± 1378.6 a |
| Spring | 1814.9 ± 386.7 | 2348.9 ± 544.5 | 3139.8 ± 1219.7 | 2535.3 ± 1007.1 a | |
| Summer | 1011.6 ± 260.3 | 1540.7 ± 256.2 | 2031.5 ± 798.4 | 1599.9 ± 685.2 b | |
| Autumn | 1134.3 ± 153.7 | 1732.0 ± 1050.5 | 1825.3 ± 1311.4 | 1601.2 ± 1008.5 b | |
| Average | 1441.8 ± 342.2 A | 2121.8 ± 631.5 AB | 2747.7 ± 937.4 B | 2195.8 ± 879.9 | |
| Pore water (mg/L) | Winter | 3.10 ± 1.46 | 3.66 ± 1.52 | 3.12 ± 1.29 | 3.27 ± 1.31 a |
| Spring | 4.03 ± 1.71 | 3.40 ± 0.61 | 4.93 ± 2.42 | 4.23 ± 1.86 a | |
| Summer | 5.58 ± 0.82 | 3.19 ± 0.68 | 6.44 ± 4.50 | 5.26 ± 3.17 a | |
| Autumn | 3.33 ± 1.52 | 5.36 ± 2.94 | 5.31 ± 3.66 | 4.76 ± 2.92 a | |
| Average | 4.01 ± 1.22 A | 3.90 ± 1.29 A | 4.95 ± 2.53 A | 4.38 ± 1.86 |
Table 3.
The averages and standard deviation (SD) of TP concentrations in different seasons of the water column, surface sediment, and pore water in Lake Yangcheng. Different letters represent statistically significant differences according to Fisher’s PLSD test (p < 0.05). Upper case letters (row): among different areas (west, middle, and east); lower case letters (column): among different seasons (winter, spring, summer, and autumn).
| TP | Season | West Lake | Middle Lake | East Lake | Whole Lake |
|---|---|---|---|---|---|
| Water column (mg/L) | Winter | 0.17 ± 0.08 | 0.08 ± 0.01 | 0.06 ± 0.01 | 0.10 ± 0.06 a |
| Spring | 0.04 ± 0.02 | 0.02 ± 0.01 | 0.02 ± 0.004 | 0.02 ± 0.01 b | |
| Summer | 0.21 ± 0.06 | 0.14 ± 0.03 | 0.11 ± 0.04 | 0.15 ± 0.06 c | |
| Autumn | 0.14 ± 0.03 | 0.08 ± 0.04 | 0.06 ± 0.05 | 0.09 ± 0.05 a | |
| Average | 0.14 ± 0.04 A | 0.08 ± 0.02 BC | 0.06 ± 0.02 C | 0.09 ± 0.04 | |
| Surface sediment (mg/kg) | Winter | 810.8 ± 421.9 | 824.7 ± 239.7 | 594.1 ± 158.6 | 721.9 ± 277.9 a |
| Spring | 578.3 ± 314.0 | 525.5 ± 190.9 | 493.8 ± 386.8 | 527.0 ± 300.0 ab | |
| Summer | 386.9 ± 123.5 | 375.5 ± 132.5 | 346.7 ± 205.9 | 366.4 ± 155.6 b | |
| Autumn | 600.6 ± 246.6 | 488.1 ± 131.3 | 573.0 ± 639.8 | 556.6 ± 421.5 ab | |
| Average | 594.2 ± 273.7 A | 553.5 ± 151.4 A | 501.9 ± 206.9 A | 543.0 ± 201.6 | |
| Pore water (mg/L) | Winter | 0.52 ± 0.34 | 0.34 ± 0.24 | 0.48 ± 0.21 | 0.45 ± 0.25 a |
| Spring | 0.47 ± 0.40 | 0.40 ± 0.30 | 0.35 ± 0.17 | 0.40 ± 0.27 a | |
| Summer | 2.16 ± 0.25 | 1.10 ± 0.57 | 0.70 ± 0.68 | 1.23 ± 0.82 b | |
| Autumn | 2.28 ± 1.12 | 1.22 ± 0.29 | 0.47 ± 0.07 | 1.20 ± 0.96 b | |
| Average | 1.36 ± 0.45 A | 0.76 ± 0.23 BC | 0.50 ± 0.18 C | 0.82 ± 0.46 |
Publisher’s Note: MDPI stays neutral with regard to jurisdictional claims in published maps and institutional affiliations. |
© 2022 by the authors. Licensee MDPI, Basel, Switzerland. This article is an open access article distributed under the terms and conditions of the Creative Commons Attribution (CC BY) license (https://creativecommons.org/licenses/by/4.0/).
Share and Cite
MDPI and ACS Style
Su, X.; Steinman, A.D.; Zhang, Y.; Ling, H.; Wu, D. Significant Temporal and Spatial Variability in Nutrient Concentrations in a Chinese Eutrophic Shallow Lake and Its Major Tributaries. Water 2022, 14, 217. https://doi.org/10.3390/w14020217
AMA Style
Su X, Steinman AD, Zhang Y, Ling H, Wu D. Significant Temporal and Spatial Variability in Nutrient Concentrations in a Chinese Eutrophic Shallow Lake and Its Major Tributaries. Water. 2022; 14(2):217. https://doi.org/10.3390/w14020217
Chicago/Turabian StyleSu, Xiaomei, Alan D. Steinman, Yunlin Zhang, Hong Ling, and Dan Wu. 2022. "Significant Temporal and Spatial Variability in Nutrient Concentrations in a Chinese Eutrophic Shallow Lake and Its Major Tributaries" Water 14, no. 2: 217. https://doi.org/10.3390/w14020217
Note that from the first issue of 2016, this journal uses article numbers instead of page numbers. See further details here.