
Determining the Risk Level of Heavy Rain Damage by Region in South Korea


1
Institute of Water Resources System, Inha University, Incheon 22201, Korea
2
Department of Civil Engineering, Inha University, Incheon 22201, Korea
3
Blackland Research and Extension Center, Texas A&M AgriLife, Temple, TX 76502, USA
*
Author to whom correspondence should be addressed.
Water 2022, 14(2), 219; https://doi.org/10.3390/w14020219
Submission received: 6 December 2021
/
Revised: 7 January 2022
/
Accepted: 8 January 2022
/
Published: 12 January 2022
(This article belongs to the Topic Natural Hazards and Disaster Risks Reduction)
Abstract
:For risk assessment, two methods, quantitative risk assessment and qualitative risk assessment, are used. In this study, we identified the regional risk level for a disaster-prevention plan for an overall area at the national level using qualitative risk assessment. To overcome the limitations of previous studies, a heavy rain damage risk index (HDRI) was proposed by clarifying the framework and using the indicator selection principle. Using historical damage data, we also carried out hierarchical cluster analysis to identify the major damage types that were not considered in previous risk-assessment studies. The result of the risk-level analysis revealed that risk levels are relatively high in some cities in South Korea where heavy rain damage occurs frequently or is severe. Five causes of damage were derived from this study—A: landslides, B: river inundation, C: poor drainage in arable areas, D: rapid water velocity, and E: inundation in urban lowlands. Finally, a prevention project was proposed considering regional risk level and damage type in this study. Our results can be used when macroscopically planning mid- to long-term disaster prevention projects.
1. Introduction
The frequency and magnitude of natural disasters such as localized torrential rain and typhoons caused by climate change are increasing worldwide, and have resulted in massive property damage and casualties [1]. Heavy rainfall damage, which is one of the main types of natural disaster in South Korea, causes over 120 million USD in damage every year in South Korea [2]. Emergency managers in many countries use four phases of disaster management to reduce the damage caused by natural disasters—Phase 1: Mitigation, Phase 2: Preparedness, Phase 3: Response, and Phase 4: Recovery. The mitigation phase is to prevent future emergencies and to take steps to minimize their effects. The preparedness phase is to take actions ahead of time to be ready for an emergency. The response phase is to protect people and property in the wake of an emergency, disaster, or crisis. The recovery phase is to rebuild after a disaster in an effort to return operations back to normal. The mitigation phase is an especially important element that forms the basis of disaster management.
Studies on the mitigation phase are closely related to risk assessment and are divided into quantitative and qualitative risk assessments. Within quantitative risk assessment, flood risk (i.e., inundation depth and area of flooded land) is analyzed based on a physical model, and quantitative loss (i.e., damage of property and fatality) is also identified. Țîncu, et al. [3] estimated direct flood damage in three scenarios (i.e., residential buildings, infrastructure, agriculture) in the basin of the Trotus River located in Romania. Di et al. [4] proposed a quantitative risk assessment method for the loss of fatality caused by floods. In this study, we reproduced the 1953 East Coast flood event in England and used several methods, such as “Mortality Function” and “Flood Risk Method to People”, for detailed assessments of the subsequent mortality. The quantitative risk assessment method can be used to calculate the cost-benefit ratio through reduced loss when disaster prevention facilities are introduced in a specific area; this method can then be utilized to evaluate the economics of prevention facilities.
For qualitative risk assessment, the integrated index is calculated using statistical indicators reflecting regional characteristics, and the risk level of each region is analyzed. This method can be used to identify the relative level of risk when establishing a disaster prevention plan for the overall area at the national level. Zhang et al. [5] proposed a fourth-grade flood damage risk index (FDRI) that considers the potential flood damage risk, the status of flood damage, flood damage change, degree of social and economic development, and flood damage defense capability. Fekete [6] proposed social flood vulnerability indicators based on factor analysis of flood damage data collected by Germany’s Federal Government Statistics Office. Sharma et al. [7] assessed the flood risk in the Kopili River basin of India using flood maps derived from satellite data by overlapping them with GIS data on roads, crops, and buildings. Amira et al. [8] used qualitative flood risk assessment to ascertain the risk of flooding in Jakarta, assigning each indicator a score using the categorical scale method.
In previous research related to qualitative risk assessment, a framework to define flood risk has been heavily emphasized. For example, Lim et al. [9] developed dimension-related indicators for various basins based on the Organization for Economic Cooperation and Development (OECD)’s (2001) P-S-R framework (i.e., the pressure, state, and response framework), and proposed a flood risk index (FRI) that can identify the overall flood risk for any given study area. Within the P-S-R framework [10] used in this study, P refers to a dangerous natural phenomenon or economic loss, S refers to the inventory affected by dangerous natural phenomena, and R refers to the ability to adapt to dangerous natural phenomena; however, the PSR framework cannot consider inventory vulnerability. Anindita et al. [11] performed a spatial assessment of flood risk for coastal areas of Central Java, Indonesia, based on the Intergovernmental Panel on Climate Change (IPCC) framework (i.e., considering nature of hazard, exposure, sensitivity, and adaptive capacity). Each region was divided into five risk levels and mapped using GIS. In the IPCC framework [12], hazard, exposure, and adaptive capacity have the same meaning as pressure, state, and response of the PSR framework; sensitivity refers to the vulnerability of the inventory. The Korea Institute of Civil Engineering and Building Technology (KICT) [13] evaluated qualitative flood risk for Korea using the framework (i.e., considering hazard, exposure, vulnerability, capacity) presented by the United Nations International Strategy for Disaster Reduction (UNISDR). The components of the UNISDR framework [14] are similar in meaning to the IPCC’s framework, with the only difference being in words such as vulnerability (sensitivity is used instead) and capacity (adaptive capacity is used instead).
The results of the aforementioned risk assessment may be analyzed differently depending on the selection of indicators. Rygel et al. [15] mentioned that the most important factor in vulnerability assessment is selecting an appropriate indicator, and proposed vulnerability assessment techniques that were selected as indicators using the Pareto-ranking process. Joo et al. [16] stated that disaster management decision-makers may be perplexed by inconsistent results for each methodology of flood risk assessment. To solve this issue, a new method was proposed based on a Bayesian network, designed to support comprehensive judgment by integrating indicators and weights in major previous studies. Kim et al. [17] selected assessment indicators via factor analysis and proposed a heavy rain damage risk index (HDRI). They then presented the results of the risk assessment by classifying it into three risk levels for Gyeonggi-do, South Korea. Birkmann [18] mentioned that because the selection of an indicator is the most important part of process to develop an index, it should be selected through clear principles. In addition, he proposed the concept of a method for qualitative disaster risk assessment.
However, in many previous studies, there is insufficient evidence to support selection on assessment indicators, and the frameworks used in their studies are unclear. Therefore, this study used the UNISDR framework (i.e., hazard, exposure, vulnerability, and capacity), which is judged to be the most clearly distinguished among such frameworks. In addition, a clear selection principle was identified by reviewing the selection principles mentioned in previous studies, after which the assessment indicators were selected.
There are various types of disaster prevention projects related to floods, which are related to the causes of flood damage (river maintenance project: river inundation; erosion control maintenance project: landslide; sewer pipe maintenance project: inland flooding due to poor sewage; drainage pump station project: inland flooding in the region of lower elevation, etc.). However, previous studies did not consider the regional cause of flood damage. As a result, although it was possible to grasp the level of risk in each region, it was not possible to present a disaster-prevention project favorable to the region. To address these limitations, the aim of this study is twofold.
The first aim is to improve the limitations, such as unclear frameworks, the assessment indicator selection of previous qualitative risk assessments; we investigated the assessment indicators and frameworks used in previous studies. The UNISDR’s framework (i.e., hazard, exposure, vulnerability, and capacity) was judged the most clearly distinguished among the various frameworks. The assessment indicators used in previous studies were then reconstructed into the UNISDR framework. The second aim is to identify the main causes of damage, by region, that were not considered in previous studies. We also performed hierarchical cluster analysis using historical damage data through a novel approach to the existing methodology. Furthermore, the assessment indicators used in this study were chosen based on six selection principles. Finally, a prevention project suitable depending on the regional damage type was proposed.
2. Theoretical Background (Materials and Methodology)
2.1. Characteristics of the Study Area
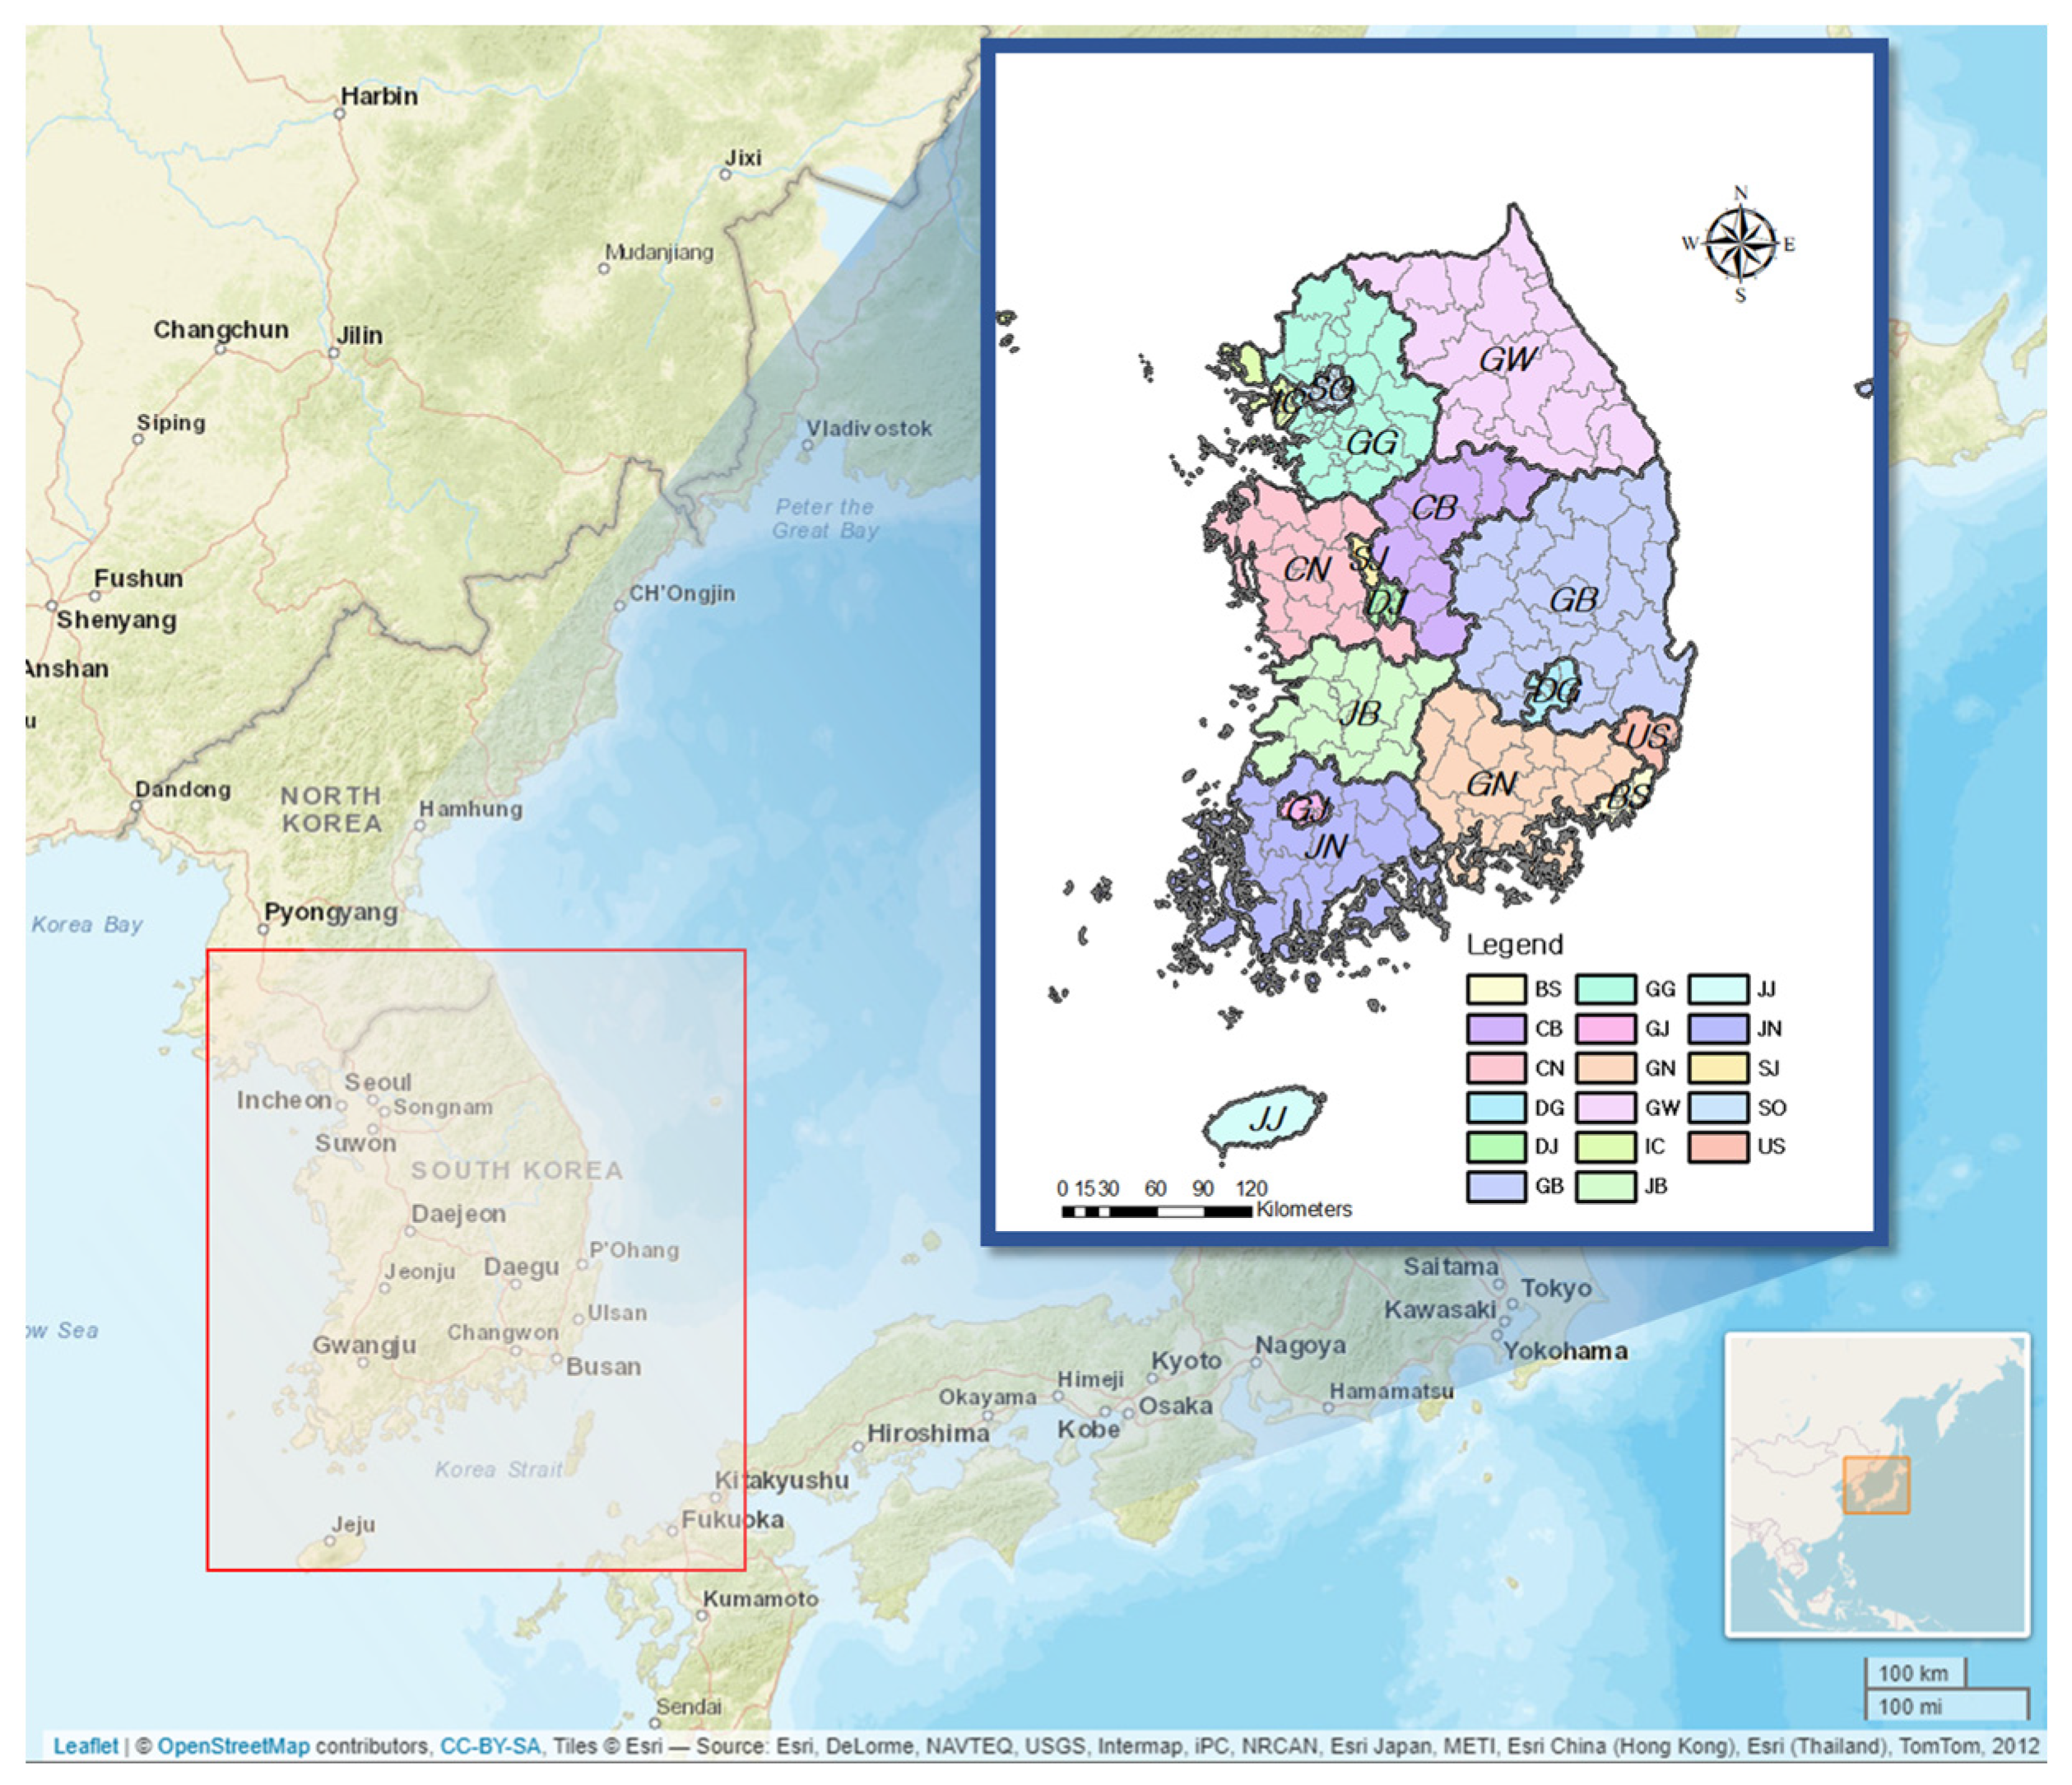
In this study, South Korea was selected as the study area. South Korea is divided into nine provinces, i.e., GyeongGi (GG), GangWon (GW), GyeongsangBuk (GB), GyeongsangNam (GN), ChungcheongBuk (CB), ChungcheongNam (CN), JeollaBuk (JB), JeollaNam (JB), and JeJu (JJ), and eight major cities, i.e., Seoul (SO), Incheon (IC), Busan (BS), Daegu (DG), Ulsan (US), Daejeon (DJ), Sejong (SJ), and Gwangju (GJ). These cities and provinces have an average of 14 administrative districts, giving a total of 228 administrative districts. The location and features of the administrative districts of South Korea are summarized in Figure 1 and Table 1. In general, the eight cities have a higher level of regional development than the provinces. Therefore, these cities contain a large number of impervious areas, whereas the provinces contain large portions of permeable areas due to their agricultural system. Despite being a province, Gyeonggi-do has a high level of regional development because it is included in the metropolitan area.
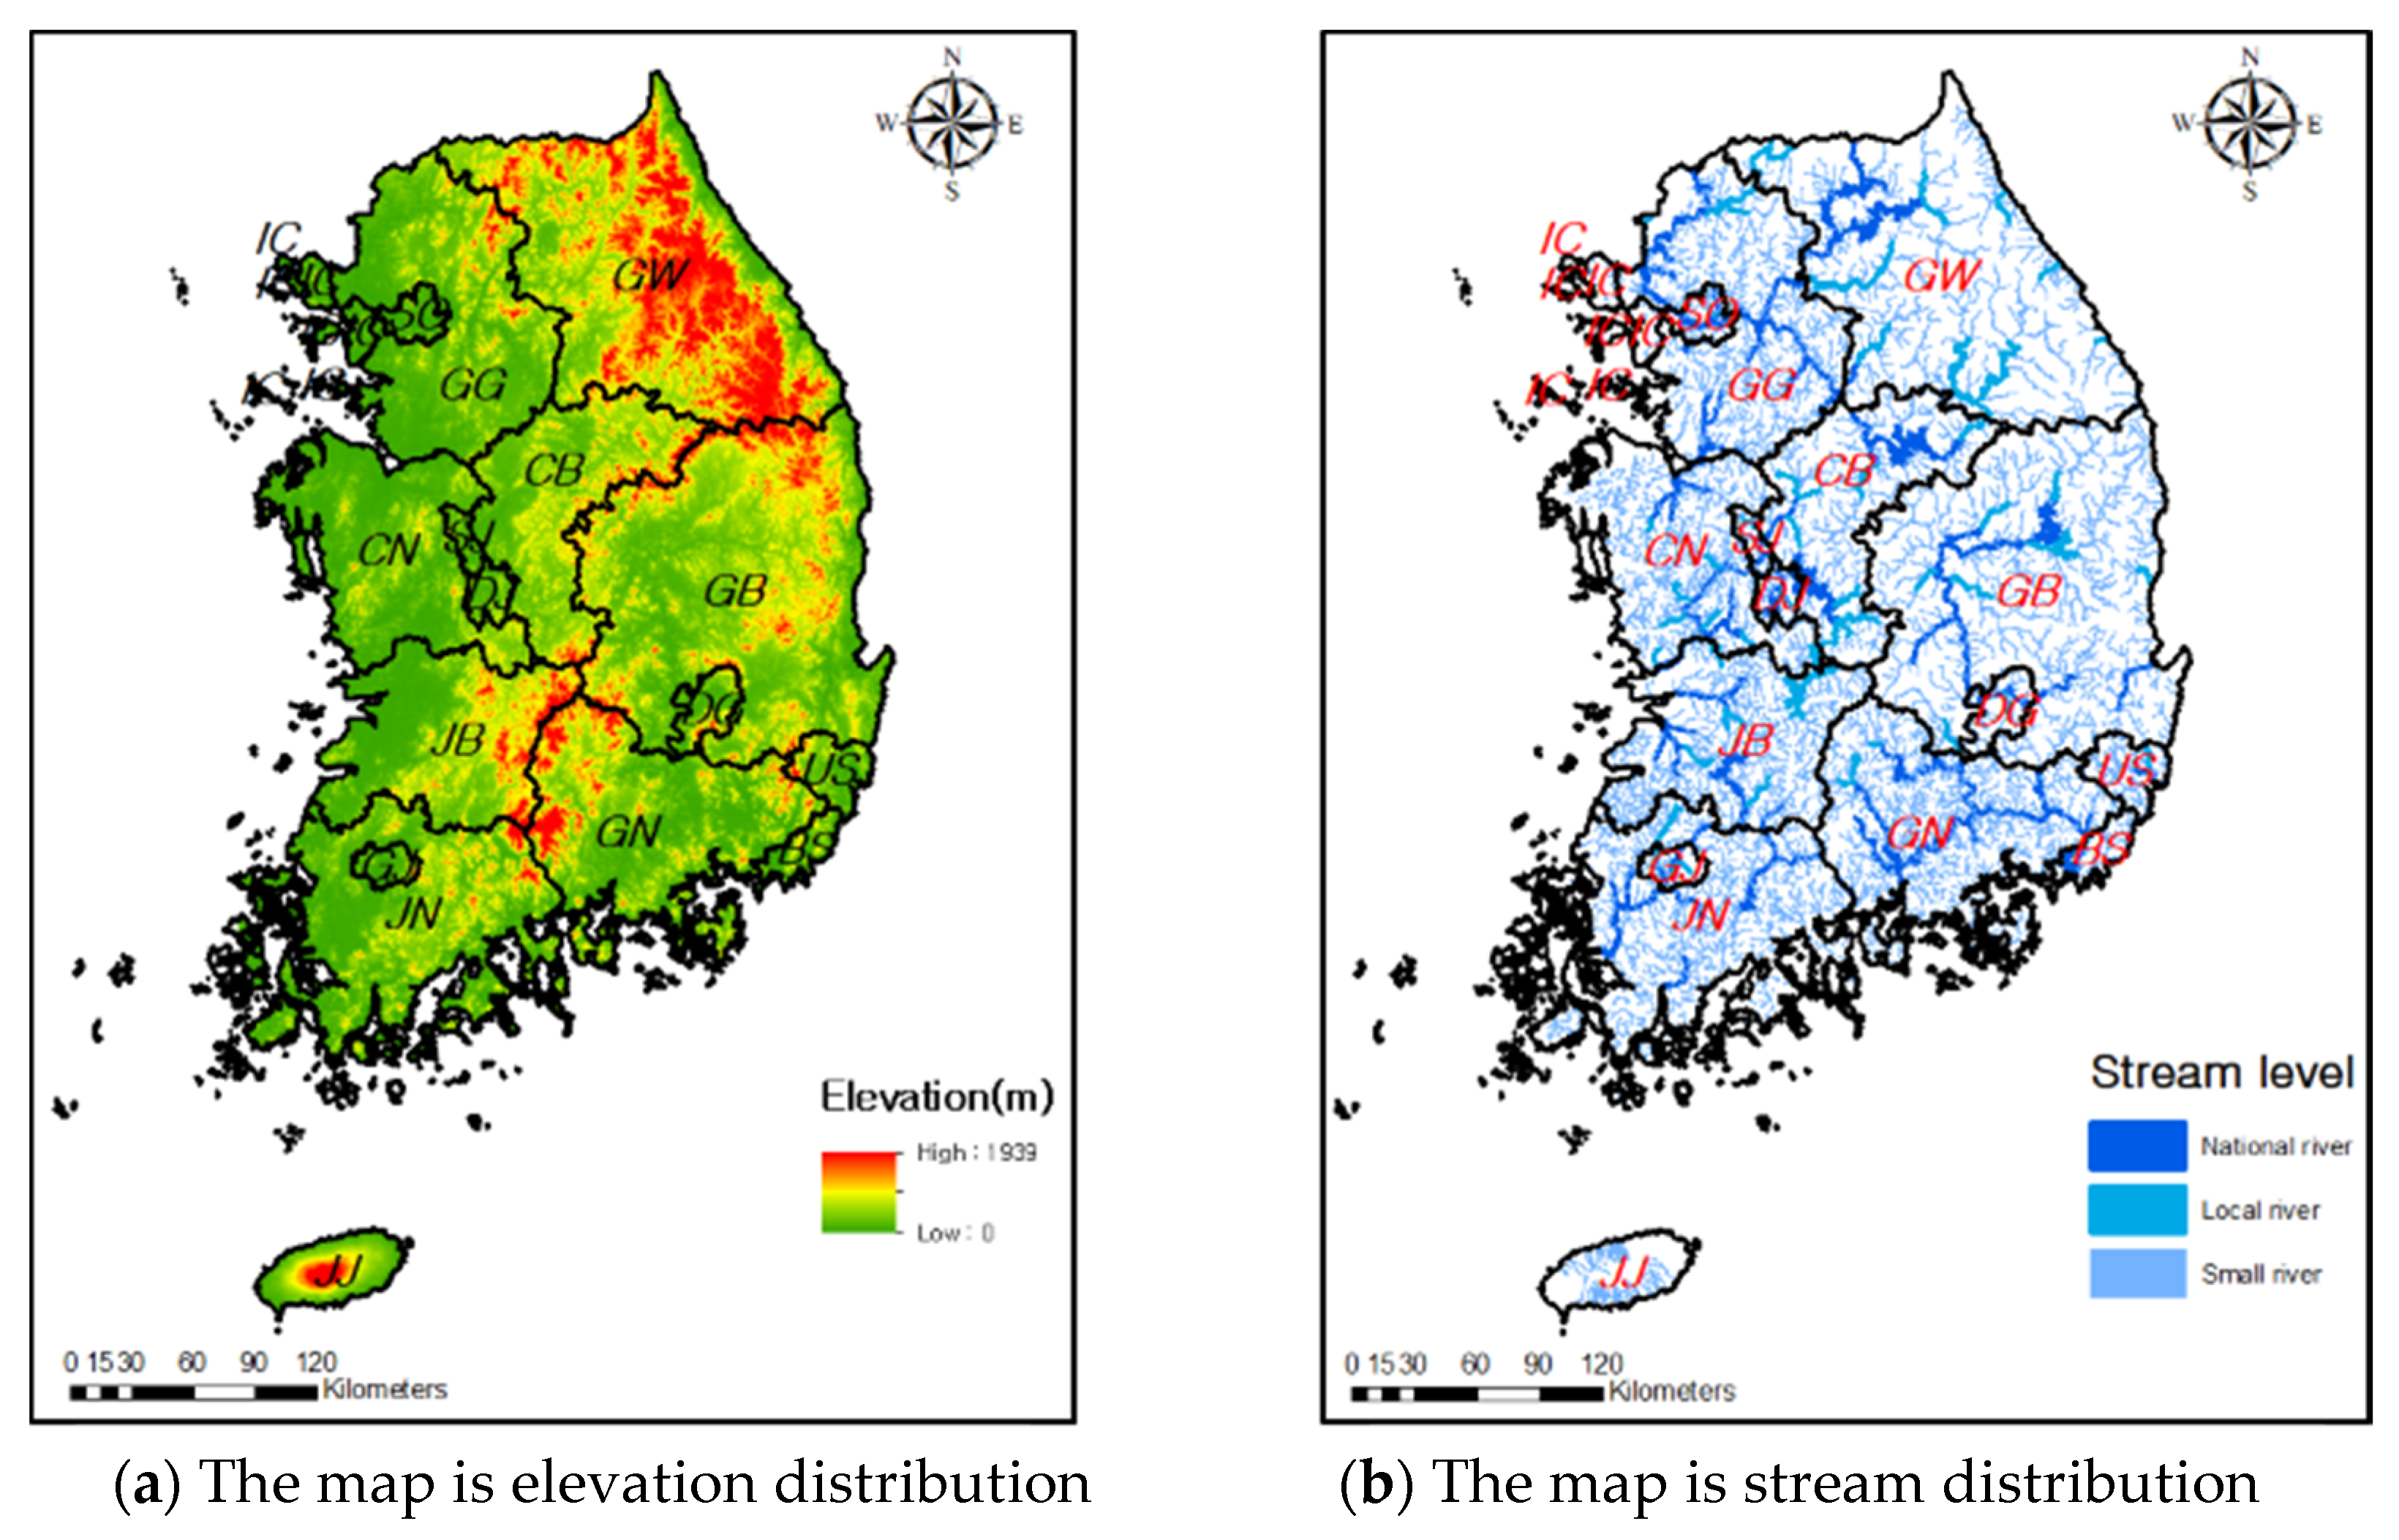
South Korea’s main topographical feature is its peninsula, with high elevation in the east and low elevation in the west. This is due to the country’s extensive mountain ranges, which are in GW, JB, and GB. Figure 2a shows the elevation of South Korea, where the part marked in red represents the mountain range. Moreover, as shown in Figure 2b, rivers in South Korea are primarily classified into three types: national rivers, local rivers, and small rivers. National rivers are largely divided into four basins: Han, Nakdong, Geum and the Seomjin-Yeongsan. The Han River flows through SO, IC, GG, and GW, the Nakdong River flows through GB, GN, DG, US, the Geum River flows through BS. CB, CN, SJ, and DJ, and JB, JN, and GJ are home to the Seomjin-Yeongsan River. From Figure 2a,b, it can be seen that rivers are less distributed in regions containing mountain ranges. This means that mountain ranges and rivers have opposite characteristics, and therefore, the types of damage caused in each landscape may be different.
2.2. Qualitative Risk Assessment Method
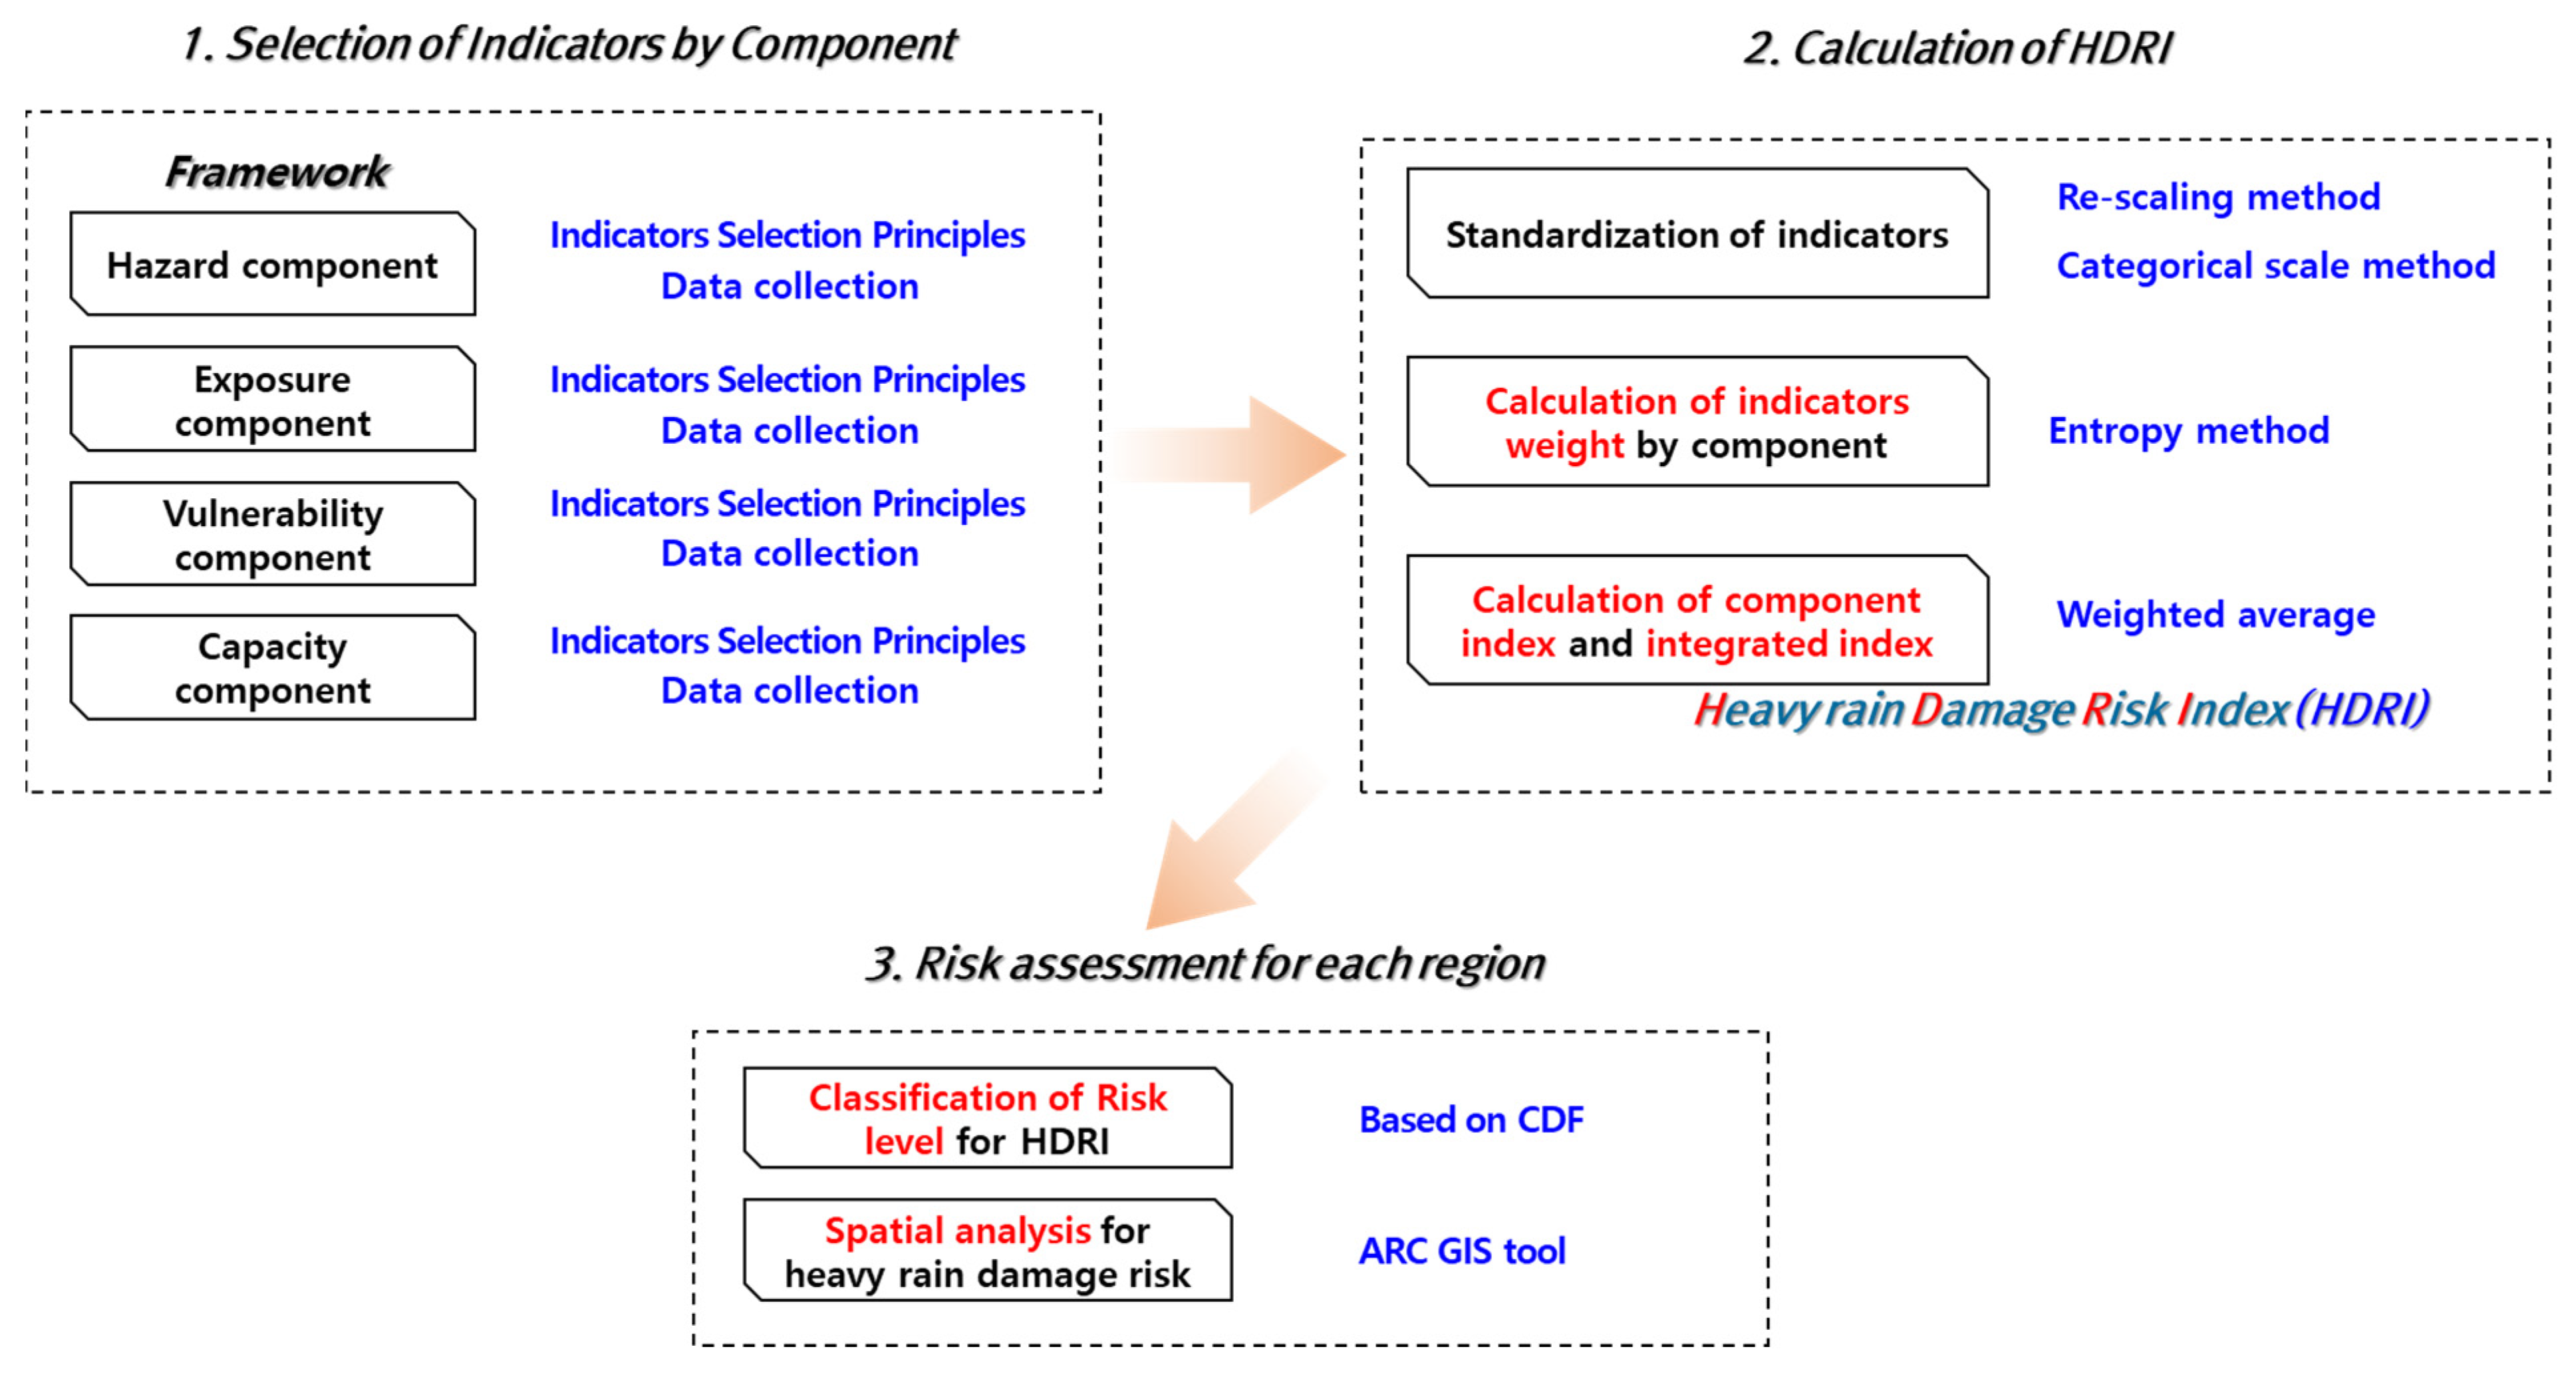
Risk assessment is a method for evaluating the relative risk level in a region by calculating an integrated index from statistical indicators representing a region’s risk levels. Here, an indicator refers to a variable that contains information about a risk level or state, and an index is calculated by aggregating two or more indicators or computing their weights. The procedure for performing heavy rain damage risk assessment is shown in Figure 3.
The first step was to select and collect assessment indicators for the component. The component used the framework suggested by UNISDR, and consisted of hazard, exposure, vulnerability, and capacity. Assessment indicators were selected and collected according to the selection principle. In the second stage, assessment indicators were standardized and calculated for weight of each indicator. Then, the integrated index, defined as the heavy-rain-damage risk index (HDRI) was calculated. In the third step, risk levels were classified for HDRIs by region based on probability distributions. Heavy-rain-damage risk was then analyzed spatially using ARC GIS tool.
The sub-index was calculated corresponding to the indicators and it weight of each component. For example, the Hazard index was integrated through the indicators and weight of hazard component. If the calculations for the four sub-indices, Hazard index, Exposure index, Vulnerability index, and Capacity index were complete, they were integrated as the HDRI.
where is th indicator of corresponding component, is the th indicator of corresponding component, is the Hazard index, is the weight of Hazard index is the Exposure index, is the weight of Exposure index, is the Vulnerability index, is the weight of Vulnerability index, is the Capacity index, and is the weight of the Capacity index.
2.2.1. Principle for Selecting Assessment Indicators
It was confirmed that several principles with similar meanings were repeated in previous studies for indicator selection. [19,20,21]. The most frequently used and important principles among these were extracted; those six principles are listed in Table 2. The major principles included were correlation, simplicity, quantitative, reliability, redundancy, and ease. The first principle, correlation, was to check whether the meaning of the components was similar; the second principle, simplicity, was to check whether the meanings of individual indicators were easy to understand; the third principle, quantitative, was to check whether an indicator could be quantified numerically; the fourth, validity, was to check whether the conceptual basis of the relevant indicator was clear; the fifth, redundancy, was to check whether there were indicators with overlapping meanings and, finally, ease was to check whether it was easy to continuously collect data.
2.2.2. Standardization Method for Assessment Indicators
When calculating an index using an indicator, it is necessary to perform standardization, calculation of weights, and aggregation, because the assessment indicators used to calculate the index are unit- and scale-dependent, thus making direct calculation impossible. Standardization is a method for resolving the issues of deviation and distortion caused by size and unit differences, by converting each evaluation index into a dimensionless value. Typically, rankings, Z-scores, categorical scales, and re-scaling are used as representative standardization methods; in this study, data were standardized using both method re-scaling and categorical scale methods. Generally, the re-scaling method is easy to understand, and the categorical scale method can be used to solve the problem of distortion in given datasets [22]. Table 3 describes the features of the two standardization methods used in this study.
2.2.3. Method of Calculating Weights
Assessment indicators have varying degrees of impact depending on the purpose of analysis, and they should be given weights during the process of determining their significance and calculating them as an index. Typically, the analytical hierarchy process (AHP), factor analysis, the Delphi method, and the entropy method are used as weight determination techniques [23,24,25,26] This study used the entropy technique, which is a method for calculating objective weights and conducting experiments.
The following procedures were used to calculate the weight of each indicator using the aforementioned entropy method. First, the constructed values of each indicator are organized into a matrix by region, followed by the normalization of the configured attribute information of each indicator. Weight values between the indicators were finally determined after calculating the entropy for each attribute using normalized data. Equations (3)–(7) summarize this process [27].
First, a matrix of attribute information of regional assessment indicators is set up:
Second, attribute information is normalized using the assessment indicator:
Third, the entropy for each attribute is calculated:
Fourth, the weight of each assessment indicator was calculated by considering the degree of diversity.
where, is the number of regions, is the number of indicators, is the th region, is the th indicator, is the th and th normalized assessment indicators, and is the entropy of the th assessment indicator.
2.3. Hierarchical Cluster Analysis
Cluster analysis is a typical statistical technique that can identify group objects with similar characteristics in given datasets. The two types of cluster analysis are hierarchical and non-hierarchical cluster analysis [28,29]. Hierarchical cluster analysis is a technique for deriving a target cluster by sequentially clustering subjects with a high degree of similarity and gradually combining clusters. Non-hierarchical clustering is a technique for clustering that involves specifying the number of clusters and the initial starting point based on the cluster center [30].
The advantage of hierarchical cluster analysis is that it can perform clustering in a way that the cluster forms a hierarchy without first specifying the number of clusters, after which it identifies the cluster’s hierarchical structure using dendrograms [31]. The dendrogram expresses a cluster’s hierarchical structure in the form of a tree, and within the hierarchical structure, the lower cluster takes on the form of the upper cluster (Figure 4). In this study, hierarchical cluster analysis was used to cluster groups that were sequentially or hierarchically similar to each other.
Here, the term “distance” should be used to refer to a metric of regional similarity. There are several methods of defining distance—Euclidean distance, which is the most frequently used, hamming distance, which is used when all variables are categorical, Manhattan distance, and cosine similarity. Since the normalized data was used in this study, the distance was calculated using the Euclidean distance. Equation (8) illustrates the Euclidean distance equation [32].
where and are two objects in p-dimensional space and represents the Euclidean distance, i.e., the shortest direct distance. is the total number of variables and is th variable.
3. Result of Analysis
3.1. Risk Assessment of Heavy Rain Damage
3.1.1. Selection and Construction of Assessment Indicators
In this study, we investigated the assessment indicators and framework used in references [5,6,7,8,9,10,11,12,13,14,15,16,17,18]. The UNISDR framework (hazard, exposure, vulnerability, and capacity) was judged to be the most clearly distinguished among various frameworks and the assessment indicators used in previous studies were reconstructed into the UNISDR framework. The assessment indicators used in this study were chosen based on six selection principles (Table 2). The principles were correlation (C), simplicity (S), quantitative (Q), validity (V), redundancy (R), and ease (E). Table 4 shows the assessment indicators selected through indicator-selection principles.
The hazard-component indicators selected were maximum rainfall during the duration (24 h) (H1), annual average rainfall (H2), flood damage (H3), and flood damage frequency (H4). The exposure component indicators were the total population (E1), the GRDP (gross regional domestic product) (E2), total number of buildings (E3), road facility area (E4), and river density (E5). The vulnerability component indicators were vulnerable populations (V1), disaster-prone districts (V2), steep slopes (V3), and old buildings (V4). Capacity indicators were drainage pump stations (C1), financial independence (C2), and cumulative disaster prevention budgets (C3). All assessment indicators chosen for this study were constructed as of 2019 and as cumulative or average concepts, depending on the nature of the data.
Meteorological data were obtained from the Korea Meteorological Administration (KMA), and damage data were obtained from the Statistical Yearbook of Natural Disaster (SYND) published by the Ministry of the Interior and Safety (MOIS). The total population, GRDP, total number of buildings, and financial independence were obtained from the Korean Statistical Information Service (KOSIS) and data on road area and river density were obtained from the Ministry of Environment (MOE). MOIS collected data on drainage pump stations and investment costs for the disaster prevention budget. In Table 4, a circle means the indicator was selected, and a cross means the indictor was not selected.
3.1.2. Standardization and Calculation of Weights of Assessment Indicators
Since it is advantageous for the visualization of integrated index, the re-scaling method was standardized and used, but the categorical scale method was also considered to minimize distortion caused by extreme values. Statistics of the assessment indicators for standardization are shown in Table 5.
As shown Table 5, the maximum values of H4, V3, and C1 were excessively large in comparison to the average value, and thus, 80% of data did not exceed 0.1. The data mentioned above (H4, V3, and C1) signified that the probability distribution was skewed to the left and the tail was generated far to the right, which means that some data among the total are extreme values. If there is standardization without using the categorical scale method, significant data distortion problems can be caused. To this end, the integrated index was also calculated considering the categorical scale, and the score for each percentile is shown in Table 6.
Table 7 summarizes the weights of the assessment indicators and the sub-index. Here, the sub-index means that it is integrated by the indicators of each framework. As shown in Table 7, the Hazard index places a large weight on H4 (accumulated amount of heavy rain damage), showing that previous damage is critical for determining the current risk of heavy rain damage. The Exposure index is distributed more evenly than the hazard, index and the density of river has the most weight. The steep slopes of the Vulnerability index (V3) show that it has the highest weight, whereas the number of disaster-prone districts (V2) has the second-highest weight. In terms of capacity, the drainage pump station’s treatment capacity (C1) had the highest weight. As for the weights of the sub-index, the Hazard index had the highest weight for each sub-index and the Capacity index has the second-highest weight.
3.1.3. Definition of the Risk Level of Heavy Rain Damage by Region
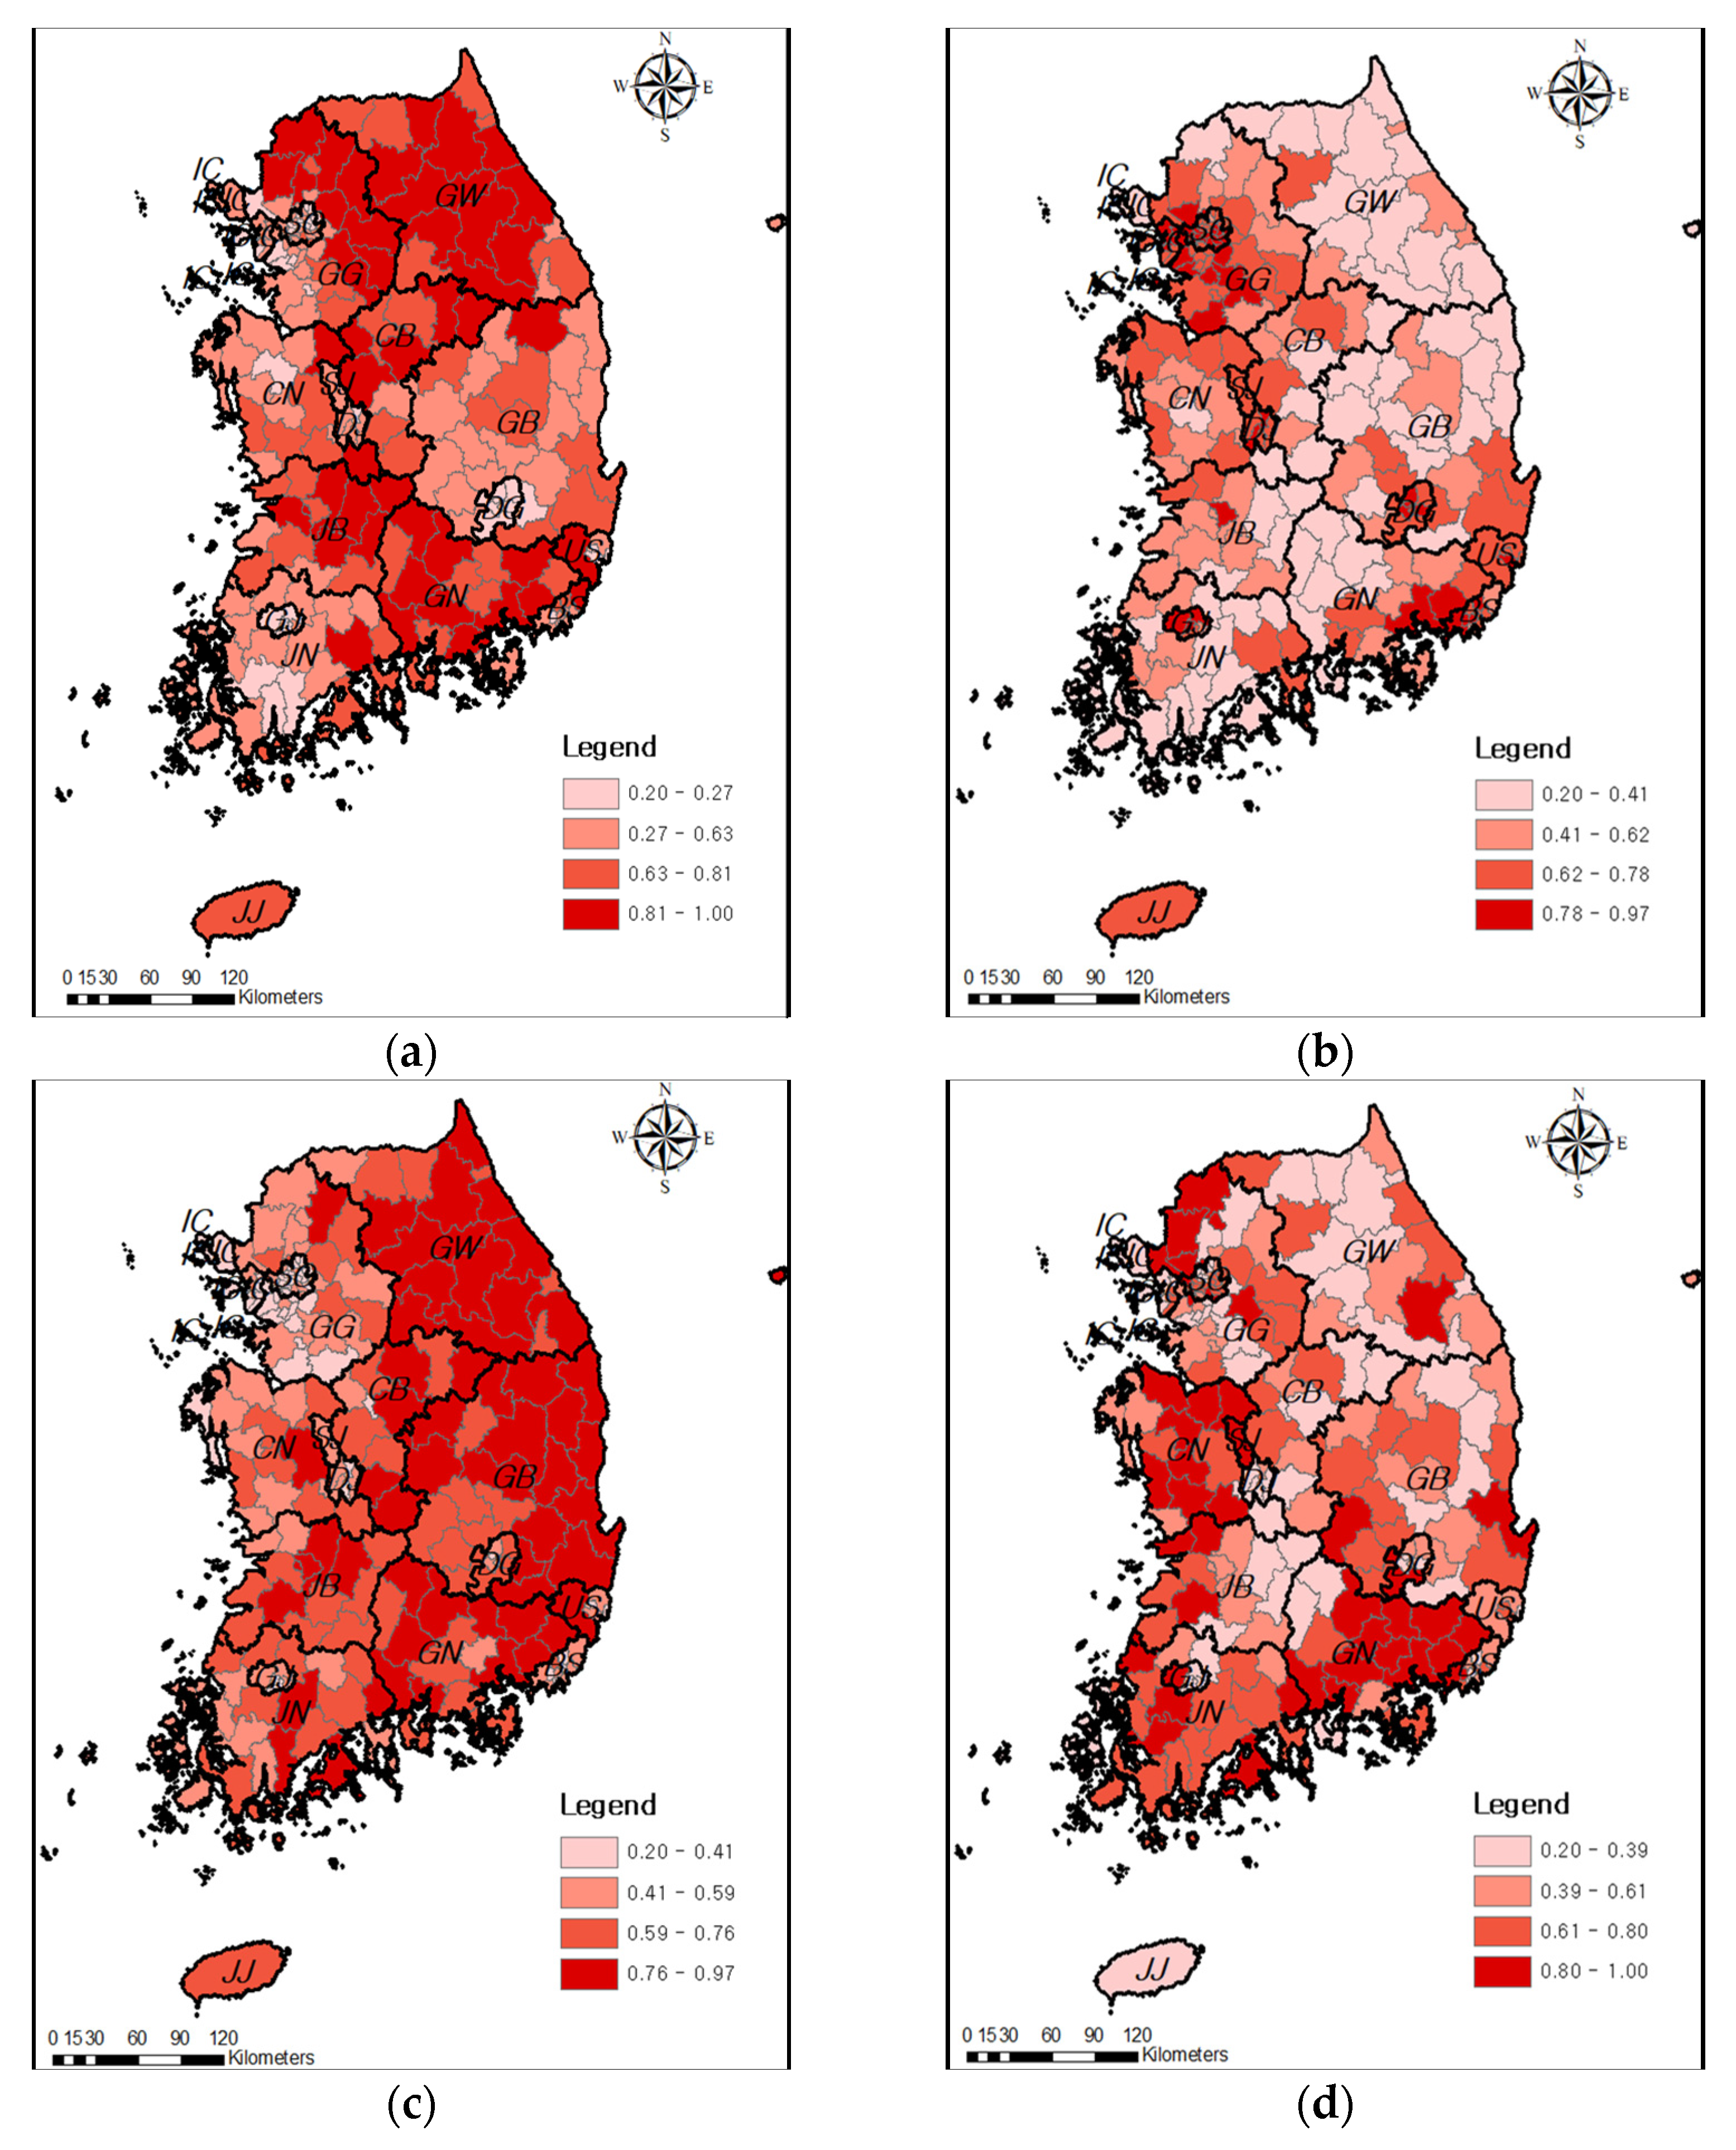
Each sub-index was calculated using the weight and assessment indicators corresponding to each component (see Equation (1)). Figure 5 illustrates the spatial distribution map of each sub-index. The Hazard index, Exposure index, and Vulnerability index have positive (+) values which show an increased risk of heavy rain damage, while the Capacity index has a negative (−) value which indicates a decreased risk of heavy rain damage. According to the Hazard index, the frequency of damage was high in GG and the scale of damage was large in GW and JB. It was confirmed that rainfall occurrence characteristics were concentrated in the central and southern coastal regions, and as a result, GW, GG, JB, and GN have a high Hazard index. The Exposure index consists of indicators that are susceptible to damage from heavy rain, and the more developed a region is, the greater the risk of flooding. Indicators such as population, GRDP, and road density were found to be higher in urban areas such as SO, BS, IC, DG, and GJ. Thus, the Exposure index seemed to be higher in urban areas.
The Vulnerability index was highest in GW, GB, JB, and JN, which are predominantly composed of disaster-prone districts and steep slopes. As shown in the elevation map (Figure 4), there are many areas that are vulnerable to damage from heavy rain distributed along the mountain ranges. In addition, these areas have a high risk of landslide damage. The Capacity index refers to areas with a high density of disaster-prevention facilities, and this index was particularly high in JN, GN, and CN.
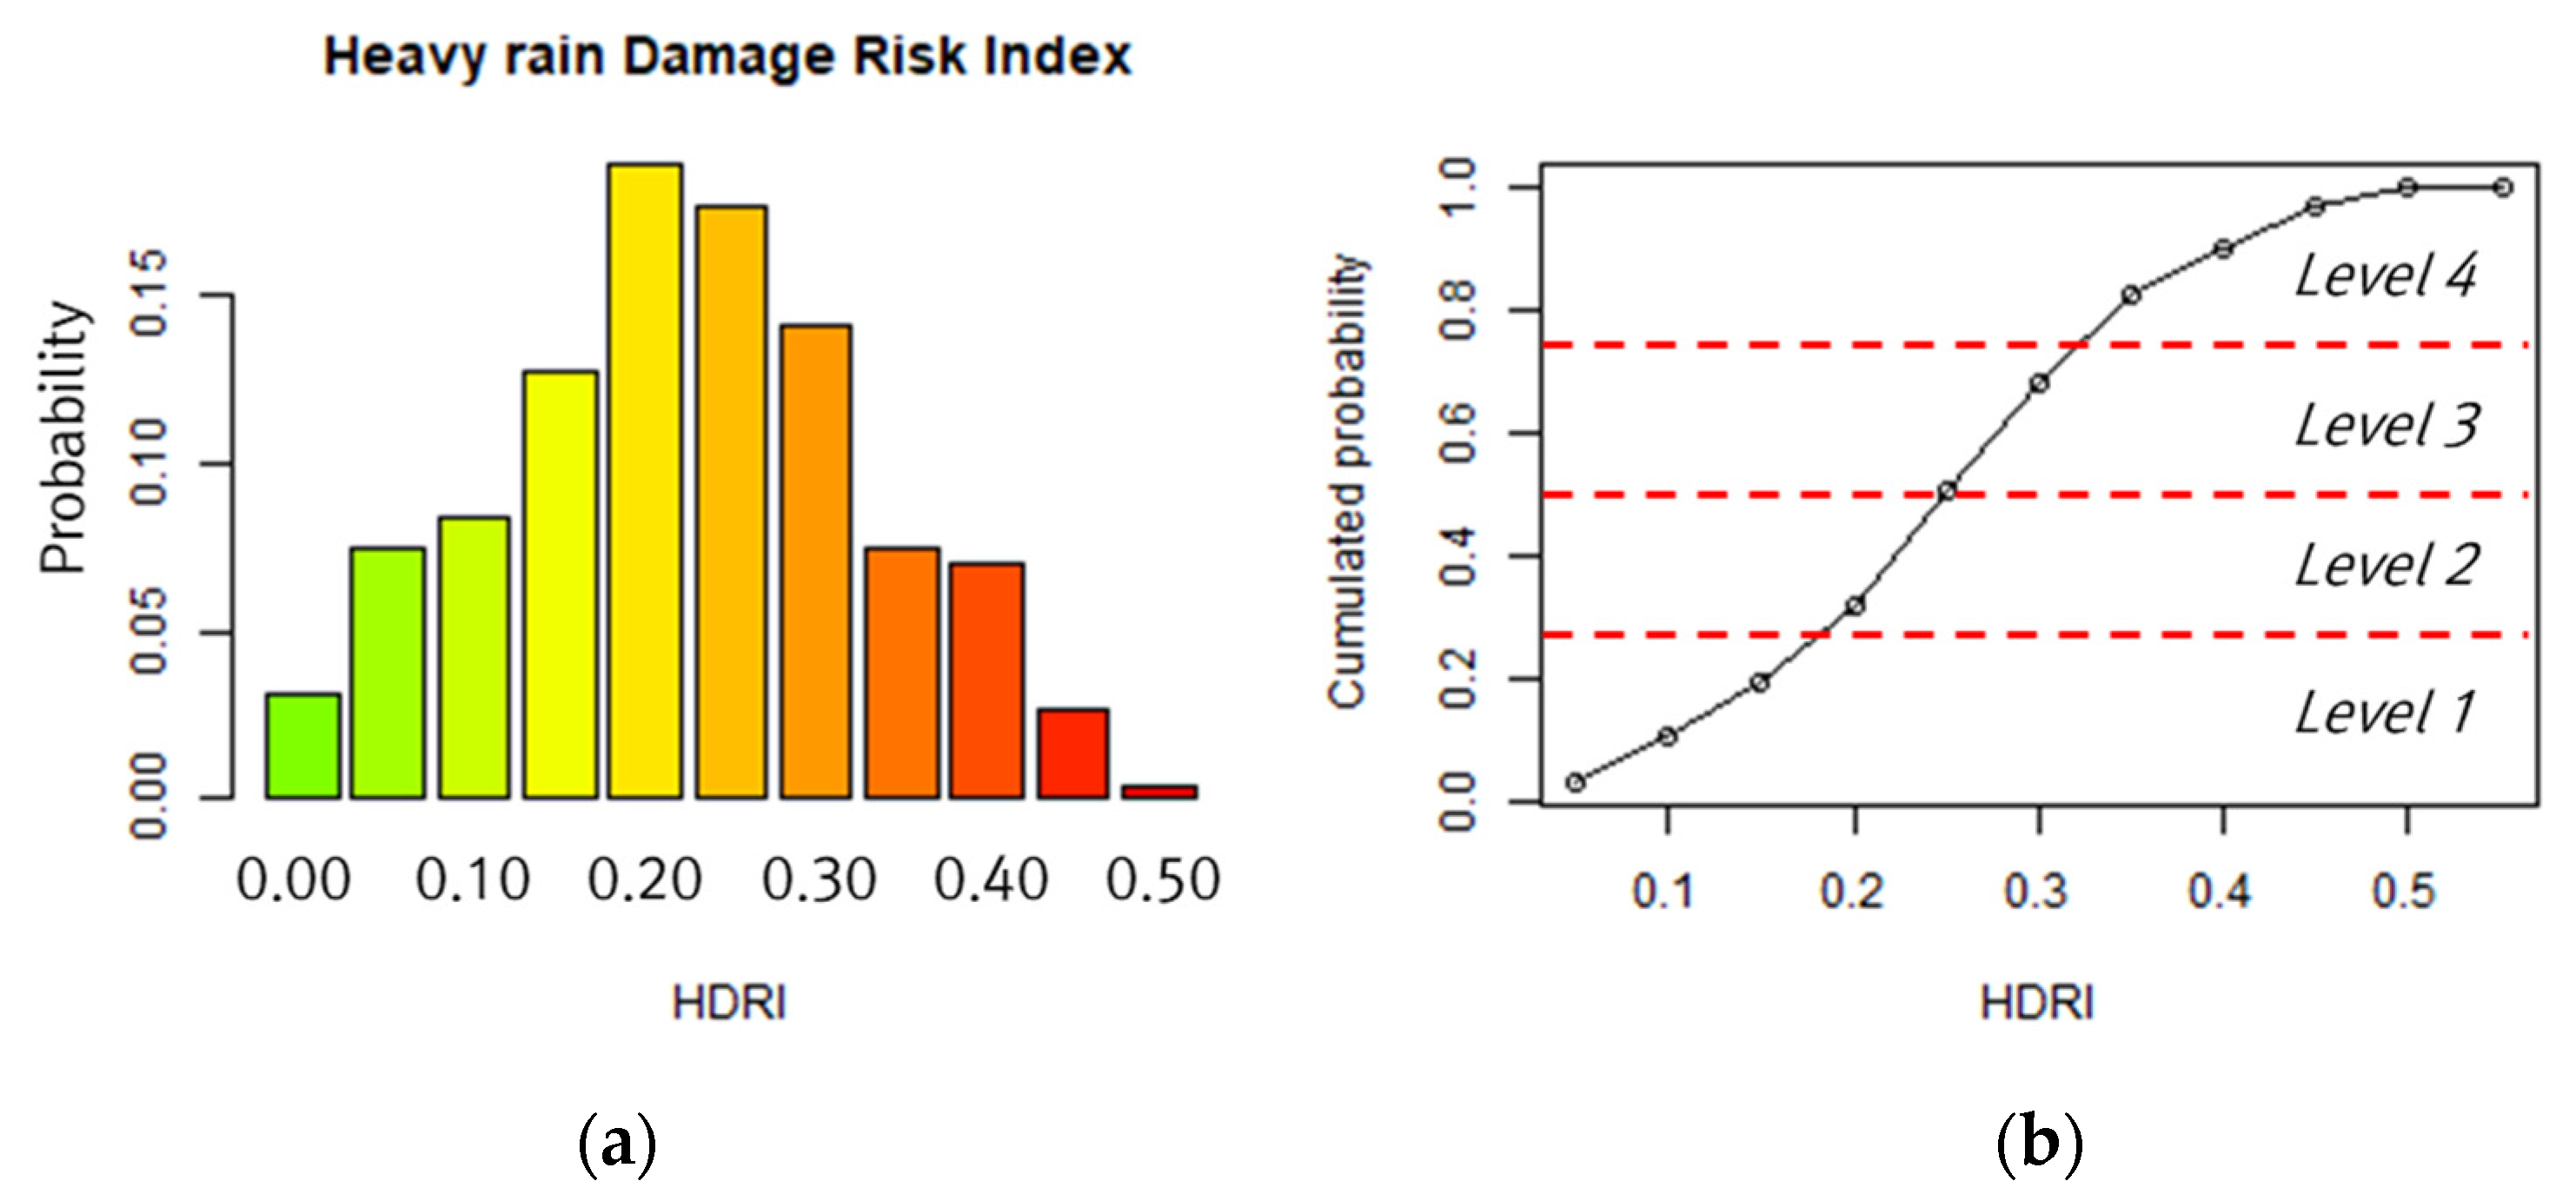
The heavy-rain-damage risk index (HDRI) was integrated through Equation (2) using sub-index and weight. Figure 6a shows the probability distribution of HDRI. Since HDRI followed a normal distribution, it was possible to classify the probability values into evenly intervals. This means that some regions have similar probability values and therefore, similar risk levels. The cumulative probability of the HDRI is shown in Figure 6b, and the probability boundaries between Levels 1 and 4 was defined as 0%, 25%, 75%, and 100%. As such, areas at low risk of heavy-rain damage were classified as Level 1, whereas those at high risk were classified as Level 4.
The assessment indicators for flood risk were selected based on the principle, these were weighted averaged and integrated as the HDRI. The heavy-rain-damage risk level was classified based on the probability distribution of the HDRI. Figure 7 illustrates the spatial distribution map of the risk level by region. According to the results of the regional heavy-rain-damage risk assessment presented in Figure 7, the risks were greatest in GD, GG, and JB, while SO, IC, DG, CN, and JD were considered relatively safe.
3.2. Classification of Heavy Rain Damage Types Based on Hierarchical Cluster Analysis
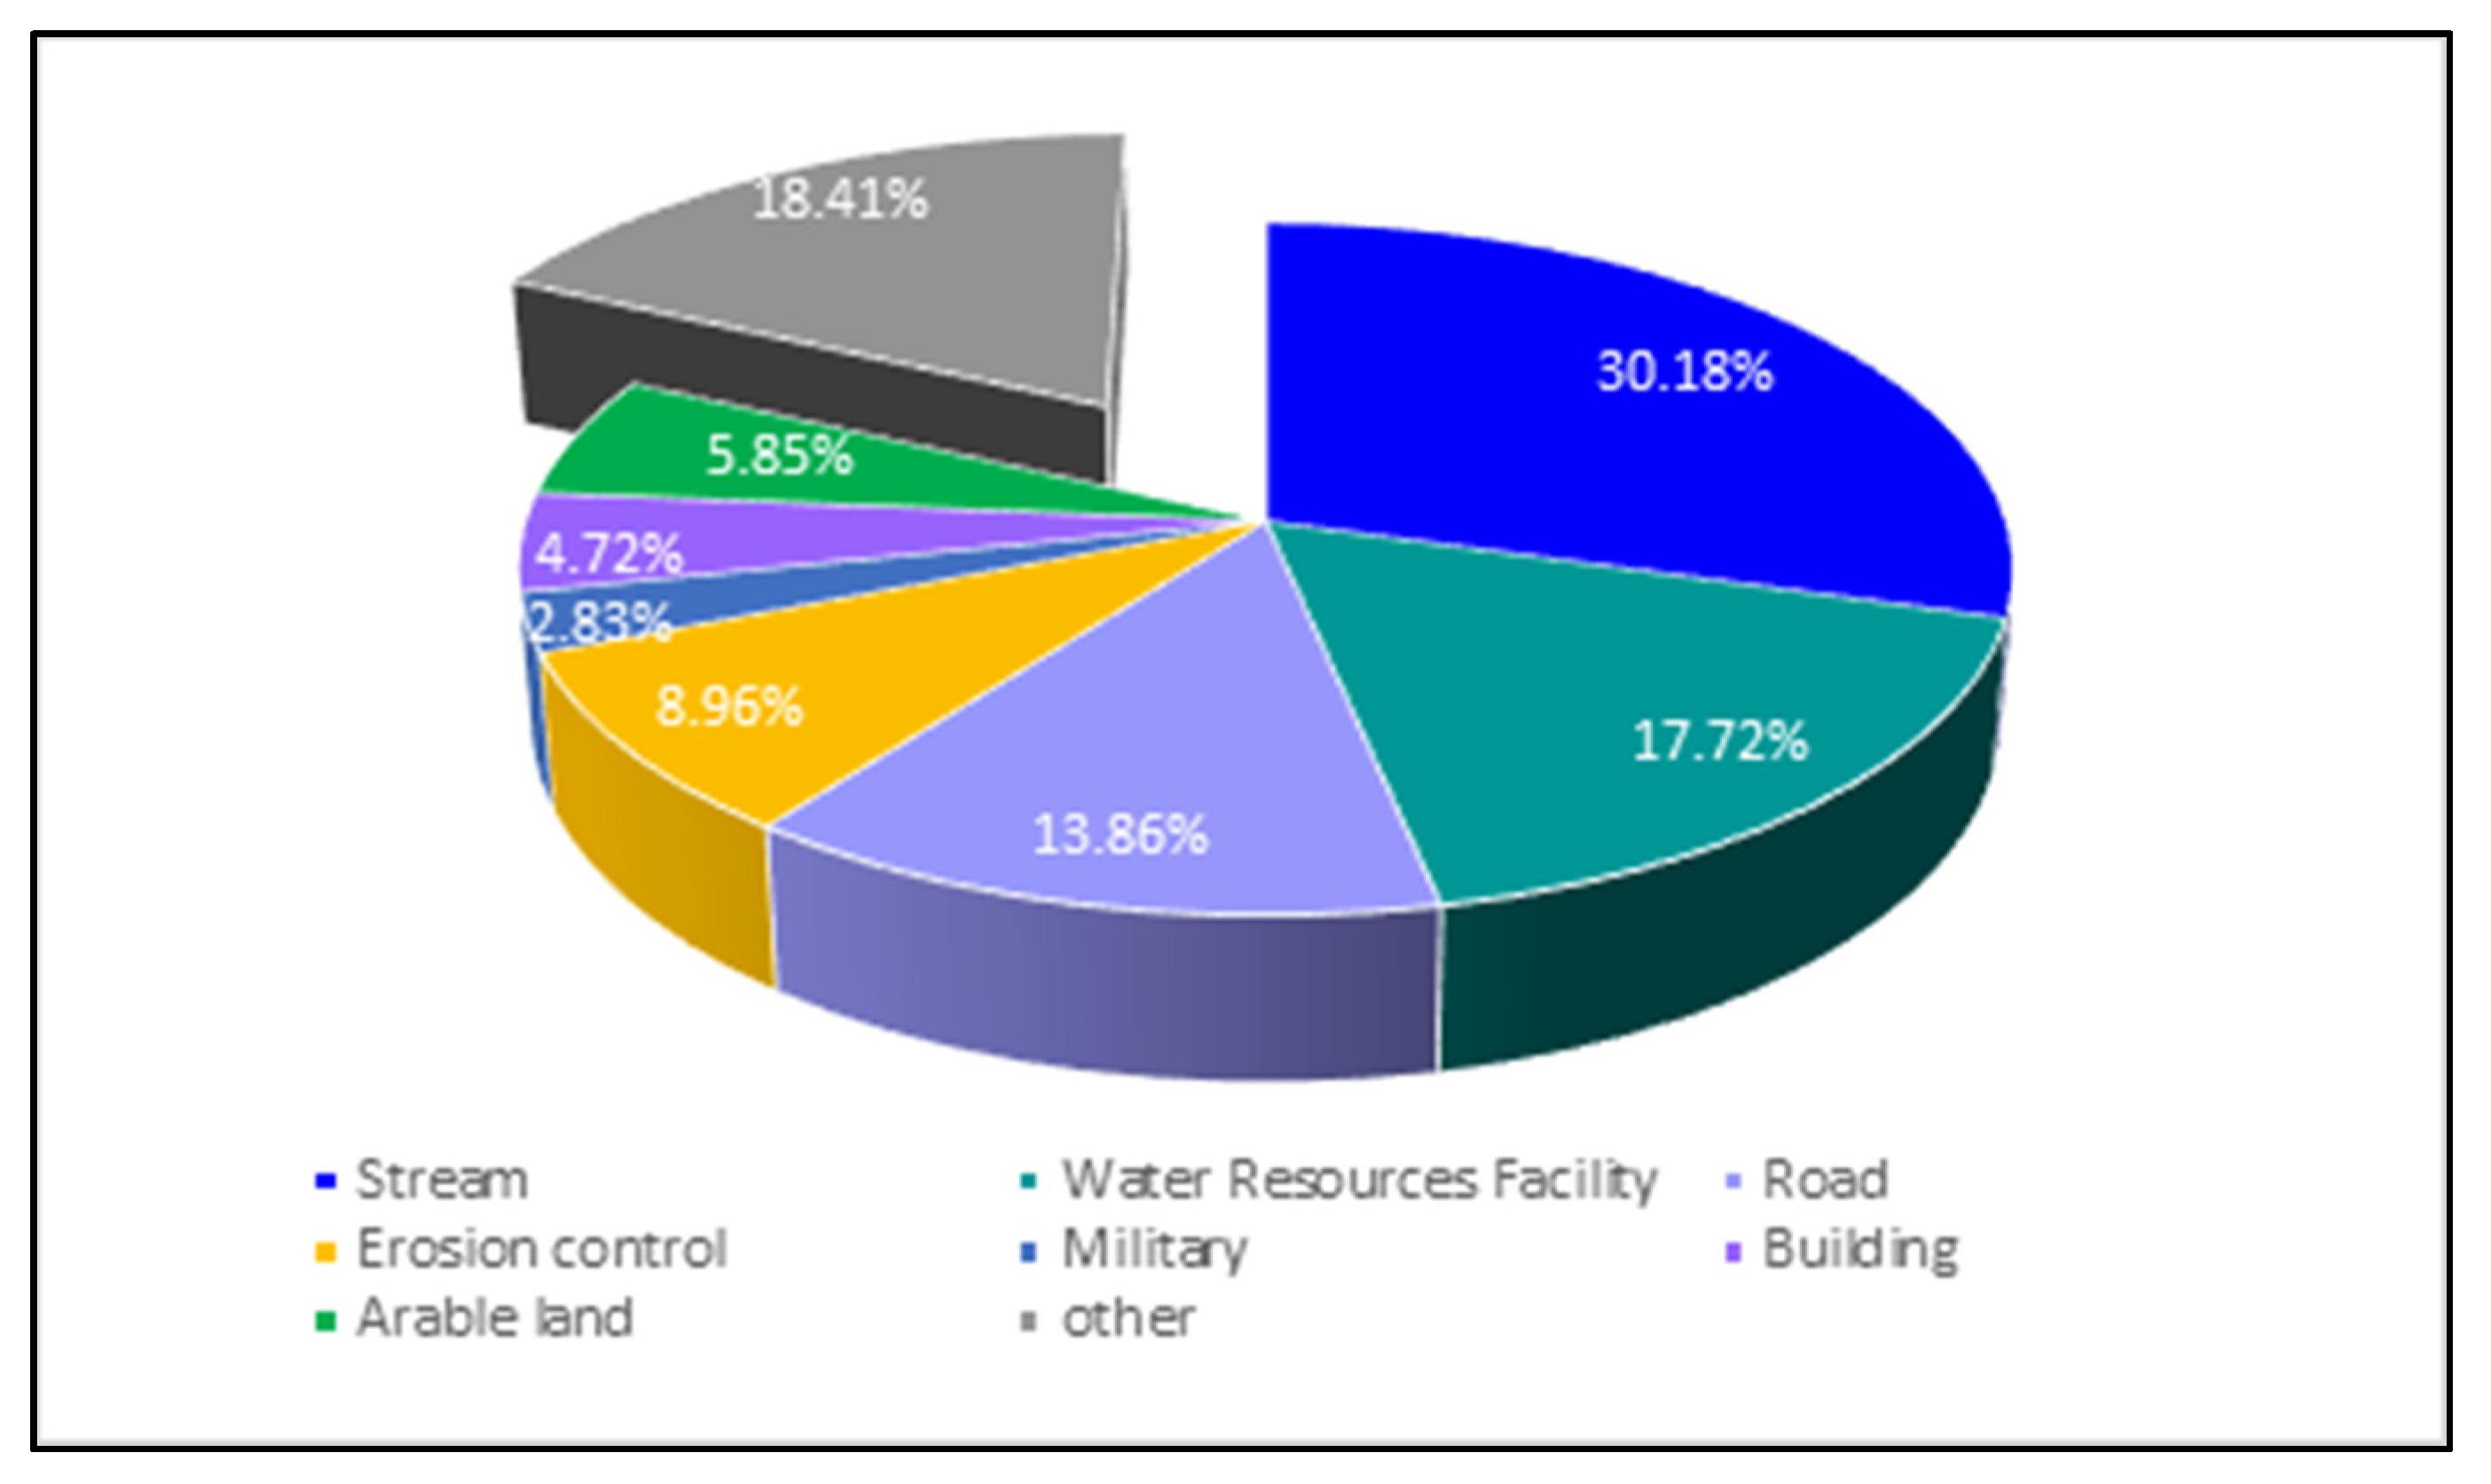
The magnitude of damage that occurs each year in South Korea is aggregated and recorded for a total of 23 facilities: 13 public and 10 private facilities. The study collected data on heavy rain damage from 2003–2019 and analyzed the ratio of major damaged facilities.
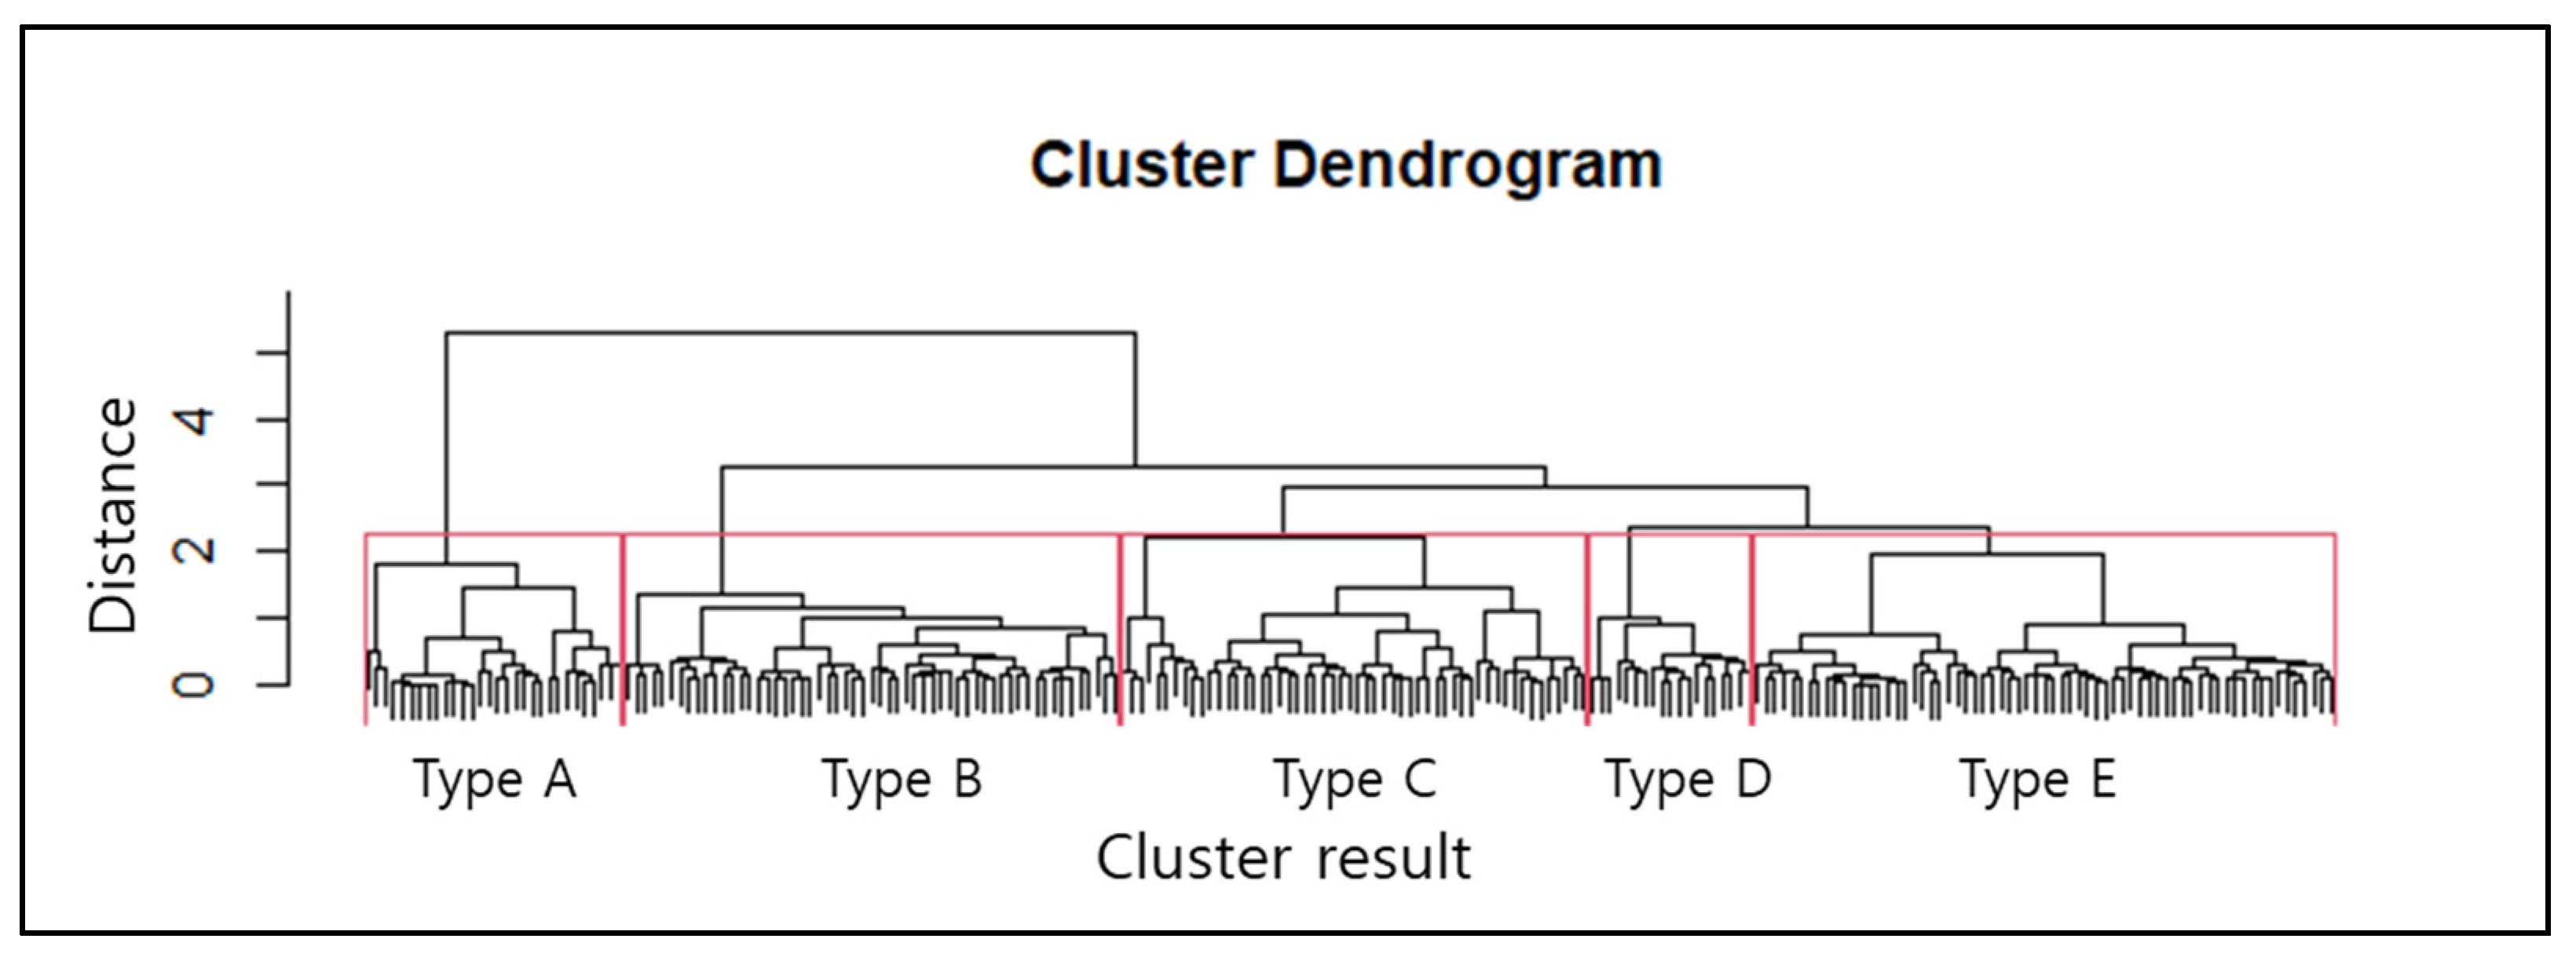
As can be seen in Figure 8, more than 30% of damage occurred in streams, 17% in water resource infrastructure, 13% on roads, and 8.9% in erosion-control infrastructure. Furthermore, 5% damage is incurred by arable land, 4% by buildings, and 2% by military facilities; facilities that accounted for less than 1% of damage were not indicated. The primary facilities in South Korea that sustain damage from heavy rains are streams, water resource facilities, roads, erosion control projects, arable land, buildings, and military facilities. In order to identify the type of damage by region according to topographical characteristics, we performed a hierarchical cluster analysis using the regional damage ratios for the seven facilities as variables. As shown Figure 9, damage types were divided into five clusters.
Based on the findings in Figure 10, the Type A area was identified as the location of the most damage in “erosion control” and “road”, and the Type B area had the highest damage ratio in “stream facility” and “road”. In addition, the Type C area had a high damage ratio in arable land, Type D area was identified as just “stream facility”. Type E area had a high damage ratio for “building”. These findings indicate that topographical characteristics and the level of regional development have a significant impact on different types of damage from heavy rainfall.
Considering the damage-type map and topographical characteristics together, Type A was mainly found in mountainous regions of GW, JB, and JN, indicating that the damage in “erosion control” and “road” due to landslides was severe. Damage occurs frequently in the local river in the GG area near the Han River in the case of Type B. Type C was confirmed to be primarily distributed in CN, CB, GN, and GB areas where arable land is located. Type D was confirmed in the GJ and GG areas where damage occurred in “stream facility”. Type E was primarily found in city-oriented SO, IC, and DG areas.
Type A affects erosion control facilities and roads due to landslides, and thus, in Type A areas, prevention projects such as erosion facility maintenance and repair projects and road drainage maintenance projects to reduce landslides should be implemented. Type B is a case of damage caused to levee facilities by river inundation, and to road facilities by poor road drainage; thus, a river improvement project that can lower water depth and a road drainage maintenance project that can well release water into drainage should be implemented.
Because Type C can occur due to poor drainage in arable land, prevention projects such as sewer-pipes maintenance projects should be implemented. Type D was a case of damage caused to a stream facility by rapid water velocity and river inundation, and prevention projects such as a river improvement project that can lower the flow velocity and water depth could be implemented. Type E mainly occurred due to inundation of urban area by lowlands areas; thus, prevention projects such as drainage-pump projects that can release the flooded water in lowlands into rivers could be implemented.
3.3. Analysis for Heavy Rain Damage Risk and Damage Type in Each Region
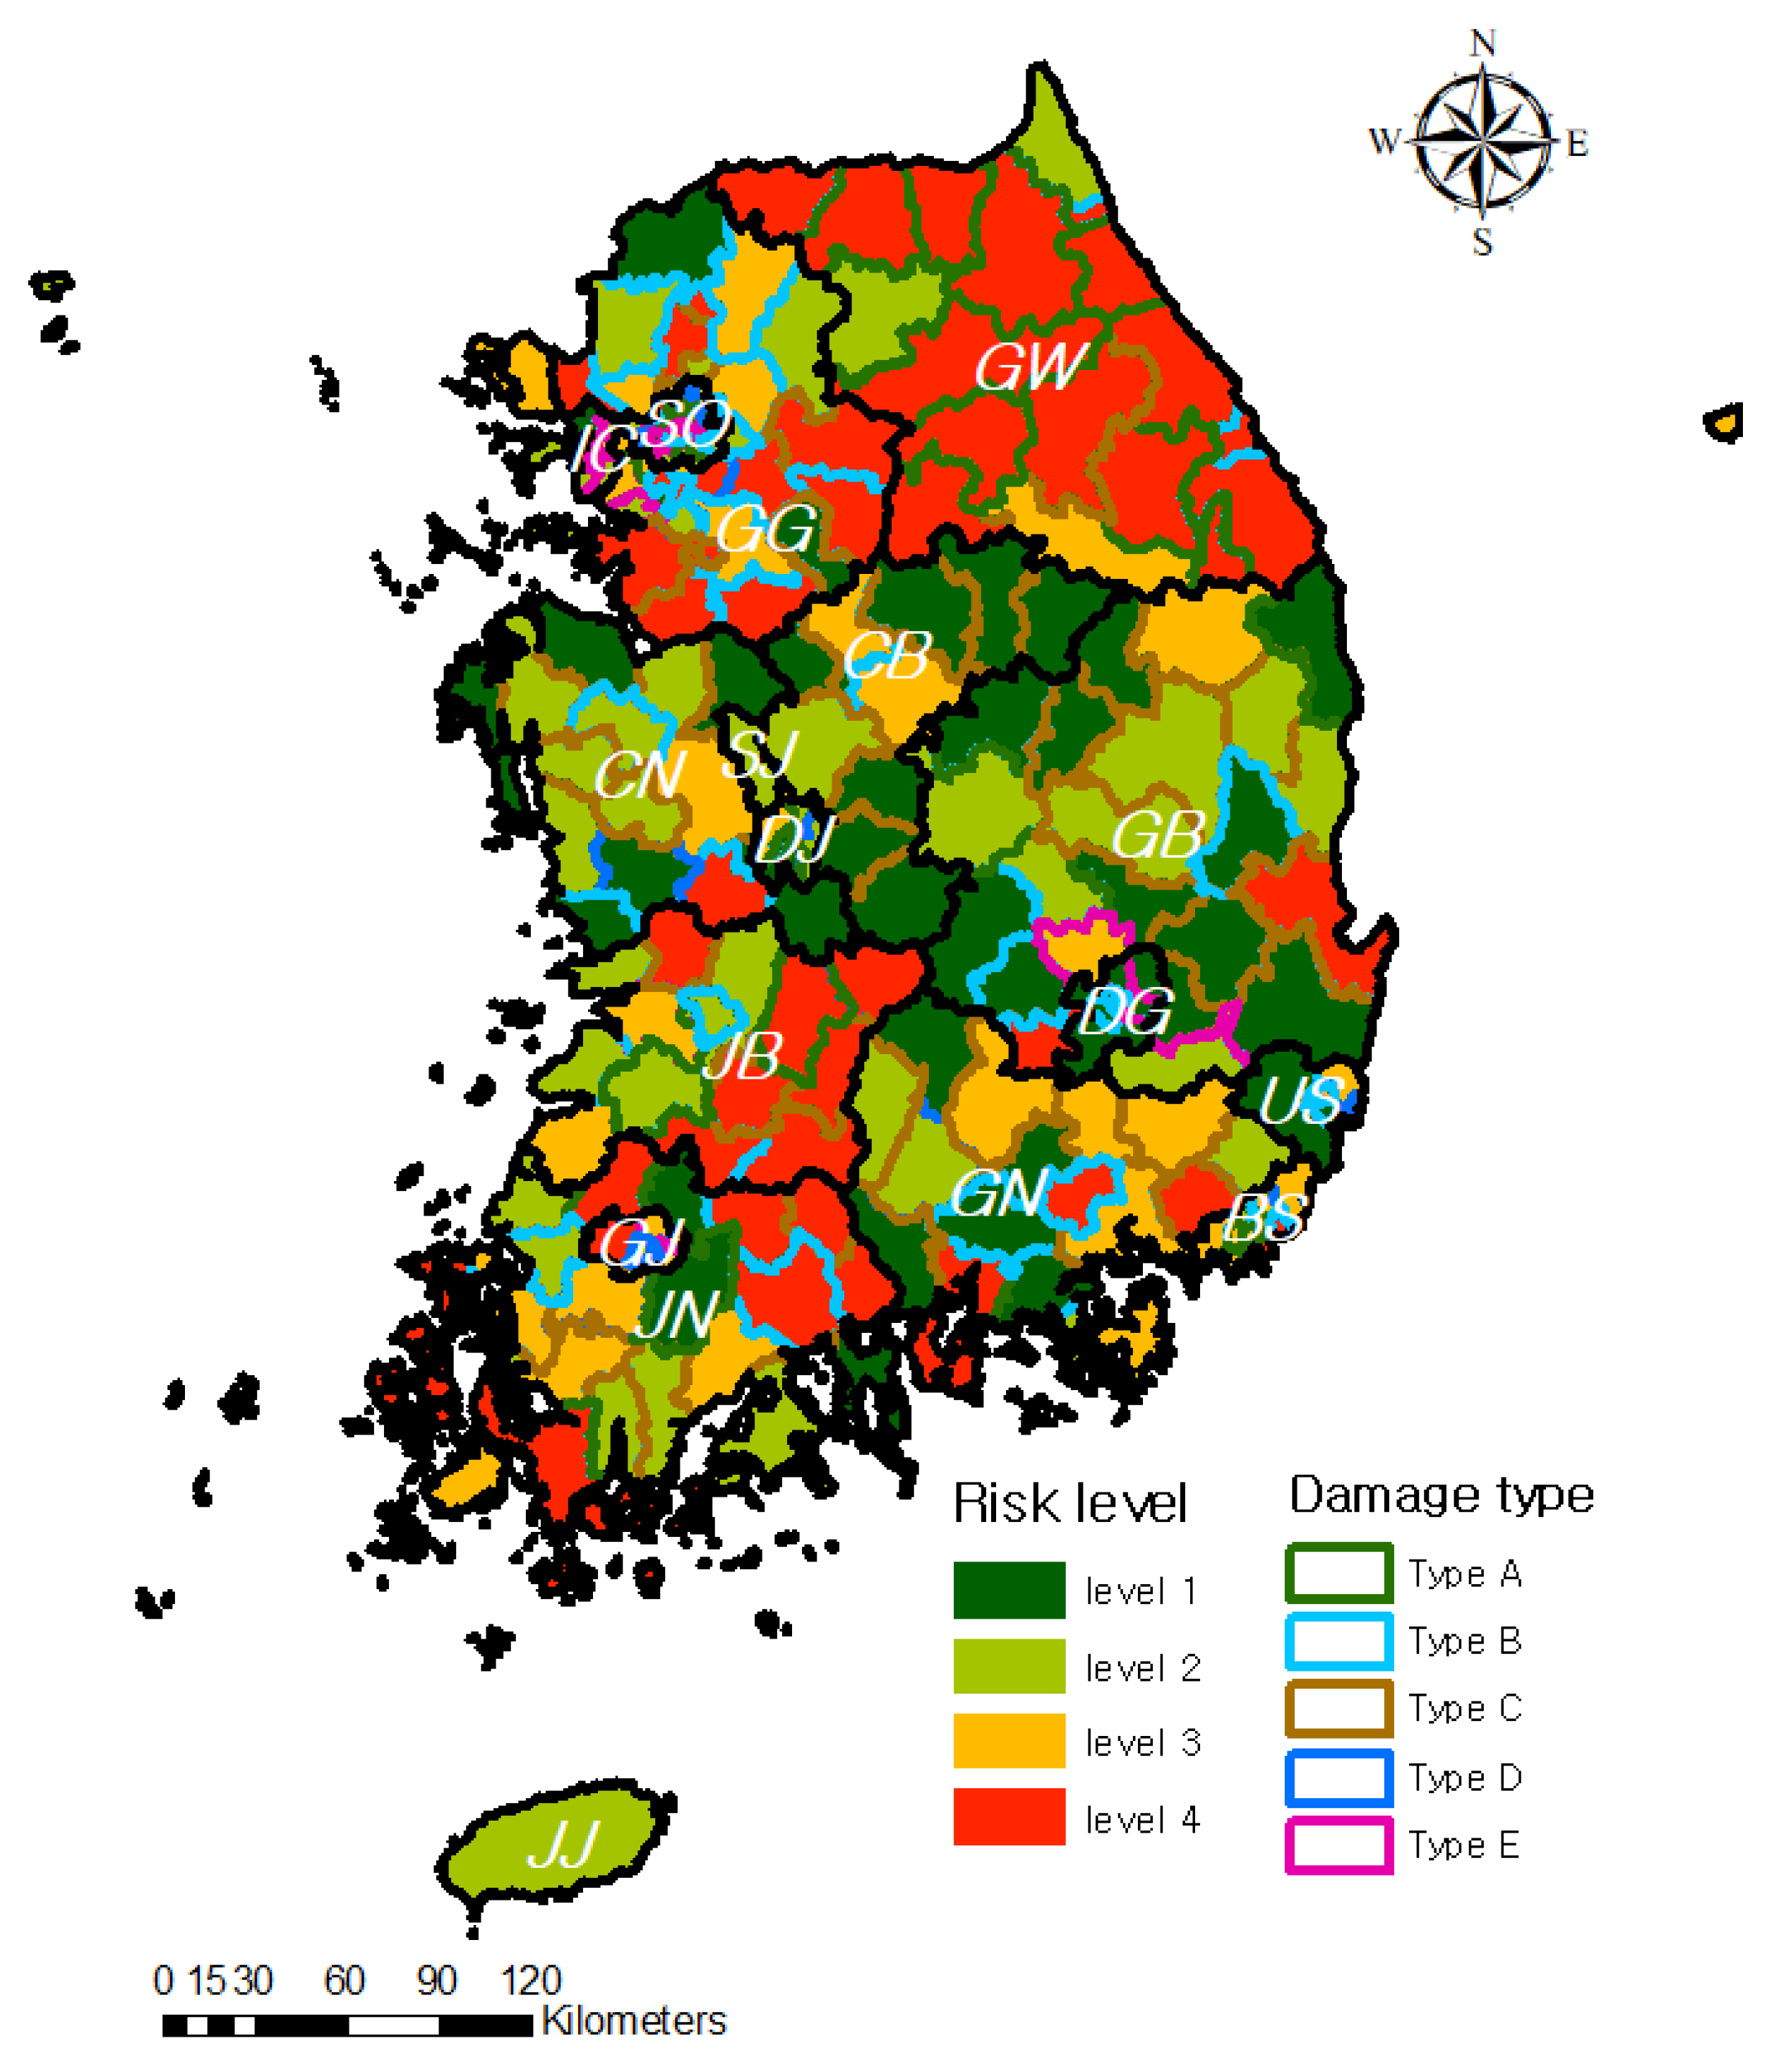
To comprehend the characteristics of heavy rain damage by region, risk level, and damage types classified in the previous section, the two results are evaluated in this section. As shown Figure 11, the risk level is represented by a fill color, and the damage type is represented by an outline color. From the results of this study, GW, JB, CB, and GG areas were identified as having high risk levels. For damage type in these areas, GW and JB were shown to be Type A and C, the GG area was Type B and C, and the CB area was Type C. Considering the causes of damage in these areas, when damage occurs in GW and JB, the scale of damage can be large and caused by landslides, and as the stream density in the GG area is high, damage can be occur frequently. In the CB area, damage are occurred mainly in arable land due to poor drainage by steep slopes. The GB and GN areas are the representative areas shown to be in risk level 3, and the damage type for this area is C.
In addition, urban area such as IC, SO, BS, and GJ were presented Type E and low risk level; west coast area such as JN, CN, and IC also were presented a low risk level. However, even if the risk levels are comparable, the damage type and cause can be different according to the topographic characteristics. Thus, in order to determine the priority and type of appropriate prevention projects, it is necessary to consider the risk level and damage type each region.
4. Discussions and Conclusions
In this study, a method which can identify the types and priorities of disaster prevention projects by considering various regional characteristics was proposed. First, potential assessment indicators for risk assessment were gathered by reviewing previous research cases, and assessment indicators relevant to this study were chosen based on principle for indicator selection. Following that, an integrated index and the risk level were calculated and four grades were identified. Damage types by region were classified into five types using hierarchical cluster analysis and the facility’s history of damage in the corresponding region. Finally, the two results were combined to examine the characteristics of heavy-rain damage in each region, and appropriate types and priorities of disaster prevention projects were proposed based on these findings.
The results of the risk-level analysis revealed that the risk level was relatively high in cities such as GW, JB, GG, CB, and JJ, where heavy rain damage occurs frequently or is severe, and relatively low in cities such as JN, CN, IC, and SE. The frequency of damage was found to be low in GW and JB, but the scale was very large; while, the scale was small, but it occurred very frequently in GG. According to the damage type analysis, Type A which mainly consists of landslide damage was primarily found in GW and JB, whereas Type B is river inundation damage and was found in GG. Furthermore, Type C is agricultural land damage which was prevalent in CB, and Type D is stream facility damage by rapid water velocity and was found in GJ, GG. Type E is building damage, which was prevalent in urban areas such as SO, IC, and DG. When analyzing regional characteristics by linking risk level and damage type, there were few cases of damage due to landslides in GW and JB, but most of the damage was significant. Damage occurred primarily in river facilities in GG, and most of the damage was minor, but it occurred frequently. Finally, considering the most dangerous areas in relation to the risk level and damage type, GW and JB areas were identified as requiring an erosion facility maintenance and repair project and a sewer pipes maintenance project; a river improvement project was suggested for the GG area. Furthermore, in CB and JJ, a sewer-pipe maintenance project should ideally be implemented.
We were able to identify the flood cause and to propose the prevention project for each region by analyzing the major damage types that were not considered in previous risk-assessment studies and with risk level. However, since this study is the result of analysis at the national level, it was impossible to identify the specific location at district level where each prevention project was necessary. Therefore, in future research, it will be necessary to derive the specific location via quantitative risk assessment for high-risk areas that were identified in the results of this study.
In this study, a strategy for determining the risk level and type of damage South Korea’s entire region was proposed. When developing various types of disaster-prevention project plans from a macroscopic perspective, it is believed that identifying the types of projects and prioritizing them can be of great help in reducing the national budget in terms of time and cost. Therefore, the findings of this study are expected to be used as a method of identifying damage characteristics by region when developing a plan for disaster prevention projects.
Author Contributions
Conceptualization, J.K. and H.S.K.; formal analysis, J.K.; methodology, D.K. and M.L.; supervision, H.S.K. and H.H.; writing—original draft, J.K.; writing—review and editing, J.K. and H.H. All authors have read and agreed to the published version of the manuscript.
Funding
INHA UNIVERSITY Research Grant.
Institutional Review Board Statement
Not applicable.
Informed Consent Statement
Not applicable.
Data Availability Statement
Not applicable.
Acknowledgments
This work was supported by INHA UNIVERSITY Research Grant.
Conflicts of Interest
The authors declare no conflict of interest.
References
- UNDP. Sendai Framework for Disaster Risk Reduction (2015–2030). Available online: https://www.undrr.org/publication/sendai-framework-disaster-risk-reduction-2015-2030 (accessed on 18 March 2021).
- Ministry of the Interior and Safety (MOIS). The Statistical Yearbook of Natural Disaster; MOIS: Korea, Sejong, 2019.
- Țîncu, R.; Zêzere, J.L.; Crăciun, I.; Lazăr, G.; Lazăr, I. Quantitative micro-scale flood risk assessment in a section of the Trotuș River, Romania. Land Use Policy 2020, 95, 103881. [Google Scholar] [CrossRef]
- Di Mauro, M.; De Bruijn, K.M.; Meloni, M. Quantitative methods for estimating flood fatalities: Towards the introduction of loss-of-life estimation in the assessment of flood risk. Nat. Hazards 2012, 63, 1083–1113. [Google Scholar] [CrossRef]
- Zhang, J.; Okada, N.; Tatano, H.; Hayakawa, S. Risk Assessment and Zoning of Flood Damage Caused by Heavy Rainfall in Yamaguchi Prefecture, Japan. Flood Def. 2002, 2002, 162–169. [Google Scholar]
- Fekete, A. Validation of a social Vulnerability index in context to river-floods in Germany. Nat. Hazards Earth Syst. Sci. 2009, 9, 393–403. [Google Scholar] [CrossRef] [Green Version]
- Shivaprasad Sharma, S.V.; Parth Sarathi, R.; Chakravarthi, V.; Srinivasa Rao, G. Flood risk assessment using multi-criteria analysis: A case study from Kopili River Basin, Assam, India. Geomat. Nat. Hazards Risk 2017, 9, 79–93. [Google Scholar] [CrossRef]
- Amira, R.F.; Surjandari, I.; Laoh, E. Jakarta Flood Risk Mapping Using Index-based Approach and Spatial Analysis. In Proceedings of the 2020 International Conference on ICT for Smart Society (ICISS), Bandung, Indonesia, 19–20 November 2020. [Google Scholar] [CrossRef]
- Lim, K.S.; Choi, S.J.; Lee, D.R.; Moon, J.W. Development of Flood Risk Index using causal relationships of Flood Indicators. J. Korean Soc. Civ. Eng. 2010, 30, 61–70. [Google Scholar]
- OECD. OECD Environmental Indicators 2001—Towards Sustainable Development; OECD: Paris, France, 2001. [Google Scholar] [CrossRef]
- Mustika Anindita, R.; Susilowati, I.; Muhammad, F. Flood risk spatial index analysis in the coastal Pekalongan, Central Java, Indonesia. In E3S Web of Conferences; EDP Sciences: Les Ulis City, France, 2020; Volume 202, p. 06028. [Google Scholar]
- IPCC. Climate Change 2007: The Physical Science Basis, Contribution of Working Group I to the Fourth Assessment Report of the Intergovernmental Panel on Climate Change; IPCC: Switzerland, Geneva, 2007. [Google Scholar]
- Korea Institute of Civil Engineering and Building Technology. Construction of Calculation Process and Advancement for Flood Damage Risk Index to Assess Qualitative Risk; KICT: Ilsan, Korea, 2020. [Google Scholar]
- 2009 UNISDR Terminology on Disaster Risk Reduction. Available online: https://www.undrr.org/publication/2009-unisdr-terminology-disaster-risk-reduction (accessed on 18 March 2021).
- Rygel, L.; O’Sullivan, D.; Yarnal, B. A method for constructing a social Vulnerability index: An Application to Hurricane Storm Surges in a Developed Country. Mitig. Adapt. Strateg. Glob. Change 2006, 11, 741–764. [Google Scholar] [CrossRef]
- Joo, H.; Choi, C.; Kim, J.; Kim, D.; Kim, S.; Kim, H.S. A Bayesian network-based integrated for flood risk assessment (InFRA). Sustainability 2019, 11, 3733. [Google Scholar] [CrossRef] [Green Version]
- Kim, J.S.; Choi, C.H.; Lee, J.S.; Kim, H.S. Damage prediction using heavy rain risk assessment:(1) Estimation of heavy rain damage risk index. J. Korean Soc. Hazard Mitig. 2017, 17, 361–370. [Google Scholar] [CrossRef]
- Birkmann, J. Measuring vulnerability to promote disaster-resilient societies: Conceptual frameworks and definitions. Meas. Vulnerability Nat. Hazards Disaster Resilient Soc. 2006, 1, 9–54. [Google Scholar]
- Choi, H.C.; Sirakaya, E. Sustainability indicators for managing community tourism. Tour. Manag. 2006, 27, 1274–1289. [Google Scholar] [CrossRef]
- Berry, D. Sustainable Development in the United States: An Experimental Set of Indicators; Interim Report; US Interagency Working Group on Sustainable Development Indicators: Washington, DC, USA, 1997.
- Bundesregierung, D. Perspektiven fur Deutschland. Unsere Strategie fur Eine Nachhaltige Entwicklung. 2002. Available online: https://www.nachhaltigkeit.info/media/1326188329phpYJ8KrU (accessed on 10 May 2021).
- Nardo, M.; Saisana, M.; Saltelli, A.; Tarantola, S. Tools for composite indicators building. Eur. Com. Ispra 2005, 15, 19–20. [Google Scholar]
- Forman, E.H.; Gass, S.I. The analytic hierarchy processan exposition. Oper. Res. 2001, 49, 469–486. [Google Scholar] [CrossRef]
- MacCallum, R. A comparison of factor analysis programs in SPSS, BMDP, and SAS. Psychometrika 1983, 48, 223–231. [Google Scholar] [CrossRef]
- Dalkey, N.; Helmer, O. An experimental application of the Delphi method to the use of experts. Manag. Sci. 1963, 9, 458–467. [Google Scholar] [CrossRef]
- Ozkul, S.; Harmancioglu, N.B.; Singh, V.P. Entropy-based assessment of water quality monitoring networks. J. Hydrol. Eng. 2000, 5, 90–100. [Google Scholar] [CrossRef] [Green Version]
- Joo, H.; Kim, S.; Lee, M.; Kim, H. A study on determination of investment priority of flood control considering flood vulnerability. J. Korean Soc. Hazard Mitig. 2018, 18, 417–429. [Google Scholar] [CrossRef]
- Kyoung, M.S.; Kim, S.D.; Kim, B.K.; Kim, H.S. Construction of hydrological drought severity-area-duration curves using cluster analysis. J. Korean Soc. Civ. Eng. 2007, 27, 267–276. [Google Scholar]
- Han, S.M.; Hwang, G.S.; Choe, S.Y.; Park, J.W. A study on classifying algorithm of disaster recovery resources using statistical method. J. Korean Soc. Hazard Mitig. 2014, 14, 49–58. [Google Scholar] [CrossRef] [Green Version]
- Nam, W.H.; Kim, T.; Hong, E.M.; Hayes, M.J.; Svoboda, M.D. Water supply risk assessment of agricultural reservoirs using irrigation vulnerability model and cluster analysis. J. Korean Soc. Agric. Eng. 2015, 57, 59–67. [Google Scholar]
- Pham, D.T.; Afify, A.A. Engineering applications of clustering techniques. In Intelligent Production Machines and Systems, ScienceDirect; Elsevier: Amsterdam, The Netherlands, 2006; pp. 326–331. [Google Scholar] [CrossRef]
- Son, Y.; Chung, M. Digital Forensics for Android Location Information using Hierarchical Clustering. J. Inst. Electron. Inf. Eng. 2014, 51, 143–151. [Google Scholar] [CrossRef]
Figure 1.
Locations of nine provinces and eight cities in South Korea.

Figure 2.
Elevation and river map in study area.

Figure 3.
Procedure of heavy rain damage risk assessment.

Figure 4.
Conceptual diagram of dendrogram [31].
Figure 4.
Conceptual diagram of dendrogram [31].

Figure 5.
Normalized spatial distribution of each sub–index. (a) Hazard index, (b) Exposure index, (c) Vulnerability index, and (d) Capacity index.
Figure 5.
Normalized spatial distribution of each sub–index. (a) Hazard index, (b) Exposure index, (c) Vulnerability index, and (d) Capacity index.

Figure 6.
Classification of risk level based on probability distribution. (a) PDF of HDRI and (b) classification of risk level using CDF.
Figure 6.
Classification of risk level based on probability distribution. (a) PDF of HDRI and (b) classification of risk level using CDF.

Figure 7.
Result of risk assessment.

Figure 8.
Distribution of facilities affected by heavy rain damage from 2003–2019 in South Korea.

Figure 9.
Hierarchical cluster analysis result based on dendrogram.

Figure 10.
Regional classification of damage type from the analysis.

Figure 11.
Regional risk level and heavy rain damage types from the analysis.


Table 1.
Abbreviations for the provinces and cities of South Korea.
| Province | Abbreviation | City | Abbreviation |
|---|---|---|---|
| Gyeonggi-do | GG | Seoul | SO |
| Gangwon-do | GW | Incheon | IC |
| Gyeongsangbuk-do | GB | Busan | BS |
| Gyeongsangnam-do | GN | Daegu | DG |
| Chungcheongbuk-do | CB | Ulsan | US |
| Chungcheongnam-do | CN | Daejeon | DJ |
| Jeollabuk-do | JB | Sejong | SJ |
| Jeollanam-do | JN | Gwangju | GJ |
| JeJu-do | JJ |
| Indicator Selection Principles | Abbreviations | Descriptions |
|---|---|---|
| Correlation | C | Examines whether the meanings of the components are similar |
| Simplicity | S | Examines whether the meanings of individual indicators are easy to understand |
| Quantitative | Q | Examines whether indicators can be quantified numerically |
| Validity | V | Examines whether the conceptual basis of the relevant indicator is clear |
| Redundancy | R | Examines whether any of the indicators have overlapping meanings |
| Ease | E | Examines whether it is easy to continuously collect data |
Table 3.
Features of standardization methods used in this study [22].
Table 3.
Features of standardization methods used in this study [22].
| Methods | Equation | Description |
|---|---|---|
| Categorical scale | A method of classifying categories by quantile and assigning scores even if the range of specific indicator values is very wide. | |
| means the value of the th data, and scores are given according to the range to which the value belongs. | ||
| Re-Scaling | A transformation method based on the range of indicators. Standardized values are included in the range of 0 to 1. | |
| means the value of the th data, and max(x) and min(x) represent the maximum and minimum values of the data, respectively. |
Table 4.
Selection of assessment indicators.
| Framework | Components | Potential Assessment Indicators | Indicator Selection Principles | Final Selection | |||||
|---|---|---|---|---|---|---|---|---|---|
| C | S | Q | V | R | E | ||||
| Hazard | Meteorological | Probable rainfall | ☓ | ○ | ○ | ○ | ○ | ○ | ☓ |
| Number of days of rainfall of 80 mm | ○ | ☓ | ○ | ○ | ☓ | ○ | ☓ | ||
| Maximum rainfall per day | ○ | ○ | ○ | ○ | ☓ | ○ | ☓ | ||
| Maximum rainfall during the duration (24 h) | ○ | ○ | ○ | ○ | ○ | ○ | ○ (H1) | ||
| Annual average rainfall | ○ | ○ | ○ | ○ | ○ | ○ | ○ (H2) | ||
| Historical Damage | Flood damage | ○ | ○ | ○ | ○ | ○ | ○ | ○ (H3) | |
| Scale of flood damage | ○ | ○ | ○ | ○ | ☓ | ○ | ☓ | ||
| Frequency of flood damage | ○ | ○ | ○ | ○ | ○ | ○ | ○ (H4) | ||
| Flooded area | ○ | ○ | ☓ | ☓ | ○ | ☓ | ☓ | ||
| Exposure | Socio-economic | Total population | ○ | ○ | ○ | ○ | ○ | ○ | ○ (E1) |
| GRDP | ○ | ○ | ○ | ○ | ○ | ○ | ○ (E2) | ||
| Per capita income | ○ | ○ | ○ | ○ | ☓ | ○ | ☓ | ||
| Average official land price | ○ | ○ | ○ | ○ | ☓ | ○ | ☓ | ||
| Population density | ○ | ○ | ○ | ○ | ☓ | ☓ | ☓ | ||
| Physical | Number of buildings | ○ | ○ | ○ | ○ | ○ | ○ | ○ (E3) | |
| Infrastructure (road) | ○ | ○ | ○ | ○ | ○ | ○ | ○ (E4) | ||
| Slope | ☓ | ○ | ○ | ○ | ☓ | ○ | ☓ | ||
| River density | ○ | ○ | ○ | ○ | ○ | ○ | ○ (E5) | ||
| Vulnerability | Social | Vulnerable population | ○ | ○ | ○ | ○ | ○ | ○ | ○ (V1) |
| Poor population | ○ | ○ | ○ | ○ | ☓ | ☓ | ☓ | ||
| Infant mortality | ○ | ○ | ○ | ○ | ☓ | ☓ | ☓ | ||
| TV distribution rate | ☓ | ○ | ○ | ○ | ○ | ☓ | ☓ | ||
| Number of semi-basement households | ○ | ○ | ○ | ○ | ○ | ☓ | ☓ | ||
| Population in flooded areas | ○ | ○ | ☓ | ☓ | ○ | ☓ | ☓ | ||
| Number of households not supplied with electricity | ☓ | ○ | ○ | ○ | ☓ | ☓ | ☓ | ||
| Physical | Area of the lowland area | ○ | ☓ | ○ | ☓ | ☓ | ☓ | ☓ | |
| Runoff curve index | ○ | ○ | ○ | ○ | ○ | ☓ | ☓ | ||
| Disaster-prone districts | ○ | ○ | ○ | ○ | ○ | ○ | ○ (V2) | ||
| Steep slope | ○ | ○ | ○ | ○ | ○ | ○ | ○ (V3) | ||
| Old buildings | ○ | ○ | ○ | ○ | ○ | ○ | ○ (V4) | ||
| Capacity | Disaster Prevention Capability | Number of disaster prevention facilities | ○ | ○ | ○ | ○ | ○ | ☓ | ☓ |
| Preventive facilities | ○ | ○ | ○ | ○ | ☓ | ☓ | ☓ | ||
| Drainage pump station | ○ | ○ | ○ | ○ | ○ | ○ | ○ (C1) | ||
| Dam and reservoir | ○ | ○ | ☓ | ○ | ○ | ☓ | ☓ | ||
| River management personnel | ☓ | ○ | ☓ | ○ | ○ | ☓ | ☓ | ||
| Financial independence | ○ | ○ | ○ | ○ | ○ | ○ | ○ (C2) | ||
| Disaster Prevention History | Cumulative disaster prevention budget | ○ | ○ | ○ | ○ | ○ | ○ | ○ (C3) | |
| Promotion of preventive measures | ○ | ○ | ☓ | ○ | ☓ | ☓ | ☓ | ||
| River embankment ratio | ☓ | ○ | ☓ | ☓ | ○ | ☓ | ☓ | ||
Table 5.
Elementary statistics for assessment indicators.
| Assessment Indicators | Re-Scaling | The Percentage of Standardized Value | ||||
|---|---|---|---|---|---|---|
| Min | Max | 20% | 40% | 60% | 80% | |
| H1 | 833.18 | 1443.75 | 0.2245 | 0.3503 | 0.4490 | 0.5518 |
| H2 | 96.43 | 200.625 | 0.2906 | 0.3778 | 0.4889 | 0.6391 |
| H3 | 0 | 156 | 0.2321 | 0.3654 | 0.4679 | 0.5923 |
| H4 | 0 | 635,553,387 | 0.0024 | 0.0065 | 0.0161 | 0.0407 |
| E1 | 16,993 | 1,194,465 | 0.0245 | 0.0709 | 0.1753 | 0.3181 |
| E2 | 431,322 | 60,407,392 | 0.0171 | 0.0446 | 0.0853 | 0.1725 |
| E3 | 2257 | 180,936 | 0.1184 | 0.1718 | 0.2508 | 0.3608 |
| E4 | 0.000421 | 0.281286 | 0.0233 | 0.0346 | 0.0712 | 0.1614 |
| E5 | 0 | 0.209904 | 0.0444 | 0.0712 | 0.1098 | 0.1740 |
| V1 | 7382 | 258,384 | 0.0491 | 0.1038 | 0.2135 | 0.3627 |
| V2 | 0 | 20 | 0.0250 | 0.0500 | 0.1500 | 0.3000 |
| V3 | 0 | 71.76 | 0.0002 | 0.0025 | 0.0224 | 0.1015 |
| V4 | 337 | 67,767 | 0.1235 | 0.1843 | 0.2463 | 0.3156 |
| C1 | 0 | 283,740 | 0.0008 | 0.0016 | 0.0081 | 0.0250 |
| C2 | 0 | 453,722.3 | 0.0176 | 0.0352 | 0.0851 | 0.1341 |
| C3 | 8.5 | 69.2 | 0.1081 | 0.1951 | 0.2965 | 0.4870 |
Table 6.
Percentile and score for standardized value.
| Percentile | Score | Percentile | Score |
|---|---|---|---|
| 0.2 | 0.8 | ||
| 0.4 | 1.0 | ||
| 0.6 | - | - |
Table 7.
Weights of the assessment indicators and sub-index.
| Framework | Assessment Indicators | Indicators Weight | Sub-Index Weight |
|---|---|---|---|
| Hazard | H1 | 0.0043 | 0.3198 |
| H2 | 0.0075 | ||
| H3 | 0.0867 | ||
| H4 | 0.9014 | ||
| Exposure | E1 | 0.139 | 0.1978 |
| E2 | 0.1861 | ||
| E3 | 0.0613 | ||
| E4 | 0.189 | ||
| E5 | 0.4245 | ||
| Vulnerability | V1 | 0.123 | 0.186 |
| V2 | 0.2937 | ||
| V3 | 0.518 | ||
| V4 | 0.0654 | ||
| Capacity | C1 | 0.7646 | 0.2963 |
| C2 | 0.1983 | ||
| C3 | 0.0371 |
Publisher’s Note: MDPI stays neutral with regard to jurisdictional claims in published maps and institutional affiliations. |
© 2022 by the authors. Licensee MDPI, Basel, Switzerland. This article is an open access article distributed under the terms and conditions of the Creative Commons Attribution (CC BY) license (https://creativecommons.org/licenses/by/4.0/).
Share and Cite
MDPI and ACS Style
Kim, J.; Kim, D.; Lee, M.; Han, H.; Kim, H.S. Determining the Risk Level of Heavy Rain Damage by Region in South Korea. Water 2022, 14, 219. https://doi.org/10.3390/w14020219
AMA Style
Kim J, Kim D, Lee M, Han H, Kim HS. Determining the Risk Level of Heavy Rain Damage by Region in South Korea. Water. 2022; 14(2):219. https://doi.org/10.3390/w14020219
Chicago/Turabian StyleKim, Jongsung, Donghyun Kim, Myungjin Lee, Heechan Han, and Hung Soo Kim. 2022. "Determining the Risk Level of Heavy Rain Damage by Region in South Korea" Water 14, no. 2: 219. https://doi.org/10.3390/w14020219
Note that from the first issue of 2016, this journal uses article numbers instead of page numbers. See further details here.