
Effect of the Progressive Increase of Organic Loading Rate in an Anaerobic Sequencing Batch Reactor for Biodiesel Wastewater Treatment


1
Department of Hydraulic and Environmental Engineering, Federal University of Ceará, Fortaleza 60020-903, Brazil
2
Department of Agricultural Engineering, Federal University of Viçosa, Viçosa 36570-900, Brazil
3
Department of Hydraulics and Sanitation, University of São Paulo, São Carlos 13560-970, Brazil
*
Author to whom correspondence should be addressed.
Water 2022, 14(2), 223; https://doi.org/10.3390/w14020223
Submission received: 16 December 2021
/
Revised: 7 January 2022
/
Accepted: 9 January 2022
/
Published: 12 January 2022
/
Corrected: 14 March 2022
(This article belongs to the Special Issue Water Quality Engineering and Wastewater Treatment Ⅱ)
Abstract
:The wastewater from the biodiesel industry is an environmental problem, and from a sanitation resources perspective, the anaerobic sequencing batch reactor (ASBR) is an interesting alternative for wastewater treatment. A better understanding of ASBR operation behavior under the progressive increase of the organic loading rate (OLR) is crucial for upscaling. The objective of this study was to monitor an ASBR operating with an OLR ranging from 1.3 to 9.3 kgCOD m−3 d−1. The average chemical oxygen demand (COD) removal efficiencies of the ASBR were 52, 41, 47, and 11% for phases 1, 2, 3, and 4, respectively. The apparent kinetic coefficient, i.e., the rate of degradation of organic matter, was between 0.10 and 1.80 h−1, considering the kinetic model that considers the residual substrate concentration, which was the one that best fit the obtained data. The progressive increase in applied OLR modified the microbial biomass diversity, which in turn influenced the degradation kinetics of the organic matter. In addition, the values of the applied OLR of 5.1 kgCOD m−3 d−1 and a food to microorganism ratio (F/M) of 0.6 kgCOD kgVSS−1 d−1 were shown to be limiting values that promoted the overload of ASBR.
1. Introduction
Biodiesel, as a result of extensive scientific research, has emerged as a potential replacement for fossil fuels. During its production process, more specifically transesterification, an average portion of glycerol is generated, corresponding to 10% of the total volume of the biodiesel produced [1]. However, a purification process is required for the commercial viability of the high industrial cost of glycerol [2]. For this reason, it is common to mix unprocessed glycerol with other aqueous by-products, generating the so-called biodiesel industry wastewater (BW).
Anaerobic treatment has been widely used in tropical countries for advantages such as low energy consumption and low sludge production. Among such processes, the anaerobic sequencing batch reactor (ASBR) offers advantages in relation to continuous treatment, due to the great process flexibility and lesser need for segregated clarifiers from the unit [3].
Organic loadings are essential for designing and starting the ASBR. By design, the mass amount of substrate applied directly to the reactor per unit volume is defined as applied volumetric organic loading (aOLR). Research by Daud et al. [4] reported that the COD of wastewater generated from biodiesel production can range from 3681 to 588,800 mg L−1, depending on the control process during biodiesel production. Therefore, the concentration of biodiesel wastewater is an important factor in studying the range of aOLR values found in current industry operations. According to Pereira et al. [5], in addition to aOLR, the inoculum mass is important for the start and operation of ASBR, as it affects the relationship between the food to microorganism (F/M) ratio. In the same study, the authors reported that this is the most influential factor in the organic matter degradation process, which drives the removal efficiency of organic matter and the quality of the treated effluent. Previous studies [6,7,8,9] have proven the influence of the progressive increase of aOLR in the removal of organic matter. However, few studies have reported the effect of these organic shocks on substrate degradation kinetics and microbial diversity in ASBRs.
Thus, the objective of this study was to evaluate the performance of an ASBR in terms of (i) removal efficiency of organic matter (as COD), (ii) substrate degradation kinetics, and (iii) microbiological characteristics and microbial diversity of the biomass of an ASBR operating under progressive increase of aOLR based on COD of biodiesel wastewater within the range of values usually found at an industrial scale.
2. Materials and Methods
2.1. Experimental Apparatus
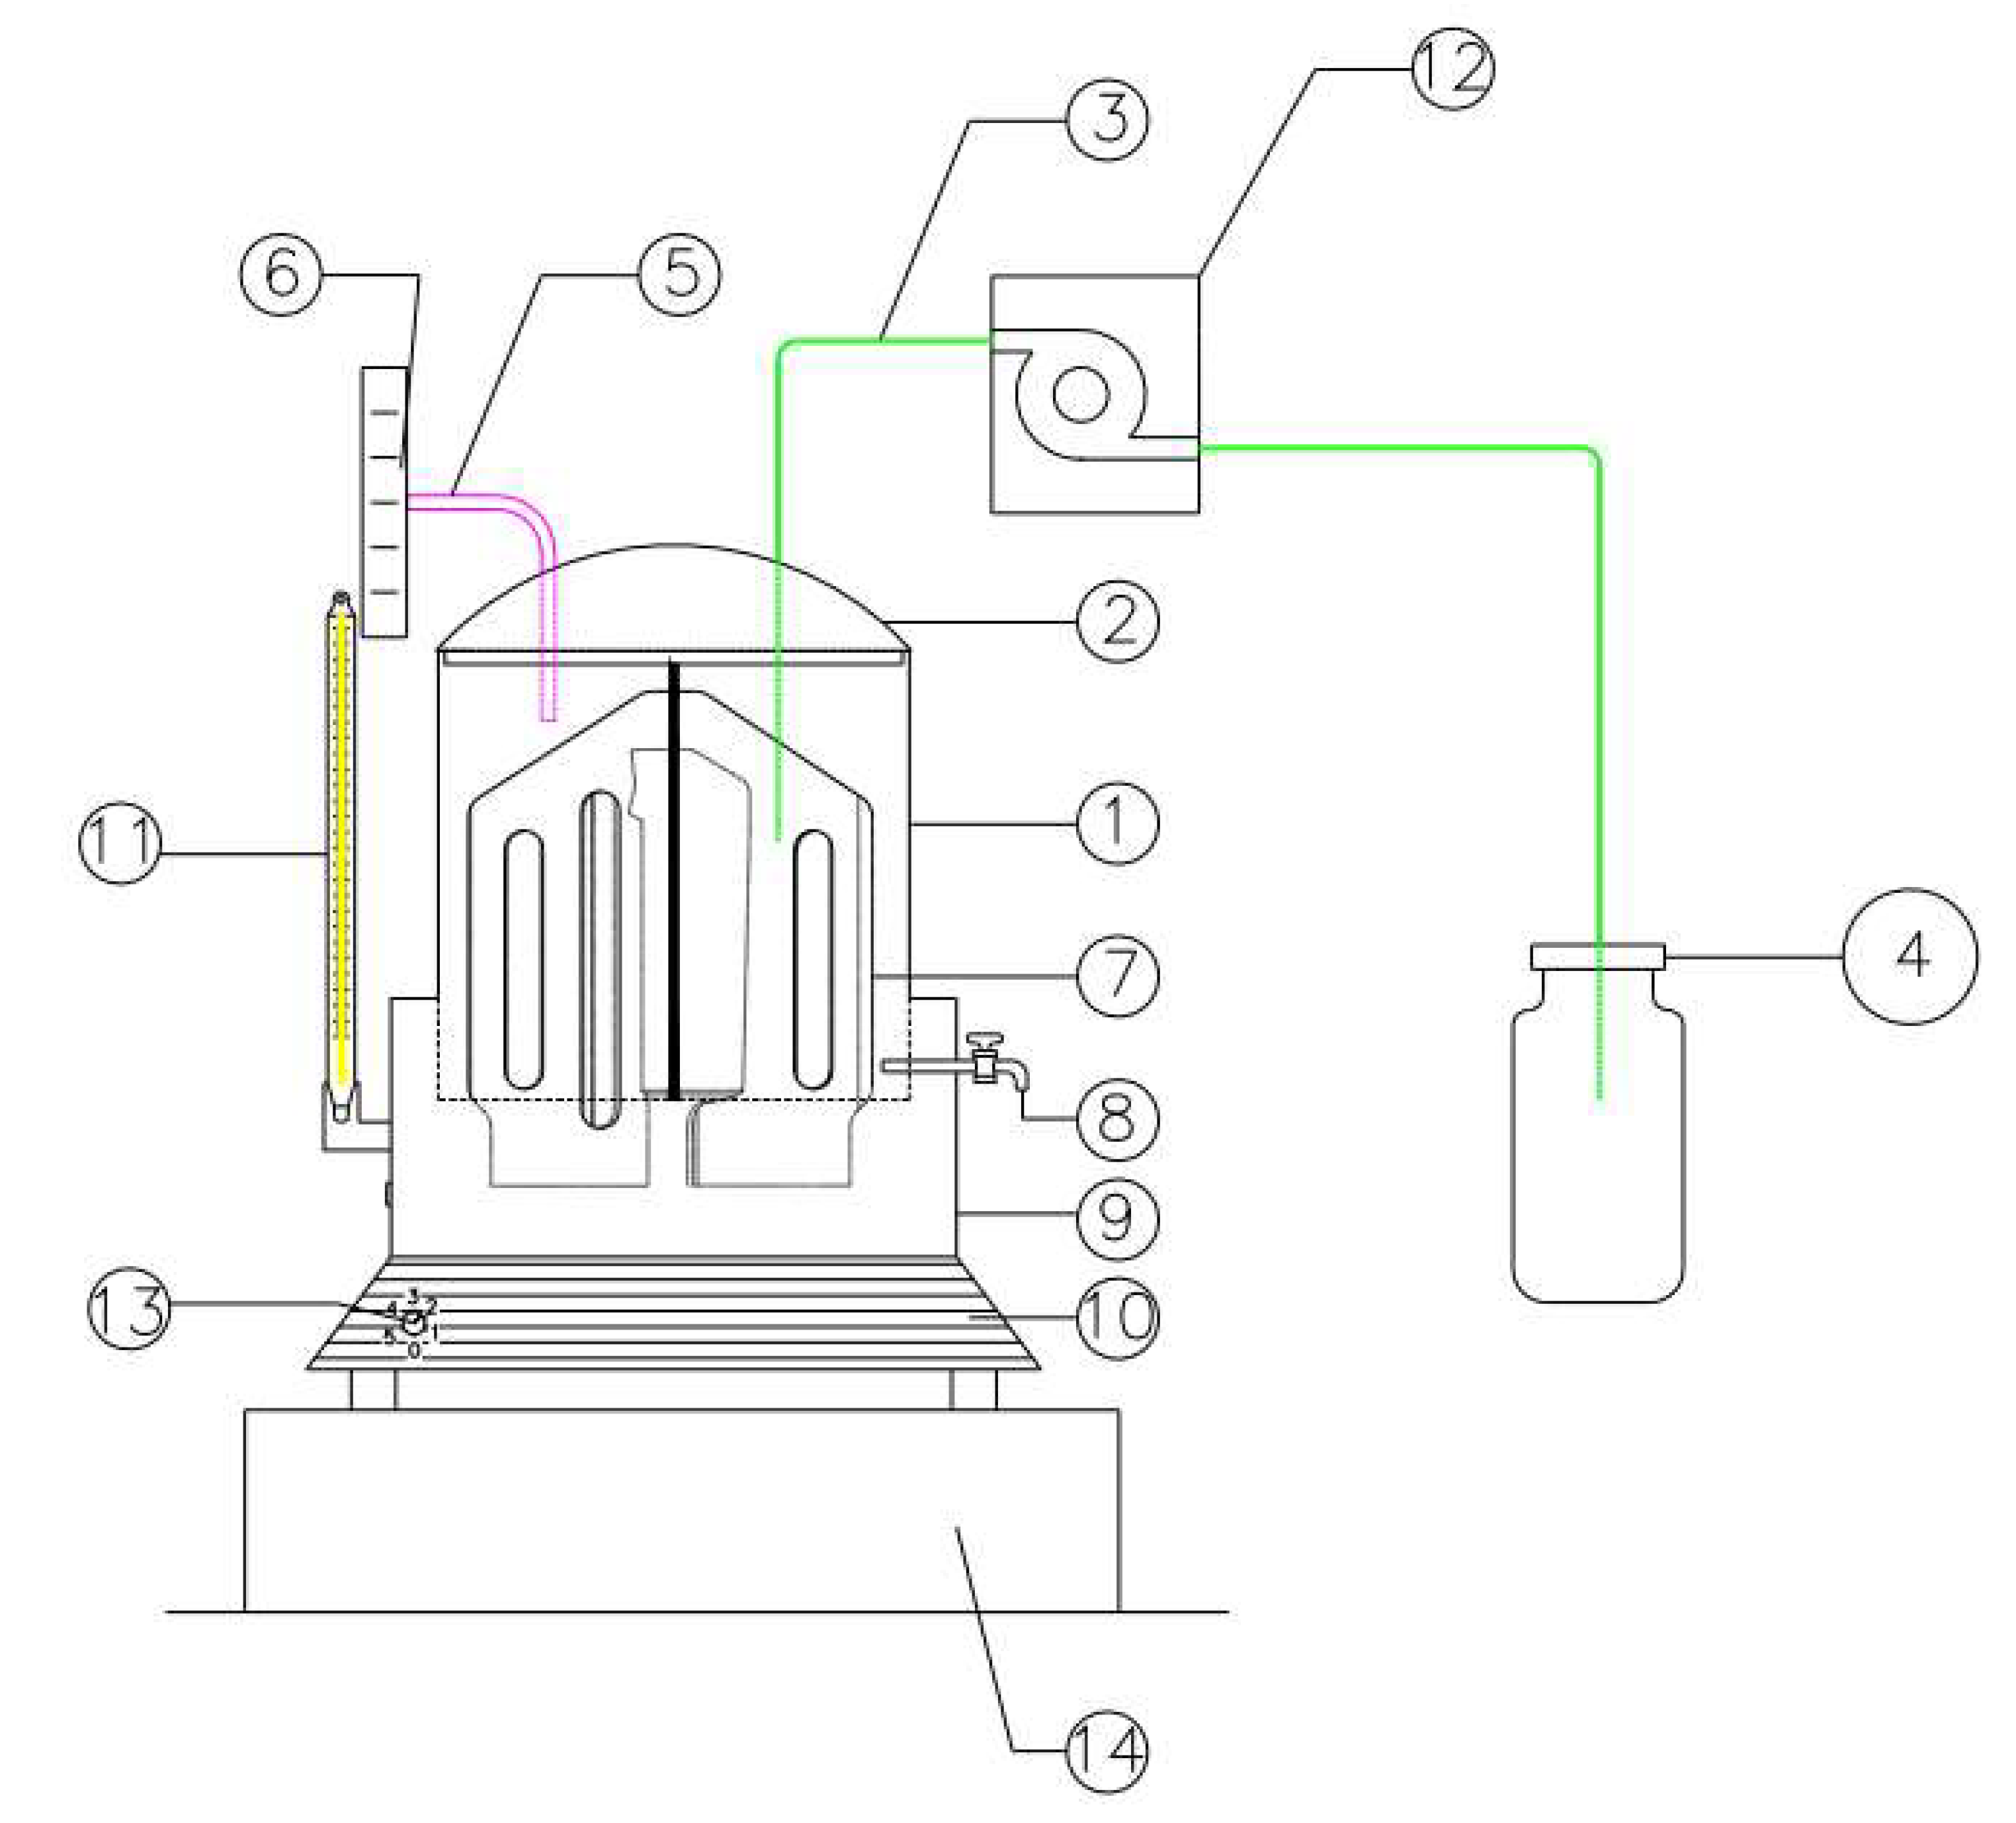
The ASBR used in this experiment was built with acrylic material, and it was equipped with a thermostat bath for temperature control (10 to 90 °C), a regulator for mixing speed (0 to 40 rpm), and a valve for sludge disposal installed at the base of the reactor (Figure 1). The total volume of the ASBR was 6.8 L, with 5.0 L for reaction volume and 1.8 L (headspace) for storage of the biogas produced during the biodegradation process. Two valves were installed at the upper part of the reactor lid. One was for the biogas outlet (where a gasometer was attached to measure gas flow), and the other was for fitting the pipe used to supply the influent to the reactor and to extract the supernatant (discharge) for the analysis, which was done using a peristaltic positive displacement pump.
2.2. Preparation of the Biodiesel Wastewater
The biodiesel wastewater used throughout the experiment was formulated with commercial glycerol (the only source of organic matter) diluted in distilled water. The COD of the biodiesel wastewater ranged between 3000 and 24,000 mg L−1, and was divided into four operation phases. The concentrations of organic matter in terms of COD were 3128; 6238; 12,597, and 23,336 mg L−1 for Phases I, II, III, and IV. The concentrations of nitrogen (from urea) and phosphorus (from a mixture of phosphate salts) were determined to maintain a COD:N:P ratio of 350:5:1 for each COD of the influent biodiesel wastewater. Subsequently, other necessary macronutrients and micronutrients were added to the solution, according to Silva et al. [9] and Lovato et al. [10]. Lastly, sodium bicarbonate (1.5 times the COD mass) was added into the wastewater, as suggested by Selma et al. [6].
2.3. ASBR Setup and Operation
The cycle time (TC) was divided into four stages, feeding (0.5 h), reaction (20 h), sedimentation (3 h), and disposal (0.5 h), with a total of 24 h per cycle. These values were based on a previous study conducted by Pereira et al. [5].
The sludge used in the inoculation of the ASBR was obtained from an anaerobic sludge blanket reactor used in the treatment of sanitary sewage. The ASBR was inoculated with 2.34 L of sludge for the first batch (ASBR start up), presenting a total mass of 101,990 mg of volatile suspended solids (VSS). After inoculation, 2.66 L of biodiesel wastewater was added into the ASBR to complete the total 5.0 L reaction volume, resulting in an initial concentration of biomass (sludge) of approximately 20.4 g L−1 of VSS. The temperature was automatically adjusted to 36 °C, and at the end of the feeding phase, the entire system was in balance.
The impeller was started at the beginning of the reaction phase to obtain the desired homogenization between the biomass and biodiesel wastewater. After 20 h of reaction, the impeller was turned off, and it was followed by the sedimentation phase, which lasted 0.5 h, in order to separate the biomass (solid) from the supernatant. A total of 2 L of supernatant was then extracted and submitted to physical-chemical analysis. From the second day onwards, the ASBR was supplied with 2 L of biodiesel wastewater, and after sedimentation, 2 L of the treated wastewater was discarded, but the biomass was kept inside the ASBR throughout the 174 days of the experiment.
2.4. Operational Parameters and Experiment Monitoring
During the experiment, the ASBR was subjected to the optimal operational parameters previously reported by Pereira et al. [5], which corresponded to an impeller mixing speed of 40 rpm, reaction time (Rt) of 20 h, pH of biodiesel wastewater of 8.2 ± 0.1, and operating temperature of 37 ± 1 °C.
The experiment was conducted in four phases (I, II, III, and IV) that lasted 60, 35, 37, and 42 days, respectively, totaling 174 days of ASBR operation. Each phase was characterized by an applied volumetric organic loading rate (aOLR) that was kept constant during the entire phase. The change in phases was characterized by the progressive increase of aOLR, which was done by increasing the COD of the influent when the steady state for COD removal was achieved within the phase. In this case, it was considered steady state when the variation between samples was below 15%. After ensuring a steady state in the ASBR, six more batches were performed, and thus six samples were collected to be used as the representative replication of the operation in the stability of the ASBR for the respective phase.
Throughout the experiment, the ASBR was monitored daily until the steady state for COD removal was achieved, in this case when the variations between samples were below 15%. The values of the applied volumetric organic loading rate (aOLR) and removed volumetric organic loading rate (remOLR), the amount of food available per amount of microorganism ratio (F/M), and the removal efficiency (E) were estimated (Equations (1) to (4)), as well as the unit buffering conditions. In terms of biomass monitoring, the concentration of the total suspended solids (TSS), fixed suspended solids (FSS), and volatile suspended solids (VSS), as well as the exopolysaccharides (EPS) effluents were monitored.
where
CODIN is the total COD of biodiesel wastewater influent (kg m−3).
CODOUT is the soluble COD of biodiesel wastewater effluent (kg m−3).
VBW is the volume of biodiesel wastewater added into the ASBR (m3).
VT is the total volume of the reactor (m3).
MS is the sludge mass in the ASBR (kg of VSS).
aOLR is the applied volumetric organic loading rate (kgCOD m−3 d−1).
remOLR is the removed volumetric organic loading rate (kgCOD m−3 d−1).
F/M is the food/microorganism ratio (kgCOD kgVSS−1).
TR is the reaction time (d).
E is the removal efficiency of organic matter in terms of COD (%).
The volumetric methane production was estimated following methodology described by Vilvert et al. [11], considering the stoichiometric coefficients of the minimum and maximum methane production (Y) of Silva et al. [9] and Selma et al. [6], respectively. These methods describe the methane produced by COD removed from biodiesel wastewater when treated in an ASBR.
2.5. Physical-Chemical Analysis
The physical-chemical analysis of pH, total COD (tCOD), soluble COD (sCOD), and series of solids performed on wastewater samples, biomass, and supernatant, in addition to analyzing the biomass for the total Kjeldahl nitrogen and total phosphorus, were performed according to Standard Methods [12]. Total alkalinity (TA), total bicarbonate (BA), and total volatile acids (TVA) were carried out according to the potentiometric titration methodology proposed by Ripley et al. [13] and Jenkins et al. [14]. The effluent protein and polysaccharides were determined using the colorimetric method with a spectrophotometer, according to Bradford [15] and Dubois et al. [16], respectively.
2.6. Statistical Analysis
To evaluate the effect of progressive increase of aOLR, the experiment was conducted using a completely randomized design with four treatments replicated six times, with a total of 24 experimental units. The treatments were the phases of the experiment. Tukey’s test was used to compare the means for each treatment after the steady state of the ASBR was met.
The data collected before reaching the steady state, referring to the performance of the ASBR during the acclimatization of biomass in each phase, were submitted to descriptive statistical analysis using SISVAR software [17].
2.7. Evaluation of Organic Matter Degradation Kinetics
At the end of each phase, after reaching steady state, another batch was carried out that was identical to the previous ones. However, this batch during the cycle was leveraged for the collection of 5 mL samples of treated wastewater were collected over a cycle time of 25 h at intervals of 0, 0.5, 1, 1.5, 2, 4, 7, 11, 17, 20, and 24 h. In these samples, the sCOD was quantified as the COD effluent in order to represent the COD of glycerol and to avoid the influence of the sludge that was collected with the sample. The average values of COD for each sampling time were used to determine the degradation profile of organic matter over time, using a first order degradation kinetics model (Equation (5)) and the first order degradation kinetics model that estimates the residual concentration (Equation (6)):
where CS is the sCOD in the effluent after degradation (mg L−1), C0 is the tCODIN at the beginning of degradation (mg L−1), CR is the residual sCOD after degradation (mg L−1), t is the reaction time of the wastewater with the biomass (h), and kap is the apparent kinetic coefficient referring to the rate of degradation of organic matter (h−1).
The model that best fit the degradation kinetics of the organic matter of wastewater in the ASBR was selected using the coefficient of determination (R2) and the Akaike Information Criteria (AIC). This criterion is used to indicate the suitability of the model in relation to the number of estimated parameters [18]. A lower AIC value (Equation (7)) results in better adaptation of the data estimated by the kinetic model to the experimental data.
where AIC is the Akaike Information Criterion (dimensionless), N is the number of observations, SS is the sum of squares of the residuals, and k is the number of model parameters.
2.8. Evaluation of Microbial Diversity
The evaluation of the microbial diversity of the archeas and anaerobic bacteria was performed using a sludge sample inoculated into the ASBR (Sample 1) on day zero of the experiment and collected after the ASBR reached steady state for each aOLR. Sample 2 was sludge collected on the 60th day of operation during the steady state of Phase I. Sample 3 was the sludge collected on the 95th day of operation during the steady state of Phase II. Sample 4 was the sludge collected on the 132th day of operation during the steady state of Phase III. Sample 5 was the sludge collected on the 174th day of operation during the steady state of Phase IV. The sludge was collected from the bottom of the ASBR (region with the solid layer) using a sterilized sampler. The analysis was performed using the denaturation gradient gel electrophoresis (DGGE). The DNA extraction from populations of anaerobic bacteria and methanogenic arches from both sludge samples was performed using the PowerSoil® DNA Isolation Kit (MoBio Laboratories, Inc., Carlsbad, CA, USA).
For the microbial diversity analysis, primers R1492 (5′-TACCTTGTTACGACTT-3′) and F27 (5′-AGAGTTTGATCMTGGCTCAG-3′) [19] were used to amplify the V1 to V9 regions of the 16S rDNA. The reactions were performed in a total volume of 25 μL, containing 10 ng of template DNA, 0.2 μM of each primer, 0.2 mM of dNTPs, GoTaq Buffer (Promega, Madison, WI, USA), 3.0 mM of MgCl2, 0.2 mg mL−1 of BSA, and 1 U de GoTaq DNA polimerase (Promega, Madison, WI, USA). The amplifications were performed in a Mastercycler thermocycler (Eppendorf) through an initial denaturation cycle at 94 °C for 4 min, followed by 35 cycles of 94 °C for 30 s, 55 °C for 60 s, and 72 °C for 90 s.
A final extension cycle at 72 °C was conducted for 7 min. The products (~1400 pb) were analyzed on 2% agarose gel (m v−1). The product of the first PCR was used as a template for the amplification of the V6 to V9 regions of the 16S rDNA using the primers R1492 and F984 (5′-AACGCGAAGAACCTTAC-3′) [20] containing a GC clamp (5′-CGC CCG CCG CGC CCC GCG CCC GTC CCG CCG CCC CCG CCC G-3′) [21]. The reactions were performed in a total volume of 25 μL, containing 10 ng of template DNA, 0.2 μM of each primer, 0.2 mM of dNTPs, GoTaq Buffer (Promega), 3.0 mM of MgCl2, 0.2 mg mL−1 of BSA, 1% foramide (v v−1), and 1 U de GoTaq DNA polimerase (Promega, Madison, WI, USA).
The amplifications were performed through an initial denaturation cycle at 95 °C for 3 min, followed by 35 cycles of 94 °C for 30 s, 57 °C for 30 s, and 72 °C for 30 s. A final extension cycle at 72 °C was conducted for 1 min. The products (~500 pb) were analyzed on 2% agarose gel (m v−1).
The DGGE analysis was performed using the DCode Universal Mutation System (Bio-Rad, Hercules, CA, USA). Firest, 30 μL of the products of the reactions carried out with the primers F984-GC and R1492 were applied in polyacrylamide gel (acrylamide:bisacrylamide) at 8% (m v−1) in the TAE buffer (Tris base 40 mM; glacial acetic acid 20 mM; EDTA 10 mM, pH 8) prepared with 40 to 55% denaturing gradient from 100% denaturing solutions (7 M urea and 40% (v v−1) formamide, and 0% denaturing). The electrophoresis was performed for 20 h at 60 V and 60 °C. After that, the gel was stained for 20 min with SYBR Gold solution (Invitrogen™).
The DNA was revealed, and the image was digitized using a Fire Reader XS imaging system (Uvitec). The images of the gels were processed using the BioNumerics program version 6.0 (Applied Maths, Inc., Saint-Martins-Latem, Belgium) in order to compare the band profiles. The Venn diagrams were constructed based on binary matrices (presence and absence of OTUs) generated by the BioNumerics software, showing the number of unique and shared OTUs by the sample microbial communities.
3. Results and Discussion
3.1. Performance of ASBR
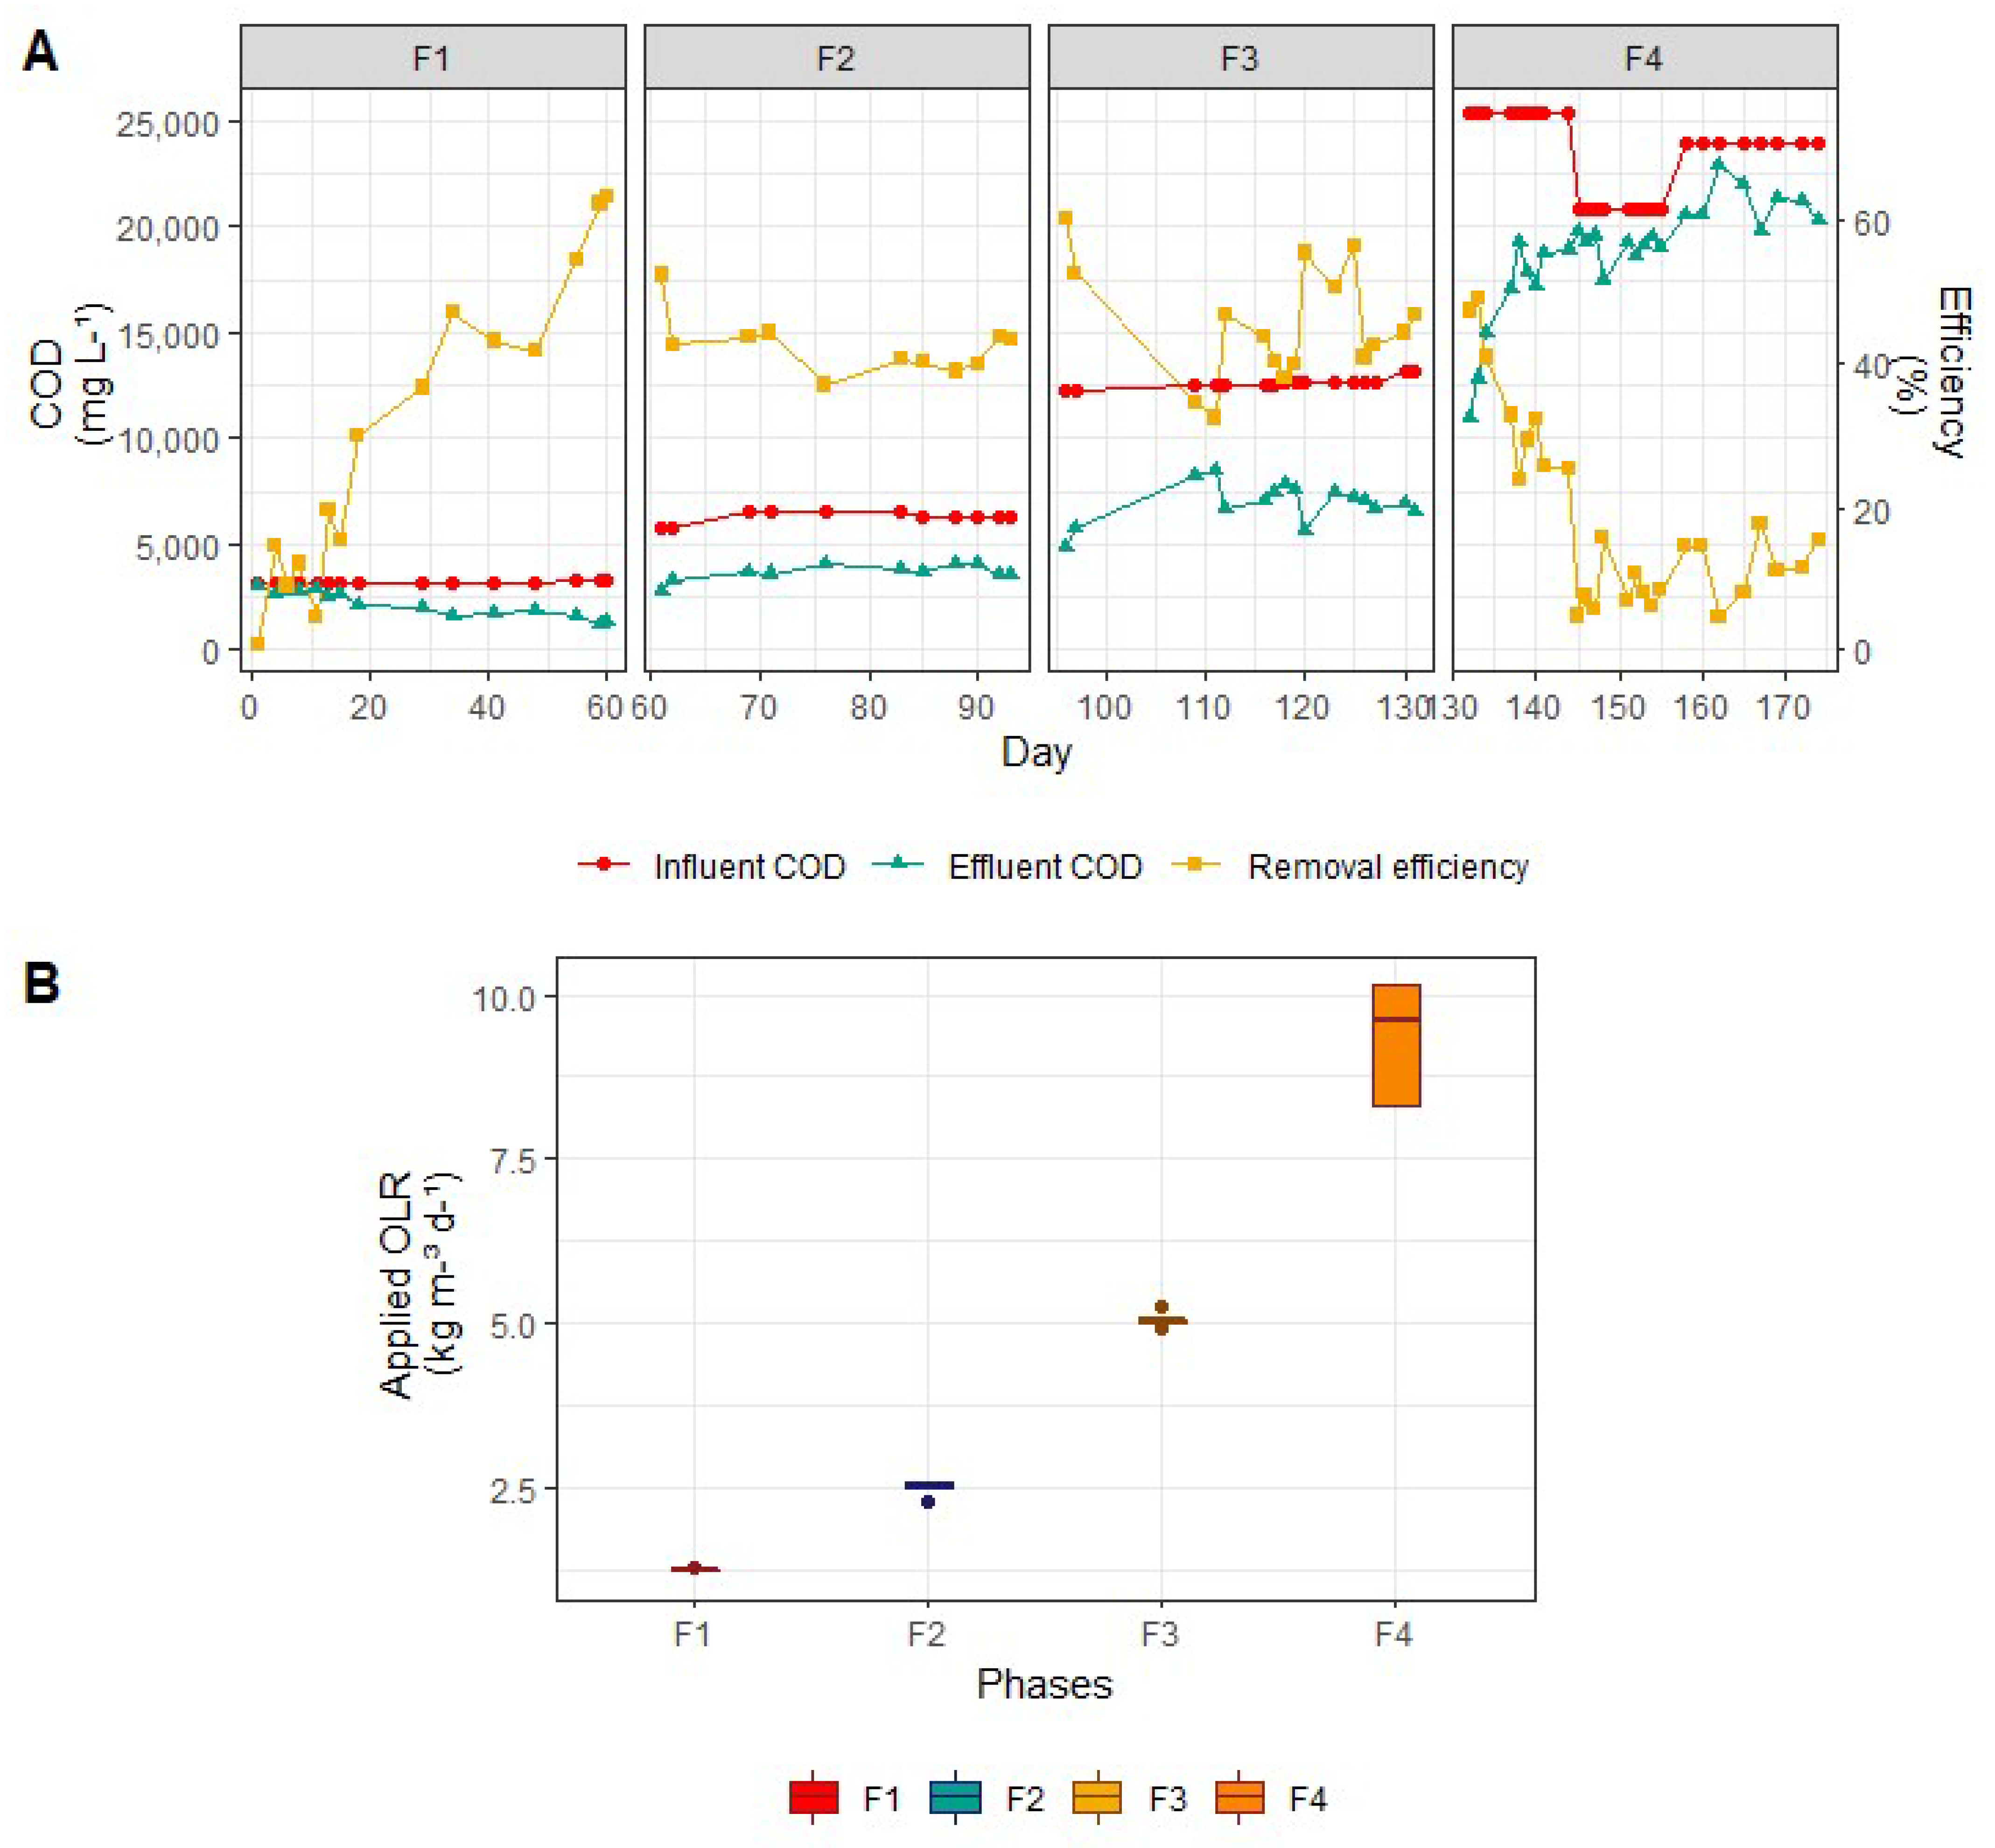
Figure 2 shows the behavior of the influent and effluent concentrations of ASBR and the removal efficiency of COD over the 174 days of monitoring (Figure 2A), as well as the analysis of variance of aOLR for each of the phases (Figure 2B).
The concentration of wastewater effluent was the highest at the start of Phase I; however, there was an improvement in the capacity of the biomass to degrade soluble organic matter (glycerol) over the time of operation, indicated by the increase in removal efficiency of COD (Figure 2A). The higher variability of aOLR in Phase IV compared to the previous ones was due to the greater oscillation of influent tCOD (Figure 2B).
When comparing Figure 2A with Figure 2B, it was noted that aOLR increased with decreasing the removal efficiency of COD, likely due to the saturation of the biomass by the substrate with increased organic loading rates (increased initial concentration throughout the phases). The effect of increased tCOD of the wastewater influent on the capacity of the ASBR to remove organic matter in terms of COD was analyzed, and the results are shown in Table 1. The data collected during the steady state were used to minimize the effect of the existing variation during the process of biomass acclimatization.
The tCOD of the influent wastewater significantly increased with the phases, indicating that the ASBR operated under the progressive increase of aOLR was promoted by the increasing tCOD (Table 1). However, the average COD removal efficiency was significantly higher in F1 compared to F2 and F4, but it was equivalent to F3. There was no significant difference of COD removal efficiency between F2 and F3. These results suggest that the ASBR supported up to 5.1 kgCOD m−3 d−1 without affecting its removal efficiency, being fed with wastewater of up to 12,778.9 mg L−1 of COD.
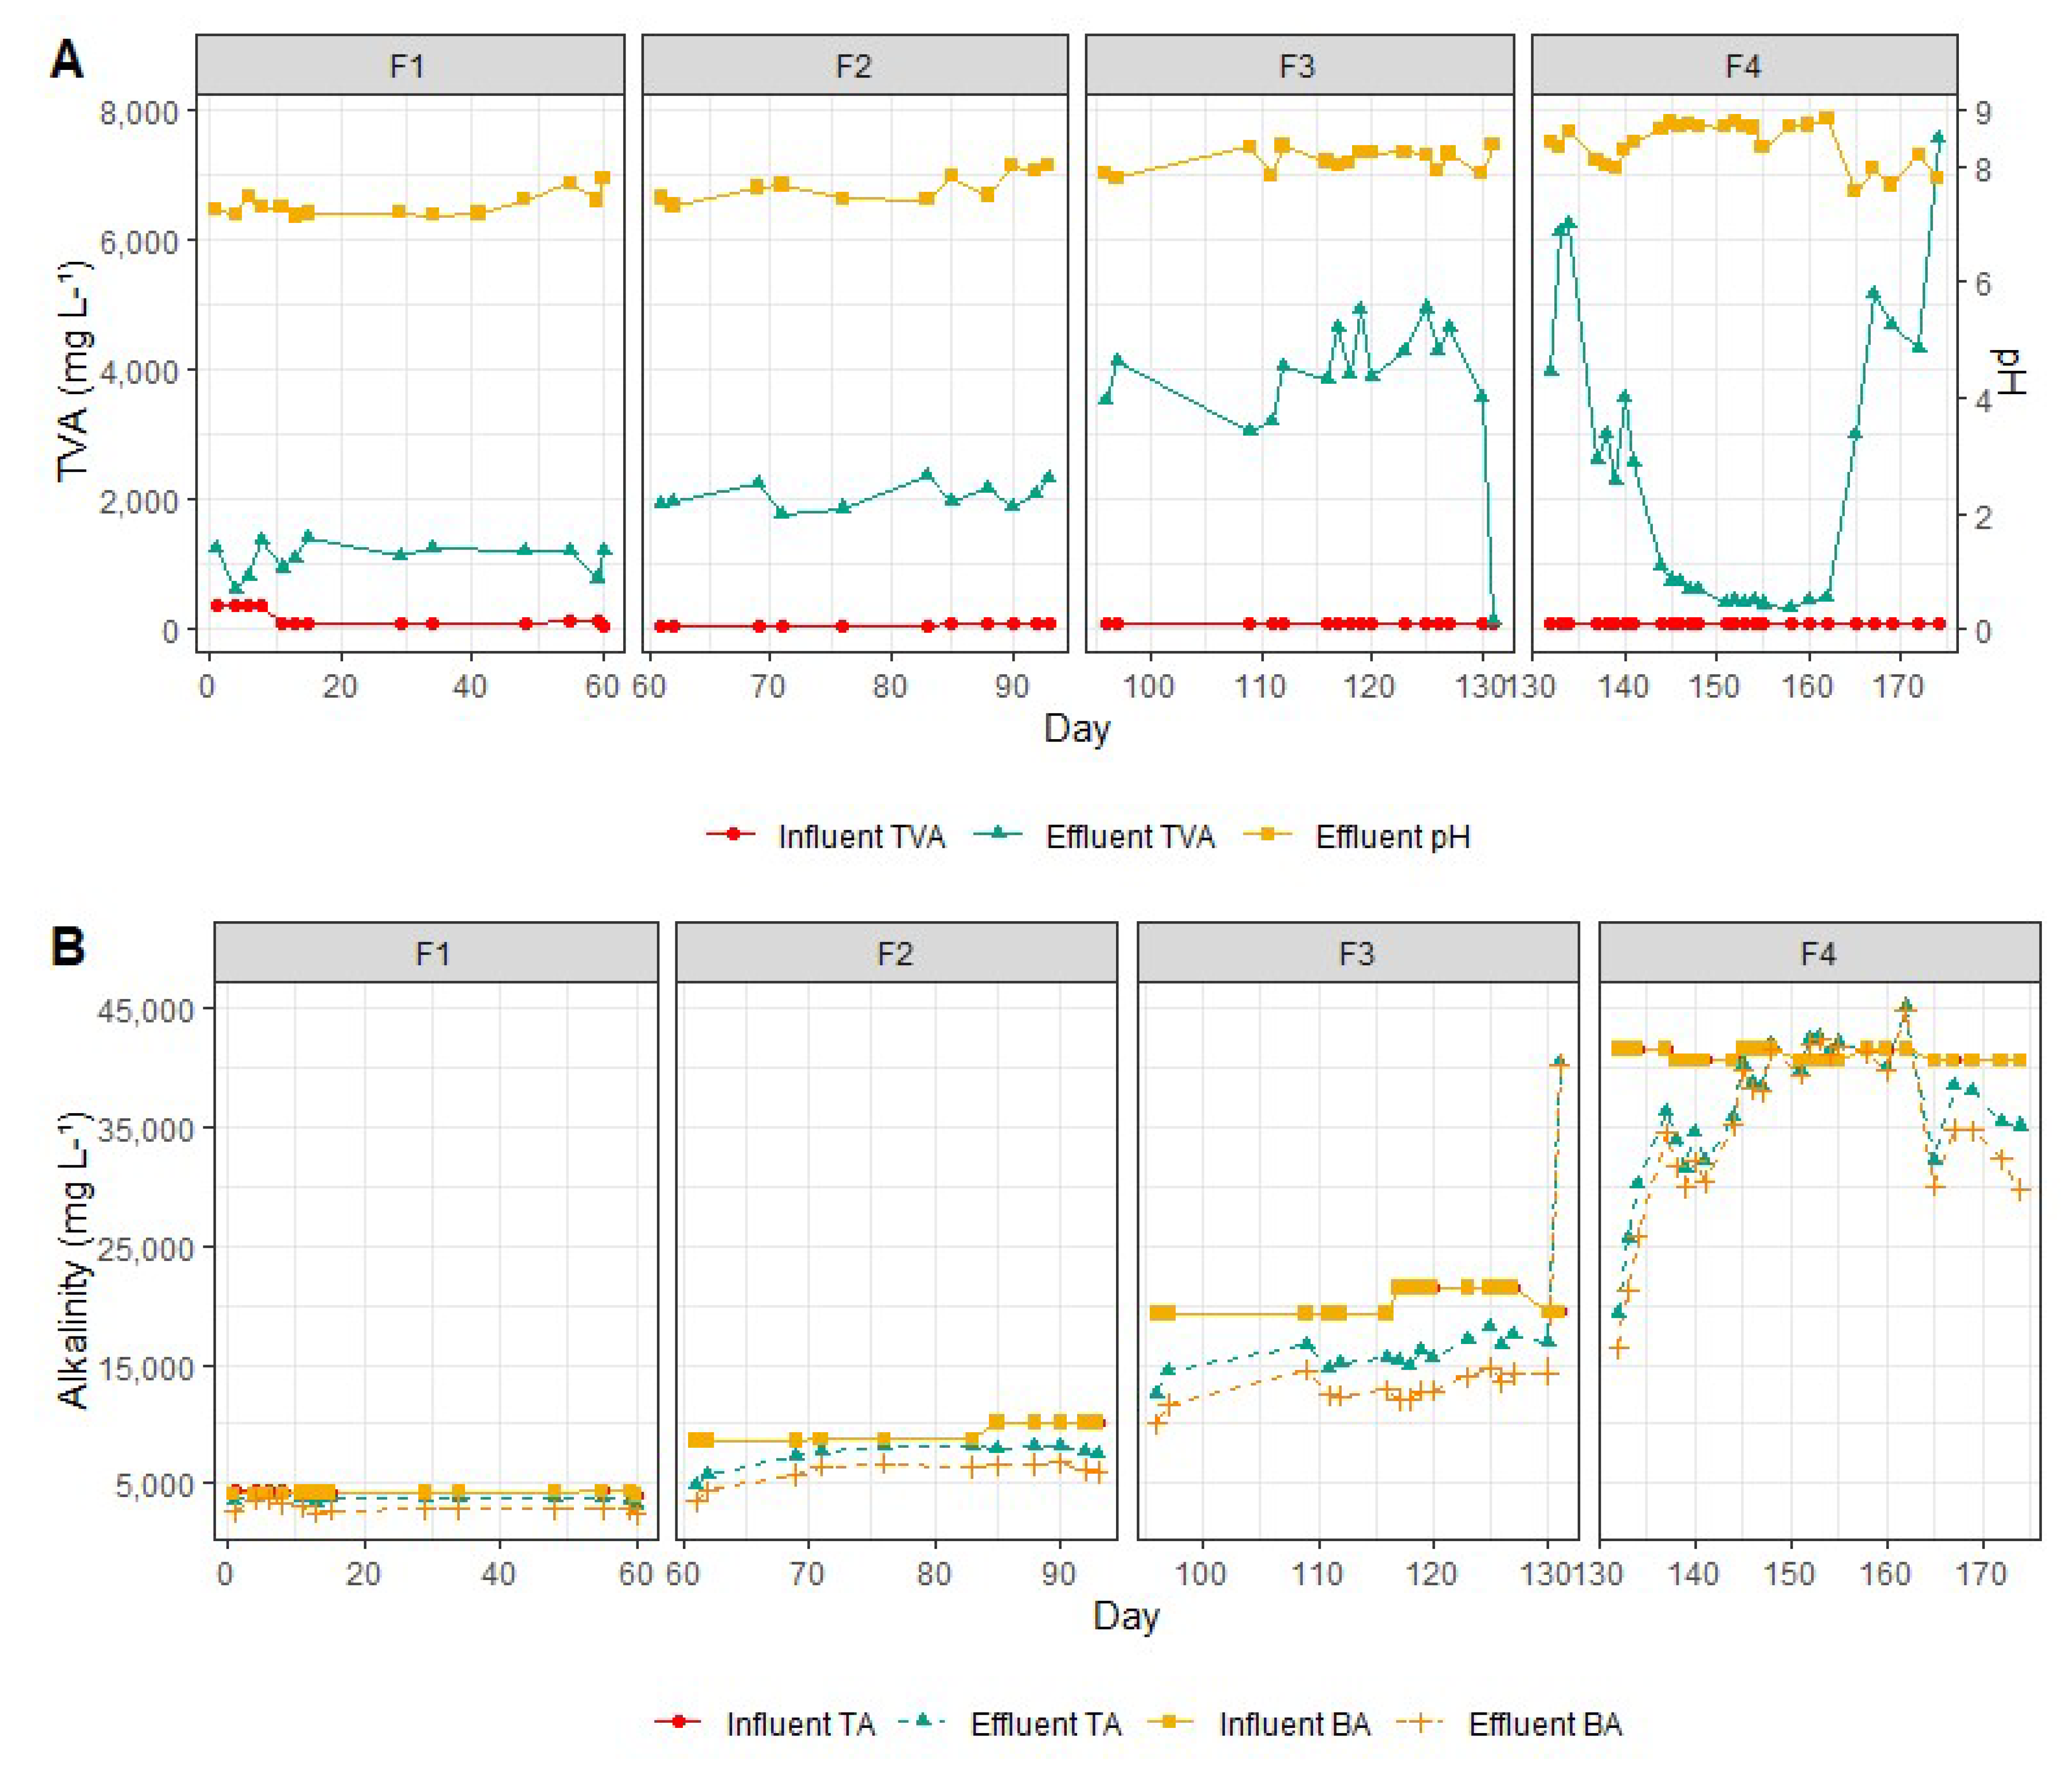
The average pH of wastewater effluent to the ASBR, as well as the concentrations of TVA, TA, and BA, of both the wastewater influent and effluent for each phase, are shown in Figure 3.
As shown in Figure 3A, there was no accumulation of TVA and there was inconsistency in the effluent pH during the progressive increase of aOLR in the ASBR, characterizing buffer stability during operation and favorable degradation rates and F/M ratios (Table 2). According to the literature [22], there is an accumulation of TVA during conditions of instability, whether due to changes in loads or the presence of toxic compounds. However, there were no kinetic and/or thermodynamic limitations, which can be caused by reduced mass and/or nutritional transfer. Under these conditions, excessive alkalinity consumption and pH reduction occur. However, the effluent pH was within neutral and alkaline ranges in all of the phases in this study. Thus, these results indicate that the adopted ratio of bicarbonate mass, equivalent to 1.5-fold the mass of COD, was enough to maintain the buffer capacity of the wastewater, as described by [6].
When analyzing the TA (Figure 3B) and TVA (Figure 3A) trends, it was noticed that the average influent TA was approximately 51-, 178-, 257-, and 412-fold higher than the average TVA in Phases I, II, III, and IV, respectively. The TA of the effluent was approximately four-fold higher than the concentration of TVA in Phases I, II, and III, but it was 47-fold higher in Phase IV. These results illustrate that, although TA and the production of TVA increased after the treatment of wastewater into the ASBR, it was still possible to maintain TA in excess in the wastewater effluent, which allowed for pH values above 8.
3.2. ASBR Biomass, Biological Organic Loading, and Theoretical Production of Biogas
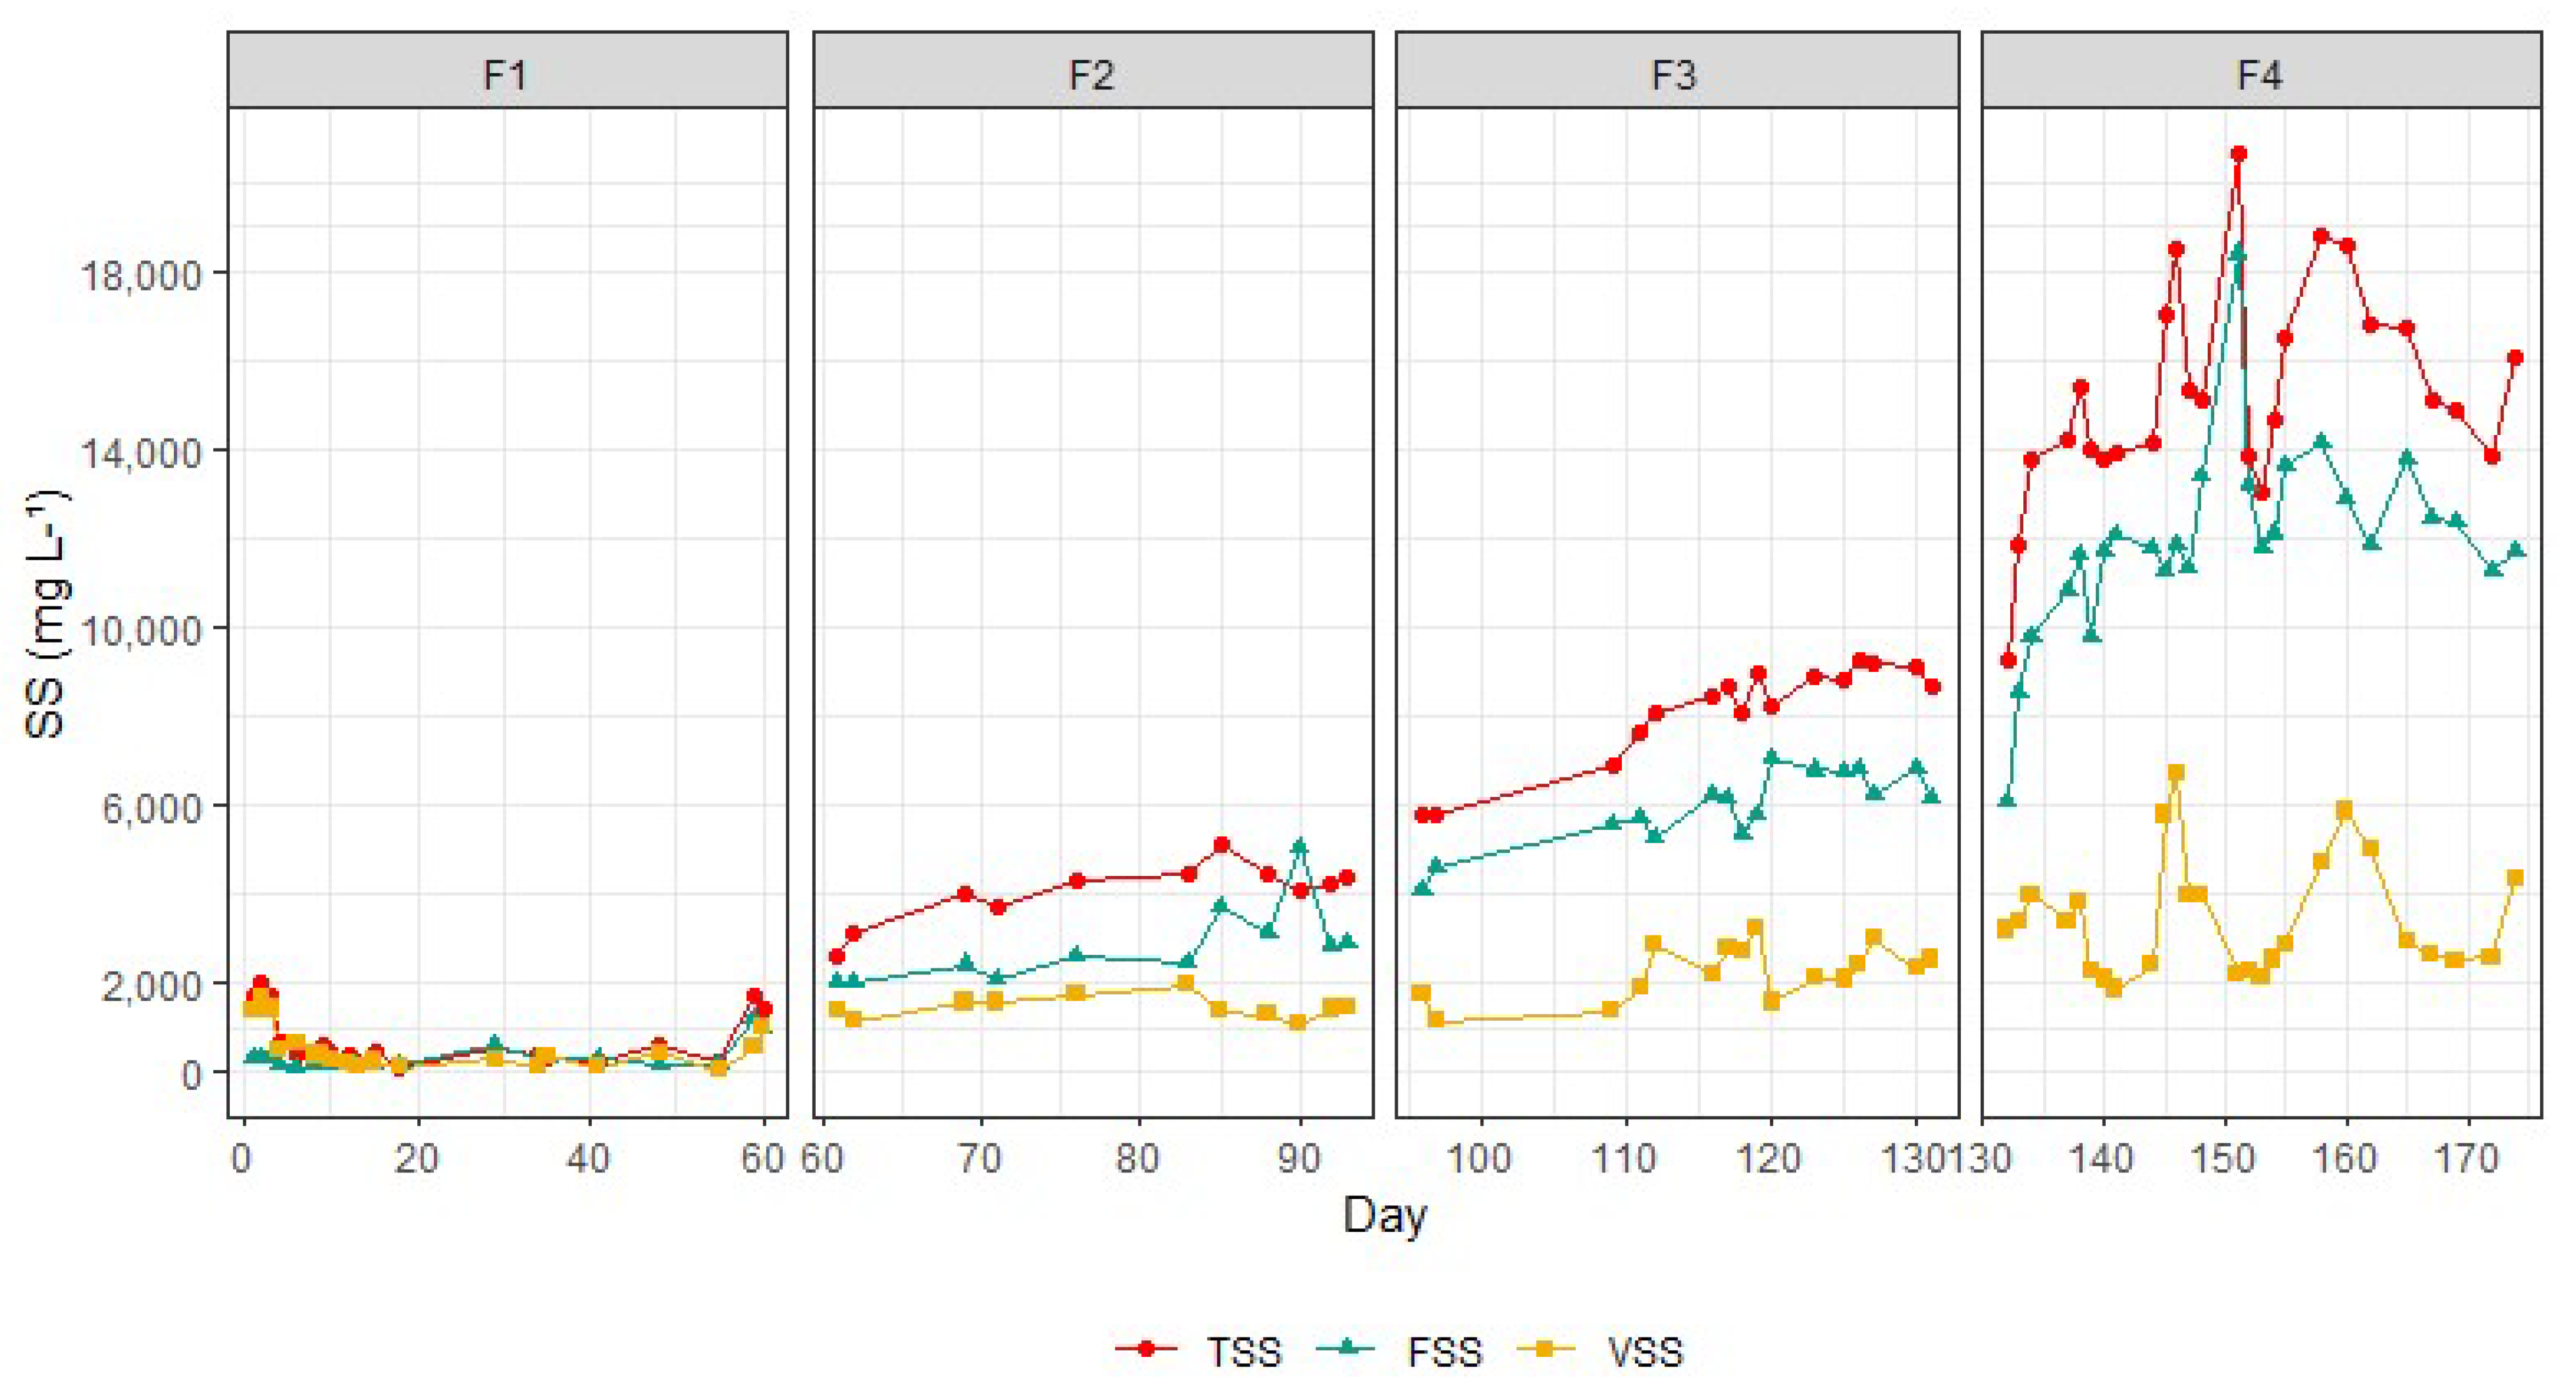
The concentrations of the influent total suspended solids (TSS) and volatile suspended solids (VSS), as well as the F/M ratio, are presented in Table 2. The concentrations of TSS, FSS, and VSS in the wastewater effluent throughout the phases are shown in Figure 4.
In addition to buffering, the solids maintained inside the ASBR (biomass) can influence the process of organic matter degradation and, consequently, the COD removal efficiency. This is because when the amount of biomass kept in the ASBR is below those necessary to degrade the substrate present in the wastewater, it can decrease the removal efficiency. This leads to instability and kinetic problems in the system, resulting in the accumulation of TVA and a reduction of the effluent pH.
The results from Table 2 and Figure 4 show that the concentrations of VSS in the wastewater effluent were greater than for the influent. This indicates that there was a biomass washout throughout the phases. However, the VSS/TSS ratios of 0.7, 0.4, 0.3, and 0.2 during Phases I, II, III, and IV, respectively, demonstrate that the biomass washout became progressively less pronounced, as the percentage of VSS in the effluent wastewater reduced with the increasing concentrations of VSS and that of the aOLR influent. This likely happened due to the density of the biomass, improving the sedimentation characteristics and providing greater remotion of COD and OLR.
Based on Table 2, it was noted that the ASBR was operated with F/M values between 0.1 and 0.6 kgCOD kgVSS−1 in the 24 h cycles. These values were considered much higher (overload) for reactors that were operated in batches, even for those that had biofilm and other structures for biomass retention, such as the anaerobic sequencing batch biofilm reactor (ASBBR). In a study treating wastewater with ASBBR, Bezerra et al. [7] used an F/M ratio between 0.03 and 0.12 kgCOD kgTVS−1 d−1 for methane production, achieving COD removal efficiencies ranging from 67 to 92%.
Comparing the removal efficiency results presented in Table 1, it was observed that increasing the F/M ratio decreased the removal efficiency, in which values between 0.1 and 0.4 kgCOD kgVSS−1 did not result in statistically significant changes in the removal efficiency by Tukey’s test at the 5% significance level. These results indicate that the ASBR supports carrying out batches with an F/M ratio of up to 0.4 kgCOD kgVSS−1 d−1 and with a removal efficiency of up to 52.1%. Microbial mass is a factor that positively influences the removal of organic matter in the ASBR treating wastewater. In this sense, the low mass of VSS caused by the biomass washout can decrease both COD removal efficiency and methane production due to the increased F/M ratios in the ASBR [3,5].
In Table 3, the setups and results of four experiments realized in the last 5 years with similar configurations in terms of system, operating on close temperature, are exposed. Through the analysis of Table 3, a COD remotion efficiency of 89% at 7.5 kg m−3 d−1 was found in the work of Lovato et al. [23] in ASBBR. Increased applied OLRs and better COD efficiency are expected in ASBBR due to biomass fixation. Furthermore, according to the authors, the efficiency was superior to other similar works, even in other ASBBR systems. The author attributed these results to the co-digestion of glycerol with cheese whey, which generates an effluent with balanced nutrients and a good buffering capacity. Seneesrisakul et al. [24], treating cassava-based ethanol wastewater, found the best system set up with an applied OLR close to the results of this work, at 6.0 kg m−3 d−1, as in this research the COD remotion efficiencies are statistically similar up to 5.3 kg m−3 d−1.
Besides improving co-digestion through a mix between whey and glycerol, an increase in number in the stages could also improve the capacity of remotion of COD in applied OLRs higher than 5.3 kg m−3 d−1. Tangkathitipong et al. [25], treating biodiesel wastewater with the addition of crude glycerol, were able to reach the best level of 9.6 kg m−3 d−1 in applied OLR regarding COD remotion efficiency, however, this amount was achieved with a two-stage ASBR. Therefore, with the outputs found here, agreeing with the results of Tangkathitipong et al. [25], it may be inferred that at an applied OLR of 9.6 kg m−3 d−1, the system lost performance and a two-stage ASBR is recommended. Intanoo et al. [26], treating cassava-based ethanol wastewater, were able to increase the system performance even further—until 15.0 kg m−3 d−1 with a three-stage ASBR.
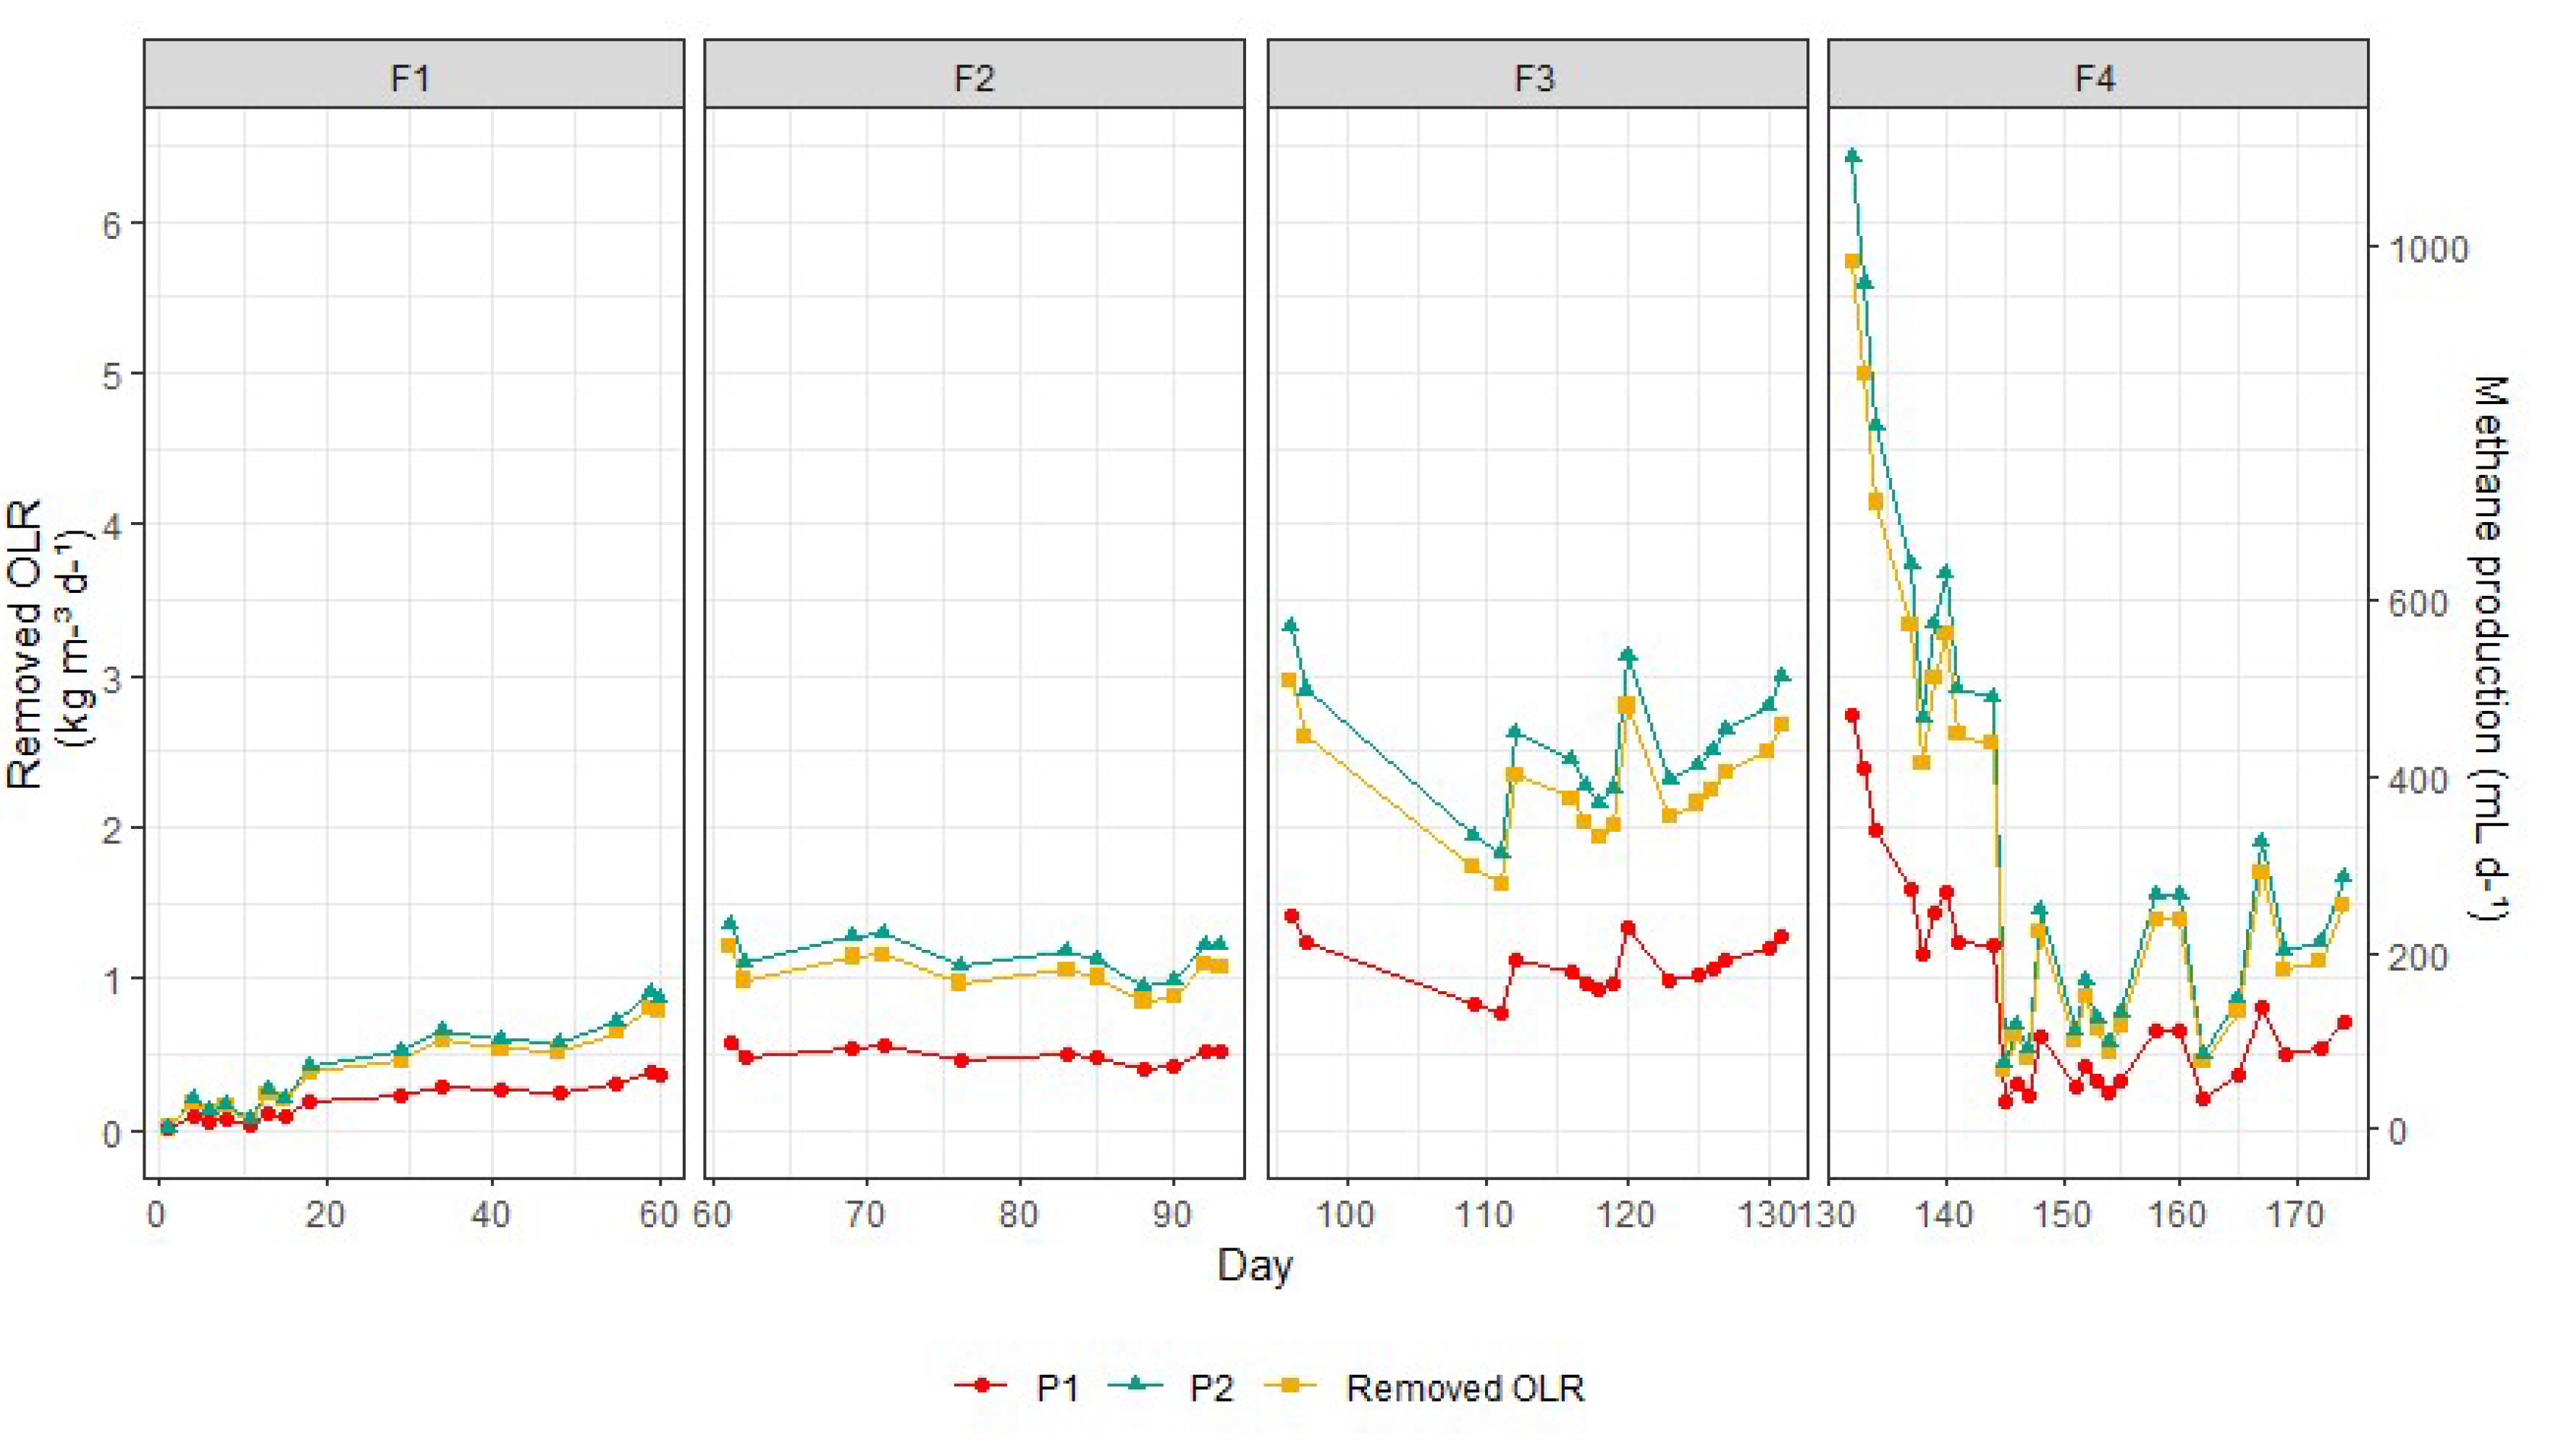
The remOLR values throughout the experiment are presented in Figure 5. Considering the minimum and maximum stoichiometric coefficients of methane production reported by Silva et al. [9] and Selma et al. [6], it was possible to estimate the minimum (P1) and maximum (P2), respectively, daily methane production in the ASBR used in this study.
The remOLR values were 0.4 ± 0.2, 1.0 ± 0.1, 2.3 ± 0.4, and 1.8 ± 1.5 kgCOD m−3 d−1 during Phases I, II, III, and IV, respectively (Figure 5). The minimum daily methane production during Phases I, II, III, and IV were 33 ± 20, 85 ± 9, 185 ± 30, and 150 ± 119 mL d−1, respectively; whereas the maximum daily methane productions were 77 ± 46, 199 ± 21, 434 ± 70, and 351 ± 279 mL d−1, respectively.
As shown in Table 1 and Figure 5, there was an increase in the capacity for organic matter removal (remOLR) and methane production during Phases I and III; however, there was a reduction in both parameters during Phase IV. These results demonstrate that the ASBR, even under conditions of medium buffering (Figure 2), responded negatively to the increases in aOLR and F/M, leading to a reduction in organic matter removal efficiency and affecting the volumetric production of methane. The reduction in removal efficiency is due to the biomass washout in the face of organic overload. In addition, the operational parameters applied in Phase III proved to be the limit for maintaining the removal efficiency of both COD and remOLR.
3.3. Degradation Kinetics of Organic Matter
The studies of biochemical kinetics aimed to understand the relationship between the speed of the reactions and the factors that influence them. Table 4 shows the results of the kinetic studies performed on the ASBR operating under optimal conditions for the degradation of wastewater, as well as values of AIC for both models evaluated in this study (Equations (5) and (6)).
The results obtained from Equation (5) show that the progressive increase in aOLR and the F/M ratio corresponded to a reduction in the apparent kinetic coefficient for the degradation speed of the organic matter, thus decreasing the quality of the model adjustment (Table 4). Based on the results from Equation (2), it was noticed that the progressive increase aOLR and F/M ratio provided, on average, an increase in the apparent kinetic coefficient, thereby maintaining the goodness of fit in the model.
However, there was a reduction in the apparent kinetic coefficient when the ASBR was operated with values of aOLR of 9.3 kgCOD m−3 d−1, resulting in a rate of organic matter degradation of 1.04 h−1, and obtaining concentrations of the residual substrate close to the initial substrate concentration. Such behavior, along with the discussed in the previous section, indicates that an aOLR of 9.3 kgCOD m−3 d−1 and F/M of 0.6 kgCOD kgVSS−1 are the limiting loading values for ASBR projects. Because the degradation of organic matter is a biological process, groups of microorganisms must find appropriate environmental conditions for their development so that they can carry out the degradation of organic matter efficiently. Thus, in addition to quantity, the quality of biomass influences the conditions for organic matter degradation inside the ASBR, and consequently, the kinetic parameters of the process.
In this context, it is suggested that the changes in Kap values in response to the progressive increase in aOLR and the F/M ratio were likely due to changes in the quality of the biomass in terms of the microbial diversity present in the ASBR. It must be noted that the decrease in Kap values during Phase IV when compared to Phase III may indicate a lower capacity of biomass adaptation, and thus, a decrease in its quality and a reduction in the organic matter removal efficiency (Table 1) in response to increases in aOLR and the F/M ratio.
Regarding the coefficient of determination, which indicates model adjustment (Table 4), both models evaluated in this study showed a good fit. However, the adjustment quality of Equation (5) was lower than Equation (6) during Phases II, III, and IV. The AIC values obtained for each model also indicated better adjustment of the data estimated by the first order kinetics model considering the residual concentration (lower AIC values suggest a better fit).
In addition to the analysis presented in this study, other studies were also carried out to estimate the error term, verifying the calibration of the model and its ability to forecast system success (validation), and other analyses of the residues from regression models, such as analysis of variance, normality, and homoscedasticity, were reported by Pereira et al. [3].
3.4. Production of Exopolysaccharides (EPS) and Microbial Diversity
The EPS production is closely linked to the quality of the biomass. According to Zhou et al. [27], the relationship between the masses of EPS and VSS of sludge, in addition to the concentrations of polysaccharides and proteins, are of great importance for understanding the microbial characteristics of anaerobic biomass. Figure 6 shows the concentration of polysaccharides and proteins of the ASBR effluent used for wastewater treatment, as well as the proportion of EPS as a function of biomass (VSS) for all phases.
As shown in Figure 6, the average concentration of protein (350 mg L−1) was greater than that of carbohydrates (330 mg L−1) on the first day of operation. However, there was a decline in both concentrations, with the concentration of proteins always exceeding that of the carbohydrates until Phase III. During Phase IV, a considerable increase in the concentration of carbohydrates was observed, and it exceeded that of the proteins.
According to Liu et al. [28], polysaccharides are predominantly found in the anaerobic biomass comprised of acidogenic fermentative bacteria, while proteins are mostly found in the anaerobic biomass comprised mostly of methanogenic archaea.
Almeida et al. [29], applying OLRs from 1 to 10 kgCOD m−3 d−1 of the vinasse effluent at 30°C in single stage ASBR and ASBBR, found an increasing trend in methane productivity and COD remotion at this range. These authors stated that the increase in productivity with increasing OLR under favorable operation conditions is due to the increase in the number of molecules that can be converted in methane, or, alternatively, to an improvement in the reaction rate of the substrate consumption by microorganisms. Therefore, if the yield of methane production assumes a decreasing trend, then the production must decrease as well once the increase in the substrate concentration is insufficient to maintain the rise in productivity. In contrast, Seneesrisakul et al. [24], utilizing a single stage ASBR to treat ethanol and adopting COD loading rates of up 6 kg m−3 d−1 at 37 °C., affirmed that COD loading rates above this level may have proportioned the increase in the production rate of volatile fat acids in comparison to its consumption rate, causing an accumulation in the system to exceed the toxic level to the methanogens, which reduced the COD remotion efficiency. Thus, it is possible to state that the ASBR operated with biomass consisting of methanogenic archaea until Phase III (Figure 6), in a suitable environment. In face of the affirmations of Almeida et al. [29], the production level of methane observed up to the 145th day at F4 in Figure 5, in spite of being part of time equivalent to the F3, primarily represented a decrease in the yield production due to the increase in COD at this phase, which apparently can be addressed to the insufficient increase in substrate concentration in order to maintain the productivity stable However, during Phase IV, there may have been a change in ecology and microbial diversity, consisting mostly of acidogenic bacteria, and thereby, it modified the buffering conditions (Figure 3) and reduced both the COD removal efficiency (Figure 2A and Table 1) and kinetic coefficient kap (Table 4). The behavior noted up to the 145th day at F4 is thus due to an establishment of an unsuitable environment for methanogenic archaea to develop.
The continuous increase in the polysaccharides/VSS and proteins/VSS ratios in the effluent samples indicate the removal of the EPS produced along with the biomass [30]. As EPS are essential for the cohesion of granules, their removal along with the biomass can negatively impact the granulation process of the anaerobic biomass [31]. During Phase I of this experiment, the polysaccharides/VSS and proteins/VSS ratio in the effluent samples were at a maximum, but they presented a reduction trend during Phase II (Figure 6). In addition, based on the results from Phase IV, it is possible to state that the EPS produced by the biomass was kept inside the ASBR, promoting biomass granulation.
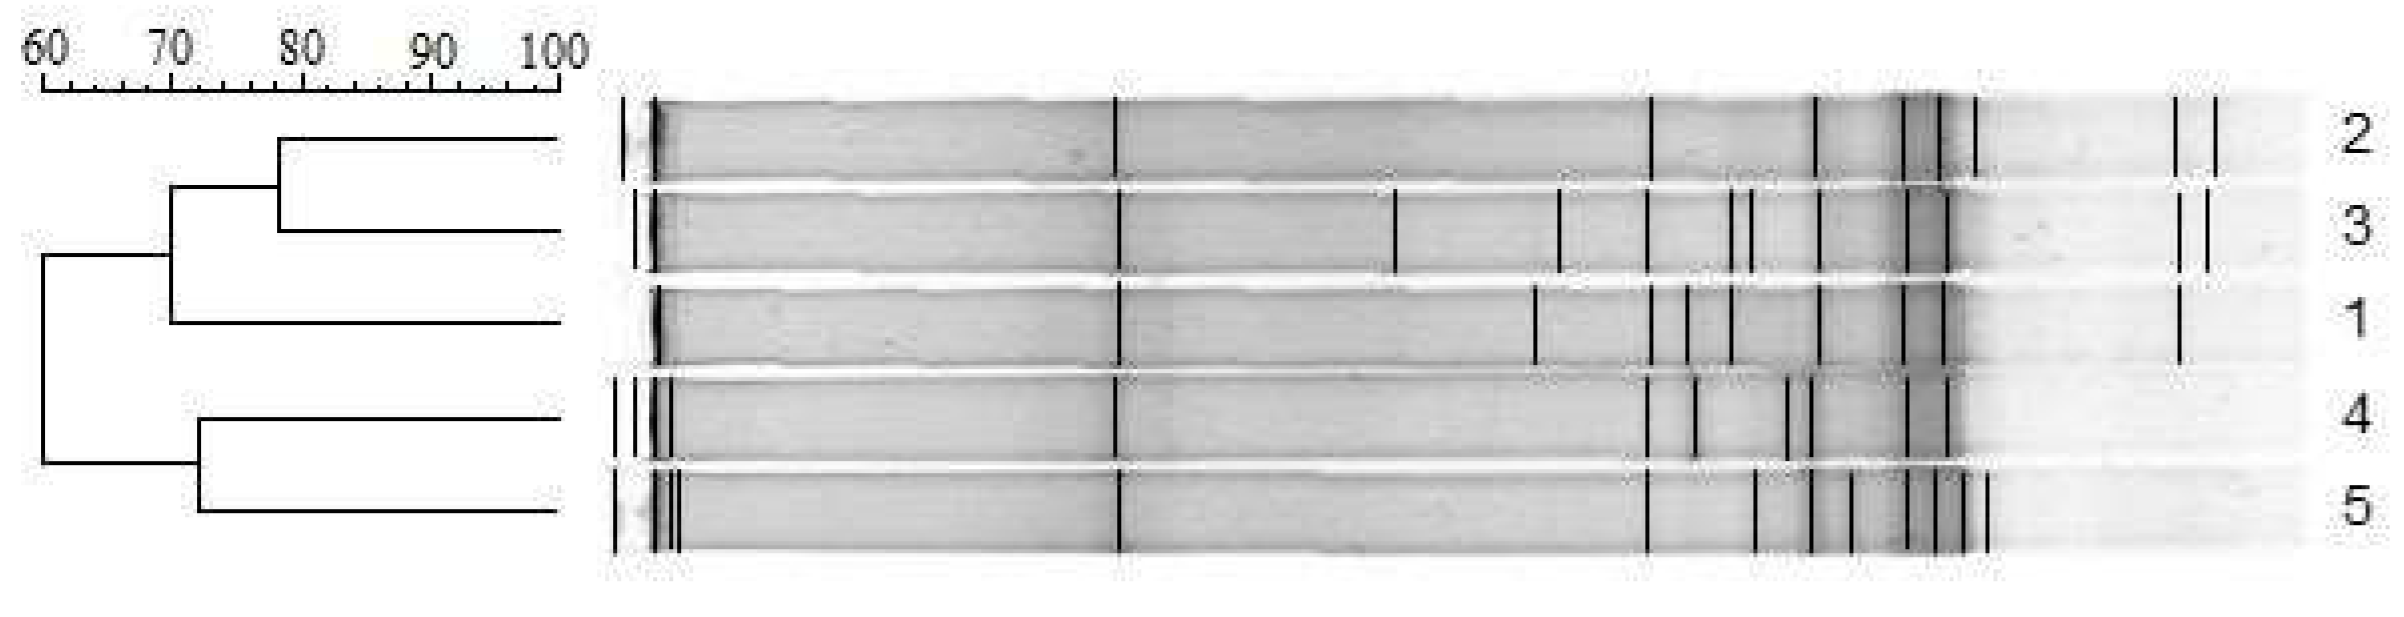
To test the assumptions regarding the change in microbial diversity caused by the progressive increase in aOLR during wastewater treatment, the DGGE analysis was performed to compare the biomass sample used in the inoculation with the biomass samples collected in each phase during steady state. The electrophoretic profiles and results of the PCR-DGGE cluster analysis are shown in Figure 7.
As the biomass used in the inoculation originated from a UASB reactor treating sanitary sewage (ES), sample 1 was compared to sample 2 to analyze the effect of changing the substrate (wastewater) from ES to biodiesel wastewater. As shown in Figure 7, sample 1 (inoculated biomass) had a 70% similarity when compared with the microorganisms present in sample 2 (biomass from phase I) and sample 3 (biomass from phase II), and it presented 78% similarity between the microorganisms found in the biomass from Phases I and II.
The results shown in Figure 6 indicate that 60 days during Phase I (sample 2) with the ASBR operating with an aOLR of 1.3 kgCOD m−3 d−1, followed by 35 days during Phase II (sample 3) with an aOLR of 2.5 kgCOD m−3 d−1, were sufficient to promote a small change in microbial diversity in relation to the inoculated biomass (sample 1).
Phases III and IV showed a 72% similarity between them, and only 60% similarity was observed when compared to Phases I and II. These results demonstrate that the progressive increase in aOLR influenced the microbial diversity among the operational phases. There was a greater effect in the modification of the reactor biomass when the aOLR was raised to 5.0 kgCOD m−3 d−1 (Phase III). However, when simultaneously analyzing the results of ECOD and remOLR as a function of aOLR shown in Table 1 with the results of microbial diversity as a function of aOLR, it was observed that the microorganisms present in the biomass during Phase III were still efficient at removing COD and did not hamper the process.
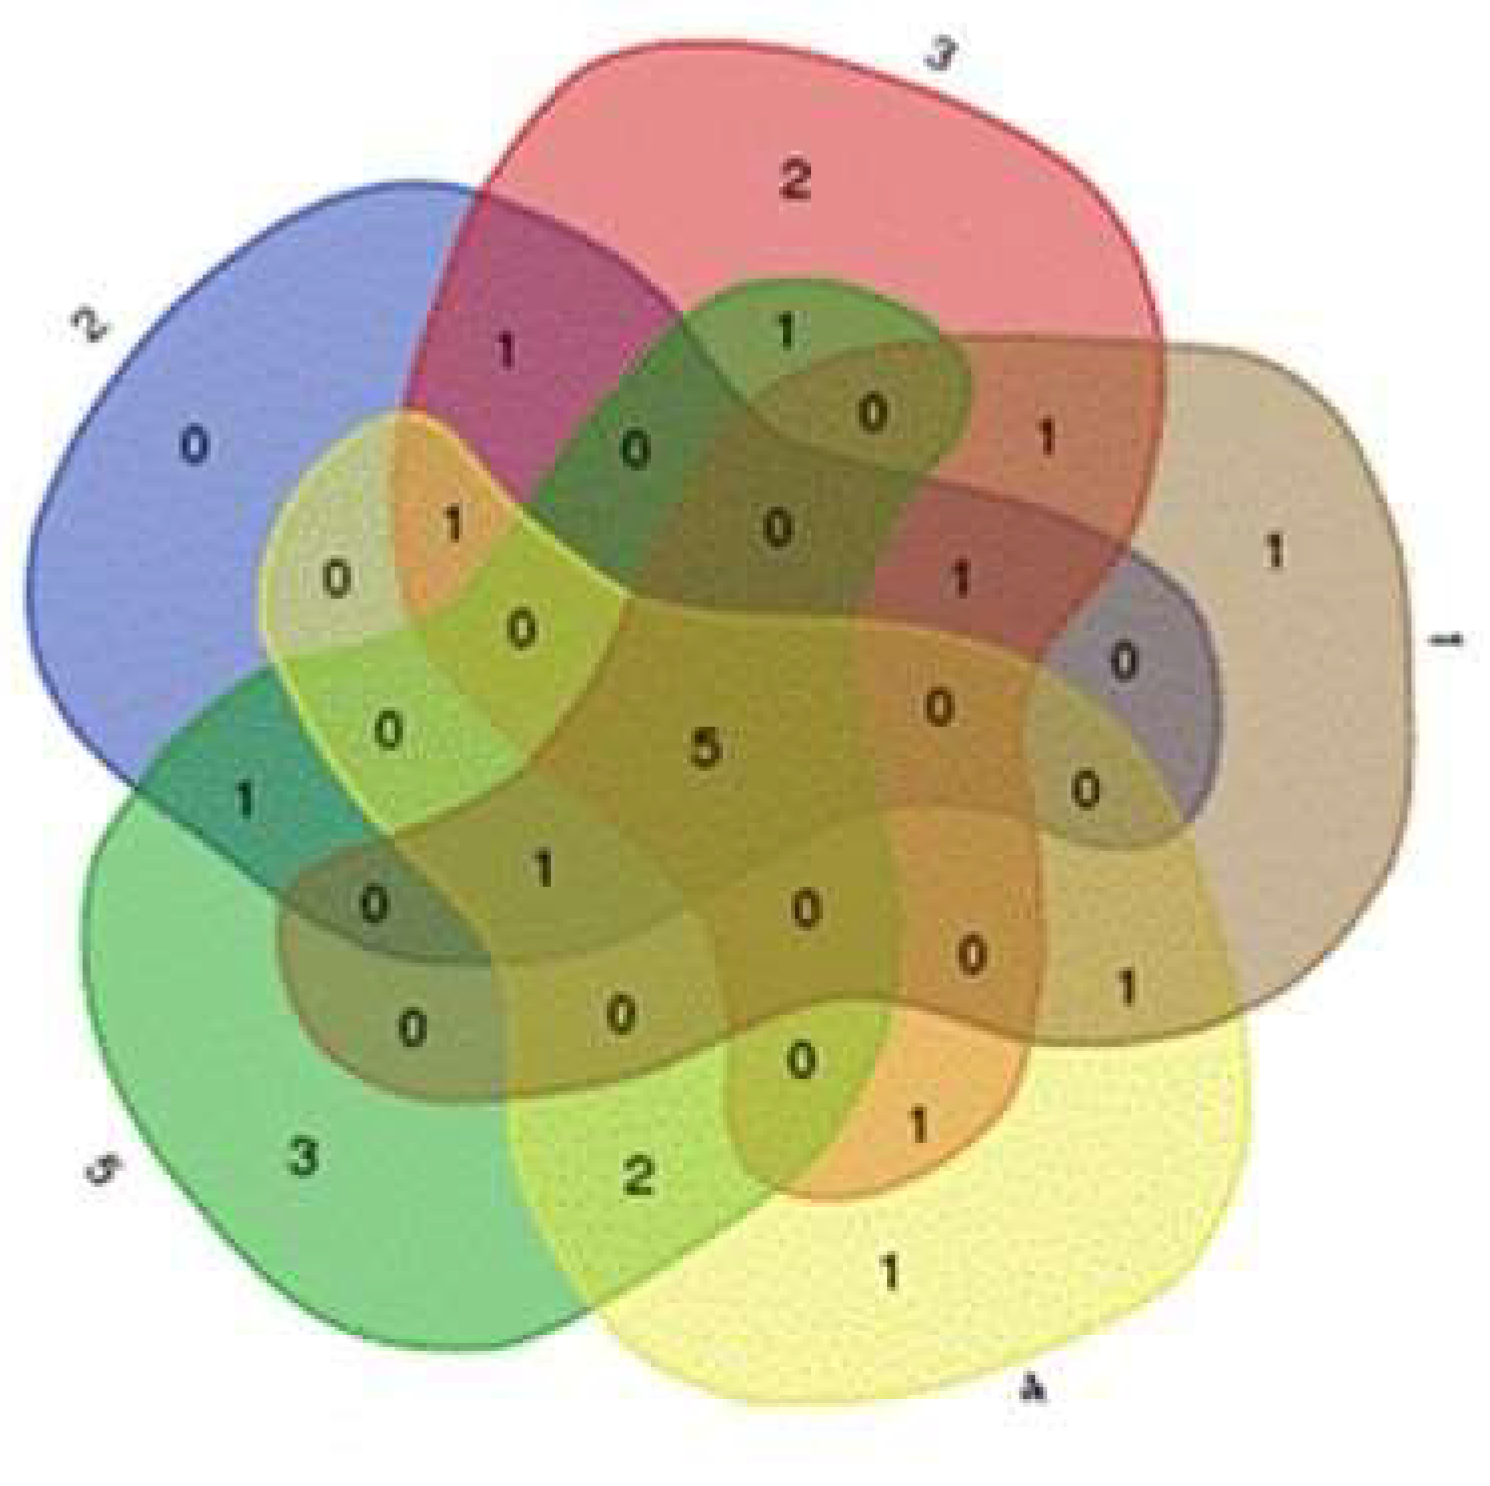
This can be confirmed with the results during Phase IV (sample 5), where the reactor operated with an aOLR of 9.3 kgCOD m−3 d−1, and this indicated that this value promoted a change in microbial diversity, suggested by the disappearance of two bands and the appearance of another three bands in sample 5 in relation to sample 4. Although the changes in microbial diversity have been proven, the number of unique and shared operational taxonomic units (OTUs) by the microbial communities in sample 1 was evaluated, and the results are shown using Venn diagrams in Figure 8.
As shown in Figure 8, the biomass used in the inoculation (Sample 1) and the biomass settled throughout Phases I to IV with the application of biodiesel wastewater under progressive increase of aOLR had five shared OTUs. These findings suggest that these microorganisms were inoculated and remained active, independent of the aOLR in the ASBR, and they adapted to the modification of the substrate/carbon source from the sanitary sewage to glycerol.
In addition, the analysis of Figure 8 allows for the determination that Sample 1 (starting sludge) had a single OTU, which is likely the one that did not resist the change of substrate. Sample 2 (biomass during Phase I) did not have a single OTU, indicating that the microorganisms present in Phase I were possibly present in other phases. This suggests that the aOLR of 1.3 kgCOD m−3 d−1 enabled the growth of bacteria that could remain in the other phases. In contrast, Sample 3, 4, and 5 had two, one, and three unique OTUs, respectively. Thus, the operation of ASBR with aOLR between 2.5 and 9.3 kgCOD m−3 d−1 promoted the appearance of new anaerobic bacteria that were not found in Phase I. In addition, it is believed that the three new OTUs found in Sample 5 may be acidogenic bacteria that contributed to the modification of the EPS profile, as shown in Figure 5.
4. Conclusions
For an ASBR treating biodiesel wastewater under the progressive increase of aOLR from 1.3 to 9.5 kgCOD m−3 d−1 and F/M ratio from 0.1 to 0.6 kgCOD kgVSS−1 d−1, a statistically significant difference was found in COD removal efficiency with aOLR values above 5.0 kgCOD m−3 d−1.
The increase in the influent substrate concentration from 3166 to 12,779 mg L−1 resulted in increases in the apparent kinetic coefficient referring to the organic matter degradation rate from 0.10 to 1.80 h−1. However, influent tCOD values greater than 12,779 mg L−1 indicated saturation of the biomass, decreasing the organic matter degradation coefficient to 1.04 h−1 and modifying the EPS production. These results indicate changes in ecology and anaerobic microbial diversity.
Values of aOLR above 5.0 kgCOD m−3 d−1 and F/M ratio above 0.4 kgCOD kgVSS−1 d−1 have the potential, under inadequate conditions of alkalinity, to inhibit the growth of methanogenic archaea, especially acetolactic ones. In addition, this condition also has the potential for the accumulation of TVA produced by acidogenic fermentative bacteria, thus promoting the souring of ASBR during the treatment of biodiesel wastewater.
The kinetic model describing the degradation of the substrate over time by estimating the residual concentration was the one that best fitted to the data collected over the cycle time. Thus, this result indicates that this model is appropriate to be used in the design, simulation, and control of processes related to the treatment of biodiesel wastewater in the ASBR.
Author Contributions
Conceptualization, A.C.B. and E.L.P.; data curation, E.L.P.; investigation, E.L.P. and G.J.d.S.; methodology, A.C.B. and E.L.P.; resources, A.C.B.; supervision, A.C.B.; validation, A.C.B.; visualization, E.L.P. and G.J.d.S.; and writing—original draft, E.L.P.; writing—review and editing, A.C.B. and G.J.d.S. All authors have read and agreed to the published version of the manuscript.
Funding
This research was funded by National Council for Scientific and Technological Development (CNPq Grant Process Number 144783/2019-3) and Coordination for the Improvement of Higher Education Personnel (CAPES Finance Code 001).
Informed Consent Statement
Not applicable.
Conflicts of Interest
The authors declare no conflict of interest.
References
- de Almeida Silva, M.C.; Monteggia, L.O.; Alves Barroso Júnior, J.C.; Granada, C.E.; Giongo, A. Evaluation of semi-continuous operation to hydrogen and volatile fatty acids production using raw glycerol as substrate. Renew. Energy 2020, 153, 701–710. [Google Scholar] [CrossRef]
- Maintinguer, S.I.; Hatanaka, R.R.; Oliveira, J.E. de Glycerol as a Raw Material for Hydrogen Production. In Biofuels—Status and Perspective; Krzysztof, B., Ed.; IntechOpen: London, UK, 2015. [Google Scholar]
- Pereira, E.L.; Borges, A.C.; Heleno, F.F.; Costa, T.H.C.; Mounteer, A.H. Factors Influencing Anaerobic Biodegradation of Biodiesel Industry Wastewater. Water Air Soil Pollut. 2017, 228, 213. [Google Scholar] [CrossRef]
- Daud, N.M.; Sheikh Abdullah, S.R.; Abu Hasan, H.; Yaakob, Z. Production of biodiesel and its wastewater treatment technologies. Process. Saf. Environ. Prot. 2015, 94, 487–508. [Google Scholar] [CrossRef]
- Pereira, E.L.; Borges, A.C.; Heleno, F.F.; Oliveira, K.R.; da Silva, G.J.; Mounteer, A.H. Central composite rotatable design for startup optimization of anaerobic sequencing batch reactor treating biodiesel production wastewater. J. Environ. Chem. Eng. 2019, 7, 103038. [Google Scholar] [CrossRef]
- Selma, V.C.; Cotrim, L.H.B.; Rodrigues, J.A.D.; Ratusznei, S.M.; Zaiat, M.; Foresti, E. ASBR applied to the treatment of biodiesel production effluent: Effect of organic load and fill time on performance and methane production. Appl. Biochem. Biotechnol. 2010, 162, 2365–2380. [Google Scholar] [CrossRef]
- Bezerra, R.A.; Rodrigues, J.A.D.; Ratusznei, S.M.; Canto, C.S.A.; Zaiat, M. Effect of organic load on the performance and methane production of an AnSBBR treating effluent from biodiesel production. Appl. Biochem. Biotechnol. 2011, 165, 347–368. [Google Scholar] [CrossRef] [PubMed]
- Lovato, G.; Bezerra, R.A.; Rodrigues, J.A.D.; Ratusznei, S.M.; Zaiat, M. Effect of feed strategy on methane production and performance of an AnSBBR treating effluent from biodiesel production. Appl. Biochem. Biotechnol. 2012, 166, 2007–2029. [Google Scholar] [CrossRef]
- Silva, R.C.; Rodrigues, J.A.D.; Ratusznei, S.M.; Zaiat, M. Anaerobic treatment of industrial biodiesel wastewater by an ASBR for methane production. Appl. Biochem. Biotechnol. 2013, 170, 105–118. [Google Scholar] [CrossRef] [PubMed]
- Lovato, G.; Moncayo Bravo, I.S.; Ratusznei, S.M.; Rodrigues, J.A.D.; Zaiat, M. The effect of organic load and feed strategy on biohydrogen production in an AnSBBR treating glycerin-based wastewater. J. Environ. Manag. 2015, 154, 128–137. [Google Scholar] [CrossRef] [PubMed]
- Vilvert, A.J.; Saldeira Junior, J.C.; Bautitz, I.R.; Zenatti, D.C.; Andrade, M.G.; Hermes, E. Minimization of energy demand in slaughterhouses: Estimated production of biogas generated from the effluent. Renew. Sustain. Energy Rev. 2020, 120, 109613. [Google Scholar] [CrossRef]
- APHA/AWWA/WEF. Standard Method for Examination of Water and Wastewater; APHA/AWWA/WEF: Washington, DC, USA, 2017. [Google Scholar]
- Ripley, L.E.; Boyle, W.C.; Converse, J.C. Improved Alkalimetric Monitoring for Anaerobic Digestion of High-Strength Wastes. J. Water Pollut. Control Fed. 1986, 58, 406–411. [Google Scholar]
- Jenkins, S.R.; Morgan, J.M.; Sawyer, C.L. Measuring anaerobic sludge digestion and growth by a simple alkalimetric titration. J. Water Pollut. Control Fed. 1983, 55, 448–453. [Google Scholar]
- BRADFORD, M.M. A Rapid and Sensitive Method for the Quantitation of Microgram Quantities of Protein Utilizing the Principle of Protein-Dye Binding. Anal. Biochem. 1976, 72, 248–254. [Google Scholar] [CrossRef]
- Dubois, M.; Gilles, K.A.; Hamilton, J.K.; Rebers, P.A.; Smith, F. Colorimetric Method for Determination of Sugars and Related Substances. Anal. Chem. 1956, 28, 350–356. [Google Scholar] [CrossRef]
- Ferreira, D.F. Sisvar: A computer statistical analysis system. Ciência e Agrotecnologia 2011, 35, 1039–1042. [Google Scholar] [CrossRef] [Green Version]
- Akaike, H. Likelihood of a model and information criteria. J. Econom. 1981, 16, 3–14. [Google Scholar] [CrossRef]
- Lane, D.J. 16S/23S rRNA Sequencing. In Nucleic Acid Techniques in Bacterial Systematic; John Wiley and Sons: New York, NY, USA, 1991; pp. 115–175. ISBN 2674298170. [Google Scholar]
- Heuer, H.; Hartung, K.; Wieland, G.; Kramer, I.; Smalla, K. Polynucleotide probes that target a hypervariable region of 16S rRNA genes to identify bacterial isolates corresponding to bands of community fingerprints. Appl. Environ. Microbiol. 1999, 65, 1045–1049. [Google Scholar] [CrossRef] [Green Version]
- Myers, R.M.; Fischer, S.G.; Lerman, L.S.; Maniatis, T. Nearly all single base substitutions in DNA fragments joined to a GC-clamp can be detected by denaturing gradient gel electrophoresis. Nucleic Acids Res. 1985, 13, 3131–3145. [Google Scholar] [CrossRef] [PubMed] [Green Version]
- Aquino, S.F.d.; Chernicharo, C.A.L. Acúmulo de ácidos graxos voláteis (AGVs) em reatores anaeróbios sob estresse: Causas e estratégias de controle. Eng. Sanit. Ambient. 2005, 10, 152–161. [Google Scholar] [CrossRef]
- Lovato, G.; Ratusznei, S.M.; Rodrigues, J.A.D.; Zaiat, M. Co-digestion of Whey with Glycerin in an AnSBBR for Biomethane Production. Appl. Biochem. Biotechnol. 2016, 178, 126–143. [Google Scholar] [CrossRef]
- Seneesrisakul, K.; Sutabutr, T.; Chavadej, S. The effect of temperature on the methanogenic activity in relation to micronutrient availability. Energies 2018, 11, 1057. [Google Scholar] [CrossRef] [Green Version]
- Tangkathitipong, P.; Intanoo, P.; Butpan, J.; Chavadej, S. Separate production of hydrogen and methane from biodiesel wastewater with added glycerin by two-stage anaerobic sequencing batch reactors (ASBR). Renew. Energy 2017, 113, 1077–1085. [Google Scholar] [CrossRef]
- Intanoo, P.; Watcharanurak, T.; Chavadej, S. Evolution of methane and hydrogen from ethanol wastewater with maximization of energy yield by three-stage anaerobic sequencing batch reactor system. Int. J. Hydrogen Energy 2020, 45, 9469–9483. [Google Scholar] [CrossRef]
- Zhou, W.; Imai, T.; Ukita, M.; Li, F.; Yuasa, A. Effect of loading rate on the granulation process and granular activity in a bench scale UASB reactor. Bioresour. Technol. 2007, 98, 1386–1392. [Google Scholar] [CrossRef] [PubMed]
- Liu, H.; Fang, H.H.P. Extraction of extracellular polymeric substances (EPS) of sludges. J. Biotechnol. 2002, 95, 249–256. [Google Scholar] [CrossRef]
- Almeida, W.A.; Ratusznei, S.M.; Zaiat, M.; Rodrigues, J.A.D. AnSBBR applied to biomethane production for vinasse treatment: Effects of organic loading, feed strategy and temperature. Braz. J. Chem. Eng. 2017, 34, 759–773. [Google Scholar] [CrossRef] [Green Version]
- Sponza, D.T. Investigation of extracellular polymer substances (EPS) and physicochemical properties of different activated sludge flocs under steady-state conditions. Enzym. Microb. Technol. 2003, 32, 375–385. [Google Scholar] [CrossRef]
- Hu, C.; Liu, Y.; Paulsen, B.S.; Petersen, D.; Klaveness, D. Extracellular carbohydrate polymers from five desert soil algae with different cohesion in the stabilization of fine sand grain. Carbohydr. Polym. 2003, 54, 33–42. [Google Scholar] [CrossRef]
Figure 1.
Schematic representation of the anaerobic sequencing batch reactor used for biodiesel wastewater treatment. 1—volume of the reactor; 2—upper part of the reactor (lid); 3—Tubing for feeding the reactor and extracting the treated supernatant after settling; 4—storage container for both the influent and treated wastewater; 5—tubing connecting the biogas to the gasometer; 6—gasometer; 7—reactor impeller; 8—tap for biomass disposal; 9—thermostatic bath for controlling the temperature; 10—region with electrical devices used for temperature control and impeller mixing; 11—digital thermometer coupled to the thermostatic bath to record the temperature continuously; 12—peristaltic pump; 13—temperature controller; 14—the reactor.

Figure 2.
Data series of COD and removal efficiency of COD of ASBR (A). Variation of applied volumetric organic loading rate (aOLR) for Phases I (F1), II (F2), III (F3), and IV (F4) (B).
Figure 2.
Data series of COD and removal efficiency of COD of ASBR (A). Variation of applied volumetric organic loading rate (aOLR) for Phases I (F1), II (F2), III (F3), and IV (F4) (B).

Figure 3.
Average pH of the effluent and concentration of total volatile acids (TVA) (A), total alkalinity (TA), and bicarbonate (BA) (B) in the influent and effluent during Phases I (F1), II (F2), III (F3), and IV (F4).
Figure 3.
Average pH of the effluent and concentration of total volatile acids (TVA) (A), total alkalinity (TA), and bicarbonate (BA) (B) in the influent and effluent during Phases I (F1), II (F2), III (F3), and IV (F4).

Figure 4.
Concentration of the total suspended solids (TSS), fixed suspended solids (FSS), and volatile suspended solids (VSS) in the effluent of ASBR during Phases I (F1), II (F2), III (F3), and IV (F4).
Figure 4.
Concentration of the total suspended solids (TSS), fixed suspended solids (FSS), and volatile suspended solids (VSS) in the effluent of ASBR during Phases I (F1), II (F2), III (F3), and IV (F4).

Figure 5.
Removed volumetric organic loading rate (g L−1 d−1) and estimated minimum (P1) and maximum (P2) daily methane production during Phases I (F1), II (F2), III (F3), and IV (F4).
Figure 5.
Removed volumetric organic loading rate (g L−1 d−1) and estimated minimum (P1) and maximum (P2) daily methane production during Phases I (F1), II (F2), III (F3), and IV (F4).

Figure 6.
Concentration of polysaccharides and proteins and the composition of EPS in the ASBR effluent in terms of mass/mass, polysaccharides/VSS, and protein/VSS ratio during Phases I (F1), II (F2), III (F3), and IV (F4).
Figure 6.
Concentration of polysaccharides and proteins and the composition of EPS in the ASBR effluent in terms of mass/mass, polysaccharides/VSS, and protein/VSS ratio during Phases I (F1), II (F2), III (F3), and IV (F4).

Figure 7.
Electrophoretic profiles of denaturing gradient gel (DGGE). Sample 1 is the sludge used at the start (inoculation). Sample 2 is the sludge collected during the steady state of Phase I. Sample 3 is the sludge collected during the steady state of Phase II. Sample 4 is the sludge collected during the steady state of Phase III. Sample 5 is the sludge collected during the steady state of Phase IV.

Figure 8.
Venn diagrams constructed based on binary matrices (presence and absence of OTUs) generated by the BioNumerics software v.6 showing the number of unique and shared OTUs by the microbial communities of the samples. Sample 1 is the sludge used at the start (inoculation). Sample 2 is the sludge collected during the steady state of Phase I. Sample 3 is the sludge collected during the steady state of Phase II. Sample 4 is the sludge collected during the steady state of Phase III. Sample 5 is the sludge collected during the steady state of Phase IV.


Table 1.
Mean values of tCOD, volumetric organic loading in terms of COD removed and applied to the ASBR, and removal efficiency of COD with letters corresponding to statistical significance Tukey’s test at 5%.
Table 1.
Mean values of tCOD, volumetric organic loading in terms of COD removed and applied to the ASBR, and removal efficiency of COD with letters corresponding to statistical significance Tukey’s test at 5%.
| Phase | tCOD Influent into ASBR | aOLR (kgCOD m−3 d−1) | ECOD (%) | remOLR (kgCOD m−3 d−1) |
|---|---|---|---|---|
| F1 | 3165.7 a | 1.3 a | 52.1 a | 0.7 a |
| F2 | 6267.5 b | 2.5 b | 41.2 b | 1.0 ac |
| F3 | 12,778.9 c | 5.1 c | 47.0 ab | 2.3 b |
| F4 | 23,982.3 d | 9.6 d | 11.4 c | 1.1 c |
Table 2.
Biomass concentrations present in the ASBR and the F/M ratio used in each phase of the experiment considering a reaction volume of 5 L.
Table 2.
Biomass concentrations present in the ASBR and the F/M ratio used in each phase of the experiment considering a reaction volume of 5 L.
| Phase | CTSS (mg L−1) | CVSS (mg L−1) | F/M (kgCOD kgVSS−1) |
|---|---|---|---|
| F1 | 31,305 ± 1729 | 19,025 ± 795 | 0.1 ± 0.0 |
| F2 | 25,700 ± 184 | 12,264 ± 95 | 0.2 ± 0.0 |
| F3 | 21,123 ± 619 | 13,583 ± 5124 | 0.4 ± 0.1 |
| F4 | 35,113 ± 960 | 15,824 ± 484 | 0.6 ± 0.0 |
Table 3.
Setups and results of researches realized in the last 5 years utilizing a similar configuration to the present work.
Table 3.
Setups and results of researches realized in the last 5 years utilizing a similar configuration to the present work.
| System | Temperature (°C) | Wastewater Type | Applied OLR (kg m−3 d−1) | Best COD Remotion Efficiency (%) | Reference |
|---|---|---|---|---|---|
| Single ASBBR | 30 | Whey and glycerol | 7.5 | 89 | Lovato et al. [23] |
| Two-stage ASBR | 37 | Biodiesel wastewater with addiction of crude glycerol | 4.0–12.0 | 77 (at 9.6 kg m−3 d−1) | Tangkathitipong et al. [25] |
| Single ASBR | 37 | Cassava-based ethanol wastewater | 2.0–8.0 | 93 (at 6.0 kg m−3 d−1) | Seneesrisakul et al. [24] |
| Three-stage ASBR | 37 | Cassava-based ethanol wastewater | 2.7–18.0 | 98 (at 15.0 kg m−3 d−1) | Intanoo et al. [26] |
| Single ASBR | 36 | Biodiesel wastewater | 1.3–9.3 | 52 (at 1.3 kg m−3 d−1) | This work |
Table 4.
Summary of the BW initial and residual COD values, apparent kinetic coefficient for the organic matter degradation rate obtained after model adjustment of first-order kinetics and by the first-order kinetics model considering the residual concentration to the data collected at the end of Phases 1, 2, 3, and 4 during steady state for each OLR and biological organic loading applied (BOL).
| Adjustments of First Order Kinetic Model | Adjustments of First Order Kinetic Model Considering Residual Concentration | ||||||||||||
|---|---|---|---|---|---|---|---|---|---|---|---|---|---|
| Phase | BOL | aOLR | C0 | kap | R2 | AIC | BOL | aOLR | C0 | CR | kap | R2 | AIC |
| F1 | 0.1 | 1.3 | 2677 | 0.04 | 0.972 | 112.4 | 0.1 | 1.3 | 2774 | 1052 | 0.10 | 0.982 | 110.0 |
| F2 | 0.2 | 2.5 | 5080 | 0.03 | 0.875 | 138.0 | 0.2 | 2.5 | 5834 | 3312 | 0.35 | 0.995 | 106.2 |
| F3 | 0.4 | 5.0 | 8,835 | 0.02 | 0.610 | 162.1 | 0.4 | 5.0 | 12,533 | 6930 | 1.80 | 0.987 | 131.0 |
| F4 | 0.6 | 9.3 | 21,907 | 0.01 | 0.700 | 152.7 | 0.6 | 9.3 | 24,062 | 20,306 | 1.04 | 0.980 | 127.1 |
BOL—biological organic loading (g g−1 d−1 in terms of COD/VSS; C0—tCOD at the beginning of degradation (mg L−1); CR— predicted residual sCOD after degradation (mg L−1); kap—apparent kinetic coefficient referring to the rate of degradation of organic matter (h−1); R2—coefficient of determination; AIC—Akaike Criterion Information (dimensionless).
Publisher’s Note: MDPI stays neutral with regard to jurisdictional claims in published maps and institutional affiliations. |
© 2022 by the authors. Licensee MDPI, Basel, Switzerland. This article is an open access article distributed under the terms and conditions of the Creative Commons Attribution (CC BY) license (https://creativecommons.org/licenses/by/4.0/).
Share and Cite
MDPI and ACS Style
Pereira, E.L.; Borges, A.C.; da Silva, G.J. Effect of the Progressive Increase of Organic Loading Rate in an Anaerobic Sequencing Batch Reactor for Biodiesel Wastewater Treatment. Water 2022, 14, 223. https://doi.org/10.3390/w14020223
AMA Style
Pereira EL, Borges AC, da Silva GJ. Effect of the Progressive Increase of Organic Loading Rate in an Anaerobic Sequencing Batch Reactor for Biodiesel Wastewater Treatment. Water. 2022; 14(2):223. https://doi.org/10.3390/w14020223
Chicago/Turabian StylePereira, Erlon Lopes, Alisson Carraro Borges, and Greicelene Jesus da Silva. 2022. "Effect of the Progressive Increase of Organic Loading Rate in an Anaerobic Sequencing Batch Reactor for Biodiesel Wastewater Treatment" Water 14, no. 2: 223. https://doi.org/10.3390/w14020223
Note that from the first issue of 2016, this journal uses article numbers instead of page numbers. See further details here.