
Effect of Particle Concentration and Pipe Materials on the Formation of Biofilms in Drinking Water Distribution Systems


1
College of Civil Engineering, Huaqiao University, 668 Jimei Road, Xiamen 361021, China
2
Key Laboratory of Yangtze River Water Environment, Ministry of Education, Tongji University, Siping Road, Shanghai 200092, China
*
Author to whom correspondence should be addressed.
Water 2022, 14(2), 224; https://doi.org/10.3390/w14020224
Submission received: 19 November 2021
/
Revised: 22 December 2021
/
Accepted: 31 December 2021
/
Published: 13 January 2022
(This article belongs to the Section Water Quality and Contamination)
Abstract
:Microorganism rebreeding and biofilm shedding enter the water body in the process of a drinking water distribution system (DWDS), which poses a threat to public health. Particles in water can gather pollutants as well as providing favorable growth conditions for bacteria. To date, there are a few studies which focus on the relationship between particles and biofilm formation. Therefore, the microbial diversity of biofilms in the different pipe materials and the effect on particle concentration on biofilm formation were investigated in this study. Experiments were carried out under a simulative DWDS (including iron (DI) and polyvinyl chloride (PVC) pipe). The results showed that the microbial diversity in biofilms followed this order: DI pipe > PVC pipe > DI pipe (upper). Moreover, the microbial biomass of biofilm and the fluorescence intensity of extracellular polymeric substances (EPS, produced by microorganisms) were the largest in the absence of particles. The amount of biofilm bacterial and the fluorescence intensity of EPS both showed first an increasing and then decreasing trend with particle concentration increasing. When particle concentration was relatively low, the absorption of particles and bacteria played a major role, however, with the increasing particle concentration, more stable particle–particle were formed and thus, EPS was easily extracted, resulting in the increase of fluorescence intensity of EPS.
1. Introduction
Drinking water distribution system (DWDS) plays an important role in the drinking water industry, and the sanitary safety of water is directly related to human health. However, with the aging of drinking water supply networks, secondary water pollution poses a threat to public health. Several recent studies reported that the tap water from some drinking water distribution pipe networks did not meet the Chinese Drinking Water Standard (GB 5749-2006) [1,2,3,4,5,6,7].
Generally, the growth of microorganisms and the formation of biofilms are supported by DWDS when microorganisms contact the surface of the pipe wall [8]. Meanwhile, microorganisms would produce extracellular polymeric substances (EPS), which help these microorganisms embed in microbial communities [9]. However, biofilms contain a variety of pathogenic bacteria. In practice, pathogenic bacteria are released into the DWDS due to complicated and frequently changed operating conditions of DWDS. The fluctuation in hydraulic conditions could cause the detachment of biofilms from the pipe wall, greatly leading to lower water quality, causing taste and order issues as well as promoting the corrosion of pipes. The detached biofilm could also increase the concentration of particles and the number of bacteria in drinking water.
Particles not only can gather organic and inorganic pollutants, but also provide growth interfaces and nutrients for bacteria, enhancing bacteria’s resistance to disinfectants [10]. The color and turbidity of drinking water would also be increased by particles [11]. Xu et al. [7] found that small molecular weight natural organic matter (NOM) made up a large proportion of total NOM in drinking water samples, implying that the number of small-size particles is relatively large. However, small-size particles cannot be completely removed by drinking water treatment processes. Moreover, Li et al. [12] reported that the surface area of biological lateral wall (212%) was significantly higher than that of new lateral wall (4.37%) and smooth wall (0.196%), which indicated that biofilms increased notably both the roughness of the pipeline surface and the adsorption of fine suspended solid particles onto surfaces. Thus, less small particles bounced off the pipe’s surface, and colloidal particles could be easily adsorbed on the surface of pipes, promoting the formation of biofilms and inducing microbial contamination. Up to now, studies on particles in DWDS mainly focus on the relationship between particles and turbidity, and their adsorption performance of micropollutants [13,14]. However, there are few studies on the relationships among fine particles, biofilm formation, and EPS.
Therefore, the objectives in this paper are as follow: (1) to evaluate the microbial diversity of biofilms in the different pipe materials; (2) to investigate the impacts of particle concentration on the biofilm formation and the fluorescence intensity of EPS. and (3) to explore the impact of rotating speed on microbial biofilm formation and the fluorescence intensity of EPS.
2. Experimental
2.1. The Simulative System of DWDS
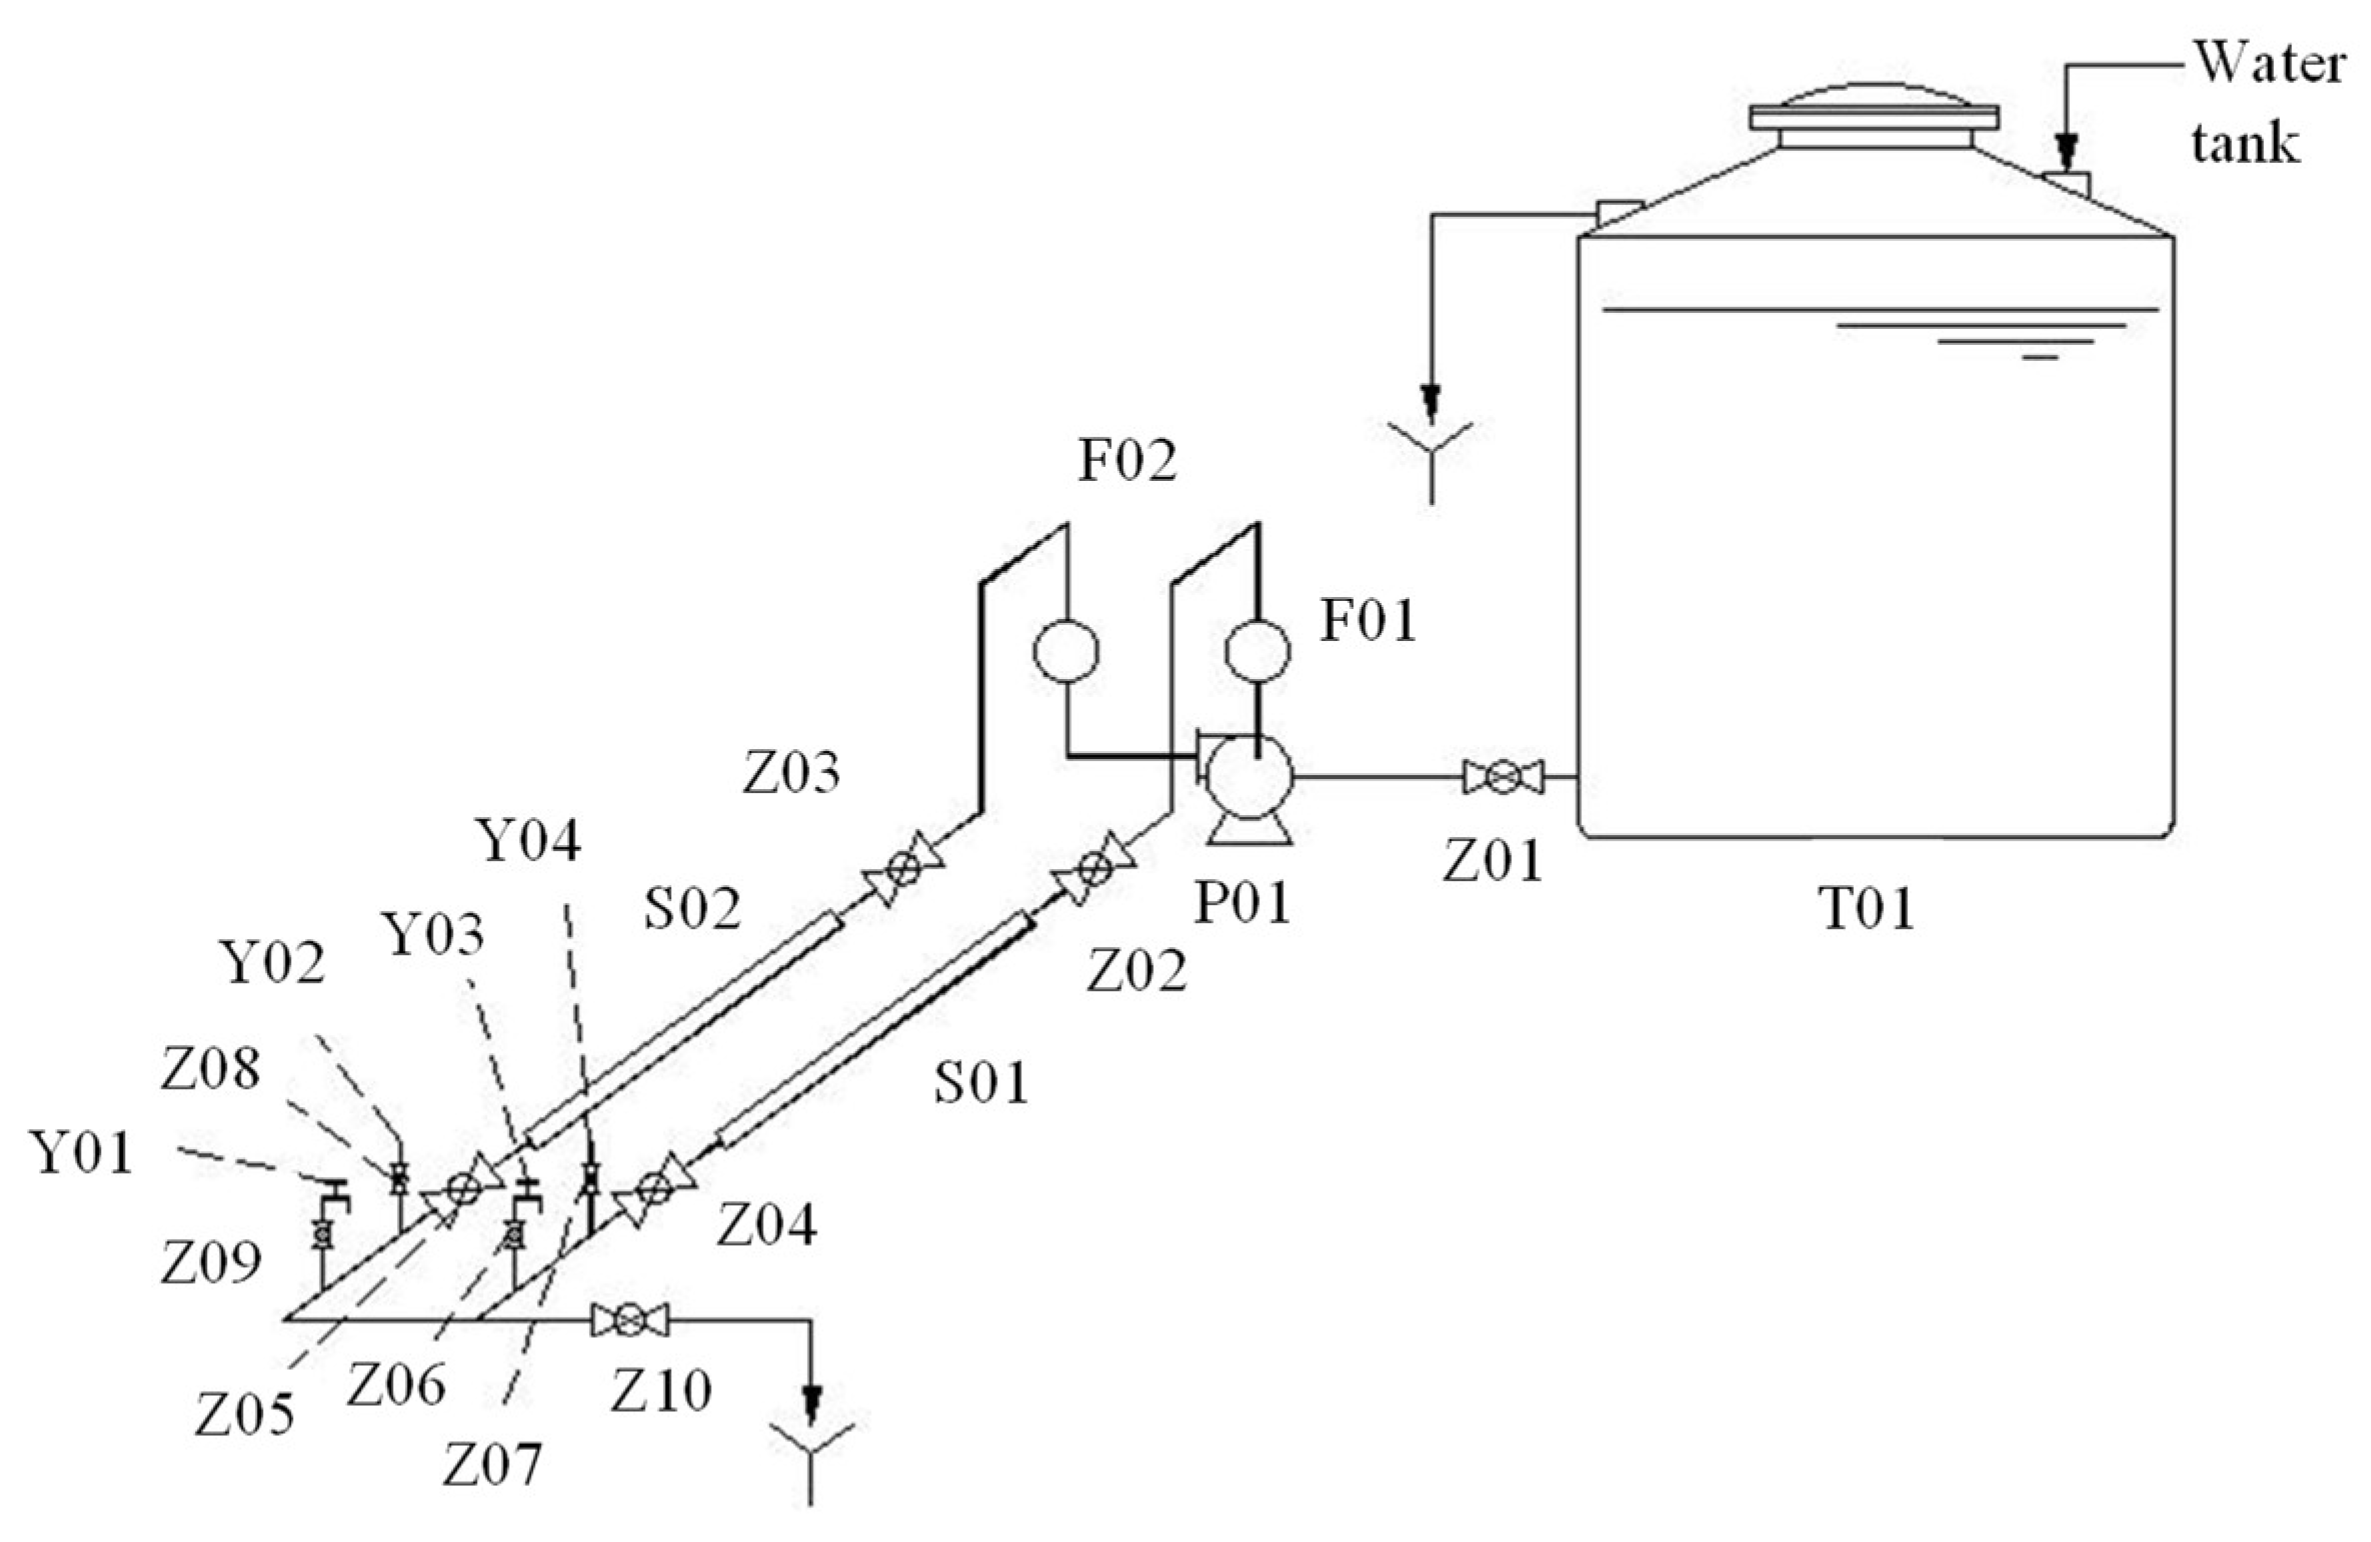
Figure 1 shows the simulation system of DWDS. This DWDS had two separate loops to test the effects of different pipe materials, which were made of ductile iron (DI) and polyvinyl chloride (PVC). The length and diameter of each loop were about 1.1 m and 90 mm, respectively. In order to better simulate the actual water consumption of the pipe network and consider the formation cycle of biofilm, this closed system ran for 12 h every day from June 2020 to September 2021. The water was from tap water in the laboratory, and the flow rate of each loop was 0.15 m3/h.
2.2. Analytical Methods
In order to investigate biofilm formation of different pipe materials, polymerase chain reaction (PCR) amplification of V4–V5 region was performed using the forward primer 338F (5′-ACTCCTACGGGAGGCAGCAG-3′) and the reverse primer 806R (5′-GGACTACHVGGGTWTCTAAT-3′). The PCR mix ingredients included 5 μL of Q5 reaction buffer (5×), 5 μL of Q5 high-fidelity GC buffer (5×), 0.25 μL of Q5 high-fidelity DNA polymerase (5U/μL), 2 μL (2.5 mM) of dNTPs, 1 μL (10 μM) each of the forward and reverse primer, 2 μL of the DNA template, and 8.75 μL of ddH2O. The thermal cycling conditions were as follows: initial denaturation at 98 °C for 2 min, 25 cycles consisting of denaturation at 98 °C for 15 s, followed by annealing at 55 °C for 30 s with a final extension at 72 °C for 50 min. PCR amplicons were pooled from different replicates, and pair-end 2 × 300 bp sequencing was performed using the Illlumina MiSeq platform with MiSeq Reagent Kit v3 produced by Shanghai Personal Biotechnology Co., Ltd. (Shanghai, China).
The number of bacteria was counted by a flow cytometry (Backman Coulter, Quanta SC, USA). The green fluorescence signal collection channel was set as FL1 with a wavelength of 520 ± 20 nm, and the particle signal collection wavelength channel was set as SS. Biofilm samples should be treated with 2% EDTA-2Na solution as dispersant at 4 °C for 3 h, and 10 µL SYBR Green I was added to the samples and stained at room temperature of 18 °C for 45 min under dark conditions.
EPS solution was analyzed by a three-dimension excitation emission matrix (3D-EEM) fluorescence spectroscopy (Hitachi, F-4600). The parameters were set as follows: the excitation wavelength (Ex) was scanned from 200 nm to 500 nm with a 5 nm increment; the emission wavelength (Em) was scanned from 250 to 550 nm with a 5 nm increment, and the scanning speed was 2400 nm/min.
2.3. Experimental Procedures
In order to better simulate the real situation of user pipe network water flow, we will carry out three experiments, one is the water distribution system experiment, the temperature is 20 °C, the pH value is 7.5, and the flow rate is 0.15 m3/h. At the same time, the difference in the concentration of particulate matter in the pipe network will also have different effects on the formation of biofilms. Eight groups of different particulate matter concentrations were designed for experiments. In order to confirm that EPS can help microorganisms to embed in biofilms, we need to extract EPS from biofilms cultured at different concentrations of particulate matter. To simulate the effect of particles on the formation of biofilms at different flow rates in the pipe network, we did a rotation speed experiment to cultivate microorganisms at different rotation speeds to see the changes in their numbers.
In water distribution system experiments, the tap water was filled in the water tank, and the simulative DWDS continuously operated for 12 h. Biofilms of DI pipe, DI (upper), PVC pipe, and PVC pipe of real DWDS were collected at 12 h by biological sampler for PCR detection.
In the influencing experiment of particle concentration on microbial biofilm formation, first, the tap water was added to the crucible and heated to obtain the particle samples. About 5 g particle samples were obtained for subsequent preparation of R2A liquid medium. Second, the obtained particles were divided into 8 parts and added into R2A liquid medium respectively. The number of particles was measured by flow cytometry. Third, these 8 samples were autoclaved at 121 °C for 20 min; 1 mL of tap water was added to 8 mL of R2A liquid medium with different particle concentrations. The cultivation temperature was set at 37 °C and the culture time of biofilm was 24 h. Finally, a medium-speed filter paper (pore size 20–30 µm) was used to collect the bacteria in biofilms. These bacteria were stained and then counted by flow cytometry.
EPS was extracted by EDTA method [15]. The extraction steps were as follows: (1) the biofilm was cultured for 3 d according to the previous experimental methods; (2) 8 biofilm samples with different particle concentration were centrifuged at 4 °C and 6000 r/min for 15 min, then were redissolved by sterile saline and centrifuged twice; (3) 5 mL sterilized saline and 5 mL EDTA-2Na were added into each sample and stood for 3 h at 4 °C; (4) each sample was centrifuged at 4 °C and 13,000 r/min for 20 min; (5) EPS solution was obtained by filtering the supernatant through 0.22 µm membranes for EEM detection.
In the influencing experiment of rotating speed, a different number of particles were added into R2A liquid medium. Four samples with no particles and four samples with particles were autoclaved at 121 °C for 20 min, and then 1 mL of tap water was added to 8 mL of R2A liquid medium. The cultivation temperature was set at 37 °C and the rotating speed was set as 0, 50, 80, and 120 rpm. After 24 h, a medium-speed filter paper (pore size 20–30 µm) was used to collect the bacteria in biofilms, and these bacteria were stained and then counted by flow cytometry. Under the same experimental conditions, four samples (containing particles) with different rotating speed were cultured for 3 d. Then, each EPS was extracted for EEM detection.
The above groups of experiments were done the same twice: one time, the sample tap water is from the PVC pipe, and the other time, the sample water is from the UI pipe.
3. Results and Discussion
3.1. Microbial Composition of Biofilms in Different Pipe Materials
At present, ductile iron pipes are commonly used in DWDS due to their high mechanical strength, impact resistance, and convenient installation. However, the biggest disadvantage of metal pipes is the occurrence of electrochemical corrosion, leading to uneven pipe walls and benefiting the adhesion of bacteria. Thereby, plastic pipes (e.g., polyvinyl chloride pipes) are increasingly being used. Generally, different pipe materials affected the development of biofilms. Meanwhile, the hydraulic conditions of the upper and bottom of the pipes are also obviously different when operation condition of pipes changes (e.g., leakage), resulting in different living environment of the biofilms. Hence, the microbial communities of DI pipe, PVC pipe, DI pipe (upper), and PVC pipe of real DWDS were investigated.
Table 1 shows microbial diversity index in different pipe materials. The community uniformity was reflected by Simpson/Shannon index. The microbial diversity in biofilms followed this order: DI pipe > PVC pipe > DI pipe (upper). Due to the rough surface of DI pipe, it can provide more suitable conditions for biofilm formation [16,17]. Moreover, previous studies verified that the bacterial quantity of DI pipe was higher than plastic pipe [18,19,20,21], which was consistent with this result. The microbial diversity of PVC pipe was slightly higher than real PVC pipe in DWDS, which may have attributed to circulating water in simulative DWDS and thus, more microbial bacteria which grew. In addition, microbial diversity of DI pipe (bottom) was significantly higher than DI pipe (upper). On the one hand, the effect of water flow on the biofilms at upper pipe is greater when the operation condition changes. On the other hand, the separation of biofilms of upper pipe from water would lead to the exposure and endogenous respiration of microorganisms, affecting their reproduction.
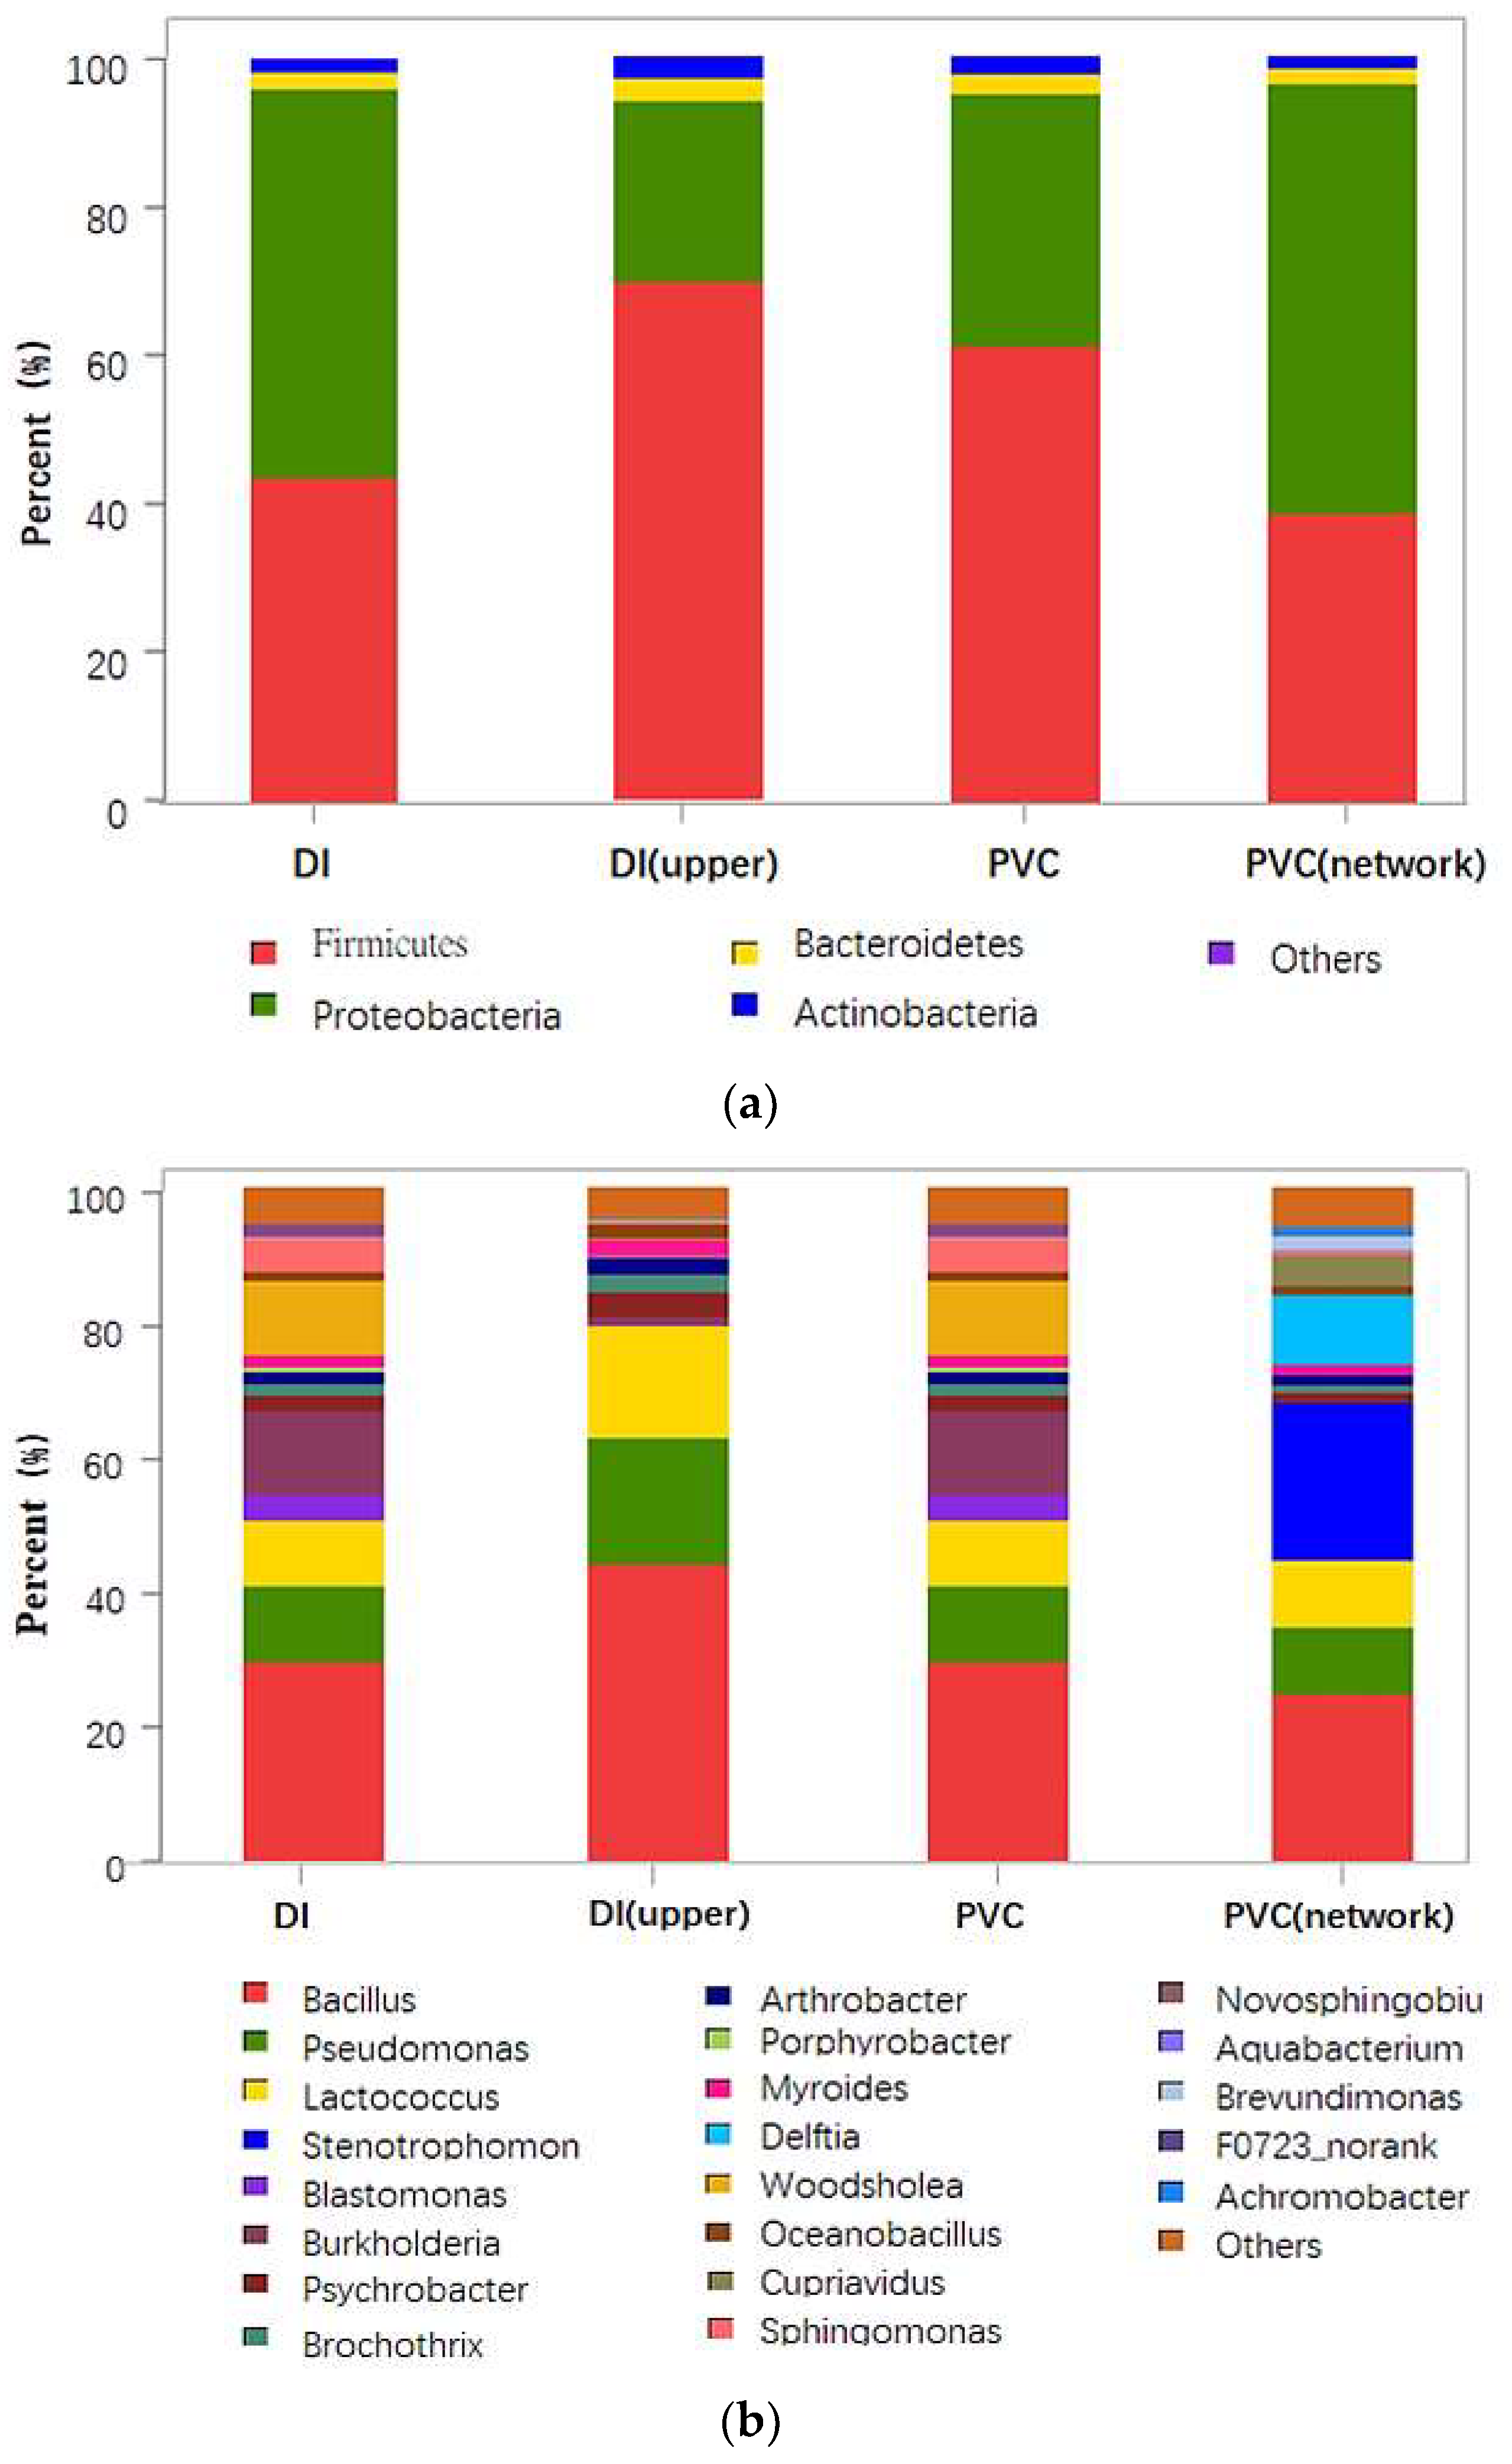
Figure 2a shows relative abundance of different bacteria in different pipe materials at the phylum level. As seen in Figure 2a, the dominant bacteria in all samples were Firmicutes (38.5–67.6%), Proteobacteria (26.7–58.0%), Bacteroidetes (2.3–3.4%), and Actinobacteria (0.7–1.9%). Lautenschlager et al. reported that the Proteobacteria was the most dominant group in biofilms, and its relative abundance was around 34–70%. Revetta et al. discovered that Proteobacteria, Actinomycetes, and Bacteroidetes accounted for 90% of the taxa in the biofilm community in DWDS. Generally, the relative abundance of bacteria relates to many factors such as pipe materials and different sampling points. The bacterial community structures were compared at the genus level in Figure 2b. It was observed that Bacillus (25.0–44.3%) was the most abundant bacteria in four samples. Some bacteria (e.g., Pseudomonas and Lactococcus) can stick to the pipe wall, and they are conducive to ensuring the smooth interspecific hydrogen transfer and providing nutrient matrix for biofilm formation [22]. In addition, previous study confirmed that plastic pipes could release total organic matter into water, benefiting microbial growth [18]. That was why Bacillus (40%), Pseudomonas (17.1%), and Lactococcus (14.8%) of PVC pipe were higher than that of DI pipe (Bacillus (29.2%), Pseudomonas (11.4%), and Lactococcus (9.9%)).
3.2. Impact of Particle Concentration on Microbial Biofilm Formation
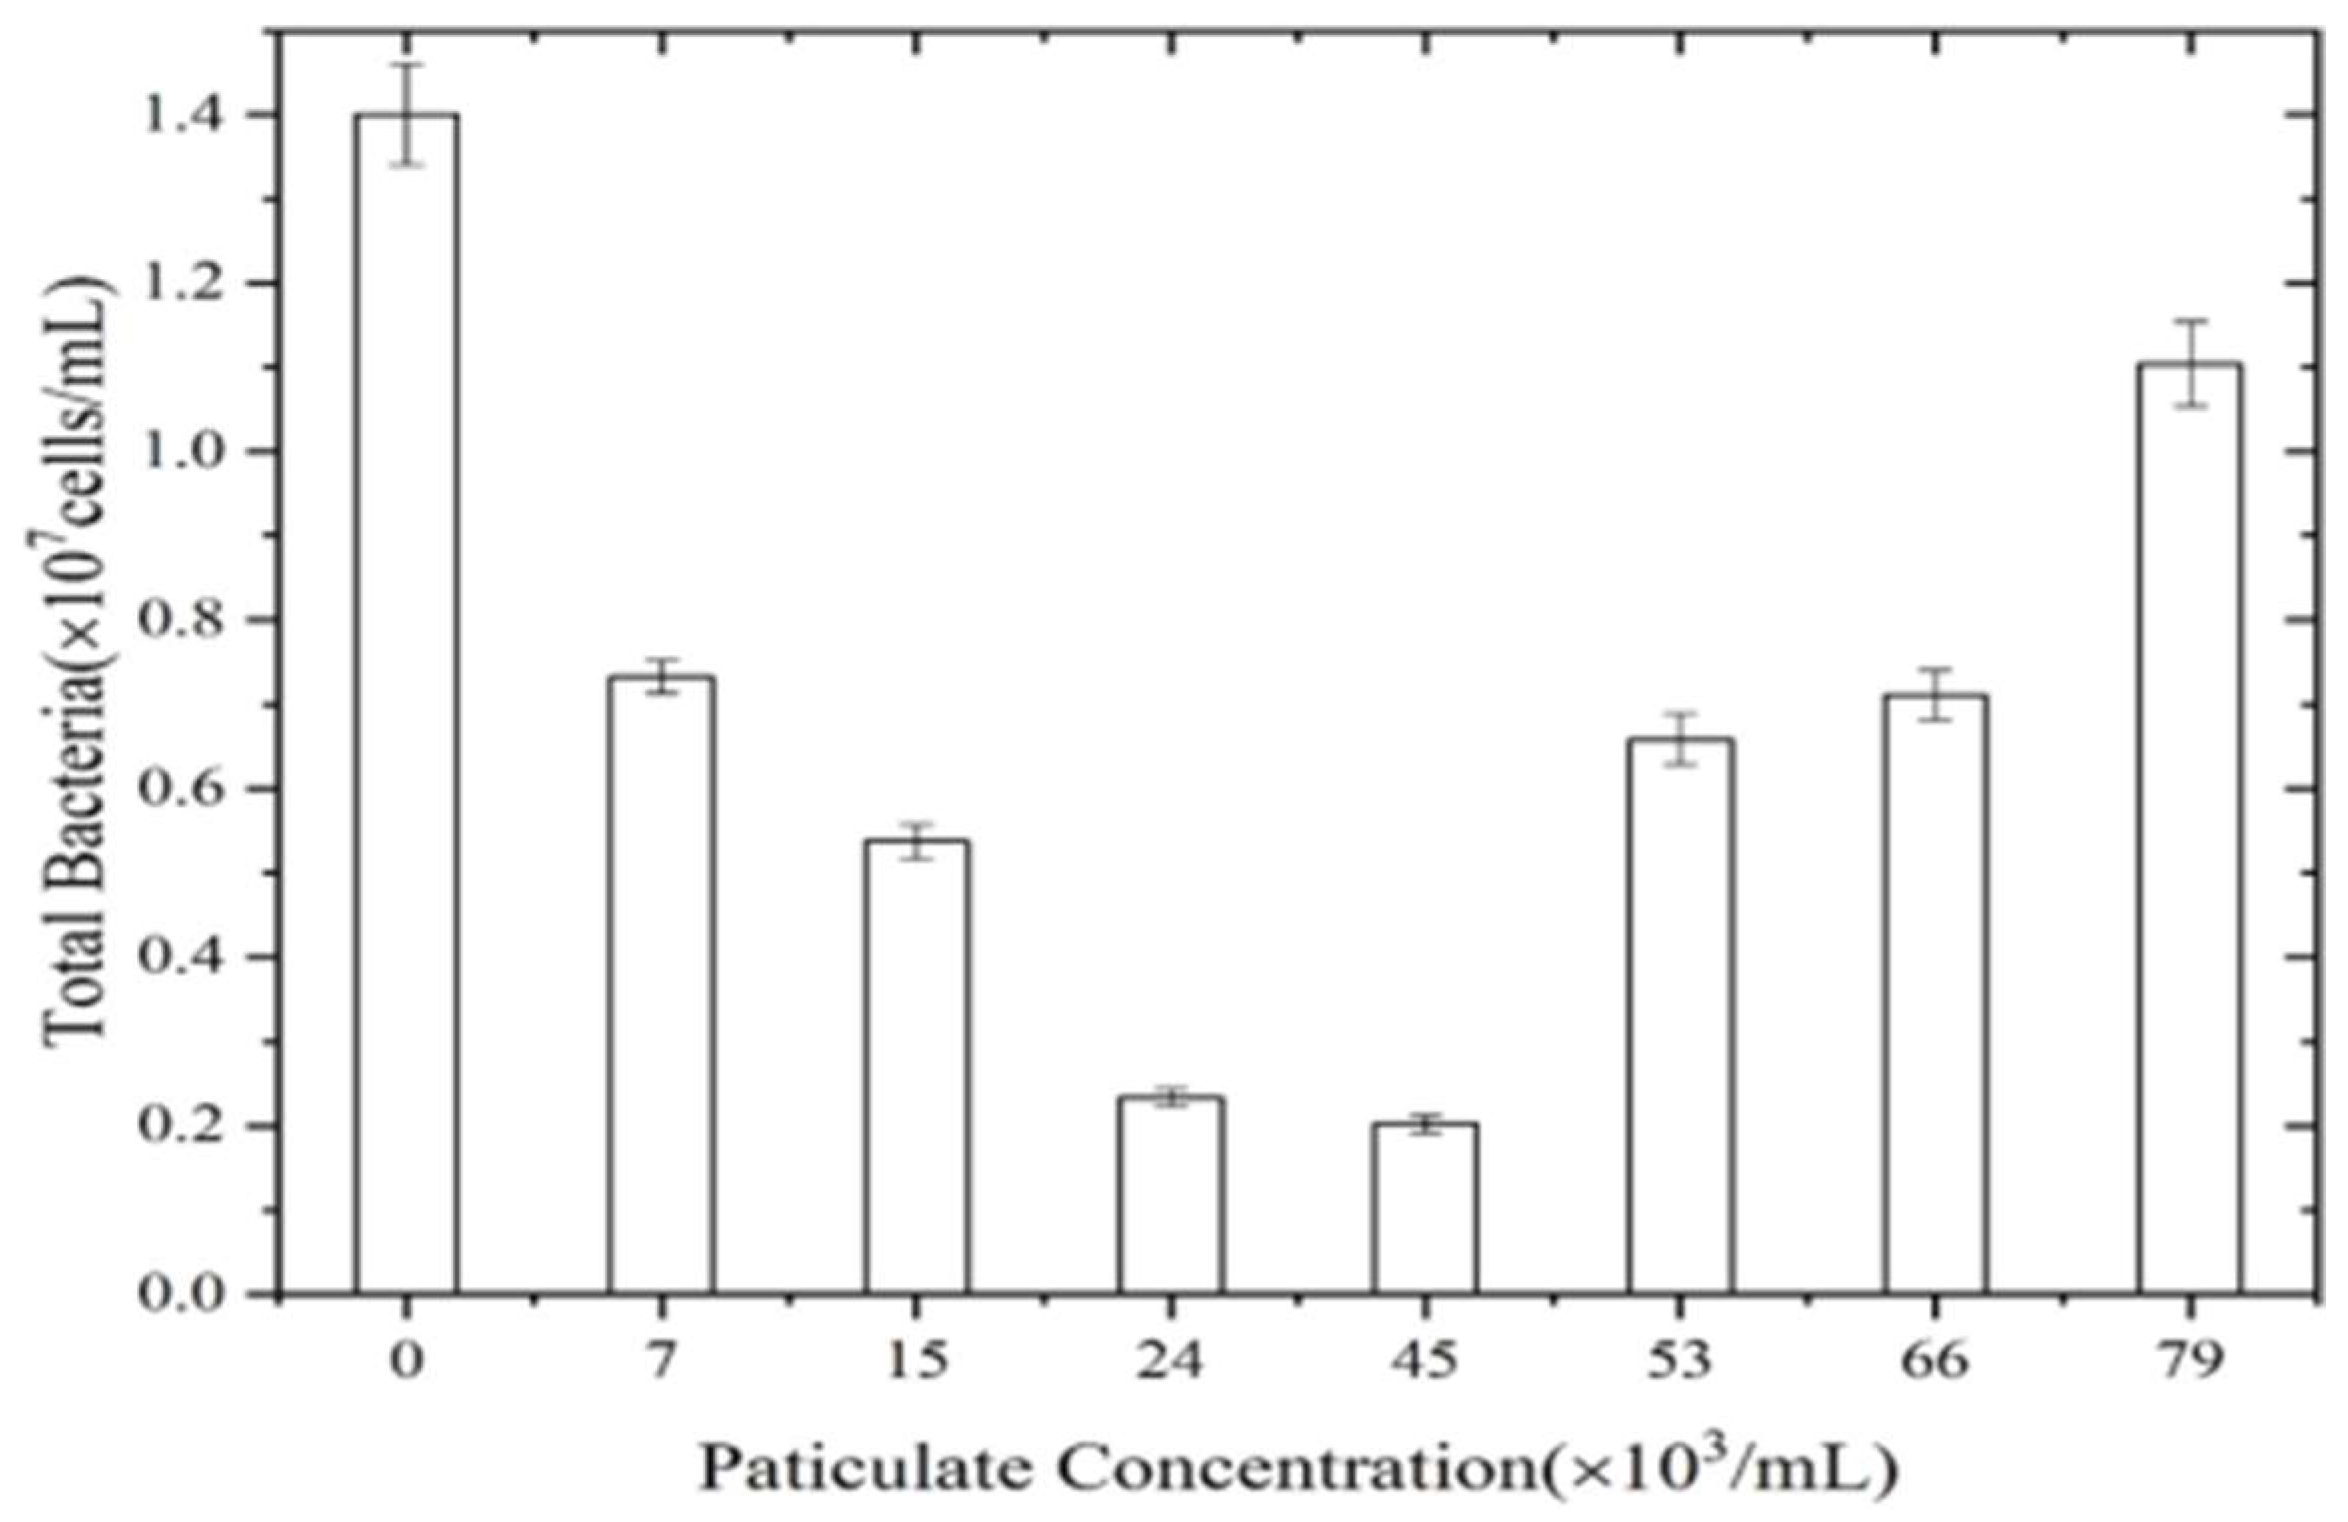
Figure 3 shows the impact of particle concentration on microbial biofilm formation. As seen, the microbial biomass of biofilm was the largest (1.4 × 10⁷ cells/mL) in the absence of particles, indicating that bacteria were prone to bond and that they generate aggregates, thus forming biofilm. The amount of biofilm bacterial was relatively low in the presence of particles, and it tended to increase first and then decrease with the increase of particle concentration. When particle concentration was 45 × 103/mL, the total amount of biofilm bacteria was the lowest (0.2 × 10⁷ cells/mL). Generally, the biofilms were formed by the homoaggregation of bacteria and heteroaggregation between bacteria and particles. The surface of particles could provide more attachment sites for microorganisms to adhere. Moreover, the particles and bacteria of biofilm were difficult to separate even by EDTA-2Na dispersant, resulting in lower numbers of microorganisms in the biofilm with the increase of particles. However, when the heteroaggregates reached saturation at relatively high particle concentration, the binding among bacteria increased, leading to the decrease and then increase of microbial counting in the biofilm [14,23].
3.3. Impact of Particle Concentration on the Fluorescence Intensity of EPS
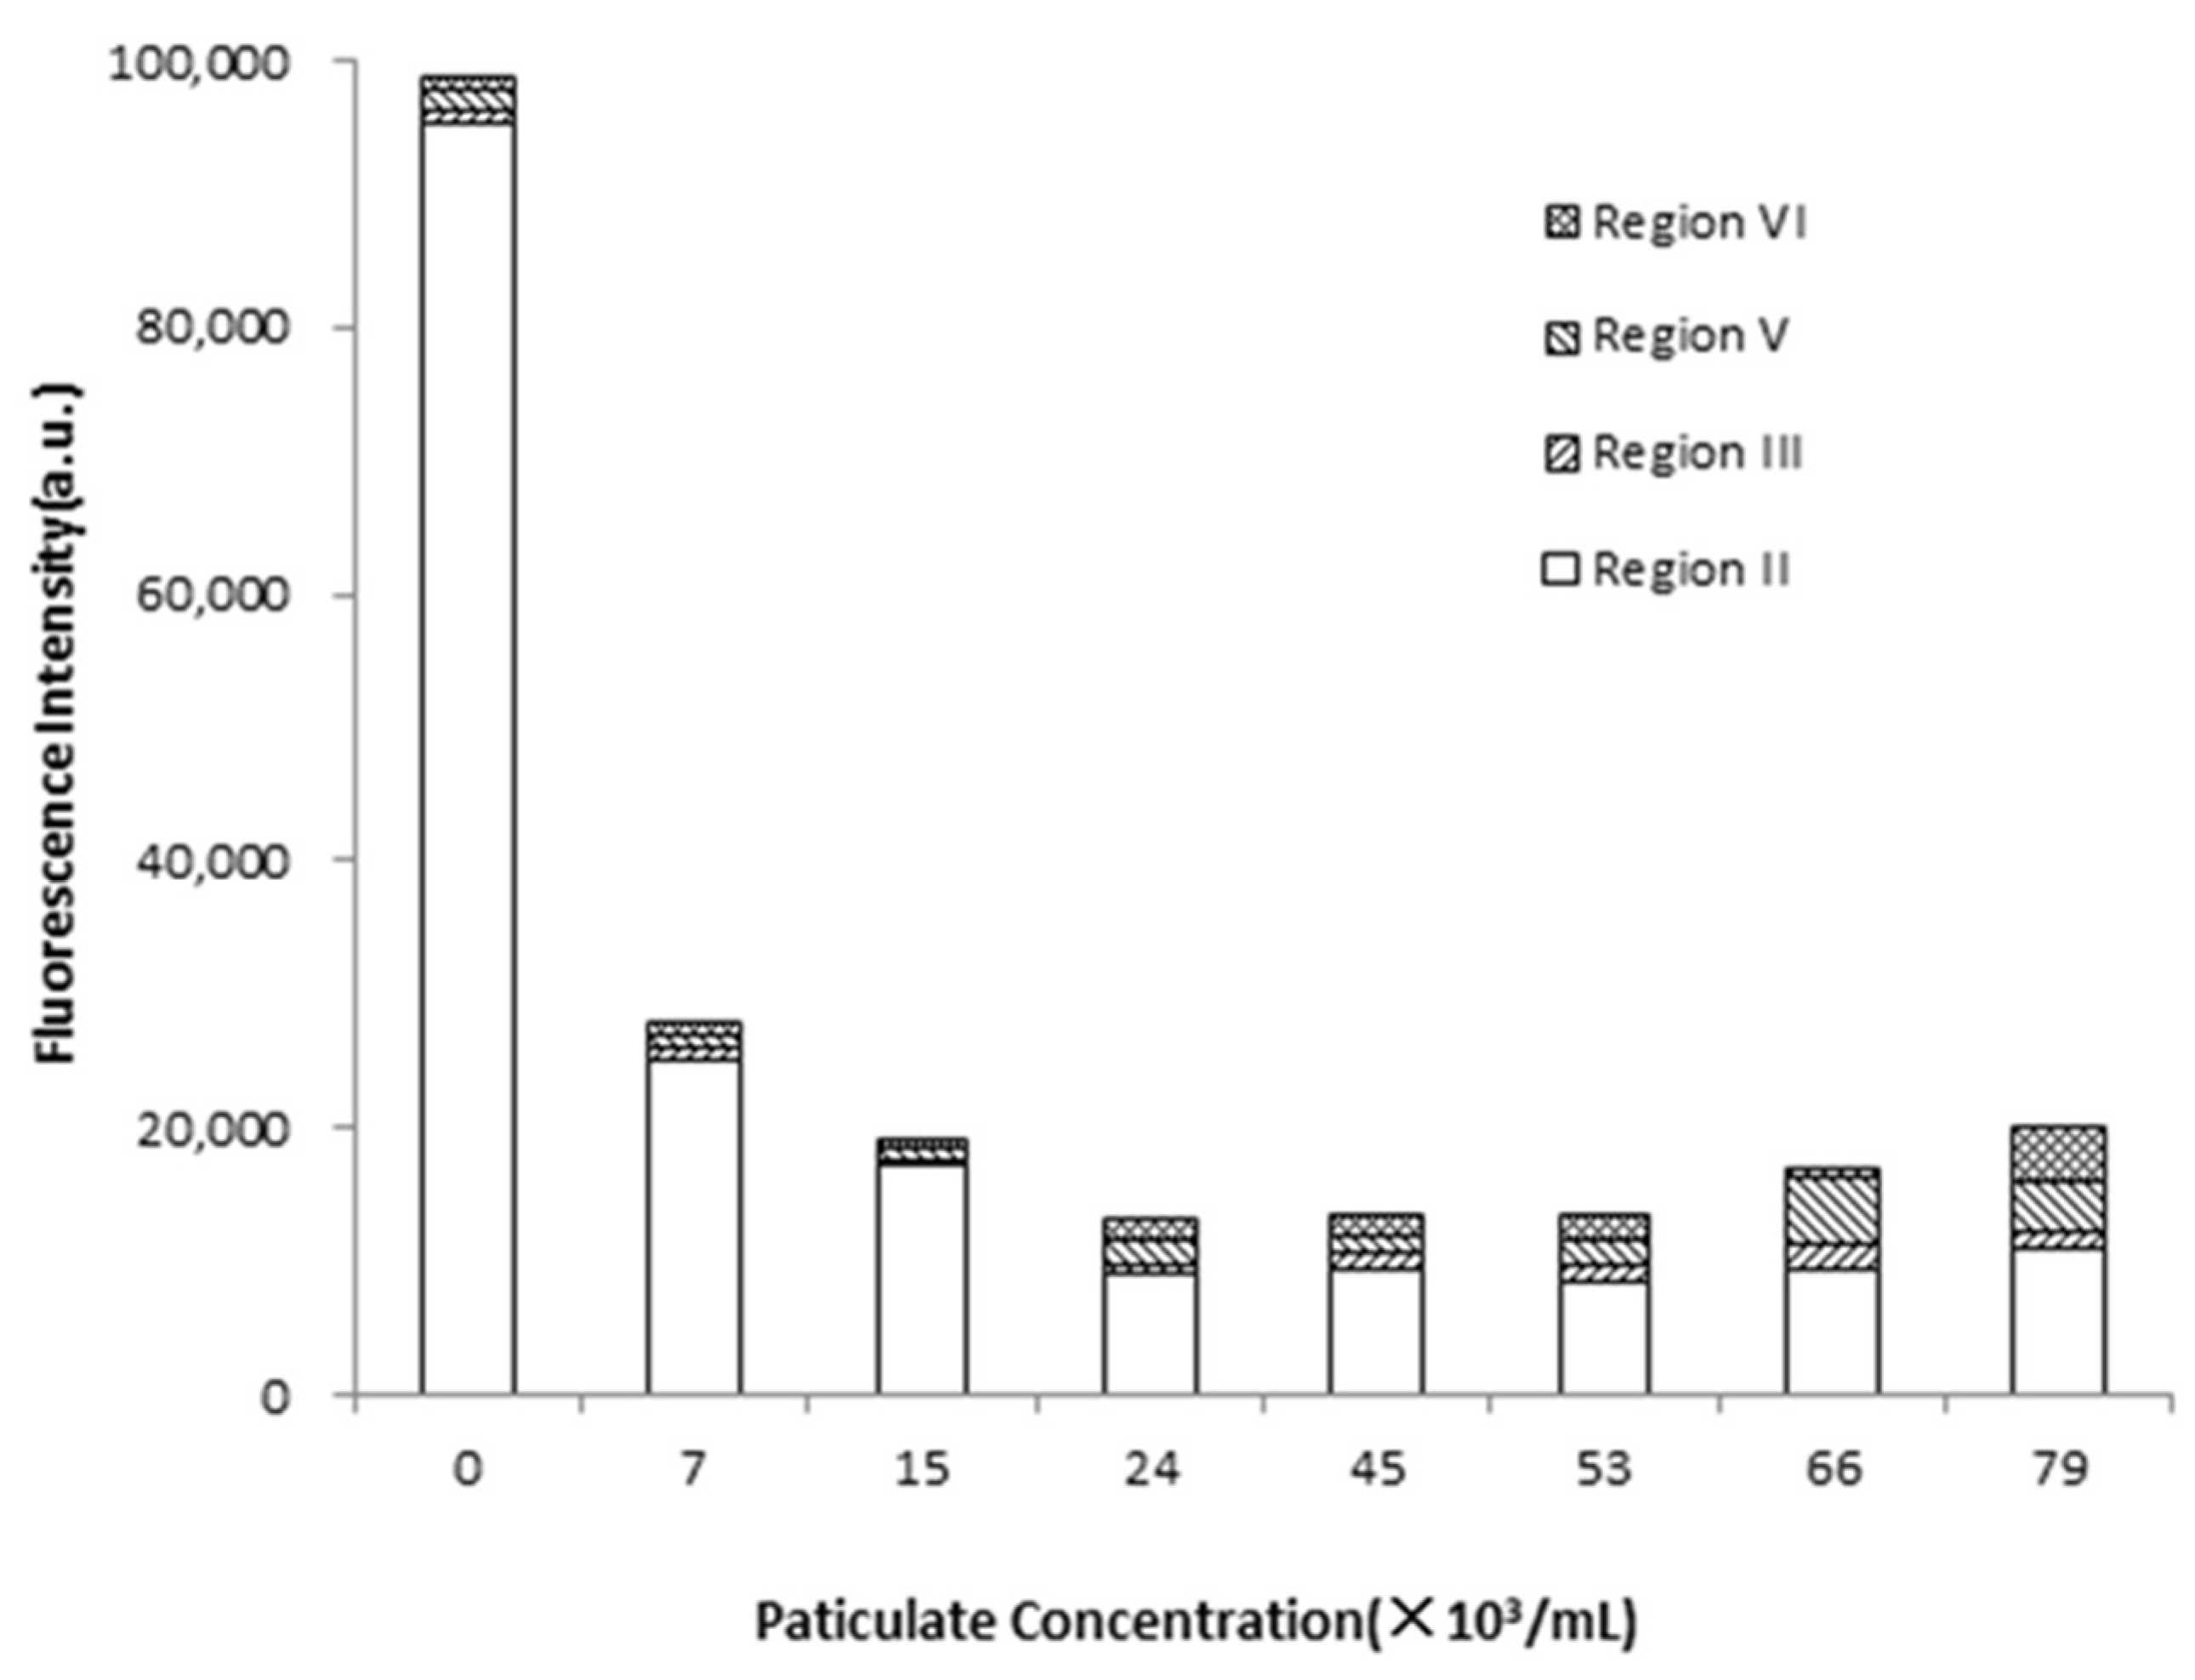
Fluorescence spectroscopy is an advanced analytical technique for dissolved organic matter characterization. In order to know the relationship between particle concentration and the fluorescence intensity of EPS, EPS solutions with different particle concentration were analyzed by 3D-EEM. Generally, the EEM spectra is divided into six regions, including tyrosine/tryptophan proteins I region (Ex: 220~240 nm/Em: 280~360 nm), tyrosine/tryptophan proteins II region (Ex: 240~290 nm/Em: 280~360 nm), polysaccharide III region (Ex: 300~330 nm/Em: 360~390 nm), fulvic acid-like IV region (Ex: 220~240 nm/Em: 410~450 nm), polyaromatic cyclic humic acid-like V region (Ex: 260~290 nm/Em: 420~460 nm), and polycarboxylic humic acid-like VI region (Ex: 330~370 nm/Em: 420~460 nm) [24,25].
Figure 4 shows the impact of particle concentration on the fluorescence intensity of EPS. The fluorescence signals of EPS were mainly distributed in region II, III, V, and VI. The fluorescence intensity of region II (tyrosine/tryptophan proteins) was significantly higher than that of the other three regions. As seen, the fluorescence intensity of EPS was the highest when the medium contained no particles. The homoaggregation of bacteria mainly occurred in the absence of particles, and the addition of EDTA-2Na could easily separate EPS and bacteria. However, the fluorescence intensity of EPS showed a decrease first and then an increase with the increase of particle concentration, indicating that the amount of unextracted EPS firstly increased and then decreased. At low particle concentration, the absorption of particles and bacteria played a major role. The particles could change properties of EPS and make the adhesion between particles and bacteria more stable so that EPS was difficult to separate from the particle–bacteria interface. Moreover, previous studies reported that EPS carried a negative surface charge while particles were positively charged due to ionization of anionic functional groups such as carboxyl and phosphate groups [14,23]. With the increase of particle concentration, more and more stable particle–particle was formed and EPS was easier to be extracted, thus, the fluorescence intensity of EPS increased. This result was consistent with previous study [26,27].
3.4. Impact of Rotating Speed on Microbial Biofilm Formation and the Fluorescence Intensity of EPS
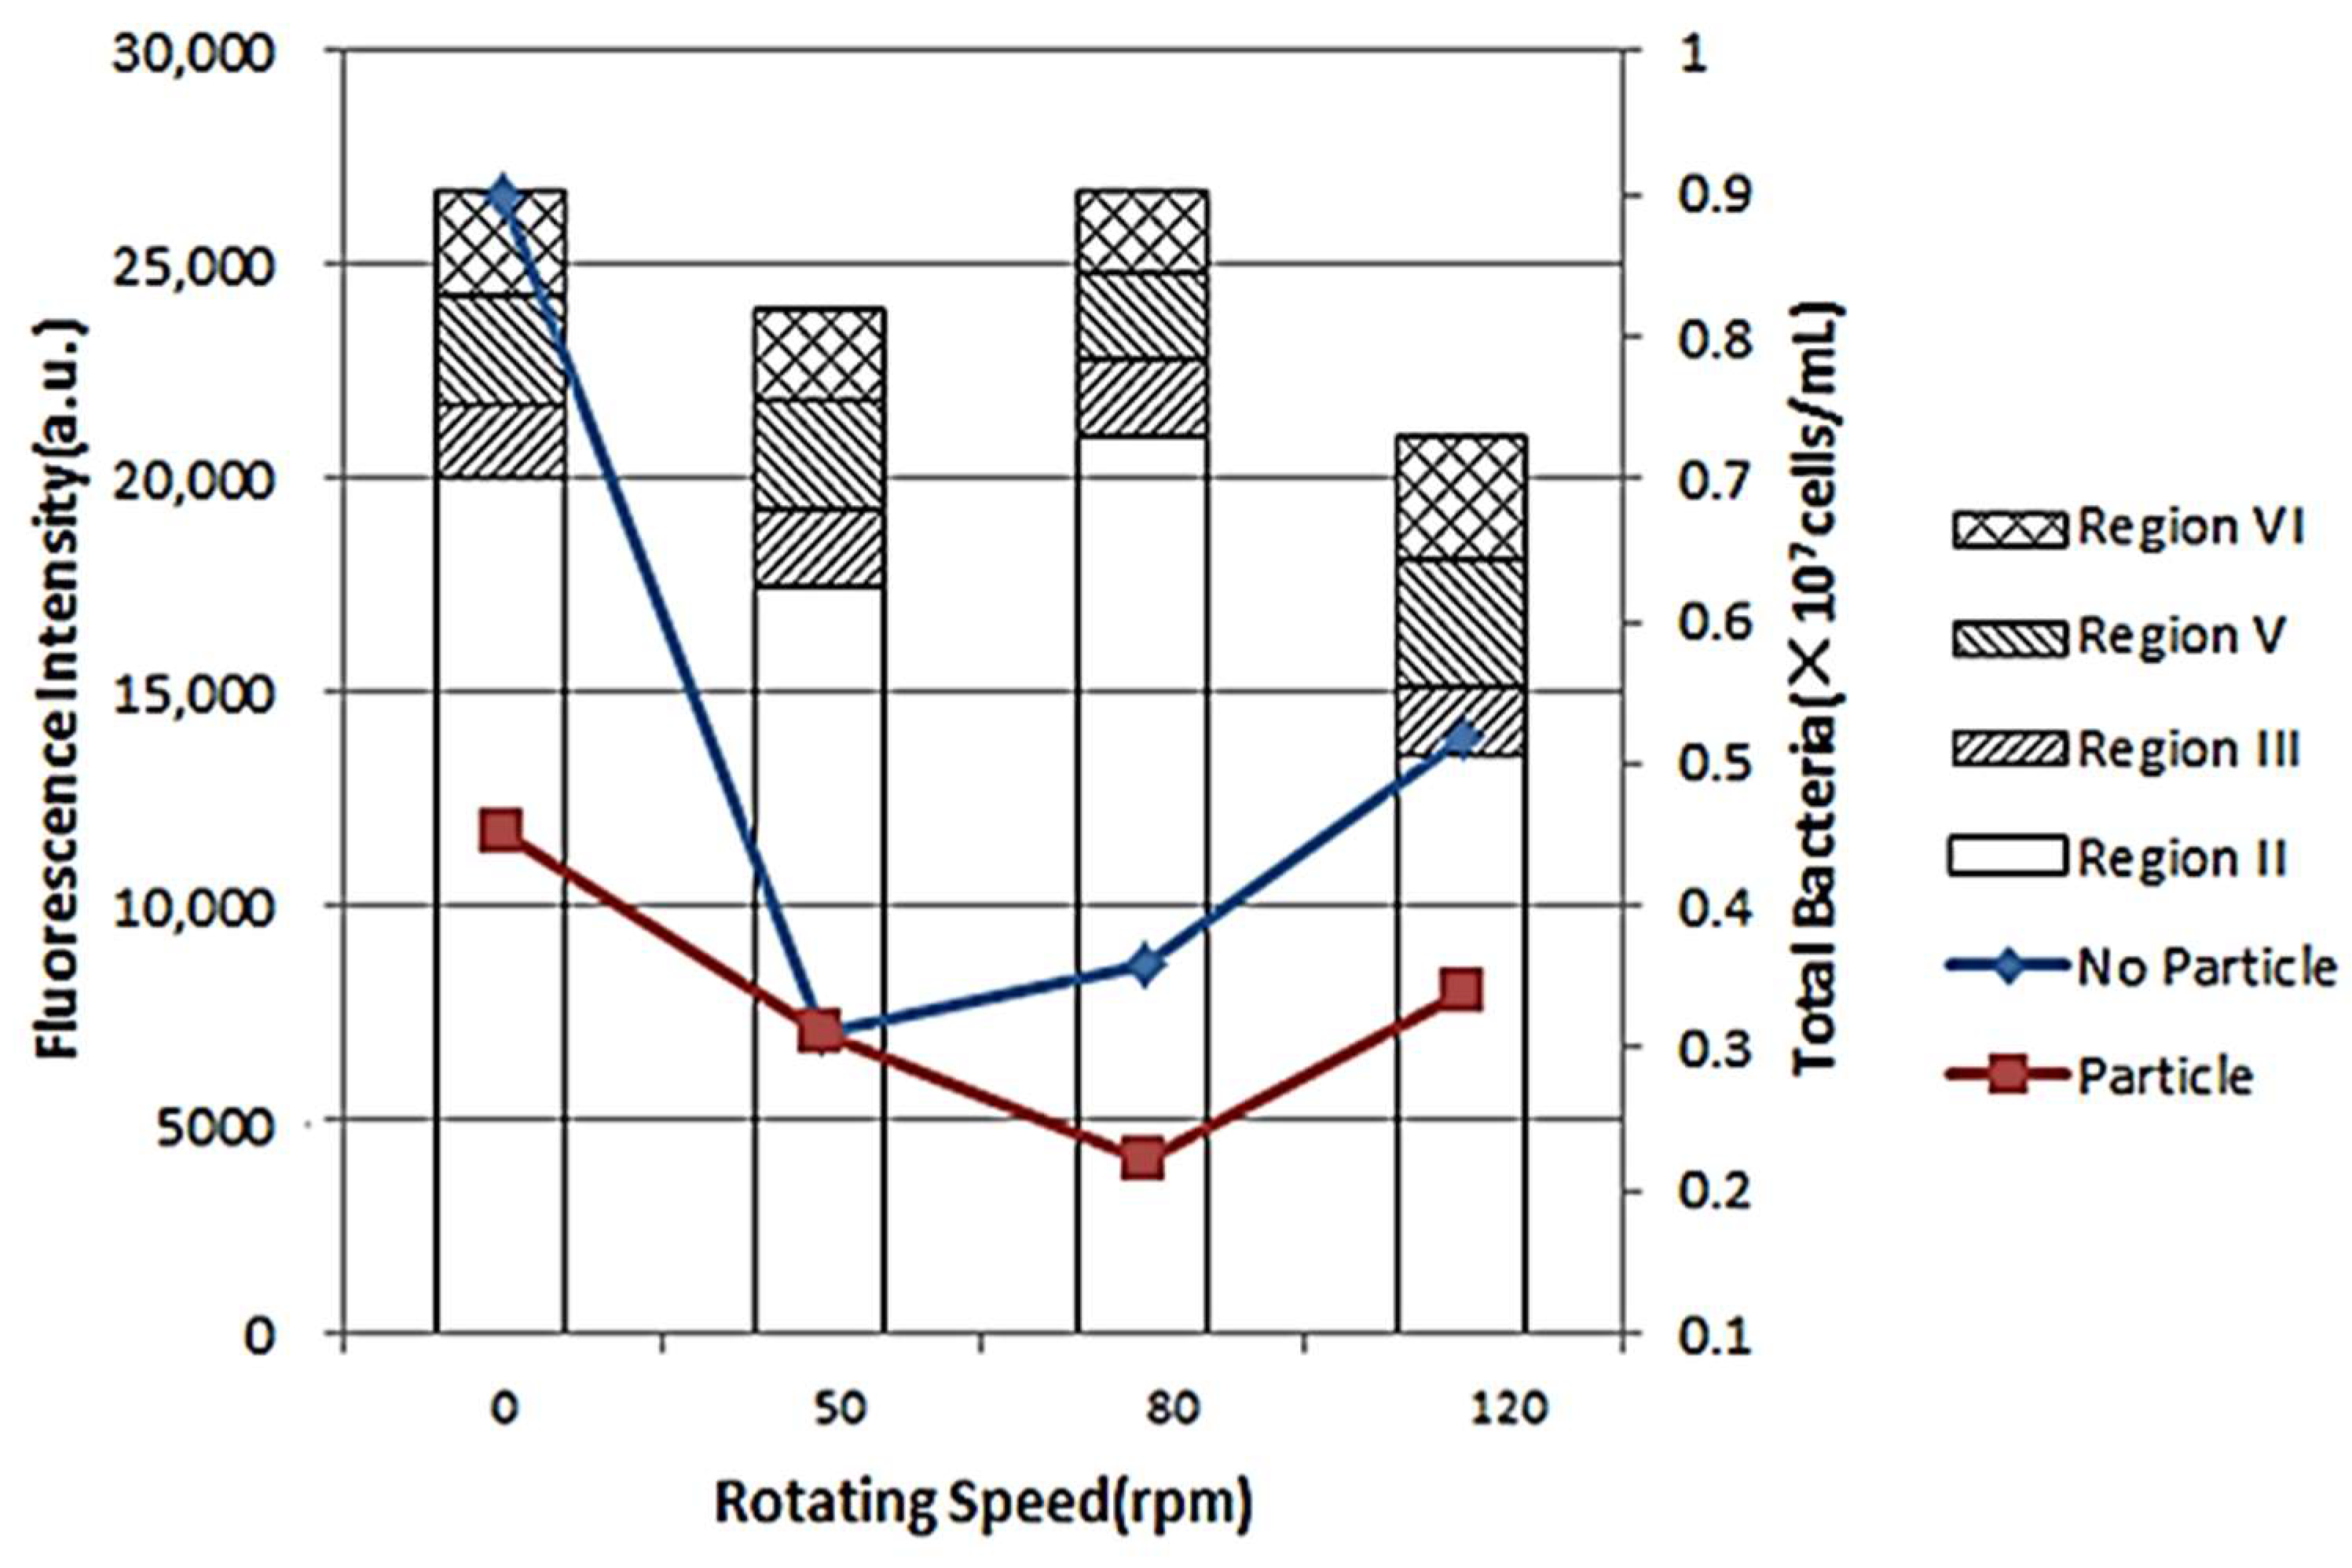
Figure 5 shows the impact of rotating speed on microbial biofilm formation and the fluorescence intensity of EPS. The microbial biomass of biofilm with no particles was larger than that of with particles, which was consistent with the above results. With the increase of rotating speed, the microbial biomass of biofilm showed first a decrease and then an increase. When the rotating speed was 50 rpm, the microbial biomass of biofilm with no particle was at least (0.31 × 10⁷ cells/mL), while the microbial biomass of biofilm with particle was at least (0.20 × 10⁷ cells/mL), as the rotating speed was 80 rpm. The aggregation by bacteria was unstable and the aggregates could be easily separated under high rotating speed. However, when the rotating speed exceeded a certain value, it could cause more intense Brownian motion and particle collision, bringing more nutrients to the microbial community and promoting the growth of bacteria and biofilm formation [28,29].
As seen, the fluorescence intensity of EPS firstly decreased and then increased with the increase of rotating speed. Higher rotating speeds could intensify the collision between particles and bacteria, leading to enhanced adhesion to the tube wall and formation of stable biofilms [26,27]. Thereby, the amount of unextracted EPS increased. However, the detachment of biofilms could accelerate when the rotating speed increased. As the collision between bacteria and particles, and the impact of water flow on biofilm reached the dynamic equilibrium, significant aggregation of biofilms was observed. Therefore, it was indicated that the hydraulic conditions could affect the formation or succession of biofilm in DWDS.
4. Conclusions
The aim of this study demonstrated the microbial diversity of biofilms in the different pipe materials, the impact of particle concentration on the biofilm formation and the fluorescence intensity of EPS, and the impact of rotating speed on microbial biofilm formation and the fluorescence intensity of EPS. The microbial diversity in biofilms followed this order: DI pipe > PVC pipe > DI pipe (upper). DI pipe could provide more suitable conditions for biofilm formation and its bacterial quantity was higher than PVC pipe. With the increase of particle concentration, the amount of biofilm bacterial and the fluorescence intensity of EPS both showed first an increasing and then decreasing trend. The absorption of particles and bacteria played a major role at low particle concentration, while as particle concentration increased, more stable particle–particle were formed and EPS was easier to be extracted, leading to the increase of fluorescence intensity of EPS. In addition, the aggregates of bacteria could be easily separated under high rotating speed. However, high rotating speed could also promote Brownian motion and particle collision, benefiting the growth of bacteria and biofilm formation. Since the secondary pollution of biofilms in pipelines is a problem that we urgently need to solve, if we research the turbidity indicators in the pipeline network water, it will be relatively macro and difficult to analyze, so the impact of particulates in the pipeline network on the formation of biofilms is studied. The experimental results show that the impact of its particulate matter on biological production is: as the particulate matter increases, the number of organisms decreases. This was the opposite of our expectations. Therefore, it provides information on how to reduce the number of biofilms in the pipe network.
Therefore, combined with the current research status at home and abroad, and the conclusion of this paper, follow-up research can be carried out from the following aspects.
(1). The microbial diversity of the biofilm in the pipeline network is complex, and the operating conditions of the water supply pipeline network are complex, so there are many factors affecting the microbial diversity. However, the pipe material is particularly important. The plastic pipe has a smooth surface to reduce adhesion, but it also releases some substances to promote the increase of biofilm. There are still a large number of cast iron pipes in China’s current pipe network, and the research on cast iron pipes and the development of new pipe materials should be strengthened in the application of specific old cities.
(2). Particulate matter has an important effect on stabilizing biofilm biomass, and particulate matter–bacterial aggregates are more difficult to destroy than bacteria–bacterial aggregates. The mechanism of particulate matter and EPS still needs to be studied, so biofilm research should pay more attention to the mechanism of particulate matter and EPS as well as the role of particulate matter in the structure of biofilm.
(3). Strengthen the study of microbial EPS functional gene expression, and the relationship between biofilm, extracellular polymer, and particulate matter. In the follow-up research, it should be discussed in depth from the surface theory.
Author Contributions
Methodology, Z.Z., Y.Z., L.W. and W.S.; validation, L.W. and W.S.; formal analysis, L.W.; data curation, W.S.; writing—original draft preparation, Z.Z. and L.W.; writing—review and editing, L.W.; funding acquisition, Z.Z. All authors have read and agreed to the published version of the manuscript.
Funding
This research was funded by No. 51278206 grant number National Natural Science Foundation of China.
Institutional Review Board Statement
Not applicable.
Informed Consent Statement
Not applicable.
Data Availability Statement
Not applicable.
Conflicts of Interest
The authors declare no conflict of interest.
References
- Dong, F.L.; Li, C.; Crittenden, J.; Zhang, T.Q.; Lin, Q.F.; He, G.L.; Zhang, W.Q.; Luo, J.M. Sulfadiazine destruction by chlorination in a pilot-scale water distribution system: Kinetics, pathway, and bacterial community structure. J. Hazard. Mater. 2019, 366, 88–97. [Google Scholar] [CrossRef] [PubMed]
- He, J.; Charlet, L. A review of arsenic presence in China drinking water. J. Hydrol. 2013, 492, 79–88. [Google Scholar] [CrossRef]
- Leung, H.W.; Jin, L.; Wei, S.; Tsui, M.M.P.; Zhou, B.S.; Jiao, L.P.; Cheung, P.C.; Chun, Y.K.; Murphy, M.B.; Lam, P.K.S. Pharmaceuticals in Tap Water: Human Health Risk Assessment and Proposed Monitoring Framework in China. Environ. Health Perspect. 2013, 121, 839–846. [Google Scholar] [CrossRef] [PubMed] [Green Version]
- Ru, J.G.; Abbaxley, A.; Yang, H.F.; Zhang, Y.; Ma, J.F. Analysis of drinking water quality in Urumuqi from 2011 to 2013. J. Environ. Hyg. 2014, 4, 480–482+486. (In Chinese) [Google Scholar] [CrossRef]
- Strohschon, R.; Wiethoff, K.; Baier, K.; Lu, L.; Bercht, A.L.; Wehrhahn, R.; Azzam, R. Land use and Water Quality in Guangzhou, China: A survey of ecological and Social Vulnerability in Four Urban Units of the Rapidly Developing Megacity. Int. J. Environ. Res. 2013, 7, 343–358. [Google Scholar] [CrossRef]
- Wang, W.; Li, R.L.; Zhang, X.X.; Zhang, Z.W.; Cheng, Y.J.; Li, B.Y. Analysis of sanitary status of drinking water quality in Xicheng District of Beijing from 2009 to 2011. J. Environ. Hyg. 2013, 3, 528–531. [Google Scholar] [CrossRef]
- Xu, B.; Gao, N.Y.; Sun, X.F.; Xia, S.J.; Simonnot, M.O.; Causserand, C.; Rui, M.; Wu, H.F. Characteristics of organic material in Huangpu River and treatability with the O-3-BAC process. Sep. Purif. Technol. 2007, 57, 348–355. [Google Scholar] [CrossRef]
- Li, W.Y.; Tan, Q.W.; Zhou, W.; Chen, J.P.; Li, Y.; Wang, F.; Zhang, J.P. Impact of substrate material and chlorine/chloramine on the composition and function of a young biofilm microbial community as revealed by high-throughput 16S rRNA sequencing. Chemosphere 2020, 242. [Google Scholar] [CrossRef]
- Liu, S.; Gunawan, C.; Barraud, N.; Rice, S.A.; Harry, E.J.; Amal, R. Understanding, Monitoring, and Controlling Biofilm Growth in Drinking Water Distribution Systems. Environ. Sci. Technol. 2016, 50, 8954–8976. [Google Scholar] [CrossRef]
- Wingender, J.; Flemming, H.C. Biofilms in drinking water and their role as reservoir for pathogens. Int. J. Hyg. Environ. Health 2011, 214, 417–423. [Google Scholar] [CrossRef]
- Vreeburg, J.H.G.; Blokke, E.J.M.; Horst, P.; Van Dijk, J.C. Velocity-based self-cleaning residential drinking water distribution systems. Water Science & Technology: Water Supply 2009, 9, 635–641. [Google Scholar] [CrossRef]
- Li, Y.K.; Wang, W.N.; Sun, H.S. Study on particle-wall collision characteristics in capillary tubes with regenerated water droplet irrigation. J. Agric. Mach. 2015, 46, 159–166. (In Chinese) [Google Scholar] [CrossRef]
- Liu, G.; Zhang, Y.; Knibbe, W.J.; Feng, C.J.; Liu, W.S.; Medema, G.; van der Meer, W. Potential impacts of changing supply-water quality on drinking water distribution: A review. Water Res. 2017, 116, 135–148. [Google Scholar] [CrossRef]
- Liu, Y.; Fang, H.H.P. Influences of extracellular polymeric substances (EPS) on flocculation, settling, and dewatering of activated sludge. Crit. Rev. Environ. Sci. Technol. 2003, 33, 237–273. [Google Scholar] [CrossRef]
- Liu, Y.; Fang, H.H.P. Extraction of extracellular polymeric substances (EPS) of sludges. J. Biotechnol. 2002, 95, 249–256. [Google Scholar] [CrossRef]
- Yu, J.; Kim, D.; Lee, T. Microbial diversity in biofilms on water distribution pipes of different materials. Water Sci. Technol. 2010, 61, 163–171. [Google Scholar] [CrossRef] [PubMed]
- Lautenschlager, K.; Hwang, C.; Liu, W.T.; Boon, N.; Koster, O.; Vrouwenvelder, H.; Egli, T.; Hammes, F. A microbiology-based multi-parametric approach towards assessing biological stability in drinking water distribution networks. Water Res. 2013, 47, 3015–3025. [Google Scholar] [CrossRef] [PubMed] [Green Version]
- Dong, F.L.; Lin, Q.F.; Duan, H.J.; Li, C. Effect of pipe materials on disinfection by-products and bacterial communities during sulfamethazine chlorination in a pilot-scale water distribution system. Environ. Chem. Lett. 2018, 17, 1039–1044. [Google Scholar] [CrossRef]
- Zhang, K.J.; Cao, C.; Zhou, X.Y.; Zheng, F.F.; Sun, Y.M.; Cai, Z.Q.; Fu, J. Pilot investigation on formation of 2,4,6-trichloroanisole via microbial O-methylation of 2,4,6-trichlorophenol in drinking water distribution system: An insight into microbial mechanism. Water Res. 2018, 131, 11–21. [Google Scholar] [CrossRef] [PubMed]
- Revetta, R.P.; Gomez-Alvarez, V.; Gerke, T.L.; Curioso, C.; Domingo, J.W.S.; Ashbolt, N.J. Establishment and early succession of bacterial communities in monochloramine-treated drinking water biofilms. Fems Microbiol. Ecol. 2013, 86, 404–414. [Google Scholar] [CrossRef] [PubMed] [Green Version]
- Learbuch, K.L.G.; Smidt, H.; van der Wielen, P.W.J.J. Influence of pipe materials on the microbial community in unchlorinated drinking water and biofilm. Water Res. 2021, 194, 116922. [Google Scholar] [CrossRef]
- Wang, Y.; Wang, W.H.; Wang, R.Q. Simultaneous nitrification and denitrification in biofilm of a model distribution pipe fed with disinfected reclaimed water. J. Water Process Eng. 2020, 35. [Google Scholar] [CrossRef]
- Liao, B.Q.; Allen, D.G.; Droppo, I.G.; Leppard, G.G.; Liss, S.N. Surface properties of sludge and their role in bioflocculation and settleability. Water Res. 2001, 35, 339–350. [Google Scholar] [CrossRef]
- Chen, W.; Westerhoff, P.; Leenheer, J.A.; Booksh, K. Fluorescence excitation—Emission matrix regional integration to quantify spectra for dissolved organic matter. Environ. Sci. Technol. 2003, 37, 5701–5710. [Google Scholar] [CrossRef]
- Wang, Z.P.; Zhang, T. Characterization of soluble microbial products (SMP) under stressful conditions. Water Res. 2010, 44, 5499–5509. [Google Scholar] [CrossRef] [PubMed]
- Zheng, D.; Liu, W.J.; Xu, H.F. Effect of suspended particulate matter on biofilm formation in a water distribution system. Environ. Sci. 2007, 1236–1240. [Google Scholar] [CrossRef]
- Vreeburg, J.H.G.; Schippers, D.; Verberk, J.Q.J.C.; van Dijk, J.C. Impact of particles on sediment accumulation in a drinking water distribution system. Water Res. 2008, 42, 4233–4242. [Google Scholar] [CrossRef] [PubMed]
- Lehtola, M.J.; Miettinen, I.T.; Hirvonen, A.; Vartiainen, T.; Martikainen, P.J. Estimates of microbial quality and concentration of copper in distributed drinking water are highly dependent on sampling strategy. Int. J. Hyg. Environ. Health 2007, 210, 725–732. [Google Scholar] [CrossRef] [PubMed]
- Su, B.Y.; Huang, Y.H.; Zhang, S.Q. Monitoring results of drinking water quality in Xiamen from 2010 to 2012. Strait J. Prev. Med. 2014, 20, 60–61. (In Chinese) [Google Scholar] [CrossRef] [Green Version]
Figure 1.
The simulative system of DWDS (F—flowmeter, P—pump, S01—ductile iron pipe, S02—polyvinyl chloride pipe, T—water tank, Y—outlet, Z—stopcock valve).
Figure 1.
The simulative system of DWDS (F—flowmeter, P—pump, S01—ductile iron pipe, S02—polyvinyl chloride pipe, T—water tank, Y—outlet, Z—stopcock valve).

Figure 2.
Relative abundance of different bacteria in different pipe materials: (a) At the phylum level; (b) At the genus level (n = 3).
Figure 2.
Relative abundance of different bacteria in different pipe materials: (a) At the phylum level; (b) At the genus level (n = 3).

Figure 3.
Impact of particle concentration on microbial biofilm formation.

Figure 4.
Impact of particle concentration on the fluorescence intensity of EPS.

Figure 5.
Impact of rotating speed on microbial biofilm formation and the fluorescence intensity of EPS.
Figure 5.
Impact of rotating speed on microbial biofilm formation and the fluorescence intensity of EPS.


Table 1.
Microbial diversity (Simpson/Shannon) index in different pipe materials.
| Samples | Simpson | Shannon |
|---|---|---|
| DI pipe | 0.0746 | 2.97 |
| PVC pipe | 0.0931 | 2.82 |
| DI pipe (upper) | 0.1190 | 2.59 |
| PVC pipe of real DWDS | 0.1043 | 2.76 |
Publisher’s Note: MDPI stays neutral with regard to jurisdictional claims in published maps and institutional affiliations. |
© 2022 by the authors. Licensee MDPI, Basel, Switzerland. This article is an open access article distributed under the terms and conditions of the Creative Commons Attribution (CC BY) license (https://creativecommons.org/licenses/by/4.0/).
Share and Cite
MDPI and ACS Style
Zhao, Z.; Zhang, Y.; Wang, L.; Shi, W. Effect of Particle Concentration and Pipe Materials on the Formation of Biofilms in Drinking Water Distribution Systems. Water 2022, 14, 224. https://doi.org/10.3390/w14020224
AMA Style
Zhao Z, Zhang Y, Wang L, Shi W. Effect of Particle Concentration and Pipe Materials on the Formation of Biofilms in Drinking Water Distribution Systems. Water. 2022; 14(2):224. https://doi.org/10.3390/w14020224
Chicago/Turabian StyleZhao, Zhiling, Yongji Zhang, Lu Wang, and Wenhang Shi. 2022. "Effect of Particle Concentration and Pipe Materials on the Formation of Biofilms in Drinking Water Distribution Systems" Water 14, no. 2: 224. https://doi.org/10.3390/w14020224
Note that from the first issue of 2016, this journal uses article numbers instead of page numbers. See further details here.