
Spatial and Temporal Variation of Droughts in the Mongolian Plateau during 1959–2018 Based on the Gridded Self-Calibrating Palmer Drought Severity Index

Abstract
:1. Introduction
2. Data and Methods
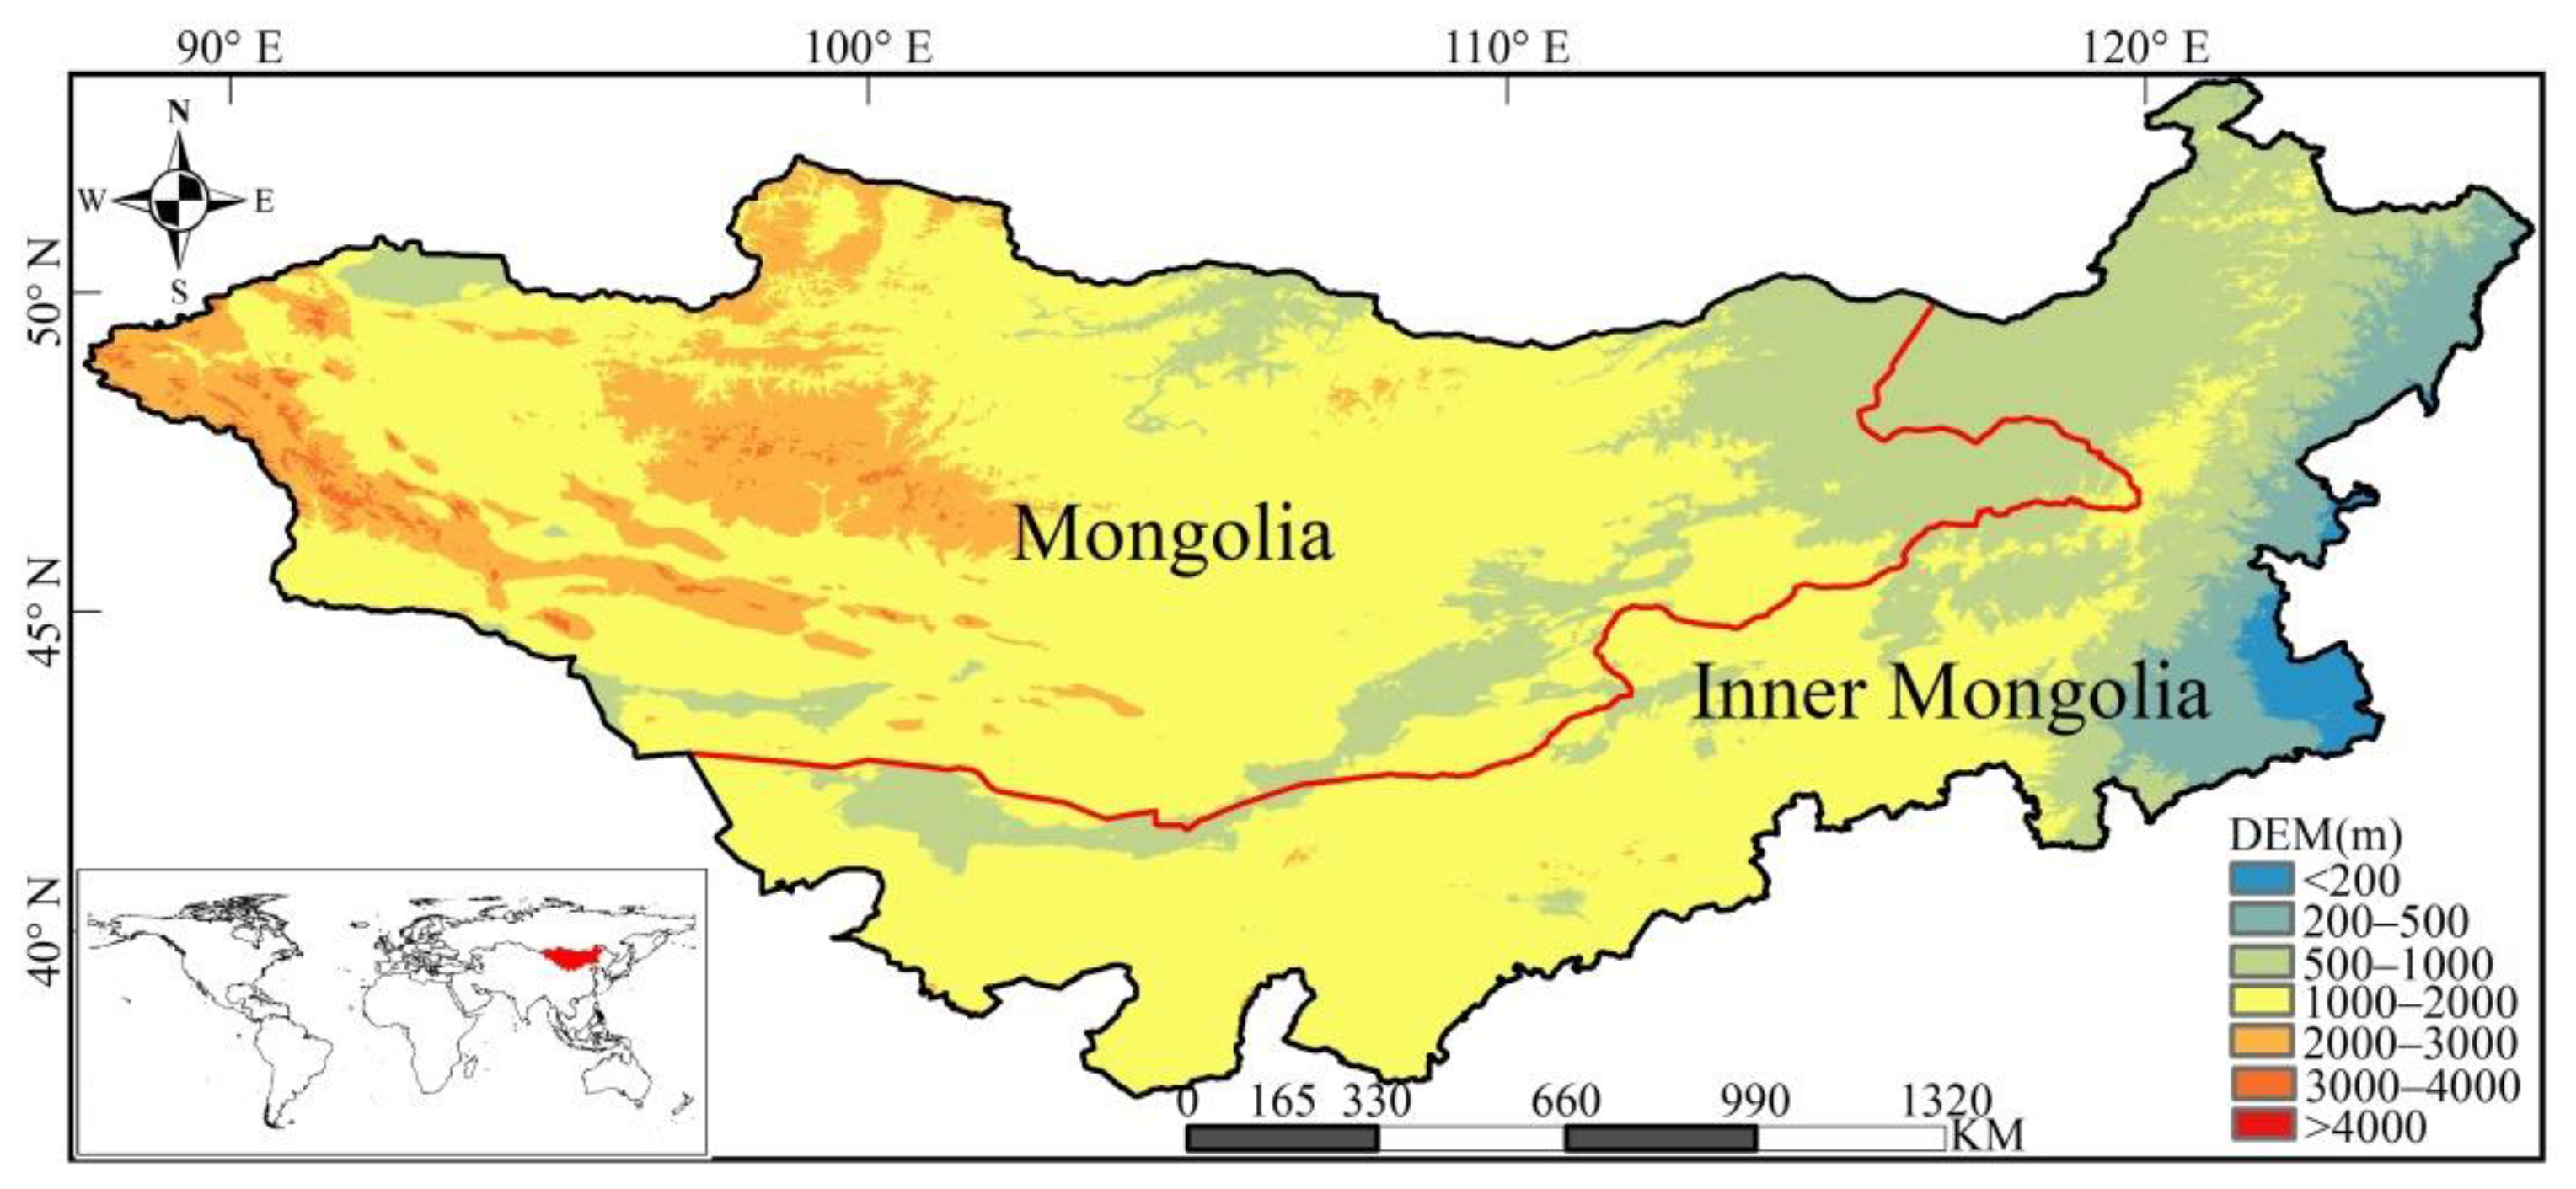
2.1. Study Region
2.2. Data Sources
2.2.1. scPDSI Dataset
2.2.2. Climate Indices
2.3. Methods
2.3.1. scPDSI
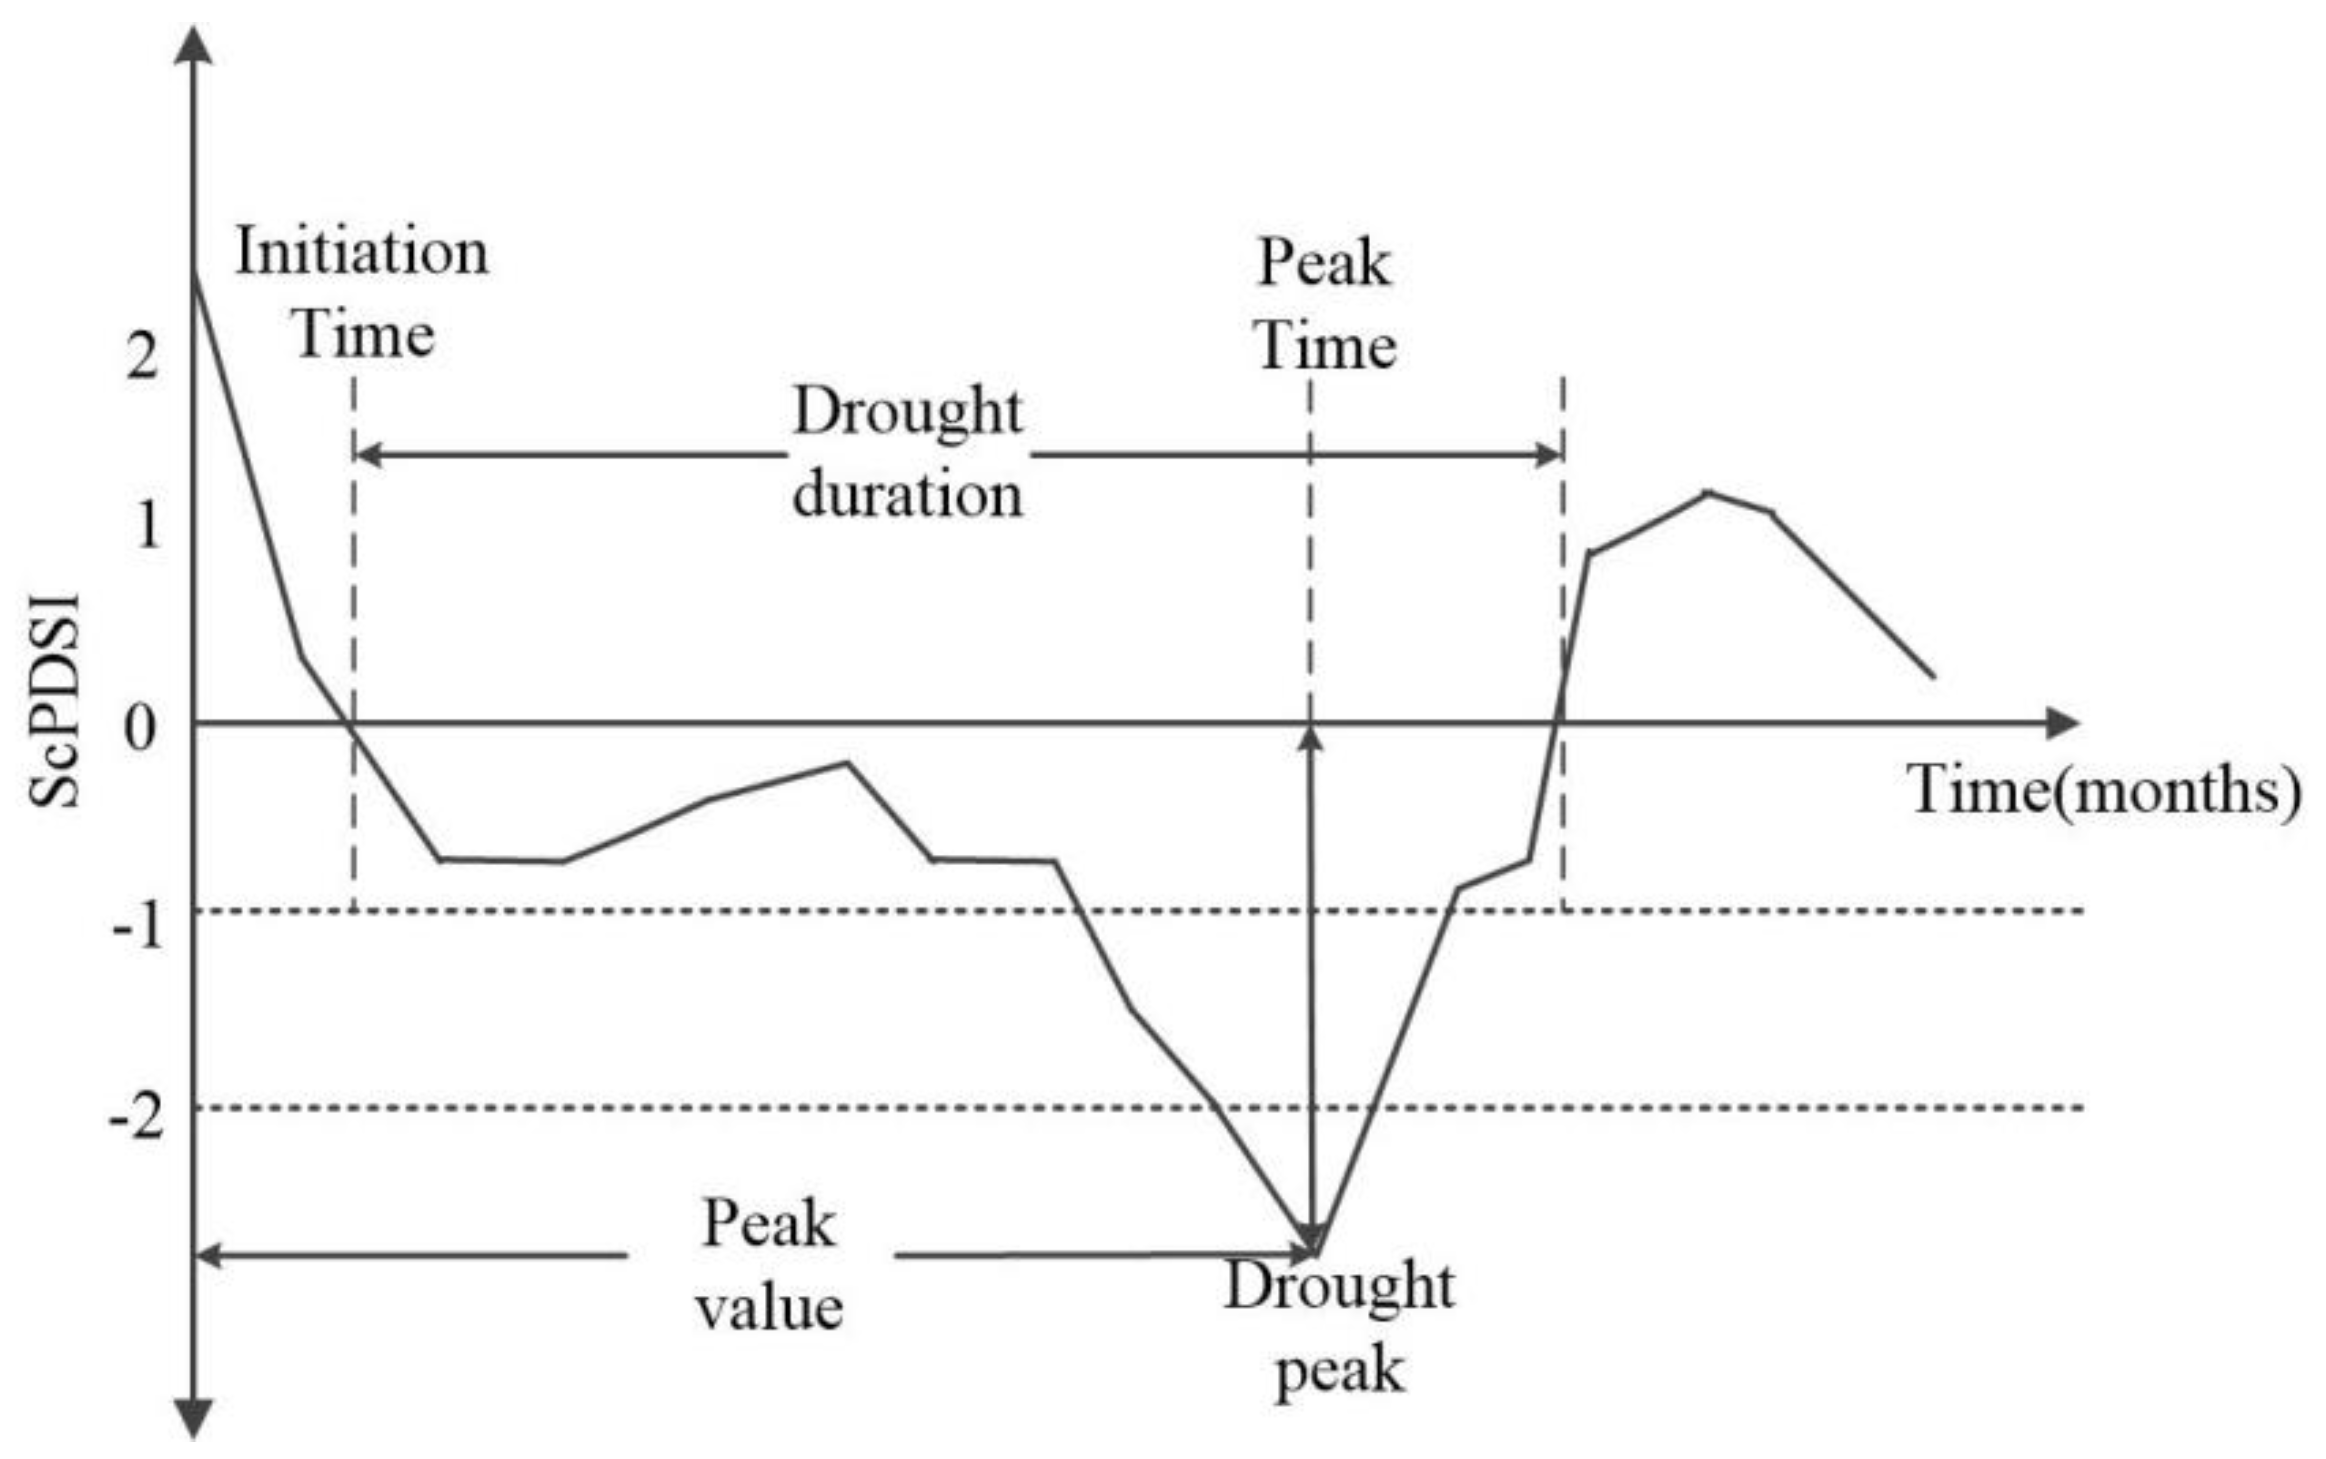
2.3.2. Identification of Drought Event Characteristics
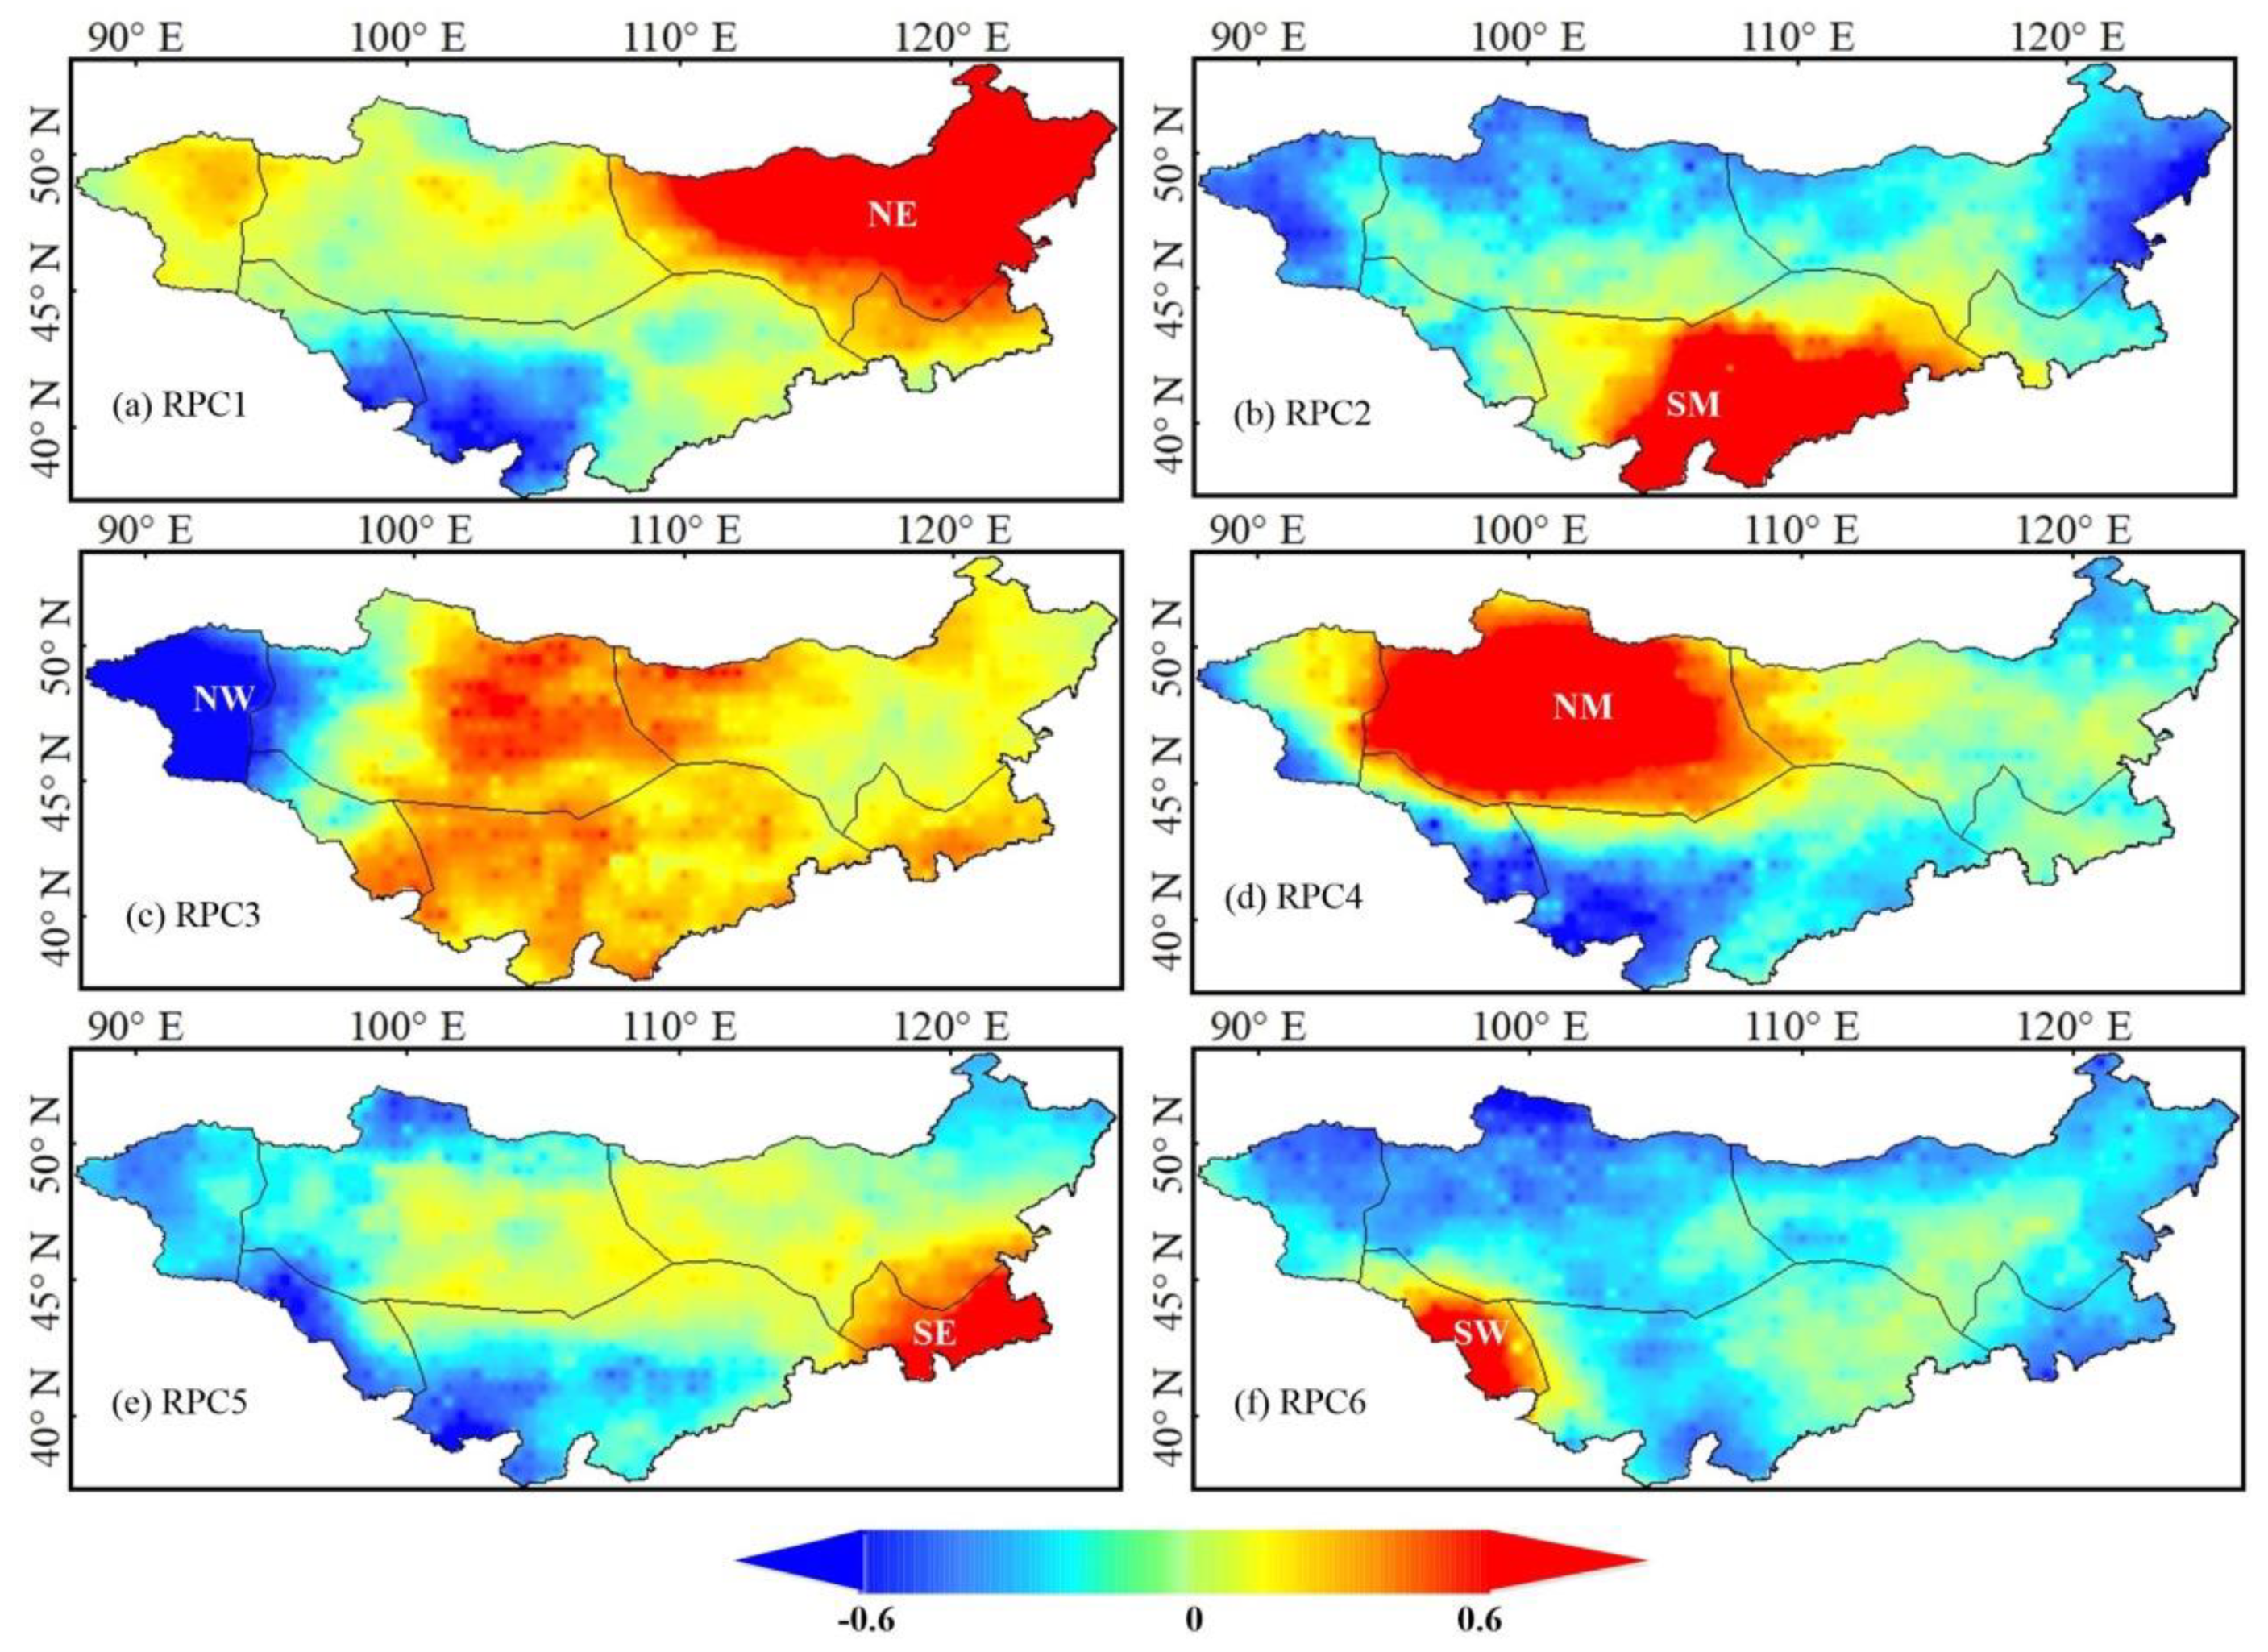
2.3.3. Sub-Regional Division
2.3.4. Mann–Kendall Test and Sen’s Slope
2.3.5. Wavelet Analysis
2.3.6. Local Regression
3. Results
3.1. Sub-Regional Division
3.2. Drought Characteristics Analysis
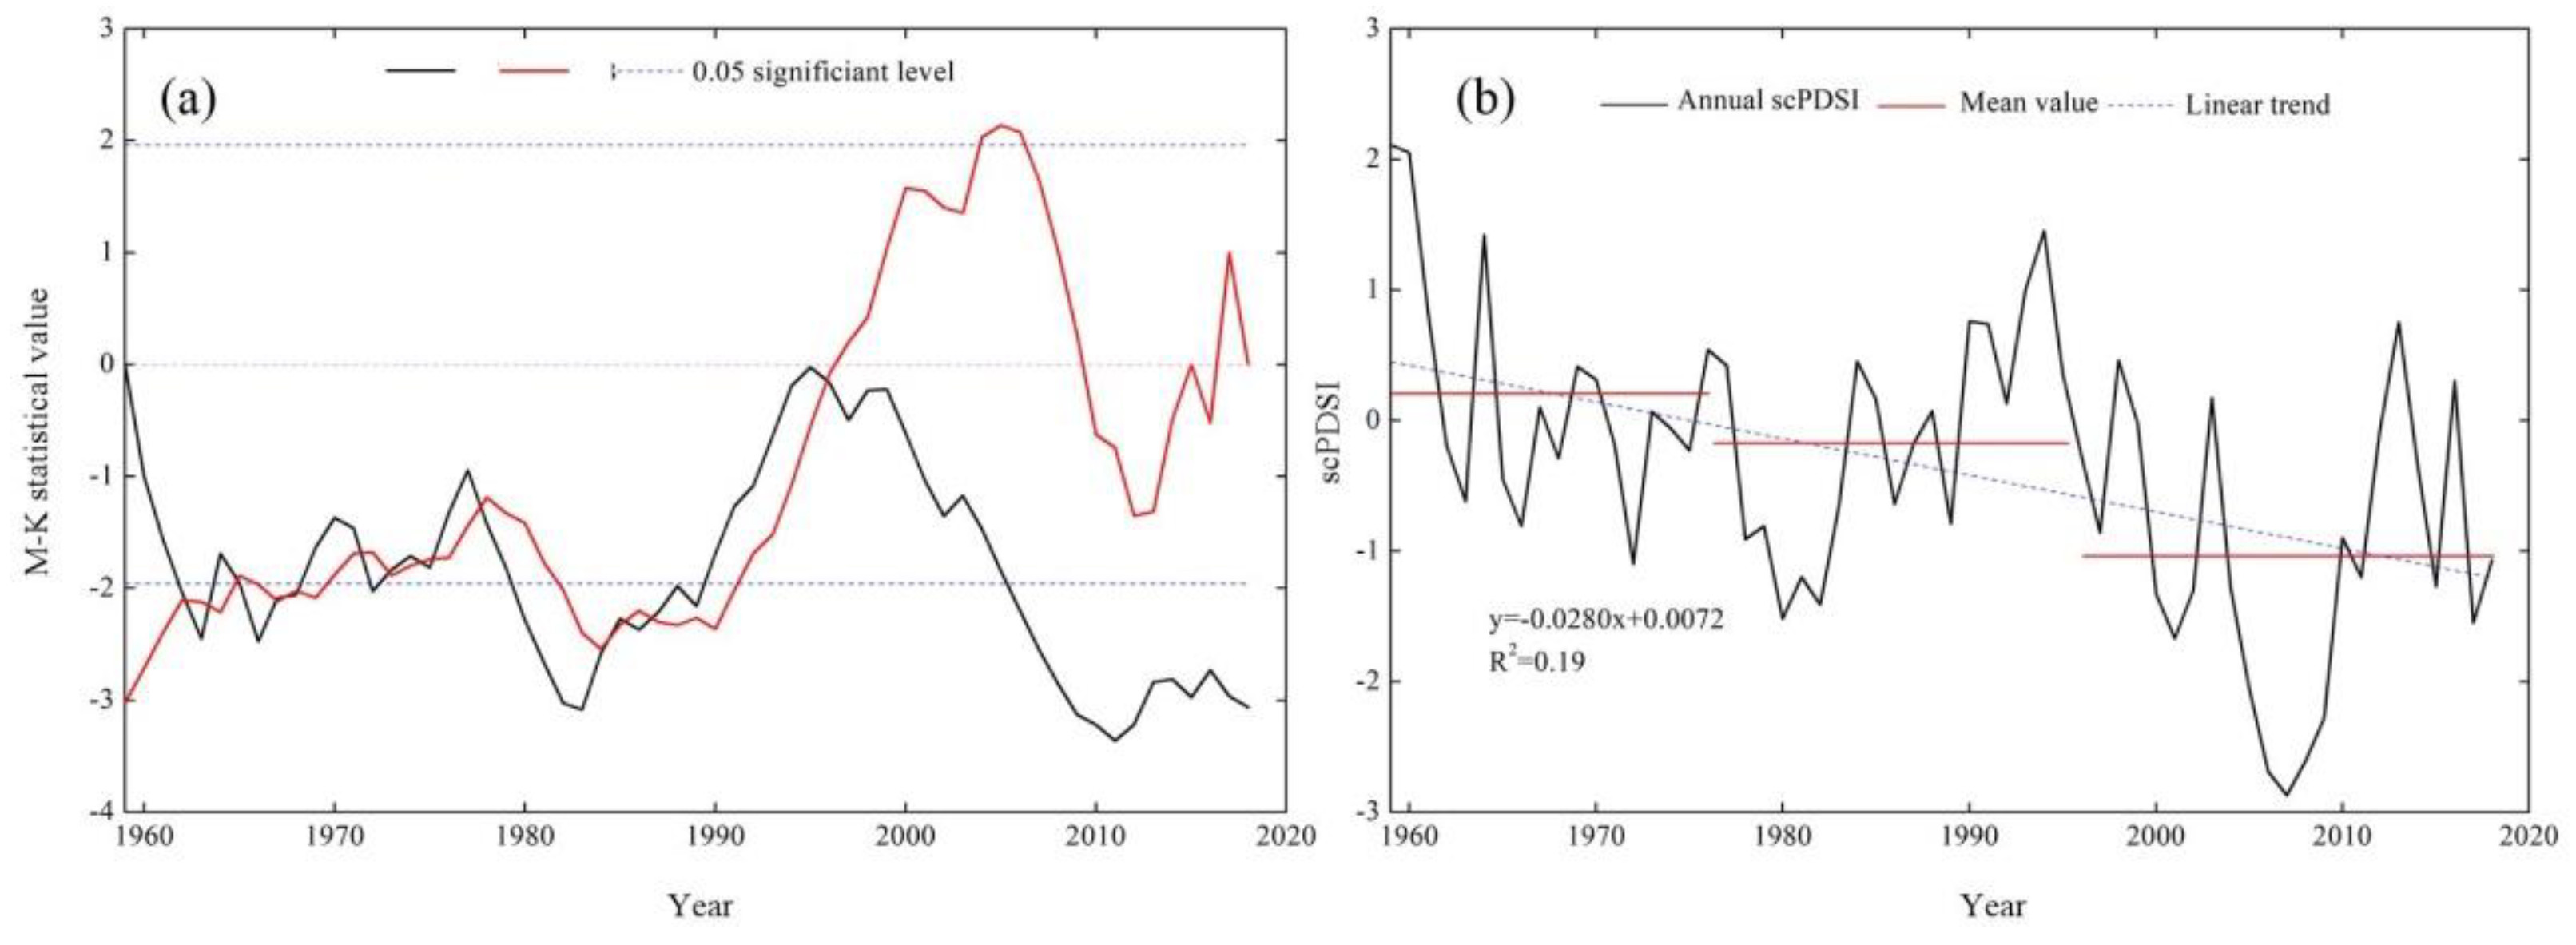
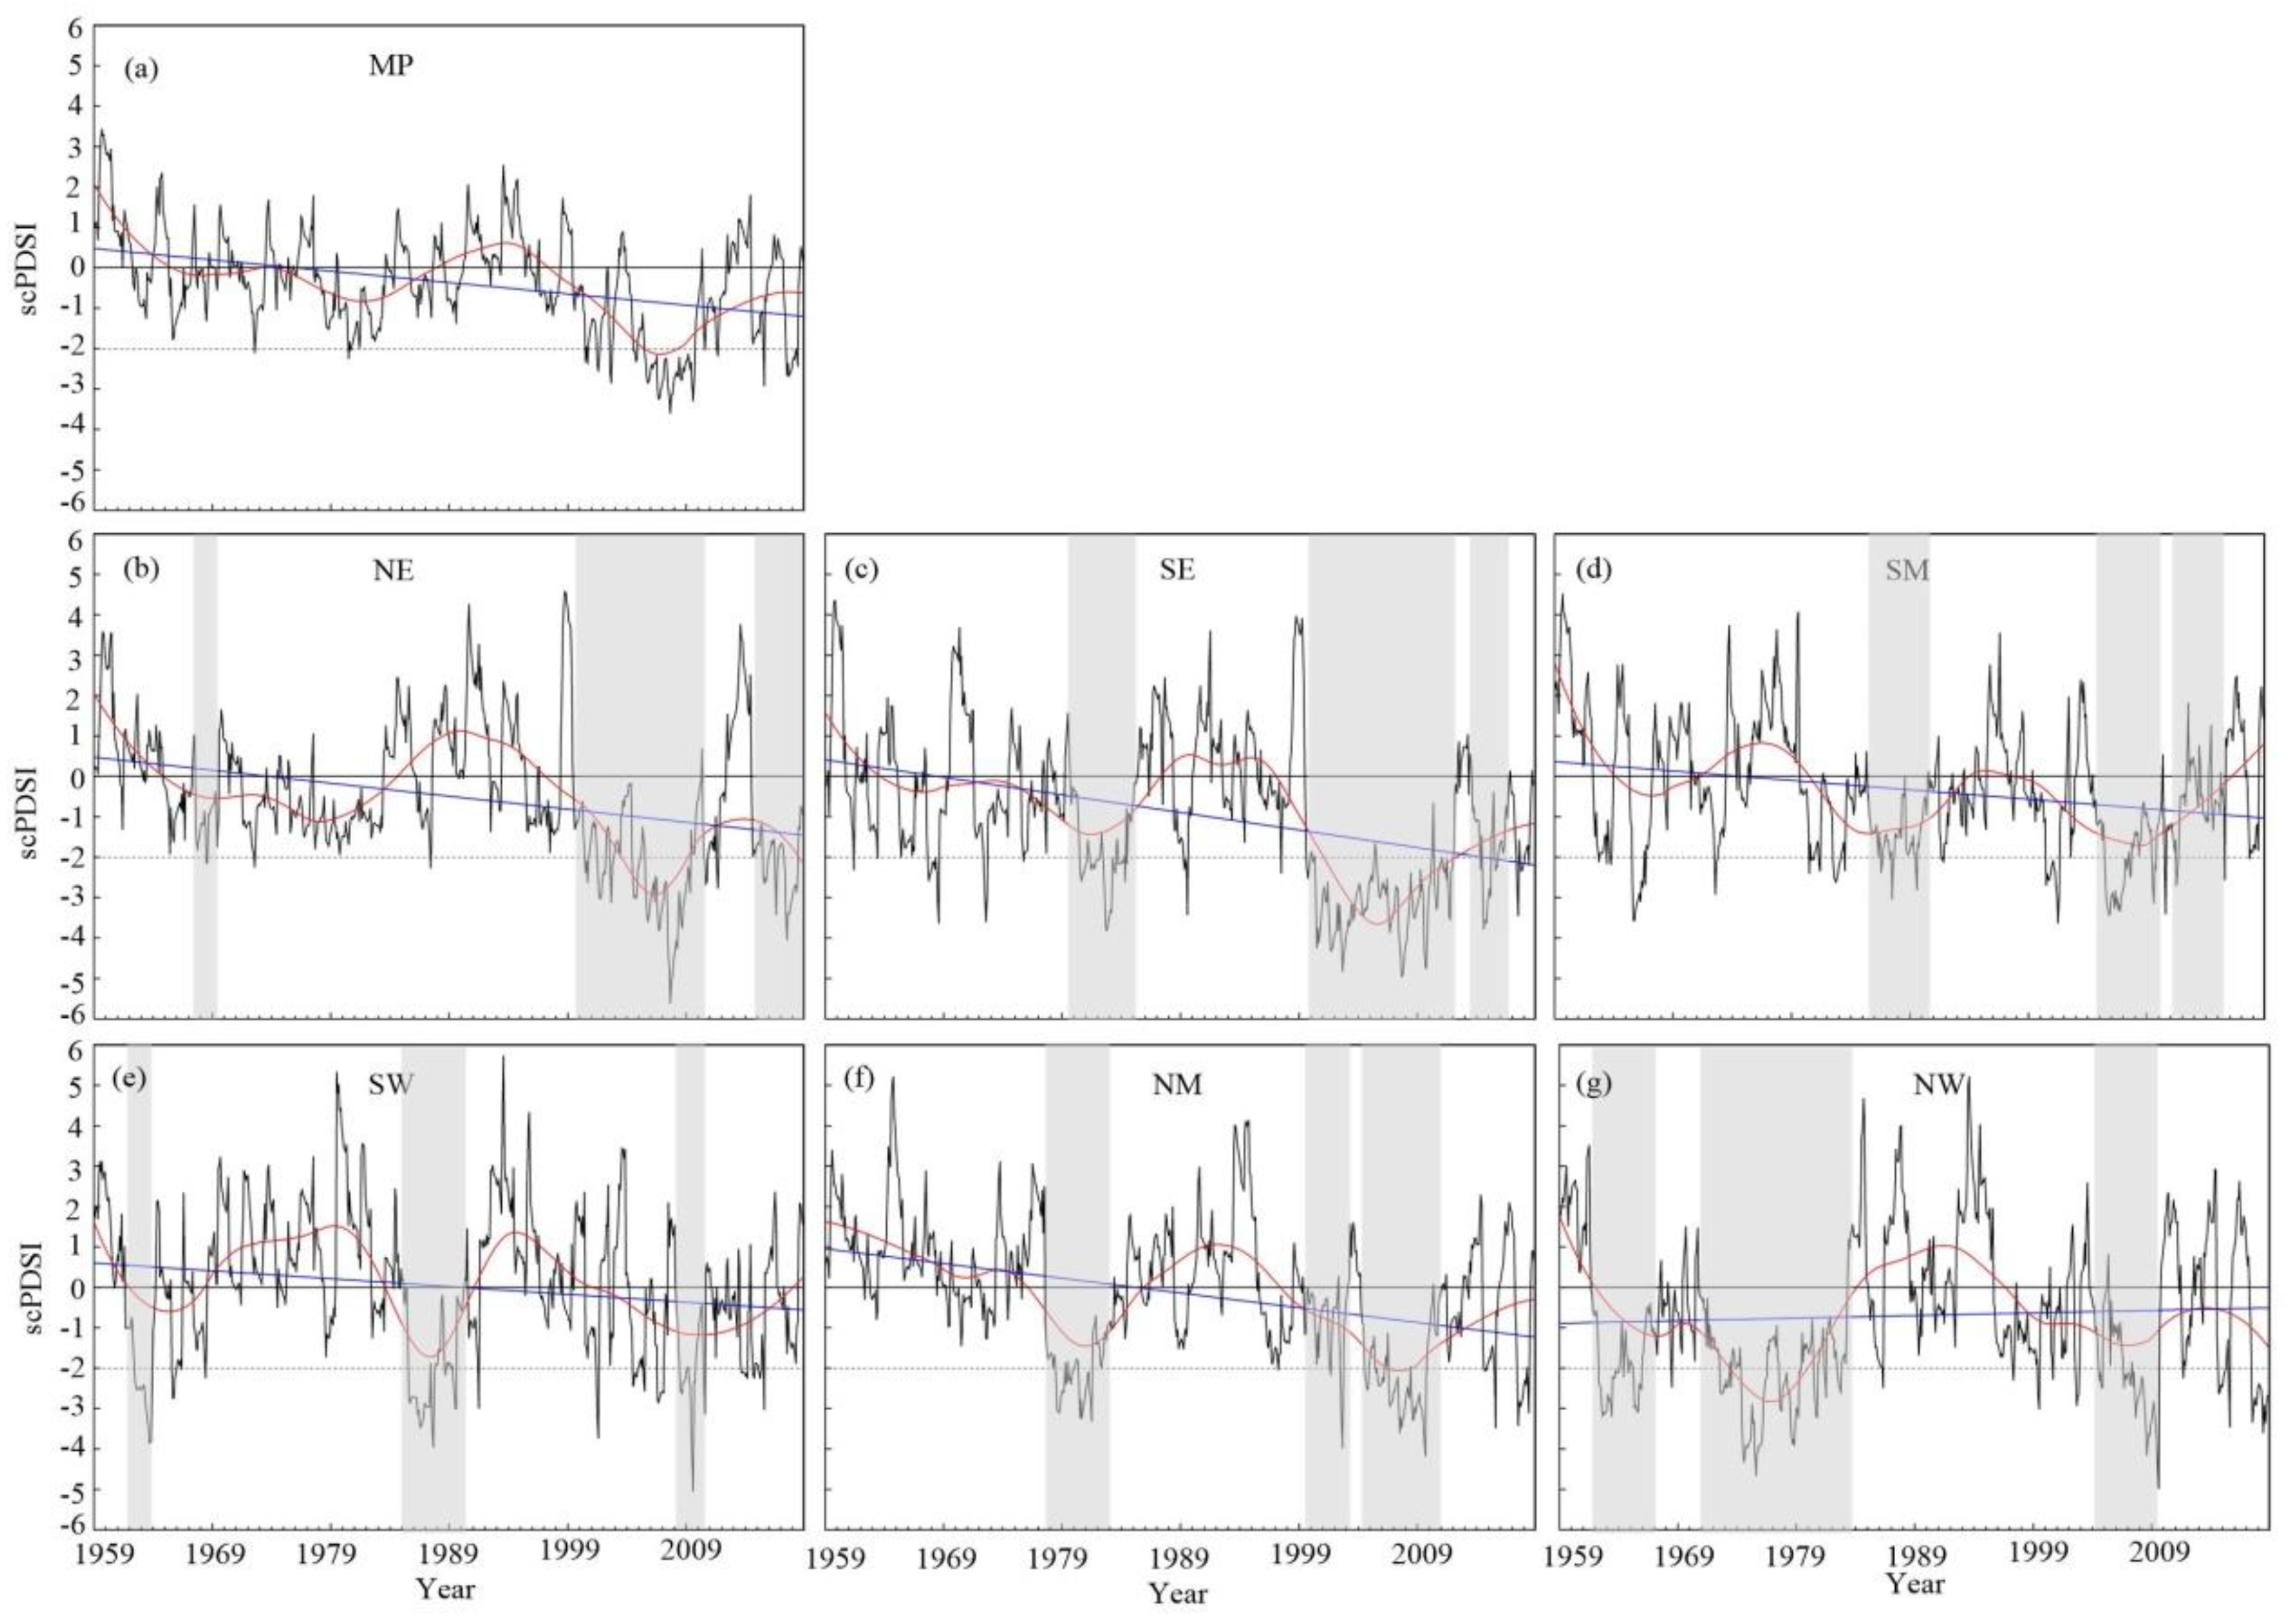
3.2.1. Drought Trend Analysis
3.2.2. Temporal Characteristics
3.2.3. Typical Drought Events
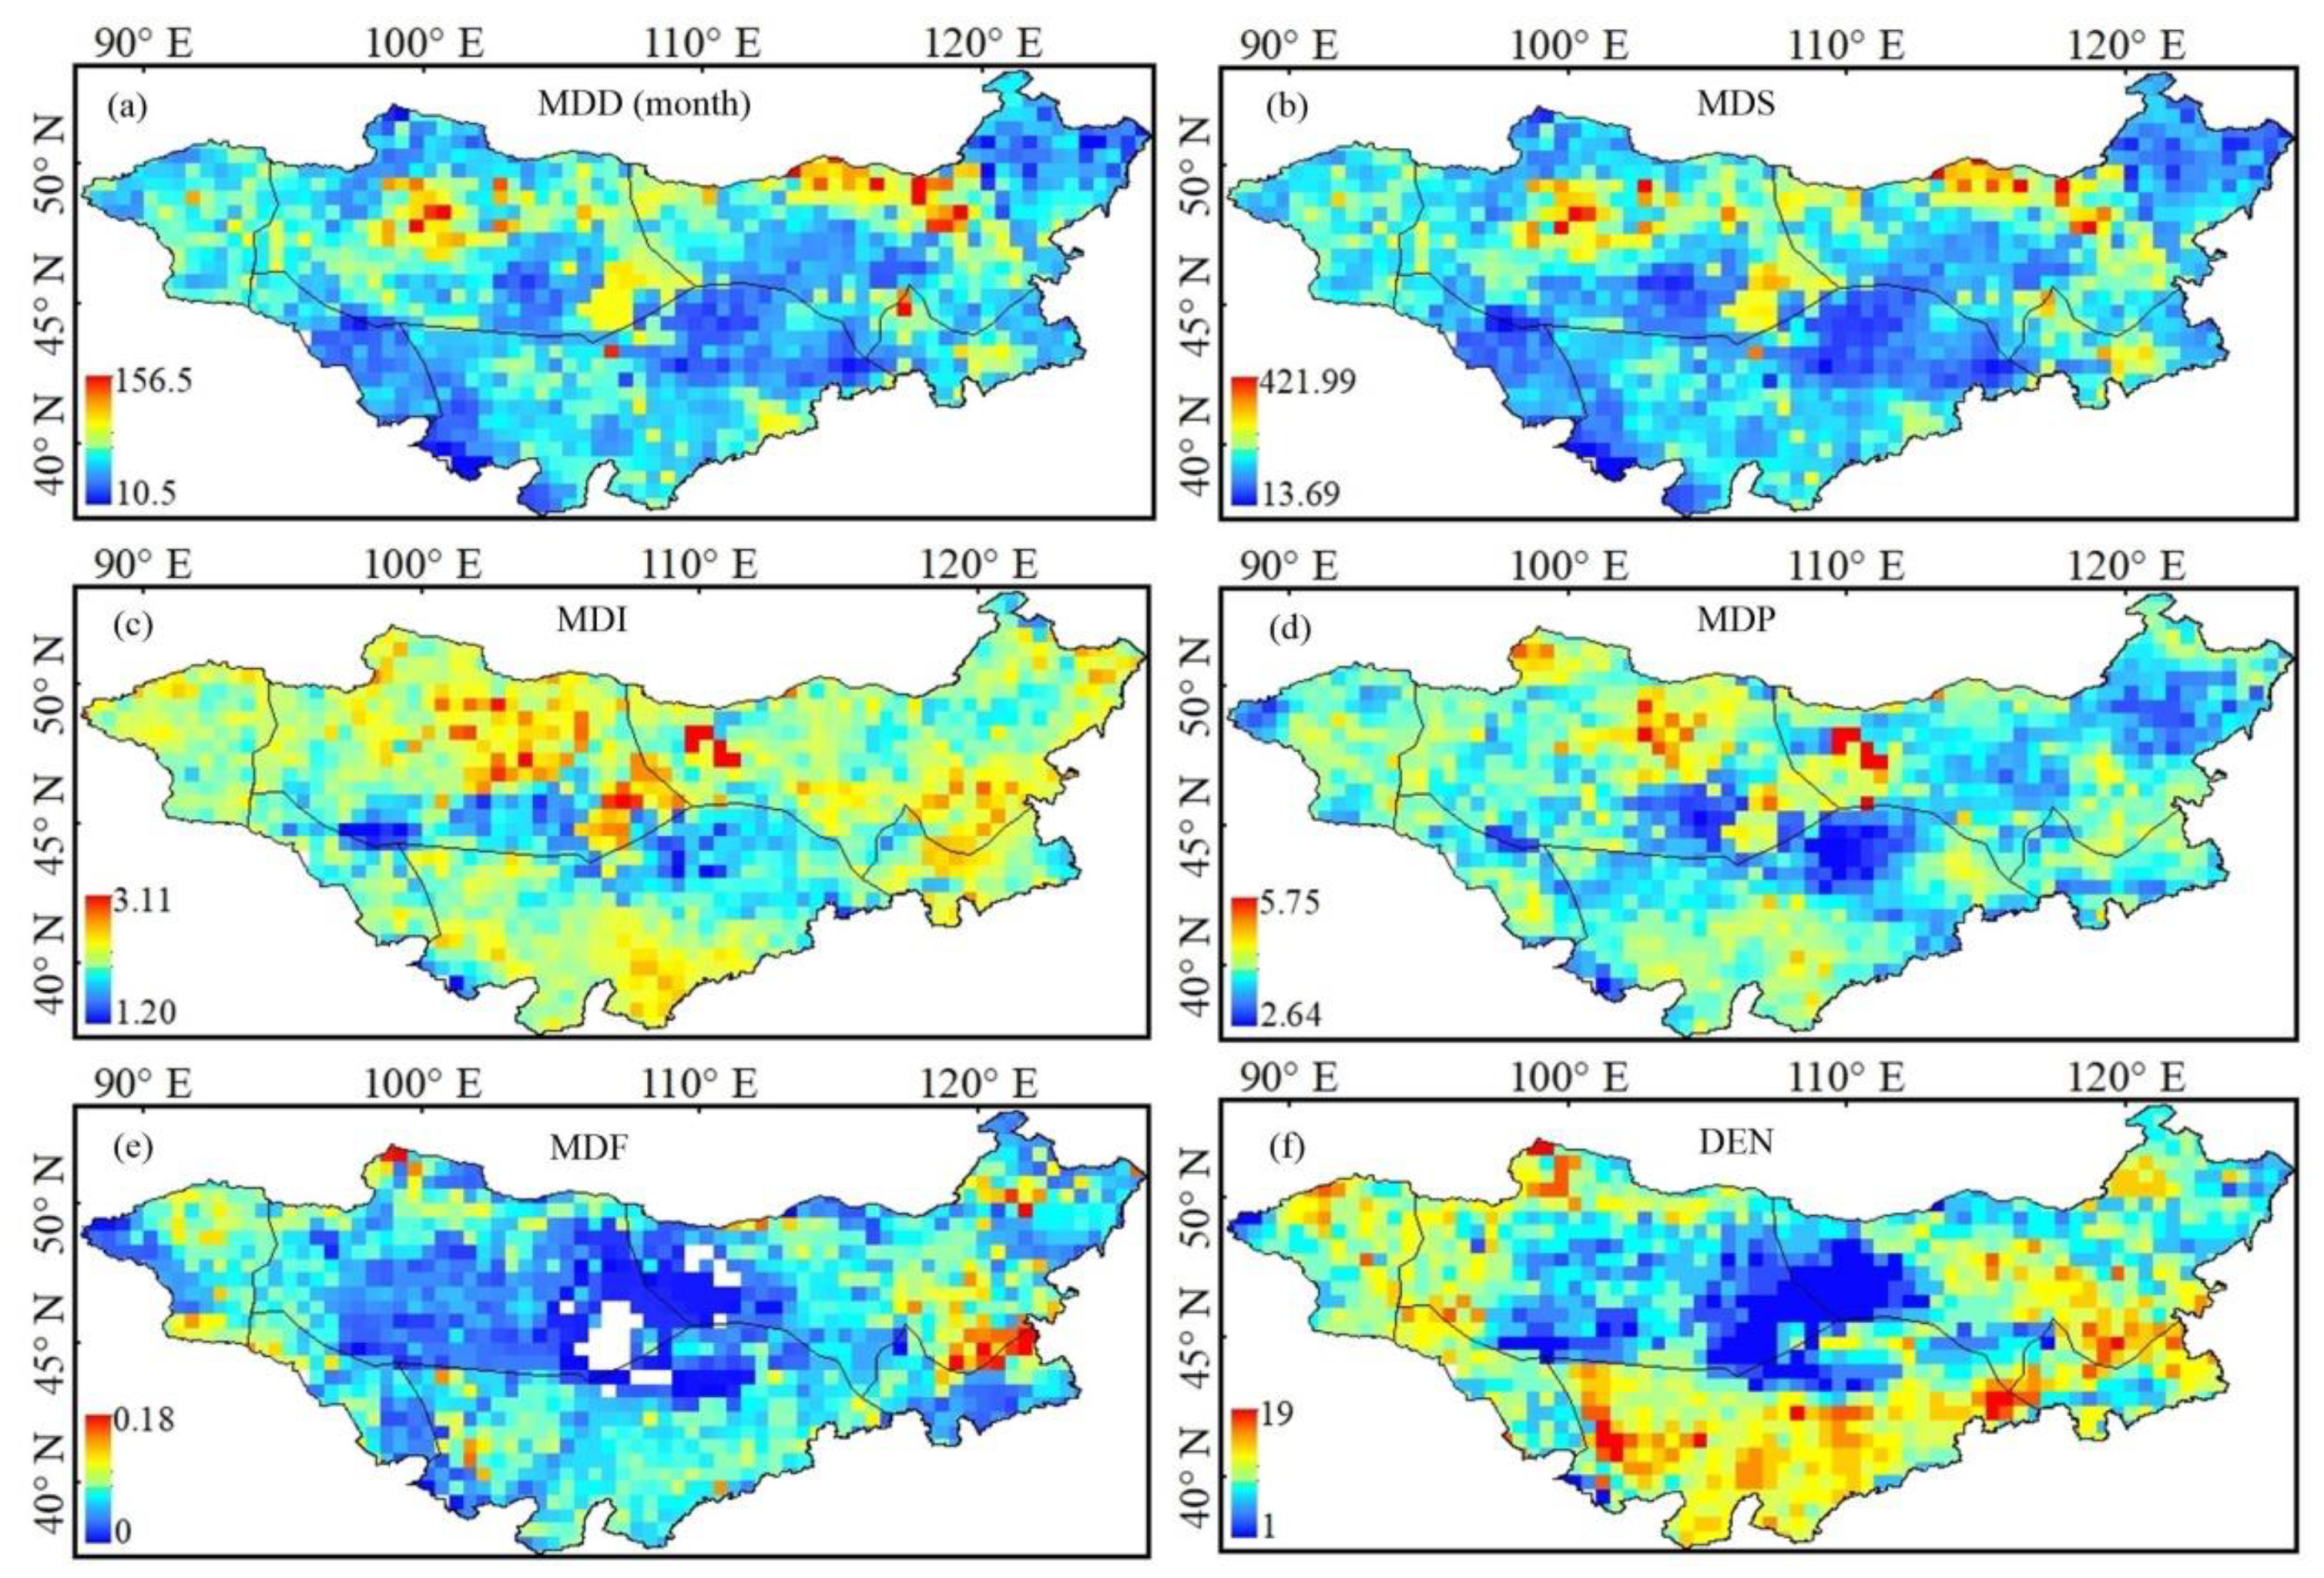
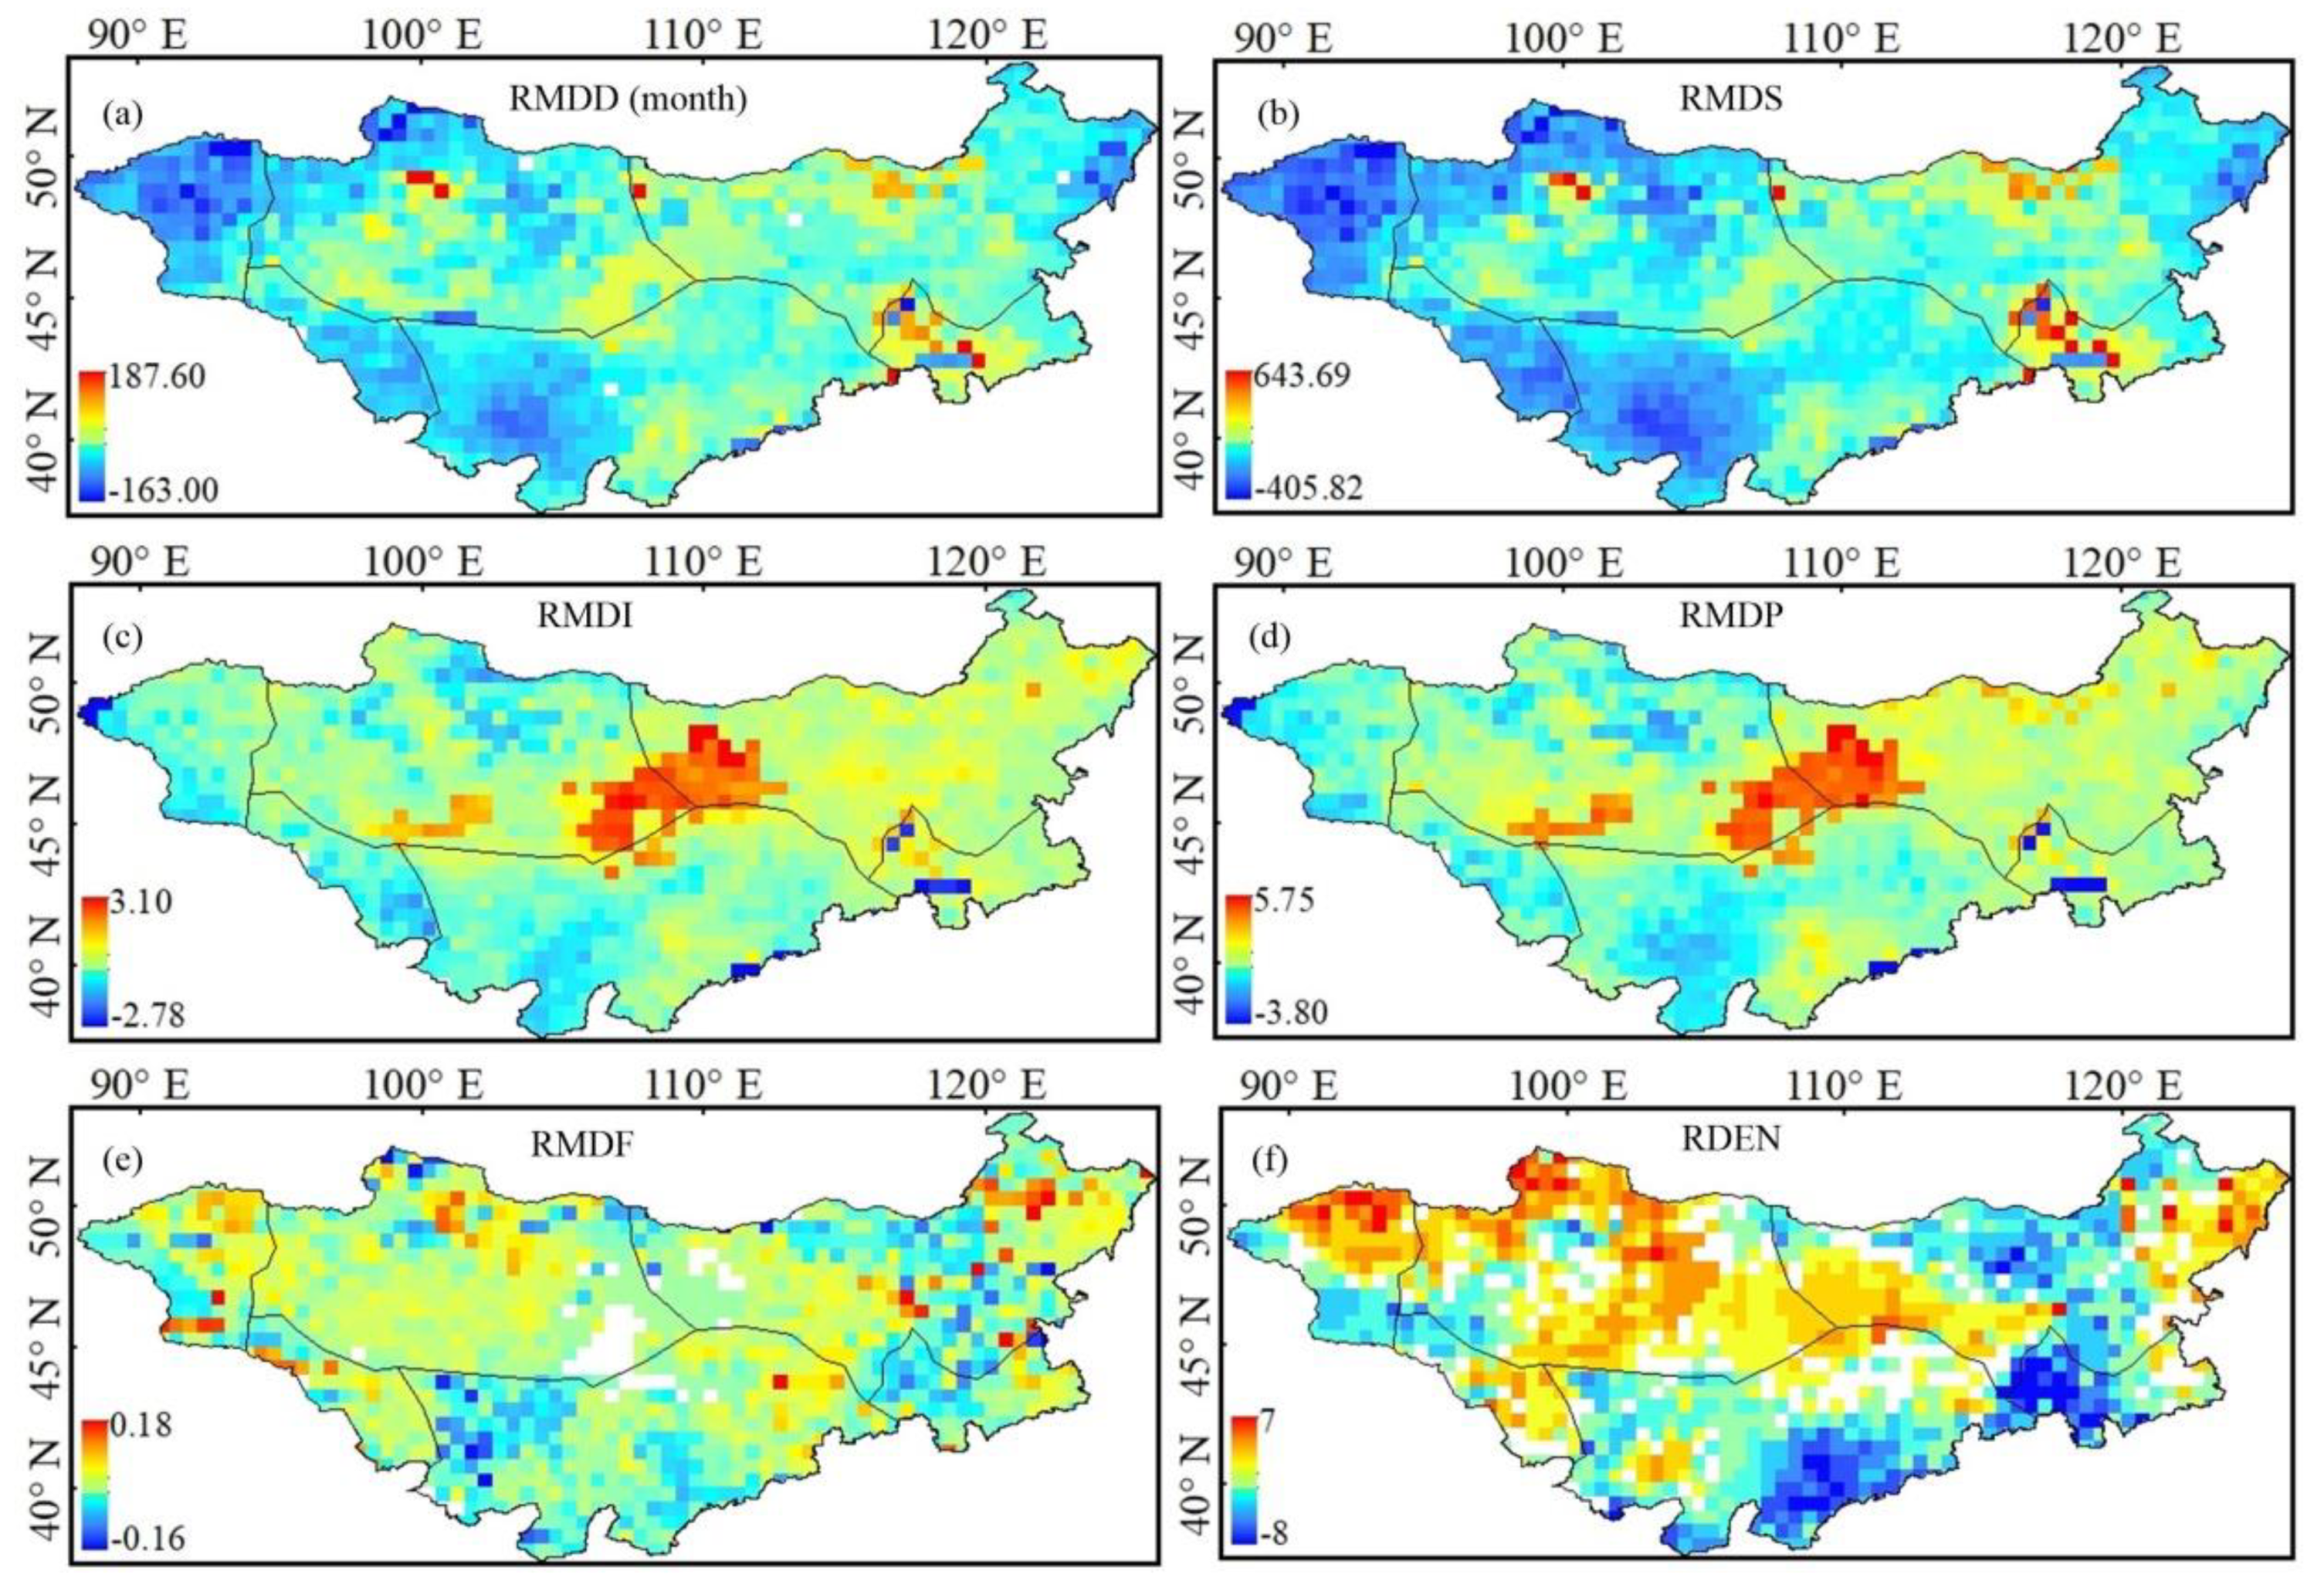
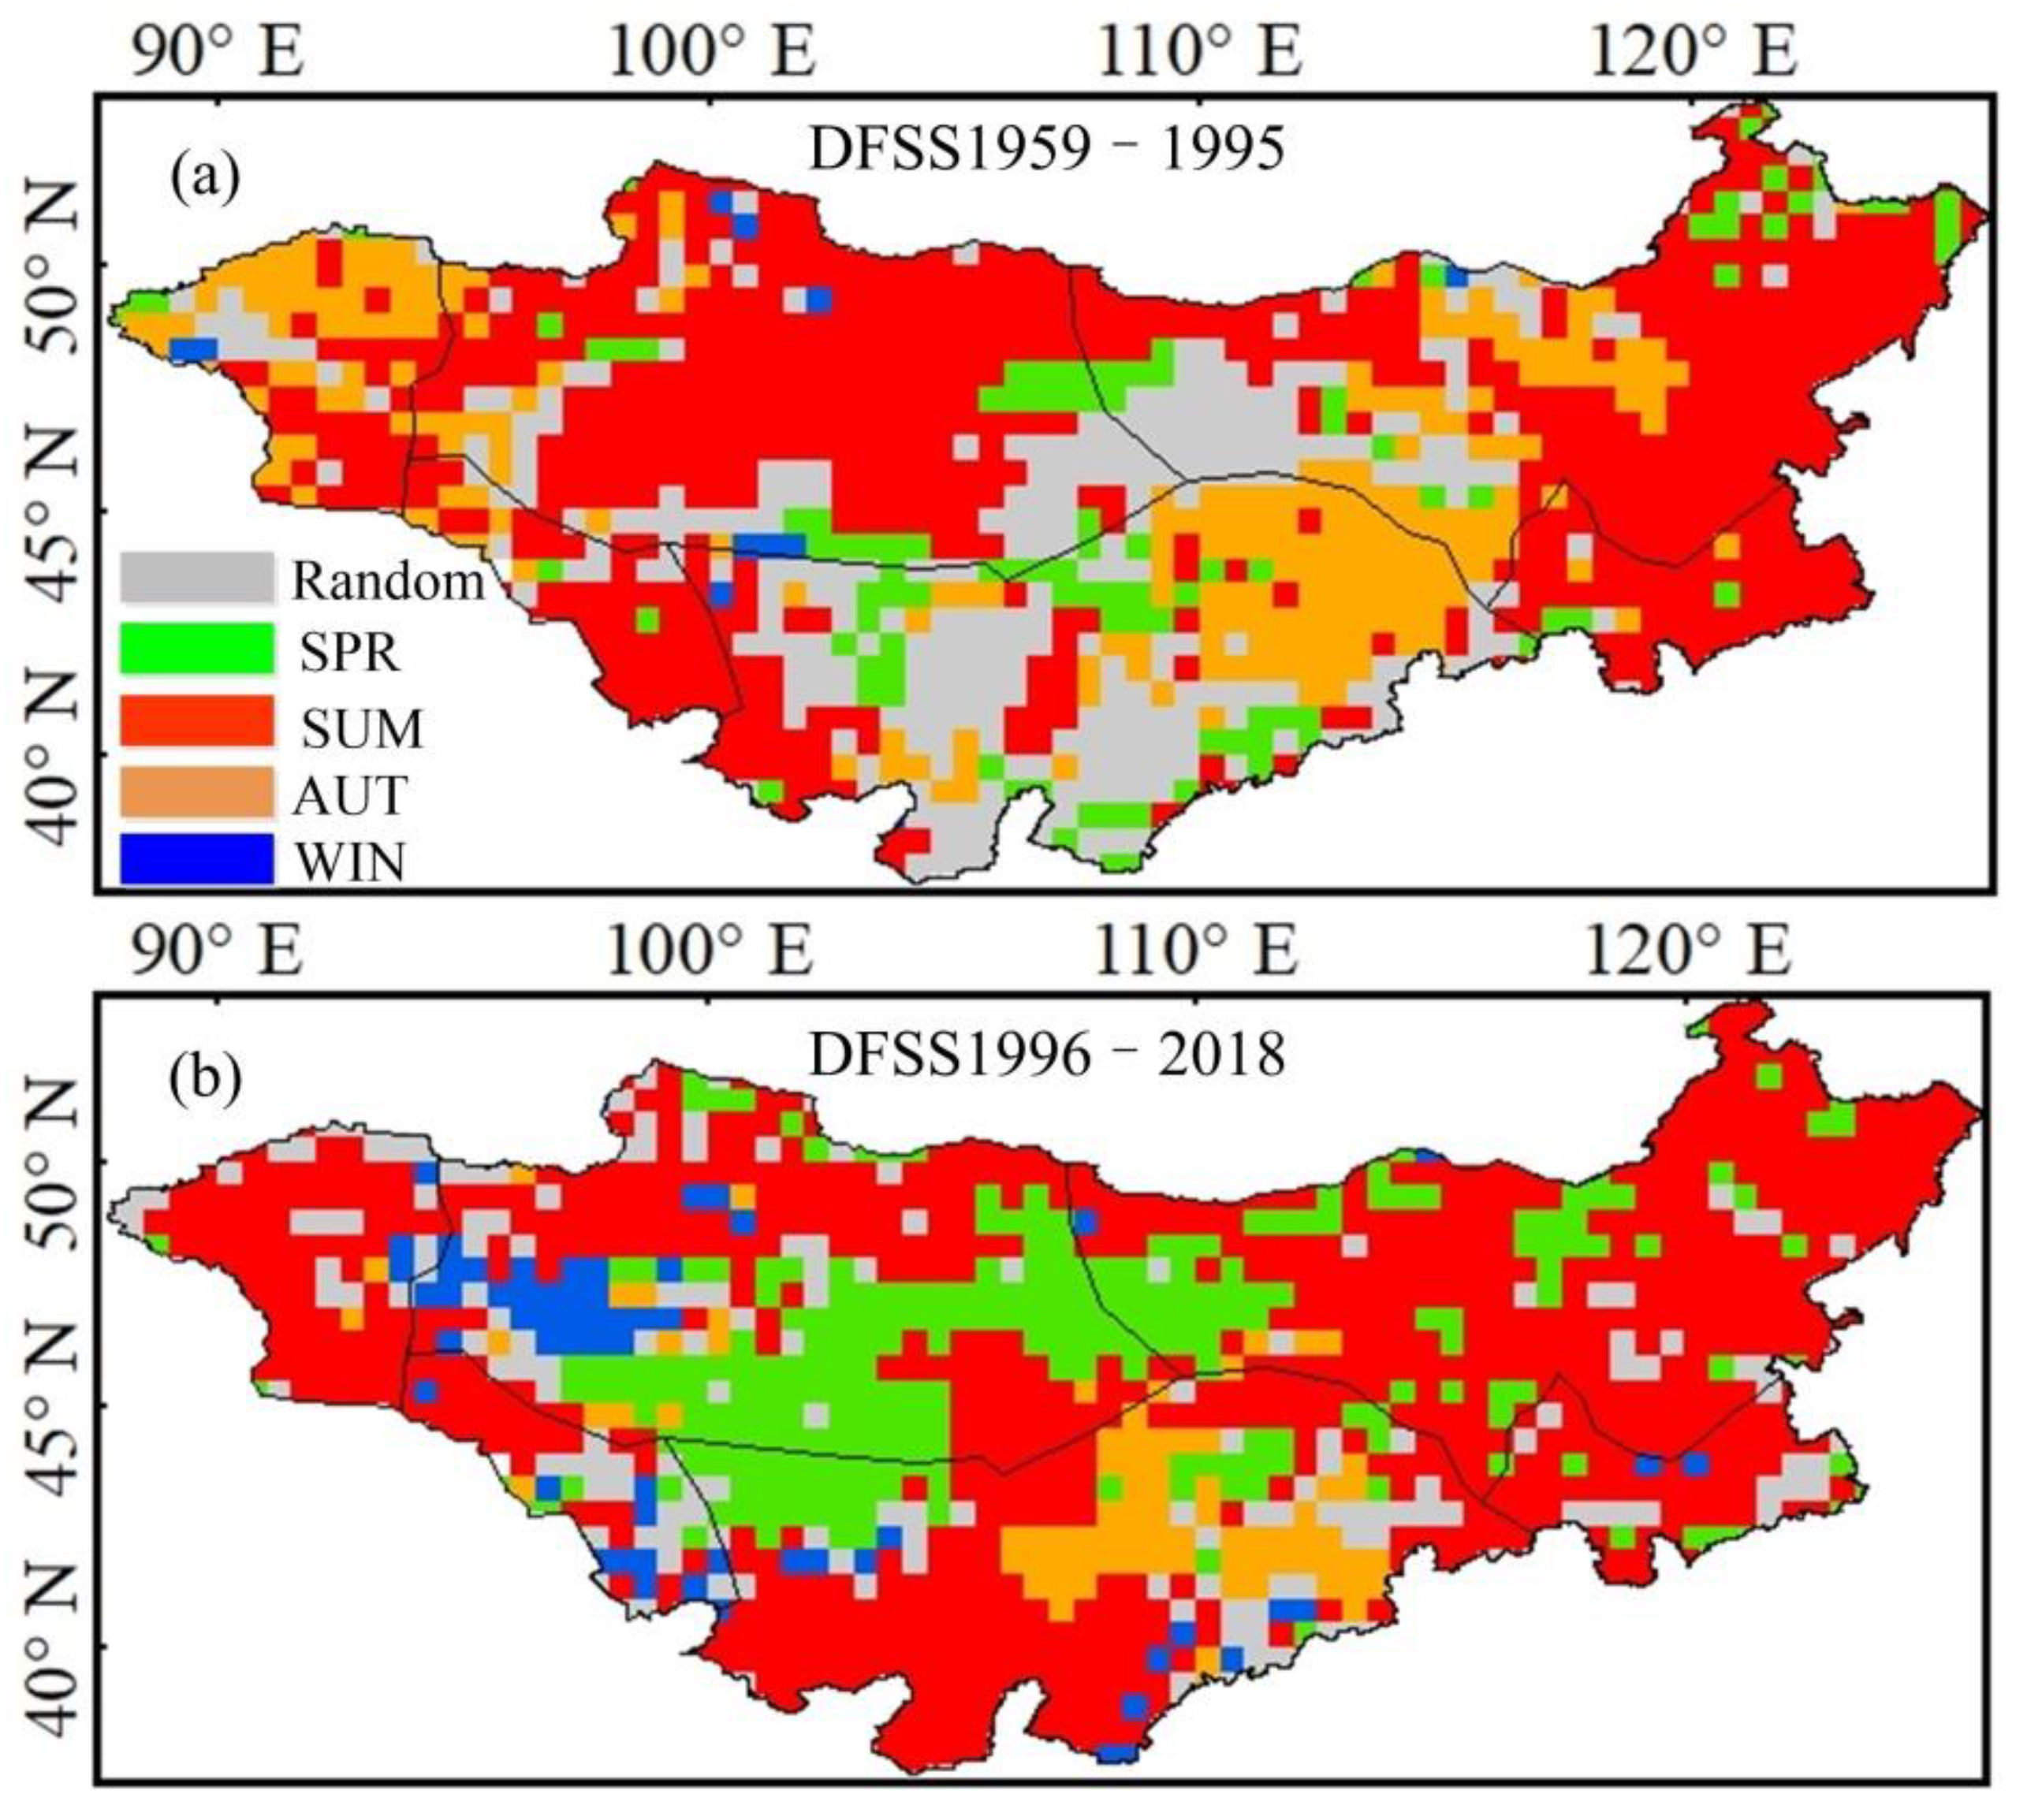
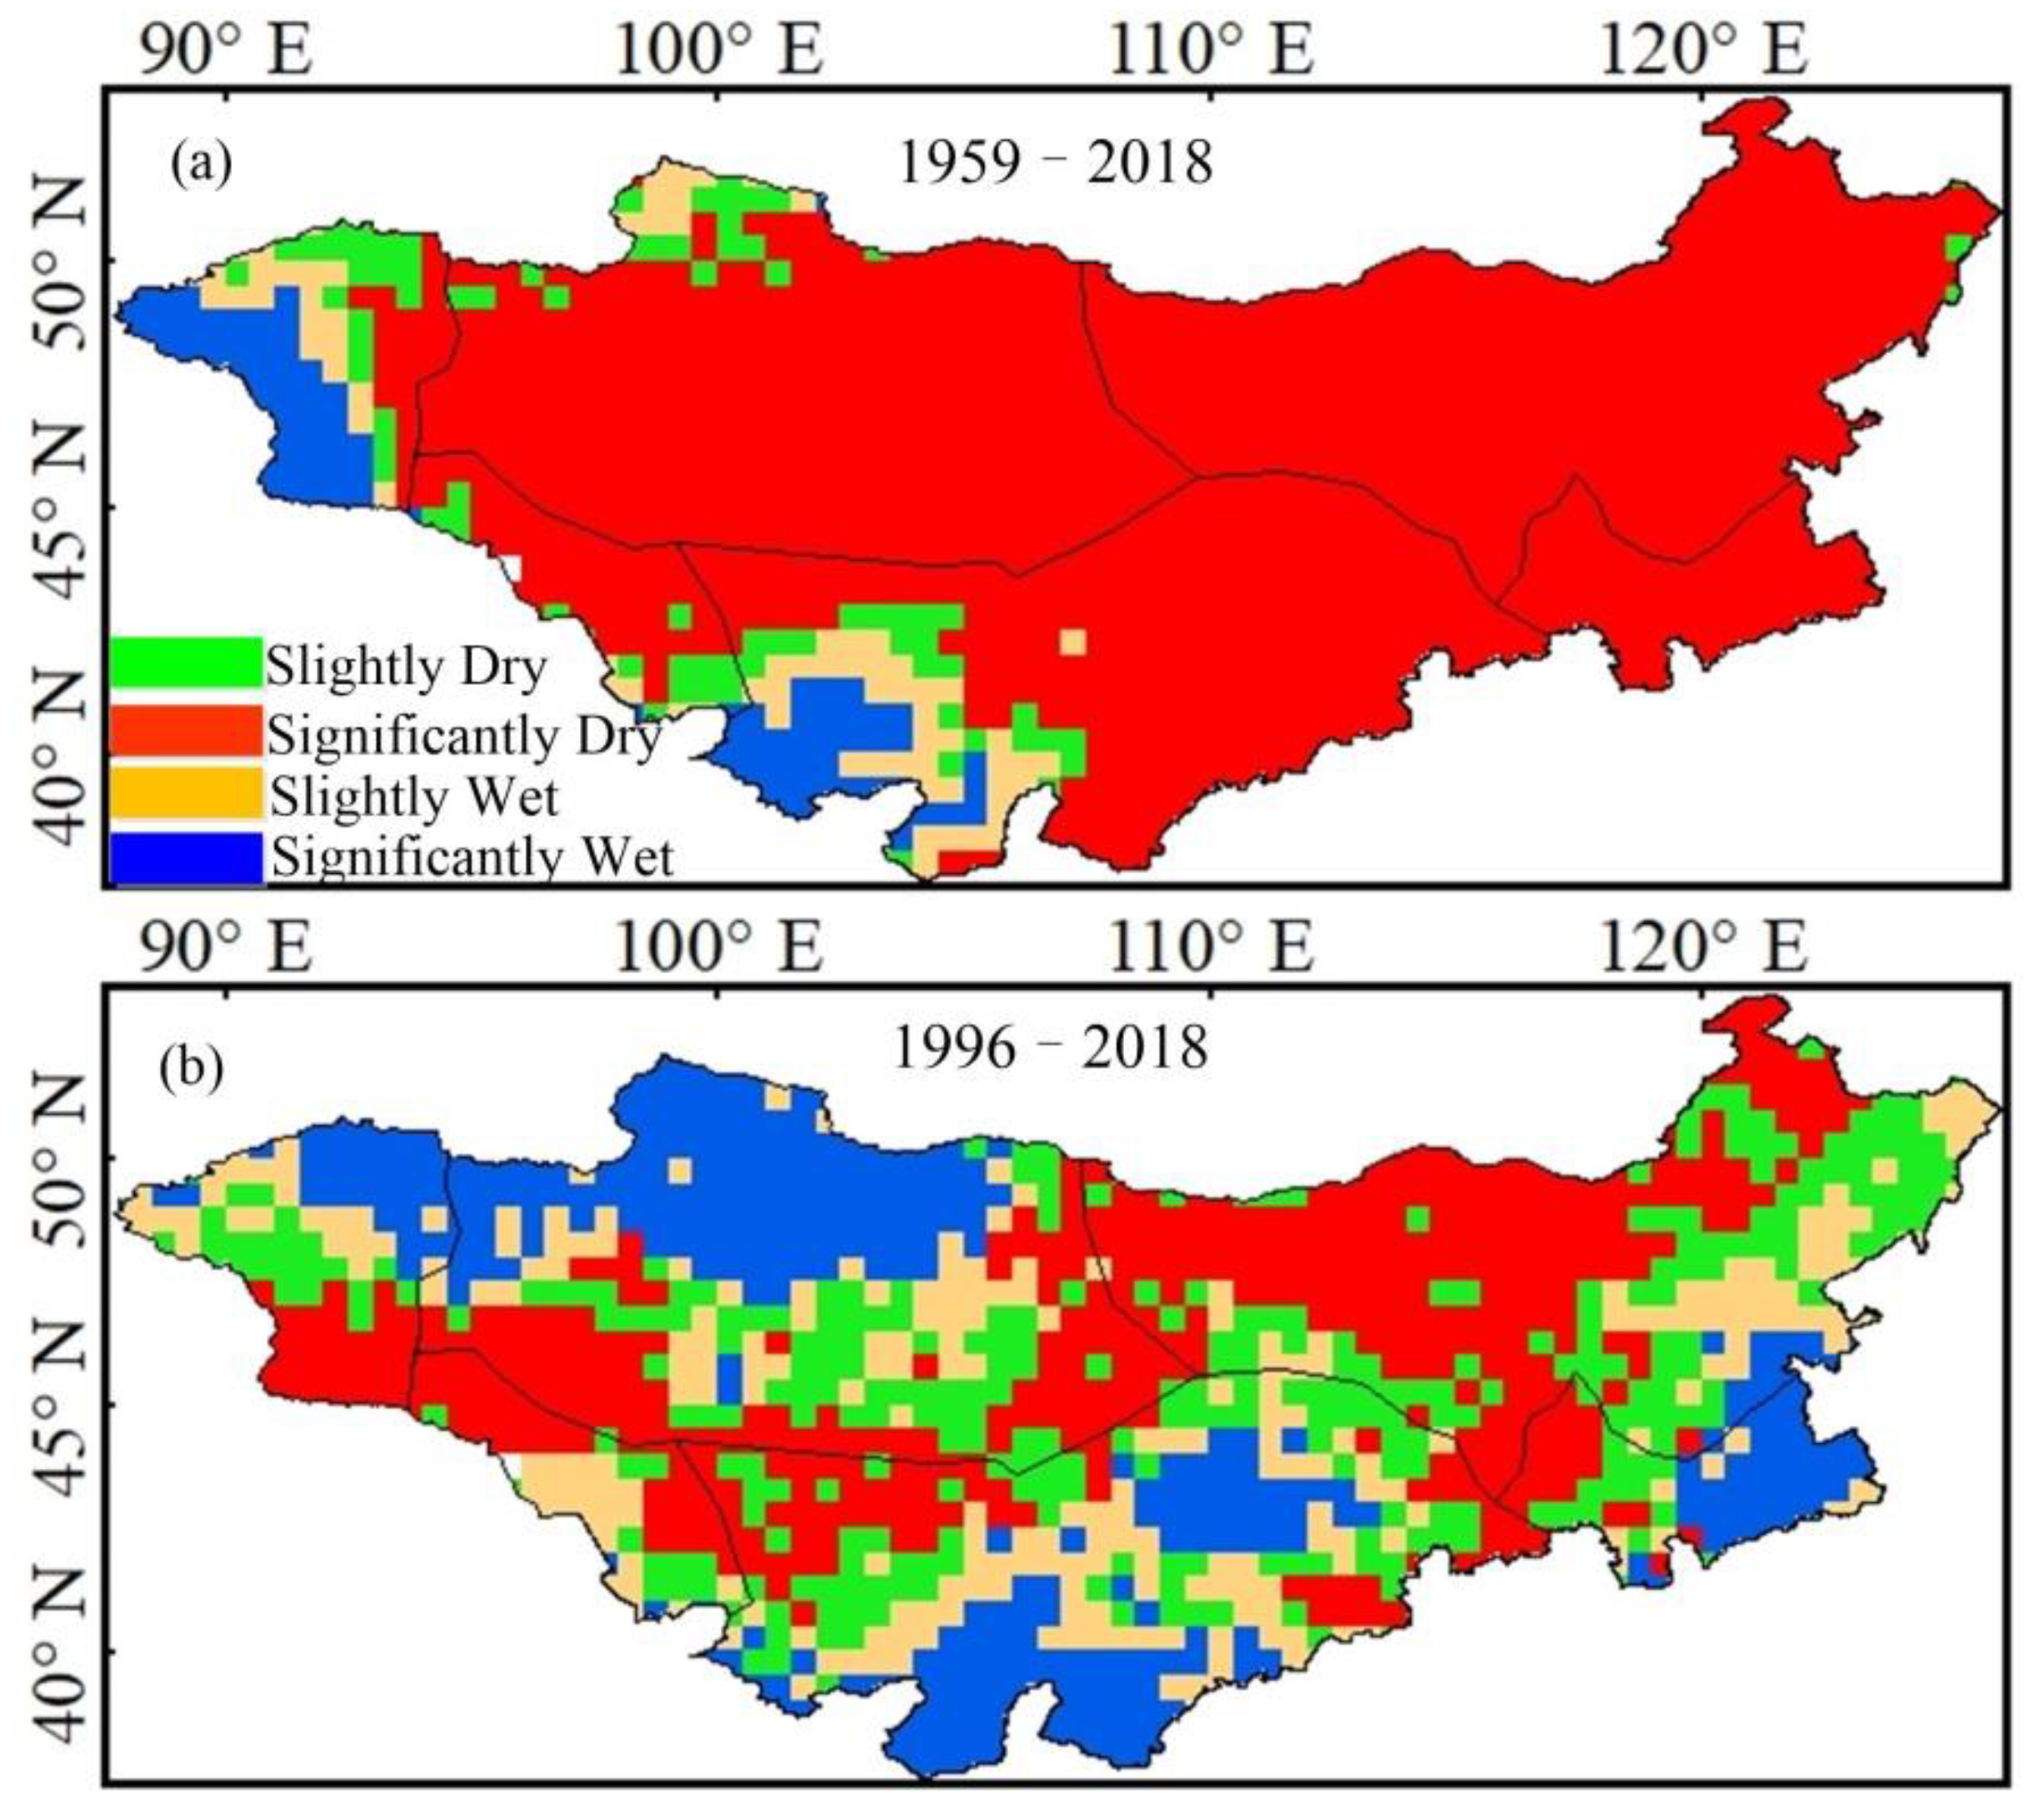
3.2.4. Spatial Characteristics
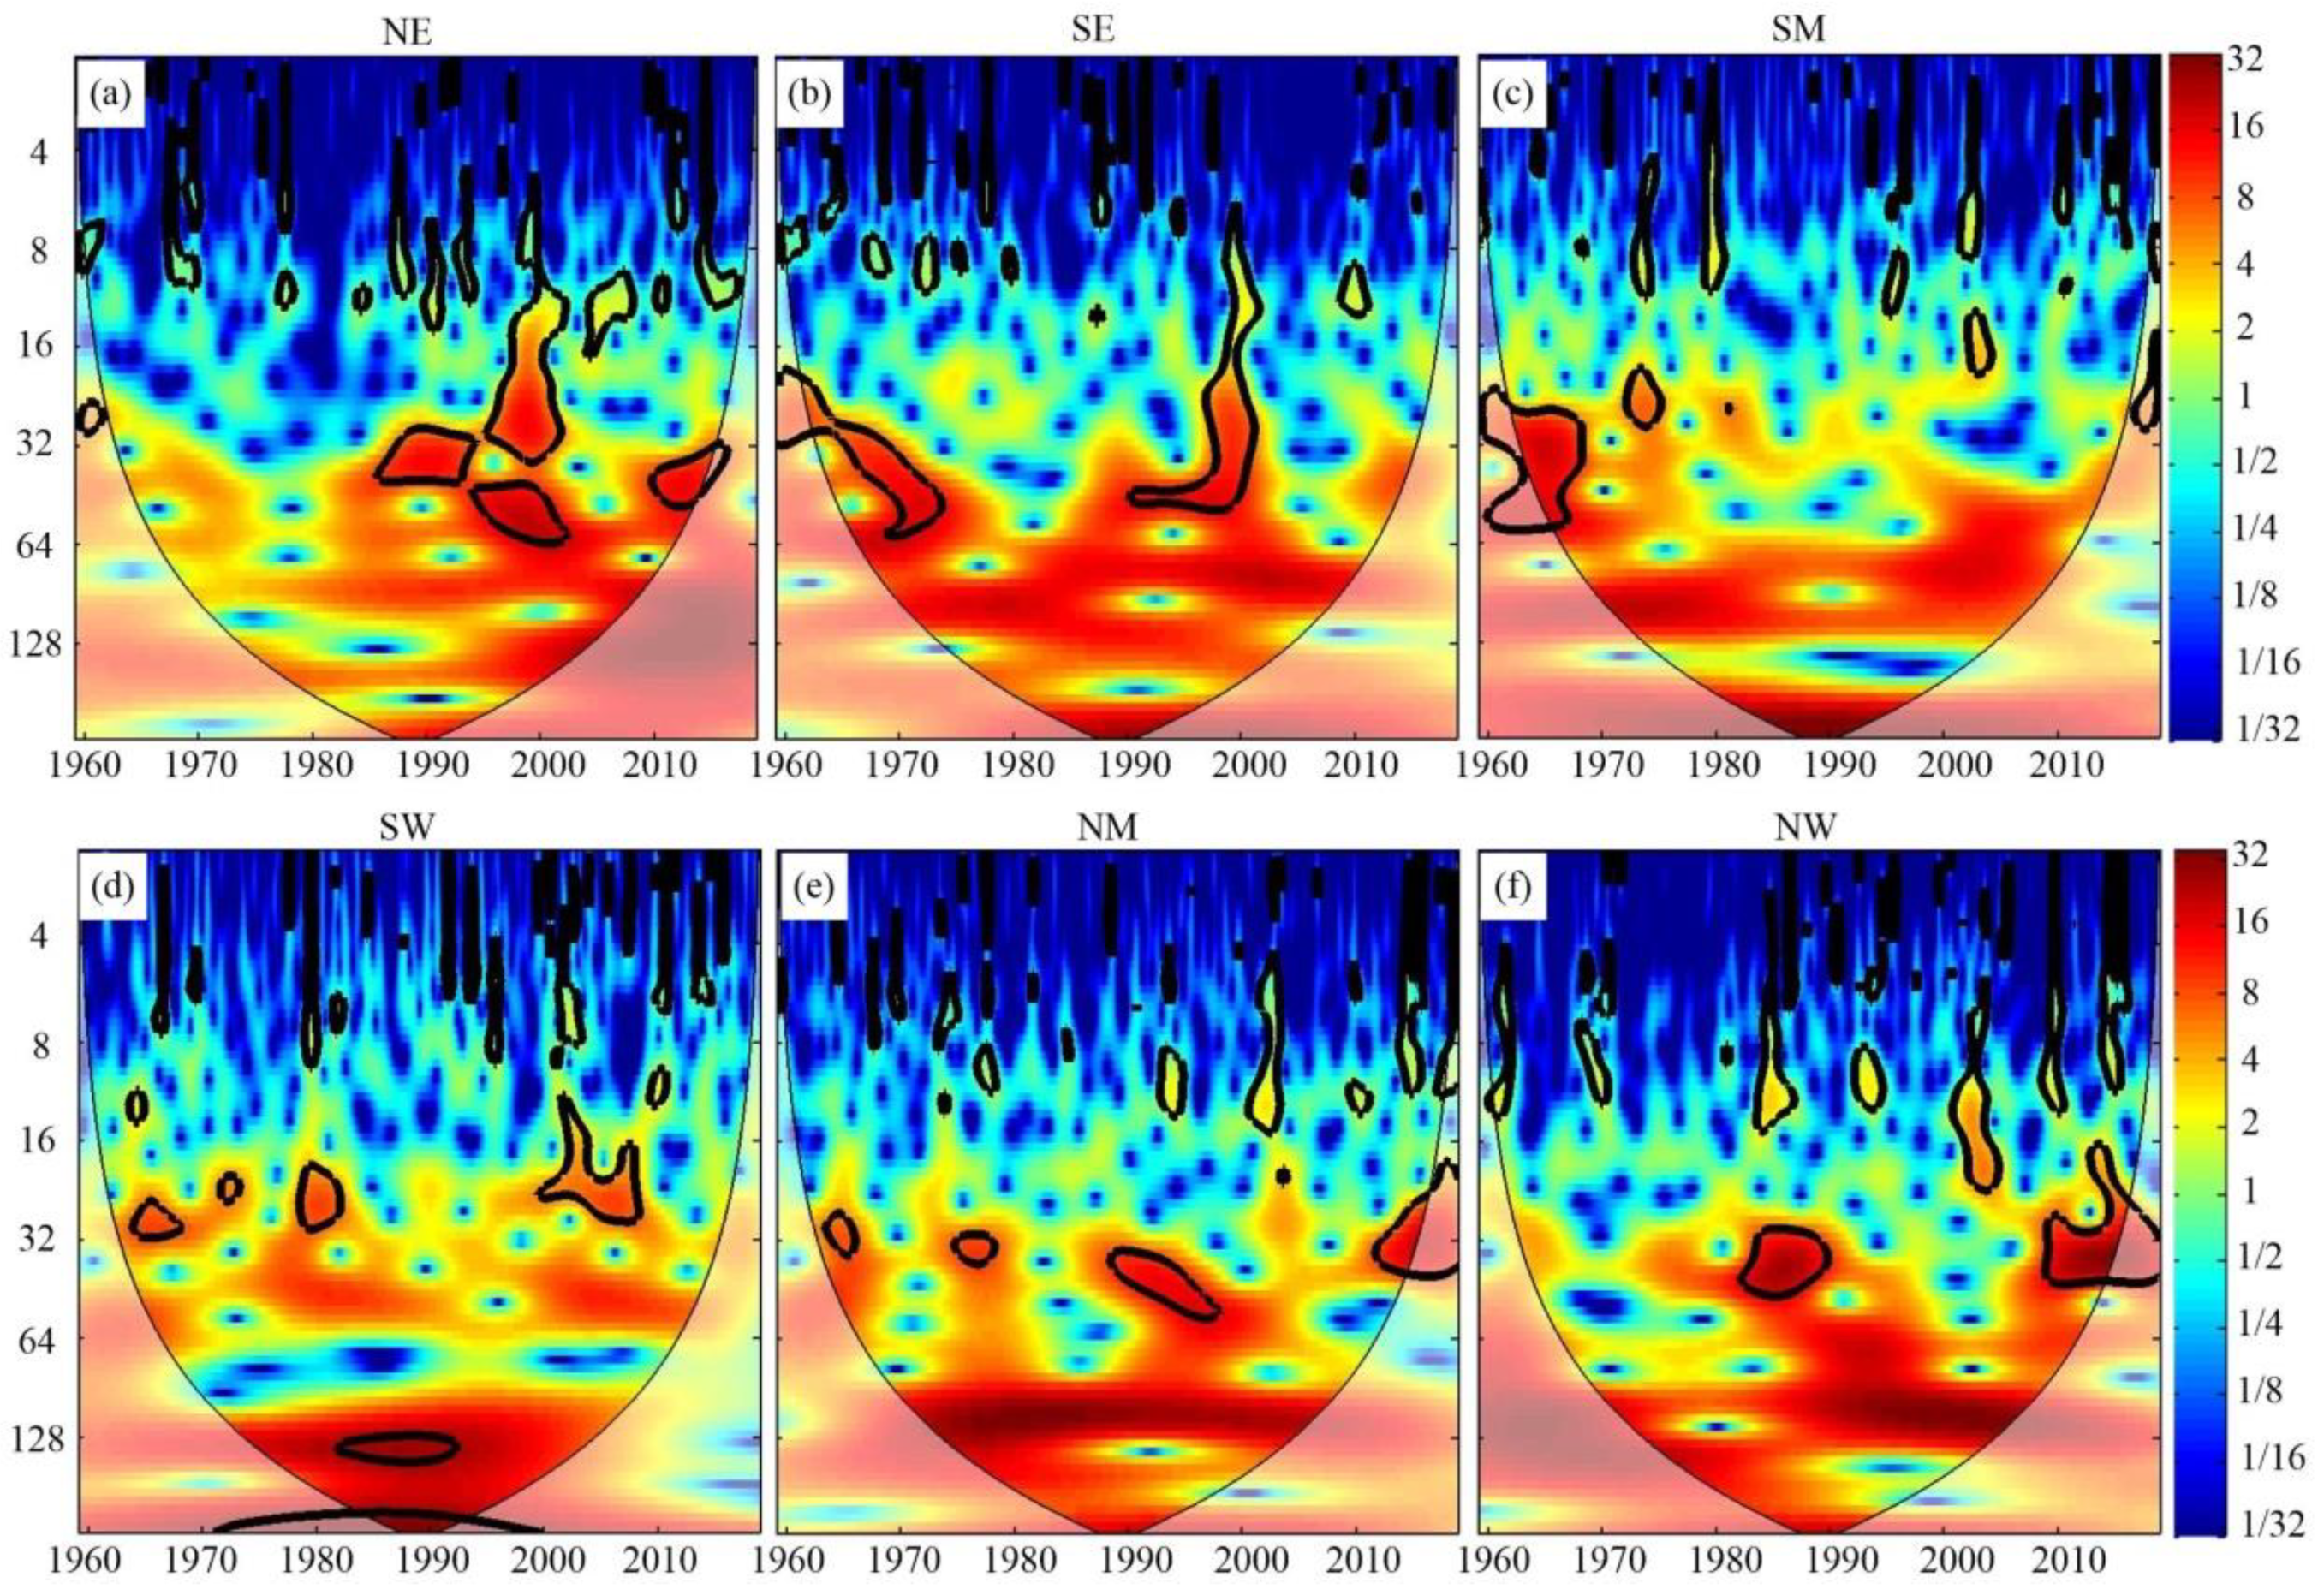
3.2.5. Drought Periodicity
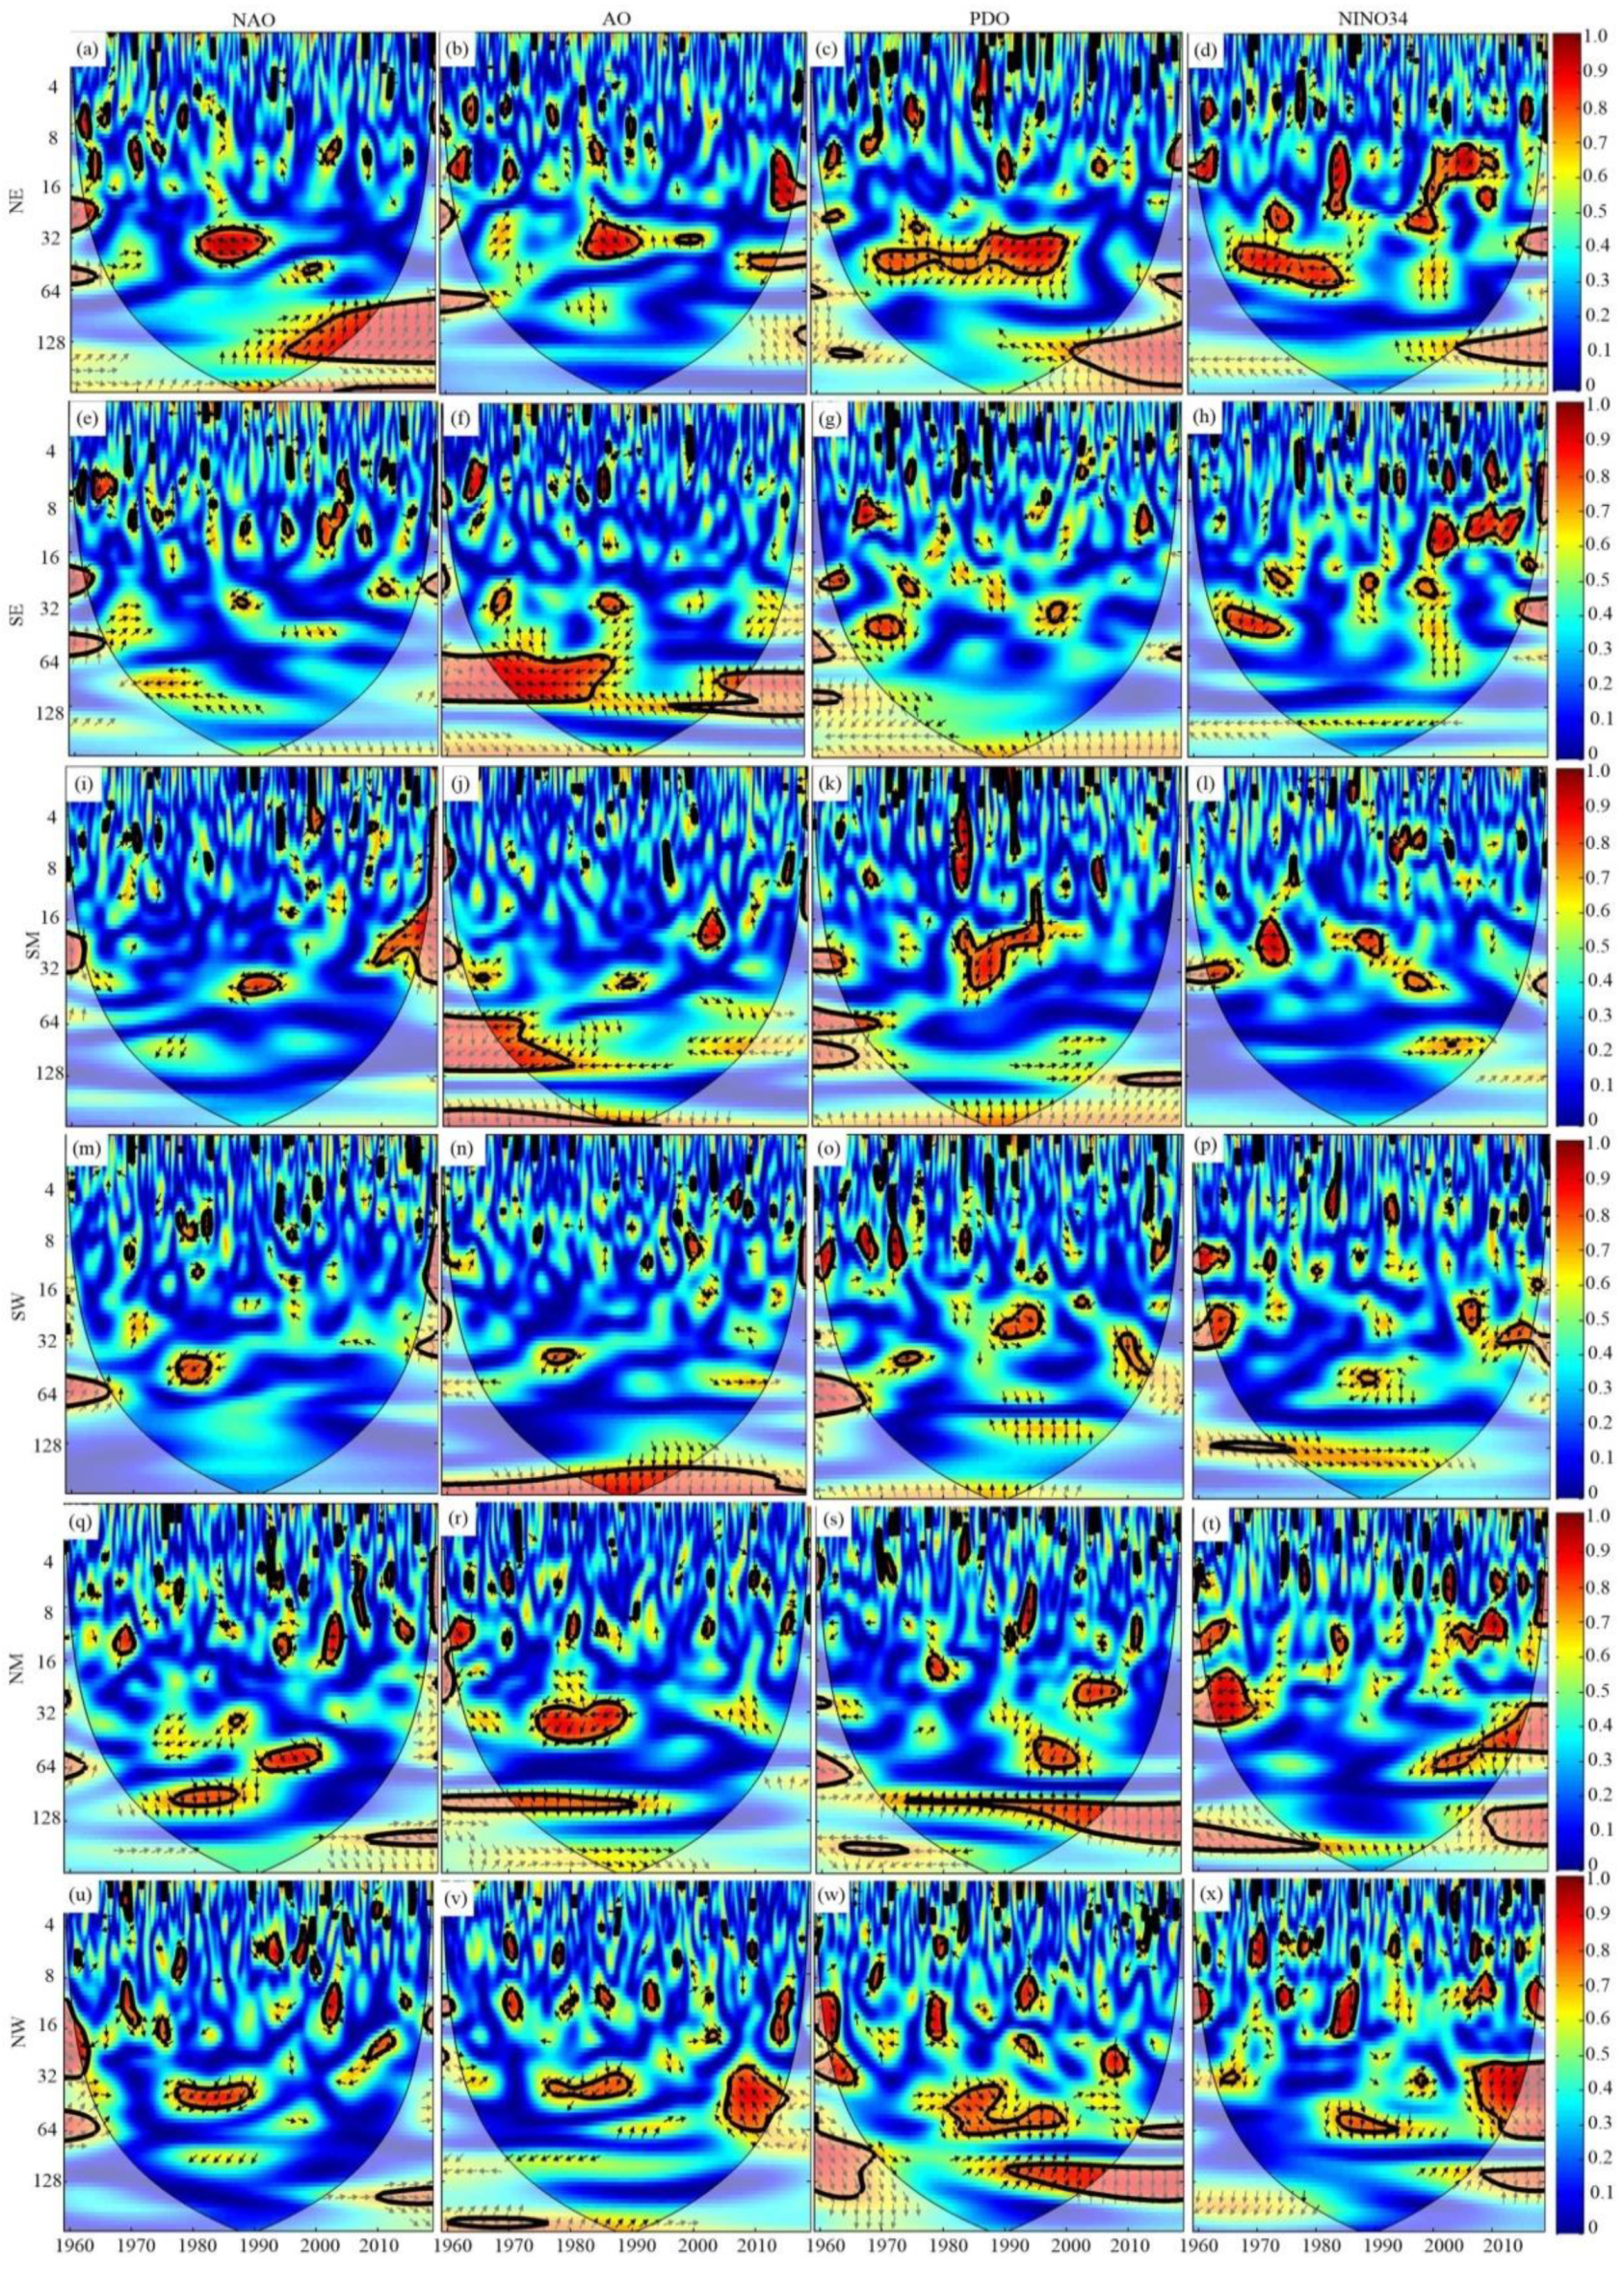
3.3. Influence of Climate Teleconnection on Regional Drought Variability
4. Discussion
5. Conclusions
Supplementary Materials
Author Contributions
Funding
Institutional Review Board Statement
Informed Consent Statement
Data Availability Statement
Acknowledgments
Conflicts of Interest
References
- Feng, S.F.; Hao, Z.C.; Zhang, X.; Hao, F.H. Probabilistic evaluation of the impact of compound dry-hot events on global maize yields. Sci. Total Environ. 2019, 689, 1228–1234. [Google Scholar] [CrossRef]
- Ozelkan, E.; Chen, G.; Ustundag, B.B. Multiscale object-based drought monitoring and comparison in rainfed and irrigated agriculture from Landsat 8 OLI imagery. Int. J. Appl. Earth Obs. Geoinf. 2015, 44, 159–170. [Google Scholar] [CrossRef]
- Tong, S.Q.; Lai, Q.; Zhang, J.Q.; Bao, Y.H.; Lusi, A.; Ma, Q.Y.; Li, X.Q.; Zhang, F. Spatiotemporal drought variability on the Mongolian Plateau from 1980–2014 based on the SPEI-PM, intensity analysis and Hurst exponent. Sci. Total Environ. 2018, 615, 1557–1565. [Google Scholar] [CrossRef] [PubMed]
- Li, X.M.; Yang, W.F.; Yang, X.L.; Li, Y.L. Sensitivity analysis of drought indices used in Shaanxi Province. J. Desert Res. 2009, 29, 342–347. [Google Scholar]
- Giannakopoulos, C.; Sager, P.L.; Bindi, M.; Moriondo, M.; Kostopoulou, E.; Goodess, C.M. Climatic changes and associated impacts in the Mediterranean resulting from a 2 °C global warming. Glob. Planet. Chang. 2009, 68, 209–224. [Google Scholar] [CrossRef]
- Guo, S.J. The meteorological disaster risk assessment based on the diffusion mechanism. J. Risk Anal. Crisis Res. 2012, 2, 124–130. [Google Scholar] [CrossRef] [Green Version]
- Dai, A. Drought under global warming: A review. WIREs Clim. Change 2011, 2, 45–65. [Google Scholar] [CrossRef] [Green Version]
- Heim, R.R. A review of twentieth-century drought indices used in the United States. Bull. Am. Meteorol. Soc. 2002, 83, 1149–1165. [Google Scholar] [CrossRef] [Green Version]
- Keyantash, J.; Dracup, J.A. The quantification of drought: An evaluation of drought indices. Bull. Am. Meteorol. Soc. 2002, 83, 1167–1180. [Google Scholar] [CrossRef]
- Palmer, W.C. Meteorological Drought; US Department of Commerce, Weather Bureau: Washington, DC, USA, 1965.
- Vicente-Serrano, S.M.; Begueria, S.; Lopez-Moreno, J.I. A multiscalar drought index sensitive to global warming: The standardized precipitation evapotranspiration index. J. Clim. 2010, 23, 1696–1718. [Google Scholar] [CrossRef] [Green Version]
- Mckee, T.B.; Doedken, N.J.; Kleist, J. The relationship of drought frequency and duration to time scales. In Proceedings of the 8th Conference on Applied Climatology, Anaheim, CA, USA, 17–22 January 1993; pp. 179–182. [Google Scholar]
- Brutsaert, W. Indications of increasing land surface evaporation during the second half of the 20th century. Geophys. Res. Lett. 2006, 33, L20403. [Google Scholar] [CrossRef]
- Alley, W.M. The Palmer drought severity index: Limitations and assumptions. J. Clim. Appl. Meteorol. 1984, 23, 1100–1109. [Google Scholar] [CrossRef] [Green Version]
- Wells, N.; Goddard, S.; Hayes, M.J. A self-calibrating Palmer drought severity index. J. Clim. 2004, 17, 2335–2351. [Google Scholar] [CrossRef]
- Leng, F.W. The recent progress of carbon cycle research in east Asian. Prog. Biochem. Biophys. 2011, 38, 1015–1019. [Google Scholar] [CrossRef]
- Zhen, L.; Liu, J.Y.; Liu, X.L.; Wang, L.; Batkhishig, O.; Wang, Q.X. Structural change of agriculture-livestock system and affecting factors in Mongolian Plateau. J. Arid Land Resour. Environ. 2008, 22, 144–151. [Google Scholar]
- John, R.; Chen, J.; Ouyang, Z.; Batkishig, O.; Samanta, A.; Ganguly, S.; Yuan, W.; Xiao, J. Vegetation response to extreme climate events on the Mongolian Plateau from 2000 to 2010. Environ. Res. Lett. 2013, 8, 035033. [Google Scholar] [CrossRef]
- Wang, L.; Zhen, L.; Liu, X.L.; Batkhishig, O.; Wang, Q. Comparative studies on climate changes and influencing factors in central Mongolian Plateau region. Geogr. Res. 2008, 27, 171–180. [Google Scholar]
- Huang, J.; Xue, Y.; Sun, S.; Zhang, J. Spatial and temporal variability of drought during 1960–2012 in Inner Mongolia, North China. Quat. Int. 2015, 355, 134–144. [Google Scholar] [CrossRef]
- Li, R.; Tsunekawa, A.; Tsubo, M. Index-based assessment of agricultural drought in a semi-arid region of Inner Mongolia, China. J. Arid Land 2014, 6, 3–15. [Google Scholar] [CrossRef]
- Liu, S.; Kang, W.; Wang, T. Drought variability in inner Mongolia of northern China during 1960–2013 based on standardized precipitation evapotranspiration index. Environ. Earth Sci. 2016, 75, 145. [Google Scholar] [CrossRef]
- Shen, Z.X.; Zhang, Q.; Singh, V.P.; Sun, P.; Song, C.Q.; Yu, H.Q. Agricultural drought monitoring across Inner Mongolia, China: Model development, spatiotemporal patterns and impacts. J. Hydrol. 2019, 571, 793–804. [Google Scholar] [CrossRef]
- Wang, Y.; Liu, G.; Guo, E. Spatial distribution and temporal variation of drought in Inner Mongolia during 1901–2014 using Standardized Precipitation Evapotranspiration Index. Sci. Total Environ. 2019, 654, 850–862. [Google Scholar] [CrossRef] [PubMed]
- Cheng, C.H.; Nnadi, F.; Liou, Y.A. A regional land use drought index for Florida. Remote Sens. 2015, 7, 17149–17167. [Google Scholar] [CrossRef] [Green Version]
- Guo, H.; Bao, A.M.; Liu, T.; Jiapaer, G.; Ndayisab, F.; Jiang, L.L.; Kurban, A.; Maeyer, P.D. Spatial and temporal characteristics of droughts in Central Asia during 1966–2015. Sci. Total Environ. 2018, 624, 1523–1538. [Google Scholar] [CrossRef] [PubMed]
- Cao, X.M.; Feng, Y.M.; Wang, J.L.; Gao, Z.Q.; Ning, J.C.; Gao, W. The study of the spatio-temporal changes of drought in the Mongolian Plateau in 40 years based on TVDI. Proc. SPIE 2014, 9221, 92210X-1. [Google Scholar]
- Bao, G.; Chen, J.Q.; Chopping, M.; Bao, Y.H.; Bayarsaikhan, S.; Dorjsuren, A.; Tuya, A.; Jirigala, B.; Qing, Z.H. Dynamics of net primary productivity on the Mongolian Plateau: Joint regulations of phenology and drought. Int. J. Appl. Earth. Obs. Geoinf. 2019, 81, 85–97. [Google Scholar] [CrossRef]
- Wei, Y.; Zhen, L.; Batkhishig, O.; Liu, X.; Fen, L.I.; Yang, L. Empirical study on consumption of ecosystem services and its spatial differences over Mongolian Plateau. Res. Sci. 2009, 31, 1677–1684. [Google Scholar]
- Zhang, X.; Hu, Y.; Zhuang, D.; Qi, Y.Q.; Ma, X. NDVI spatial pattern and its differentiation on the Mongolian Plateau. J. Geogr. Sci. 2009, 19, 403–415. [Google Scholar] [CrossRef]
- Miao, L.J.; Luan, Y.B.; Luo, X.Z.; Liu, Q.; Moore, J.C.; Nath, R.; He, B.; Zhu, F.; Cui, X.F. Analysis of the Phenology in the Mongolian Plateau by Inter-Comparison of Global Vegetation Datasets. Remote Sens. 2013, 5, 5193–5208. [Google Scholar] [CrossRef] [Green Version]
- Mitchell, T.D.; Jones, P.D. An improved method of constructing a database of monthly climate observations and associated high-resolution grids. Int. J. Climatol. 2005, 25, 693–712. [Google Scholar] [CrossRef]
- Jones, P.D.; Harpham, C.; Harris, I.; Goodess, C.M.; Burton, A.; Centella-Artola, A.; Taylor, M.A.; Bezanilla-Morlot, A.; Campbell, J.D.; Stephenson, T.S.; et al. Long-term trends in precipitation and temperature across the Caribbean. Int. J. Clim. 2015, 36, 3314–3333. [Google Scholar] [CrossRef] [Green Version]
- Yu, L.J.; Zhong, S.Y.; Bian, X.D.; Heilman, W.E. Climatology and trend of wind power resources in China and its surrounding regions: A revisit using Climate Forecast System Reanalysis data. Int. J. Climatol. 2016, 36, 2173–2188. [Google Scholar] [CrossRef]
- Tong, S.Q.; Li, X.Q.; Zhang, J.Q.; Bao, Y.H.; Bao, Y.B.; Na, L.; Si, A.L. Spatial and temporal variability in extreme temperature and precipitation events in Inner Mongolia (China) during 1960–2017. Sci. Total Environ. 2019, 649, 75–89. [Google Scholar] [CrossRef]
- Choi, J.W.; Kim, I.G.; Kim, J.Y.; Kim, B.J.; Parka, C.H.; Kim, D.W. The assessment of droughts in Northern China and Mongolian areas using PDSI and relevant large-scale environments. Int. J. Climatol. 2016, 36, 3259–3269. [Google Scholar] [CrossRef]
- Wang, H.J.; Chen, Y.N.; Pan, Y.P.; Li, W.H. Spatial and temporal variability of drought in the arid region of China and its relationships to teleconnection indices. J. Hydrol. 2015, 523, 283–296. [Google Scholar] [CrossRef]
- Chen, J.; John, R.; Zhang, Y.Q.; Shao, C.L.; Brown, D.G.; Batkhishig, O.; Amarjargal, A.; Ouyang, Z.T.; Dong, G.; Wang, D.; et al. Divergences of Two Coupled Human and Natural Systems on the Mongolian Plateau. BioScience 2015, 65, 559–570. [Google Scholar] [CrossRef] [Green Version]
- Huang, S.Z.; Huang, Q.; Chang, J.X.; Leng, G.Y.; Xing, L. The response of agricultural drought to meteorological drought and the influencing factors: A case study in the Wei River Basin, China. Agric. Water Manag. 2015, 159, 45–54. [Google Scholar] [CrossRef]
- Liu, X.; Wang, S.; Zhou, Y.; Wang, F.; Li, W.; Liu, W. Regionalization and Spatiotemporal Variation of Drought in China Based on Standardized Precipitation Evapotranspiration Index (1961–2013). Adv. Meteorol. 2015, 2015, 1–18. [Google Scholar] [CrossRef] [Green Version]
- Montaseri, M.; Amirataee, B. Comprehensive stochastic assessment of meteorological drought indices. Int. J. Climatol. 2017, 37, 998–1013. [Google Scholar] [CrossRef]
- Gregor, M. Surface and Groundwater Quality Changes in Periods of Water Scarcity; Springer Science & Business Media: Berlin/Heidelberg, Germany, 2012. [Google Scholar]
- Venturas, M.D.; MacKinnon, E.D.; Dario, H.L.; Jacobsen, A.L.; Pratt, R.B.; Davis, S.D. Chaparral shrub hydraulic traits, size, and life history types relate to species mortality during California’s historic drought of 2014. PLoS ONE 2016, 11, e0159145. [Google Scholar] [CrossRef] [Green Version]
- Liu, Y.W.; Liu, Y.B.; Wang, W. Inter-comparison of satellite-retrieved and Global Land Data Assimilation System-simulated soil moisture datasets for global drought analysis. Remote Sens. Environ. 2019, 220, 1–18. [Google Scholar] [CrossRef]
- Raziei, T.; Saghafian, B.; Paulo, A.A.; Pereira, L.S.; Bordi, I. Spatial patterns and temporal variability of drought in Western Iran. Water Resour. Manag. 2008, 23, 439–455. [Google Scholar] [CrossRef] [Green Version]
- North, G.R.; Bell, T.L.; Cahalan, R.F.; Moeng, F.J. Sampling errors in the estimation of empirical orthogonal functions. Mon. Weather Rev. 1982, 110, 699–706. [Google Scholar] [CrossRef]
- Kendall, M.G. Rank Correlation Methods; Charles Griffin: London, UK, 1990. [Google Scholar]
- Mann, H.B. Nonparametric tests against trend. Econometrica 1945, 13, 245–259. [Google Scholar] [CrossRef]
- Sen, P.K. Estimates of the regression coefficient based on Kendall’s tau. Am. Stat. Assoc. 1968, 63, 1379. [Google Scholar] [CrossRef]
- Salehi, S.; Dehghani, M.; Mortazavi, S.M.; Singh, V.P. Trend analysis and change point detection of seasonal and annual precipitation in Iran. Int. J. Clim. 2020, 40, 308–323. [Google Scholar] [CrossRef]
- Wang, Y.; Zhang, T.; Chen, X.; Li, J.; Feng, P. Spatial and temporal characteristics of droughts in Luanhe River basin, China. Theor. Appl. Climatol. 2018, 131, 1369–1385. [Google Scholar] [CrossRef]
- Smadi, M.M.; Zghoul, A. A sudden change in rainfall characteristics in Amman, Jordan during the mid 1950s. Am. J. Environ. Sci. 2006, 2, 84–91. [Google Scholar] [CrossRef]
- Da Silva, R.M.; Santos, C.A.; Moreira, M.; Corte-Real, J.; Silva, V.C.; Medeiros, I.C. Rainfall and river flow trends using Mann–Kendall and Sen’s slope estimator statistical tests in the Cobres River basin. Nat. Hazards 2015, 77, 1205–1221. [Google Scholar] [CrossRef]
- Joshi, N.; Gupta, D.; Suryavanshi, S.; Adamowski, J.; Madramootoo, C.A. Analysis of trends and dominant periodicities in drought variables in India: A wavelet transform based approach. Atmos. Res. 2016, 182, 200–220. [Google Scholar] [CrossRef]
- Grinsted, A.; Moore, J.C.; Jevrejeva, S. Application of the cross wavelet transform and wavelet coherence to geophysical time series. Nonlinear Process Geophys. 2004, 11, 561–566. [Google Scholar] [CrossRef]
- Maraun, D.; Kurths, J. Cross wavelet analysis: Significance testing and pitfalls. Nonlinear Process Geophys. 2004, 11, 505–514. [Google Scholar] [CrossRef] [Green Version]
- Cleveland, W.S.; Devlin, S.J. Locally weighted regression: An approach to regression analysis by local fitting. J. Am. Stat. Assoc. 1988, 83, 596–610. [Google Scholar] [CrossRef]
- Fernández-Duque, B.; Pérez, I.A.; Ángeles García, M.; Pardo, N.; Luisa Sánchez, M. Local regressions for decomposing CO2 and CH4 time-series in a semi-arid ecosystem. Atmos. Pollut. Res. 2020, 11, 213–223. [Google Scholar] [CrossRef]
- Marchetto, A.; Rogora, M.; Arisci, S. Trend analysis of atmospheric deposition data: A comparison of statistical approaches. Atmos. Environ. 2013, 64, 95–102. [Google Scholar] [CrossRef]
- Pettitt, A.N. A Non-Parametric Approach to the Change-Point Problem. J. R. Stat. Soc. Ser. C Appl. Stat. 1979, 28, 126. [Google Scholar] [CrossRef]
- Quiring, S.M.; Goodrich, G.B. Nature and causes of the 2002 to 2004 drought in the southwestern United States compared with the historic 1953 to 1957 drought. Clim. Res. 2008, 36, 41–52. [Google Scholar] [CrossRef] [Green Version]
- Andreadis, K.M.; Clark, E.A.; Wood, A.W.; Hamlet, A.F.; Lettenmaier, D.P. Twentieth century drought in the conterminous United States. J. Hydrometeorol. 2005, 6, 985–1001. [Google Scholar] [CrossRef]
- Liu, Z.F.; Yao, Z.J.; Huang, H.Q.; Batjav, B.; Wang, R. Evaluation of Extreme Cold and Drought over the Mongolian Plateau. Water 2019, 11, 74. [Google Scholar] [CrossRef] [Green Version]
- Zeleke, T.; Giorgi, F.; Diro, G.; Zaitchik, B. Trend and periodicity of drought over Ethiopia. Int. J. Clim. 2017, 37, 4733–4748. [Google Scholar] [CrossRef]
- Torrence, C.; Compo, G. A practical guide to wavelet analysis. Bull. Am. Meteorol. Soc. 1998, 79, 61–78. [Google Scholar] [CrossRef] [Green Version]
- Wang, H.J.; Chen, Y.N.; Li, W.H. Characteristics in streamflow and extremes in the Tarim River, China: Trends, distribution and climate linkage. Int. J. Clim. 2014, 35, 761–776. [Google Scholar] [CrossRef]
- Narisu, N.; Bao, Y.; Yushan, B. Drought Temporal Variation Characteristics Analysis based on the PDSI Data in Mongolian Plateau. Adv. Intell. Syst. Res. 2016, 128, 843–848. [Google Scholar]
- Li, W.Y.; Qian, Z.A. Temporal and spatial feature analyses of winter and summer surface air temperature in CMASA, part (1): January. Plateau Meteorol. 2005, 24, 889–897. [Google Scholar]
- Yatagai, A.; Yasunari, T. Interannual variations of summer precipitation in the arid/semi-arid regions in China and Mongolia: Their regionality and relation to the Asian summer monsoon. J. Meteorol. Soc. Jpn. 1995, 73, 909–923. [Google Scholar] [CrossRef] [Green Version]
- Zhou, Y.; Dong, J.W.; Xiao, X.M.; Liu, R.G.; Zou, Z.H.; Zhao, G.S.; Ge, Q.S. Continuous monitoring of lake dynamics on theMongolian Plateau using all available Landsat imagery and Google Earth Engine. Sci. Total Environ. 2019, 589, 366–380. [Google Scholar] [CrossRef]
- Guo, H.; Bao, A.M.; Ndayisaba, F.; Liu, T.; Jiapaer, G.; Attia, M.; El-Tantawi, A.M.; De Maeyer, P. Space-time characterization of drought events and their impacts on vegetation in Central Asia. J. Hydrol. 2018, 564, 1165–1178. [Google Scholar] [CrossRef]
- Xu, K.; Yang, D.W.; Yang, H.B.; Li, Z.; Qin, Y.; Shen, Y. Spatio-temporal variation of drought in China during 1961–2012: A climatic perspective. J. Hydrol. 2015, 526, 253–264. [Google Scholar] [CrossRef]


| scPDSI Value | Category |
|---|---|
| ≥4 | Extremely wet |
| 3 to 4 | Severely wet |
| 2 to 3 | Moderately wet |
| 1 to 2 | Mildly wet |
| −1 to 1 | Near normal |
| −2 to −1 | Mildly dry |
| −3 to −2 | Moderately dry |
| −4 to −3 | Severely dry |
| ≤−4 | Extremely dry |
| NE | SE | SM | SW | NM | NW | |
|---|---|---|---|---|---|---|
| 1959–2018 | −2.95 *** | −3.51 *** | −1.92 *** | −1.80 *** | −3.17 *** | 0.62 * |
| 1996–2018 | −2.92 *** | 2.57 *** | 0.20 *** | −3.69 *** | 0.97 *** | 1.03 * |
| Region | Event | Initiation Time | Peak Time | Termination Time | DD (Months) | DP | DS | DI | DA (%) |
|---|---|---|---|---|---|---|---|---|---|
| NE | D1 | 1999.07 | 2007.09 | 2012.05 | 155 | −5.61 | 324.48 | 2.09 | 81.14 |
| D2 | 2014.07 | 2017.07 | 2018.12 | 54 | −4.04 | 112.14 | 2.08 | 89.95 | |
| D3 | 1967.08 | 1968.07 | 1969.07 | 24 | −2.16 | 28.45 | 1.19 | 74.37 | |
| SE | D1 | 1999.07 | 2007.09 | 2012.05 | 155 | −4.96 | 470.69 | 3.04 | 95.22 |
| D2 | 1979.10 | 1982.10 | 1985.05 | 68 | −3.83 | 124.58 | 1.83 | 86.74 | |
| D3 | 2013.08 | 2014.08 | 2016.10 | 39 | −3.78 | 68.61 | 1.76 | 85.19 | |
| D4 | 1971.08 | 1972.08 | 1974.06 | 35 | −3.59 | 43.51 | 1.24 | 82.1 | |
| D5 | 1967.08 | 1968.08 | 1969.06 | 23 | −3.63 | 38 | 1.65 | 77.55 | |
| D6 | 2016.12 | 2017.07 | 2018.08 | 21 | −3.44 | 35.41 | 1.69 | 90.52 | |
| D7 | 1988.06 | 1989.08 | 1990.01 | 20 | −3.43 | 29.77 | 1.49 | 82.24 | |
| SM | D1 | 2004.03 | 2006.10 | 2010.03 | 74 | −3.33 | 135.2 | 1.83 | 83.61 |
| D2 | 1985.06 | 1987.07 | 1990.07 | 62 | −3.03 | 90.47 | 1.46 | 74.78 | |
| D3 | 1965.05 | 1965.09 | 1967.03 | 23 | −3.57 | 51.91 | 2.26 | 85.5 | |
| D4 | 1999.06 | 2001.07 | 2002.03 | 34 | −3.63 | 51.19 | 1.51 | 74.54 | |
| D5 | 1981.10 | 1982.10 | 1984.05 | 32 | −2.62 | 39.04 | 1.22 | 78.02 | |
| D6 | 1971.04 | 1972.08 | 1973.06 | 27 | −2.91 | 29.5 | 1.09 | 71.27 | |
| D7 | 1979.10 | 1980.07 | 1981.08 | 23 | −2.4 | 29.08 | 1.26 | 89.03 | |
| SW | D1 | 1985.07 | 1987.09 | 1990.04 | 58 | −3.95 | 123.85 | 2.14 | 79.87 |
| D2 | 1961.09 | 1963.11 | 1964.03 | 31 | −3.83 | 64.68 | 2.09 | 91.58 | |
| D3 | 2008.03 | 2009.08 | 2010.08 | 30 | −5.05 | 60.77 | 2.03 | 84.24 | |
| D4 | 2004.04 | 2005.07 | 2005.12 | 21 | −2.57 | 32.08 | 1.53 | 88.27 | |
| NM | D1 | 2004.04 | 2009.09 | 2011.01 | 82 | −4.17 | 175.59 | 2.14 | 86.18 |
| D2 | 1977.08 | 1980.09 | 1983.05 | 70 | −3.25 | 136.73 | 1.95 | 88.26 | |
| D3 | 1999.11 | 2002.09 | 2003.02 | 40 | −3.97 | 36.58 | 0.91 | 63.28 | |
| NW | D1 | 1970.1 | 1975.08 | 1983.04 | 121 | −4.67 | 322.66 | 2.67 | 88.41 |
| D2 | 1961.09 | 1962.09 | 1967.06 | 70 | −3.19 | 125.91 | 1.80 | 86.11 | |
| D3 | 2005.06 | 2009.08 | 2009.10 | 53 | −4.97 | 122.79 | 2.32 | 91.99 | |
| D4 | 2017.04 | 2018.06 | 2018.12 | 21 | −3.59 | 54.19 | 2.58 | 99.19 |
Publisher’s Note: MDPI stays neutral with regard to jurisdictional claims in published maps and institutional affiliations. |
© 2022 by the authors. Licensee MDPI, Basel, Switzerland. This article is an open access article distributed under the terms and conditions of the Creative Commons Attribution (CC BY) license (https://creativecommons.org/licenses/by/4.0/).
Share and Cite
Huang, Y.; Liu, B.; Zhao, H.; Yang, X. Spatial and Temporal Variation of Droughts in the Mongolian Plateau during 1959–2018 Based on the Gridded Self-Calibrating Palmer Drought Severity Index. Water 2022, 14, 230. https://doi.org/10.3390/w14020230
Huang Y, Liu B, Zhao H, Yang X. Spatial and Temporal Variation of Droughts in the Mongolian Plateau during 1959–2018 Based on the Gridded Self-Calibrating Palmer Drought Severity Index. Water. 2022; 14(2):230. https://doi.org/10.3390/w14020230
Chicago/Turabian StyleHuang, Yingchun, Bowen Liu, Haigen Zhao, and Xudong Yang. 2022. "Spatial and Temporal Variation of Droughts in the Mongolian Plateau during 1959–2018 Based on the Gridded Self-Calibrating Palmer Drought Severity Index" Water 14, no. 2: 230. https://doi.org/10.3390/w14020230