Article

Longitudinal Chemical Gradients and the Functional Responses of Nutrients, Organic Matter, and Other Parameters to the Land Use Pattern and Monsoon Intensity

Department of Bioscience and Biotechnology, Chungnam National University, Daejeon 34134, Korea
*
Author to whom correspondence should be addressed.
Water 2022, 14(2), 237; https://doi.org/10.3390/w14020237
Submission received: 7 December 2021 / Revised: 13 January 2022 / Accepted: 13 January 2022 / Published: 14 January 2022
(This article belongs to the Special Issue Water Quality Management of Inland Waters)

Abstract

:
River water quality degradation is one of the hottest environmental issues worldwide. Therefore, monitoring water quality longitudinally and temporally is crucial for effective water management and contamination control. The main aim of this study was to assess the longitudinal variations in water quality in the mainstream of the Han River, Korea, from 2015 to 2019. The trophic state classification (TSC), microbial pollution indicator (MPI), and river pollution index (RPI) were calculated to characterize river water quality and revealed more serious pollution toward the downstream zone (Dz) due to agricultural and urban-dominated areas. The biodegradability index (BI) indicated that non-biodegradable organic pollutants are increasing in the water body from the urban and animal wastewater treatment plants. Nutrients, organic matter contents, total suspended solids, ionic factors, and algal chlorophyll were higher in the Dz than in any other zones and were markedly influenced by the summer monsoon. Empirical analysis showed that nutrients and organic matter had positive linear functional relations with agricultural and urban coverage and negative linear relations with forest coverage. The pollutant-transport function suggested that suspended solids act as TP and TN carriers. Regression analysis indicated that TP (R2 = 0.47) has more positive functional relations with algal growth than TN (R2 = 0.22). Our findings suggest that a combination of empirical models and pollution indices might be utilized to assess river water quality and that the resulting information could aid policymakers in managing the Han River.

1. Introduction

Rivers are significant freshwater sources for domestic, industrial, and irrigation purposes and carry sediments, pollutants, debris, and municipal and industrial wastewater from one place to another; accordingly, they are the most vulnerable water bodies to contaminants [1,2]. Furthermore, anthropogenic activities and natural processes directly impact watershed hydrology, heat budget, water energy balance, and biogeochemical cycling in streams and rivers, all of which influence water quality [3,4]. Earlier research suggested that watershed development is closely related to changes in stream hydrology and morphology, water quality, and biotic conditions [5]. Nutrients and organic matter are problematic pollutants in rivers [5,6]. Urban and agricultural water runoffs increase the nutrient and organic matter concentrations in a watershed [5,7,8]. Excessive nutrients and organic matter contents accelerate the eutrophication process, which causes disproportionate algal growth that depletes dissolved oxygen in the water body [9,10]. Recent studies revealed that watershed development and impermeable surface coverage are positively related to fecal bacterial contamination in freshwater streams and rivers [11,12].
Moreover, the water quality of streams and rivers is closely related to three axes: the lateral axis, longitudinal axis, and vertical axis [2]. Water quality parameters are moved to the stream and rivers laterally, longitudinally, and vertically and their surroundings [2,13]. A fundamental paradigm in aquatic system studies is the longitudinal response of river ecosystems to changes in water quality conditions along the river’s course [14]. Earlier studies proposed that nutrients, organic matter, CHL-a, and microbial loads could be low in headwater zones (Hzs), increase gradually in the middle reaches, and peak at downstream sites [13,15]. Moreover, constructions of dams or weirs disrupt rivers’ or streams’ longitudinal connectivity, altering the hydrological regime, water quality, and biotic community structure [16,17]. The interrelations among water quality parameters as observed in longitudinal scale studies are attracting attention in efforts to improve the ecological health of streams and rivers worldwide [8,17,18]. In addition, the variability in water quality parameters can be influenced by the intensity of the summer monsoon [19,20]. This distinct seasonal feature can cause physicochemical differences between pre-monsoon and post-monsoon seasons, along with longitudinal gradients [21].
Concern about river water quality has been highlighted in Korea since the 1960s, and water quality is monitored regularly by the Korean Ministry of Environment at several sites in Korea [22,23]. As a result, a Korean Long-Term Ecological Research program was initiated to study ecological changes in various ecosystems and habitats, such as the Han River [24]. It reported that Han River water quality had not improved markedly even after initiating a water quality monitoring program [24]. Previous studies on Han River water quality suggested that the combined effects of upstream development and tiny tributaries with inadequate wastewater treatment facilities affected water quality in the downstream parts [3,21,25,26,27]. Nonpoint source pollution was the predominant cause of water contamination, accounting for roughly 70% of TSS [28] and 80% of TP intake [29]. Suspended sediment contamination directly impacts light attenuation, interferes with fish activities and prey detection, and affects fish spawning and benthic microalgal composition and richness [11]. In addition, suspended solids act as carriers of other pollutants, especially TP and TN, in the watershed [11]. TP is the most crucial nutrient for algal growth in most freshwater bodies [30,31], although N plays an important role in selected freshwater systems [32]. The Han River is one of Korea’s largest rivers and provides water to Seoul City, the economic capital of Korea [21]. The water quality has declined markedly due to increased urban sprawl, industry, and intensive farming along the Han River basin (HRB) [3,27].
Therefore, river water quality monitoring is imperative for understanding present river conditions and for managing water quality impairments under different stresses [4,33]. Numerous water quality indices, including the biodegradability index (BI), river pollution index (RPI), trophic state classification (TSC), and microbial pollution indicator (MPI), are useful tools for assessing water quality in the river. This study was performed to evaluate water quality from the Hz to the downstream zone (Dz) using BI, RPI, TSC, and MPI. We also determined the relationships between land use coverage, nutrients, organic matter, and TCB.

2. Materials and Methods
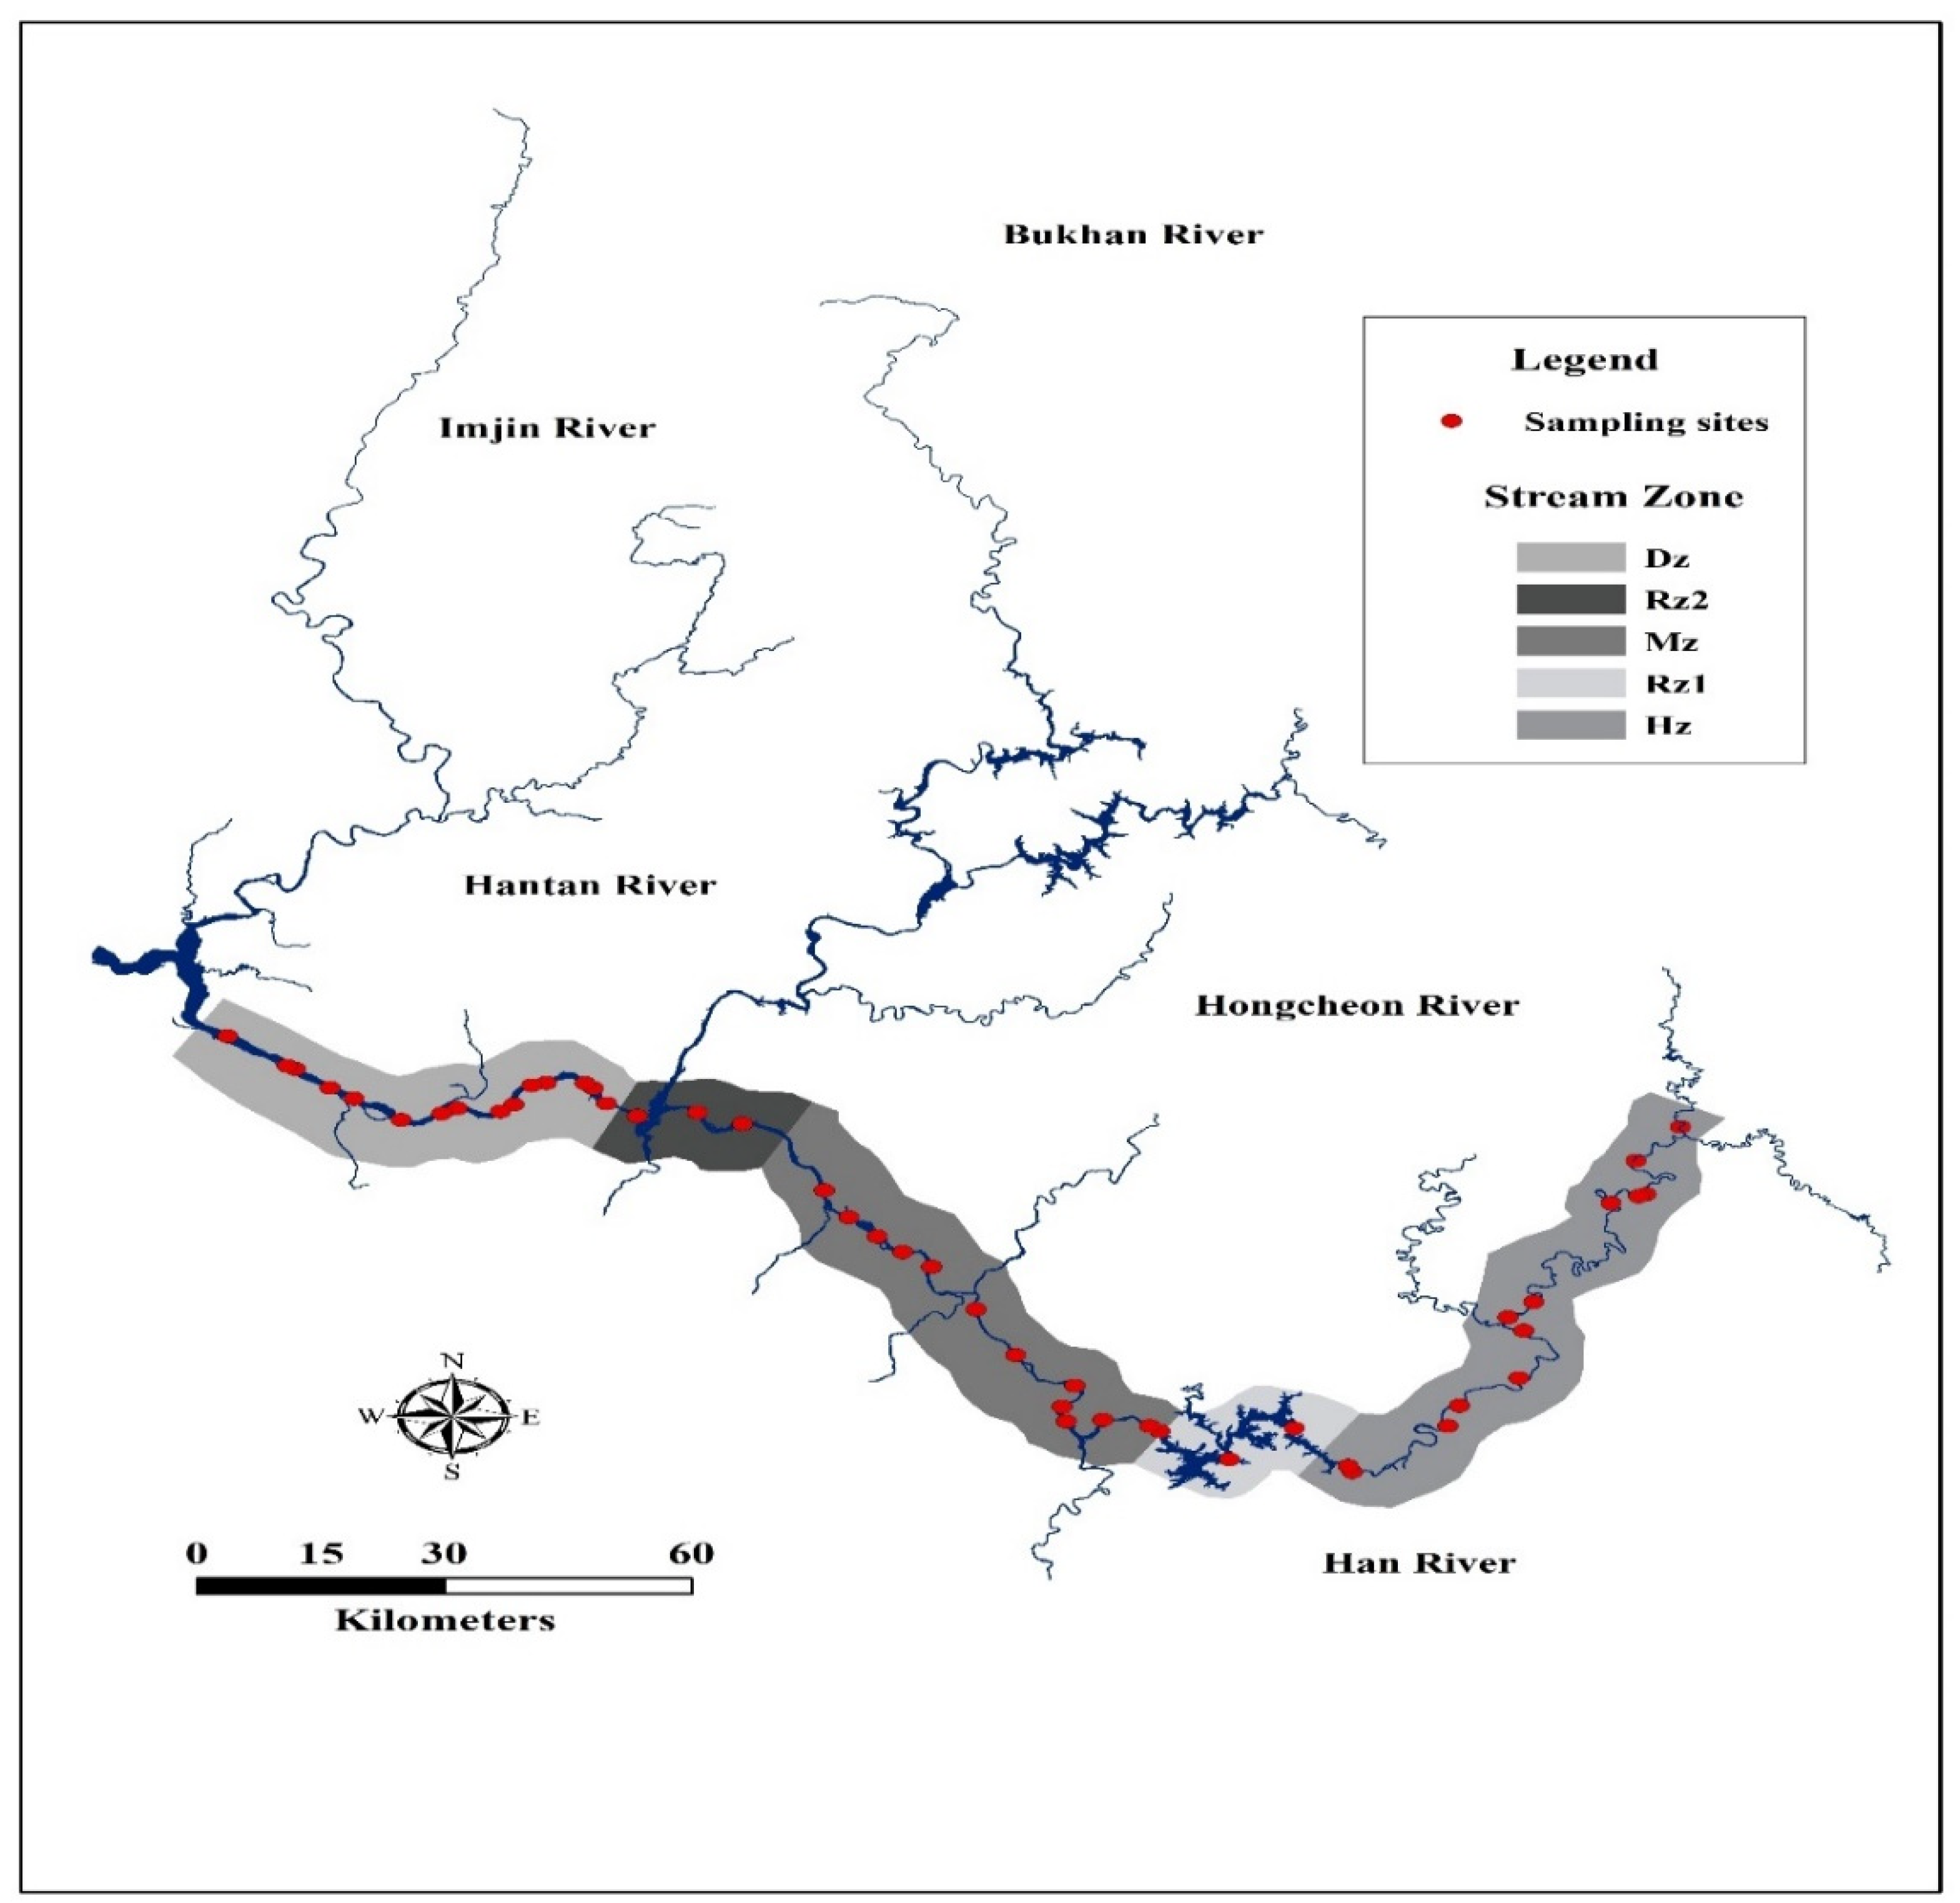
2.1. The Study Area

The Han River, with a length of 564 km, has the largest river basin in South Korea (approximately 26,219 km2) and flows to the Yellow Sea [3]. The Han River consists of two main parts—the South Han River (12,514 km2) and the North Han River (10,652 km2)—that join 35 km east of Seoul in Yangsuri [3]. The climate of the research area is temperate, with four distinct seasons. The research area’s average monthly temperature varied from −2.5 °C in January to +25.4 °C in August [34]. It rains an average of 1300 mm per year in the HRB, and approximately 70% of the rain falls during the summer monsoon [35]. The upper Han River basin primarily comprises Ordovician limestones and Permo-Carboniferous coal-bearing clastic sedimentary rocks [34]. Limestones are locally metasomatized by the Mesozoic granites [34]. Numerous polymetallic skarn deposits are developed along contact zones [34]. The HRB primarily supplies drinking, irrigation, industrial, hydroelectric, and recreational water for 24 million people [3]. Land development pressure continues in the downstream part of HRB, near the metropolitan areas of Seoul. Due to the migration of people from rural areas to Seoul City, forest and agricultural land in the lower part of the HRB have been converted to residential and commercial spaces [3,25]. Pollution from point and nonpoint sources from agricultural and urban areas is still a problem in many parts of the HRB [36].
Details of the sampling sites and zones with coordinates in the HRB for this study are provided in Supplementary Table S1. First, we divided the HRB longitudinally into three main parts, i.e., the Hz, midwater zone (Mz), and Dz. Then, we further classified the HRB into two sections due to the presence of two reservoirs—reservoir zone 1 (Rz1; Chungju Reservoir) and reservoir zone 2 (Rz2; Paldang Reservoir). The geographic locations of the selected study sites in the HRB are shown in Figure 1.

2.2. Analysis of Water Quality Parameters and Land Use Coverage

The Korean Ministry of Environment collects monthly surface water quality data as part of a nationwide ecological health survey. We complied water quality data from the Korean Ministry of Environment (MOE) Water Information Network (available online: http://water.nier.go.kr (accessed on 15 March 2021)). We studied 12 water quality parameters at 46 selected sites in the HRB during the 2015–2019 period. A portable multi-parameter analyzer (YSI Sonde Model 6600, YSI Incorporated, Yellow Springs, OH, USA) was used onsite to directly measure pH, WT, EC, and DO. The sampling, preservation, and analytical procedures for TOC, COD, BOD, TSS, TP, TN, CHL-a, and TCB were conducted in accordance with the Korean Ministry of Environment’s approved techniques [37]. Land use coverage data (agricultural, urban, forest) were obtained from the Korean Ministry of Environment (Supplementary File, Table S2). Based on rainfall data from the Korean Meteorological Administration, 2018 was a wet year, and 2015 was a dry year (Supplementary File, Figure S1).

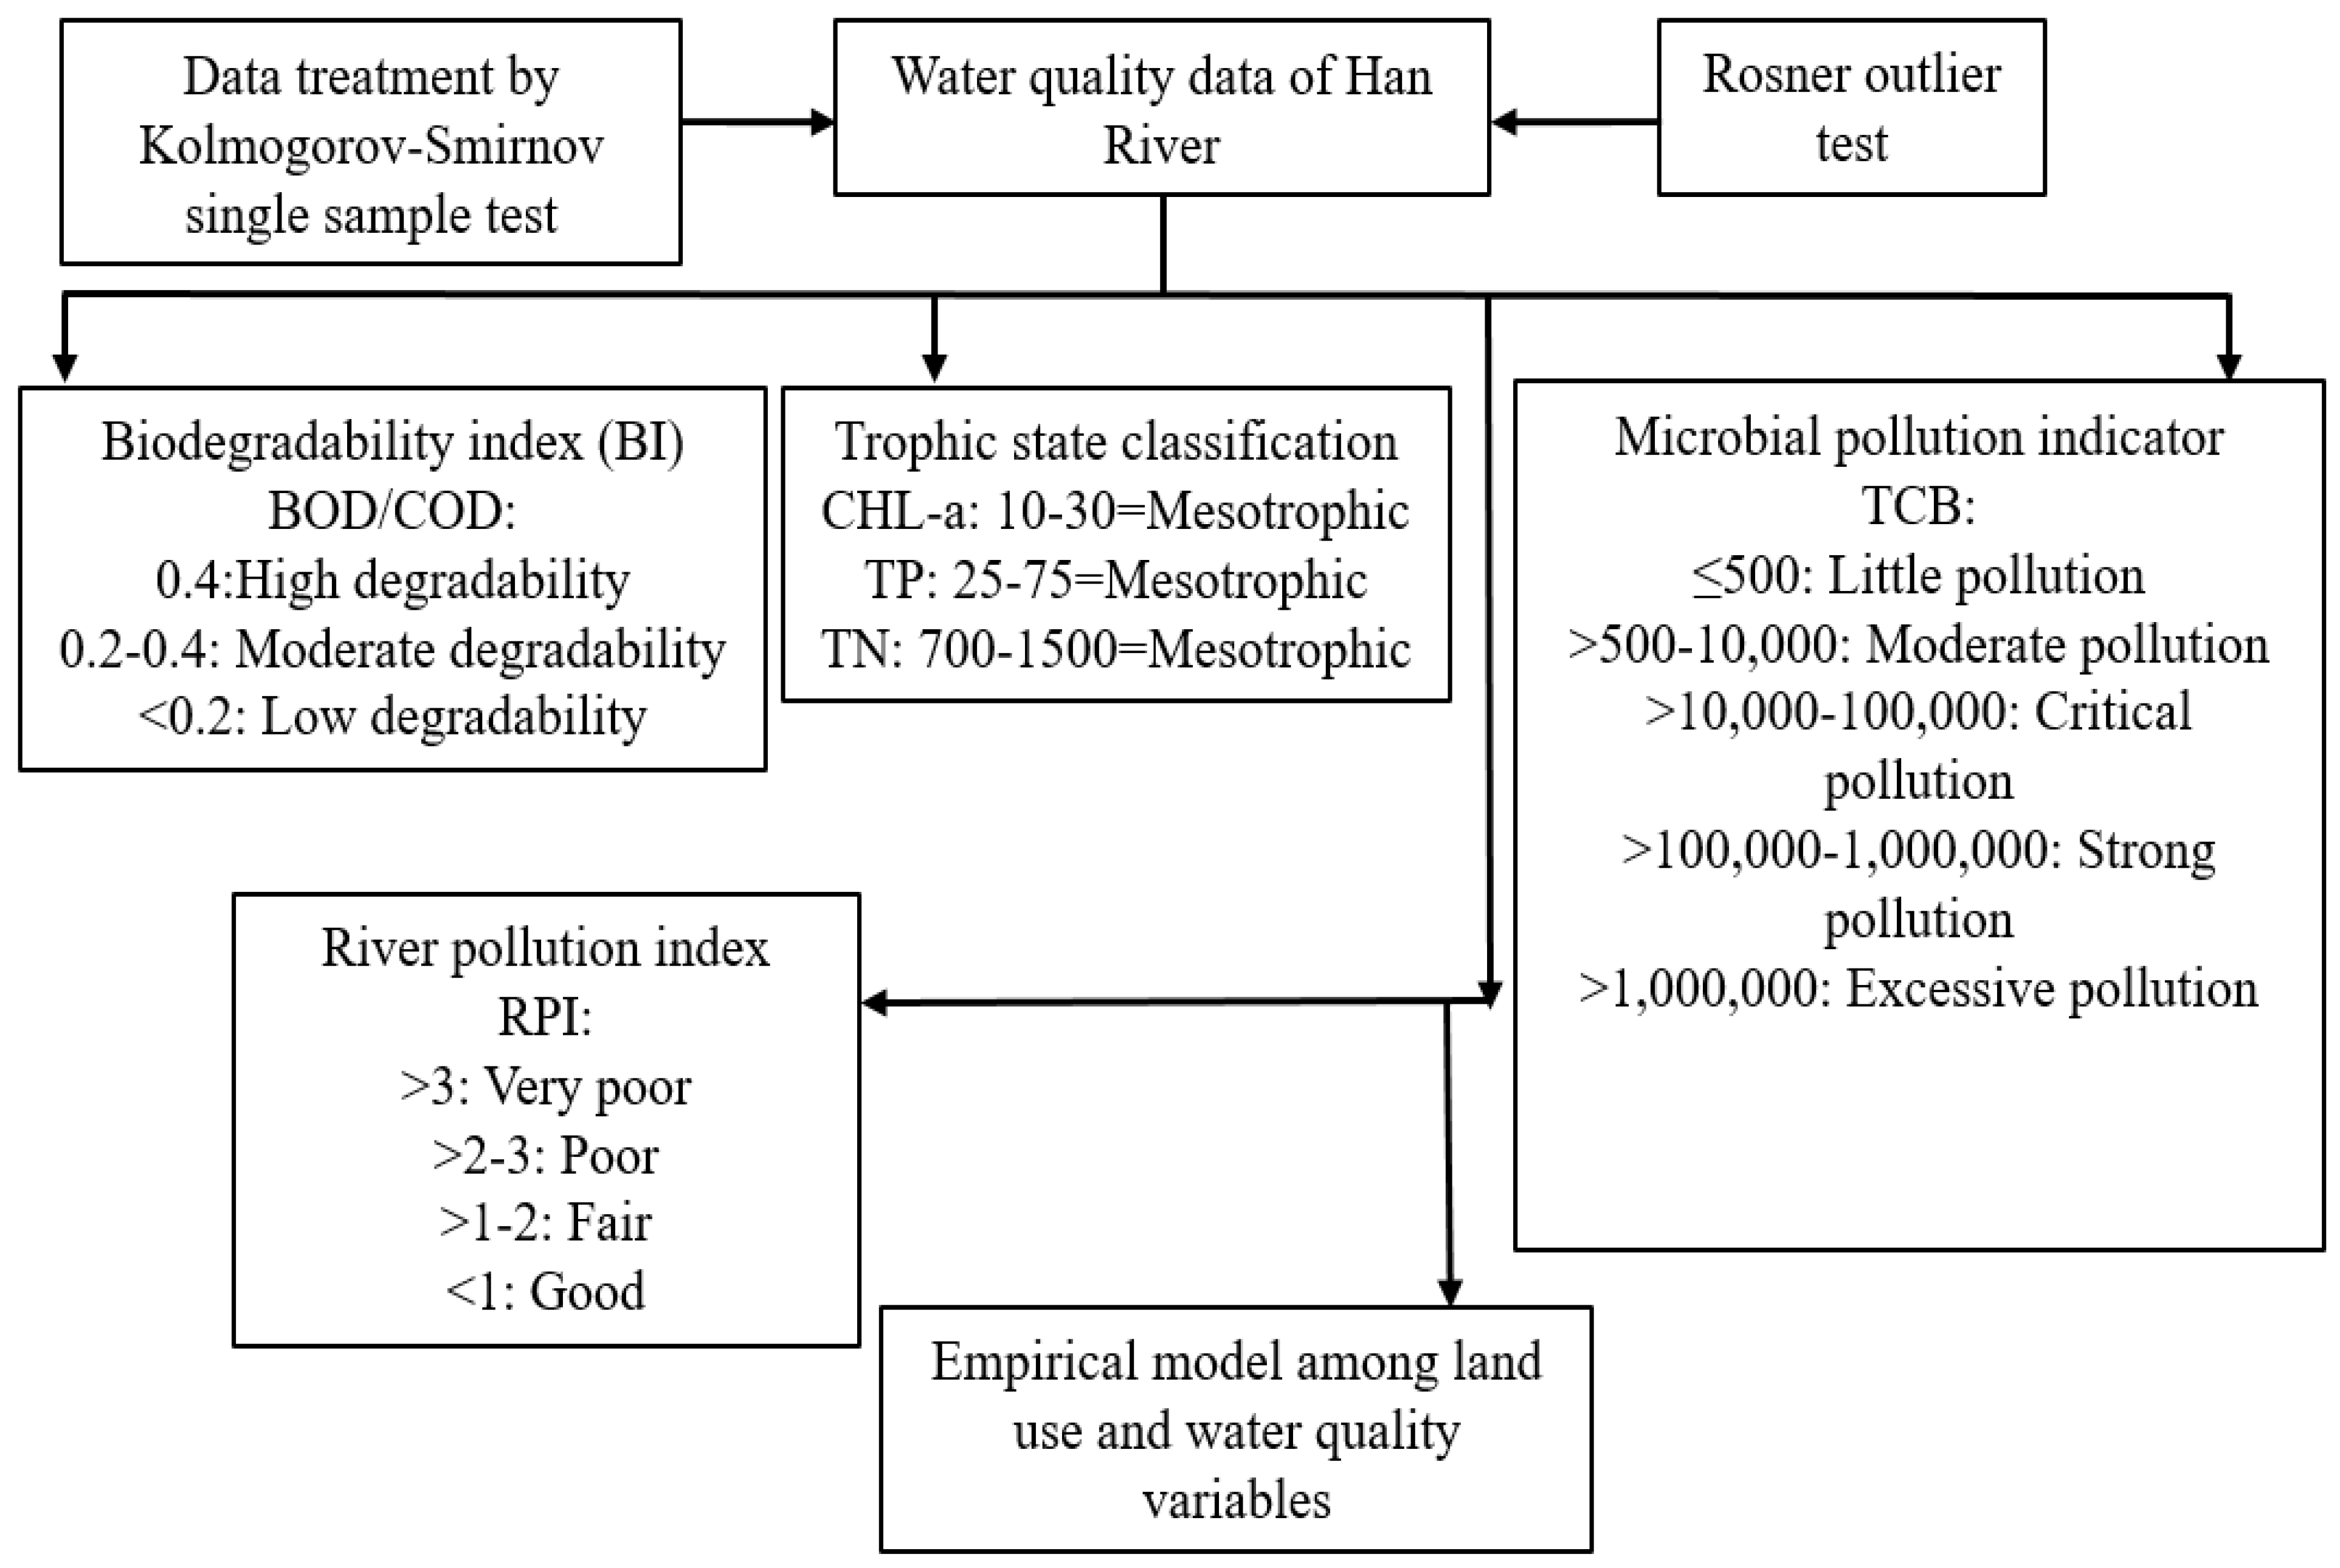
2.3. Biodegradability Index and Trophic State Classification

The organic matter BI was calculated as the ratio between BOD and COD [38]. Biodegradability was classified according to the BOD/COD ratio as follows: 0.4, high degradability; 0.2–0.4, moderate degradability; <0.2, low degradability [38,39,40]. TSC based on TP, TN, and CHL-a was used to determine the trophic state of the HRB [41].

2.4. Microbial Pollution Indicator and River Pollution Index

The MPI was used to assess the microbiological quality of surface waters [12,42]. The counts of Escherichia coli and intestinal enterococci were used to determine microbial contamination in the water body. Surface water quality was categorized according to different pollution levels based on the TCB [42,43], as follows: TCB (most probable number/100 mL) ≤ 500, little pollution; TCB > 500–10,000, moderate pollution; TCB > 10,000–100,000, critical pollution; TCB > 100,000–1,000,000, strong pollution; and TCB > 1,000,000, excessive pollution.
A modified RPI model was used to assess the pollution level and chemical health of the HRB [44,45]. The RPI was calculated using the following formula:
RPI = 1/9(MpH/SpH + MDO/SDO + MBOD/SBOD + MCOD/SCOD + MTSS/STSS + MTN/STN + MTP/STP + MEC/SEC + MCHL-a/SCHL-a)
where MpH, MDO, MBOD, MCOD, MTSS, MTN, MTP, MEC, and MCHL-a are measured values, and SpH, SDO, SBOD, SCOD, STSS, STN, STP, SEC, and SCHL-a are standard values defined by the Korean Ministry of Environment. The pollution level was classified as follows based on the RPI [14,45]: RPI > 3.0, very poor; RPI > 2–3.0, poor; RPI > 1–2.0, fair; and RPI < 1.0, good.

2.5. Statistical Analysis

A detailed methodological flow chart is shown in Figure 2. The Rosner outlier test of water quality parameters was executed by ProUCL version 5.1. software [46]. Water quality parameters were log10 transformed to increase data normality before empirical analysis. Regression analysis was utilized to investigate the causal relationships between water quality variables and land use patterns and to develop an empirical model [47], which was performed using SigmaPlot software [48]. Pearson’s correlation analysis of water quality data was conducted using the PAST software to ascertain the degree of correlation between the parameters in the HRB [49].

3. Results

3.1. Physicochemical Properties of the Han River Basin

The water quality parameters of the HRB varied from the Hz to the Dz, and nutrients, organic matter, suspended solids, ionic concentrations, and CHL-a were always higher in the Dz in comparison with other zones (Table 1). A statistical summary of selected parameters of the water samples is presented in Table 1. A total of 12 water quality variables were analyzed at 46 sites in the Han River watershed. The pH and WT in the HRB did not exhibit any significant variation from the Hz to the Dz. EC exhibited heterogeneity from the Hz to the Dz, and the mean EC was highest in the Dz (350.4 µS cm−1) compared with the other zones. The DO concentrations were above the standard level from the Hz to the Dz. The lowest mean BOD of all zones was detected in the Hz (1.10 mg L−1). Of all zones, the highest mean levels of COD (5.09 mg L−1), TSS (15.5 mg L−1), and TOC (2.75 mg L−1) were found in the Dz. The lowest mean levels of TP (15.03 µg L−1) and CHL-a (3.32 µg L−1) were observed in Rz1 (Chungju Reservoir). Mean TN (4.13 mg L−1) concentrations were higher in the Dz, and the TN/TP (70.97) ratio was reduced.
The annual variation in water quality parameters exhibited divergence from the Hz to the Dz (Supplementary File, Figure S2). It was remarkable that TP, TN, BOD, COD, TSS, TOC, EC, and CHL-a were always higher in the Dz than in the Hz, Mz, Rz1, and Rz2. The TP concentration was higher in the Dz in 2015 (152.03 µg L−1) than in other years. A high TN level was observed in the Dz in 2016 (4.49 mg L−1) compared with the other years. The lowest BOD was found in 2019 (1.79 mg L−1), whereas the highest was found in 2015 (2.68 mg L−1) in the Dz. It was notable that the COD and TOC concentrations were lower in Rz1 (Chungju Reservoir) during the study period. The TSS concentrations were higher in all zones in 2017 except in the Hz. The lowest ionic level (EC, 307.71 µS cm−1) was observed in 2017 in the Dz. CHL-a growth was highest in the Dz, whereas it was lowest in Rz1 from 2015 to 2019.

3.2. Seasonal Variations in Water Quality Parameters

Nutrients (TP, TN), CHL-a, TSS, TOC, and ionic contents in the HRB varied from the Hz to downstream areas and were markedly influenced by the summer monsoon (Supplementary File, Figures S3 and S4). TP and TSS contents from the Hz to the Dz were higher during the monsoon period than during the pre-monsoon and post-monsoon periods. The TN level in the HRB was always high (>1.5 mg L−1) regardless of the season, indicating a nitrogen-rich system, but dilution of nitrogen was observed during the monsoon season. CHL-a and TOC from the Hz to Rz2 (Paldang Reservoir) were higher during the monsoon season and then fluctuated in the Dz during the pre-monsoon, monsoon, and post-monsoon seasons.

3.3. Pearson Correlation Matrix

Pearson’s correlation matrix indicated clear positive and negative relations among water quality parameters in the HRB (Table 2). Negative correlations were observed between pH and all water quality parameters except DO (r = 0.80, p < 0.01) and TN/TP (r = 0.65, p < 0.01). WT was positively related to all water quality parameters except for DO and TN/TP, with which it was negatively related (r = −0.05, p < 0.01; r = −0.44, p < 0.01, respectively). EC increased with increasing concentrations of nutrients, organic matter, suspended solids, and CHL-a in the HRB. The dissolved oxygen level decreased with increasing BOD, COD, TSS, TOC, TN, TP, and CHL-a in the HRB. The BOD in the HRB increased with increasing TSS, COD, TOC, TN, TP, and CHL-a. COD was positively correlated with TSS, TOC, TN, TP, and CHL-a. TSS exhibited positive relations with nutrients, organic carbon, and CHL-a. TN and TP were correlated with each other in the HRB and exhibited positive relations with CHL-a.

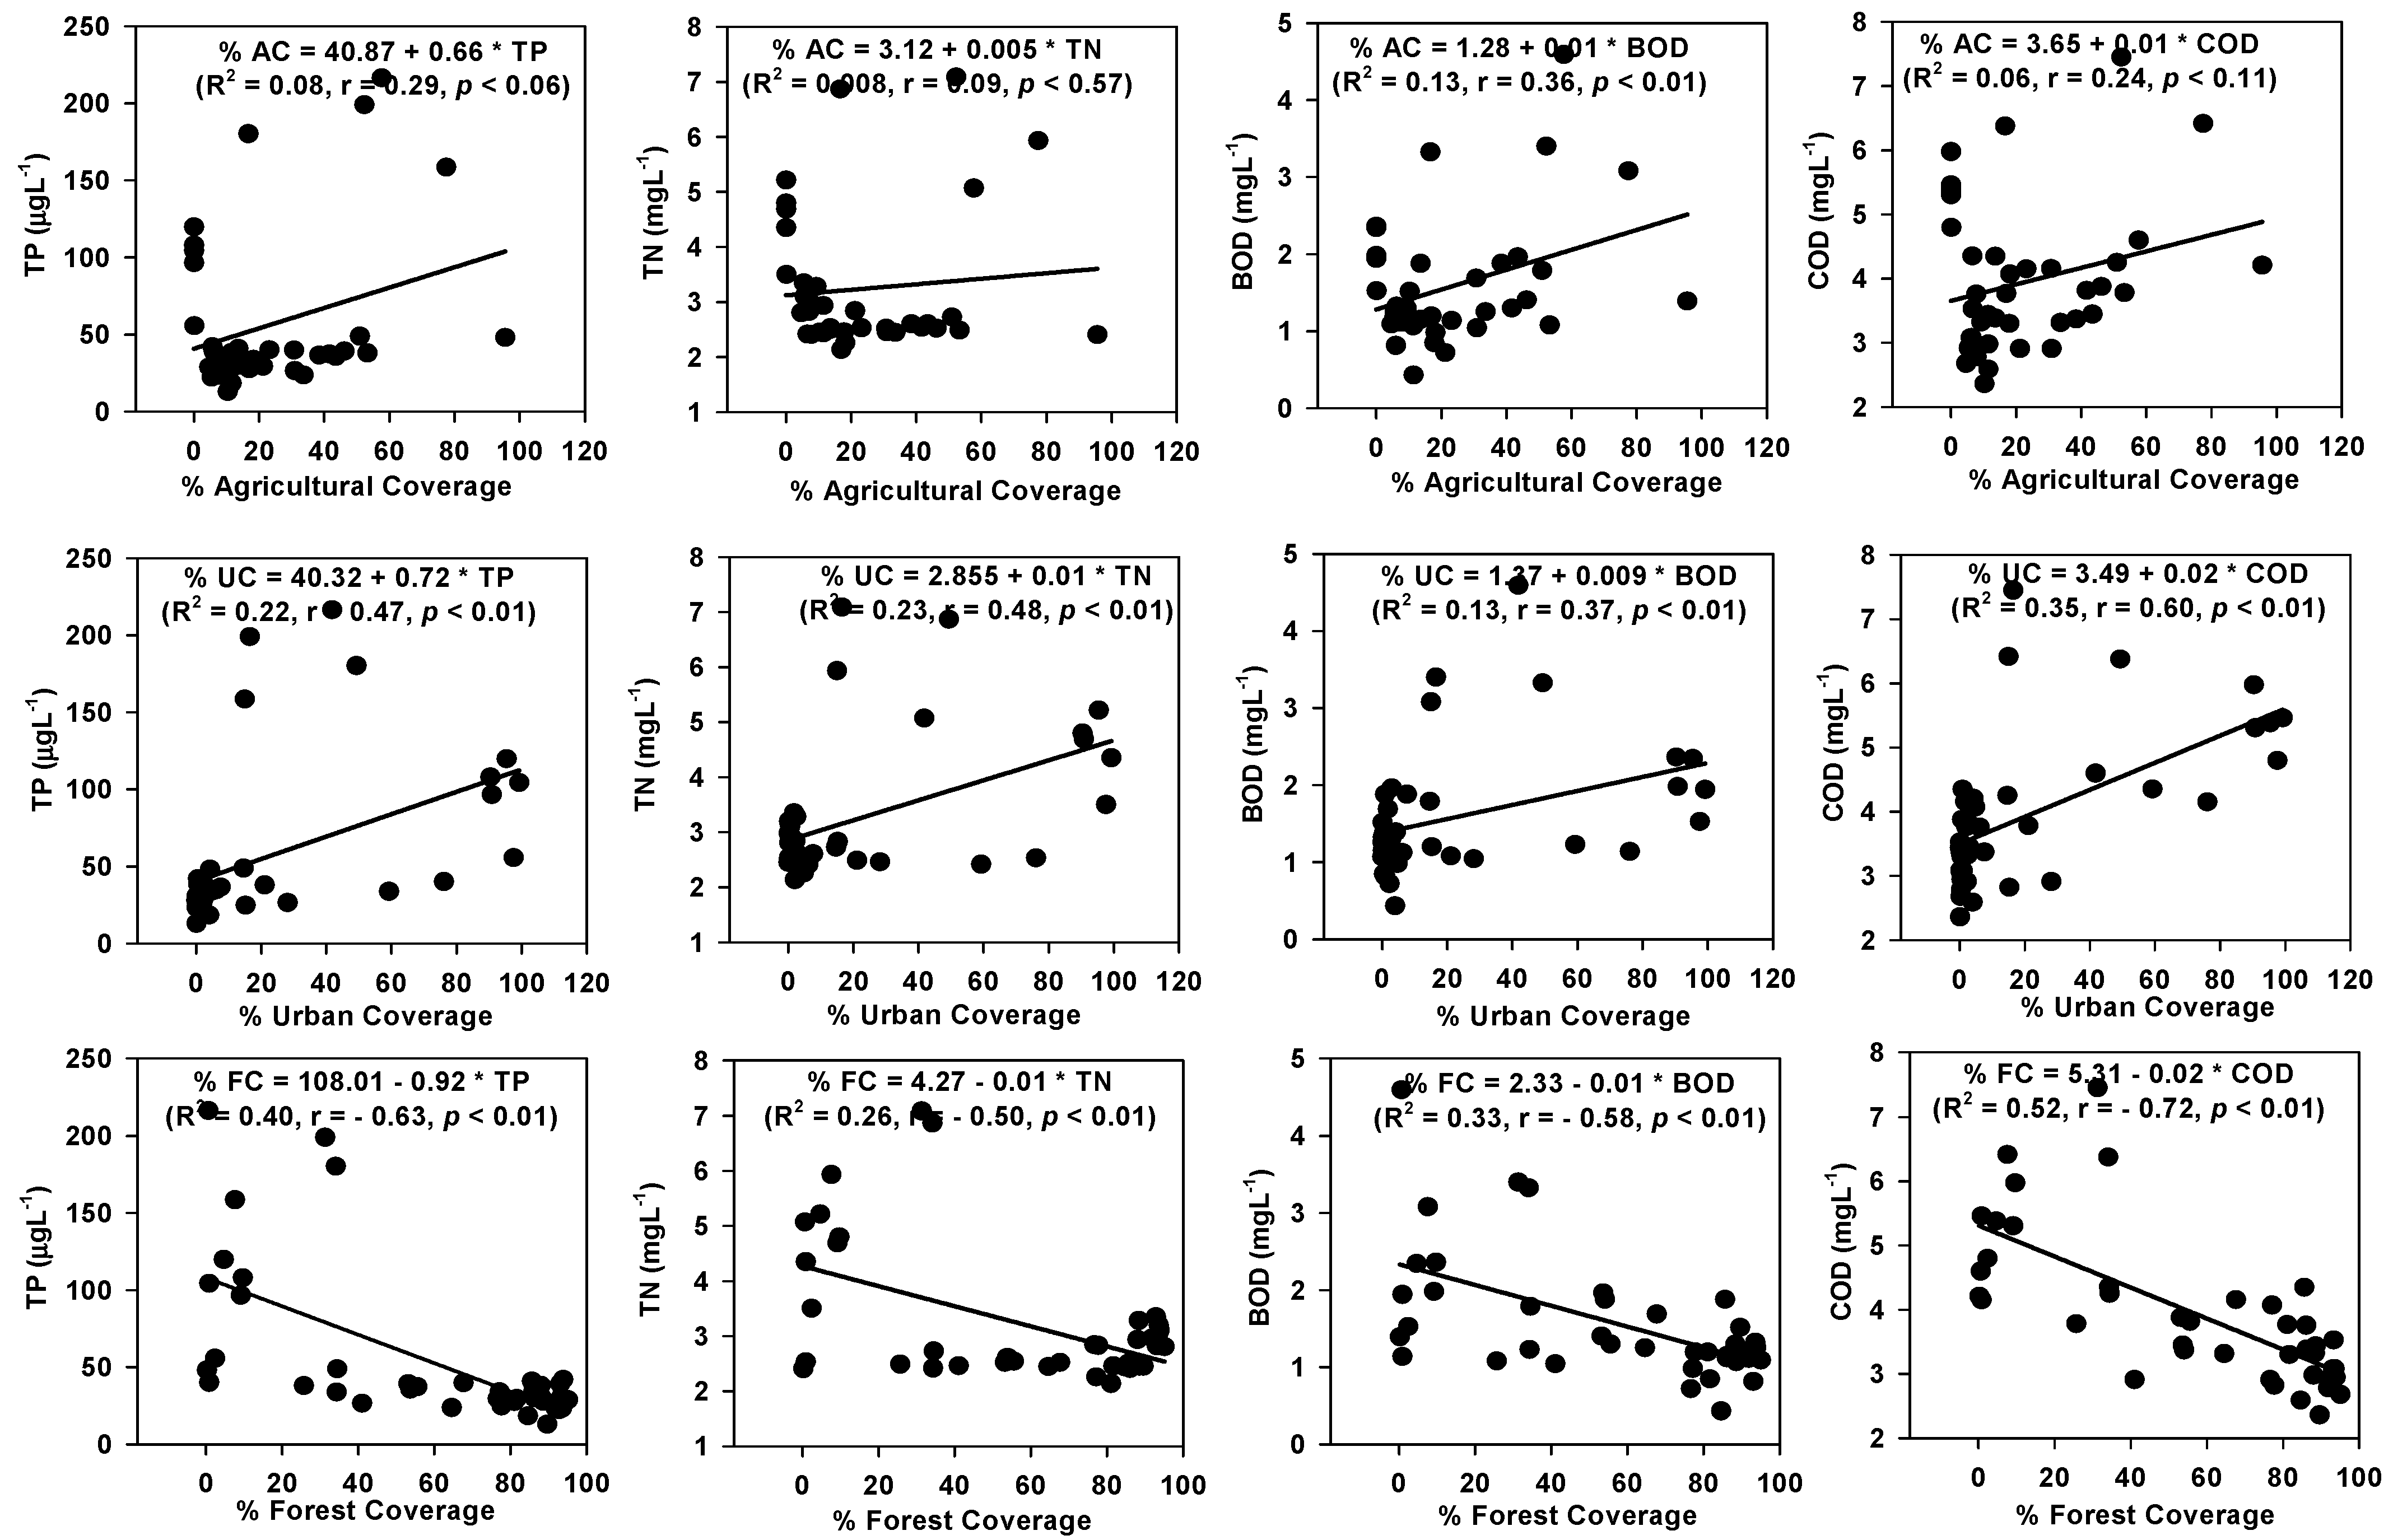
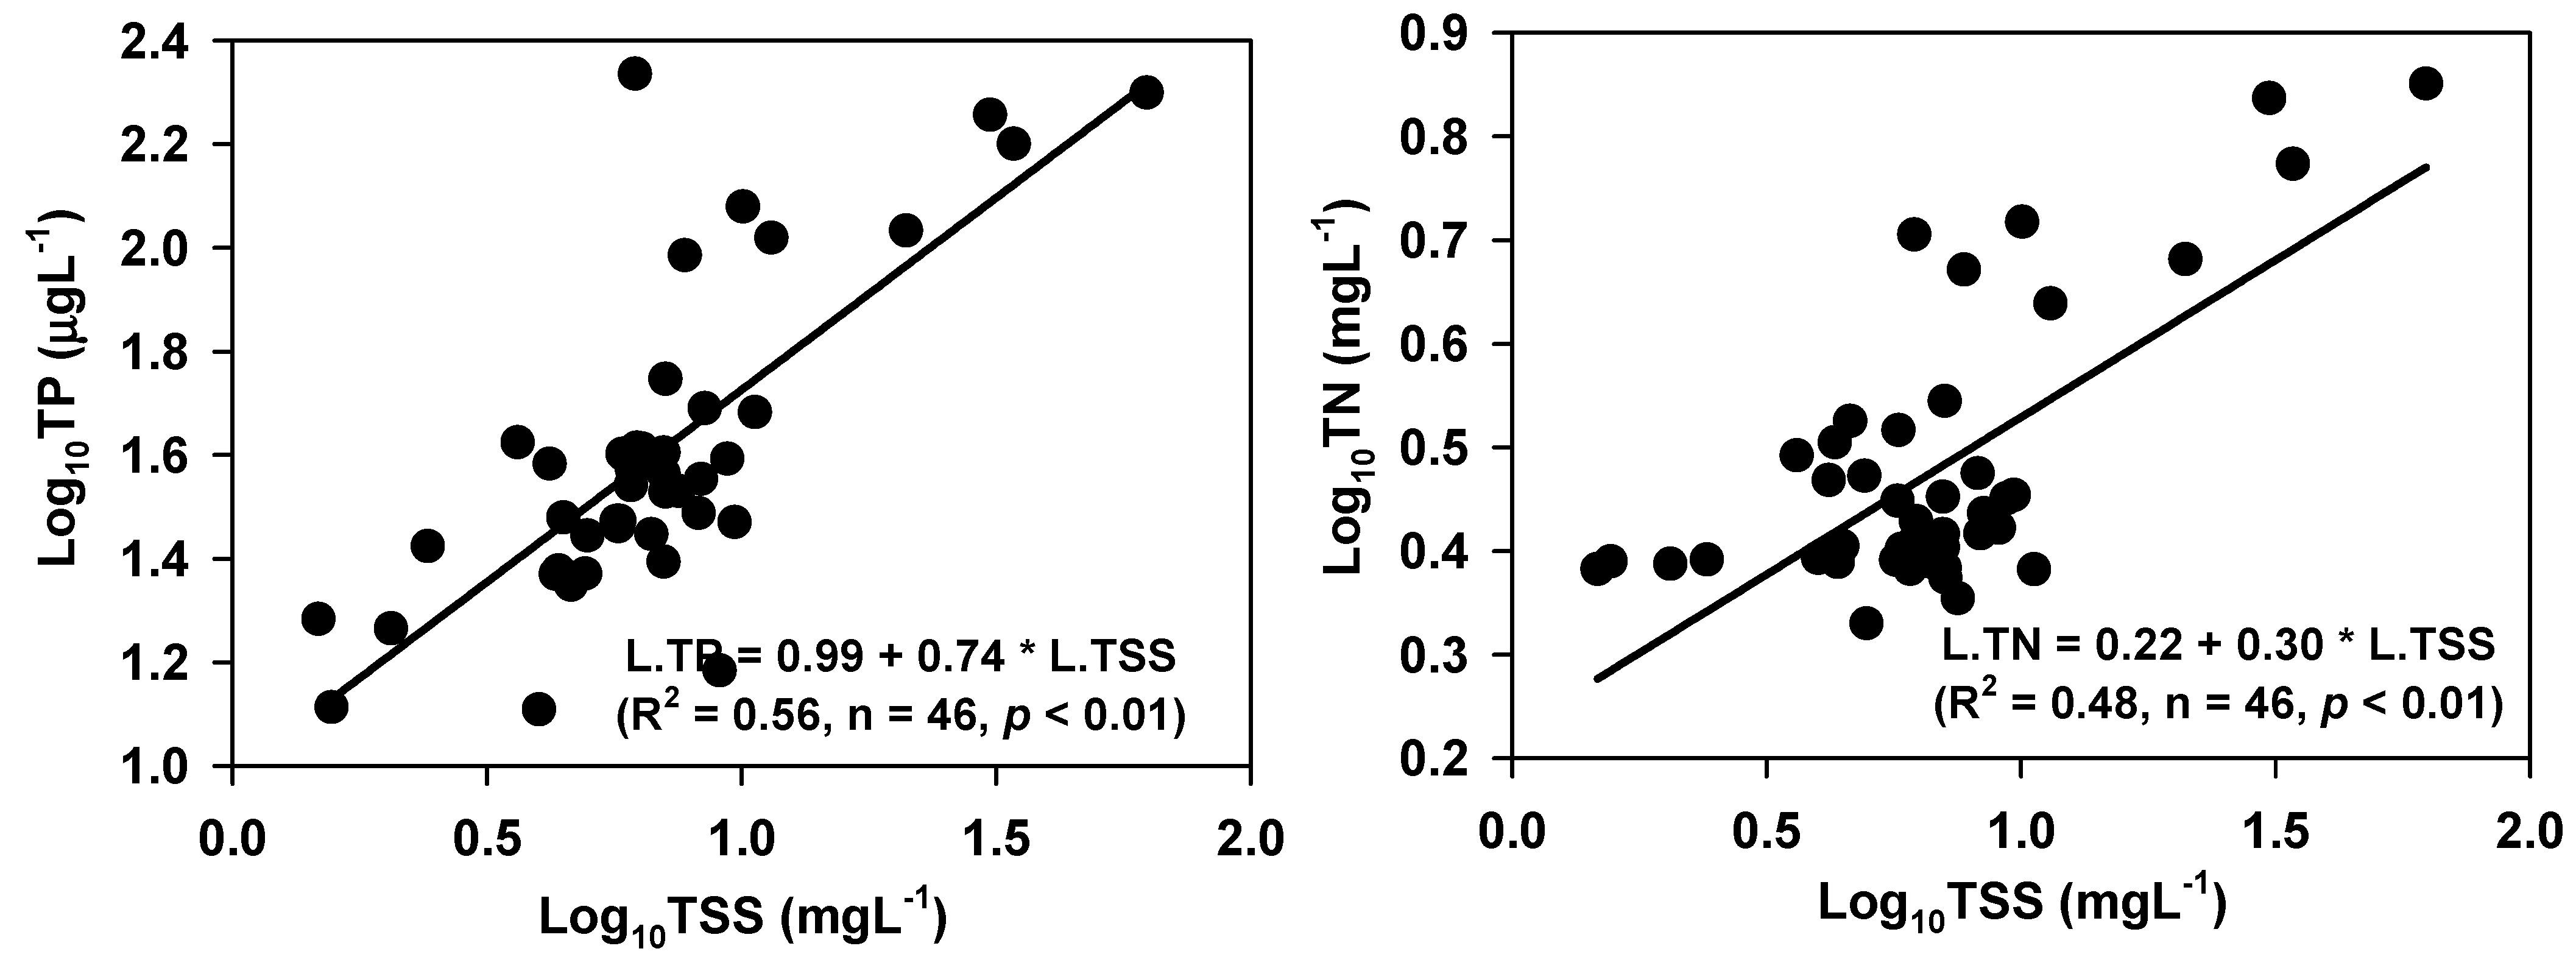
3.4. Associations between Nutrients, Suspended Solids, Organic Matter, and Land Cover Type

Regression analysis assessing the associations between water quality parameters and land cover indicated that land cover type had a distinct impact on water quality in the HRB (Figure 3). Urban and agricultural land use positively influenced TP, TN, BOD, and COD, whereas forest cover negatively affected these parameters. Agricultural land cover was significantly and positively associated with BOD (R2 = 0.13, r = 0.36, p < 0.01) and TP (R2 = 0.08, r = 0.29, p = 0.06) but not with TN (R2 = 0.008, r = 0.09, p = 0.57) and COD (R2 = 0.06, r = 0.24, p = 0.11). Associations between urban land cover and TP (R2 = 0.22, r = 0.47, p < 0.01), TN (R2 = 0.23, r = 0.48, p < 0.01), BOD (R2 = 0.13, r = 0.37, p < 0.01), and COD (R2 = 0.35, r = 0.60, p < 0.01) were significant in the HRB, with these associations influencing the concentrations of nutrients and organic matter. TP (R2 = 0.40, r = −0.63, p < 0.01), TN (R2 = 0.26, r = −0.50, p < 0.01), BOD (R2 = 0.33, r = −0.58, p < 0.01), and COD (R2 = 0.52, r = −0.72, p < 0.01) decreased significantly with increasing forest cover. To quantify the interactive effects of TSS on TP and TN in the HRB, TSS was used as a predictive variable, and TP and TN were chosen as response variables in regression analysis (Figure 4). The present findings suggest that TSS is a better predictor of TP and TN in the watershed. Regression analysis revealed that TSSlog explained 56% of the TP variance and 48% of the TN variance in the HRB.

3.5. Empirical Relationships between CHL-a and Nutrient Dynamics

The empirical model based on log-transformed TP, TN, and CHL-a from the Hz to the Dz in the HRB is presented in Table 3. Headwater and downstream algal growth levels as indicated by CHL-a level were influenced to a greater extent by TN (Hz; R2 = 0.26, p < 0.001; Dz; R2 = 0.24, p < 0.001) than by TP (Hz; R2 = 0.02, p < 0.05; Dz; R2 = 0.10, p < 0.001) in the HRB. The TP concentration (Rz1; R2 = 0.16, p < 0.02; Mz; R2 = 0.33, p < 0.001; Rz2; R2 = 0.11, p < 0.001) determined algal growth to greater extent in Rz1 (Chungju Reservoir), the Mz, and Rz2 (Paldang Reservoir) than did TN (Rz1; R2 = 0.03, p < 0.05; Mz; R2 = 0.07, p < 0.02; Rz2; R2 = 0.01, p < 0.001). The whole river regression analysis indicated that CHL-a was more responsive to changes in TP than to those in TN. Regression analysis indicated that TP and TN explained 47% and 22% of algal growth in the HRB, respectively.

3.6. Trophic State Classification

The trophic state condition of the HRB was evaluated based on the analysis of TP, TN, and CHL-a (Supplementary File, Figure S5). Based on TP, the trophic state of the HRB ranged from oligotrophic to eutrophic. Throughout the study period, the conditions in Rz1 were oligotrophic based on TP. The highest TP concentrations were found at site 34 (Domchion), designated as a eutrophic site, with 57.65% agricultural land cover and 41.76% urban cover. One remarkable characteristic of the HRB is that most sites had >1 mg L−1 of TN, suggesting that all sites were eutrophic. The trophic state parameter CHL-a indicated that conditions in Rz2 (Paldang Reservoir) and the Dz were mesotrophic except at sites 32, 33, and 34 in the Dz.

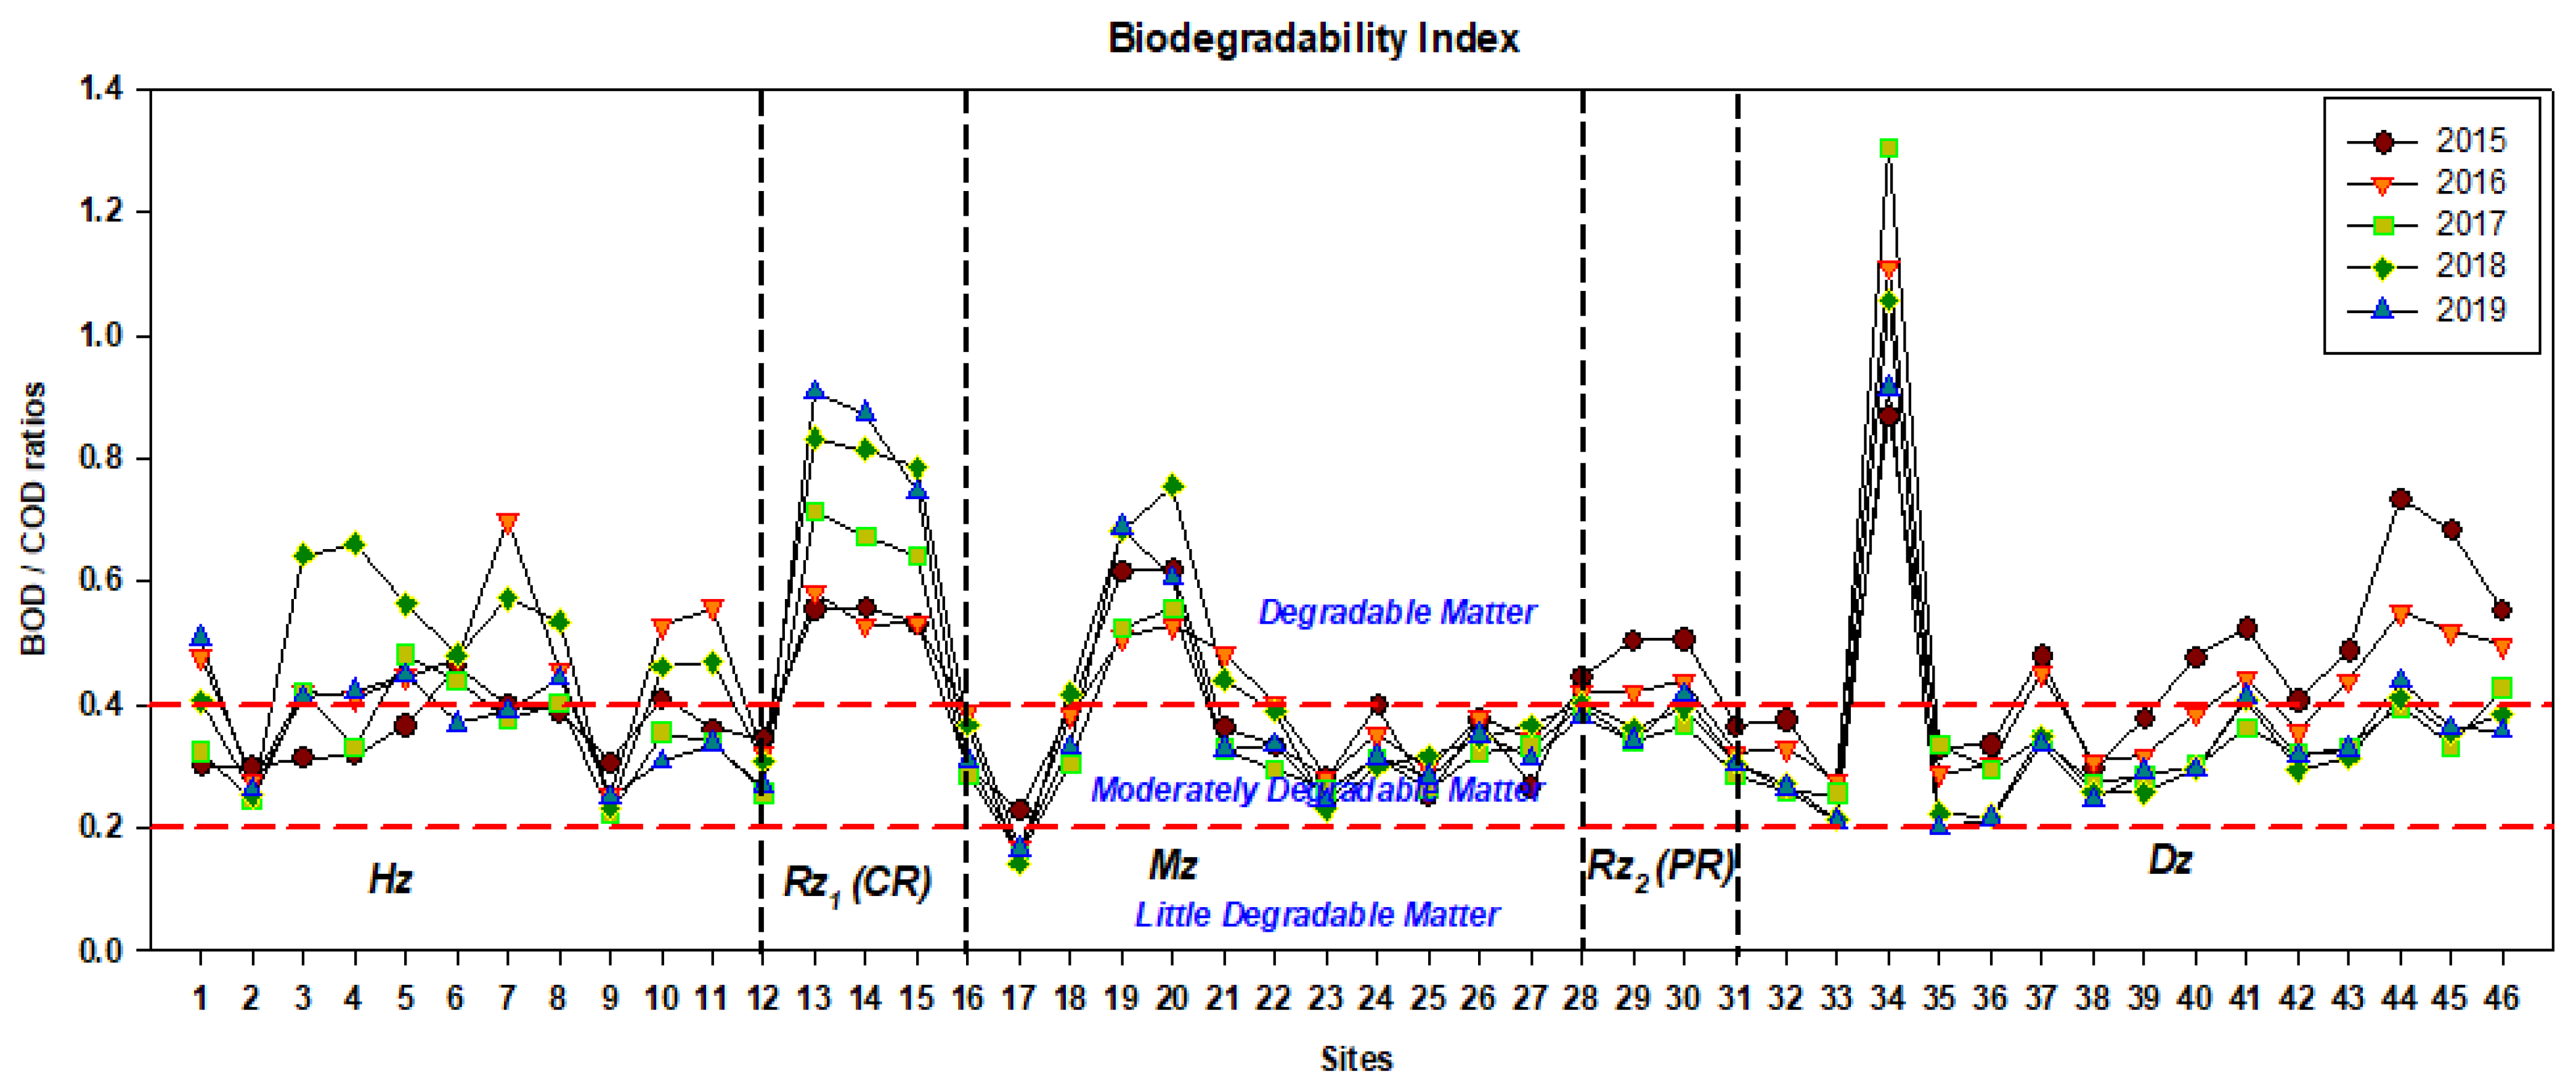
3.7. Organic Matter Enhancement and Biodegradability Index

The present study results indicate that TP and TN were suitable enhancers of BOD and COD in the watershed (Supplementary File, Figure S6). Regression analysis indicated that TP could explain 54% of the BOD and 80% of the COD increases in the HRB, whereas TN explained 52% of the BOD and 48% of the COD increases. TOC analysis of organic pollutants has been suggested as an alternative to analysis of BOD and COD in aquatic systems [50] (Supplementary File, Figure S7). The findings indicate that TOC was a good surrogate for BOD and COD in the HRB. Our results indicate that TOC has good linear relations with BOD (R2 = 0.55, p < 0.11) and COD (R2 = 0.78, p < 0.11).
The BOD is a well-known indicator of organic pollution, whereas the COD indicates both biodegradable and non-biodegradable organic pollution in water systems. Therefore, COD values are always higher than BOD values in aquatic systems. In addition, the ratio between BOD and COD, regarded as the BI, indicates the ratio of biodegradable to non-biodegradable organic materials (Figure 5). The levels of biodegradable organic pollutants increased in Rz1 (Chungju Reservoir) from 2015 to 2019. The highest levels of biodegradable organic pollution occurred at site 34 in the Dz. Our findings demonstrate that the BOD to COD ratio decreased over time, especially in the Mz, Rz2 (Paldang Reservoir), and the Dz, indicating that the BOD level was continuously decreasing. By contrast, the COD level increased due to increases in non-biodegradable organic loading in the Mz, Rz2 (Paldang Reservoir), and the Dz. Little degradable organic pollution was found at site 17 in the Mz.

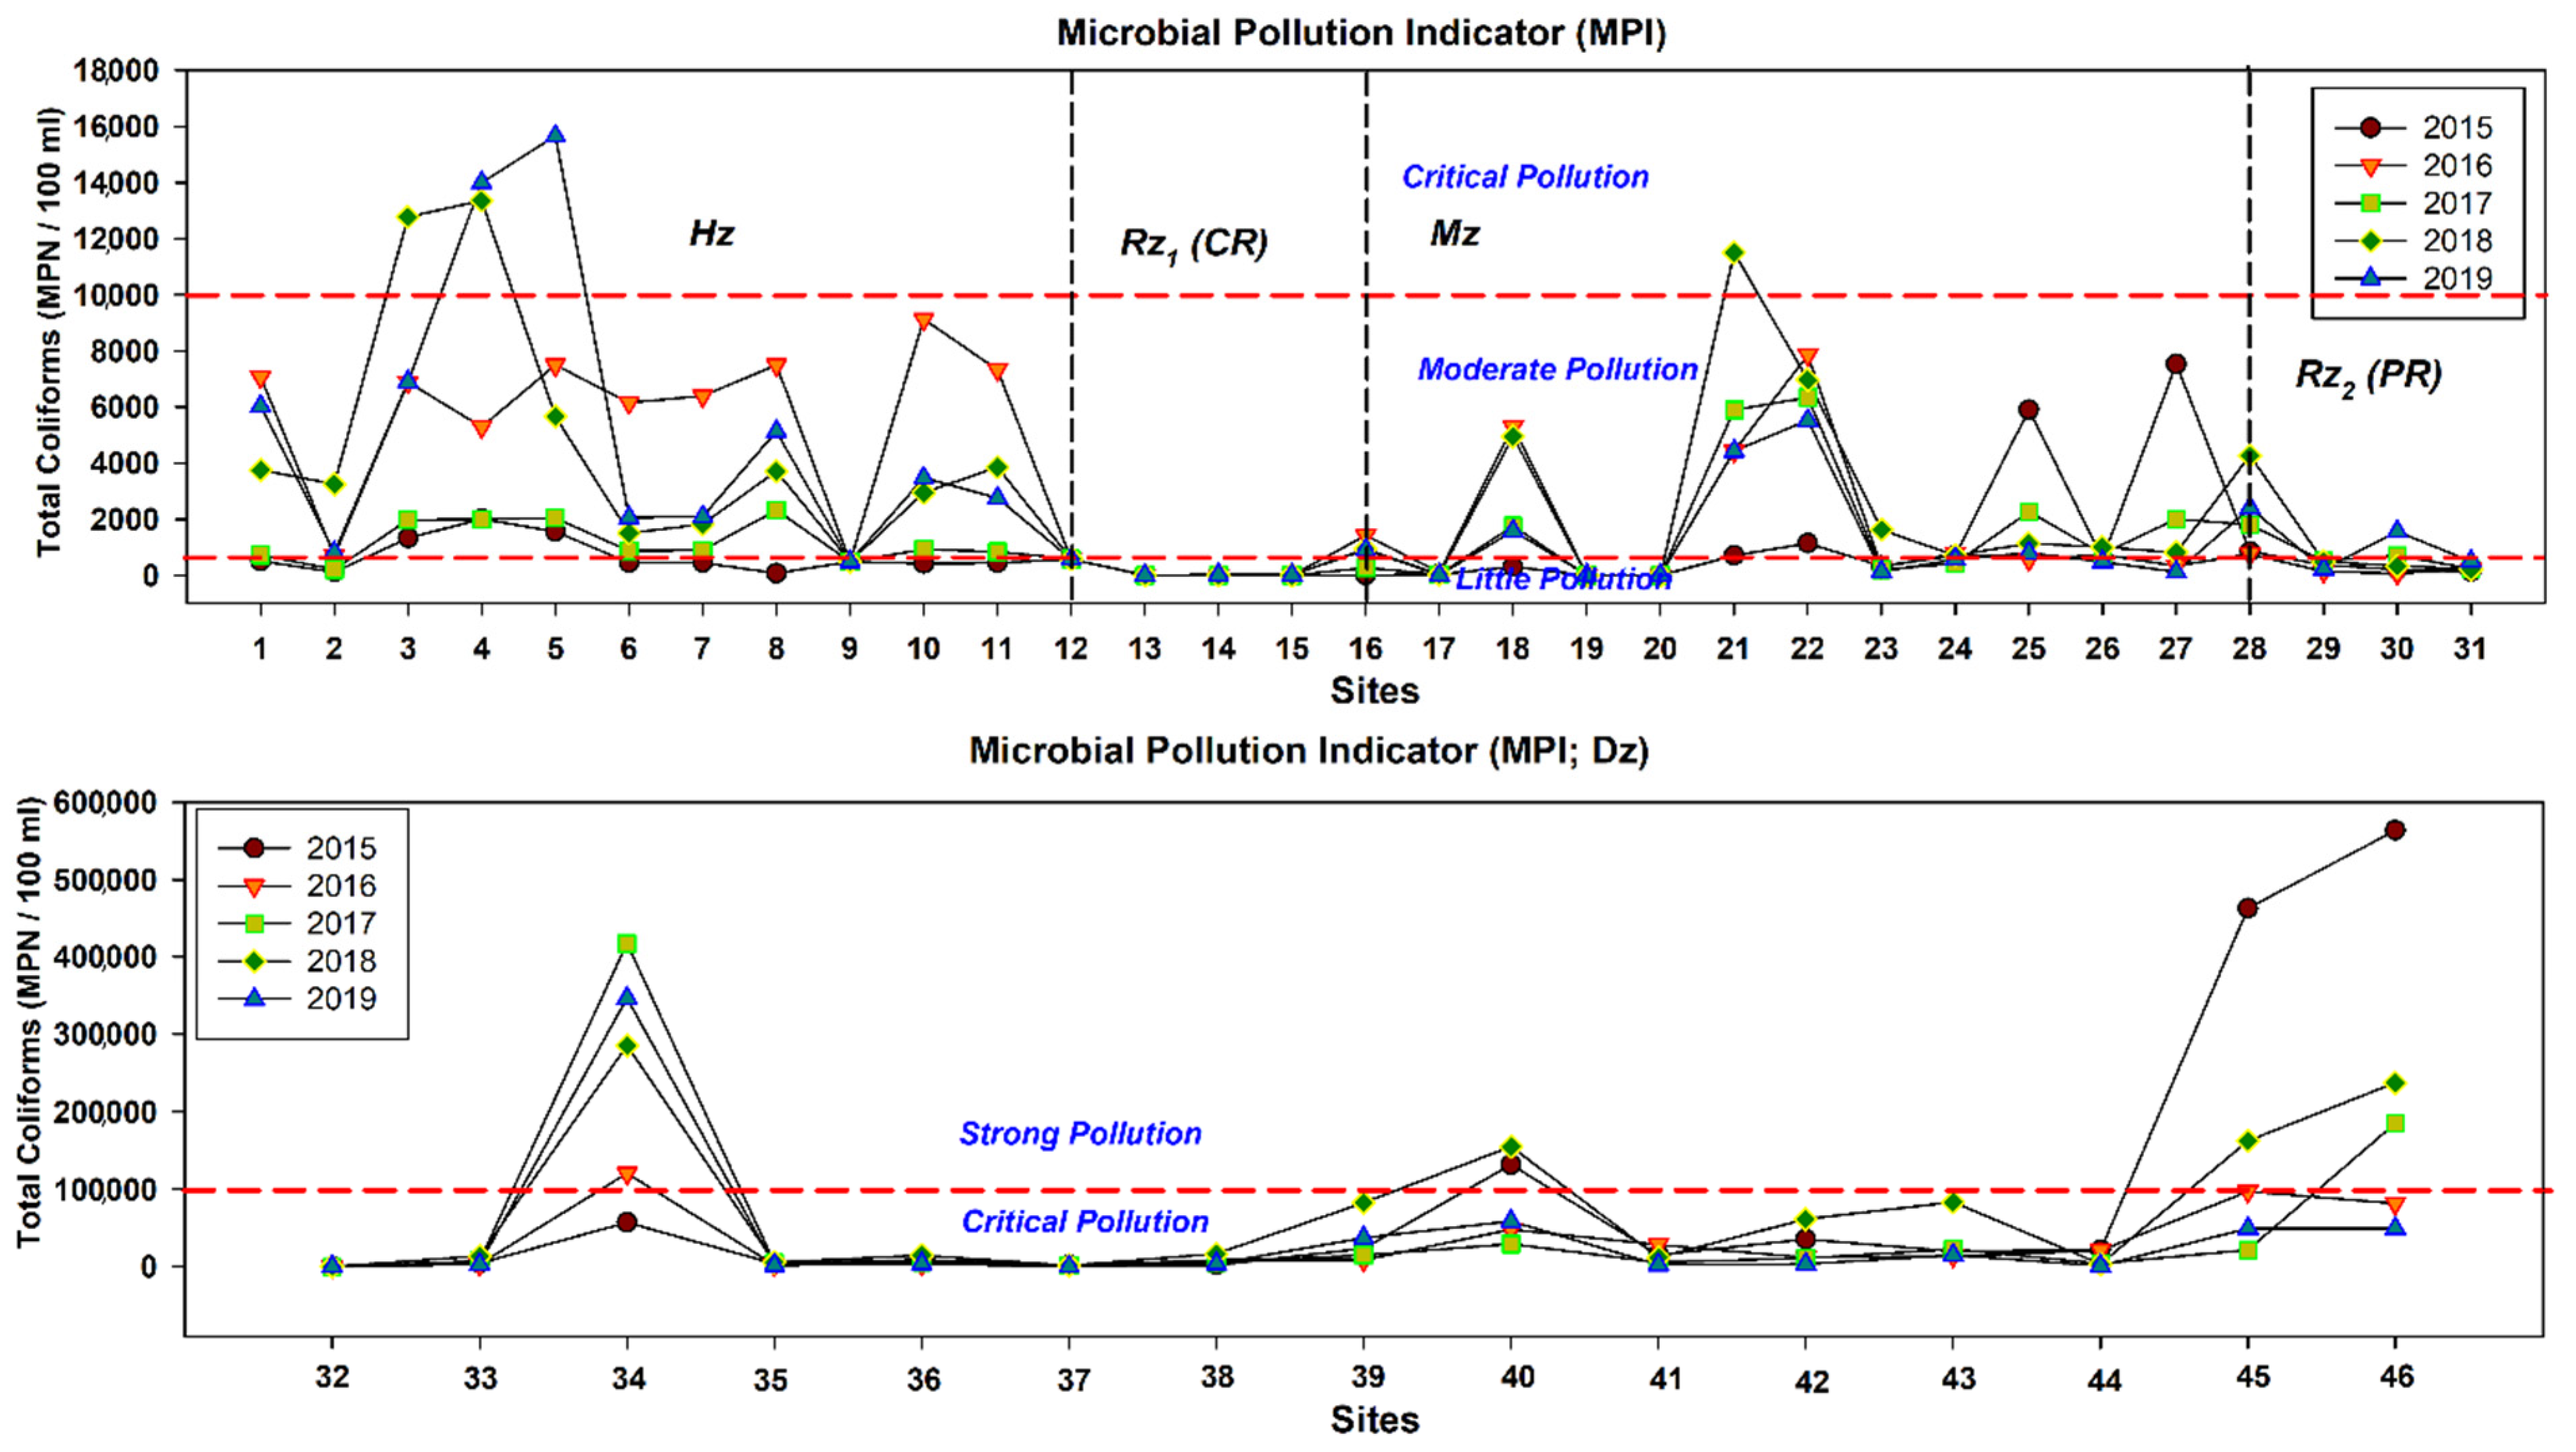
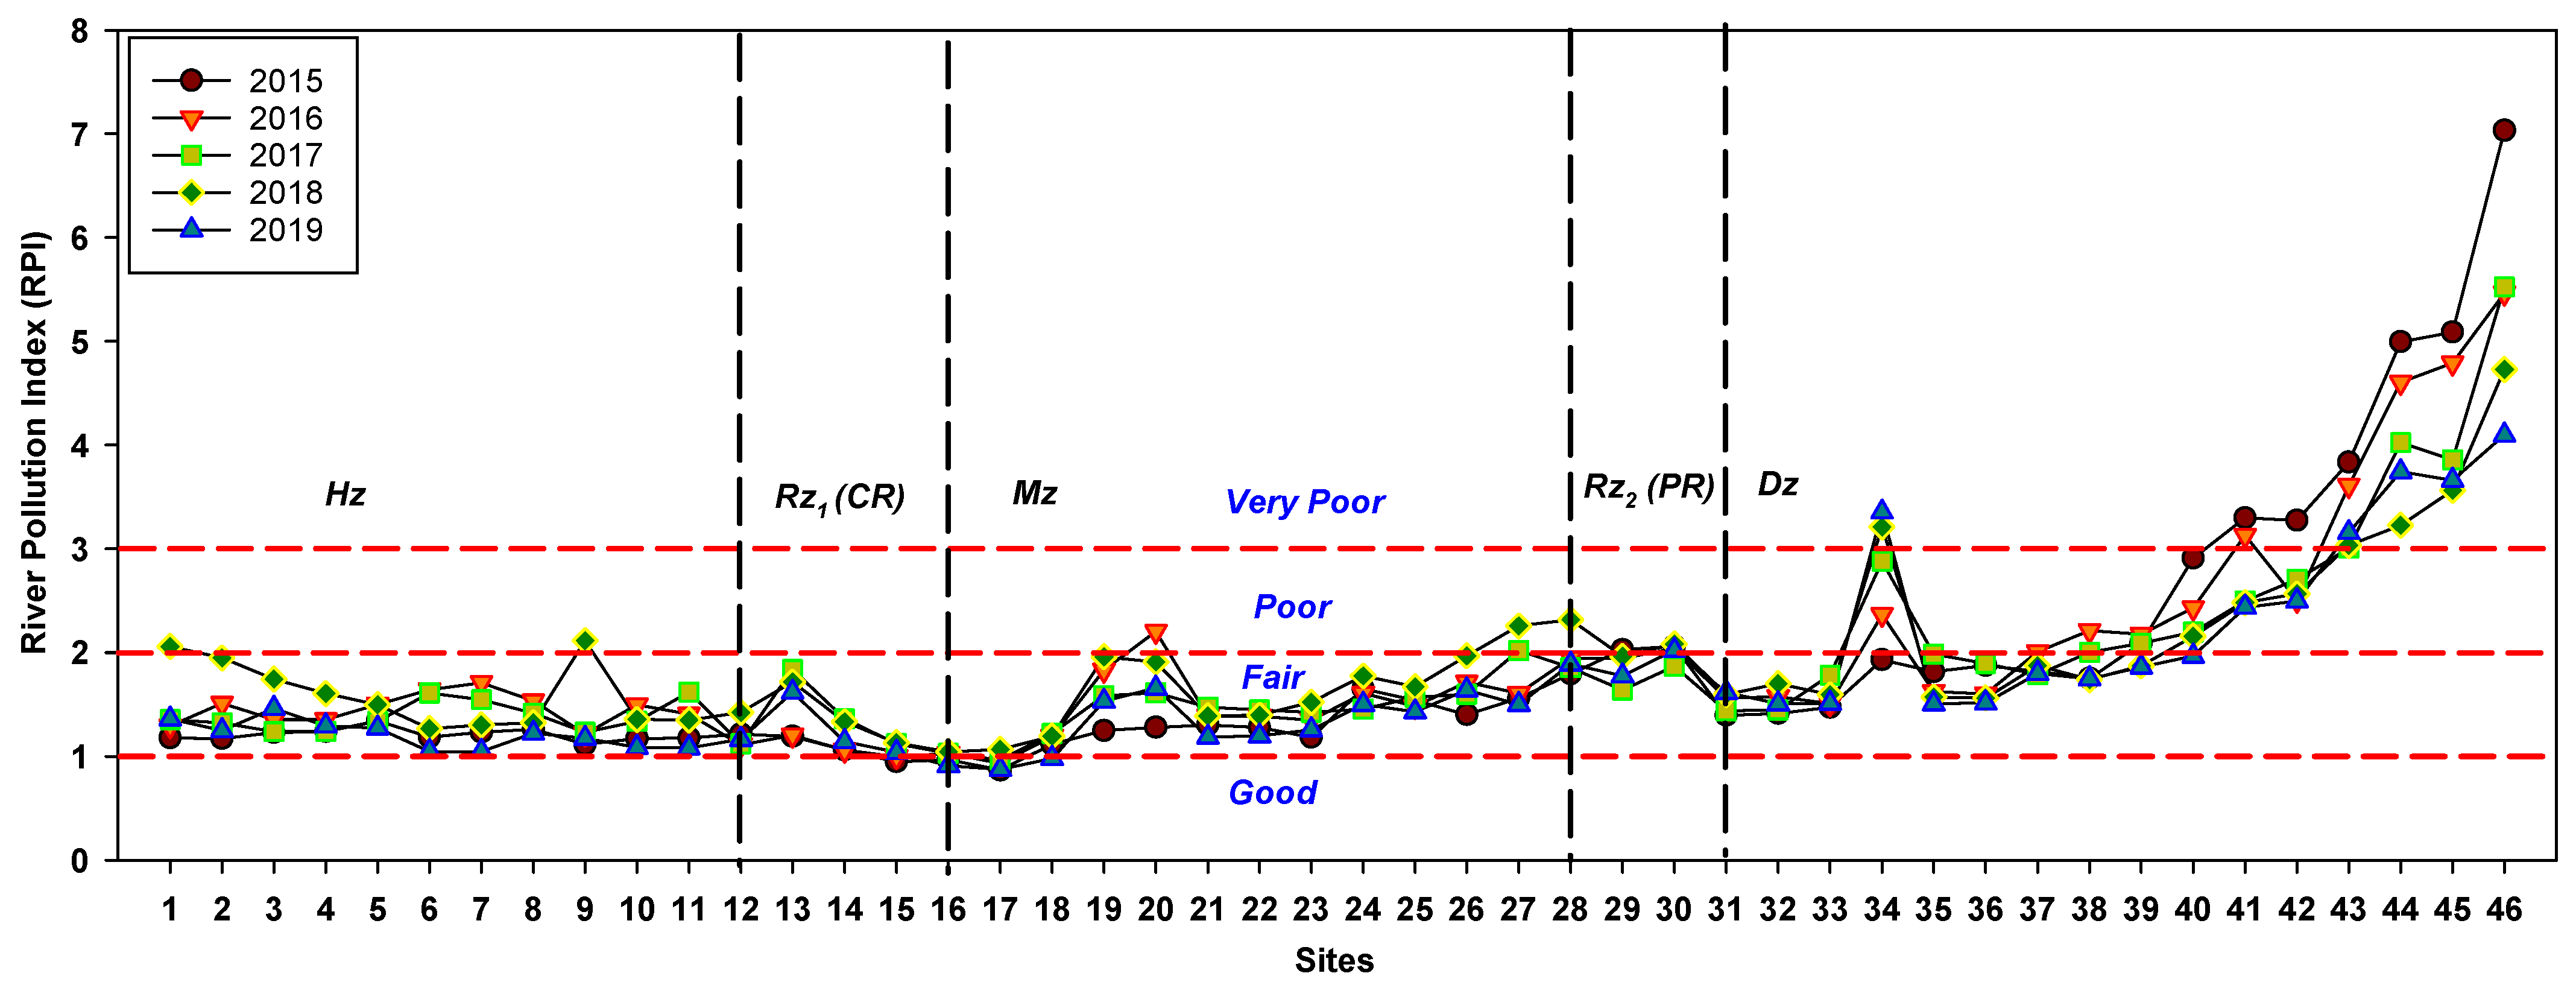
3.8. Microbial Pollution and Chemical Health

Coliform bacteria are the most important pollutants washed into aquatic systems [51]. Coliform bacteria are closely associated with nutrients and organic carbon content [11] (Supplementary File, Figure S8). The results of the present study show that TP, TN, and TOC inputs had a major positive effect on TCB. Regression analysis of TCB-TP, TCB-TN, and TCB-TOC showed that TP, TN, and TOC explained 50%, 41%, and 46% of the TCB variation in the HRB, respectively. Based on the observed abundance of coliform bacteria as indicated by the MPI, downstream areas were heavily polluted (Figure 6). It was noteworthy that the microbiological water quality in Rz1 (Chungju Reservoir) and Rz2 (Paldang Reservoir) was good. Due to stormwater and agricultural runoffs, the TCB level at site 34 increased over time. Furthermore, the lowest water quality from the viewpoint of sanitation was recorded in the downstream areas. In 2018 and 2019, critical pollution levels were recorded at sites 3, 4, and 5 in the Hz.
The RPI indicated that the chemical health of the HRB varied from the Hz to downstream areas (Figure 7). According to the RPI classification, the chemical health of the downstream areas was poor to very poor. The RPI suggested that conditions in the Hz, Rz1 (Chungju Reservoir), the Mz, and Rz2 (Paldang Reservoir) were almost fair during the study period. In the Dz, sites 34 and 43–46 were in very poor condition. The highest pollution level was always observed at site 46 due to the location of the site.

4. Discussion

4.1. Damming and Monsoon Effects on Water Quality at Different Zones

Water quality values across the channel varied heterogeneously from the Hz to downstream in the HRB. The headwater reaches had better water quality, whereas values associated with poor water quality were observed mainly at downstream reaches. Streams and rivers have three main sections at longitudinal gradient: In the headwaters, the stream or river ecosystem has deep valleys, fast flow, and better water quality; the middle section has wide valleys, gentle slopes, and moderate nutrient loading, and it also brings organic matter and nutrients to the lower part; in the lower section, the river meanders across a flat valley, and there are many human disturbances [2,17,52]. Our findings in the HRB corresponded to this longitudinal pattern. The river’s upper reaches are heavily shaded by forest and grassland, which have been reported previously to improve water quality [2,3,25]. By contrast, the downstream reaches are surrounded by towns and cities that directly affect the deterioration of water quality [2,3,6].
Moreover, the present study also observed the damming effects on river water quality. Artificial reservoirs interrupt a river’s longitudinal connectivity, altering the hydrological regime and resulting in physical, chemical, and biological changes in the impounded river [16]. Riverine transport of suspended solids and nutrients is often reduced by reservoir sedimentation and increased water transparency [53,54]. Reduced turbidity can enhance algal growth. A reservoir’s hydraulic retention time affects downstream water quality [54]. Reservoirs with smaller HRTs are usually less stratified and contain less sediment and nutrients [16,55]. Similar effects are also observed if the reservoir is controlled by a seasonal hydrological cycle [55]. The dam operation can increase daily outflow fluctuations, significantly impacting downstream hydrology and water quality [16]. The present study suggested that suspended solids and nutrients were lower in the reservoir due to reservoir sedimentation. Studies incorporating mesocosms and ecological model simulations are needed to determine the long-term impact of the artificial reservoir on river water quality.
Monsoons increase inflow and outflow in Korea during the summer. They reduce water residence time, controlling nutrient loading, suspended solids, organic carbon, algal growth, and ionic contents in the watershed [19]. The present study’s findings show that TP, TSS, TOC, and CHL-a levels were higher during the summer monsoon than during the pre-monsoon and post-monsoon seasons, supporting the notion that summer monsoons may cause distinct differences in water quality from other seasons [55,56]. Throughout the study period, significant spatial and temporal fluctuations in water quality variables were observed. The greater enrichment of TSS during the intense monsoon was attributed to an increase in TP delivered during large flood periods from the Hz to downstream areas in the HRB [57]. Inputs of nutrients, organic matter, and suspended solids are closely associated with the flow regime in the HRB. Larger inputs of TP in the Hz and Mz during the high monsoon can affect phytoplankton production in the Dz [56]. TN dilution was observed during the monsoon period.

4.2. Land Cover Effects on Nutrients and Algal Dynamics and Environmental Impacts

Globally, water quality degradation has become one of the most pressing environmental challenges. Among the numerous possible causes of poor water quality, anthropogenic activities have contributed significantly to elevated levels of nutrients, organic matter, suspended solids, and algal chlorophyll in rivers and streams, resulting in eutrophication [58]. Previous research suggested that increased urbanization with a higher degree of impervious surface coverage and intensive agricultural farming has increased TP and TN levels, BOD, COD, and fecal bacterial counts in surface waters [3,11]. Intensive agriculture farming includes crop agriculture, pastureland, and concentrated animal feeding operations [6]. Agricultural processes are considered an important source of sediment, nutrients, organic matter, and microbial pollution to stream and river systems [12]. Leakage and seepage from agricultural land are responsible for pollution in downslope waters. The present study’s findings indicate that nutrients, organic matter, and microbial pollution are positively correlated with intensive farming systems. The relationships between urban development, nutrients, organic matter, and fecal microbes are well documented in surface waters [11]. Consistent with the present results, [3,8,15] reported that TP, TN, BOD, COD, and TCB were positively related to the watershed population and percentage of developed land. Without appropriate restoration management policies, near-stream areas with agricultural and urban land cover are vulnerable to high pollution levels.
Moreover, nutrients can enter into the water body from point sources (human and industrial wastewater plants) and nonpoint sources (septic systems, crop agriculture, urban runoff, subsurface transport from swine, cattle, or poultry farms). Most nutrients are bound to sediments during surface runoff [11]. Ref. [59] reported that 75–90% of P could be bound to suspended solids. The strong association between nutrients (P and N) and suspended solids negatively affects water quality, including increasing light attenuation and affecting benthic microalgal abundance and composition [11]. This pollutant-transport function suggests that suspended solids act as TP and TN carriers, which was consistent with the present study’s findings [5]. BOD and COD have been used globally to evaluate organic contaminant pollution in aquatic systems [5,50]. Nutrient inputs to the streams can enhance organic matter concentrations. The present study results suggest that TP and TN were positively related to BOD and COD. The ratio between BOD and COD can be used to estimate organic matter biodegradability in a system [38]. The present results show that the BOD/COD ratio decreased at most study sites in the HRB, indicating the presence of moderately degradable matter. These observations suggest that BOD was reducing and COD increasing, implying an increase in non-biodegradable organic load from wastewater treatment plants [50]. Previously published research indicated a rise in the prevalence and permanence of inorganic particles from wastewater treatment plants in rivers throughout the United States of America [60]. As a result, lower BOD/COD ratios may be associated with an increase in non-biodegradable organic contaminants in rivers. According to present findings, industries may not strictly comply with environmental regulations, contributing to the high level of non-degradable compounds discharged into rivers [40]. TOC has recently been promoted as a viable alternative to BOD and COD as a measure of water quality due to its numerous advantages, including rapidity and accuracy of determination, low hazardous waste production, and the lack of influence by the presence of obstructive substances.
The Han River watershed is characterized as having oligotrophic, mesotrophic, and eutrophic conditions on the basis of mean TP, TN, and CHL-a concentrations [41]. The present findings were similar to the previous TSC of Korean streams and rivers [61]. Agricultural fertilizers, animal manure, and urban sewage are the principal nutrient sources in streams and rivers [25]. Based on TP concentrations, most of the downstream sites were eutrophic. One remarkable feature of Korean streams and rivers is that most had TN > 1 mg L−1, classified as eutrophic, a finding that is consistent with some earlier studies [8,14]. In addition, most temperate streams worldwide are nitrogen-rich systems [41,62]. Therefore, parameters in the Han River watershed, particularly the Dz, exceed the standards indicating good water quality.
Earlier studies of nutrients and algal biomass were focused on lentic systems and showed that nutrients in the water column were good indicators of algal growth [63,64,65]. These findings were initially adopted in stream and river ecology. However, it was immediately realized that nutrients were poor indicators of algal development in lotic systems, owing to the complex interplay between nutrients, temperature, pH, light, streamflow, habitat conditions, and invertebrate and fish grazing [62,66,67,68]. Therefore, the relationships between nutrients and algal biomass exhibit a high degree of variability in lotic systems and are considered inappropriate for use in decision making [62,69]. The conceptual model of nutrient–algal biomass states that the relationships between nutrients and algal growth as indicated by CHL-a level are controlled via a combination of habitat and biological processes [69]. In headwater streams, TP was not a better indicator of algal growth compared with TN due to the forested riparian area with heavy canopy cover and high water flow. TP was a better predictor of CHL-a than was TN in Rz1, the Mz, and Rz2. Algal growth downstream is influenced to a greater extent by TN than by TP. In the entire HRB, TP and TN explained 47% and 22% of CHL-a variation, respectively. The positive CHL-a-TP and CHL-a-TN relations in the HRB support the findings of previous research conducted in Delmarva and Snake River, USA [62]. These zonal and regional relations between nutrients and CHL-a should be investigated further to assess the impacts of TP and TN on CHL-a.

4.3. Socio-Economic Impacts

Water resource development in Korea was initiated during 1960–1980 for pursuing environment-friendly river maintenance and reservoir construction based on water use and control [70]. Reservoir construction reflects economic growth, improves the quality of life, and upgrades land value [70,71]. In Korea, large reservoirs have been constructed for hydroelectric power generation, water supply, and flood risk reduction [70]. Paldang Reservoir and Chungju Reservoir supply drinking water daily to the metropolitan area (Seoul, Gyeonggi, Incheon) where nearly half of South Korea’s people live, indicating the importance of socio-economic aspects. In particular, Paldang Reservoir supplies 3.65 million tons of drinking water per day. More than 50% of the total population in South Korea is concentrated in Seoul and Gyeonggi Province, which are supplied by the two reservoirs. The intense water supply structure poses a high risk of simultaneous contamination of drinking water by residents of the metropolitan area in the downstream region if the upper stream of the site under this study is contaminated. In addition, excessive preservation regulations in the upper reaches of Paldang Reservoir and Chungju Reservoir prevent regional development and amplify damage and conflict on the water use among local residents, with the result being that water quality and quantity for drinking water are becoming the most important hot issues from a socioeconomic perspective.

4.4. Health Risks

Pollution has a stronger correlation with health problems. Poor water quality destroys crops and contaminates our food, posing a threat to aquatic and human life. Nutrients, organic, and ionic pollutants disrupt the food chain and harm fishes’ respiratory systems. Pollution-clogged gills are lethal to fish. When humans consume these fish, it creates a major health problem. A modified RPI with nine water quality factors was used to determine the pollution level of the Han River. The mean TP concentration surpassed the standard value established by the Korean Ministry of Environment, except at Rz1 in the HRB. TN values were >1.5 mg L−1 at all sites in the HRB, indicating a eutrophic state. The BOD and COD levels suggest that the watershed was undergoing continuous degradation throughout the study period. High flushing rate along with agricultural and urban runoffs resulted in higher suspended solids, CHL-a, and ionic content in the downstream. The RPI model suggested that most upstream, Rz1, and midstream sites were in good to fair condition, whereas Rz2 and downstream sites were in fair to very poor condition. The present study results indicate that the watershed health, especially at downstream sites, is abnormal due to excessive accumulation of nutrients, organic matter, and ionic content. Our findings are in line with prior research, which has shown that contaminants significantly impact the downstream water [2,7,15].
Fecal pollution of water sources is a common cause of fecal–oral transmission of aquatic infectious illnesses [12,72]. Polluted water has been linked to a variety of illnesses, including respiratory problems, cancer, diarrhea, neurological problems, and cardiovascular disease in humans and other animals [73]. According to previous research, diarrhea is primarily caused by untreated drinking water and fecal contamination of water [42,72,73]. Fecal bacterial concentration was shown to be related to the degree of commercial development near the watershed area. Ref. [11] suggested a significant positive impact of nutrients and organic carbon inputs on fecal coliform bacteria in streams. Our results indicate that TP, TN, and TOC inputs have major positive effects on TCB. Based on the MPI classification, the Han River exhibited strong and critical pollution at the downstream and upstream sites, indicating their unsuitability for drinking and swimming. The indicators of coliform bacteria contamination confirmed the negative impact of municipal wastewater and animal manure on microbiological water quality [42]. The present results indicate that actions must be taken to control microbial pollution in the HRB, particularly at the downstream sites and at some upstream sites.

5. Conclusions

The present study suggests that a mix of empirical models and pollution indices could be used to assess river water quality. The water quality indices varied depending on study sites, along with the longitudinal scale of rivers. Pollution indices indicated that the river’s downstream section is severely polluted. The river water was extremely susceptible to eutrophication. The classification of pollution levels of the Han River using different indices may provide significant support for water pollution monitoring. Moreover, the results presented here indicate that surface water pollution is higher in downstream areas than in other zones and is influenced by the summer monsoon and damming effects. Watershed urbanization and intensive farming are both responsible for the transportation of coliform bacteria, nutrients, and organic matter to the surface water. Empirical model research showed that TSS exhibited clear associations with TP and TN. TP and TN were strongly correlated with CHL-a, BOD, and COD. TP, TN, and TOC showed good relations with TCB. These findings indicate that attempts to minimize TSS loading in water bodies would have a number of beneficial effects, including increased water clarity and decreased nutrients, organic matter, and fecal bacteria level. In addition, several steps can be taken to protect the Han River’s water quality: reducing industrial and domestic effluent disposal from Seoul City to the downstream; implementing cutting-edge treatment technologies for treating urban and animal wastewater prior to discharge into the river; restricting fertilizer use and land development within the catchment area; strictly enforcing water quality regulations; routine check on river’s water quality; and developing and implementing new management strategies.

Supplementary Materials

The following are available online at https://www.mdpi.com/article/10.3390/w14020237/s1, Figure S1: Annual and seasonal rainfall pattern of the study area, Figure S2: Annual variations in water quality parameters in the Han River. Hz, headwater zone; Rz1, reservoir zone 1; Mz, midwater zone; Rz2, reservoir zone 2; and Dz, downwater zone; TP, total phosphorus; TN, total nitrogen; BOD, biological oxygen demand; COD, chemical oxygen demand; TSS, total suspended solids; TOC, total organic carbon; EC, electrical conductivity; and CHL-a, chlorophyll-a, Figure S3: Seasonal variations in TP, TN, and CHL-a from Hz to Dz in the HRB. Hz, headwater zone; Rz1 (CR), reservoir zone 1 (Chugju Reservoir); Mz, midwater zone; Rz2 (PR), reservoir zone 2 (Paldang Reservoir); and Dz, downwater zone; HRB, Han River basin, Figure S4: Seasonal variations in TSS, TOC, and EC from Hz to Dz in the HRB. Hz, headwater zone; Rz1 (CR), reservoir zone 1 (Chugju Reservoir); Mz, midwater zone; Rz2 (PR), reservoir zone 2 (Paldang Reservoir); and Dz, downwater zone; HRB, Han River basin, Figure S5: Trophic state condition of Han River. Hz, headwater zone; Rz1 (CR), reservoir zone 1 (Chugju Reservoir); Mz, midwater zone; Rz2 (PR), reservoir zone 2 (Paldang Reservoir); Dz, downwater zone; TP, total phosphorus; TN, total nitrogen; and CHL-a, chlorophyll-a, Figure S6: Relations among nutrients (TP, total phosphorus; TN, total nitrogen) and organic matters (BOD, biological oxygen demand; COD, chemical oxygen demand) in the Han River, Figure S7: Relations among TOC (total organic carbon), BOD (biological oxygen demand), and COD (chemical oxygen demand) in the Han River, Figure S8: Influence of TP (total phosphorus), TN (total nitrogen), and TOC (total organic carbon) on TCB (total coliform bacteria) in the Han River, Table S1: Details of sampling sites, zones with coordinates of Han River watershed, Table S2: Land use coverage data of the studied sites.

Author Contributions

Conceptualization, M.M. and K.-G.A.; methodology, M.M.; software, M.M.; validation, M.M.; formal analysis, M.M.; investigation, M.M.; resources, M.M., J.Y.K. and J.-E.K.; data curation, M.M., J.Y.K. and J.-E.K.; writing—original draft preparation, M.M.; writing—review and editing, M.M.; visualization, M.M. and K.-G.A.; supervision, K.-G.A.; project administration, K.-G.A.; funding acquisition, K.-G.A. All authors have read and agreed to the published version of the manuscript.

Funding

This research was supported by the Korea Environmental Industry & Technology Institute (KEITI) through (Project #: 2020003050004) the Aquatic Ecosystem Conservation Research Program, funded by Korea Ministry of Environment (MOE).

Institutional Review Board Statement

Not applicable.

Informed Consent Statement

Not applicable.

Data Availability Statement

The datasets studied during the present study are available from the corresponding author on reasonable request.

Acknowledgments

This research was supported by the Korea Environment Industry & Technology Institute (KEITI) through (Project #: 2020-1008-01) and also supported by Daejeon Green Environment Center under the Research Development Program (Yr 2016). Therefore, the authors would like to acknowledge for their supports.

Conflicts of Interest

The authors declare that they have no conflict of interest.

References

  1. Zhang, W.; Chen, D.; Li, H. Spatio-temporal dynamics of water quality and their linkages with the watershed landscape in highly disturbed headwater watersheds in China. Environ. Sci. Pollut. Res. 2018, 25, 35287–35300. [Google Scholar] [CrossRef] [PubMed]
  2. Wen, T.; Sheng, S.; Xu, C.; Xu, D.; Wan, Y.; An, S. Longitudinal changes in water quality to landscape gradients along sha river basin. Clean-Soil Air Water 2015, 43, 1609–1615. [Google Scholar] [CrossRef]
  3. Chang, H. Spatial analysis of water quality trends in the Han River basin, South Korea. Water Res. 2008, 42, 3285–3304. [Google Scholar] [CrossRef] [PubMed]
  4. Luo, P.; He, B.; Takara, K.; Razafindrabe, B.H.N.; Nover, D.; Yamashiki, Y. Spatiotemporal trend analysis of recent river water quality conditions in Japan. J. Environ. Monit. 2011, 13, 2819–2829. [Google Scholar] [CrossRef] [PubMed] [Green Version]
  5. Mallin, M.A.; Johnson, V.L.; Ensign, S.H. Comparative impacts of stormwater runoff on water quality of an urban, a suburban, and a rural stream. Environ. Monit. Assess. 2009, 159, 475–491. [Google Scholar] [CrossRef]
  6. Mallin, M.A. Effect of Human Land Development on Water Quality; Elsevier Inc.: Amsterdam, The Nehterlands, 2009; ISBN 9780123741929. [Google Scholar]
  7. Mallin, M.A.; Turner, M.I.H.; McIver, M.R.; Toothman, B.R.; Freeman, H.C. Significant reduction of fecal bacteria and suspended solids loading by coastal best management practices. J. Coast. Res. 2016, 320, 923–931. [Google Scholar] [CrossRef]
  8. Mamun, M.; An, K.-G. Ecological health assessments of 72 streams and rivers in relation to water chemistry and land-use patterns in South Korea. Turk. J. Fish. Aquat. Sci. 2018, 18, 871–880. [Google Scholar] [CrossRef]
  9. Mallin, M.A.; Johnson, V.L.; Ensign, S.H.; MacPherson, T.A. Factors contributing to hypoxia in rivers, lakes, and streams. Limnol. Oceanogr. 2006, 51, 690–701. [Google Scholar] [CrossRef] [Green Version]
  10. NRC. Clean Coastal Waters: Understanding and Reducing the Effects of Nutrient Pollution; The National Academies Press: Washington, DC, USA, 2000. [Google Scholar]
  11. Mallin, M.A.; Cahoon, L.B. The hidden impacts of phosphorus pollution to streams and rivers. Bioscience 2020, 70, 315–329. [Google Scholar] [CrossRef]
  12. Chudoba, E.A.; Mallin, M.A.; Cahoon, L.B.; Skrabal, S.A. Stimulation of fecal bacteria in ambient waters by experimental inputs of organic and inorganic phosphorus. Water Res. 2013, 47, 3455–3466. [Google Scholar] [CrossRef]
  13. Vannote, R.L.; Minshall, G.W.; Cummins, K.W.; Sedell, J.R.; Cushing, C.E. The river continuum concept. Can. J. Fish. 1980, 37, 130–137. [Google Scholar] [CrossRef]
  14. HaRa, J.; Mamun, M.; An, K.G. Ecological river health assessments using chemical parameter model and the index of biological integrity model. Water 2019, 11, 1729. [Google Scholar] [CrossRef] [Green Version]
  15. Alford, J.B.; Debbage, K.G.; Mallin, M.A.; Liu, Z.J. Surface water quality and landscape gradients in the north carolina cape fear river basin: The key role of fecal coliform. Southeast. Geogr. 2016, 56, 428–453. [Google Scholar] [CrossRef]
  16. Fantin-Cruz, I.; Pedrollo, O.; Girard, P.; Zeilhofer, P.; Hamilton, S.K. Changes in river water quality caused by a diversion hydropower dam bordering the Pantanal floodplain. Hydrobiologia 2016, 768, 223–238. [Google Scholar] [CrossRef]
  17. Ward, J.V. The four-dimensional nature of lotic ecosystems. N. Am. Benthol. Soc. 1989, 8, 2–8. [Google Scholar] [CrossRef]
  18. Inoue, M.; Nunokawa, M. Effects of longitudinal variations in stream habitat structure on fish abundance: An analysis based on subunit-scale habitat classification. Freshw. Biol. 2002, 47, 1594–1607. [Google Scholar] [CrossRef]
  19. Mamun, M.; Kim, J.Y.; An, K.G. Trophic responses of the Asian reservoir to long-term seasonal and interannual dynamic monsoon. Water 2020, 12, 2066. [Google Scholar] [CrossRef]
  20. Ingole, N.P.; An, K.G. Modifications of nutrient regime, chlorophyll-a, and trophic state relations in daechung reservoir after the construction of an upper dam. J. Ecol. Environ. 2016, 40, 5. [Google Scholar] [CrossRef] [Green Version]
  21. Choi, Y.; Lee, E.; Ji, J.; Ahn, J.; Kim, T.; Yi, J. Development and evaluation of the hydropower reservoir rule curve for a sustainable water supply. Sustainability 2020, 12, 9641. [Google Scholar] [CrossRef]
  22. MOST. Studies on Water Pollution of the Han River, Seoul, Korea; MOST: Seoul, Korea, 1975.
  23. MOE. Water Environment of Seoul. In Status of the Environment in the City of Seoul, Seoul, Korea; MOE: Seoul, Korea, 2003. [Google Scholar]
  24. Shin, M.S.; Lee, J.Y.; Kim, B.; Bae, Y.J. Long-term variations in water quality in the lower Han River. J. Ecol. Biol. 2011, 34, 31–37. [Google Scholar] [CrossRef] [Green Version]
  25. Chang, H. Spatial and temporal variations of water quality in the han river and its tributaries, Seoul, Korea, 1993–2002. Water. Air. Soil Pollut. 2005, 161, 267–284. [Google Scholar] [CrossRef]
  26. Kim, J.H.; Jo, J. Chemical Oxygen Demand (COD) model for the assessment of water quality in the Han River, Korea. Korean J. Environ. Health Sci. 2016, 42, 280–292. [Google Scholar] [CrossRef]
  27. Park, M.; Cho, Y.; Shin, K.; Shin, H.; Kim, S.; Yu, S. Analysis of water quality characteristics in unit watersheds in the hangang basin with respect to tmdl implementation. Sustainability 2021, 13, 9999. [Google Scholar] [CrossRef]
  28. Choi, E.; Kim, G.; Yun, Z. An approach for the estimation of NPS pollutant discharge. J. Korean Assoc. Water Qual. 1994, 10, 189–194. [Google Scholar]
  29. Kim, L.H.; Choi, E. Phosphorus Release from Sediment with Environmental Changes in Han River. In Proceedings of the 4th Conference of Korean Association of Water Quality, Pusan, Seoul, Korea, 19–20 April 1996. [Google Scholar]
  30. Hecky, R.E.; Kilham, P. Nutrient limitation of phytoplankton in freshwater and marine environments: A review of recent evidence on the effects of enrichment. Limnol. Oceanogr. 1988, 33, 796–822. [Google Scholar] [CrossRef] [Green Version]
  31. Jones, J.R.; Knowlton, M.F.; An, K.G. Trophic state, seasonal patterns and empirical models in South Korean Reservoirs. Lake Reserv. Manag. 2003, 19, 64–78. [Google Scholar] [CrossRef]
  32. Elser, J.J.; Marzolf, E.R.; Goldman, C.R. Phosphorus and nitrogen limitation of phytoplankton growth in the freshwaters of North America: A review and critique of experimental enrichments. Can. J. Fish. Aquat. Sci. 1990, 47, 1468–1477. [Google Scholar] [CrossRef]
  33. Gurjar, S.K.; Tare, V. Spatial-temporal assessment of water quality and assimilative capacity of river Ramganga, a tributary of Ganga using multivariate analysis and QUEL2K. J. Clean. Prod. 2019, 222, 550–564. [Google Scholar] [CrossRef]
  34. Ryu, J.S.; Lee, K.S.; Chang, H.W. Hydrogeochemical and isotopic investigations of the Han River basin, South Korea. J. Hydrol. 2007, 345, 50–60. [Google Scholar] [CrossRef]
  35. Chang, H.; Kwon, W.T. Spatial variations of summer precipitation trends in South Korea, 1973–2005. Environ. Res. Lett. 2007, 2, 045012. [Google Scholar] [CrossRef] [Green Version]
  36. Kim, L.H.; Choi, E.; Stenstrom, M.K. Sediment characteristics, phosphorus types and phosphorus release rates between river and lake sediments. Chemosphere 2003, 50, 53–61. [Google Scholar] [CrossRef]
  37. MOE. Standard Methods for the Examination of Water Quality Contamination, 7th ed.; Ministry of Environemnt (MOE): Gwacheon, Korea, 2000; p. 435. (In Korean)
  38. Lai, T.M.; Shin, J.K.; Hur, J. Estimating the biodegradability of treated sewage samples using synchronous fluorescence spectra. Sensors 2011, 11, 7382–7394. [Google Scholar] [CrossRef] [Green Version]
  39. Martín, I.; Betancourt, J. Guía Sobre Tratamientos de Aguas Residuales Urbanas para Pequeños Núcleos de Población. Mejora de la Calidad de los Efluentes, 1st ed.; Daute Diseño, S.L.: Las Palmas, Spain, 2006. [Google Scholar]
  40. Vizcaino, I.P.; Carrera, E.V.; Sanromán-Junquera, M.; Muñoz-Romero, S.; Rojo-Álvarez, J.L.; Cumbal, L.H. Spatio-temporal analysis of water quality parameters in machángara river with nonuniform interpolation methods. Water 2016, 8, 507. [Google Scholar] [CrossRef]
  41. Dodds, W.K.; Jones, J.R.; Welch, E.B. Suggested classification of stream trophic state: Distributions of temperate stream types by chlorophyll, total nitrogen, and phosphorus. Water Res. 1998, 32, 1455–1462. [Google Scholar] [CrossRef]
  42. Čučak, D.I.; Marković, N.V.; Radnović, D.V. Microbiological water quality of the Nišava River. Water Sci. Technol. Water Supply 2016, 16, 1668–1673. [Google Scholar] [CrossRef]
  43. Kavka, G.; Kasimir, G.; Farnleitner, A. Microbiological water quality of the River Danube (2581 km–15 km): Longitudinal Variation of Pollution as Determined by Standard Parameters. In Proceedings of the 36th International Conference of IAD. Austrian Committee Danube Research/IAD, Vienna, Austria, 24–28 June 2006; pp. 415–421. [Google Scholar]
  44. Yu, X.; Xia, J.; Yang, J.; Ma, W. Preliminary study on the index system and assessment method of green hydropower. J. Hydroelectr. Eng. 2011, 30, 71–77. (In Chinese) [Google Scholar]
  45. Son, C.T.; Giang, N.T.H.; Thao, T.P.; Nui, N.H.; Lam, N.T.; Cong, V.H. Assessment of Cau River water quality assessment using a combination of water quality and pollution indices. J. Water Supply Res. Technol—AQUA 2020, 69, 160–172. [Google Scholar] [CrossRef]
  46. Singh, A.; Maichle, R. ProUCL V. 5.1. Statistical Software for Environmental Applications for Data Sets with and without Nondetect Observations; USEPA: Washington, WA, USA, 2016.
  47. Mamun, M.; Kwon, S.; Kim, J.E.; An, K.G. Evaluation of algal chlorophyll and nutrient relations and the N:P ratios along with trophic status and light regime in 60 Korea reservoirs. Sci. Total Environ. 2020, 741, 140451. [Google Scholar] [CrossRef]
  48. SigmaPlot. SigmaPlot Version 10.0; Systat Software, Inc.: San Jose, CA, USA.
  49. Hammer, Ø.; Harper, D.; Ryan, P. PAST: Paleontological statistics software package for education and data analysis. Palaeontol. Electron. 2001, 4, 9. [Google Scholar]
  50. Lee, J.; Lee, S.; Yu, S.; Rhew, D. Relationships between water quality parameters in rivers and lakes: BOD5, COD, NBOPs, and TOC. Environ. Monit. Assess. 2016, 188, 252. [Google Scholar] [CrossRef]
  51. Rosov, K.A.; Mallin, M.A.; Cahoon, L.B. Waste nutrients from U.S. animal feeding operations: Regulations are inconsistent across states and inadequately assess nutrient export risk. J. Environ. Manag. 2020, 269, 110738. [Google Scholar] [CrossRef] [PubMed]
  52. Schumm, S.A. The Fluvial System; Wiley: Hoboken, NJ, USA, 1977. [Google Scholar]
  53. Kennedy, R.H. Toward integration in reservoir management. Lake Reserv. Manag. 2005, 21, 128–138. [Google Scholar] [CrossRef] [Green Version]
  54. Straskraba, M.; Tundisi, G. Guidelines Of Lake Management: Volume 9 Reservoir Water Quality Management; United Nations Environment Programme: Washington, DC, USA, 1999; Volume 9, ISBN 4906356265. [Google Scholar]
  55. Jones, J.; McEachern, P.; Seo, D. Empirical evidence of monsoon Influences on Asian Lakes. Aquat. Ecosyst. Health Manag. 2009, 12, 129–137. [Google Scholar] [CrossRef]
  56. An, K.G.; Park, S.S. Influence of seasonal monsoon on the trophic state deviation in an Asian reservoir. Water. Air. Soil Pollut. 2003, 145, 267–287. [Google Scholar] [CrossRef]
  57. Alexander, R.B.; Boyer, E.W.; Smith, R.A.; Schwarz, G.E.; Moore, R.B. The role of headwater streams in downstream water quality. J. Am. Water Resour. Assoc. 2007, 43, 41–59. [Google Scholar] [CrossRef] [PubMed] [Green Version]
  58. Lee, Y.; Woo, J.-M.; Hong, Y. The economic valuation of water quality degradation from river algae blooms: Evidence from the Han River. J. Environ. Policy Adm. 2019, 27, 51–75. [Google Scholar] [CrossRef]
  59. Sharpley, A.; Daniel, T.; Edwards, D. Phosphorus movement in the landscape. J. Prod. Agric. 1993, 6, 492–500. [Google Scholar] [CrossRef]
  60. Kolpin, D.W.; Furlong, E.T.; Meyer, M.T.; Thurman, E.M.; Zaugg, S.D.; Barber, L.B.; Buxton, H.T. Pharmaceuticals, hormones, and other organic wastewater contaminants in U.S. streams, 1999–2000: A national reconnaissance. Environ. Sci. Technol. 2002, 36, 1202–1211. [Google Scholar] [CrossRef] [Green Version]
  61. Mamun, M.; An, K.G. The application of chemical and biological multi-metric models to a small urban stream for ecological health assessments. Ecol. Inform. 2019, 50, 1–12. [Google Scholar] [CrossRef]
  62. Munn, M.D.; Frey, J.W.; Tesoriero, A.J.; Black, R.W.; Duff, J.H.; Lee, K.E.; Maret, T.R.; Mebane, C.; Waite, I.; Zelt, R.B. Understanding the influence of nutrients on stream ecosystems in agricultural landscapes. U.S. Geol. Surv. Circ. 2018, 1437, 80. [Google Scholar]
  63. Dillon, P.J. The phosphorus-chlorophyll in lakes. Limnol. Oceanogr. 1974, 19, 767–773. [Google Scholar] [CrossRef]
  64. Sakamoto, M. Primary production by phytoplankton community in some Japanese lakes and its dependence on lake depth. Arch. Hydrobiol. 1966, 62, 1–28. [Google Scholar]
  65. Edmondson, W. Nutrients and phytoplankton in Lake Washington. In Nutrients and Eutrophication; Likens, G.E., Ed.; American Society of Limnology and Oceanography: Lawrence, KS, USA, 1972. [Google Scholar]
  66. Pringle, C.M.; Bowers, J. An in situ substratum fertilization technique—Diatom colonization on nutrientenriched, sand substrata. Can. J. Fish. Aquat. Sci. 1984, 41, 247–251. [Google Scholar] [CrossRef]
  67. Pringle, C. Effects of water and substratum nutrient supplies on lotic periphyton growth—An integrated bioassay. Can. J. Fish. Aquat. Sci. 1987, 44, 619–629. [Google Scholar] [CrossRef]
  68. Corkum, L. Responses of chlorophyll-a, organic matter, and macroinvertebrates to nutrient additions in rivers flowing through agricultural and forested land. Arch. Hydrobiol. 1996, 136, 391–411. [Google Scholar] [CrossRef]
  69. Munn, M.; Frey, J.; Tesoriero, A. The influence of nutrients and physical habitat in regulating algal biomass in agricultural streams. Environ. Manag. 2010, 45, 603–615. [Google Scholar] [CrossRef] [PubMed] [Green Version]
  70. MOSF (Ministry of Strategy and Finance). 2012 Modularization of Korea’s Development Experience: Korea’s River Basin Management Policy; Ministry of Strategy and Finance: Seoul, Korea, 2013.
  71. Yasarer, L.M.W.; Sturm, B.S.M. Potential impacts of climate change on reservoir services and management approaches. Lake Reserv. Manag. 2016, 32, 13–26. [Google Scholar] [CrossRef]
  72. Haseena, M.; Muhammad, M.F.; Javed, A.; Arshad, S.; Asif, N.; Zulfiqar, S.; Hanif, J. Water pollution and human health. Environ. Risk Assess. Remediat. 2017, 1, 16–19. [Google Scholar] [CrossRef]
  73. Ahmed, T.; Scholz, M.; Al-Faraj, F.; Niaz, W. Water-related impacts of climate change on agriculture and subsequently on public health: A review for generalists with particular reference to Pakistan. Int. J. Environ. Res. Public Health 2016, 13, 1051. [Google Scholar] [CrossRef] [Green Version]
Figure 1. Sampling sites in the Han River basin. Hz, headwater zone; Rz1 (CR), reservoir zone 1 (Chugju Reservoir); Mz, midwater zone; Rz2 (PR), reservoir zone 2 (Paldang Reservoir); and Dz, downwater zone.
Water 14 00237 g001
Figure 2. A methodological flow chart of Han River water quality.
Water 14 00237 g002
Figure 3. The relation between land cover and water quality. TP, total phosphorus; TN, total nitrogen; BOD, biological oxygen demand; COD, chemical oxygen demand; AC, agricultural coverage; UC, urban coverage; and FC, forest coverage.
Water 14 00237 g003
Figure 4. Relations between total suspended solids (TSS) and nutrients (TP, total phosphorus; TN, total nitrogen) in the Han River.
Water 14 00237 g004
Figure 5. Biodegradability index in the Han River. Hz, headwater zone; Rz1 (CR), reservoir zone 1 (Chugju Reservoir); Mz, midwater zone; Rz2 (PR), reservoir zone 2 (Paldang Reservoir); Dz, downwater zone; BOD, biological oxygen demand; and COD, chemical oxygen demand.
Water 14 00237 g005
Figure 6. Microbial pollution indicator in the Han River. Hz, headwater zone; Rz1 (CR), reservoir zone 1 (Chugju Reservoir); Mz, midwater zone; Rz2 (PR), reservoir zone 2 (Paldang Reservoir); Dz: downwater zone.
Water 14 00237 g006
Figure 7. River pollution index in the Han River. Hz, headwater zone; Rz1 (CR), reservoir zone 1 (Chugju Reservoir); Mz, midwater zone; Rz2 (PR), reservoir zone 2 (Paldang Reservoir); Dz, downwater zone.
Water 14 00237 g007
Table 1. Zonal variations in water quality parameters in the Han River during 2015–2019. Hz, headwater zone; Rz1 (CR), reservoir zone 1 (Chugju Reservoir); Mz, midwater zone; Rz2 (PR), reservoir zone 2 (Paldang Reservoir); and Dz, downwater zone; pH, hydrogen ion concentration; WT, water temperature; EC, electrical conductivity; DO, dissolved oxygen; BOD, biological oxygen demand; COD, chemical oxygen demand; TSS, total suspended solids; TOC, total organic carbon; TN, total nitrogen; TP, total phosphorus; and CHL-a, chlorophyll-a.
Water Quality ParametersHzRz1 (CR)MzRz2 (PR)Dz
Min–MaxMean ± SD
CV
Min–MaxMean ± SD
CV
Min–MaxMean ± SD
CV
Min–MaxMean ± SD
CV
Min–MaxMean ± SD
CV
pH6.9–9.78.41 ± 0.35
0.04
7.2–98.10 ± 0.32
0.04
7–9.28.14 ± 0.31
0.03
7.3–8.87.93 ± 0.33
0.04
6.5–9.27.86 ± 0.37
0.04
WT (°C)0–29.614.42 ± 8.17
0.56
2.7–29.614.07 ± 6.67
0.47
0.2–3114.38 ± 7.40
0.51
2.2–28.315.28 ± 7.70
0.50
0–3215.26 ± 8.37
0.54
EC (µS/cm)56–327244 ± 125.8
0.51
2–390245.6 ± 35.46
0.14
120–383247.1 ± 30.68
0.12
139–345243.1 ± 47.46
0.19
25–863350.4 ± 77.2
0.36
DO (mg/L)6.7–18.511.45 ± 2.13
0.18
3.9–20.610.32 ± 2.95
0.28
5.7–17.711.46 ± 2.06
0.18
4.3–14.410.25 ± 2.38
0.23
4–16.810.52 ± 2.37
0.22
BOD (mg/L)0.1–4.31.10 ± 0.58
0.53
0.2–3.91.48 ± 0.63
0.42
0.3–4.11.29 ± 0.67
0.52
0.5–3.21.51 ± 0.67
0.44
0.3–12.82.12 ± 1.58
0.74
COD (mg/L)1–3.183.03 ± 1.22
0.40
1.5–4.72.55 ± 0.46
0.18
1.1–10.63.51 ± 0.98
0.28
2.6–5.94.05 ± 0.68
0.16
1–12.65.09 ± 1.55
0.30
TSS (mg/L)0.1–21.86.29 ± 6.77
0.66
0.2–209.34.06 ± 15.17
3.72
0.2–194.36.09 ± 12.21
2.0
1–36.25.66 ± 3.66
0.64
0.3–18115.5 ± 23.97
1.54
TOC (mg/L)0.1–81.95 ± 0.88
0.45
0.7–3.51.63 ± 0.50
0.31
0.5–6.72.14 ± 0.70
0.32
1.5–3.92.37 ± 0.43
0.18
1–7.82.75 ± 0.93
0.34
TN (mg/L)0.98–5.592.94 ± 0.75
0.25
1.40–5.032.47 ± 0.51
0.20
1.07–5.852.52 ± 0.49
0.19
1.15–3.352.34 ± 0.50
0.21
1.14–14.774.13 ± 2.17
0.52
TN:TP25.19–793234.4 ± 199.8
0.85
16.52–629272.7 ± 81.2
1.03
66.3–711131.6 ± 102.2
0.77
16.3–198.381.55 ± 40.8
0.5
5.33–326.870.97 ± 44.23
0.62
TP (µg/L)1–9030.66 ± 7.21
0.91
1–14715.03 ± 13.45
0.89
2–7634.35 ± 5.14
0.48
9–17936.34 ± 21.5
0.59
8–63770.97 ± 113
1.15
CHL-a (µg/L)0.1–34.33.83 ± 4.15
0.8
0.6–67.43.32 ± 5.08
1.2
0.4–62.37.32 ± 1.52
0.56
1.1–45.114.47 ± 8.29
0.57
0.5–14516.54 ± 15.64
0.94
Table 2. Pearson correlation matrix of water quality parameters. pH, hydrogen ion concentration; WT, water temperature; EC, electrical conductivity; DO, dissolved oxygen; BOD, biological oxygen demand; COD, chemical oxygen demand; TSS, total suspended solids; TOC, total organic carbon; TN, total nitrogen; TP, total phosphorus; and CHL-a, chlorophyll-a.
Water Quality VariablespHWT (°C)EC (µS/cm)DO (mg/L)BOD (mg/L)COD (mg/L)TSS (mg/L)TOC (mg/L)TN (mg/L)TN:TPTP (µg/L)CHL-a (µg/L)
pH1.00
WT (°C)−0.311.00
EC (µS/cm)−0.510.521.00
DO (mg/L)0.80−0.05−0.411.00
BOD (mg/L)−0.580.450.65−0.411.00
COD (mg/L)−0.720.670.71−0.460.701.00
TSS (mg/L)−0.490.550.94−0.330.610.781.00
TOC (mg/L)−0.590.510.60−0.400.820.870.641.00
TN (mg/L)−0.570.460.80−0.500.800.800.800.831.00
TN:TP0.65−0.44−0.300.33−0.44−0.78−0.38−0.72−0.381.00
TP (µg/L)−0.690.440.74−0.520.900.840.730.890.92−0.581.00
CHL-a (µg/L)−0.680.630.57−0.380.590.920.650.750.66−0.720.661.00
Table 3. The empirical models and equations of CHL-a-TP and CHL-a-TN in the Han River. Hz, headwater zone; Rz1 (CR), reservoir zone 1 (Chugju Reservoir); Mz, midwater zone; Rz2 (PR), reservoir zone 2 (Paldang Reservoir); Dz, downwater zone; TP, total phosphorus; TN, total nitrogen; CHL-a, chlorophyll-a; and L, Log10.
SitesEmpirical ModelsEquationsR2p-Value
HzCHL-a-TPL.(CHL-a) = 0.35 − 0.11 ∗ L.(TP)0.020.05
CHL-a-TNL.(CHL-a) = −0.55 + 2.31 ∗ L.(TN)0.26<0.001
Rz1 (CR)CHL-a-TPL.(CHL-a) = −0.52 − 0.53 ∗ L.(TP)0.160.02
CHL-a-TNL.(CHL-a) = 0.18 + 0.71 ∗ L.(TN)0.030.05
MzCHL-a-TPL.(CHL-a) = 1.89 + 0.72 ∗ L.(TP)0.33<0.001
CHL-a-TNL.(CHL-a) = 0.13 + 1.67 ∗ L.(TN)0.070.02
Rz2 (PR)CHL-a-TPL.(CHL-a) = 1.69 + 0.37 ∗ L.(TP)0.11<0.001
CHL-a-TNL.(CHL-a) = 1.05 + 0.27 ∗ L.(TN)0.01<0.001
DzCHL-a-TPL.(CHL-a) = 1.37 + 0.16 ∗ L.(TP)0.10<0.001
CHL-a-TNL.(CHL-a) = −0.87 + 0.53 ∗ L.(TN)0.24<0.001
Entire RiverCHL-a-TPL.(CHL-a) = −0.43 + 0.81 ∗ L.(TP)0.47<0.001
CHL-a-TNL.(CHL-a) = 0.25 + 1.26 ∗ L.(TN)0.22<0.001
Publisher’s Note: MDPI stays neutral with regard to jurisdictional claims in published maps and institutional affiliations.

