Article

Low-Impact Development (LID) in Coastal Watersheds: Infiltration Swale Pollutant Transfer in Transitional Tropical/Subtropical Climates

by
Aline Rech
1,
Elisa Pacheco
2,
Jakcemara Caprario
2,
Julio Cesar Rech
3 and
Alexandra Rodrigues Finotti
2,*
1
Environmental Engineering Department, University of West Santa Catarina, Xaxim 89825-000, SC, Brazil
2
Urban Stormwater and Compensatory Technique Laboratory, Sanitary Engineering Department, Federal University of Santa Catarina, Florianópolis 88040-970, SC, Brazil
3
Civil Engineering Department, Contestado University, Concórdia 89711-330, SC, Brazil
*
Author to whom correspondence should be addressed.
Water 2022, 14(2), 238; https://doi.org/10.3390/w14020238
Submission received: 30 November 2021 / Revised: 7 January 2022 / Accepted: 11 January 2022 / Published: 14 January 2022
(This article belongs to the Special Issue Research on Urban Runoff Pollution)

Abstract

:
The control of runoff pollution is one of the advantages of low-impact development (LID) or sustainable drainage systems (SUDs), such as infiltration swales. Coastal areas may have characteristics that make the implementation of drainage systems difficult, such as sandy soils, shallow aquifers and flat terrains. The presence of contaminants was investigated through sampling and analysis of runoff, soil, and groundwater from a coastal region served by an infiltration swale located in southern Brazil. The swale proved to be very efficient in controlling the site’s urban drainage volumes even under intense tropical rainfall. Contaminants of Cd, Cu, Pb, Zn, Cr, Fe, Mn and Ni were identified at concentrations above the Brazilian regulatory limit (BRL) in both runoff and groundwater. Soil concentrations were low and within the regulatory limits, except for Cd. The soil was predominantly sandy, with neutral pH and low ionic exchange capacity, characteristic of coastal regions and not very suitable for contaminant retention. Thus, this kind of structure requires improvements for its use in similar environments, such as the use of adsorbents in soil swale to increase its retention capacity.

1. Introduction

The worldwide growth of cities has caused significant problems for basic infrastructure systems, especially urban drainage [1,2]. Increased volumes, flows and peak anticipation are widely reported problems. Surface runoff is also recognised as an important source of diffuse pollution [3,4]. However, the concern with its control is relatively recent [5].
Sustainable urban drainage systems have been reported as very advantageous solutions for runoff control and they have been effectively applied in several countries such as France, the United States and Germany [6,7,8,9,10]. Infiltration swales are vegetated open channels that can treat and attenuate precipitation [11]. Such swales present simple constructive processes, are easily inserted into the urban landscape and provide rapid infiltration of runoff in roadways [12,13]. However, surface runoff is a potential contaminant of groundwater due to the presence of metals, organic matter, nutrients, pesticides and emerging micropollutants [3,10,14].
The main sources of pollutants found in runoffs are the result of vehicular traffic through abrasion, transported product leakages, and chemicals used in agriculture and de-icing [15]. In developing countries, with no universal sewage collection and treatment services, the irregular contribution of sanitary sewage is also included [13,16,17].
In coastal environments, urban drainage presents particular challenges [18,19]. Such sites usually present soils with high sand content, shallow aquifers, and floodplains that present drainage difficulties and tidal effects. Infiltration is facilitated in environments with these characteristics, which makes the implementation of sustainable drainage systems based on infiltration very suitable [20]. However, the greatest risk to which they are subjected is the transfer of contaminants from surface runoff to the subterranean environment.
The purpose of this paper is to investigate the occurrence of metal ions in the surface runoff flowing into an infiltration swale adjacent to a heavily trafficked highway in a coastal zone with a transitional (tropical/subtropical) climate. The structure has been in operation for over 30 years in the municipality of Florianópolis (Santa Catarina, Brazil) and monitored over four years (2014–2017). Emphasis was given to the study of metal ion transfer by the swale soil and the verification of contamination of the local aquifer, which is characterised by high vulnerability [21].
The structure is located in a coastal region where it is difficult to establish an alternative for urban drainage control other than infiltration into the ground. Indeed, the tidal effects associated with the height of the aquifer impose restrictions on urban drainage water runoff. Understanding the actual functioning of the seepage structure in removing metal ions allowed us to identify adaptations needed for the use of compensatory techniques in coastal regions and to improve urban drainage management. Drainage compensatory techniques are safe, but the region in which this particular swale is implemented presents elements that would restrict its application. For this reason, the investigation and proposal of alternatives is fundamental for future drainage projects to be better adapted and more resilient.

2. Materials and Methods
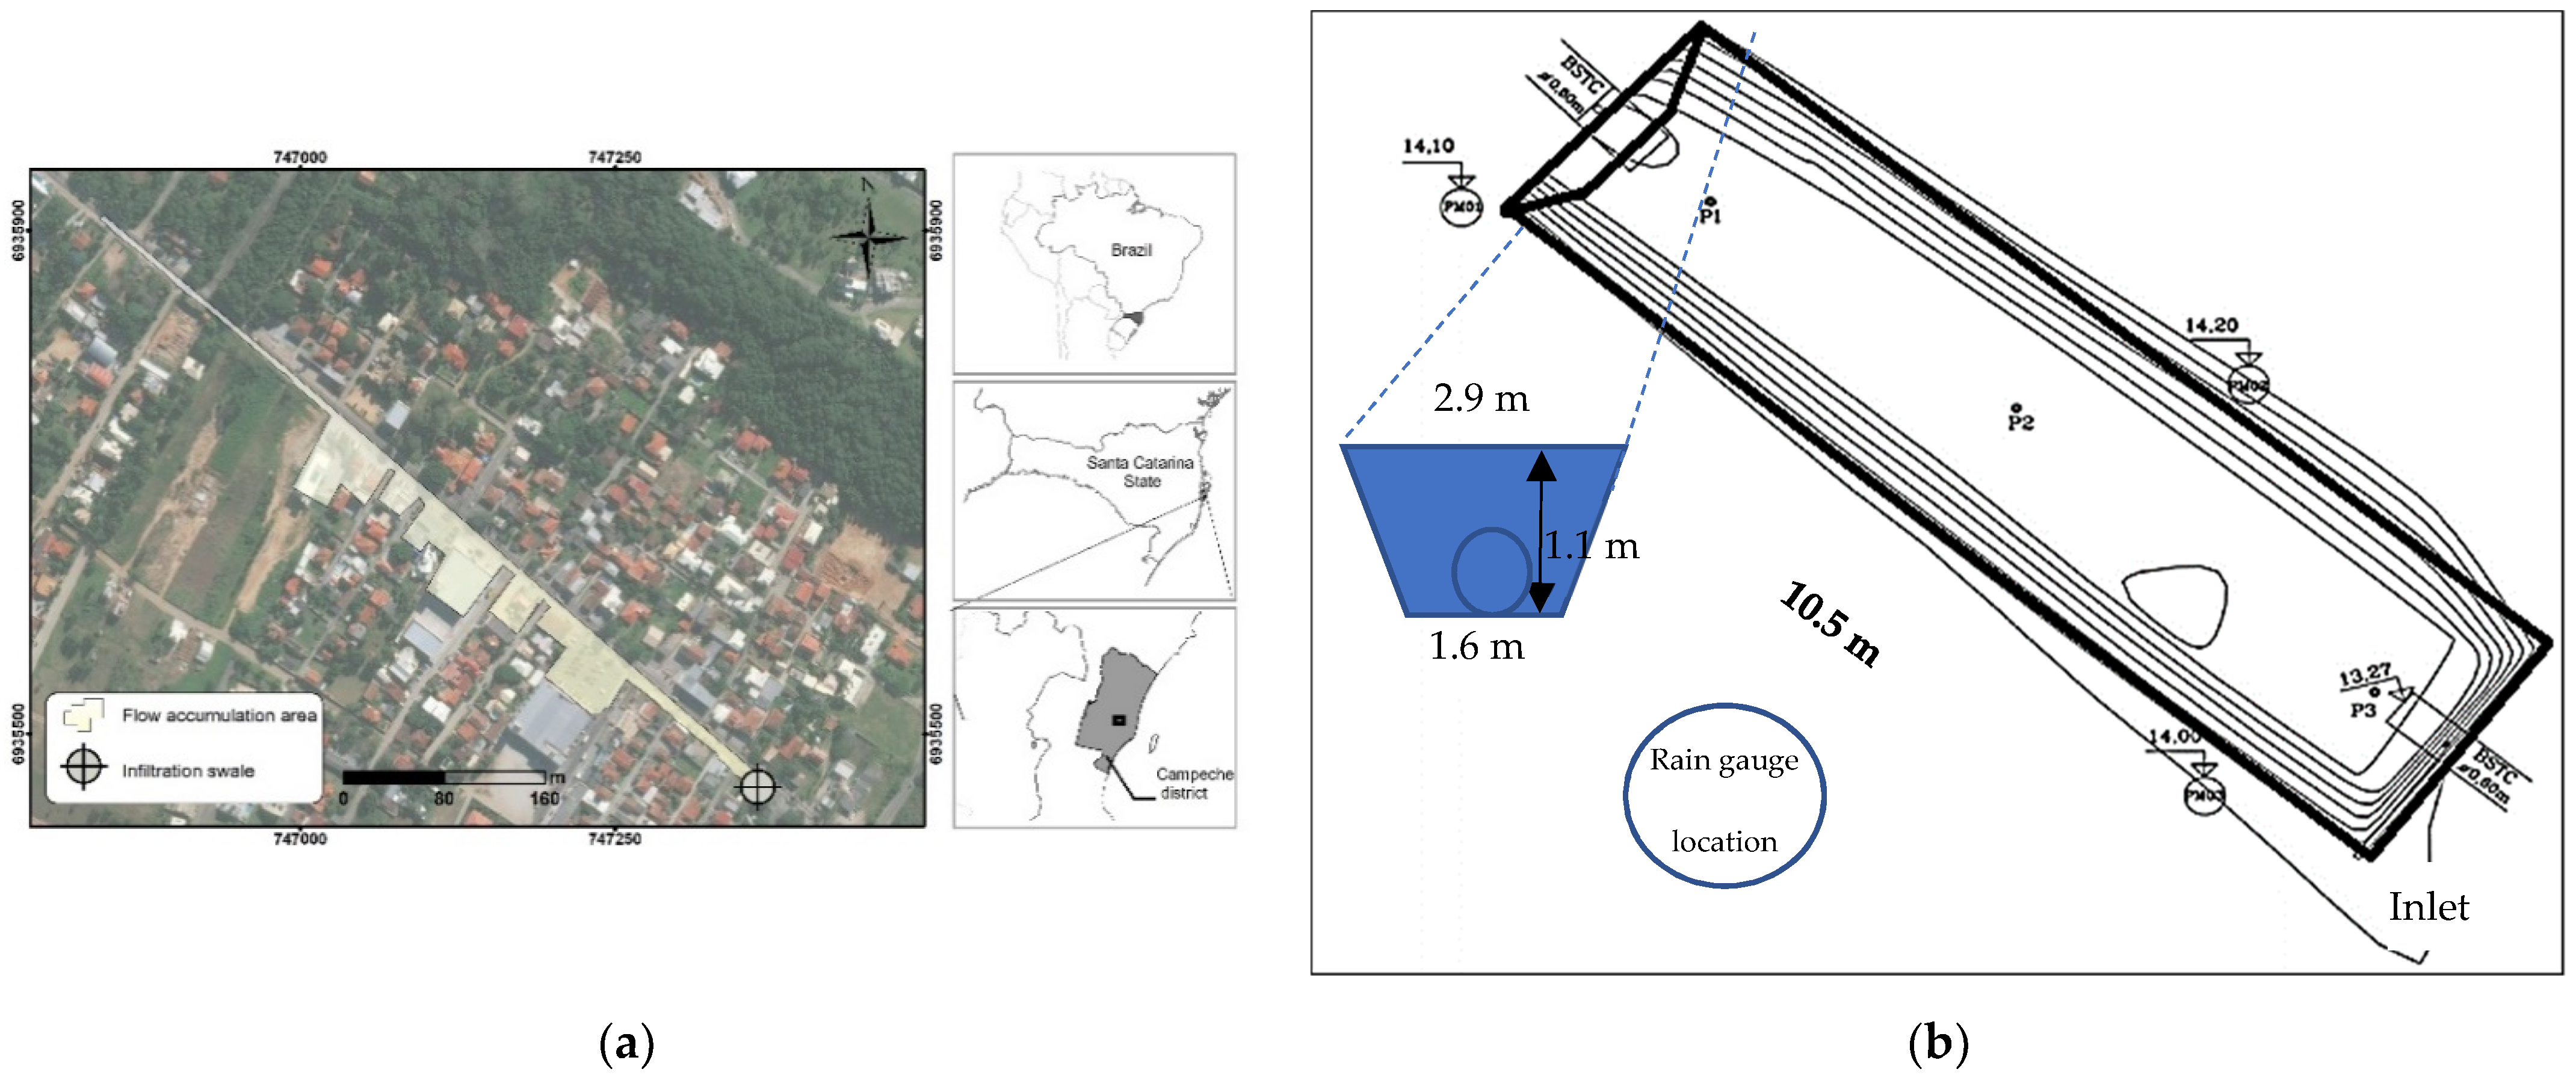
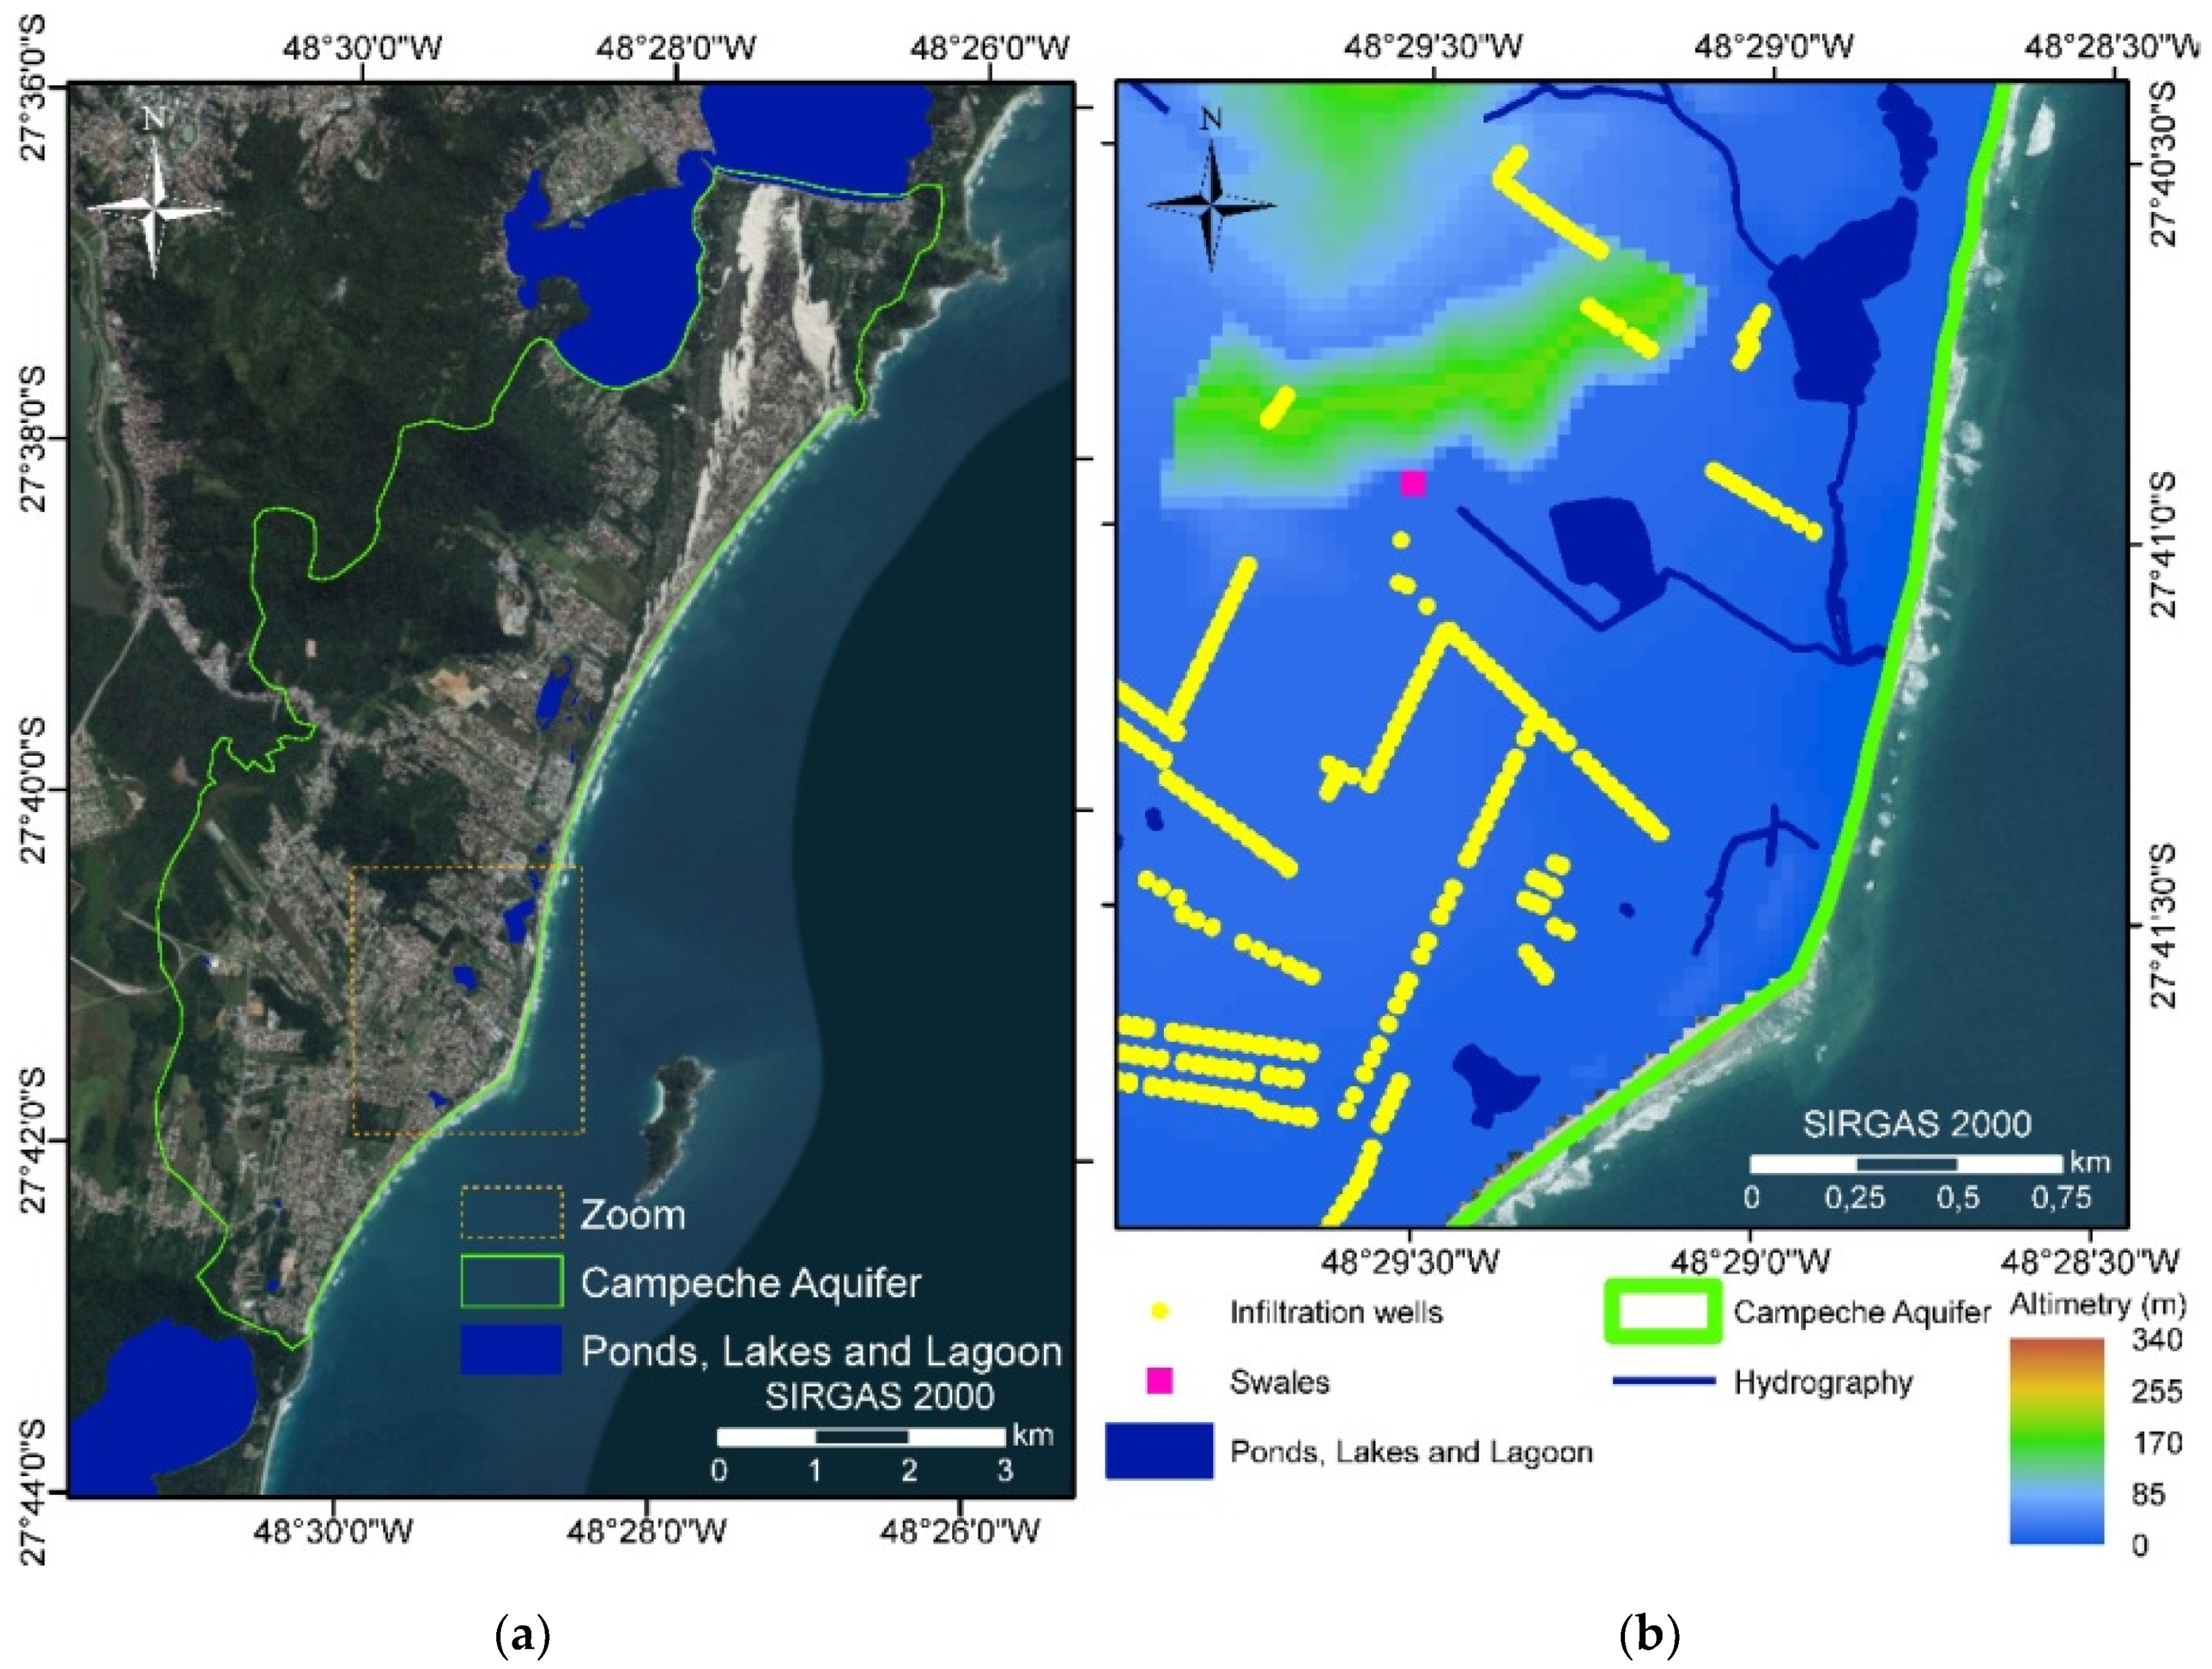
2.1. Study Area

The region studied is located between parallels 27°37′34″ and 37°43′16″ south and meridians 48°27′44″ and 48°31′49″, in Campeche District, on Santa Catarina Island, southern Brazil (Figure 1), southern hemisphere. The site is a sedimentary coastal plain, with marine influenced vegetation consisting of herbaceous, bushy and arboreal species. Sedimentary basins are also vulnerable to impacts related to human activities [22,23]. According to the Köppen–Geiger climate classification, this region has a humid subtropical climate with hot summers (Cfa) [24]. The annual average precipitation around 1400 to 1600 mm is well distributed throughout the year with an average of 160 rainy days per year. The region is characterised by the presence of a free shallow aquifer, the Campeche aquifer, which presents a vast extension of sandy soils.
The watershed contribution area is 17.91 ha, characterised predominantly by mixed use (residential and commercial) with approximately 80% of impermeable surfaces and intense car traffic. The swale cross-section is trapezoidal (Figure 1b) with a superficial area of 16.83 m2, side slope of 1.6:1 and a longitudinal slope of approximately 2.1% [16].
The infiltration swale is highlighted in red in Figure 2. The structure overlays a thin layer of geological material under which the Campeche free aquifer is located. Near this structure are the surface water springs of Lagoa Pequena (Rio Tavares), Lagoa da Chica (Campeche) and Lagoa do Peri; all these allow the recharging of the aquifer. The Campeche region occurs within the hydrographic basin of the Tavares River. The rivers contributing to the Tavares watershed are small, with the main tributaries rising in rocky elevations. The runoff in the region is controlled by infiltration structures low-impact development (LID) devices such as wells, swales and ponds (Figure 2b).

2.2. Field Data and Laboratory Analysis

The qualitative and quantitative monitoring program was carried out by LAUTEC/UFSC in the period from 2014 to 2017. The parameters monitored were rain, runoff levels at the inlet and outlet of the swale, variation of the aquifer level, water quality analysis of the surface runoff and groundwater and soil quality samples at the bottom of the swale for concentrations of chemical oxygen demand (COD), total organic carbon (COT), solids (suspended, total, solved), nitrite, phosphorus and metal ions (Cr, Pb, Ni, Cu, Zn, Fe, Ni and Mn).
Rain was monitored in a tipping-bucket rain gauge (SL2000P Solar Instruments) placed 2 m away from the side of the swale (Figure 1b). The time interval readings were each 5 min. Data was stored in a datalogger with solar panels. Data from the rain gauge was compared with data from the station Areias do Campeche (n° 420540703A) operated by CEMADEN (National Centre for Disasters Monitoring and Prevention) 2.5 km away from the experimental site. The precipitation climatological standard normal for 30 years (1961–1990), as defined by World Meteorological Organization [25], was presented to compare with the monitoring years on the swale. The climatological standard normal for the Florianópolis station was obtained from the National Institute of Meteorology (INMET).
Flows rates and volumes. Runoff enters the swale through a 0.6-m diameter concrete tube placed at the swale button. The non-infiltrated flow parcel leaves the swale through a 0.5-m diameter concrete tube at the opposite side (Figure 1b). Two pressure sensors (SL2000NV Solar Instruments) were installed in the entry and outlet tubes. The inflow and outflow rates were calculated from the water levels obtained from the respective sensors using Manning’s Equation (1) with coefficient n adjusted in the field by the float method for the inflow and from literature for the outflow [16]. The inflow and outflow volumes were calculated for each sensor time step ( Δ t ) according to Equation (2). The infiltrated volume was calculated by the differences between the swale inlet and outlet volumes using Equation (3).
Qet (or Qot) = A × n−1 × R2/3 I1/2
Vet (or Vot) = Qet (or Qot) × Δt × 60
Vi = Vet − Vot
where: Qe,t and Qot are the flow rates for the inlet or outlet in sensor time step t (m3/s), n is the Manning coefficient, R is the hydraulic radius (m), I is the slope of the hydraulic grade line (m/m), Ve,t and Vot are the volumes of entry or outflow between two sensor time steps, Δ t is the interval between two time steps and Vi is the infiltrated volume (m3).
Runoff water quality. Runoff was sampled for quality analysis at the entry of the swale, automatically over 2014–2015 (first sampling scheme) and manually over 2016–2017 (second sampling scheme). The samples were automatically collected through a stainless-steel prolongation in the inlet concrete pipe. This prolongation had nine holes at different heights along the transverse tube section allowing the automatic collection of runoff at different levels and, consequently, different times [16]. However, this device is dependent on the speed at which the level rises in the tube, preventing the control of the time at which the samples would be taken. Each of up to nine water intakes were connected to a 400-mL glass sampler bottle with a Teflon tube. The sampling frequency was limited to up to three events per month. Unfortunately, since the water level increases very quickly in the tube; all samples were collected in less than ten minutes. Therefore, in the first sampling scheme the simple average of concentrations was calculated instead of Event Mean Concentration (EMC) [26]. A total of forty samples were collected: 20 in the first sampling scheme (2014–2015) and 20 in the second (2016–2017). To verify whether the sampling scheme or the change of laboratory would have an influence on the results, Student’s t test was performed with the hypothesis of equality of variances of the sets.
Soil samples were collected in three points of the infiltration structure (inlet P1, middle P2 and outlet P3) at two depths 0–0.20 m and 0.20–0.40 m. The samples were manually collected using an auger. Approximately 1 kg of soil was collected at each point; 200 mg were used for metals analysis and 800 mg for the particle size distribution curve. The samples were obtained in April of each year (2014 to 2017).
Groundwater level and quality. Three monitoring wells were installed in the swale laterals. The wells were 3.5-m-deep with filter in the lowermost 0.5 m. PM01 was located upstream and PM02 and PM03 were downstream of the water flux (Figure 1). Groundwater level was monitored in PM03, which was equipped with a pressure sensor (SL2000NV Solar Instruments). Groundwater samples for quality analyses were manually collected in all three wells with a peristaltic pump. The sampling frequency was every three months between 2015 and 2017, during which 32 samples were effectively collected.
All samples (runoff, groundwater and soil) were collected, stored in refrigerated boxes and forwarded within 24 h to the Soil Laboratory of the Universidade do Oeste de Santa Catarina-UNOESC, Campos Novos or to the Integrated Environmental Laboratory -LIMA of the Universidade Federal de Santa Catarina. The soil was stored in sealed plastic bags and the runoff samples in polyethylene bottles provided by the laboratories. The analytical methods are summarised in Table 1.
The statistical techniques were performed with the Microsoft Excel®, PAST, and IBM SPSS Statistics® softwares. The interference of swale infiltration water in groundwater was verified by T-Student for the three wells as suggested by the Brazilian Standard NBR/ABNT 10157/1987. The test was used to evaluate if the infiltrated concentration significantly changed the averages of concentrations between the upstream and downstream wells.

3. Results and Discussion

3.1. Rain in the Campeche District

The swale is located on an ocean island in a transition region between tropical and subtropical climates in southern hemisphere. Although precipitation is relatively high during all months (Table 2), the autumn/winter months are somewhat drier (89.5–95.3 mm) than the summer months (162.7–196.9 mm). The region is also subject to the climate anomalies of the El Nino and La Nina phenomena [32]. The year 2014 showed precipitation close to normal, on the other hand, the year 2015 was 59.8% rainier than the climatological standard normal. Very heigh precipitation events took place in the south of Brazil in 2015 due to a strong El Nino occurrence [33]. In previous studies of the swale [16,32,33], it was observed that the pattern of precipitation changes with seasons. In general, spring/summer rains are more intense and associated with convective processes and in autumn/winter, frontal systems are responsible for precipitations events that presents as higher duration and are less intense. These patterns influence runoff generation.

3.2. Runoff Analysis

The first studies we conducted on the swale [16,34,35] attempted to initially highlight the hydrological behaviour of compensatory technique for urban drainage control. In summary, 39 events were analysed [34] in 2014 and 2015; it was found that in 49% of the events, the infiltration flow rate was higher than the outlet flow rate of the structure, achieving very satisfactory results for a compensatory drainage structure in a tropical/subtropical climate. However, the range of variation of the removal efficiency was quite high (between 26.1 and 81.4%). The results presented by [16], in which 75%, 78% and 80% of infiltration were achieved, also highlight the good functioning of the swale in events with a low rainfall intensity, resulting in low flows allowing greater infiltration into the soil.
The number of previous days without rain also has an influence on the increase in infiltration capacity. The bottom of the swale is very close to the saturated zone during some events. The groundwater level rises during rainy periods, reducing the infiltration capacity. When there are several days without precipitation, the swale behaves differently. This behaviour was observed on 12 August 2015 (Table 3) with 75% infiltration of the runoff when there were seven dry days and on 25 August 2015, with 80% infiltration with nine dry days.
Overall, the swale showed a fast response to precipitation for higher rainfall depths, as in the case of the 15 March 2015 event. During this event, the infiltration volume was higher than the outflow volume, unlike during the event of the 17 August 2016 and 7 January 2016, although precipitation was more intense during the event 7 January 2016 event (similar to 15 March 2015 event) and not very intense on the 17 August 2016. This suggests that other factors beyond rainfall depth, average intensity and previous days without rain interferes with the swale performance, such as aquifer level and tidal variations. Tidal interference, as well as relatively rapid aquifer level rise in response to seepage, were effects observed in the Ressacada aquifer [36], a geological formation similar to the Campeche aquifer and about 20 km away from our swale site, as well as in an aquifer in a coastal region in China [20]. This kind of interference seems to be common in coastal areas with sandy aquifers and must be taken into consideration in the design and operation of LIDs in this type of environment.
The multiple factors intervening in the swale’s quantitative performance will also influence its level of contaminant control. When referring to contaminant transport, the factors of contaminant generation, accumulation, leaching and the capacity of the soil to retain contaminants will also interfere [3], rendering the analysis more complex.
Table 3 summarises the information about some events that occurred during the period from 2015 to 2016 for which we also investigated contaminants. The bold numbers indicate that both volumes and quality data were available. During these events, the swale also showed the same good performance in infiltration capacity. Among the 11 events selected, three indicated an infiltration capacity greater than 68% of the volume, four events indicated infiltration above 30% and four events were below 16%. Only for the event recorded on 2 September 2015 was the infiltrated volume low, computed as 4%. The lower infiltration volumes are usually correlated with higher precipitation volumes, so the structure would act as a passage channel.

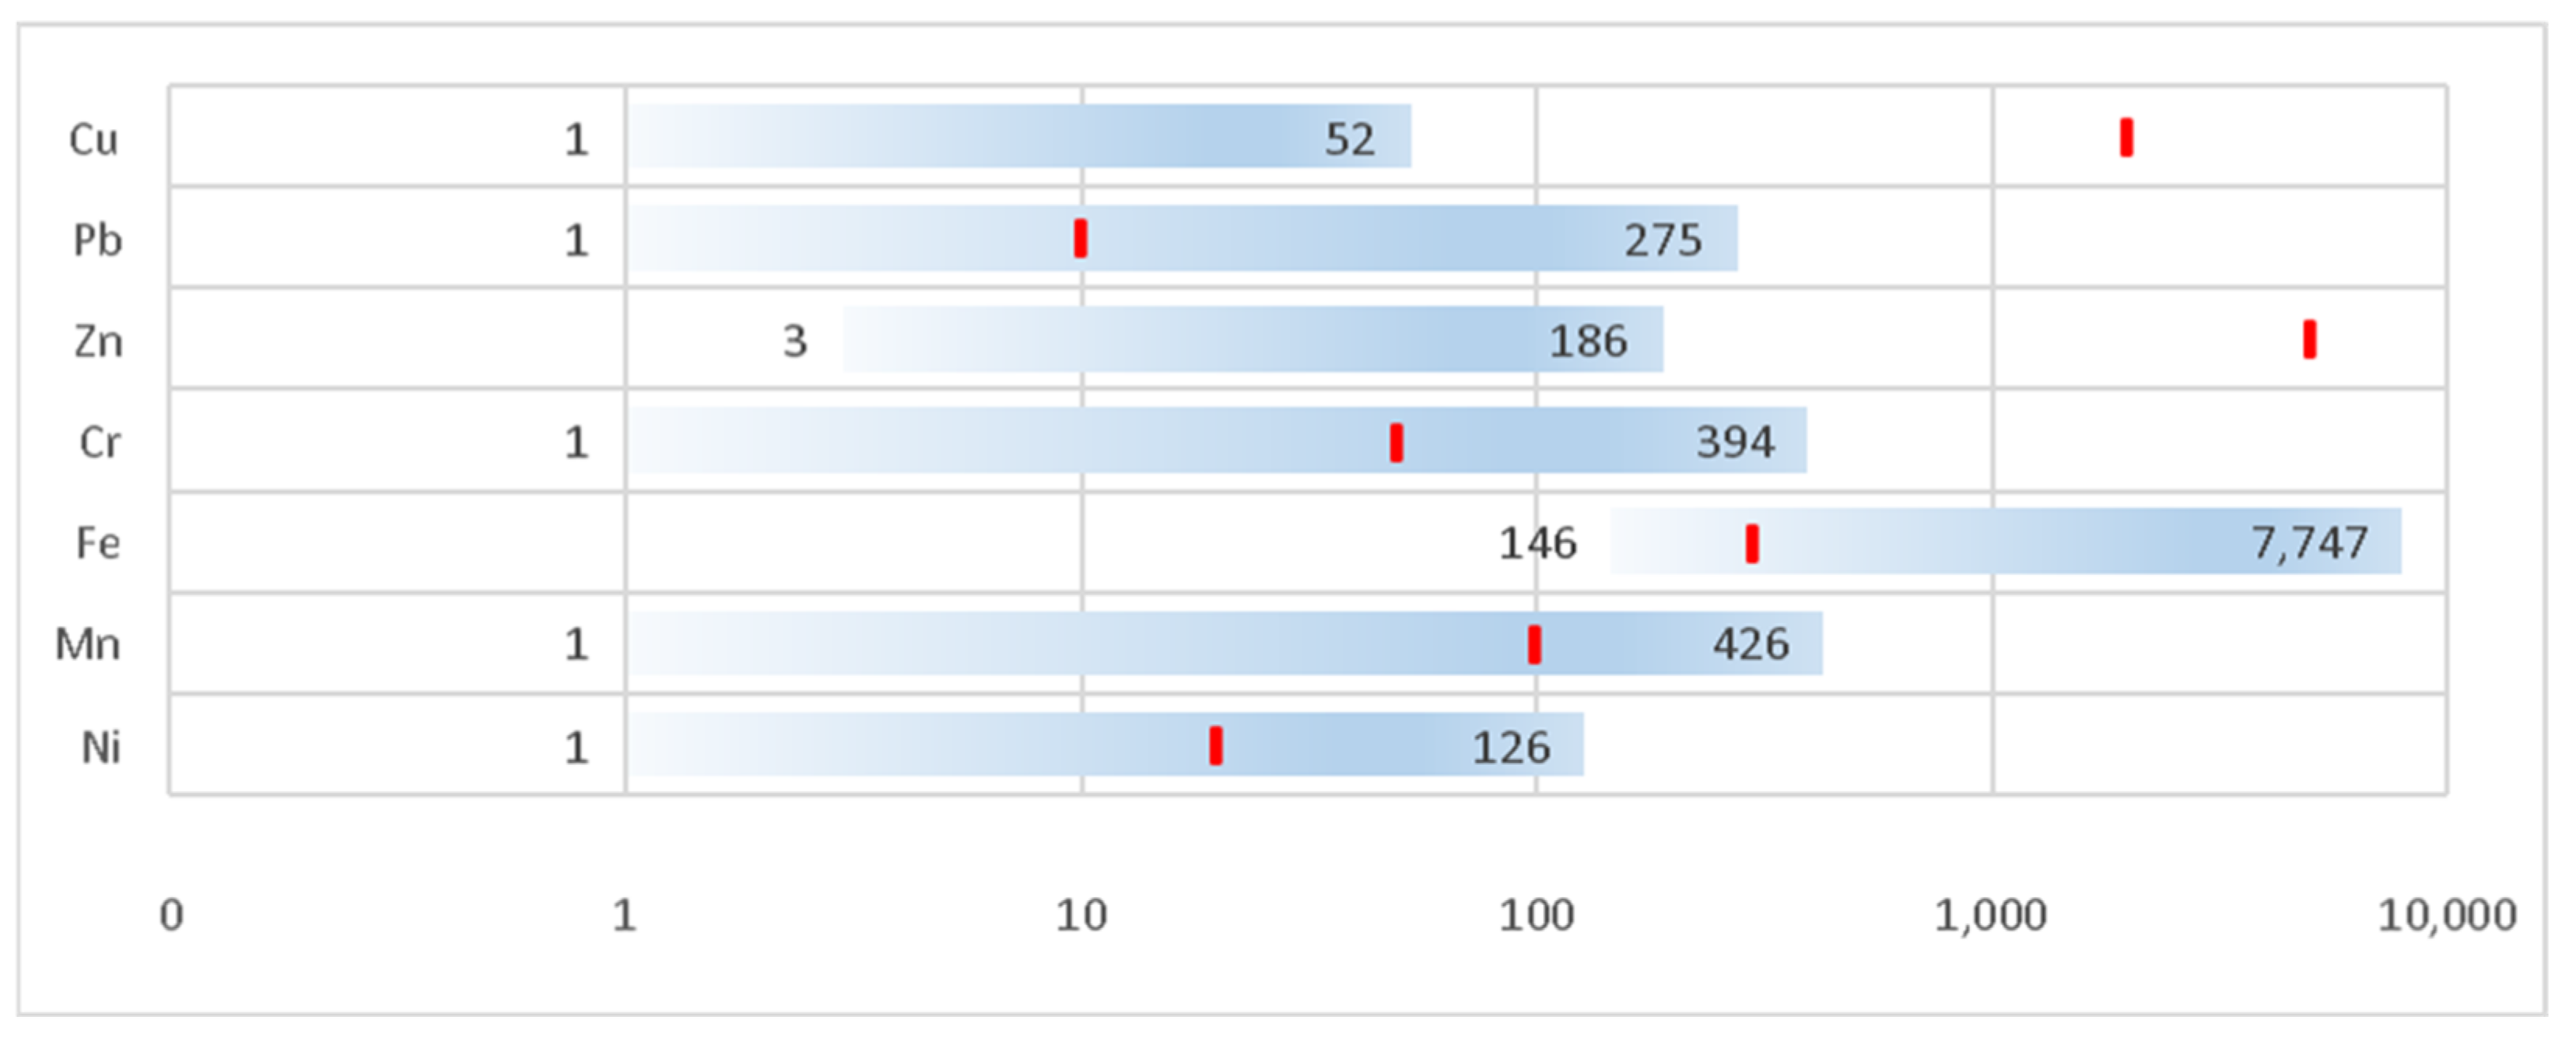
3.3. Pollutant Concentrations in Runoff

From 4 August 2014 to 29 December 2017, 40 samplings of surface runoff were collected in the entry of the infiltration swale. The results were compared with the Brazilian regulatory limits (BRL) standards for Class 2 waters [37], which comprises natural waters with a low degree of pollution and good environmental conditions. The measured concentrations ranges (maximum and minimum levels) are shown in Figure 3. Class 2 thresholds are shown as red lines and the orange boxes named with the acronym “Lit” refers to literature values (from Table 4) for comparison. Selected studies (Table 4) include urban residential watershed runoff [38], road runoff from Portugal [4] and France (strong traffic reviewed data) [3], metals in watershed runoff [39], a study of Cr leaching by rain in wood decks treated with CCA (Chromated Copper Arsenate) [40] and a short review on Cr in runoff [41].
Not all chemical species were sampled or analysed in all campaigns due to various constraints common to real field studies (unavailability of laboratories, equipment breakdown, loss of samples). Some samples from the beginning of the project (2014 and 2015) were composite and the remaining samples were single. There was also a change of laboratory during this period for the metal analyses. To certify homogeneity among the sets of data, Student’s t-test was conducted for each chemical sampled and analysed under these two different conditions. The statistics indicated that the two groups of samples had no significant difference in variance at the 5% level suggesting that they can be jointly evaluated.
Many of the compounds presented concentrations above and below the BRL. The exception was nitrate, which never exceeded the limit. At the other extreme, the metals Pb, Cd and Cr exceeded the limit in all samplings. Metal concentrations were very similar to values presented in the selected literature by [3,4] for runoff from intense traffic roads, although the Cd concentration values in some Campeche samples was ten times higher than this reference. Nickel slightly exceeded the limit concentrations of the standard and showed values in the same range as in the literature. A few studies have addressed the presence of Ni in drainage runoff [44], and, as a toxic metalloid, it should also be monitored. The Cr concentrations were remarkably high—over 7750 µg/L (BRL is 50 µg/L). The literature values range from 0.6 to 580 µg/L, with 1-95 in road runoff, 8–470 µg/L in a study of leaching from treated wood decks and 580 as the runoff value in a site with industrial activity. Small wood processing industries that may be related to the elevated Cr concentrations in the drainage water occurs in the Campeche district. However, this hypothesis must be checked.
The total COD, total phosphorus and nitrate concentrations suggest the presence of domestic sewage. Low nitrate and high phosphorus values may indicate recent sewage release [45] probably due to cross-connection. The sanitary sewage service in the town is partially provided by a centralised, absolutely separative network and individual solutions such as septic tanks. The presence of cross-connections is common throughout the city’s sanitation system, including in the swale site in Campeche.
Brazilian soils in general present high values of Fe [46] and may partially explain such concentrations of the metals in the runoff, since the contributing area has 20% of natural soil. Systematic concentrations of Fe, Zn and Pb in surficial waters attributed to soil minerals were found in [46]. The metals found in runoff were also identified in the studies of [7,8,10,40,41,47,48] that investigated runoff from impermeable areas such as roads and parking lots. Metals such as Fe, Pb, Zn, Cd and Cu had the highest concentrations in analysed runoff samples.
The area contributing to the swale has no industrial activities, only commercial and residential uses. There is a large supermarket with an important paved area. Additionally, since the swale is located near the only road that gives access to the beach and presents a large traffic flow, the major source of metals found in the runoff should be the vehicles and the deterioration of asphalt paving.

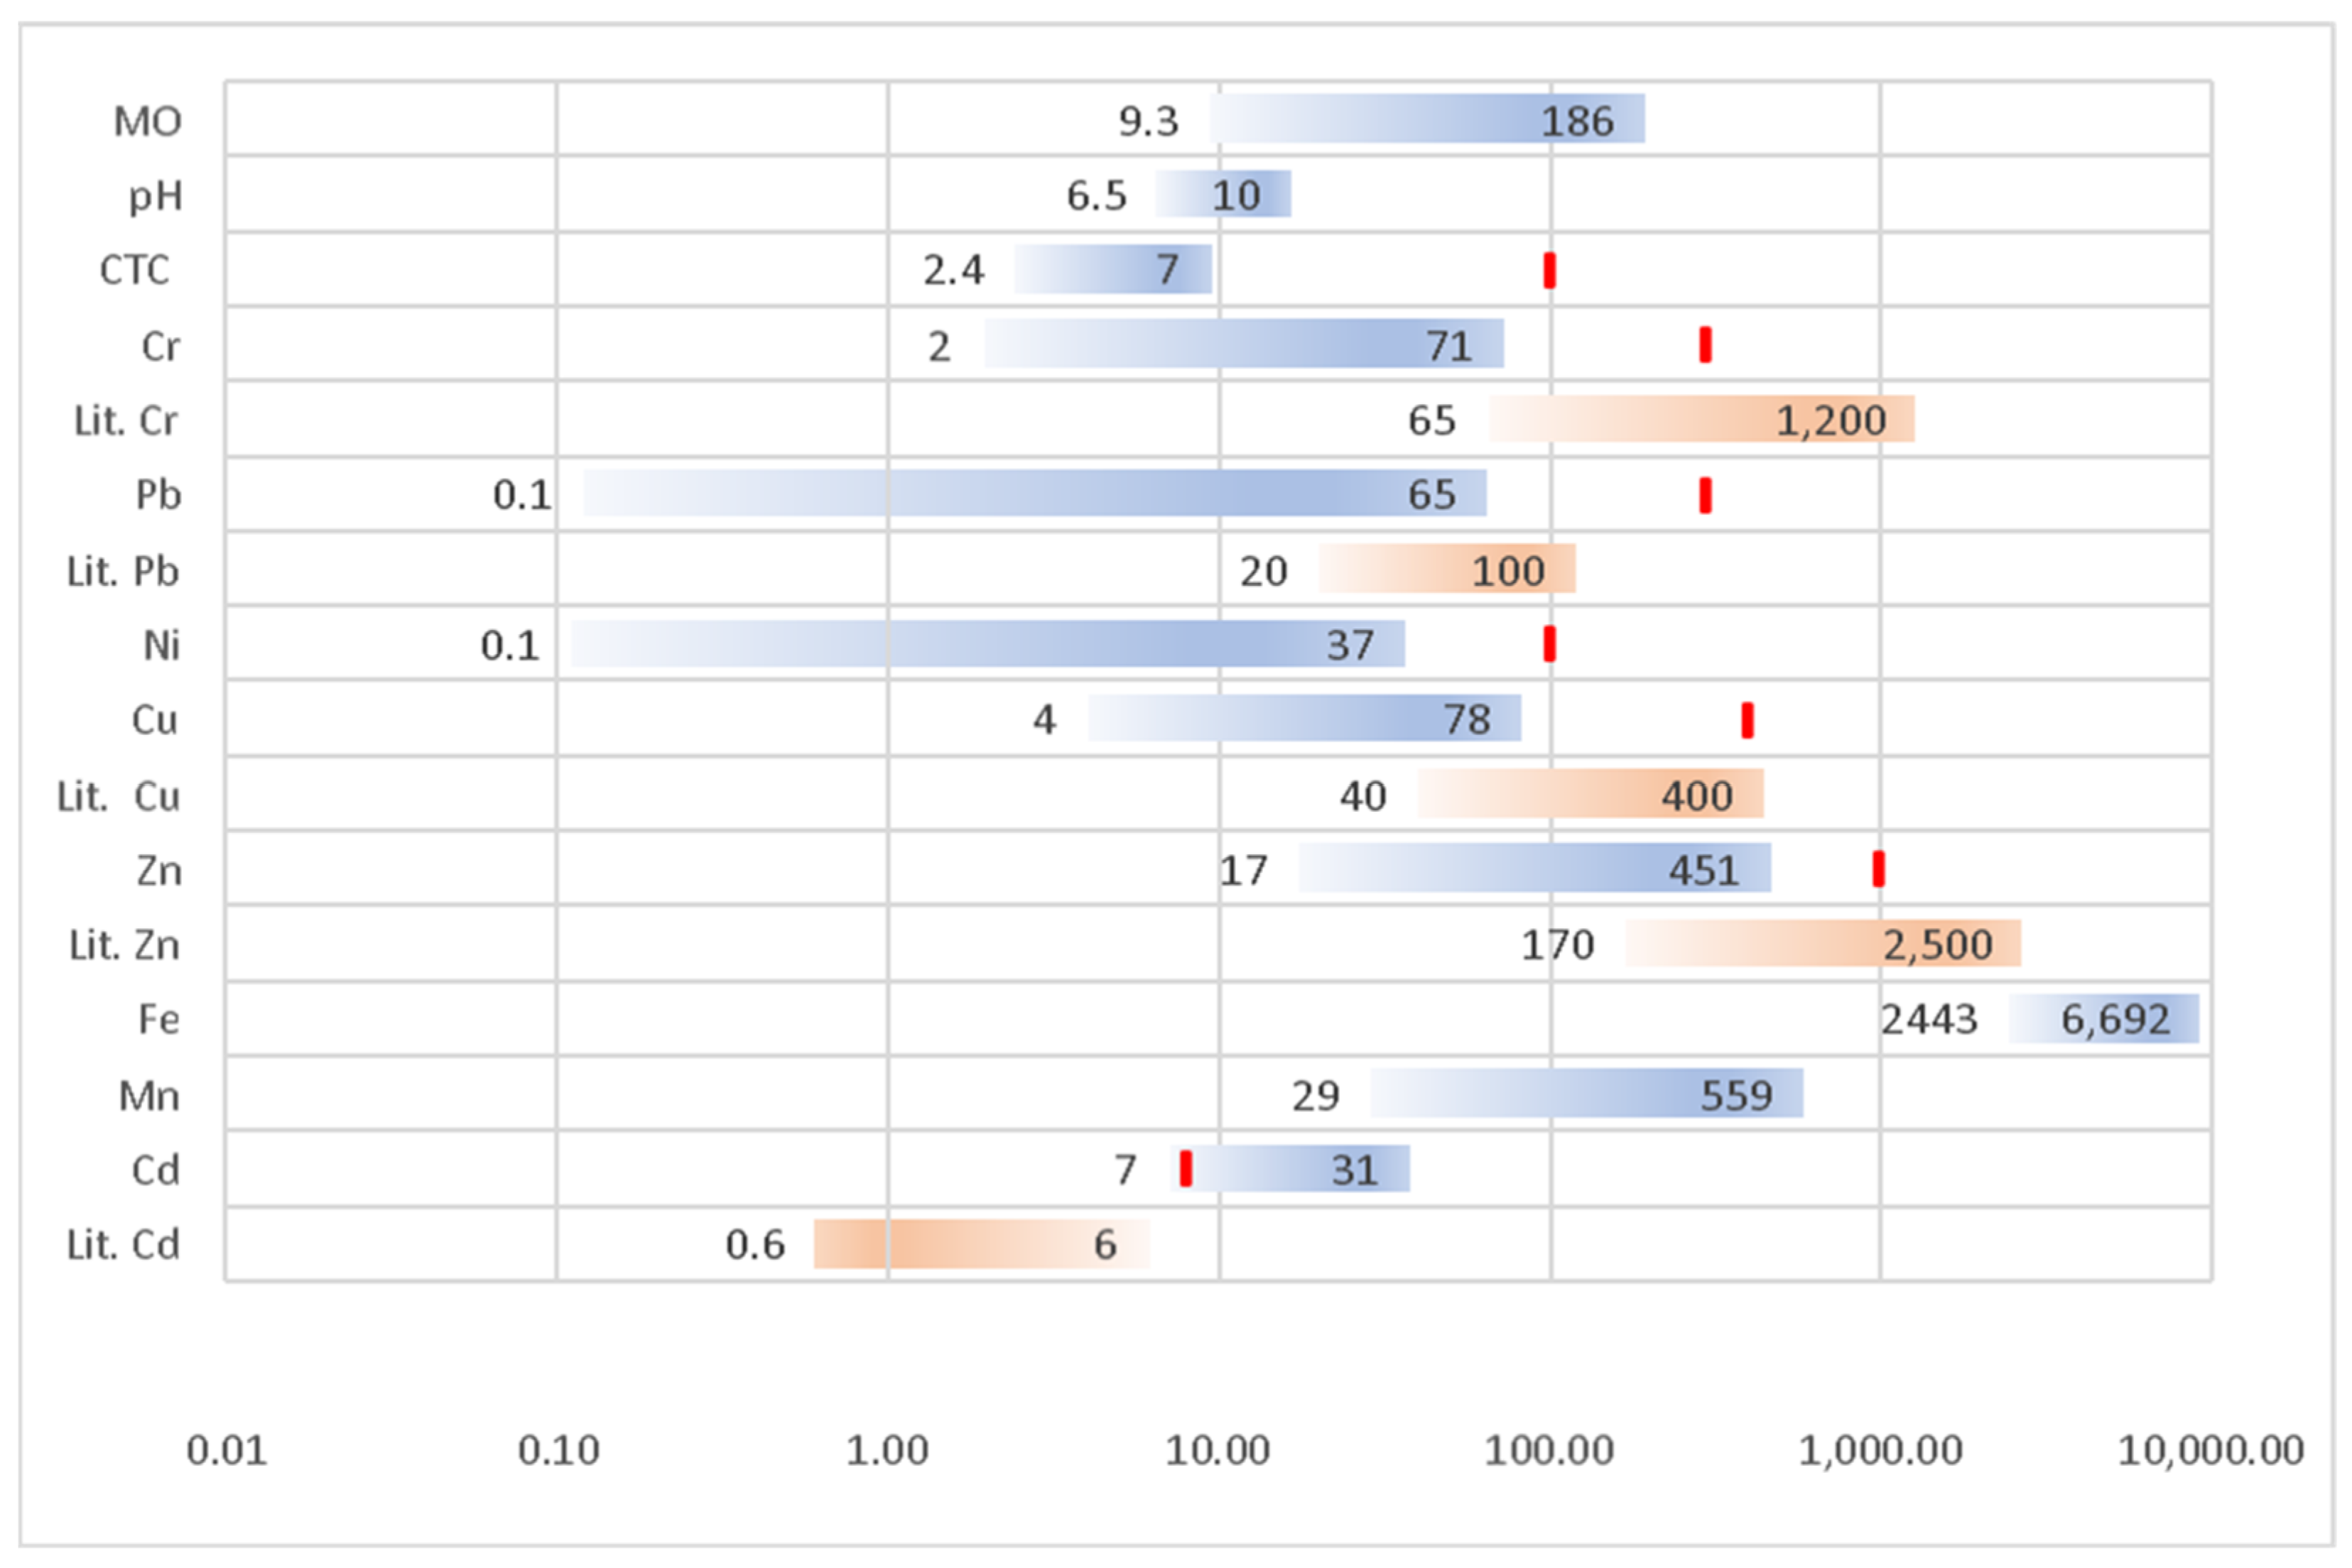
3.4. Results from Soil Monitoring

Soil monitoring took place during the period from 2014 to 2017, wherein samples were collected in April. The soil samples were collected at two specific depths (0–0.20 m and 0.20–0.40 m) at three points of the infiltration structure, the entrance, middle and exit. Information about the texture, metal ions, organic matter and pH of the soil were evaluated. A total of 22 soil samples were analysed. The synthesis of chemical monitoring is presented in Figure 4. The thresholds refers to BRL defined for soil classification in residential areas [49].
All metal ions present in the runoff were found in the soil samples. Only Cd was out of compliance with the values presented in BRL. Cadmium concentrations were investigated in 2014 and 2015; however, in 2016 and 2017, due to analytical problems Fe was analysed instead of Cd. This substitution occurred due to problems with the metal reading equipment. This metal (Fe) showed the highest concentrations during monitoring. The measured pH was considered neutral, with the exceptions of the sampling that occurred in 2015 (8.69 to 10.14). Soil pH is an important property in controlling chemical reactions. Generally, the mobility of metal cations increases as the acidity of the medium increases. However, this relationship is more variable for oxyanions.
The soil results indicate that the cation exchange capacity (CEC) and the amount of organic matter remained low. The CEC ranged from 2.40 to 7.12 cmolc/dm3 and the organic matter from 9.34 to 185.81 g/kg. Organic matter was present in all samples, with higher rates in the superficial samples (P1). The greatest variation in organic matter concentrations were found in 2016, but it does not reflect in the increase in CEC. The CEC retained similar values during all investigated years. Indeed, organic matter has a binding affinity for some metals, including Cu, Ni, Pb, Co, Ca, Zn, Mn and Mg [50].
The metals Zn, Fe and Mn presented higher concentrations than the other elements investigated. Fe and Mn are the heavy metals that usually appear in larger quantities in Brazilian soils [51]. The natural occurrence of heavy metals in soil depends on the rock matrix from which the soil was formed, the formation processes, composition, and proportion of its solid phase.
The range of concentrations of the metals sampled at the bottom of the swale is presented in Figure 4. All the pollutant concentrations in soil were well below the BRL for residential soils [49] and literature values. The exception is Cd, which showed four times higher concentrations than the BRL. The pollutant concentrations in the soil were also below the values found in the literature. The comparison values refer to the maximum values found in several drainage control structures in France [3].
Textural analyses of the swale soil were performed in 2016 and 2017 (Figure 5). The information presented is similar for all three sampling points at both depths highlighting that sand is the predominant fraction with values greater than 80%. The similarity of texture in all three points indicates that sedimentation from runoff particles did not occur at any specific point of the swale (Figure 5a) in 2016. The variations between 2016 and 2017 confirms that the sedimentation was well distributed along all three points, since the fines (clay and silt) presented higher values in the 2017 samples than the 2016 ones at all three points. The process of colmatation did not seem to be important in the swale, as, one year, the fines only increased by less than 10% (Figure 5b).
Soil texture influences the retention or mobility of pollutants. According to [52], clay content has a positive correlation with Cr, Ni, Cu, Pb and Cd retention. This correlation is inverse to silt contents. Thus, the predominant presence of sand in the soil does not favour the retention of contaminants in the infiltration swale. The predominantly sandy texture of the soil partially explains the low presence of contaminants found in the soil of this swale, although important concentrations were detected in the surface runoff. This soil type is typical of coastal plains and can be found in vast areas along the Brazilian coast [53].

3.5. Groundwater Monitoring Results

Water levels were monitored in PM3 (Figure 1) and water samples were collected in all three wells. Water levels were measured in all wells with a water level sounder during a sampling campaign. Since the aquifer is very transmissible water levels in wells responds quickly to water infiltration after rain events.
Despite the failures in the recording of the well level in the years 2015 and 2016, a reduction in the water level was observed from March to August 2016. The large volume of rain—much higher than the precipitation climatological standard normal of the site—detected in 2015 reflected in higher water level than in 2016 and 2017. The average water level in 2015 was around 2.0 m and was 1.7 m in 2016. Studies performed in the Ressacada aquifer found rapid water level variations as a response to recharge by infiltration of precipitation [36]. Both the Campeche aquifer and the Ressacada aquifer are sandy, have good transmissivity, shallow water levels and present this relatively fast response in level due to infiltration.
Groundwater was monitored for quality control in wells PM1, PM2 and PM3 in the vicinity of the swale in the period from 2015 to 2017 (accounting for 31 samples). The threshold concentration in groundwater is given by BRL [54], which establishes values for groundwater classification. The maximum and minimum values found in the samples and the comparison with BRL are shown in Figure 6.
The concentrations of the investigated metal ions were determined in all groundwater samples. There were records of excessive concentrations of Pb, Cr, Fe, Mn and Ni. Lead was identified in 90.9% of the analysed samples, Cr in 54.54%, Fe in 75.75%, Mn in 69.7% and Ni in 9.1%.

3.6. Integrative Analysis of All Three Environments (Runoff, Soil, Groundwater)

When the average concentrations present in the surface runoff and in the subsurface runoff were analysed, it was observed that the values were similar (illustrated in Figure 7. These results show that the pollutants found in the surface runoff were present in the subsurface water in similar concentrations, indicating the low performance of the structure in retaining these pollutants. The pollutants Zn, Cr and Cu presented higher concentration values in runoff than in groundwater, suggesting that they may have less mobility between the two environments, resulting in their retention in the soil.
According to the results presented previously, inorganic pollutants are present in the three environments investigated, indicating that the infiltration swale may be one of the insertion points of contaminants into the Campeche aquifer. The infiltration swale was not designed according to the minimum requirements established in a conventional LID project but has been in operation for over 30 years. The structure has good infiltration functionality, acting to control surface runoff in a coastal area where these issues are more intensified.
The structure does not function well as a pollutant retainer. Some research such as [7,8,10,47,48] has described the good functioning of the structures (infiltration swales) for the retention of Fe, Pb, Cu, Cr, Mn, Zn and Cd, in addition to the retention of turbidity, phosphorus and total solids. The results from [7], which monitored seven infiltration swales-with operation time from 5–15 years, show that the soil in the structures did not reach critical levels of metal contamination. One of the main factors influencing the capability of a soil to retain pollutants is its texture and also the absorption of these pollutants by macrophytes.
However, the swale cannot be considered the only point of contamination to the underground environment. There are 1017 compensatory drainage structures in the district, represented by infiltration swales and infiltration wells [55] (Figure 2b). Of these structures, 515 are installed in the moderate-vulnerability area and 447 structures in the high-vulnerability area of the Campeche aquifer. Furthermore, in the year 2000, approximately 94% of the residences used septic tanks followed by a complementary system for the treatment of their effluents, which may also have contributed to the concentrations of pollutants found in the groundwater.
The swale exerts a good control of surface runoff and plays an important role in the control of flooding in an area that presents difficulties for drainage, thus being very suitable to flooding. Meanwhile, it seems to act as a transfer point of pollutants from runoff into groundwater. The physical conformation of the Campeche district requires infiltration structures for runoff control due to its constraints to drainage, and, thus, adaptations are suggested to effectively manage the retention of contaminants. The use of natural biosorbents, for example, such as chitin [56], which is found abundantly in coastal areas, is a promising alternative that should be studied.

4. Conclusions

The studied infiltration swale receives concentrations of inorganic and organic pollutants along with surface runoff. All investigated metal ions were present in all three investigated environments (surface runoff, soil and groundwater), with the exception of Cd in groundwater. Surface runoff showed high concentrations of all investigated metal ions, namely Pb, Cu, Zn, Fe, Mn, Cr and Cd.
Out of 20 samples obtained from 2014 to 2017, excessive concentrations of Pb were present in 90% of the samples, Fe in 60%, Cr in 55%, Mn in 45%, Cd in 45%, Zn in 30% and Ni in 10%. This information is worrisome, since the swale has a high infiltration rate, reaching the infiltration capacity of up to 80% of the volume drained into the structure.
The results of the soil analyses collected from the bottom of the trench indicate the presence of all the investigated metal ions, but at concentrations below the BRL. The only observed non-compliance was for Cd. Textural characteristics indicate the predominance of sand, and low concentrations of organic matter, which reduce the retention of pollutants. The pH remained neutral and with a low CEC. It is understood that low CEC values represent soils that have a low capacity to retain cations in exchangeable form, thus allowing the migration of pollutants from the surface environment to the subsurface. While the soil has a high infiltration capacity, there are two aggravating factors: the first is the presence of toxic metal ions in the surface runoff and the second is the presence of an aquifer located very close to the surface (2.5 m on average). Water can be found within 0.40 m of the trench bottom in some situations, while many references recommend depths of at least 2 m.
High runoff concentrations and low soil retention capacity must impact the aquifer as was clear from the analysis of the subsurface runoff samples and their comparison with the BRLs. Lead was non-compliant in 90% of the samples analysed, Fe in 75.7%, Mn in 69.7%, Cr in 54.5% and Ni in 9.1%. Cu and Zn did not present nonconformities.
Thus: the infiltration swale has an excellent functioning for the infiltration of runoff, even considering the tidal effects and variability of intensities and volumes of rain. However, it does not retain pollutants; the concentrations of pollutants found in the underground water were almost equal to the concentrations found in the surface runoff. All of the metal ions investigated in this research can cause adverse health effects in considerable doses and were found in the environments investigated. The presence of metal ions in groundwater raises concern on the mobility of pollutants and the need to modify and adapt the infiltration structures built in the Campeche District. The application of structural changes in the infiltration LID structures of the region becomes a measure among several actions that could protect groundwater quality. Thus, the use of natural and locally abundant biosorbents is suggested to allow the retention of unwanted pollutants. The implementation of infiltration structures in sandy coastal sites must be well evaluated and, if necessary, pretreatment systems may also be required.

Author Contributions

A.R.: Conceptualization, methodology, investigation, writing—original draft preparation; E.P.: methodology and investigation; J.C.: methodology, investigation; J.C.R.: data curation; A.R.F.: Conceptualization, writing —original draft preparation, writing—review and editing, project administration, funding acquisition. Proof-Reading-Service.com Ltd.: writing—review and editing. All authors have read and agreed to the published version of the manuscript.

Funding

This research was funded by Brazilian research agencies CAPES (Coordenação de Aperfeiçoamento de Pessoal de Nível Superior) and CNPQ (Conselho Nacional de Desenvolvimento Científico e Tecnológico) edital MCTI/CNPq No 14/2013–Universal.

Institutional Review Board Statement

Not applicable.

Informed Consent Statement

Not applicable.

Data Availability Statement

Acknowledgments

The authors are thankful to the LIMA/UFSC (Laboratório Integrado do Meio Ambiente), UnC (Universidade do Contestado), UNOESC (Universidade do Oeste de Santa Catarina), and TSGA/PETROBRAS (Tecnologia Sociais para Gestão da Água) for laboratory support and to the Florianópolis Municipal Government—(Santa Catarina) for technical support.

Conflicts of Interest

The authors declare no conflict of interest. The funders had no role in the design of the study; in the collection, analyses, or interpretation of data; in the writing of the manuscript, or in the decision to publish the results.

References

  1. Abellán García, A.I.; Cruz Pérez, N.; Santamarta, J.C. Sustainable Urban Drainage Systems in Spain: Analysis of the Research on SUDS Based on Climatology. Sustainability 2021, 13, 7258. [Google Scholar] [CrossRef]
  2. Qi, Y.; Chan, F.K.S.; O’Donnell, E.C.; Feng, M.; Sang, Y.; Thorne, C.R.; Griffiths, J.; Liu, L.; Liu, S.; Zhang, C.; et al. Exploring the Development of the Sponge City Program (SCP): The Case of Gui’an New District, Southwest China. Front. Water 2021, 3, 41. [Google Scholar] [CrossRef]
  3. Tedoldi, D.; Gromaire, M.-C.; Chebbo, G. Infiltrer Les Eaux Pluviales C’est Aussi Maîtriser Les Flux Polluants; OPUR: Paris, France, 2020. [Google Scholar]
  4. Barbosa, A.E.; Fernandes, J.N. Review of tools for road runoff quality prediction and application to European roads. Water Sci. Technol. 2021, 84, 2228–2241. [Google Scholar] [CrossRef] [PubMed]
  5. Fletcher, T.D.; Shuster, W.; Hunt, W.F.; Ashley, R.; Butler, D.; Arthur, S.; Trowsdale, S.; Barraud, S.; Semadeni-Davies, A.; Bertrand-Krajewski, J.L.; et al. SUDS, LID, BMPs, WSUD and more—The evolution and application of terminology surrounding urban drainage. Urban Water J. 2015, 12, 525–542. [Google Scholar] [CrossRef]
  6. Huthinson, S.L.; Keane, T.; Christianson, R.D.; Skabeland, L.; Mooret, L.; Green, E.A.; Kinery-Page, K. Management practices for the amelioration of urban stormwater. Procedia Environ. Sci. 2009, 9, 83–89. [Google Scholar] [CrossRef] [Green Version]
  7. Ingvertsen, S.T.; Sommer, H.; Cederkvist, K.; Régent, Y.; Jensen, M.B.; Magid, J. Infiltration and Treatment of Urban Stormawater: How Well do Swale-Trench Systems Work? NOVATECH: Lyon, France; INSA de Lyon: Lyon, France, 2010. [Google Scholar]
  8. Ismail, A.F.; Sapari, N.; Waha, B.; Abdul, M.M. Vegetative swale for treatment of stormwater runoff from contruction site. Sci. Technol. Pertanika J. Ci Technol. 2014, 22, 55–64. [Google Scholar]
  9. Horstmeyer, N.; Huber, M.; Drewes, J.E.; Helmreic, H. Evaluation of site-specific factors inflencing heavy metal contents in the topsoil of vegetated infiltration swales. Sci. Total Environ. 2016, 560, 19–28. [Google Scholar] [CrossRef]
  10. Leroy, M.C.; Koltalo, F.P.; Legras, M.; Lederf, F. Performance of vegeted swale for improving road runoff quality in a moderate traffic urban area. Sci. Total Environment. 2016, 566, 113–121. [Google Scholar] [CrossRef]
  11. Scholes, L.; Revitt, D.M.; Ellis, J.B. A systematic approach for the comparative assessment of stormwater pollutant removal potentials. J. Environ. Manage. 2008, 88, 467–478. [Google Scholar] [CrossRef]
  12. Baptista, M.; Nascimento, N.; Barraud, S. Técnicas Compensatórias em Drenagem Urbana; Associação Brasileira de Recursos Hídricos: Porto Alegre, Brazil, 2005. [Google Scholar]
  13. Belotti, F.M. Capacidade de Retenção de Metais Pesados Pelo Solo em Áreas de Implantação de Estruturas de Infiltração Para Águas Pluviais Urbanas em Belo Horizonte-MG. Ph.D. Thesis, Universidade Federal de Minas Gerais, Belo Horizonte, Brazil, 2011; 142p. [Google Scholar]
  14. Sebastian, C.; Barraud, S.; Becouze-Lareire, C.; Gonzalez-Merchan, C.; Lipeme-Kouy, I.; Gibello, C. Accumulated Sedimetns in a Large Dry Stormwater Retention-Detention Basin: Physic-Chimical Spatial Characterization and Evolution—Estimation of Metals, Pesticides, PAHs and Alkylphenols Contents; NOVATECH: Lyon, France, 2013; p. 10. [Google Scholar]
  15. California Stormwater Quality Association. California Stormwater Best Management Practices Handbook: New Development and Redevelopment; CASQA: Redondo Beach, CA, USA, 2003; 378p. [Google Scholar]
  16. Pacheco, E.F. Avaliação Quali-Quantitativa do Desempenho de Uma Vala de Infiltração de Águas Pluviais Implantada em Florianópolis. Dissertação de Mestrado Apresentada ao Programa de Pós-Graduação em Engenharia Ambiental; da Universidade Federal de Santa Catarina: Florianópolis, Brazil, 2015. [Google Scholar]
  17. Silveira, A.L.L. Problems of modern urban drainage in developing countries. Water Sci. Technol. 2002, 45, 31–40. [Google Scholar] [CrossRef]
  18. Ruckelshaus, M.H.; Guannel, G.; Arkema, K.; Verutes, G.; Griffin, R.; Guerry, A.; Silver, J.; Faries, J.; Brenner, J.; Rosenthal, A. Evaluating the benefits of green infrastructure for coastal areas. Coast. Manag. 2016, 44, 504–516. [Google Scholar] [CrossRef]
  19. Arkema, K.K.; Griffin, R.; Maldonado, S.; Silver, J.; Suckale, J.; Guerry, A.D. Linking social, ecological, and physical science to advance natural and nature-based protection for coastal communities. Ann. N. Y. Acad. Sci. 2017, 1399, 5–26. [Google Scholar] [CrossRef] [PubMed]
  20. Mao, X.; Enot, P.; Barry, D.A.; Li, L.; Binley, A.; Jeng, D.S. Tidal influence on behaviour of a coastal aquifer adjacent to a low-relief estuary. J. Hydrol. 2006, 327, 110–127. [Google Scholar] [CrossRef]
  21. Caprario, J.; Rech, A.S.; Tasca, F.A.; Finotti, A.R. Influence of drainage network and compensatory techniques on urban flooding susceptibility. In Proceedings of the 11th International Conference on Urban Drainage Modelling, Palermo, Italy, 23–26 September 2018; Mannina, G., Ed.; Springer International: New York, NY, USA, 2018; pp. 23–26. [Google Scholar]
  22. Reginato, P.A.R.; Brancher, L.; Schafer, A.E.; Lanzer, R.M. Poços como vetores de contaminação: O caso dos aquíferos da planície costeira do Rio Grande do Sul. In Proceedings of the XV Congresso Brasileiro de Águas Subterrâneas, Natal, Brazil, 14 November 2008; ABAS: São Paulo, Brazil, 2008; pp. 11–15. [Google Scholar]
  23. Medeiros, C.M.; Barbosa, D.L.; Ceballos, B.S.O.; Ribeiro, M.M.R.; Albuquerque, J.P.T. Qualidade das águas subterrâneas na porção sedimentar na região do baixo curso do rio Paraíba. In Proceedings of the XVIII Simpósio Brasileiro de Recursos Hídricos, Campo Grande, Brazil, 26 November 2009; ABRH; Porto Alegre, Brazil, 2009; p. 10. [Google Scholar]
  24. Peel, M.C.; Finlayson, B.L.; McMahon, T.A. Updated world map of the Köppen-Geiger climate classification. Hydrol. Earth Syst. Sci. 2007, 11, 1633–1644. [Google Scholar] [CrossRef] [Green Version]
  25. OMM. WMO Guidelines on the Calculation of Climate Normals; WMO-No. 1203; WMO: Geneve, Switzerland, 2017; 18p. [Google Scholar]
  26. Erickson, A.J.; Weiss, P.T.; Gulliver, J.S. Optimizing Stormwater Treatment Practices; Springer: New York, NY, USA, 2013; ISBN 978-1-4614-4623-1. [Google Scholar]
  27. APHA. Standard Methods for the Evaluation of Water and Wastewater, 22th ed.; LTC-Pharmabooks: Washington, DC, USA, 2012. [Google Scholar]
  28. Tedesco, M.J.; Gianello, C.; Bissani, C.A.; Bohnen, H.; Volkweiss, S.J. Análise de Solo, Plantas e Outros Materiais, 2nd ed.; UFRGS: Porto Alegre, Brazil, 1995. [Google Scholar]
  29. EMBRAPA. Empresa Brasileira de Pesquisa Agropecuária. Sistema Brasileiro de Classificação de Solos, 2nd ed.; EMBRAPA Solos: Rio de Janeiro, Brazil, 2006. [Google Scholar]
  30. ABNT. Brazilian Technical Standard 07181: Soil Particle Size Determinantion with Sieves and Sedimentation; ABNT: São Paulo, Brazil, 1984. [Google Scholar]
  31. ABNT. Brazilian Technical Standard—Infiltration with Concentric Rings; ABNT: São Paulo, Brazil, 1997. [Google Scholar]
  32. Cai, W.; McPhaden, M.J.; Grimm, A.M.; Rodrigues, R.R.; Taschetto, A.S.; Garreaud, R.D.; Dewitte, B.; Poveda, G.; Ham, Y.-G.; Santoso, A.; et al. Climate impacts of the El Niño–Southern Oscillation on South America. Nat. Rev. Earth Environ. 2020, 1, 215–231. [Google Scholar] [CrossRef]
  33. Martínez, R.; Zambrano, E.; Nieto López, J.J.; Hernández, J.; Costa, F. Evolución, vulnerabilidad e impactos económicos y sociales de El Niño 2015-2016 en América Latina. Investig. Geográficas 2017, 65, 65–78. [Google Scholar] [CrossRef] [Green Version]
  34. Frello, A.S. Avaliação Quantitativa de Uma Vala de Infiltração Como Técnica Compensatória em Drenagem Urbana; Universidade Federal de Santa Catarina: Florianópolis, Brazil, 2016; p. 109. [Google Scholar]
  35. Orlando, E.G. Avaliação do Fenômeno da Carga de Lavagem na Área de Contribuição de Uma Vala de Infiltração Localizada no Distrito do Campeche (Florianópolis/SC); Universidade Federal de Santa Catarina: Florianópolis, Brazil, 2017; p. 128. [Google Scholar]
  36. Rama, F.; Miotlinski, K.; Franco, D.; Corseuil, H.X. Recharge estimation from discrete water-table datasets in a coastal shallow aquifer in a humid subtropical climate. Hydrogeol. J. 2018, 26, 1887–1902. [Google Scholar] [CrossRef]
  37. BRASIL; Conselho Nacional do Meio Ambiente (CONAMA). Resolução 357/2005. Dispõe sobre a classificação dos corpos de água e diretrizes ambientais para o seu enquadramento, bem como estabelece as condições e padrões de lançamento de efluentes, e dá outras providênc. DOU 2005, 53, 58–63. [Google Scholar]
  38. Minnessota Stormwater Manual. Available online: https://stormwater.pca.state.mn.us/index.php?title=Typical_Annual_and_Snowmelt_Urban_Stormwater_Quality_Characteristics (accessed on 20 October 2021).
  39. David, N.; Leatherbarrow, J.E.; Yee, D.; McKee, L.J. Removal efficiencies of a bioretention system for trace metals, PCBs, PAHs, and dioxins in a semiarid environment. J. Environ. Eng. 2015, 141, 04014092. [Google Scholar] [CrossRef] [Green Version]
  40. Shibata, T.; Solo-Gabriele, H.M.; Fleming, L.E.; Cai, Y.; Townsend, T.G. A mass balance approach for evaluating leachable arsenic and chromium from an in-service CCA-treated wood structure. Sci. Total Environ. 2007, 372, 624–635. [Google Scholar] [CrossRef] [Green Version]
  41. Cederkvist, K.; Jensen, M.B.; Holm, P.E. Characterization of Chromium Species in Urban Runoff. J. Environ. Qual. 2013, 42, 111–117. [Google Scholar] [CrossRef] [PubMed]
  42. Gromaire, M.-C.; Veiga, L.; Grimaldi, M.; Aires, N. Outils de Bonne Gestion des Eaux de Ruissellement en Zones Urbaines; Eau Seine Normandie: Nanterre, France, 2013. [Google Scholar]
  43. US EPA. Median Concentrations from More Than 2300 Rainfall Events Monitored across the Nation; USEPA: Washington, DC, USA, 1983.
  44. Hunt, W.F.; Davis, A.P.; Traver, R.G. Meeting Hydrologic and Water Quality Goals through Targeted Bioretention Design. J. Environ. Eng. 2012, 138, 698–707. [Google Scholar] [CrossRef]
  45. VonSperling, M. Princípios do tratamento biológico de águas residuárias. In Introdução à Qualidade das Águas e ao Tratamento de Esgoto; UFMG: Belo Horizonte, Brazil, 2005. [Google Scholar]
  46. Souza, A.M.; Salviano, A.M.; Melo, J.F.B.; Felix, W.P.; Belém, C.S.; Ramos, P.N. Seasonal study of concentration of heavy metals in waters from lower São Francisco River basin, Brazil. Braz. J. Biol. 2016, 76, 967–974. [Google Scholar] [CrossRef] [Green Version]
  47. Barrett, M.E.; Walsh, P.M.; Malina, J.F.; Charbeneau, R.J. Performance of vegetative controls for treating highway runoff. J. Environ. Eng. 1998, 124, 1121–1128. [Google Scholar] [CrossRef]
  48. Stagge, H.J.; Allen, D.; Jamil, E.; Kim, H. Performace of grass swales for improving water quality from highway runoff. Water Res. 2012, 46, 20–6731. [Google Scholar] [CrossRef] [PubMed]
  49. BRASIL; Conselho Nacional do Meio Ambiente (CONAMA). Resolução 420/2009. Dispõe sobre critérios e valores orientadores de qualidade do solo quanto à presença de substâncias químicas e estabelece diretrizes para o gerenciamento ambiental de áreas contaminadas por. Publicação DOU 2009, 249, 81–84. [Google Scholar]
  50. McBride, M.B. Environmental Chemistry of Soils; OUP: New York, NY, USA, 1994. [Google Scholar]
  51. Fadiga, F.S.; Amaral-Sobrinho, N.M.B.; Mazur, N.; Anjos, L.H.C.; Freixo, A.A. Concentrações naturais de metais pesados em algumas classes de solos brasileiros. Bragantina 2002, 61, 151–159. [Google Scholar] [CrossRef] [Green Version]
  52. Yang, Z.; Liang, J.; Tang, L.; Zeng, G.; Yu, M.; Li, X.; Li, X.; Qian, Y.; Wu, H.; Luo, Y.; et al. Sorption-desorption behaviors of heavy metals by biochar-compost amendment with different ratios in contaminated wetland soil. J. Soils Sediments 2018, 18, 1530–1539. [Google Scholar] [CrossRef]
  53. Santos, H.G.; Jacomine, P.K.; Anjos, L.H.C.; Oliveira, V.A.; Lumbreras, J.F.; Coelho, M.R.; Almeida, J.A.; Araujo Filho, J.C.; Oliveira, J.B.; Cunha, T.J.F. Brazilian Soil Classification System, 5th ed.; EMBRAPA: Brasília, Brazil, 2018. [Google Scholar]
  54. BRASIL Conselho Nacional do Meio Ambiente (CONAMA). Resolução 396/2008. Dispõe Sobre a Classificação e Diretrizes Ambientais para o Enquadramento das Águas Subterrâneas e dá Outras Providências; MMA: Brasília, Brazil, 2008. [Google Scholar]
  55. Rech, A.S.; Caprario, J.; Miranda, N.M.G.; Tasca, F.A.; Finotti, A.R.; Rech, J.C.; Durante, T.; Favero, M.; Chiuchi, L.; Leoratto, J.; et al. Uso de técnicas de infiltração e os riscos de contaminação de aquíferos superficiais. Anais 2017. Available online: https://repositorio.ufsc.br/bitstream/handle/123456789/215452/PGEA0659-T.pdf?sequence=-1&isAllowed=y (accessed on 20 October 2021).
  56. Rech, A.S.; Rech, J.C.; Caprario, J.; Tasca, F.A.; Lobo Recio, M.A.; Finotti, A.R. Use of shrimp-shell for adsortion of metals present surface runoff. Water Sci.Technol. 2019, 79, 2221–2230. [Google Scholar] [CrossRef]
Figure 1. (a) Contribution area and location of infiltration swale (b) swale instrumentation.
Water 14 00238 g001
Figure 2. (a) Hydrography details in the vicinity of the infiltration swale; (b) presence of infiltration structures near the swale.
Water 14 00238 g002
Figure 3. Range of concentrations sampled in runoff inflow to the Campeche infiltration swale in 2014–2017. If not indicated, concentrations are in mg/L. Orange boxes with the acronym Lit. preceding the pollutant name indicate literature ranges (Table 4. The red line indicates the chemical concentrations for the Brazilian regulatory limit (BRL) Class 2 waters. P: range of events rain depths; Turb: turbidity; Total COD: chemical oxygen demand; Total PHO: total phosphorus; TS: total solids; DS: dissolved solids; SS: suspended solids.
Water 14 00238 g003
Figure 4. Range of soil concentrations sampled in the infiltration swale soil in 2014–2017. Concentrations are in mg/kg. Orange boxes with acronym Lit. preceding the pollutant name indicate literature concentration ranges [3]. The red line indicates the chemical concentration for the Brazilian Regulatory Limit for residential use soils [49]. MO: organic matter; CEC: cation exchange capacity.
Water 14 00238 g004
Figure 5. (a) Particle size distribution curves for soil swale samples in 2016. (b) Percentages of clay, silt and sand in samples from 2016 and 2017. Location of soil sample points; P1 is near the inlet, P2 is in the middle and P3 is near the outlet;“A” refers to 0–0.2 m depths and “B” to 0.2–0.4 m. For details, see Figure 1b.
Water 14 00238 g005
Figure 6. Range of concentrations sampled in groundwater in wells PM1, PM2 and PM3 of the infiltration swale soil in 2015–2017. Concentrations are in mg/L. The red line indicates the chemical concentration for the Brazilian reglatory limit (BRL) for groundwater [54].
Water 14 00238 g006
Figure 7. Comparison of average groundwater and runoff concentrations.
Water 14 00238 g007
Table 1. Analytical methods applied to water and soil samples.
MediumParameterAnalysis TypeMethod Reference
runoff and groundwaterCd, Cu, Pb, Zi, Cr, Fe, Mn, Ni, P-PO4 and N-NO2mass spectrophotometerSM3111B 4500-P C and NO2 B [27]
pHpHmeter
Solids 1gravimetric2540B,C,D [27]
TOC 2TOC analyser5310 B [27]
turbiditynephelometric2130B [27]
alkalnitytitulometry2501B [27]
CODspectrophotometer5310B [27]
Cd, Cu, Pb, Zi, Cr, Fe, Mn, Nimass spectrophotometerSM3111B [27]
pHpHmeter
CEC 3 [28]
soilOM 4 [29]
PSD 5 NBR 07181/84 [30]
nfiltration rateconcentric ringsNBR 13969/97 [31]
1 Total, solved and filtered solids; 2 total organic carbon; 3 cathion exchange capacity; 4 organic mater; 5 particle size distribution.
Table 2. Rainfall in monitoring years in contrast to the precipitation climatological standard normal (INMET) of Florianópolis.
MonthsPCSN 1 (INMET)Precipitation in Swale Rain Gauge or CEMADEN
2014201520162017
January 3 162.7147.195.7184.6178.2
February196.9148.6335.3159.672.0
March17394.6237.1218.4174.9
April92.8178.0207.5121.2147.0
May96.966.8194.166.1276.8
June89.5197.982.638.4126.5
July 399.568.2275.4149.18.9
August95.385.874.078.0107.2
September134.2115.9321.3129.484.4
October109.8113.0293.6134.1102.7
November130.284.0176.444.9128.7
December13790.4132.6325.1165.9
MA 2126.5115.8202.1137.4131.1
total annual15171390.32425.61648.91573.1
% diffe from climatology0−8.459.88.63.6
1 PCSN: precipitation climatological standard normal; 2 MA: monthly average. 3 In the southern hemisphere summer is from 21 December to 20 March, winter is from 21 June to 22 September.
Table 3. Swale performance in controlling runoff for some selected events.
EventP
(mm)
D
(min)
DNR
(days)
VeVoVi%Inf
13/2/1555.611521516166719913
9/3/1597.662022638227319914
15/3/1526.8315297021275778
4/8/1510.4160341525316239
12/8/1516325768321351475
25/8/1514.230591269263101980
31/8/1538.442061550126025416
2/9/1515.23093837758304
17/3/1526.822923152209530
7/1/1619.854522521678534
17/8/163.2174232191342
P: rain depth; D: rain duration; DNR: previous days without rain; Ve: swale entry volume; Vo: swale outlet volume; Vi: infiltrated volume in the swale; %Inf: percentage of the total volume infiltrated during the event.
Table 4. Literature examples of runoff contaminant concentration ranges.
Reference [3,42][43][38][4][39][40,41]
CharacteristicRoad Runoff 1Road Runoff 2Urban Watershed Runoff 3Road Runoff 4Urban Watershed Runoff 5Wood Deck Runoff 6
MES (mg/L)69.3–875
DCO (mg/L)70–3689166–169
Cd0.4–13.8 0.4–0.6
Cu65.6–143.5 16–228–72
Pb25–5351800.4–0.62–44
Zn129.3–1956 111–20376–346
Ni 1–95
Cr 0.6–580
Nitrate 0.96
P 0.460.29–0.66
TSS 64–1847–225
1 WikHydro. Based on runoff pollutant concentrations in French sites; 2 median concentration from 2300 sites along; 3 runoff from an urban watershed in Minnessota; 4 site mean concentration from runoff quality studies conducted in 10 highways in Portugal; 5 semiarid climate urban watershed in the California range of concentrations in runoff to a bioretention system (three events and nine samples); 6 runoff generated in wood deck experimental sites (three years) and a small revision of Cr concentrations in runoff.
Publisher’s Note: MDPI stays neutral with regard to jurisdictional claims in published maps and institutional affiliations.

