Article

Evaluation of the Effectiveness of the SED-BIO System in Reducing the Inflow of Selected Physical, Chemical and Biological Pollutants to a Lake

by
Jerzy M. Kupiec
1,*,
Agnieszka Bednarek
2,
Sebastian Szklarek
3,
Joanna Mankiewicz-Boczek
3,
Liliana Serwecińska
3 and
Jolanta Dąbrowska
4
1
Department of Ecology and Environmental Protection, Faculty of Environmental Engineering and Mechanical Engineering, Poznań University of Life Sciences, 60-649 Poznań, Poland
2
UNESCO Chair on Ecohydrology and Applied Ecology, Faculty of Biology and Environmental Protection, University of Lodz, 90-237 Łódź, Poland
3
European Regional Centre for Ecohydrology of the Polish Academy of Sciences, 90-364 Łódź, Poland
4
Department of Civil Engineering, Faculty of Environmental Engineering and Geodesy, Wrocław University of Environmental and Life Sciences, 50-363 Wrocław, Poland
*
Author to whom correspondence should be addressed.
Water 2022, 14(2), 239; https://doi.org/10.3390/w14020239
Submission received: 30 November 2021 / Revised: 5 January 2022 / Accepted: 11 January 2022 / Published: 14 January 2022
(This article belongs to the Special Issue Stormwater Management in Urban and Rural Areas)

Abstract

:
The aim of this study was to assess the efficiency of the innovative SED-BIO system in limiting the inflow of pollutants to Jelonek Lake. The analyses were conducted in the Gniezno Lake District in Greater Poland (the western part of Poland). Physical and chemical analyses were conducted in the years 2016–2019. The results demonstrate that the system is highly effective in the reduction of such nutrients as nitrogen (NO3—63%; NH4+—14.9%) and phosphorus (PO43−—19.3%). Although the presence of cyanobacteria was confirmed practically throughout the whole monitoring period of the system (2016), the specimens found in most samples were not toxigenic genotypes with a potential to produce microcystins. Microcystins (3 µg·L−1) were detected only once, immediately after the SED-BIO system had been installed in the river and pond, which demonstrates that this natural toxin was eliminated from the additional pool of contaminants that might be transported to Jelonek Lake.

1. Introduction

Water quality in Poland and all over the globe is deteriorating due to continuous and permanent pollution, progressive eutrophication, and degradation. These are caused by human economic activity, as well as the processes that transform or even degrade the natural environment [1,2,3,4,5,6,7]. The appropriate protection and use of aquatic ecosystems are becoming increasingly important for further social development and for the everyday lives of a growing number of people. In numerous water reservoirs, the main problem is that the water is becoming over-fertilized with such nutrients as nitrogen and phosphorus. They flow into the waters from industrial and agricultural areas and emerge as a result of rapidly progressing urbanization. Nutrients may enter lakes through surface runoff from paved surfaces, point discharge of pollutants or they may be supplied by water courses from the catchment area. The degradation of lakes leads to a deterioration of their recreational and fishing values and limits the possibilities to use them for municipal purposes. This, in turn, has negative economic consequences [5,7,8,9]. The progressing eutrophication, which very often involves the emergence and further domination of toxic cyanobacteria, is particularly dangerous for shallow reservoirs that are situated in areas that are significantly transformed and perhaps occupied by humans. Gradual overgrowth and shallowing are also natural phenomena, which are accelerated by anthropogenic activities [10,11]. The intensity of trophicity is associated with an increase in the primary production of aquatic organisms, mainly phytoplankton, algae, and cyanobacteria. The acceleration of productivity is the result of an increase in the concentrations of phosphorus and nitrogen reaching the surface waters in the form of minerals or organic matter. Weather and climatic factors are of great importance as well. The eutrophication process is a source of greenhouse gases such as carbon dioxide, methane, and nitrous oxide [12,13,14,15].
One of the most important factors that may stimulate the eutrophication process is precipitation and its chemistry. The increase in evapotranspiration in relation to the total rainfall and problems with drought cause an increase in the concentration of components in surface waters and intensify the eutrophication process. This is indirectly caused by the increase in average temperature. Rising air temperature also causes an increase in the temperature of surface waters. Uneven distribution of rainfall throughout the year and the intensification of related extreme phenomena, such as torrential rains, intensify surface runoff and leaching of nutrients from soil to water. This applies mainly to agricultural land. It is assumed that the average nitrogen outflow from arable soils in Poland is 10–20 kg·ha−1 per year [16]. The chemistry of rainfall is also important. Precipitation, especially in areas with intensive agricultural production, may contain relatively large amounts of nitrogen compounds. A good indicator is the ammonium form of nitrogen, whose advantage over the nitrate form is related to the degree of air pollution. It is estimated that the amount of nitrogen compounds from atmospheric precipitation is 8–20 kg·ha−1 per year, and up to 2 kg·ha−1 of phosphorus is also supplied in this way [17]. The soil type may also exacerbate eutrophication. Light, permeable soils favor the process of nitrification and, as a result, the leaching of nitrates. The main step before the introduction of reclamation measures should be identifying all sources of pollution in the lake catchment and reducing the load of pollutants to the greatest extent possible [18]. Only combined actions aimed at eliminating or minimizing all factors that threaten the reservoir, both biological and chemical factors, may lead to a permanent improvement of the condition of the aquatic ecosystem. In most cases, the deterioration of lake water is caused by the inflowing water courses that periodically carry high loads of nutrients (discharge from agricultural areas, inflow from sewage system leaks) and organic matter. Quite often, rainwater from large, paved areas (such as parking lots or streets) is also discharged into these water courses, which results in a rapid inflow after torrential rains. This is why it is so important to implement Nature-based Solutions (NbS) that are based on natural processes. These solutions employ the proper activation of selected self-purification processes, which may significantly improve the water quality in the given reservoir [5,7,19,20,21,22]. According to the report by the European Environmental Agency from 2018, approximately 40% of surface waters in EU Member States meet the criteria for good and very good ecological status. The water quality in lakes and coastal waters is usually higher than that in rivers and transitional waters [23]. Moreover, lakes and water reservoirs are very important elements of the landscape and the functioning of cities. They provide recreational and leisure areas, support biodiversity, regulate the microclimate, and retain rainwater. Unfortunately, the quality of inflowing waters often does not meet the quality standards [24,25]. One of the main threats, and, as a consequence, the key factor that influences the ecological quality of small urban aquatic ecosystems, is rainwater runoff, which transports chemical and microbiological pollutants from impermeable urban areas [6,26,27]. As far as small urban reservoirs are concerned, the high ratio of catchment area to reservoir area and the high load of pollutants from urban catchments or rainwater discharge systems, together with the considerable amount of time that the water is retained make them particularly prone to accelerated eutrophication and deterioration of sanitary status. The identification of these pollutants and the paths of their inflow from the catchment to surface waters in the city area will allow us to select the appropriate solutions based on the use of environmental biotechnologies that will minimize their degrading effects on the aquatic environment [28,29,30,31].
An example of such solutions may be various types of sedimentation and biofiltration systems. The SED-BIO system described in this article was designed to optimize the use of the available space in the area of the city of Gniezno. The purpose of having individual zones in the system was to maximize the chances of the occurrence of such processes as: sedimentation and microbiological mineralization of organic matter, biogeochemical binding of phosphates, denitrification and phytoremediation, and to improve the efficiency of these processes.
The aim of the study was to assess the effectiveness of an innovative system that is located on the Struga Gnieźnieńska water course and consists of two sections: A and B. Its aim is to reduce the inflow of pollutants into Jelonek Lake, by means of transforming and reducing the load of nutrients. In order to achieve the planned goal, the following tasks were performed: (1) analysis of the concentration of phosphates, nitrates—nitrogen, ammonium—nitrogen; (2) assessment of phytoplankton abundance, including the presence of toxigenic cyanobacteria, and the toxicity of hepatotoxins—microcystins; and (3) evaluation of the sanitary condition of water based on the detection of fecal indicator bacteria (FIB).

2. Materials and Methods
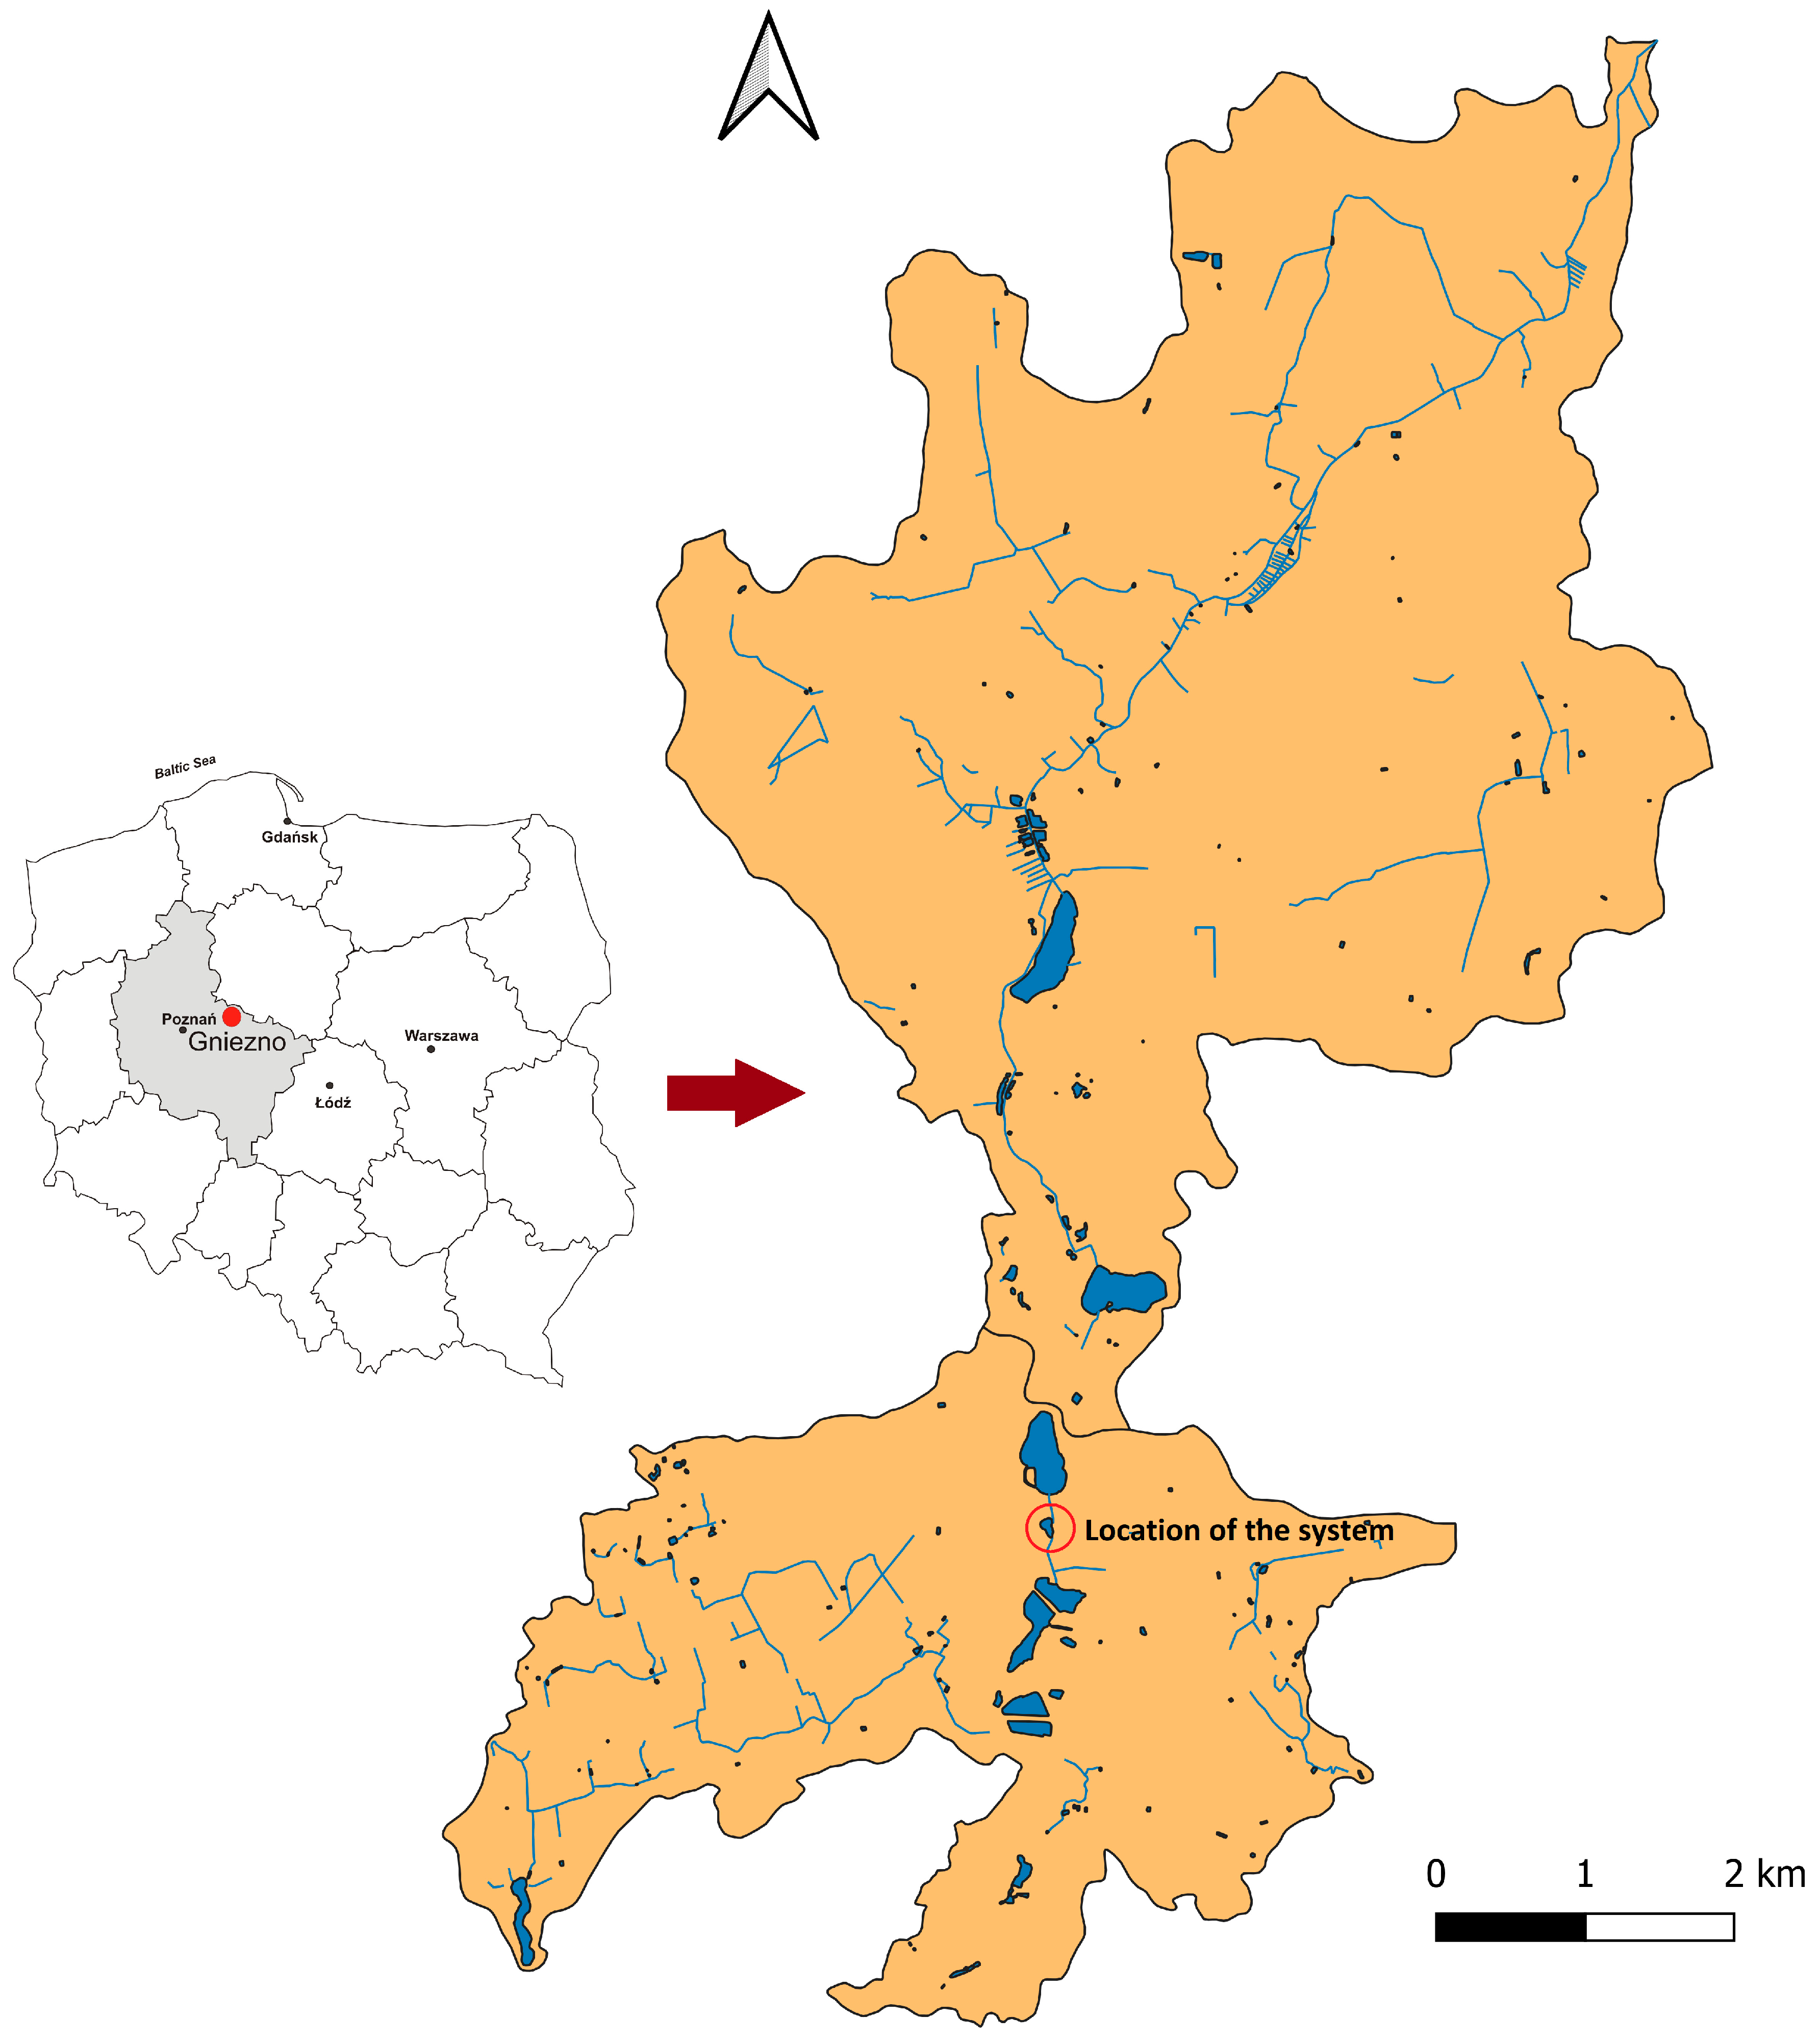
2.1. Study Area

The SED-BIO system, whose aim is to reduce the inflow of pollutants carried by river water, is located on the Struga Gnieźnieńska river, which is a tributary of Jelonek Lake (Figure 1, Figure 2 and Figure 3). The lake is located in the area of the city of Gniezno, in the Greater Poland Voivodeship, in the Greater Poland Lake District. It has a surface area of approx. 14 ha and a capacity of approx. 170,000 m3. It is a shallow flow-through lake of an average depth of 1.2 m and a maximum depth of 2.4 m. In the south part, water is supplied to the lake by the Struga Gnieźnieńska. The lake is prone to excessive eutrophication [32].
According to the classification of watersheds [33], the Struga Gnieźnieńska is an approximately 18.1 km long fourth-order water course, whose catchment is situated in the Greater Poland region (Figure 1).
The source of the river is located in an agricultural area. For the first 8 km, the water course flows through areas of agricultural production and, partly, through a less-urbanized area of the city of Gniezno. Then it flows into Jelonek Lake. The river is partly channelized and constitutes an element of the Wastewater Treatment Facility. Potential sources of pollutants that are discharged to the Struga Gnieźnieńska on the section from the source to the mouth into Jelonek Lake include, among others [34]:
  • discharge of municipal and rainwater wastewater,
  • family allotment gardens,
  • the system of sedimentation ponds of a former sugar refinery,
  • stormwater discharge system—outflow from impermeable surfaces,
  • general sewage system,
  • waste disposed in the area of the sedimentation ponds in the catchment: mainly organic waste from gardens (grass sward, weeds, branches and others) and household waste (cans, bottles, plastic waste, old furniture),
  • the activity of two former tanneries,
  • and the emergency stormwater discharge system of the sports stadium.
The lake condition is influenced by the combined sewage system (stormwater discharge system and general sewage system) in approx. 80%.

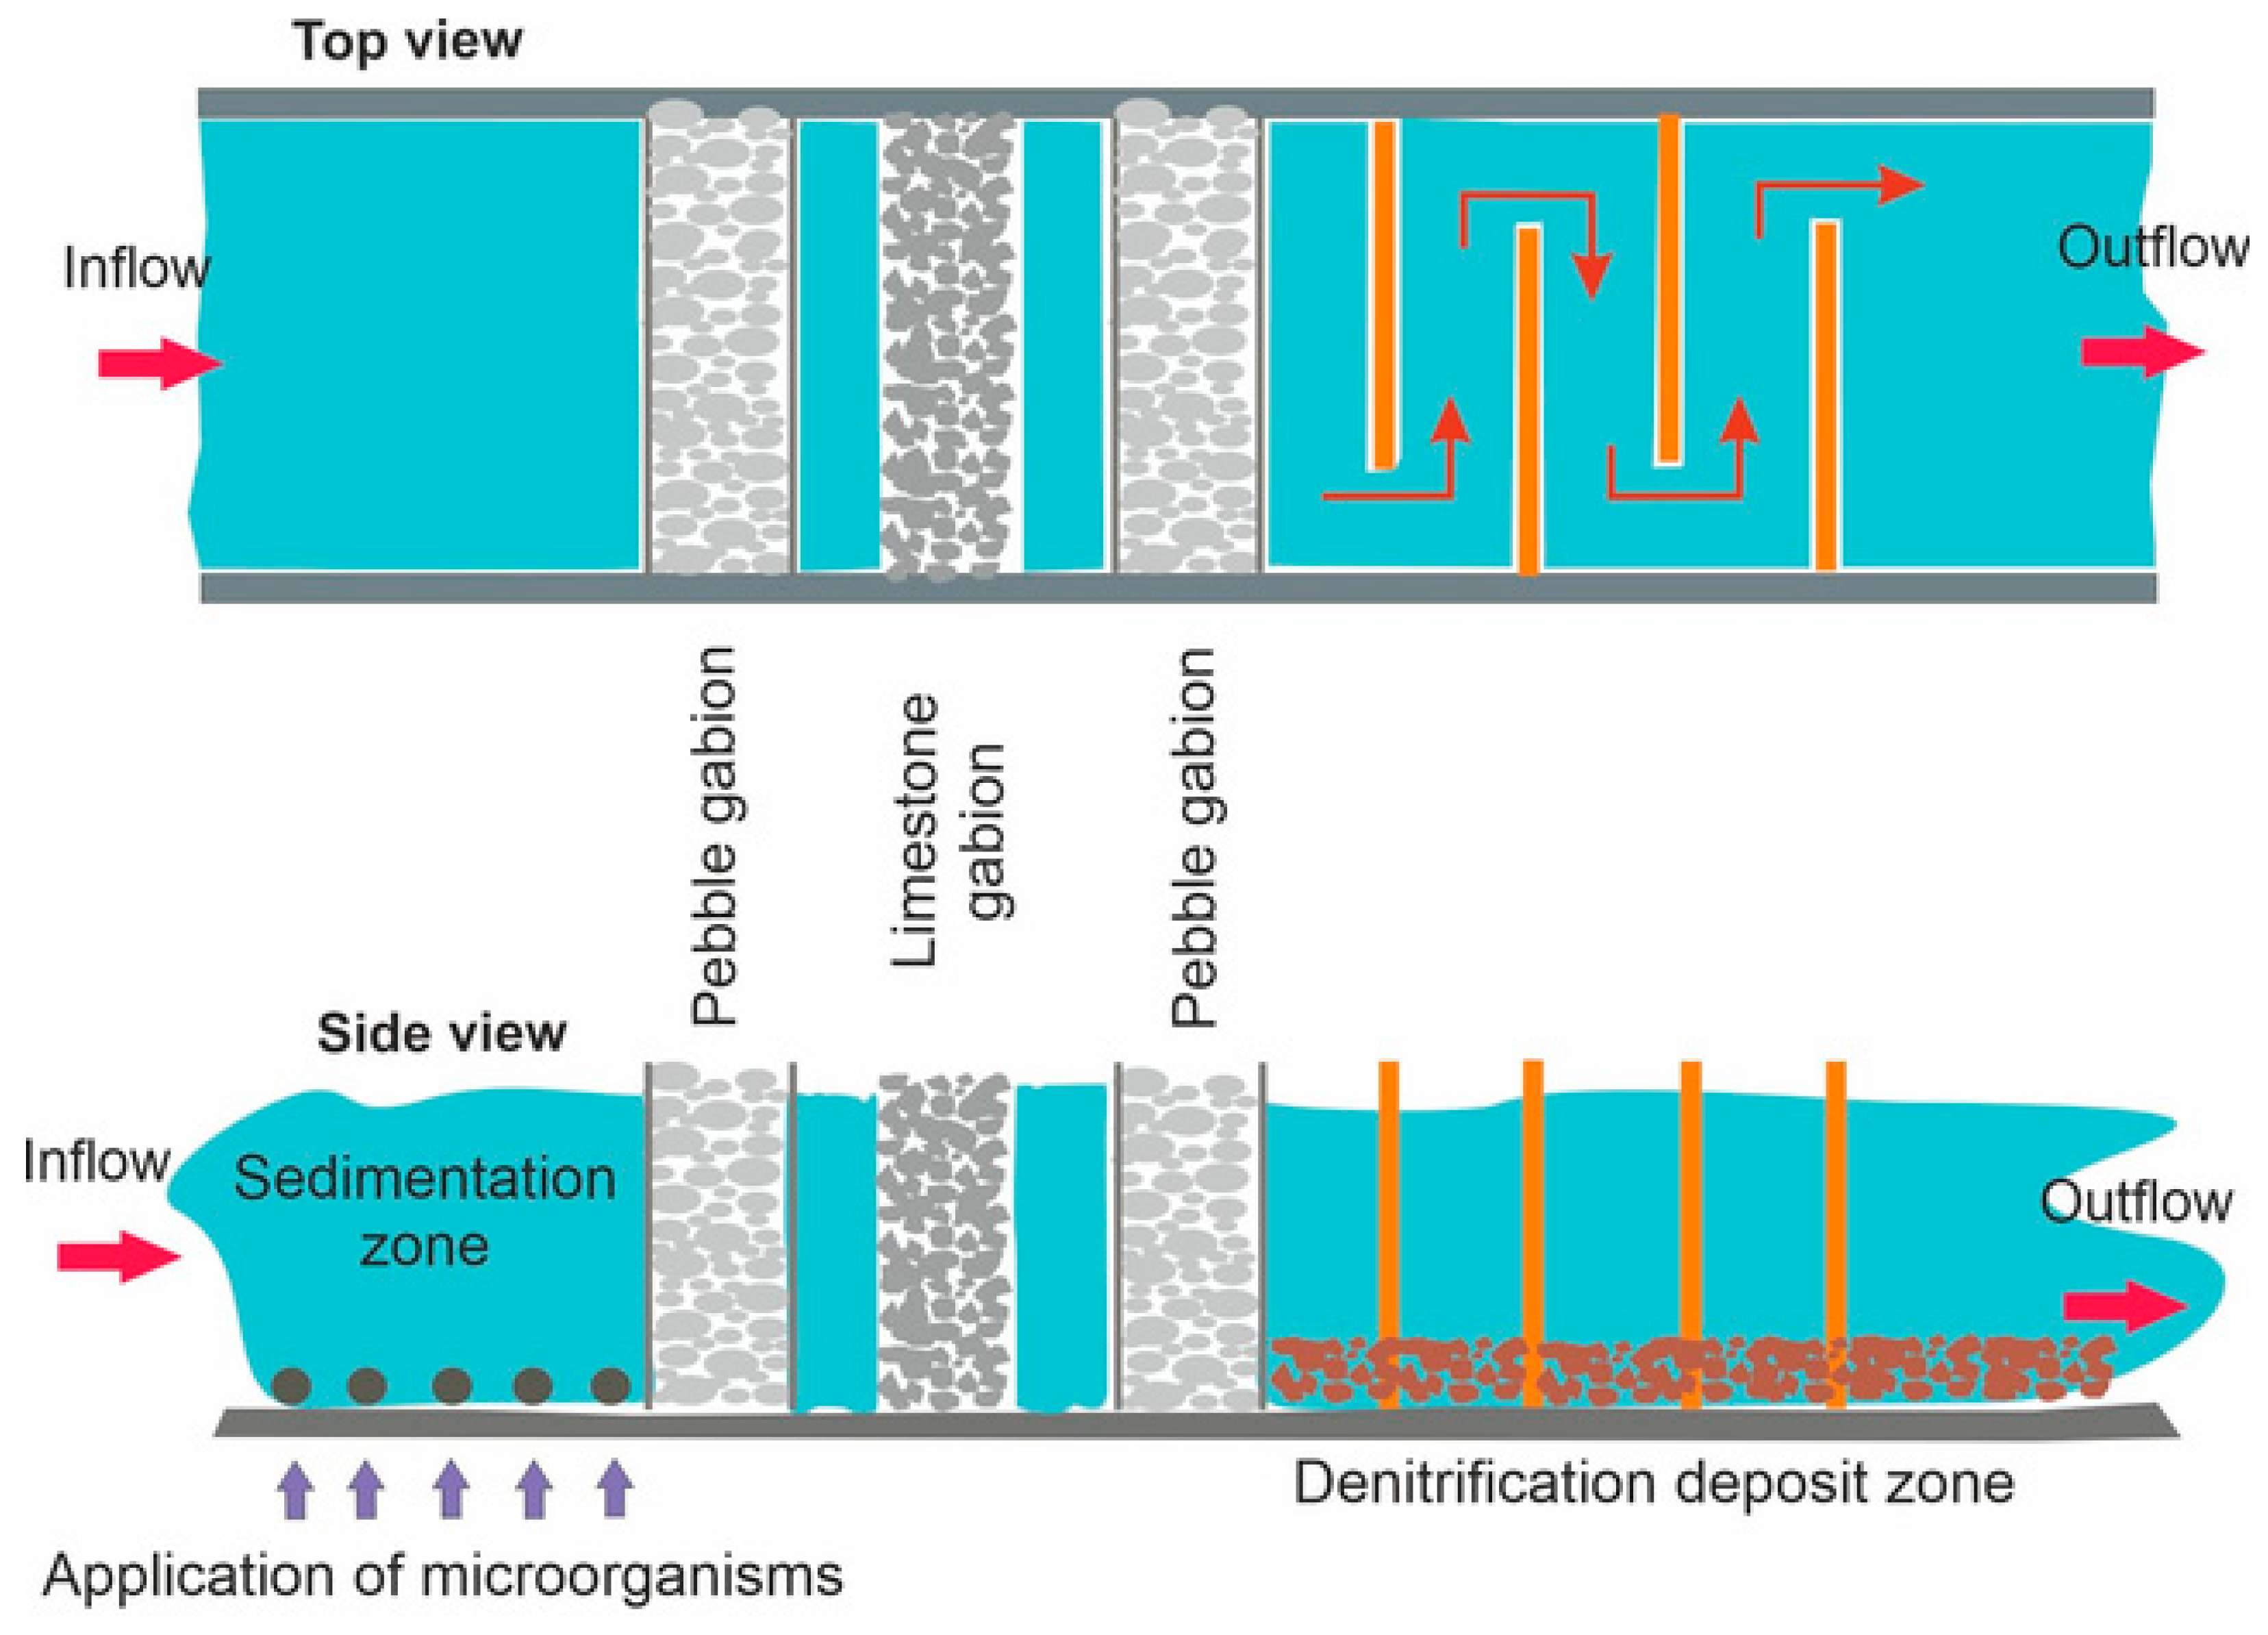
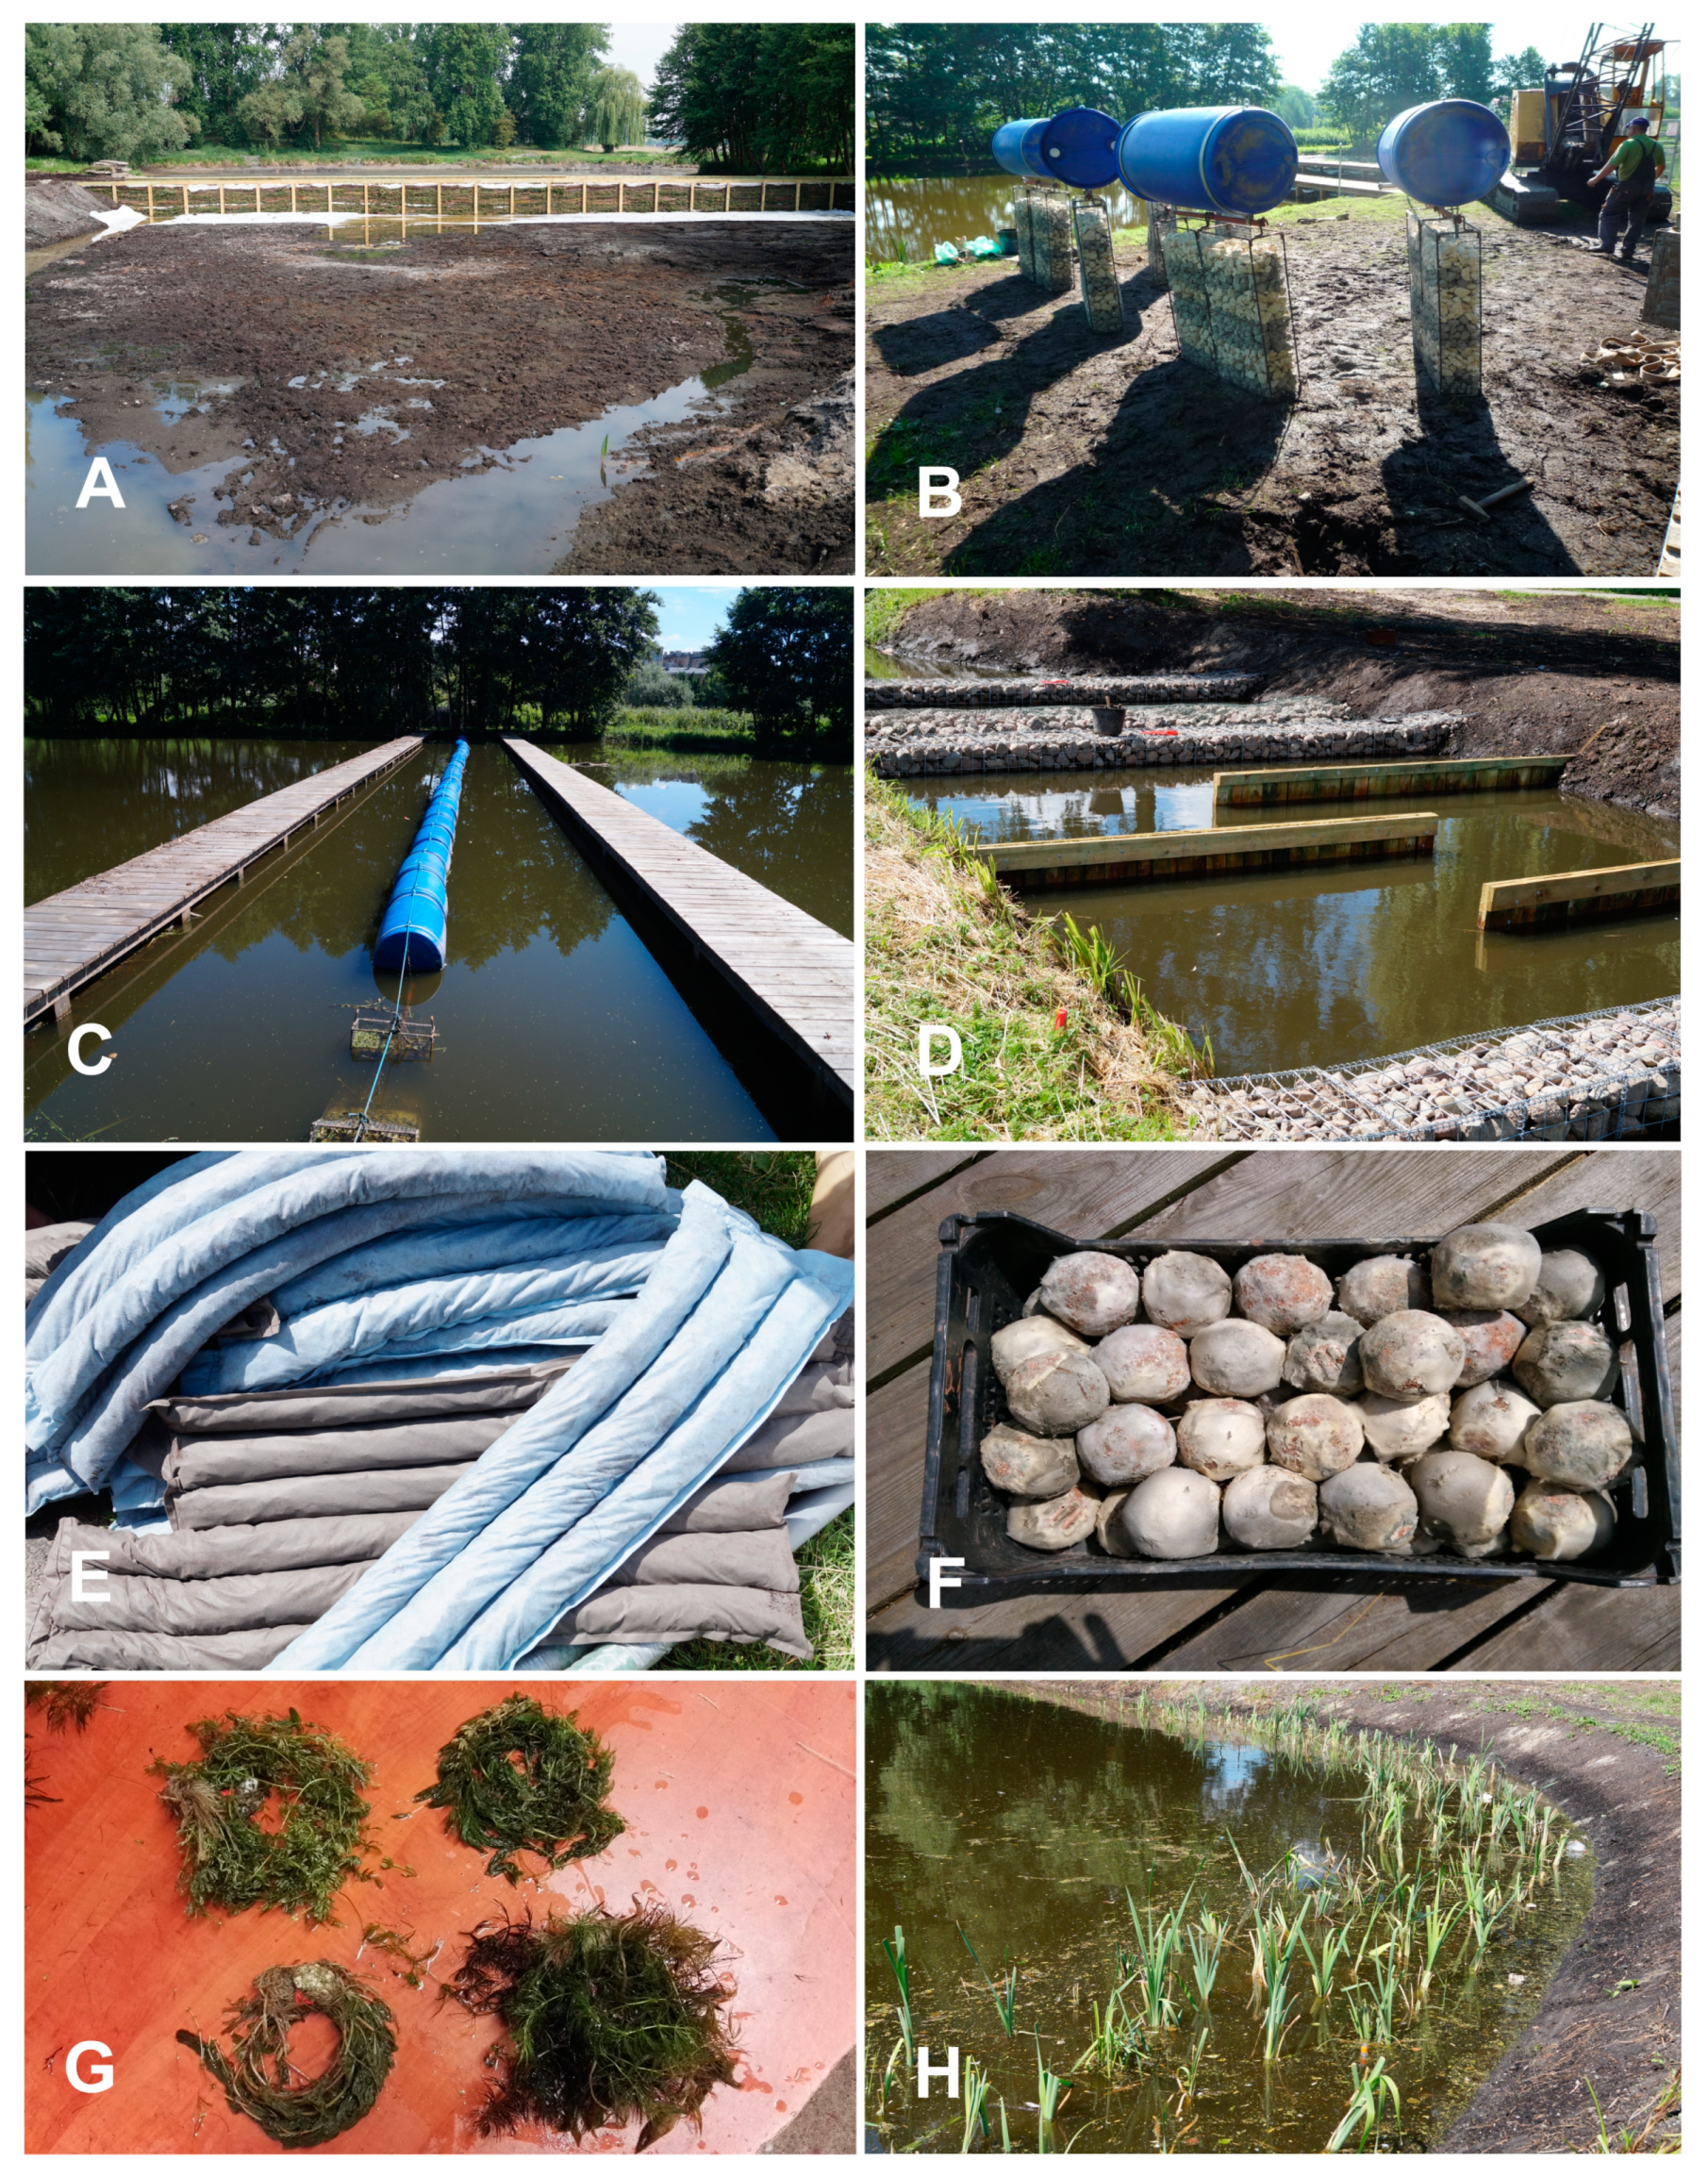
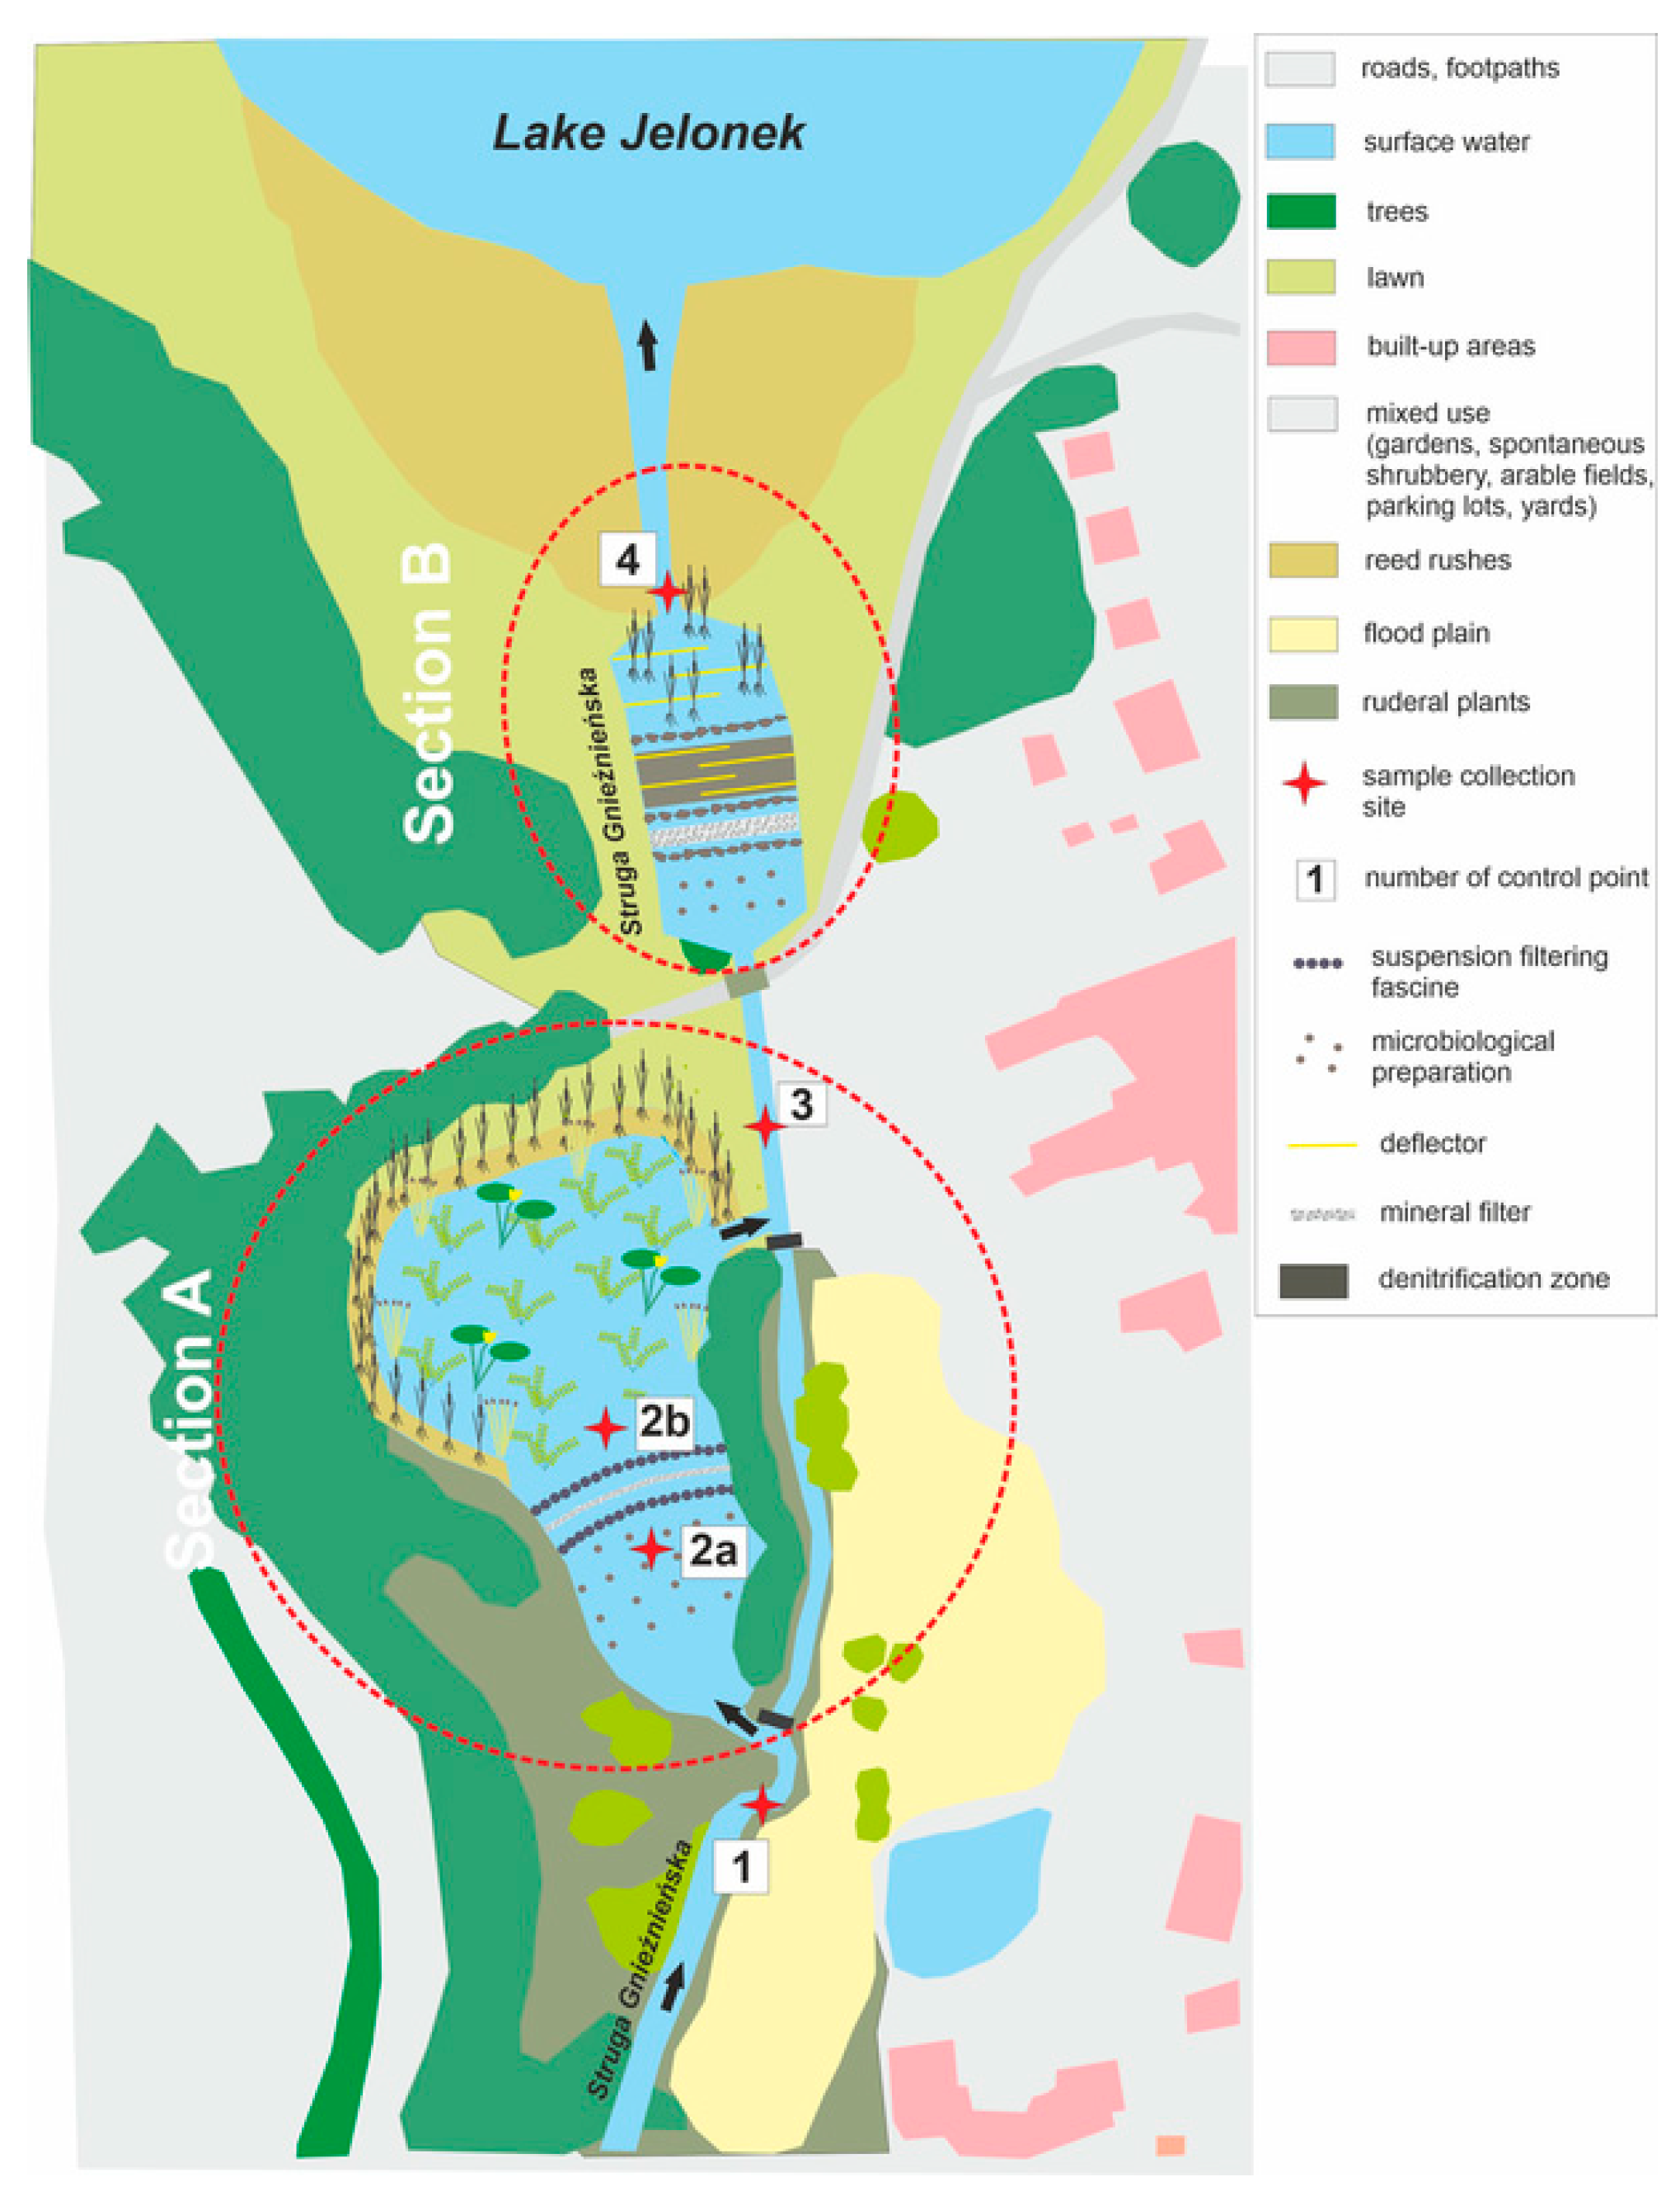
2.2. Innovative, Two-Zone Sedimentation and Biofiltration System (SED-BIO)

The SED-BIO system is an innovative solution developed by the authors, created for the purpose of the reclamation of surface waters. It consists of section A (the pond section) and section B (the river section) (Figure 2 and Figure 3). The main part of the system is located on a pond with a surface area of 0.7 ha, through which the Struga Gnieźnieńska flows (section A). Section A is divided into three segments (Figure 4):
1. Sedimentation and biological activity segment—approx. 1/3 of the pond surface. In this zone, mineral and organic suspensions are captured. The main task of this section is to accelerate the process of the mineralization of sediments by applying a composition of microorganisms in the form of a specially prepared solid preparation (Micro-Dictum), which gradually releases the microorganisms into the aquatic environment.
The Micro-Dictum preparation consists of ceramic clay (sterile), beet molasses, wheat bran, water in appropriate proportions, and microbial mother cultures. The mixed materials are glued into balls and fermented for about 5 days at 20 °C. The formed balls are fermented and dried. The average weight of the raw ball was: 300 g and after drying—180 g.
The Micro-Dictum preparation is harmless to aquatic organisms and components of the aquatic environment. The carrier consists of natural, biodegradable elements. The set of microorganisms are native organisms that take part in natural biological processes (i.e., lactic acid bacteria (LAB), aerobic microorganisms and the number of fungi, including yeast, and Bacillus licheniformis: Patent No 229843). They are not GMO organisms.
2. Filtration segment—the sedimentation zone which is separated from the next segment of the system by two parallel filtrating gabions (1.5 m high and 1 m wide), placed perpendicularly to the direction of flow. The gabions were constructed from bundles of wicker branches. The wicker bundles were about 1.5 m long and consisted of several dozen so-called wicker bars (one-year increments). The bundles were cross arranged so as to slow down the flow but allow water to be filtered at the same time. They were placed in special scaffolding, which ensured the stability of the structure. Wicker was chosen because it has a neutral influence on water and does not cause any changes in its quality [35]. Layers of fieldstone were placed on each layer of wicker bundles in order to stabilize the whole structure. The fieldstones used in the construction of the gabions are Småland granites, Swekofene granites, and Baltic porphyries with a smooth surface, a round or oval shape, with a diameter of approx. 15–20 cm. The bottom of the pond under the gabions was also stabilized with use of geotextile and geomesh. Between the gabions, there is a 3 m wide zone where the flow is slowed down. A mineral filter (a mixture of calcareous rock and pieces of air-cooled blast furnace slag) was installed there. The gabions filter the water by removing suspension, woody debris, and macrophytes or their parts. They also create an environment that facilitates the formation of biofilm through useful microorganisms and provides a habitat for saprotrophs. The presence of gabions is necessary for the proper functioning of the mineral filter and to avoid clogging. It also increases the transparency in the macrophyte biofilter segment, which is particularly important for the growth of submerged flora.
Between the gabions, perpendicular to the direction of flow and along the whole length of the gabions, a mineral filter was installed. It is based on a substrate that consists of two components that cause the adsorption and absorption of phosphates. One of the elements of the substrate is calcareous rock aggregate o the grain size 30–70 mm. The content of CaO in the calcareous rock is not lower than 35%. The second element of the substrate consists of pieces of air-cooled blast furnace slag. Thanks to its porous structure, it has a very large sorption surface. The slag meets the standards for radiation activity and the content of heavy metals and other specific substances that pose a threat for aquatic ecosystems. The content of CaO in the air-cooled blast furnace slag is not lower than 40%. The fraction diameter ranges from 30–60 mm. Both aggregates were mixed in the substrate at the proportion of 1:1. They were placed in baskets in layers of 20–25 cm. The substrate was placed in special mesh baskets of the dimensions 1 m × 1 m × 0.3 m, suspended on floats that kept the filters in a vertical position, one next to the other. The mesh density matched the granulation of the substrate. The filters were replaced once a year.
3. The plant biofilter segment—this zone included vegetation from the littoral and sublittoral zone as well as submerged flora. In order to improve the efficiency, the authors selected plants with a high affinity for phosphorus, which are not alien or difficult to remove in the event of excessive growth and creating biomass.
A.
Littoral zone. In this zone, a coastal shelf with a width of approx. 1 m was created and the following plants were planted:
  • Typha latifolia—50% share
  • Glyceria maxima—50% share
The plants were planted in intermittent stripes: a 10-m wide stripe of Typha latifolia followed by a 10-m wide stripe of Glyceria maxima.
B.
Sublittoral zone (immediately after the coastal shelf)
  • Schoenoplectus lacustris
C.
Pelagic (deep water) zone
  • Ceratophyllum demersum
  • Myriophyllum sp.
The purpose of this segment was to uptake the excessive nutrients. The biomass was removed from the aquatic ecosystem several times a year. The excess of nutrients that was noted in this segment might have resulted from the existing high loads brought into the system by the Struga Gnieźnieńska, but also from the intensive mineralization of organic substances.
Additionally, due to high concentrations of nitrogen in the waters of the Struga Gnieźnieńska, denitrification deposits were placed in the plant biofilter segment at the bottom of the pond. They had the form of specially prepared mattresses made from biodegradable geotextile, filled with fine-grained lignite. Their aim was to optimize the denitrification process by means of supplying additional carbon substrate for the growth of bacteria that participates in the nitrogen transformation process.
Due to the high density of pollution sources and the load of pollutants in the water course, section B was also constructed on the widened section of the Struga Gnieźnieńska, directly before the inflow to the lake (Figure 5).
Section B was constructed on the water course flowing out of the pond, approximately 50 m away from section A. The section is 20 m long, and the water course was widened to reach the width of 8 m (Figure 4). Section B also consists of 3 zones:
  • Sedimentation segment, where the microbiological preparation Micro-Dictum was also applied.
  • Filtration segment—consisting of two stone gabions 0.8 m high, 0.3 m deep and 8.0 m wide, filled with pebbles. The space between the gabions was 3 m wide. In this zone, a gabion filled with limestone of similar parameters and functions as the one in section A was placed. The gabion was 0.8 m high, 0.4 m deep and 8.0 m wide.
  • Denitrification and slow flow segment. The purpose of this zone was to slow down the water current with use of artificial deflectors in case of high water and by placing a loose denitrification deposit containing lignite in the zone.
The system is currently subject to patent procedure (application No. P.422056).

2.3. Field and Laboratory Tests

The analyses were conducted in the years 2016–2019. The special microbiological preparation (Micro-Dictum) was applied in the analyzed period. The preparation was applied, on average, once a month, from May to October, in the amount of 80 balls in the sedimentation zone in section A and 20 balls in the sedimentation zone in section B.

2.3.1. Physical and Chemical Analyses of Water

Water samples for analyses were collected in 4 points (1, 2b, 3, and 4) once a month throughout the year. The analyses were conducted for discharge years: April 2016–March 2017; April 2017–March 2018; and April 2018–March 2019 (Figure 5). Temperature, pH, dissolved oxygen (DO), and conductivity (SPC) were measured in situ with the use of the YSI Professional Plus handheld multiparameter meter. Water samples collected in field were transported with an icepack in 5 ± 2 °C.
Ammonium, nitrate, and phosphate ions were analyzed using a Dionex® ion chromatograph with a cation column (CG18, IonPac CS18, CSRS-ULTRA II) (Dionex Thermo Fisher Scientific, 168 Third Avenue Waltham, MA 02451 USA) and an anion column (AG22, IonPac AS22, ASRS e ULTRA II). The systems were operated in isocratic elution at 30 °C at a flow rate of 1 mL/min. For ion identification, combined standards were used (Dionex Thermo Fisher Scientific, 168 Third Avenue Waltham, MA 02451 USA). Samples of water were passed through Whatman GF/C 0.45 μm filters and analyzed with the Ion Chromatography System (DIONEX, ICS 1000) to determine the concentrations of soluble nutrients: phosphates (PO43−), nitrates, (NO3), and ammonium ions (NH4+) [36].

2.3.2. Phytoplankton and Toxic Cyanobacteria Assessment

Samples for the following studies on the quantity of phytoplankton and the occurrence of toxigenic cyanobacteria and their toxins (microcystins) were collected from three locations: the river (1), the pond from the biofiltration segment (2b)—part A, and behind the whole SED-BIO system (4) (Figure 5). Samples were taken on the following dates during the vegetation period for phytoplankton: 21.07, 3.08, 23.08, 6.09, 26.09, 17.10, and 7.11 in 2016, after the construction of the SED-BIO system.

Phytoplankton Analysis

The concentration of chlorophyll A (μg·L−1) was measured immediately after sampling in a 1-L integrated water sample using a bbe Algae Online Analyser (AOA, Version 1.5 E1, bbe-Moldaenke company, Kiel, Germany). This analyzer takes measurements based on the determination of the fluorescence spectrum and kinetics of the algae. The determined chlorophyll A represents the sum of the values for green algae, cyanobacteria, cryptophytes, and diatoms and was used as the indicator of total phytoplankton availability.

Genetic Analyses of Cyanobacteria

The samples of water for DNA assays (always 100 mL of water was collected) were prepared according to Mankiewicz-Boczek et al. [37]. Extracted DNA was used as the template for the qualitative (PCR) determination of: 16S rRNA (258 bp) gene fragment for cyanobacteria with 16S F (CGGACGGGTGAGTAACGCGTG)/16S R (CCCATTGCGGAAAATTCCCC) primers [38], and mcyE (405 bp) gene fragment specific for their toxigenic genotypes with mcyE-R1 (ATAGGATGTTTAGAGAGAATTTTTTCCC)/mcyE-S1 (GGGACGAAAAGATAATCAAGTTAAGG) primers [39].

Toxicity of Cyanotoxins—Microcystins

The protein phosphatase inhibition assay was performed using screening immuno-bioassay MicroCystest (ZEU-Inmunotec, Zaragoza, Spain) to assess the biological activity of microcystins (MCs), i.e., their toxicity. MicroCystest is based on the inhibition of PP2A (rabbit skeletal muscle) activity by MCs, the mechanism of action used by these toxins in hepatocytes (PP2A is able to hydrolyze a specific substrate that can be detected at 405 nm). Samples containing MCs inhibit the enzyme activity proportionally to the amount of toxin contained in the sample. The test is able to detect all toxic MCs present in the sample. The assessments of MCs real biological activity were performed according to the manufacturer’s instruction manual [40].
The study did not analyze other types of cyanotoxins such as neurotoxins, it focused on microcystins (hepatotoxins), as they are most common in Poland and worldwide [41]. Therefore, their concentration and toxicity were assessed as part of the conducted water quality monitoring.

2.3.3. Microbiological Assessment

The sanitary condition of water was assessed based on microbial tests that were carried out for water samples collected from April to November 2016 at four stations of the installed sedimentation-biofiltration system marked with the following numbers: 1 (river—inflow to the system), 2a (pond—sedimentation area), 3 (river between section A and section B), and 4 (outflow from the SED-BIO to Jelonek Lake). Water samples were collected in sterile 400 mL glass bottles, transported to the laboratory in the cold, stored at 4 °C, and processed within 24 h. The detection of indicator bacteria, i.e., coliforms and E. coli, was carried out using the DST Colilert 18 (PN-EN ISO 9308-2) tests in the Quantitray 2000 system in accordance with the manufacturer’s procedure [42,43]. The Colilert 18 tests were incubated at 36.5 °C and the Most Probable Number (MPN) of bacterial cells in 100 mL of water was determined using the tables provided by the manufacturer. The E. coli ATCC 25922 strain was used as a positive control, and a negative control was the P. aeruginosa ATCC 49189 strain.

2.3.4. Determination of the Mean Annual Flow in the Struga Gnieźnieńska before Jelonek Lake

The mean annual flow into the Struga Gnieźnieńska before Jelonek Lake was determined with the use of two calculation methods. The first of them was based on the rational formula with runoff coefficient according to Byczkowski [44,45]. It was assumed that for the catchment of the Struga Gnieźnieńska this coefficient equals 0.25 [46]. Apart from that, the authors used the Atlas of Hydrographic Division of Poland and the QGIS 3.4 Madeira software to determine the surface area of the catchment to the cross-section situated before the SED-BIO system, which was 10.9 km2 (Figure 1). Rational formula with runoff coefficient according to Byczkowski:
SQ = 0.0317 × Cs × A × P [m3·s−1]
where:
  • Cs—runoff coefficient according to Byczkowski,
  • A—catchment area [km2],
  • P—mean annual precipitation [m],
SQ = 0.0317 × 0.25 × 10.9 × 0.507 = 0.0438 [m3·s−1]
The second method was used to calculate the mean specific runoff in the catchment area based on the isoline map. The value 3.0 dm3·s−1·km−2 was used in the calculations [47]. The averaged value obtained with the use of both calculation methods was adopted as the final result. Flow was calculated based on the isoline map of mean specific runoff in the area of Poland:
SQ = SSq × A × 0.001 [m3·s−1]
where:
  • SSq—mean specific runoff [dm3·s−1·km−2],
  • A—catchment area [km2],
SQ = 3.0 × 10.9 × 0.001 = 0.0327 [m3·s−1]
The results obtained with the use of both methods used to calculate the mean annual flow in the Struga Gnieźnieńska on the inflow to Jelonek Lake were similar, so the final result was considered to be the average from both calculation methods, which was 0.038 m3·s−1.
The mean annual precipitation in the years 1951–2016 for the measurement station located in Gniezno was 507 mm [48]. In the analyzed years, the average annual precipitation was: in 2016—617.4 mm, in 2017—758.0 mm, and in 2018—408.8 mm.

2.3.5. Statistical Analysis

The significance of differences between the input and output loads of the SED-BIO system were verified with the use of the Wilcoxon signed-rank test. The significance of differences in the physical and chemical parameters (temperature, pH, DO, SPC, ammonium-nitrogen, nitric nitrogen, and phosphates) between the sites for the whole analyzed period and for loads flowing in and out of the SED-BIO system for the whole analyzed period and for specific years was verified with the use of the Wilcoxon signed-rank test. The analyses were performed with use of the Statistica StatSoft Inc., ver. 12.

3. Results and Discussion

3.1. Analysis of the Physical and Chemical Parameters and Calculation of the Load of Nutrients Captured by the SED-BIO System

Based on the calculated flow rate and the concentrations of nutrients recorded in the discharge years, the load of elements captured by the SED-BIO system was calculated. Table 1 contains the characteristics of the physical parameters, and Table 2 presents the concentrations of nutrients on the inflow (control point 1), on control points 2 and 3, and on the outflow from the system (control point 4) in the analyzed periods (Figure 5). Table 3 contains the calculated average loads of nutrients that were supplied with the waters of the Struga Gnieźnieńska and captured as a result of the processes activated by the SED-BIO system during the year.
The conducted analyses demonstrate that the temperature conditions on specific control points of the SED-BIO system were stable (the differences were statistically insignificant) (Table 1), which results from the fact that the physical conditions, such as depth or solar irradiation, were similar.
The obtained results reveal a statistically significant difference in the pH between control points 1 (8.00) and 2b (7.92) and control points 3 and 4 (7.88 and 7.83, respectively). The pH values on sites 3 and 4 were also significantly different. Based on that average and the min-max value, the values of pH were more stabilized in each of the following control points in SED-BIO. These pH values might increase the efficiency of the removal of nitrates through the denitrification process and of the removal of phosphates through the absorption by calcium deposit, as both processes occur most effectively in pH 7–8 [49,50]. This proves that this parameter was influenced by the mineral filters absorbing PO43− installed in the SED-BIO system and by the assimilation of nutrients by plants and the use of CO2 in the process of photosynthesis.
The conducted research also revealed that the concentration of oxygen dissolved in water was significantly lower on control points 3 and 4 than on control points 1 and 2b (Table 1). Such changes in the oxygenation conditions are characteristic for a reduced flow rate. The first part of the SED-BIO system depended on the variable flow rate in the river flowing into the system and on the increased influence of phytoplankton (photosynthesis). The second part of the system (control points 3–4) was characterized by more stable flow conditions and a lower potential for water oxygenation that is connected to turbulent flow and limited gas exchange with the air.
The highest electric conductivity was noted in water supplied to the SED-BIO system from the catchment on control point 1 (1010 μS·cm−1). This value was significantly higher than those noted on the other control points—960 μS·cm−1 for 2a and 4, and 970 μS·cm−1 for 3 (there were no significant differences between those 3 points). This might be a result of the purification processes that occur in the SED-BIO including: sedimentation of suspension, PO43− sorption, denitrification and assimilation by plants, as well as other processes that reduce the amount of pollutants, but there is a need to analyze more pollutants, such as acids, bases, salts, and dissolved carbon dioxide.
The obtained results revealed a statistically significant difference in the concentrations of N-NO3 with a decreasing trend from control point 1 (3.3 mg·L−1) to 4 (1.24 mg·L−1) (Table 2). The concentrations of N-NO3 decreased significantly on each consecutive control point in the SED-BIO system. This demonstrates that the activated denitrification processes and other processes of NO3 assimilation and transformation of nitrogen compounds in the two zones of the SED-BIO system contributed to a 37.6% reduction in the NO3 concentration.
The results of the conducted analyses revealed that the level of N-NH4+ ranged from 0.44 mg·L−1 on control point 1 to 0.42 mg·L−1 on control point 4 (the difference was statistically insignificant) throughout the SED-BIO system (Table 2). This may be caused by the nitrification and NH4+ assimilation processes in the system (decreased concentration) and simultaneous ammonification of organic matter (increased concentration). If it becomes necessary to increase the reduction in N-NH4+ more methods that improve the nitrification and assimilation of NH4+ should be introduced to the system.
The obtained results revealed statistically significant differences in the concentration of PO43− between control point 1 (0.7 mg·L−1) and control points 2–4 (0.52–0.55 mg·L−1) (Table 2). This proves the high efficiency of the processes that are activated in the first part of the SED-BIO system, including: suspension sedimentation, bonding PO43−, and assimilation by plants.
Similar trends of change were observed in the rehabilitated urban pond due to testing a combination of conventional restoration of urban recreational reservoirs (bottom sediment removal and biomanipulation) and comprehensive ecohydrological restoration methods (hybrid systems, sequential sedimentation-biofiltration systems (SSBS), floating islands, landform-adjusted shoreline vegetation and plant harvesting) [51,52].
Throughout the analyzed period, a 19.3% reduction in the load of phosphates was observed (a statistically significant result) (Table 3). In the specific analyzed discharge years the reduction in the load ranged from 6.1% in the second year of the project to 38.8% in the first year. A statistically significant difference corresponding to an 18.4% reduction in the phosphate load was noted only in the 2017/18 discharge year.
As far as nitrate nitrogen was concerned, the reduction of load in the whole SED-BIO system was 63.7% for the whole analyzed period, and for the individual discharge years it fell into the range of 53.1–69.5%. All of these reduction values were statistically significant (Table 3).
The reduction in the load of ammonium-nitrogen in the whole analyzed period was 14.9% (Table 3). It was the highest in the first year of the study, i.e., 2016/17 when it reached 23.6%, and in the subsequent years it decreased to 13.8% in 2017/18 and to 4.5% in 2018/19. The changes in the load of ammonium-nitrogen flowing in and out of the SED-BIO system were not statistically significant.
Urban stormwater runoff contributes to the degradation of aquatic ecosystems and their intensified eutrophication, which usually results in toxic cyanobacterial blooms [53]. According to Szklarek et al. [54], the sequential sedimentation-biofiltration system (SSBS) significantly reduced NO3 by 44.8% in the first two years of its operation. These authors also noted a reduction in the loads of NH4+ and PO43− (30.4% and 2.8%, respectively), but the results were not significant. Another similar system—a hybrid system which combines the biological/ecohydrological SSBS system with a functionally integrated engineered system (underground separators) [52]—noted a 52.6% reduction for NH4+, 58.1% for NO3, and 40.7% for PO43−.
The hybrid system is an example of a nature-based solution measure that has a huge potential to reduce the negative effects of nutrient transfer, which has been confirmed by similar solutions that were also applied for the improvement of nutrient removal in municipal wastewater [55] but also to decrease freshwater eutrophication and flooding in urbanized areas, as part of the blue-green infrastructure.
The average supply of the analyzed nutrients to the systems in the annual load, calculated to take into account the surface area of the catchment to the cross-section of the Struga Gnieźnieńska, before flowing into the SED-BIO system, amounted to 0.60 kg PO4·ha−1, 3.12 kg N-NO3·ha−1, and 0.33 kg N-NH4·ha−1. On the outflow from the system, the average annual load was: 0.49 kg PO4·ha−1, 1.13 kg N-NO3·ha−1, and 0.28 kg N-NH4·ha−1. On the other hand, nitrogen loads calculated by Pulikowski et al. [56] for two micro-catchments—in the foothills (a drainage network) and lowlands (a drainage ditch) located in Lower Silesia, demonstrated significantly higher loads. They amounted to 75.5 kg N·ha−1 for the foothill catchment, and 12.7 kg N·ha−1 for the lowland river. The differences in the values obtained in the study resulted first of all from terrain inclination and precipitation amount, but they were also caused by soil drainage systems that accelerated the discharge of water and thus also of nitrogen compounds.
The loads of nutrients calculated by Sojka et al. [57] for the agricultural catchment of Mała Wełna, demonstrated an outflow of nitrogen of 0.22 kg N-NH4⋅ha−1, 0.08 N-NO3 kg⋅ha−1 during a 1-year period. For phosphates, the outflow was 0.20 kg PO4⋅ha−1. As one may notice, these values are lower than those obtained in the study for the cross-section of the analyzed catchment (inflow to the system). This confirms the fact that the catchment of the Struga Gnieźnieńska, apart from agricultural sources of pollution, is also under pressure exerted by other factors.
The observations made during this study indicate that system performance depends on maintenance works on and around the system that must be performed regularly. They should be included in the recommendations and good practices. In order to maintain the proper functioning of the system, necessary repairs, supplements, and the replacement of used biofilter elements were performed periodically. Maintenance works included such activities as:
  • clearing the inflow of Struga Gnieźnieńska into the pond and the outflow from the pond to the watercourse, in the event of its potential siltation or blockage by plant material, wood debris, or rubbish
  • cleaning filter fascines in the event of their siltation or blockage by wood rubble or rubbish
  • cleaning mesh-stone gabions and repairing the damaged filtering fascines and mesh-stone gabions along with the necessary replenishment of cavities with appropriate construction and building materials,
  • removing excess vegetation in plant biofilters in the event of their excessive growth: all above-ground mass should be removed from the system area.
  • removal of spontaneous herbaceous, shrub and woody vegetation appearing in sections A and B and in the coastal zone and removal of biomass outside the investment area,
  • removing the excess of herbaceous, shrub and woody vegetation appearing in the Struga Gnieźnieńska watercourse in the section between sections A and B and transporting the biomass outside the investment area,
  • periodic replacement of filters that absorb phosphorus and stimulate nitrification and denitrification processes (section A and B)—once every discharge year.
  • periodic application of the biopreparation system based on a special composition of microorganisms that decompose the organic substances in water to the sedimentation segments of sections A and B—once every month in every discharge year.
In 2016, after the SED-BIO system had been installed, the selected points were monitored: 1—on the Struga Gnieźnieńska River, 2b—in the biofiltration segment on the pond, and 4—behind the system. The aim was to assess the dynamics of the presence of phytoplankton, including toxic cyanobacteria (Figure 5). The amount of phytoplankton determined based on chlorophyll A ranged from 1.86 µg·L−1 (1, 26 September 2016) to 246.88 µg·L−1 (2b, 3 August 2016). Values exceeding 100 µg·L−1 were noted in July and August in the biofiltration segment in the pond and behind the whole system (Table 4). However, when considering the whole monitoring period, the largest amount of phytoplankton was found in the biofiltration segment in the pond (2b). As far as cyanobacteria are concerned, their presence was confirmed in practically every sample (exception: 4, 17 October 2016) during the monitoring period (Table 4). Still, the genotypes of toxigenic cyanobacteria that are responsible for the production of hepatotoxins (microcystins) were found in only sixout of 21 analyzed samples (Table 4). The presence of toxigenic genotypes was confirmed mostly in the river (1) or in the biofiltration section in the pond (2b), or both. On the other hand, the microcystins (hepatotoxins) were detected only once, immediately after the system had been installed, on the 27 July 2016, in a concentration of 2.71 µg·L−1 (1) and 2.62 µg·L−1 (2b) (Table 4).
The analysis of the amount of phytoplankton and the presence of cyanobacteria, including toxigenic genotypes that are capable of synthesizing hepatotoxins (microcystins), [40] demonstrated that the installed SED-BIO system contributed to a reduction in the amount of phytoplankton and protected Jelonek Lake against the potential supply of toxic cyanobacteria from the Struga Gnieźnieńska river, or the pond, or both (Table 4). Higher amounts of phytoplankton were noted behind the system (point 4) only on two occasions, in August (23 August 2016) and September (6 September 2016). This was probably caused by its re-inflow from the lake as a result of temporary high-water levels. Although the presence of cyanobacteria was confirmed in all the monitored samples between July and November 2016, the number of samples containing toxigenic genotypes with a potential to produce microcystins was low and they were found mainly in the points on the Struga Gnieźnieńska (1) and the pond (2b) (Table 4). Moreover, the presence of harmful hepatotoxins (microcystins) was detected only in July, after the installation of the system, in the concentration of 3 µg·L−1, in samples collected from the river (1) and pond (2b) (Table 4). The detected concentrations of microcystins did not pose a serious threat for recreational waters, as the threshold is set at 24 µg·L−1 according to the WHO guidelines [58].The results presented above suggest that the SED-BIO system eliminates the risk of toxic cyanobacteria that may appear both in the river (1) and in the biofiltration segment in the pond (2b), which may provide an additional water supply to Jelonek Lake. On the other hand, due to the fact that the pond contains stagnated water, it should be subject to regular monitoring in order to prevent the emergence of an additional pool of toxic cyanobacteria.

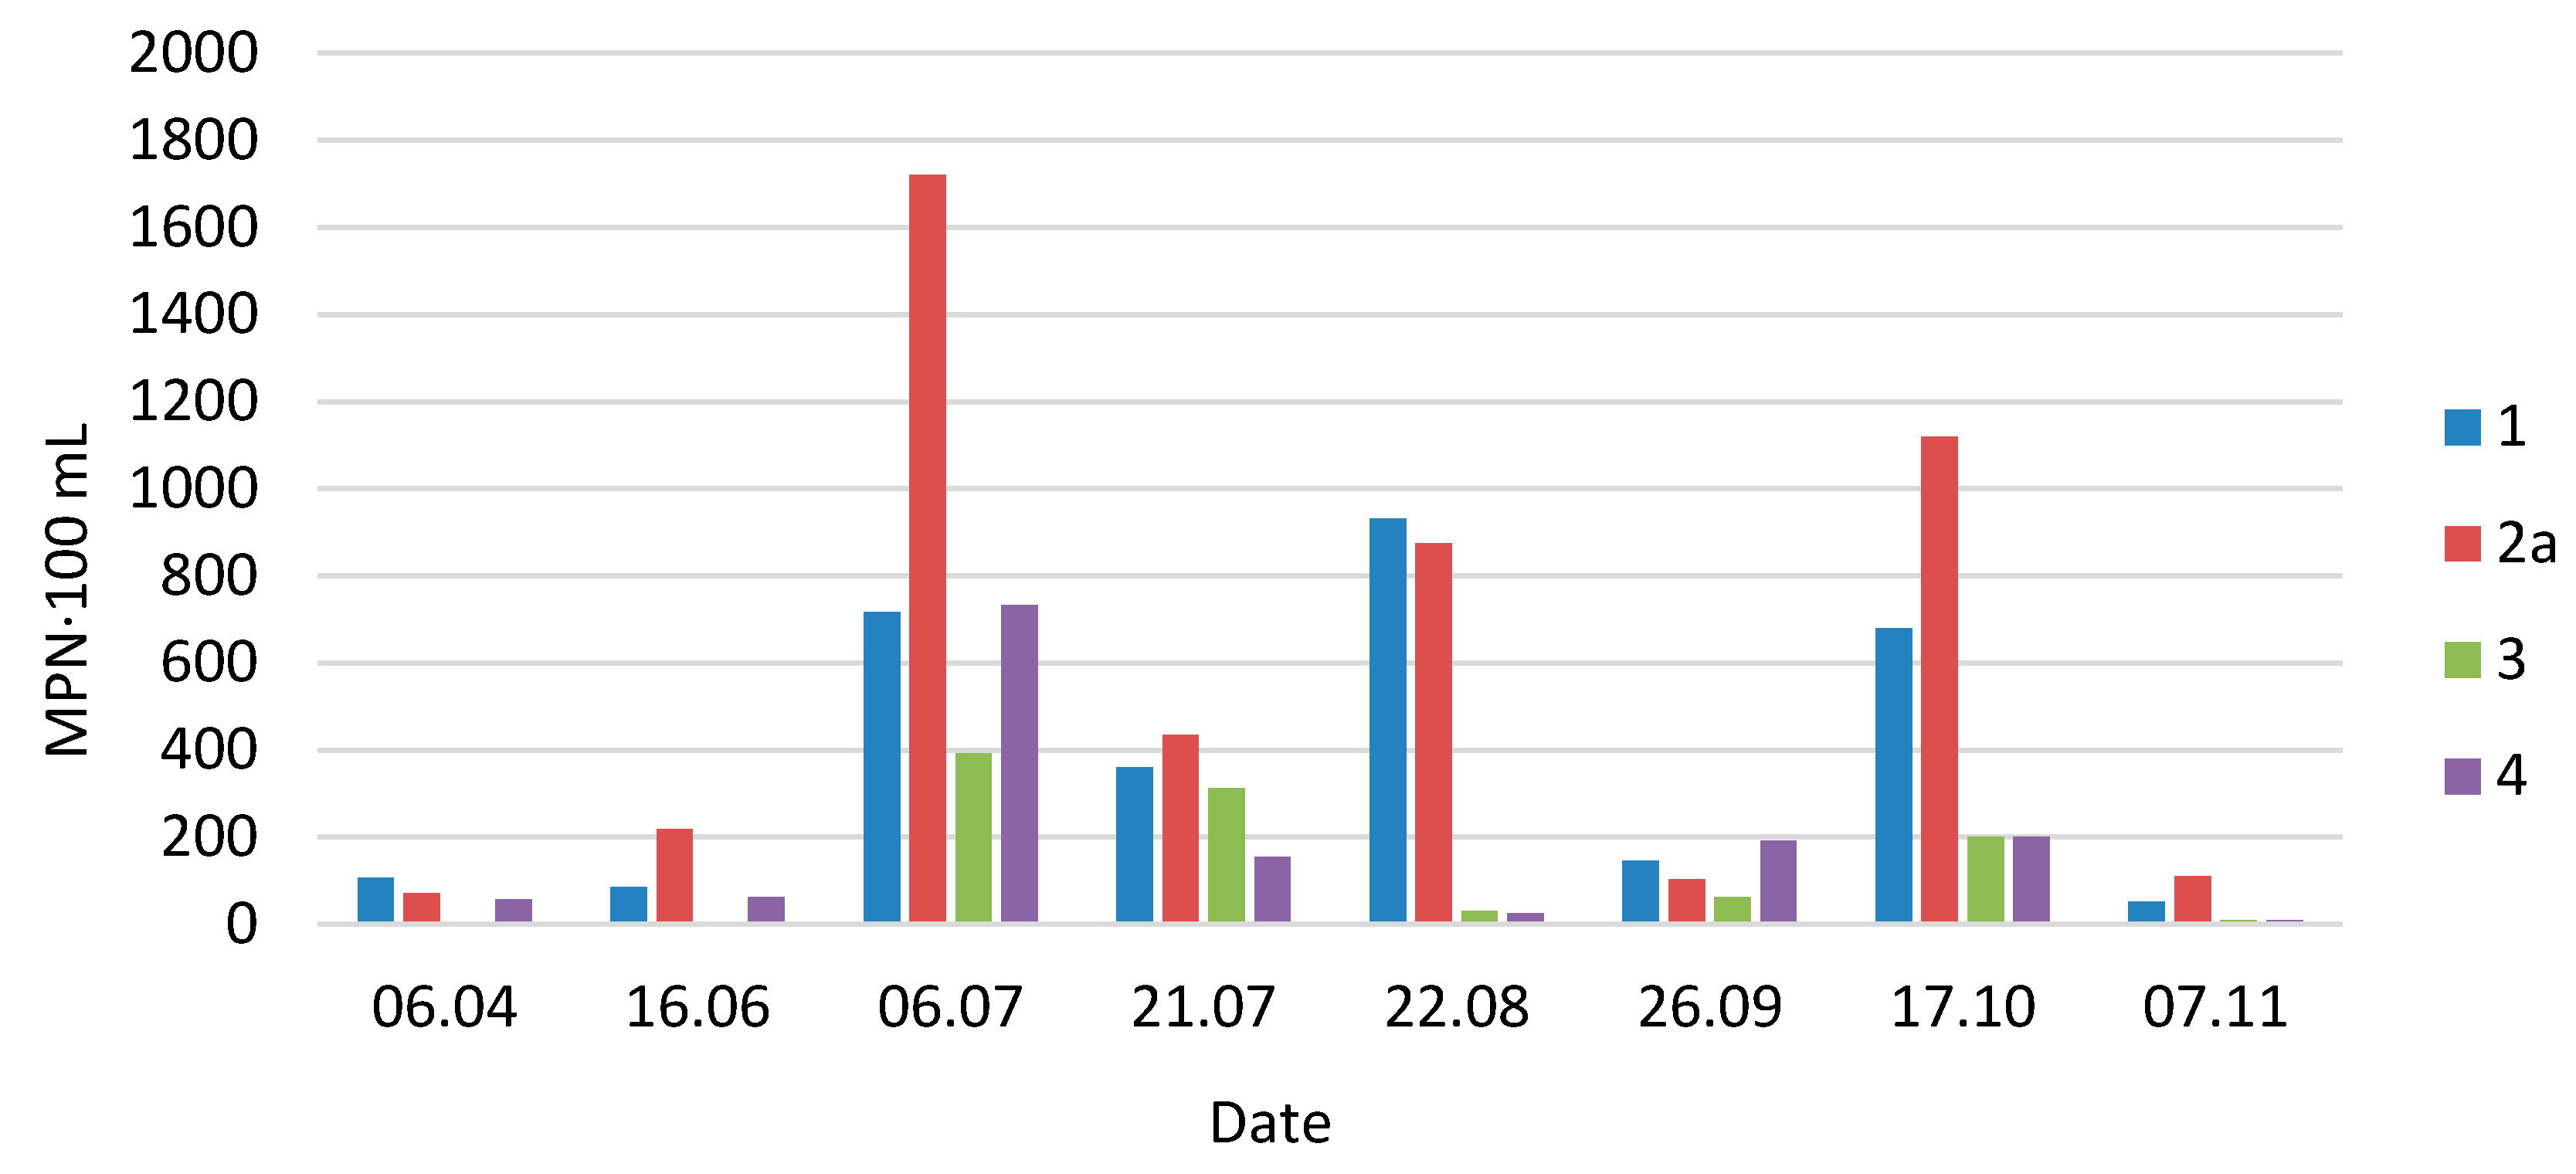
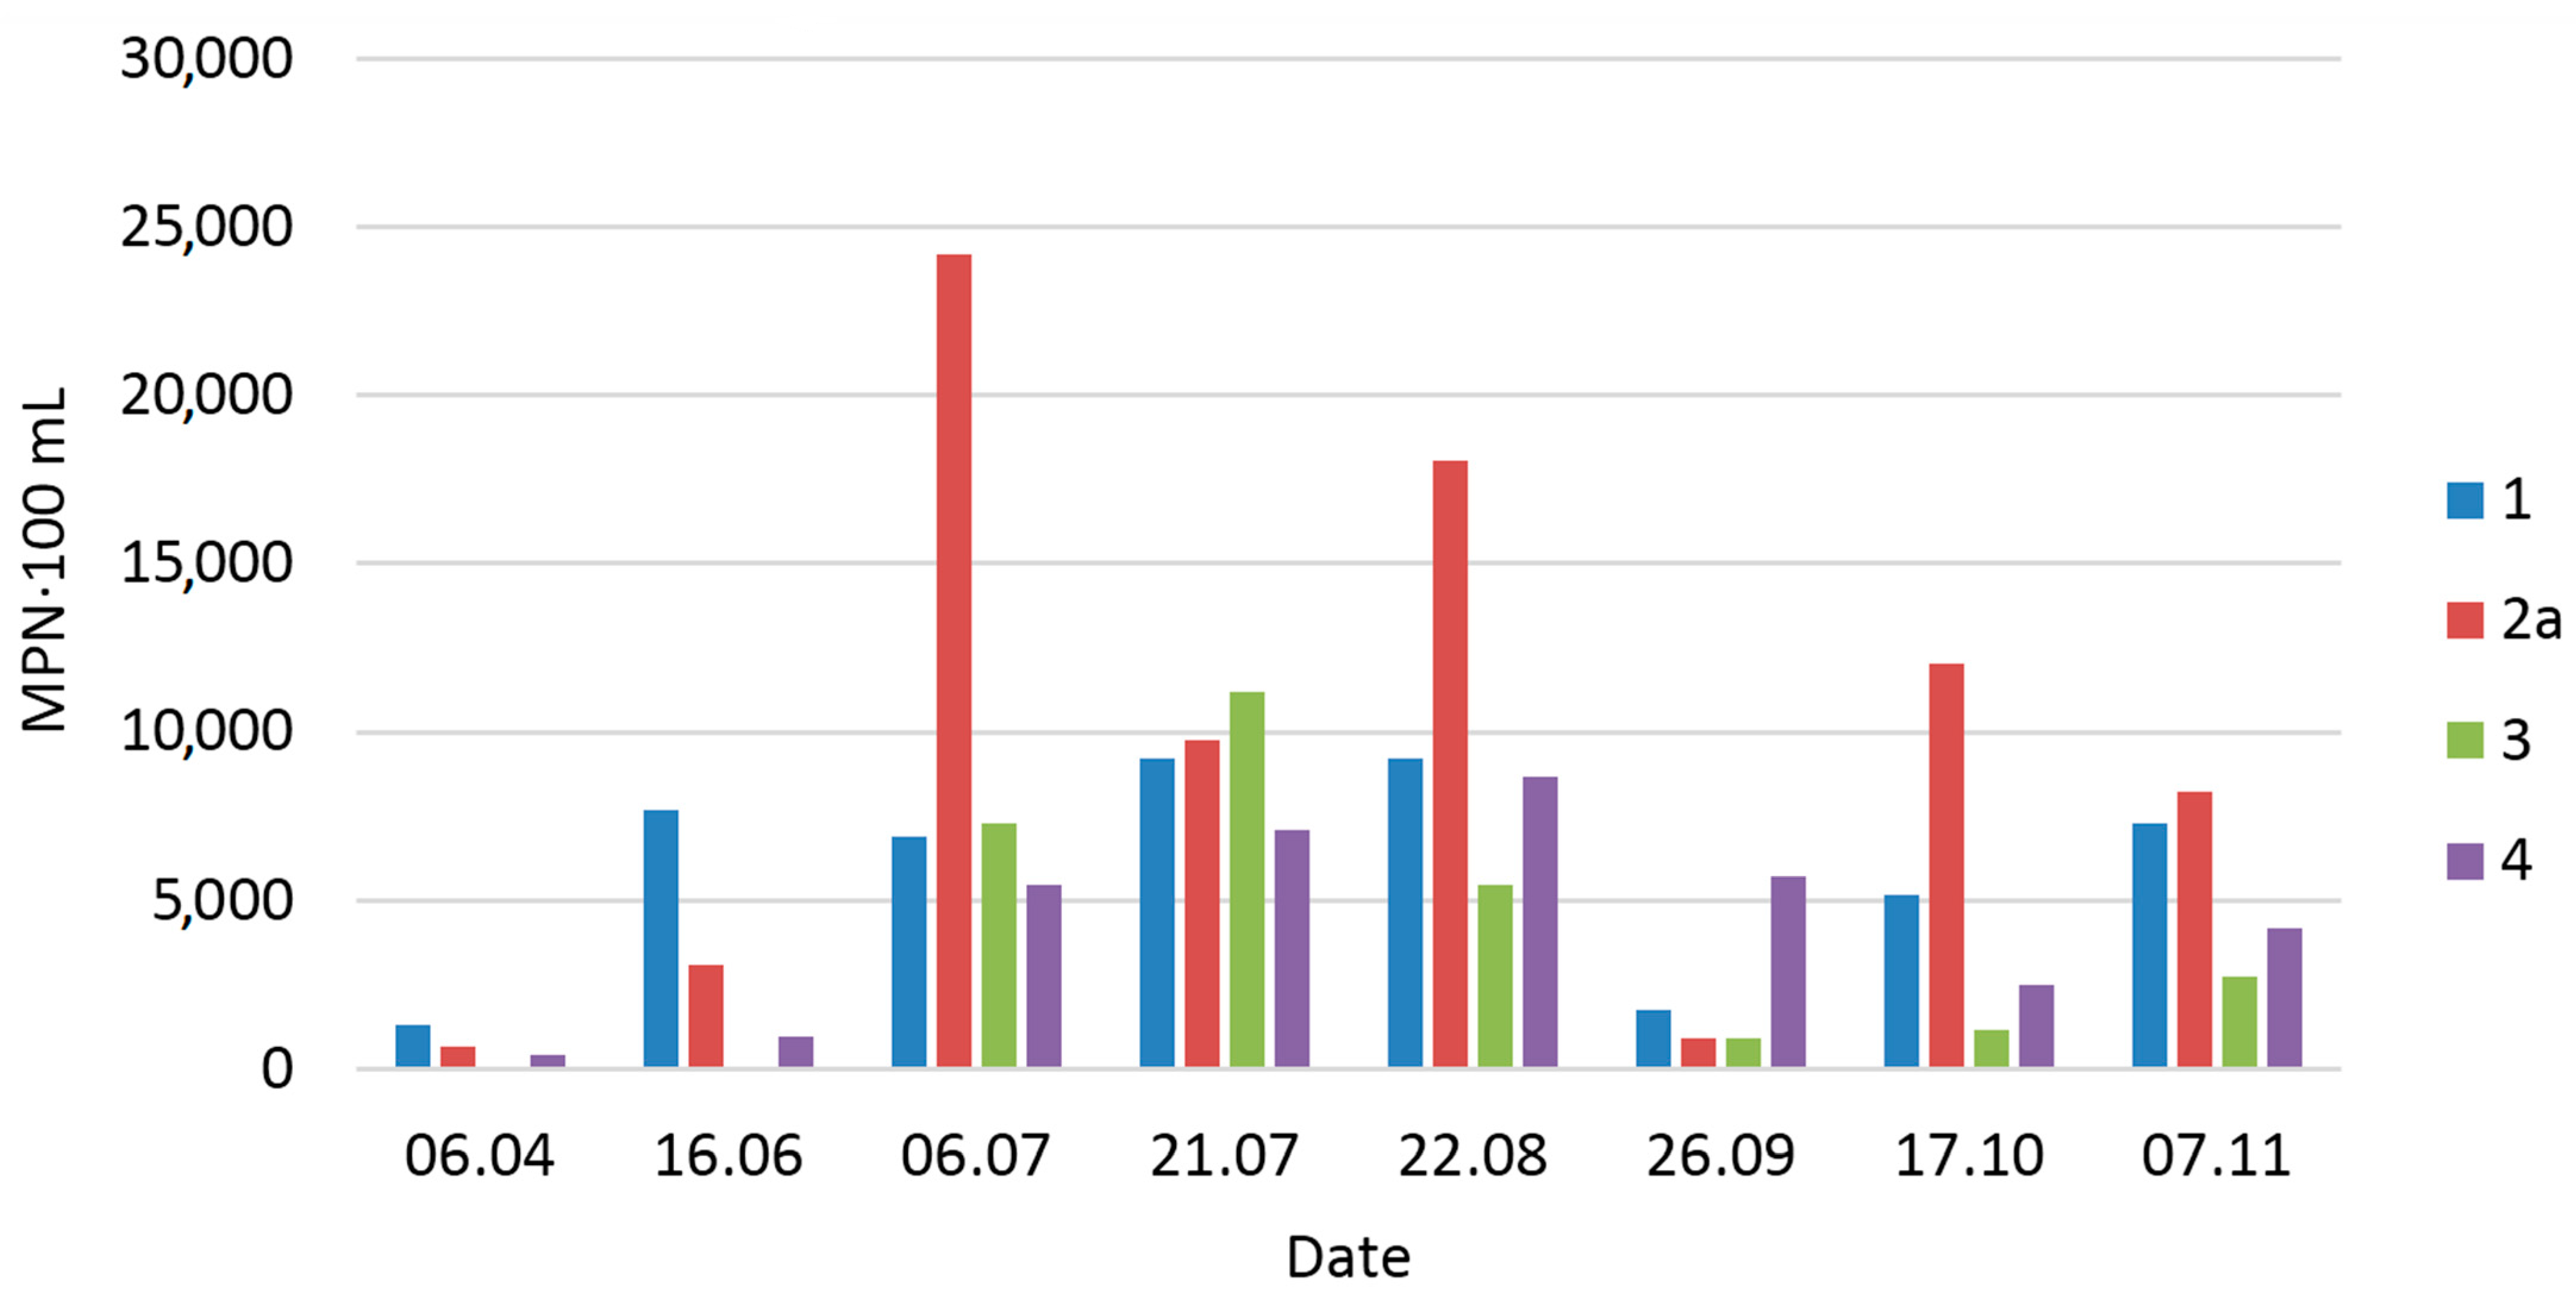
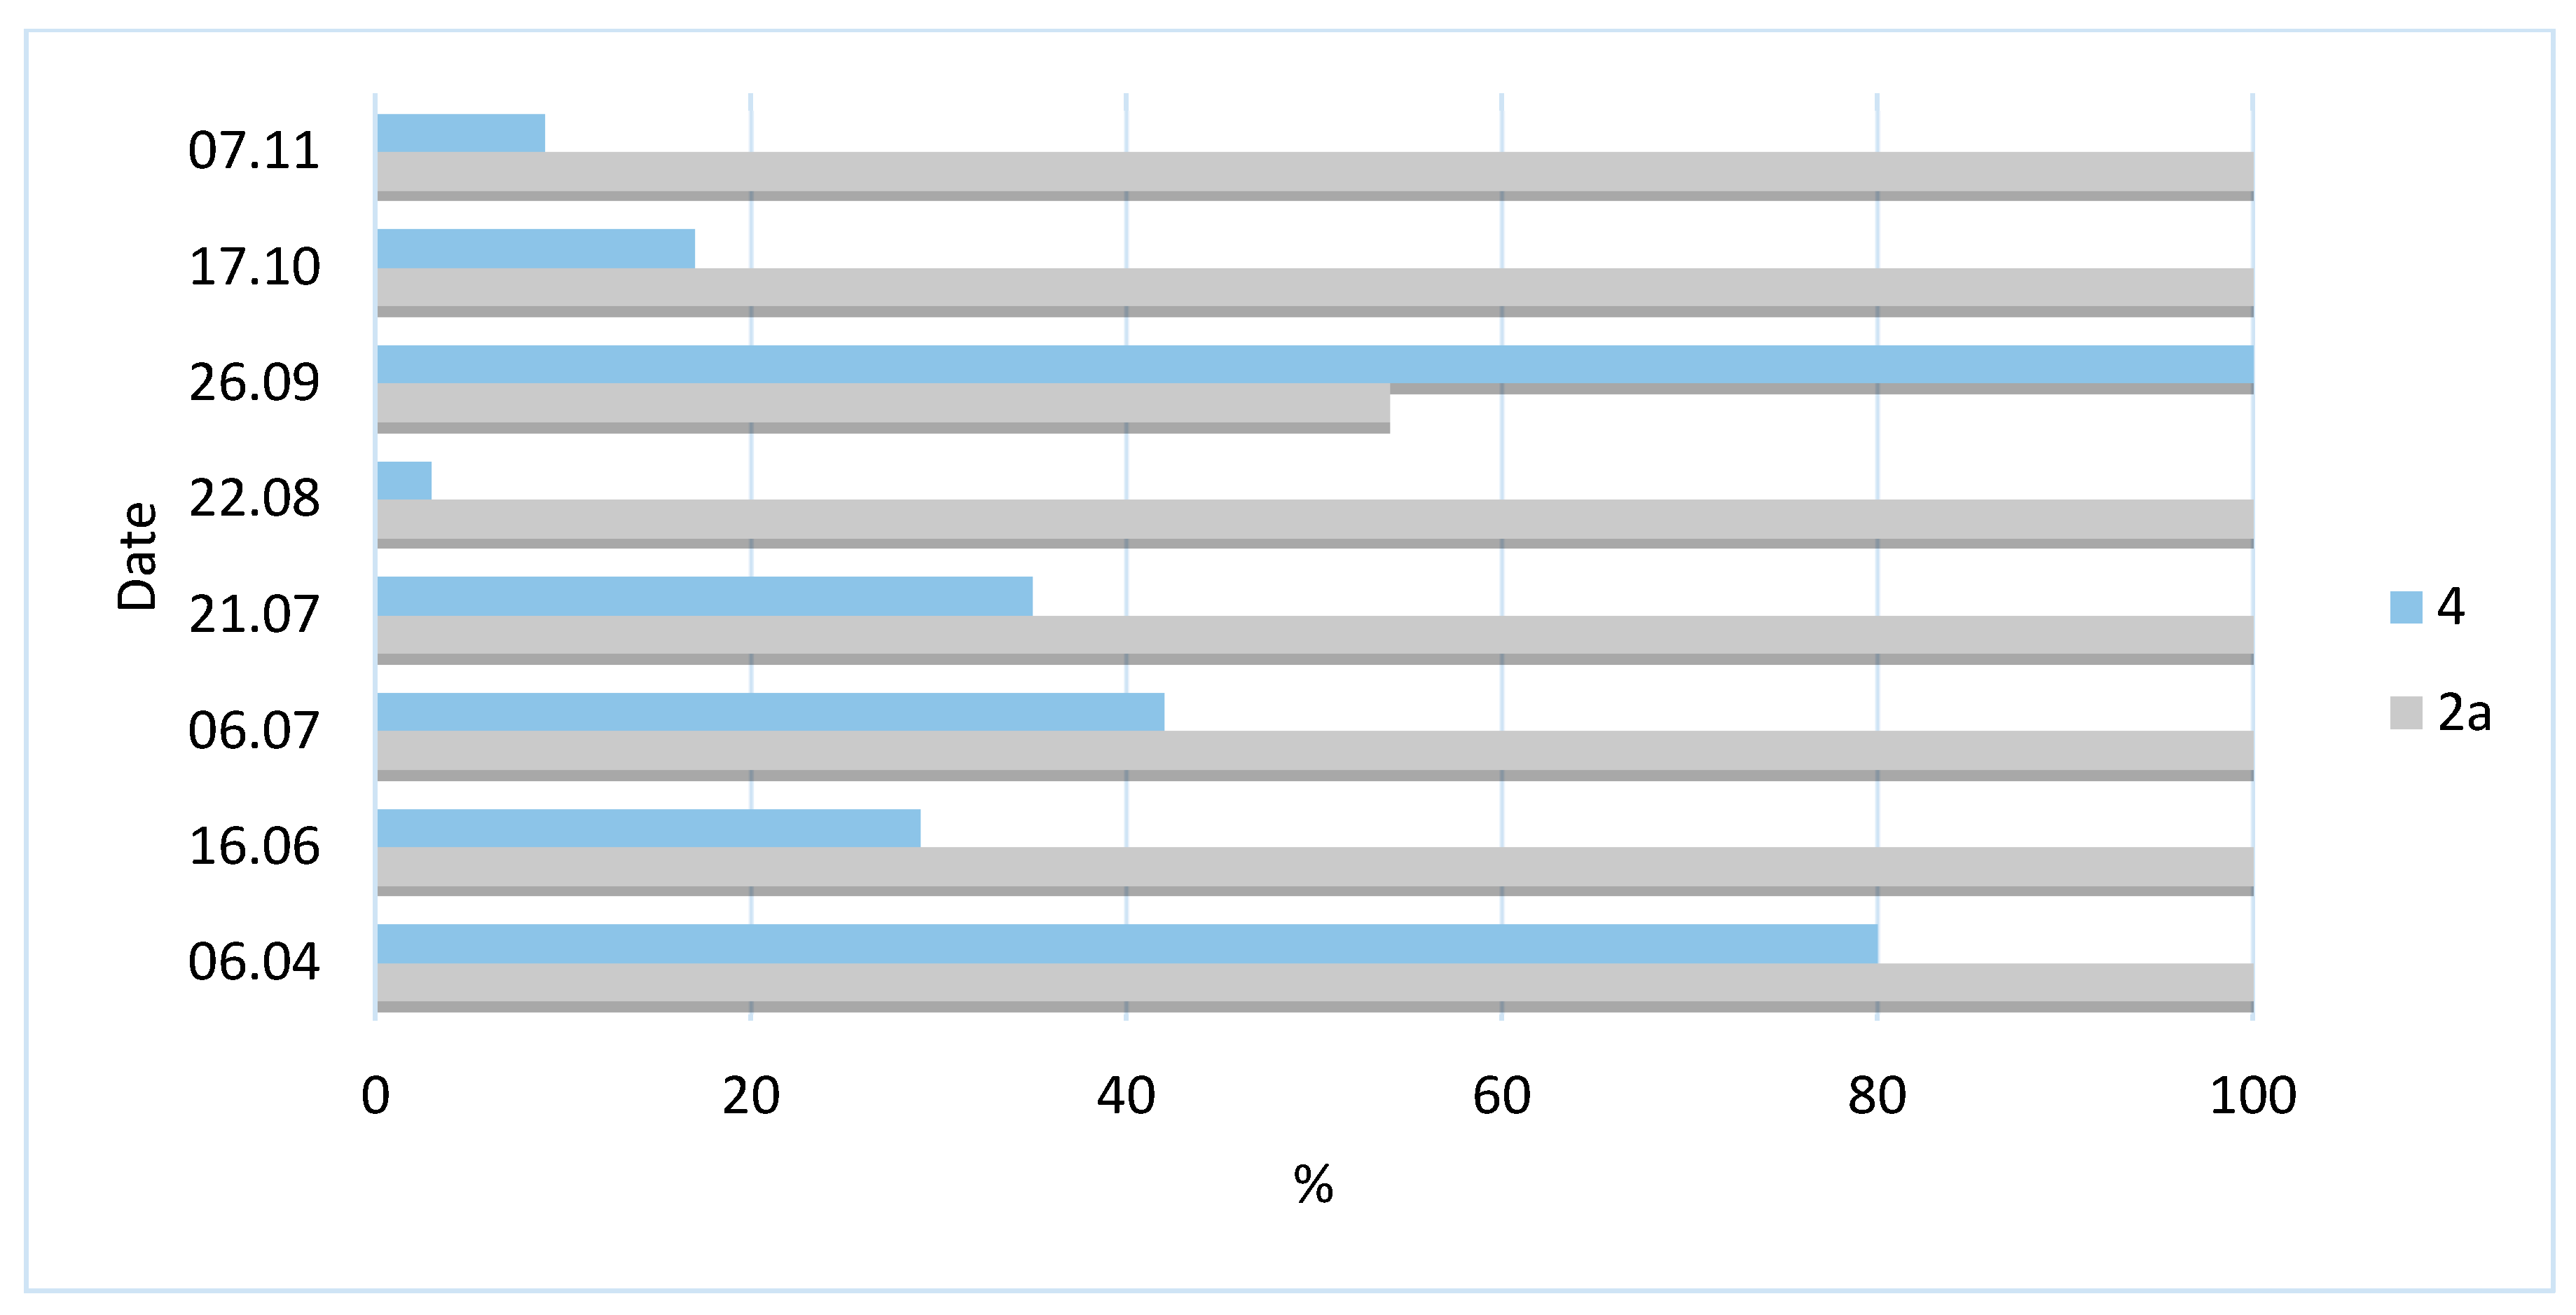
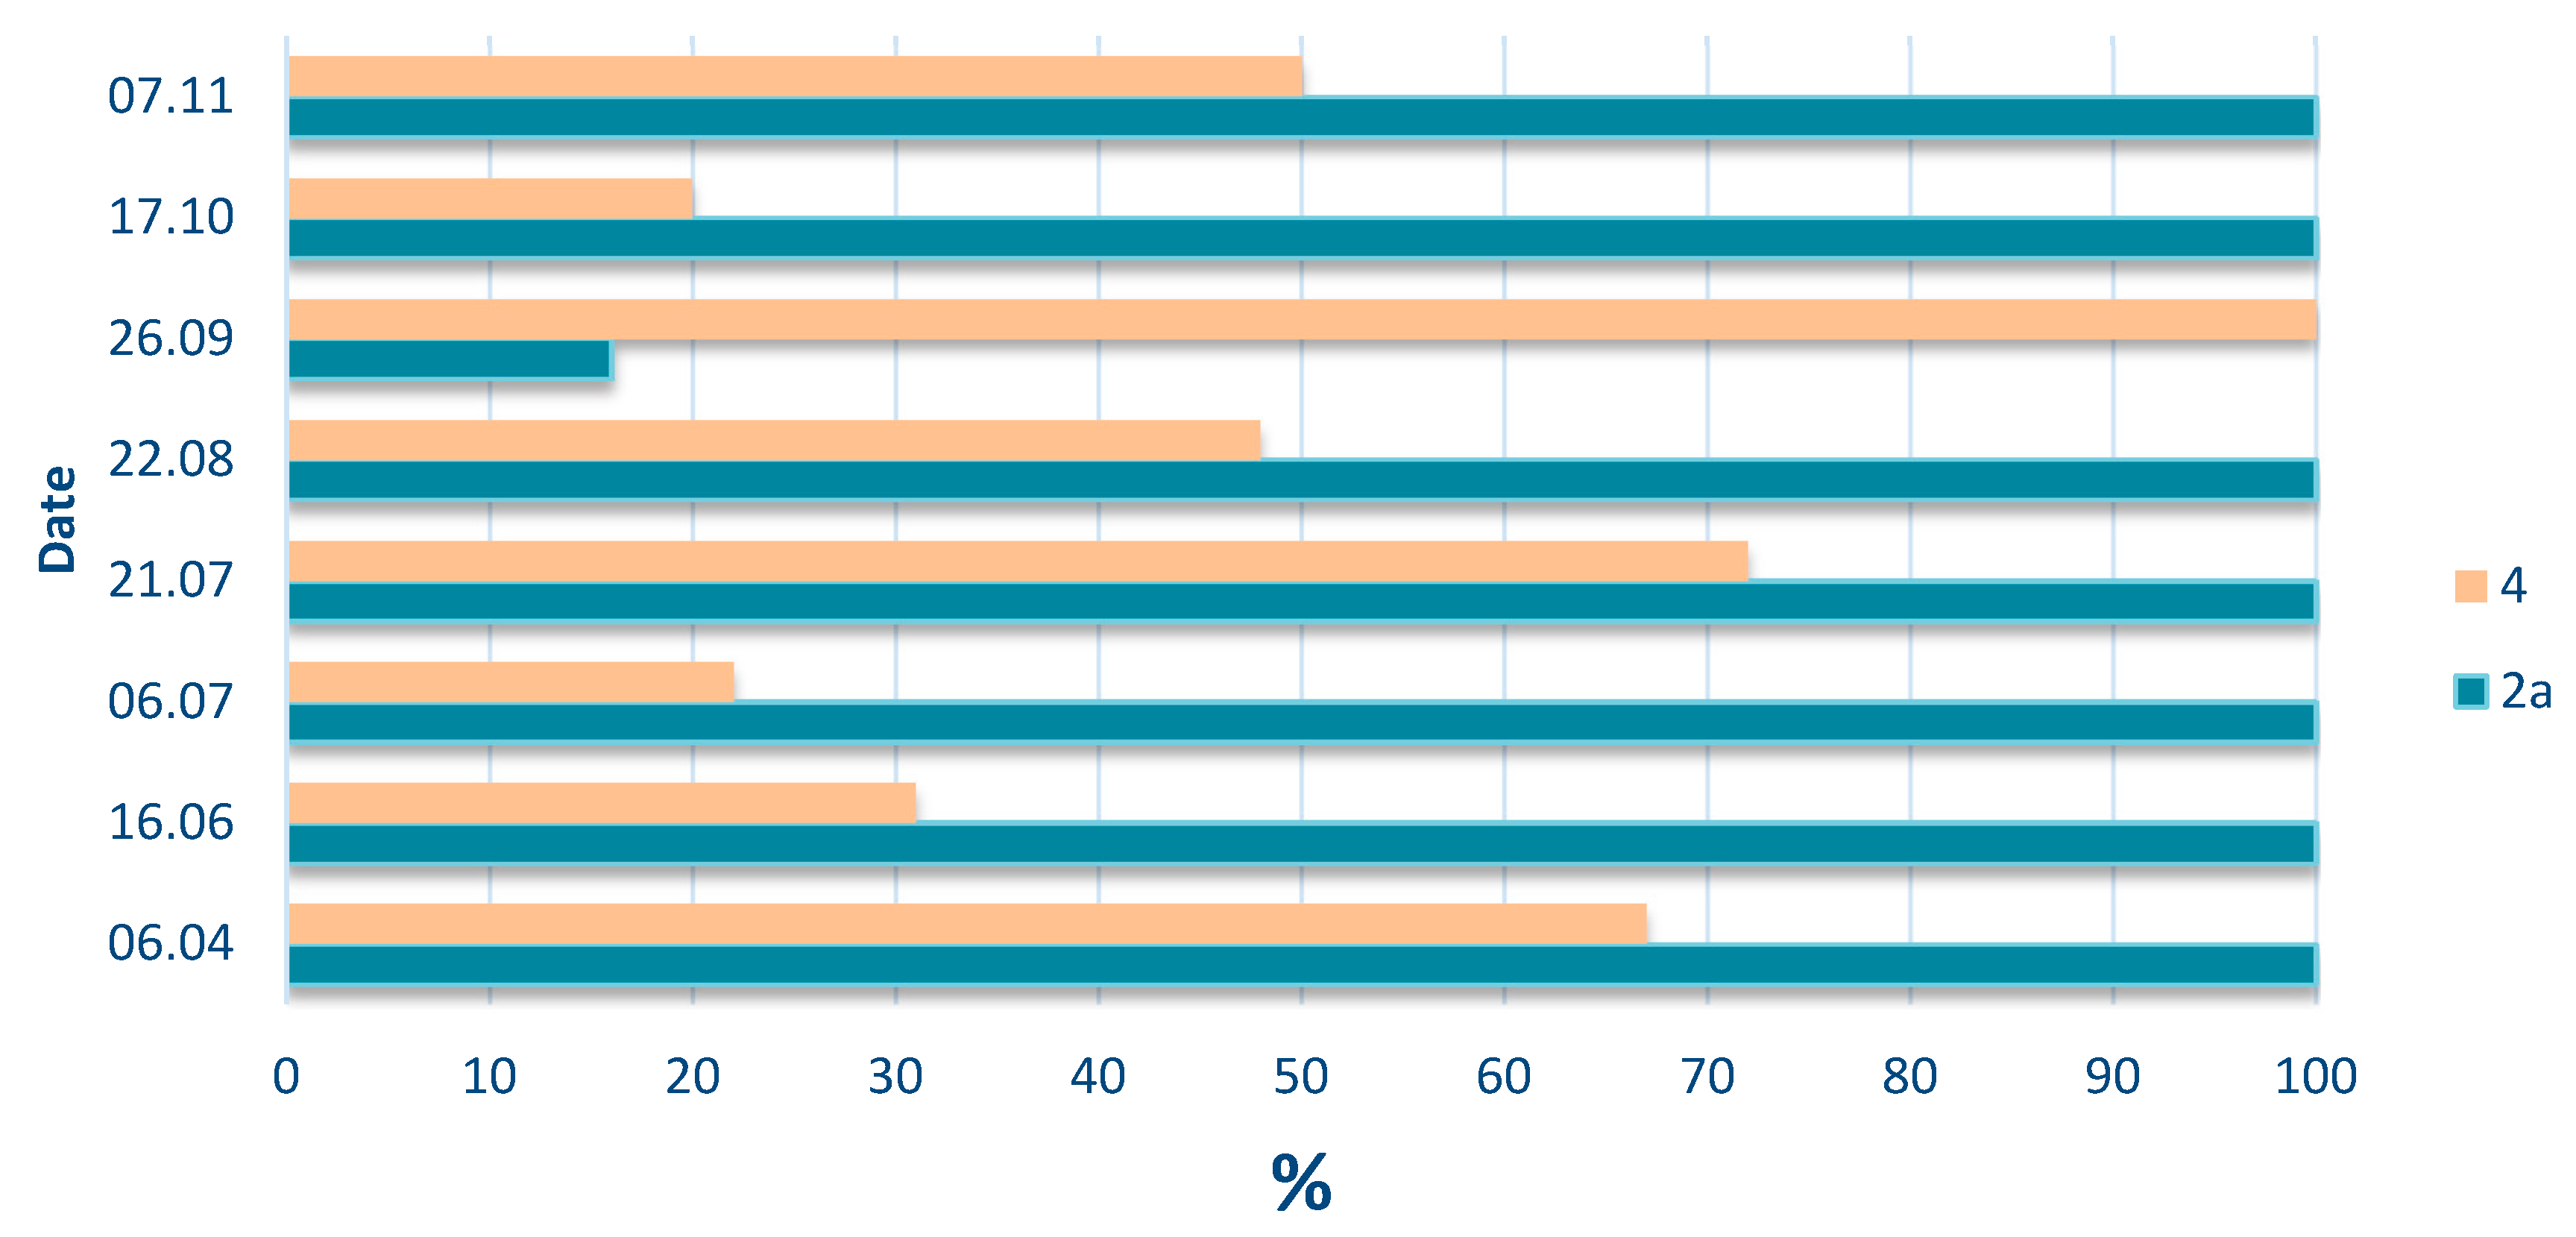
3.2. Sanitary Conditions

The water sanitary condition was assessed by the DST (defined-substrate test) using the Colilert 18 assay (IDEXX Inc., Westbrook, ME, USA), by means of which the MPN (most probable number) of indicator bacteria from the coli group and Escherichia coli was determined in 100 mL of water samples. The results of the study are presented in Table 5. The number of E. coli in water samples from monitoring points 1, 2a, 3 and 4 (Figure 5) ranged from 1.0 × 101/100 mL in the final sections of the SED-BIO (points 3 and 4) to 1.7 × 10³/100 mL in the initial part of the system (point 2a), where it was as much as two orders of magnitude higher (Table 5, Figure 6). Over the entire monitoring period, the largest E. coli loads were recorded in July, August, and October, and the lowest ones in April, June, and November (Figure 6). According to the regulation of the Polish Minister of Health, the number of E. coli cells in 100 mL of water from bathing and recreational areas must not exceed 1000 cells [59]. The results presented in Figure 6 show that the highest abundance of E. coli was found in water samples collected from the river and pond (sites 1 and 2a) on 6 July, and that the sanitary standards adopted for recreational waters [57] were exceeded on 6 July and 17 October in the pond (point 2a), where the number of potential pathogens was at the highest level compared to other parts of the SED-BIO system. Potentially pathogenic bacteria accumulated in the pond, which was a barrier against the penetration of pathogens into further compartments of the system and into Jelonek Lake, where they were detected in much lower numbers (Figure 6). During the entire monitoring period, the most significant differences in the number of E. coli cells in individual parts of the system were noted in August; in the river (point 1) their number was 9.3 × 10² in 100 mL, and in the pond it was at the same level (8.8 × 10²/100 mL cells), while after passing through the entire system, on the inflow to the lake (point 4), the number of E. coli was one order of magnitude lower, with only 2.6 × 10/100 mL. Coliforms were also most abundant in the sedimentation area, as was E. coli (Figure 7). The range of coliforms cells fluctuated between 4.3 × 10²/100 mL in the final section of the SED-BIO (monitoring point 4) and as much as 2.4 × 10⁴/100 mL in the pond of sedimentation area. In general, the numbers of coliforms were one to two orders of magnitude higher than those of E. coli at individual monitoring points for the same monitoring dates (Table 5, Figure 6 and Figure 7).
For a better illustration of the sanitary condition of water in the initial and final section of the SED-BIO system, the results are presented in Figure 8 and Figure 9. The sanitary purity of the water behind the SED-BIO (point 4) was significantly higher than in the pond (site 2a), and reduction in E. coli ranging from 20% in April up to 97% in July was recorded (Figure 8). At the end of the SED-BIO, the abundance of coliforms was also reduced by about 28% on July 21 and by even up to 80% on October 17 (Figure 9).
Monitoring the sanitary status of surface waters, also those in urban agglomerations, is vital for effective controlling the contamination by pathogenic bacteria and maintaining the microbiological safety of surface water resources. The presence of pathogenic microorganisms in water is predicted by the detection of fecal indicator bacteria (FIB) adopted as determinants of water purity due to their prevalence and abundance [60,61,62]. Escherichia coli belongs to the group of coliform bacteria, which also includes genera Enterobacter, Citrobacter, and Klebsiella; other genera are also commonly found in water, soil, and plants [63,64]. E. coli is the obligatory indicator in most countries because its presence indicates fresh fecal contamination and the possibility of pathogenic intestinal bacteria accompanying it. In addition, as the E. coli found in water are only of fecal origin, they are better indicators of the penetration of human or animal feces into water than other coliforms [65,66]; coliform bacteria can also be detected in the absence of pathogenic bacteria, and provide information on the microbial state of the water as an operational marker [67,68]. Such sanitary indicators act as a warning factor against waterborne infections due to the existence of a significant relationship between the number of FIB in the water and the number of pathogenic microorganisms [69,70,71,72,73].
In the summer months, the number of E. coli and coliforms cells in water samples was at its highest, which is most likely related to the high summer temperatures promoting bacterial survivability. Moreover, for individual monitoring periods, the highest abundance of E. coli was noted in the initial sections of the SED-BIO (sites 1 and 2a) and the lowest in the final sections (3 and 4), i.e., after passing through the system, which indicates the effectiveness of the constructed system in purifying water by ridding it pathogens (Figure 6). A similar trend occurred for coliforms (Figure 7). Furthermore, it has been noted that as the system runtime lengthened, the level of E. coli reduction also increased significantly (Figure 6). The averaged decline in numbers of E. coli cells in water samples was as high as 70%. The exception was September 26, when the abundance of E. coli was 46% higher behind the system (point 4) than in the sedimentation segment in point 2a. This may be related to the local and temporary bacteriological contamination around sampling point 4. As a result of the operation of the SED-BIO, the abundance of coliforms was also reduced (with the exception of 26 September, as described above); the decrease in the number of cells in water samples from the outflow was between 28% on 21 July up to 80% on 17 October, with the average level of coliforms reduction in the monitoring period as high as 56%. In conclusion, the study shows that one of the results of the operation of the developed SED-BIO system is also a significant reduction in potentially pathogenic microorganisms in the inflow to Jelonek Lake, which is a recreational lake and, as such, should meet sanitary standards.

4. Conclusions

This study has shown that the novel hybrid system effectively reduced nutrients transported by stormwater runoff from the rural part of the catchment and from impermeable urban areas to the river and downstream into Jelonek Lake. The results obtained in this study lead to the following conclusions:
  • In the majority of the analyzed period, the monitored sedimentation-biofiltration system contributed to the reduction of nitrogen (NO3—63%; NH4+—14.9%) and phosphorus (PO43−—19.3%) compounds flowing into Jelonek Lake with the waters of the Struga Gnieźnieńska.
  • The analysis of physical parameters revealed that the temperature conditions on specific points of the SED-BIO system were stable (statistically insignificant differences). This results from the fact that the physical conditions, such as depth or solar irradiation, were similar. On the other hand, the differences in pH between control points situated in section A and section B were statistically significant. This demonstrates that this parameter is influenced by the mineral filters absorbing PO43− that are part of the system, as well as by the assimilation of nutrients by plants and the use of CO2 in the photosynthesis process in section A.
  • The conducted tests revealed that the oxygen concentration differed significantly between sections A and B of the system. The first part of the SED-BIO system depended to a greater extent on the variable flow rate in the river flowing into the system and on the increased influence of phytoplankton (photosynthesis). On the other hand, the second part of the system was characterized by more stable flow conditions and a lower potential for water oxygenation that is connected to turbulent flow and limited gas exchange with the air.
  • The highest electric conductivity was noted in water supplied to the SED-BIO system from the catchment (1010 μS·cm−1). No statistically significant differences were found between the controls points in section A, which may additionally result from the microbiological activation with use of the Micro-Dictum preparation. At the same time, the conductivity of water on control points 3 and 4 in section B (970 and 960 μS·cm−1, respectively) points to the combined effects of the processes activated in section A, including: sedimentation of suspension, PO43− sorption, denitrification and assimilation by plants, as well as other processes that reduce the amount of pollutants. It is important to secure the reposition of nutrients in phosphate-binding deposits, nitrate reducing deposits, and in zones incorporating nutrients into plants, behind the activation zone of organic matter decomposition using Micro-Dictum, in newly constructed systems.
  • The largest amount of phytoplankton, together with the possibility of the appearance of toxic cyanobacteria that might produce microcystins, was recorded in section A of the SED-BIO system, in the plant biofilter segment. Therefore, this part of the system needs to be regularly monitored for the potential occurrence of blooms. In contrast, the number of microcystins detected did not indicate a threat to the recreational use of the pond (a walking, fishing, and archaeological site), and the place and time of their detection have shown that the SED-BIO system can effectively reduce this threat, thus protecting the waters of Jelonek Lake.
  • It can be concluded, that the solutions used in the SED-BIO, resulted in the reduction of the number of potential pathogens in the water flowing into Jelonek Lake, and the application of Micro-Dictum with beneficial microorganisms, was an additional tool supporting other parallel processes of self-purification of the waters. Recent years have seen a considerable rise in the number of pathogens released into the environment, including surface waters. It is vital to reduce the sanitary threat and keep the aquatic environment free of pathogenic bacteria that is endangering public health, and the SED-BIO system in this study seems to be a solution that is conducive to achieving this goal.
  • It should be assumed that the decrease in the number of fecal indicator bacteria in the river water at the inflow to Jelonek Lake compared to the number in the initial section of the SED-BIO was due to the operation of the system. Thus, the risk of microbiological contamination and transfer of pathogenic bacteria to the water of the lake decreased significantly.
Due to its specific construction, the SED-BIO proved to be efficient in spite of its relatively small surface area. Therefore, it may also be used successfully in cities, where land is often expensive or its availability is limited. The system is cost-efficient and easy to use in similar locations in other cities to purify stormwater. Similar constructions are currently being tested in Arturówek—Łódź city [74] and in Radom city (Poland) [75], as an example of Nature-based Solutions that enable the city to adapt to climate changes (retention of extreme city and small urban river floods, and purification of more frequent and intensive stormwater runoff).

5. Patents

The SED-BIO system is currently subject to patent procedure (application No. P.422056 Method for complex reduction of impurities on flows and the filtering system for complex reduction of impurities on flows).

Author Contributions

Conceptualization, J.M.K.; methodology, J.M.K., A.B., S.S., J.M.-B. and L.S.; validation, J.M.K. and A.B.; formal analysis, J.M.K., A.B., S.S., J.M.-B. and L.S.; investigation, J.M.K., A.B., S.S., J.M.-B. and L.S.; resources, J.M.K.; data curation, J.M.K., A.B., S.S., J.M.-B. and L.S.; writing—original draft preparation, J.M.K., A.B., J.M.-B. and L.S.; writing—review and editing J.M.K., A.B., J.M.-B., L.S. and J.D.; visualization, J.M.K. and A.B.; supervision, J.M.K.; project administration, J.M.K. and A.B.; funding acquisition, J.M.K., A.B. and J.D. All authors have read and agreed to the published version of the manuscript.

Funding

Part of the study was conducted under the project No. GEKON2/03/267948/21/2016, entitled: Development and implementation of lake reclamation and surface water protection method based on natural biological technologies employing beneficial microorganisms, financed by the National Centre for Research and Development and the National Fund for Environmental Protection and Water Management. The research was also financed from the own funds of the Poznań University of Life Sciences, Mikronatura Środowisko Sp. z o.o. and the Foundation w Harmonii z Naturą.

Institutional Review Board Statement

Not applicable.

Informed Consent Statement

Not applicable.

Data Availability Statement

The data that support the findings of this study are available from the corresponding author upon reasonable request.

Acknowledgments

The Authors would like to express their gratitude to Mikronatura Środowisko Sp. z o.o. and the Foundation w Harmonii z Naturą for their valuable cooperation and support.

Conflicts of Interest

The authors declare no conflict of interest.

References

  1. Kanownik, W.; Policht-Latawiec, A.; Dąbrowska, J. Influence of Human Activities on Water Quality in Two Rural Catchments-Understanding the Drivers and Relationships for Effective Restoration. Desalin. Water Treat. 2020, 206, 10–21. [Google Scholar] [CrossRef]
  2. Fu, H.; Chen, L.; Ge, Y.; Wu, A.; Liu, H.; Li, W.; Yuan, G.; Jeppesen, E. Linking Human Activities and Global Climatic Oscillation to Phytoplankton Dynamics in a Subtropical lake. Water Res. 2022, 208, 117866. [Google Scholar] [CrossRef] [PubMed]
  3. Van Heyst, A.; Sinclair, A.; Jamieson, R. Application of Phosphorus Loading Models to Understand Drivers of Eutrophication in a Complex Rural Lake-Watershed System. J. Environ. Manag. 2022, 302, 114010. [Google Scholar] [CrossRef] [PubMed]
  4. Lizotte, R.E.; Yasarer, L.M.W.; Bingner, R.L.; Locke, M.A.; Knight, S.S. Long-Term Oxbow Lake Trophic State under Agricultural Best Management Practices. Water 2021, 13, 1123. [Google Scholar] [CrossRef]
  5. Dąbrowska, J.; Dąbek, P.; Lejcuś, I.; Dąbrowska, J.; Dąbek, P.B.; Lejcuś, I. Identifying Surface Runoff Pathways for Cost-Effective Mitigation of Pollutant Inputs to Drinking Water Reservoir. Water 2018, 10, 1300. [Google Scholar] [CrossRef] [Green Version]
  6. Müller, A.; Österlund, H.; Marsalek, J.; Viklander, M. The Pollution Conveyed by Urban Runoff: A Review of Sources. Sci. Total Environ. 2020, 709, 136125. [Google Scholar] [CrossRef]
  7. Vinçon-Leite, B.; Casenave, C. Modelling Eutrophication in Lake Ecosystems: A Review. Sci. Total Environ. 2019, 651, 2985–3001. [Google Scholar] [CrossRef]
  8. Kubiak, J.; Tórz, A. Eutrophication. The Basic Problems of Lakes Waters Protection at the West Pomeranian Region. Słupskie Pract. Biol. 2005, 2, 17–36. [Google Scholar]
  9. Bhagowati, B.; Ahamad, K.U. A Review on Lake Eutrophication Dynamics and Recent Developments in Lake Modeling. Ecohydrol. Hydrobiol. 2019, 19, 155–166. [Google Scholar] [CrossRef]
  10. Ławniczak, A.; Zbierska, J.; Machula, S.; Choiński, A. Fluvial Lakes affect on Phosphorus and Potassium Concentrations in the Samica Stęszewska River. Limnol. Rev. 2011, 10, 29–36. [Google Scholar] [CrossRef] [Green Version]
  11. Jaskuła, J.; Sojka, M. Assessing Spectral Indices for Detecting VegetativeOvergrowth of Reservoirs. Pol. J. Environ. Stud. 2019, 28, 4199–4211. [Google Scholar] [CrossRef]
  12. Abril, G.; Guérin, F.; Richard, S.; Delmas, R.; Galy-Lacaux, C.; Gosse, P.; Tremblay, A.; Varfalvy, L.; Dos Santos, M.A.; Matvienko, B. Carbon Dioxide and Methane Emissions and the Carbon Budget of a 10-Year Old Tropical Reservoir (Petit Saut, French Guiana). Glob. Biogeochem. Cycles 2005, 19, GB4007. [Google Scholar] [CrossRef]
  13. Zimov, S.A.; Voropaev, Y.V.; Semiletov, I.P.; Davidov, S.P.; Prosiannikov, S.F.; Chapin, F.S.; Chapin, M.C.; Trumbore, S.; Tyler, S. North Siberian Lakes: A Methane Source Fueled by Pleistocene Carbon. Science 1997, 277, 800–802. [Google Scholar] [CrossRef] [Green Version]
  14. Huttunen, J.T.; Alm, J.; Liikanen, A.; Juutinen, S.; Larmola, T.; Hammar, T.; Silvola, J.; Martikainen, P.J. Fluxes of Methane, Carbon Dioxide and Nitrous Oxide in Boreal Lakes and Potential Anthropogenic Effects on the Aquatic Greenhouse Gas Emissions. Chemosphere 2003, 52, 609–621. [Google Scholar] [CrossRef]
  15. Guérin, F.; Abril, G.; Serça, D.; Delon, C.; Richard, S.; Delmas, R.; Tremblay, A.; Varfalvy, L. Gas Transfer Velocities of CO2 and CH4 in a Tropical Reservoir and Its River Downstream. J. Mar. Syst. 2007, 66, 161–172. [Google Scholar] [CrossRef]
  16. Alterra Environmental Sciences Wageningen University & Research Centre Wageningen. Assessment of the Designation of Nitrate Vulneralble Zones in Poland; Alterra Environmental Sciences Wageningen University & Research Centre Wageningen: Wageningen, The Netherlands, 2007. [Google Scholar]
  17. Decina, S.M.; Templer, P.H.; Hutyra, L.R. Atmospheric Inputs of Nitrogen, Carbon, and Phosphorus across an Urban Area: Unaccounted Fluxes and Canopy Influences. Earth Future 2018, 6, 134–148. [Google Scholar] [CrossRef] [Green Version]
  18. Paerl, H.W.; Barnard, M.A. Mitigating the Global Expansion of Harmful Cyanobacterial Blooms: Moving Targets in a Human- and Climatically-Altered World. Harmful Algae 2020, 96, 101845. [Google Scholar] [CrossRef]
  19. Davies, C.; Chen, W.Y.; Sanesi, G.; Lafortezza, R. The European Union Roadmap for Implementing Nature-Based Solutions: A Review. Environ. Sci. Policy 2021, 121, 49–67. [Google Scholar] [CrossRef]
  20. Seddon, N.; Chausson, A.; Berry, P.; Girardin, C.A.J.; Smith, A.; Turner, B. Understanding the Value and Limits of Nature-Based Solutions to Climate Change and Other Global Challenges. Philos. Trans. R. Soc. B 2020, 375, 20190120. [Google Scholar] [CrossRef] [Green Version]
  21. Chausson, A.; Turner, B.; Seddon, D.; Chabaneix, N.; Girardin, C.A.J.; Kapos, V.; Key, I.; Roe, D.; Smith, A.; Woroniecki, S.; et al. Mapping the Effectiveness of Nature-Based Solutions for Climate Change Adaptation. Glob. Chang. Biol. 2020, 26, 6134–6155. [Google Scholar] [CrossRef]
  22. Oral, H.V.; Carvalho, P.; Gajewska, M.; Ursino, N.; Masi, F.; van Hullebusch, E.D.; Kazak, J.K.; Exposito, A.; Cipolletta, G.; Andersen, T.R.; et al. A Review of Nature-Based Solutions for Urban Water Management in European Circular Cities: A Critical Assessment Based on Case Studies and Literature. Blue-Green Syst. 2020, 2, 112–136. [Google Scholar] [CrossRef] [Green Version]
  23. European Environment Agency. European Waters Assessment of Status and Pressures 2018; European Environment Agency: Luxembourg, 2018.
  24. Szklarek, S.; Stolarska, M.; Wagner, I.; Mankiewicz-Boczek, J. The Microbiotest Battery as an Important Component in the Assessment of Snowmelt Toxicity in Urban Watercourses—Preliminary Studies. Environ. Monit. Assess. 2015, 187, 1–11. [Google Scholar] [CrossRef] [Green Version]
  25. Urbaniak, M.; Zieliński, M.; Wagner, I. Seasonal Distribution of PCDDs/PCDFs in the Small urban Reservoirs. Int. J. Environ. Res. 2015, 9, 745–752. [Google Scholar]
  26. Yu, C.; Stone, M. Sediment and Nutrient Transport Dynamics in an Urban Stormwater Impoundment. In Sediment Dynamics for a Changing Future, Proceedings of the ICCE Symposium, Warsaw, Poland, 14–18 June 2010; IAHS Press: Warsaw, Poland, 2010; pp. 99–105. [Google Scholar]
  27. Schwartz, D.; Sample, D.J.; Grizzard, T.J. Evaluating the Performance of a Retrofitted Stormwater Wet Pond for Treatment of Urban Runoff. Environ. Monit. Assess. 2017, 189, 256. [Google Scholar] [CrossRef]
  28. Volkan Oral, H.; Radinja, M.; Rizzo, A.; Kearney, K.; Andersen, T.R.; Krzeminski, P.; Buttiglieri, G.; Ayral-Cinar, D.; Comas, J.; Gajewska, M.; et al. Management of Urban Waters with Nature-Based Solutions in Circular Cities—Exemplified through Seven Urban Circularity Challenges. Water 2021, 13, 3334. [Google Scholar] [CrossRef]
  29. Furtado, A.P.F.V.; de Monte-Mor, R.C.A.; de Couto, E.A. Do Evaluation of Reduction of External Load of Total Phosphorus and Total Suspended Solids for Rehabilitation of Urban Lakes. J. Environ. Manag. 2021, 296, 113339. [Google Scholar] [CrossRef]
  30. Rahman, K.; Barua, S.; Imran, H.M. Assessment of Water Quality and Apportionment of Pollution Sources of an Urban Lake Using Multivariate Statistical Analysis. Clean. Eng. Technol. 2021, 5, 100309. [Google Scholar] [CrossRef]
  31. Jia, Z.; Chang, X.; Duan, T.; Wang, X.; Wei, T.; Li, Y. Water Quality Responses to Rainfall and Surrounding Land Uses in Urban Lakes. J. Environ. Manag. 2021, 298, 113514. [Google Scholar] [CrossRef]
  32. Berleć, K.; Traczykowski, A.; Budzińska, K.; Szejniuk, B.; Michalska, M.; Jurek, A.; Tarczykowska, M.; Klimczak, I. Effectiveness of the Reclamation of Jelonek Lake Based on Selected Physical and Chemical Parameters of Water. Annu. Set Environ. Prot. 2013, 15, 1336–1351. [Google Scholar]
  33. Bajkiewicz-Grabowska, E.; Magnuszewski, A. Przewodnik do Ćwiczeń z Hydrologii Ogólnej; PWN: Warsaw, Poland, 2016. [Google Scholar]
  34. Kupiec, J.M.; Bednarek, A.; Szklarek, S.; Mankiewicz-Boczek, J.; Żeleźnik, W.; Zalewski, M. Wyniki Funkcjonowania Systemu Sedymentacyjno-Biofiltracyjnego Zlokalizowanego na Strudze Gnieźnieńskiej w Kontekście Ochrony Jeziora Jelonek; Raport Roczny WOŚ.272.13.2017. 30; Poznań University of Life Sciences: Poznań, Poland, 2017. [Google Scholar]
  35. Guidi Nissim, W.; Jerbi, A.; Lafleur, B.; Fluet, R.; Labrecque, M. Willows for the Treatment of Municipal Wastewater: Performance under Different irrigation Rates. Ecol. Eng. 2015, 81, 395–404. [Google Scholar] [CrossRef]
  36. APHA; AWWA; WEF. Standard Methods for the Examination of Water and Wastewater, 18th ed.; American Public Health Association; American Water Works Association; Water Environment Federation: Baltimore, MD, USA, 1992. [Google Scholar]
  37. Mankiewicz-Boczek, J.; Izydorczyk, K.; Romanowska-Duda, Z.; Jurczak, T.; Stefaniak, K.; Kokocinski, M. Detection and Monitoring Toxigenicity of Cyanobacteria by Application of Molecular Methods. Environ. Toxicol. 2006, 21, 380–387. [Google Scholar] [CrossRef]
  38. Lin, S.; Shen, J.; Liu, Y.; Wu, X.; Liu, Q.; Li, R. Molecular evaluation on the distribution, diversity, and toxicity of Microcystis (Cyanobacteria) species from Lake Ulungur—A mesotrophic brackish desert lake in Xinjiang, China. Environ. Monit. Assess. 2011, 175, 139–150. [Google Scholar] [CrossRef] [PubMed]
  39. Mankiewicz-Boczek, J.; Gągała, I.; Jurczak, T.; Jaskulska, A.; Pawełczyk, J.; Dziadek, J. Bacteria Homologus to Aeromonas Capable of Microcystin Degradation. Open Life Sci. 2015, 10, 119–129. [Google Scholar] [CrossRef]
  40. Kaczkowski, Z.; Wojtal-Frankiewicz, A.; Gągała, I.; Mankiewicz-Boczek, J.; Jaskulska, A.; Frankiewicz, P.; Izydorczyk, K.; Jurczak, T.; Godlewska, M. Relationships among Cyanobacteria, Zooplankton and Fish in Sub-Bloom Conditions in the Sulejow Reservoir. J. Limnol. 2017, 76, 380–396. [Google Scholar] [CrossRef] [Green Version]
  41. Svirčev, Z.; Lalić, D.; Bojadžija Savić, G.; Tokodi, N.; Drobac Backović, D.; Chen, L.; Meriluoto, J.; Codd, G.A. Global Geographical and Historical Overview of Cyanotoxin Distribution and Cyanobacterial Poisonings. Arch. Toxicol. 2019, 93, 2429–2481. [Google Scholar] [CrossRef] [PubMed]
  42. Serwecińska, L.; Kiedrzyńska, E.; Kiedrzyński, M. A Catchment-Scale Assessment of the Sanitary Condition of Treated Wastewater and River Water Based on Fecal Indicators and Carbapenem-Resistant Acinetobacter spp. Sci. Total Environ. 2021, 750, 142266. [Google Scholar] [CrossRef]
  43. Malema, M.S.; Abia, A.L.K.; Tandlich, R.; Zuma, B.; Kahinda, J.M.M.; Ubomba-Jaswa, E. Antibiotic-Resistant Pathogenic Escherichia Coli Isolated from Rooftop Rainwater-Harvesting Tanks in the Eastern Cape, South Africa. Int. J. Environ. Res. Public Health 2018, 15, 892. [Google Scholar] [CrossRef] [Green Version]
  44. Byczkowski, A. Hydrologia; SGGW: Warsaw, Poland, 1999; Volume I. [Google Scholar]
  45. Byczkowski, A. Hydrologia; SGGW: Warsaw, Poland, 1996; Volume II. [Google Scholar]
  46. Nastawska-Majchrzak, E. Modification of the Discharge Data Control Procedure at Hydrological Nodes. Przegląd Geofiz. 2013, 3–4, 197–210. [Google Scholar]
  47. Gutry-Korycka, M.; Sadurski, A.; Kundzewicz, Z.W.; Pociask-Karteczka, J.; Skrzypczyk, L. Water Resources and Their Use. Nauka 2014, 1, 77–98. [Google Scholar]
  48. Institute of Meteorology and Water Management (IMGW-PIB), Historical Measurement Data. Available online: www.meteomodel.pl (accessed on 15 September 2021).
  49. Dittrich, M.; Gabriel, O.; Rutzen, C.; Koschel, R. Lake Restoration by Hypolimnetic Ca(OH)2 Treatment: Impact on Phosphorus Sedimentation and Release from Sediment. Sci. Total Environ. 2011, 409, 1504–1515. [Google Scholar] [CrossRef]
  50. Knowles, R. Denitrification. Microbiol. Rev. 1982, 46, 43–70. [Google Scholar] [CrossRef]
  51. Jurczak, T.; Wagner, I.; Wojtal-Frankiewicz, A.; Frankiewicz, P.; Bednarek, A.; Łapińska, M.; Kaczkowski, Z.; Zalewski, M. Comprehensive Approach to Restoring Urban Recreational Reservoirs. Part 1–Reduction of Nutrient Loading Through Low-Cost and Highly Effective Ecohydrological Measures. Ecol. Eng. 2019, 131, 81–98. [Google Scholar] [CrossRef]
  52. Jurczak, T.; Wagner, I.; Kaczkowski, Z.; Szklarek, S.; Zalewski, M. Hybrid System for the Purification of Street Stormwater Runoff Supplying Urban Recreation Reservoirs. Ecol. Eng. 2018, 110, 67–77. [Google Scholar] [CrossRef]
  53. Rodak, C.M.; Moore, T.L.; David, R.; Jayakaran, A.D.; Vogel, J.R. Urban Stormwater Characterization, Control, and Treatment. Water Environ. Res. 2019, 91, 1034–1060. [Google Scholar] [CrossRef] [Green Version]
  54. Szklarek, S.; Wagner, I.; Jurczak, T.; Zalewski, M. Sequential Sedimentation-Biofiltration System for the Purification of a Small Urban River (the Sokolowka, Lodz) Supplied by Stormwater. J. Environ. Manag. 2018, 205, 201–208. [Google Scholar] [CrossRef] [PubMed]
  55. Kiedrzyńska, E.; Urbaniak, M.; Kiedrzyński, M.; Jóźwik, A.; Bednarek, A.; Gągała, I.; Zalewski, M. The Use of a Hybrid Sequential Biofiltration System for the Improvement of Nutrient Removal and PCB Control in Municipal Wastewater. Sci. Rep. 2017, 7, 1–14. [Google Scholar]
  56. Pulikowski, K.; Czyżyk, F.; Pawęska, K.; Strzelczyk, M. Seasonal Changes in the Size of Nitrogen Load Outflowed from Micro-catchments Used for Agricultural Purposes. Infrastruct. Ecol. Rural Areas 2011, 10, 161–171. [Google Scholar]
  57. Sojka, M.; Murat-Błażejewska, S.; Kanclerz, J. Evaluation of Temporal Variability of Nitrogen and Phosphorus Compound Load Leaching from Agricultural Catchment. Zesz. Probl. Postępów Nauk Rol. 2008, 526, 443–450. [Google Scholar]
  58. Chorus, I.; Welker, M. Toxic Cyanobacteria in Water. A Guide to Their Public Health Consequences, Monitoring and Management; World Health Organization: Geneva, Switzerland, 2021. [Google Scholar]
  59. Journal of Laws of the Republic of Poland Dz.U. 2016 poz. 1602. Regulation of the Polish Minister of Health on the Monitoring of Water Quality on the Bathing Water and Bathing Area; Journal of Laws of the Republic of Poland Dz.U.: Warsaw, Poland, 2016; pp. 1–9. [Google Scholar]
  60. Zhang, Q.; Eichmiller, J.J.; Staley, C.; Sadowsky, M.J.; Ishii, S. Correlations between Pathogen Concentration and Fecal Indicator Marker Genes in Beach Environments. Sci. Total Environ. 2016, 573, 826–830. [Google Scholar] [CrossRef]
  61. Bradshaw, J.K.; Snyder, B.J.; Oladeinde, A.; Spidle, D.; Berrang, M.E.; Meinersmann, R.J.; Oakley, B.; Sidle, R.C.; Sullivan, K.; Molina, M. Characterizing Relationships among Fecal Indicator Bacteria, Microbial Source Tracking Markers, and Associated Waterborne Pathogen Occurrence in Stream Water and Sediments in a Mixed Land Use Watershed. Water Res. 2016, 101, 498–509. [Google Scholar] [CrossRef] [PubMed] [Green Version]
  62. Korajkic, A.; McMinn, B.R.; Harwood, V.J. Relationships between Microbial Indicators and Pathogens in Recreational Water Settings. Int. J. Environ. Res. Public Health 2018, 15, 2842. [Google Scholar] [CrossRef] [PubMed] [Green Version]
  63. Leclerc, H.; Mossel, D.A.A.; Edberg, S.C.; Struijk, C.B. Advances in the Bacteriology of the Coliform Group: Their Suitability as Markers of Microbial Water Safety. Annu. Rev. Microbiol. 2001, 55, 201–234. [Google Scholar] [CrossRef]
  64. Rompré, A.; Servais, P.; Baudart, J.; De-Roubin, M.R.; Laurent, P. Detection and Enumeration of Coliforms in Drinking Water: Current Methods and Emerging Approaches. J. Microbiol. Methods 2002, 49, 31–54. [Google Scholar] [CrossRef]
  65. Abbaszadegan, M.; Lechevallier, M.; Gerba, C. Occurrence of Viruses in US Groundwaters. J. Am. Water Works Assoc. 2003, 95, 107–120. [Google Scholar] [CrossRef]
  66. Locas, A.; Barthe, C.; Barbeau, B.; Carrière, A.; Payment, P. Virus Occurrence in Municipal Groundwater Sources in Quebec, Canada. Can. J. Microbiol. 2007, 53, 688–694. [Google Scholar] [CrossRef]
  67. Borchardt, M.A.; Bertz, P.D.; Spencer, S.K.; Battigelli, D.A. Incidence of Enteric Viruses in Groundwater from Household Wells in Wisconsin. Appl. Environ. Microbiol. 2003, 69, 1172–1180. [Google Scholar] [CrossRef] [Green Version]
  68. Marrero-Ortiz, R.; Riley, K.R.; Karpiscak, M.K.; Gerba, C. Groundwater Quality of Individual Wells in Small Systems in Arizona. J. Am. Water Work. Assoc. 2009, 101, 89–100. [Google Scholar] [CrossRef]
  69. Jang, J.; Hur, H.G.; Sadowsky, M.J.; Byappanahalli, M.N.; Yan, T.; Ishii, S. Environmental Escherichia coli: Ecology and Public Health Implications-A Review. J. Appl. Microbiol. 2017, 123, 570–581. [Google Scholar] [CrossRef] [Green Version]
  70. United States Environmental Protection Agency. Ambient Water Quality Criteria for Bacteria EPA440/5-84-002; United States Environmental Protection Agency: Washington, DC, USA, 1986.
  71. United States Environmental Protection Agency. Final Water Quality Standards Bacteria Rule for Coastal and Great Lakes Recreation Waters; Final Rule; United States Environmental Protection Agency: Washington, DC, USA, 2004.
  72. United States Environmental Protection Agency. Microbial Source Tracking Guide Document; United States Environmental Protection Agency: Cincinnati, OH, USA, 2005.
  73. Balière, C.; Rincé, A.; Blanco, J.; Dahbi, G.; Harel, J.; Vogeleer, P.; Giard, J.C.; Mariani-Kurkdjian, P.; Gourmelon, M. Prevalence and Characterization of Shiga Toxin-Producing and Enteropathogenic Escherichia coli in Shellfish-Harvesting Areas and Their Watersheds. Front. Microbiol. 2015, 6, 1356. [Google Scholar] [CrossRef]
  74. Ecohydrologic Rehabilitation of Recreational Reservoirs “Arturowek” (Łódź) as a Model Approach to Rehabilitation of Urban Reservoirs. Available online: http://arturowek.pl (accessed on 15 September 2021).
  75. Adaptation to Climate Change through Sustainable Management of Water of the Urban Area in Radom. Available online: http://life.radom.pl/ (accessed on 15 September 2021).
Figure 1. Position of the system in the catchment of the Struga Gnieźnieńska river.
Water 14 00239 g001
Figure 2. Overview of section A located on the pond and its segments: 1—sedimentation and biological activity segment—the place of application of the Micro-Dictum preparation; 2—filtration segment with wicker gabions and mineral filter; 3—plant biofilter segment with the applied denitrification deposit (the segments were described in detail in the beginning of Section 2.2).
Water 14 00239 g002
Figure 3. Overview of section B located on the Struga Gnieźnieńska watercourse with the following segments: 1—sedimentation and biological activity segment—the place of application of the Micro-Dictum preparation; 2—filtration segment with stone gabions and mineral filter; 3—denitrification and slow flow segment with the applied denitrification deposit (the segments were described in detail in the beginning of Section 2.2).
Water 14 00239 g003
Figure 4. Structural and biotic elements of the SED-BIO system: (A)—a wicker gabion on a drained pond (section A); (B)—floats with a mineral filter, (C)—two wicker gabions with a mineral filter between them (section A); (D)—view of section B; (E)—specially prepared mattresses with denitrification deposit; (F)—Micro-Dictum preparation; (G)—wreaths of submerged plants specially prepared for planting; (H)—planted Typha and Glyceria in the littoral zone (section A).
Water 14 00239 g004
Figure 5. Location of sections and individual elements of the SED-BIO system and monitoring points.
Water 14 00239 g005
Figure 6. Variation in the number of E. coli cells in the SED-BIO system in the test period April–November 2016. The results are shown as MPN (most probable number) in 100 mL.
Water 14 00239 g006
Figure 7. Variability of the number of coliform bacteria in the SED-BIO system in the test period April–November 2016. The results are shown as MPN (most probable number) in 100 mL.
Water 14 00239 g007
Figure 8. Efficiency of the SED-BIO system in reducing the number of E. coli cells. A decrease in the number in point 4 (outlet) in relation to point 2a (sedimentation segment). The result is shown as a percentage.
Water 14 00239 g008
Figure 9. Reduction of coliform cells in the final point 4 of SED-BIO in relation to the sedimentation segment (point 2a). The results are shown as a percentage.
Water 14 00239 g009
Table 1. Characteristics of the physical parameters of water flowing through the SED-BIO system. Different letters mean a significant difference between control sites for each parameter in the Wilcoxon signed-rank test with p < 0.05, n = 36.
Parameters/Control Point12b34
Temperature [°C]11.11 A11.79 A11.95 A11.79 A
(Min.–Max.)(2.70–20.30)(0.40–21.30)(0.90–24.00)(0.80–23.40)
pH 8.00 A7.92 A7.88 B7.83 B
(Min.–Max.)(6.17–9.40)(5.39–8.59)(6.32–8.45)(6.61–8.47)
DO [mg·L−1]9.74 A10.29 A8.11 B8.50 B
(Min.–Max.)(4.22–13.78)(3.25–20.00)(2.02–20.00)(1.21–20.00)
SPC [μS·cm−1]1010 A960 A970 B960 C
(Min.–Max.)(720–1220)(720–1300)(710–1280)(660–1290)
A, B … other letters mean that the averages are significantly different.
Table 2. Characteristics of the concentration of nutrients in water which flows through the SED-BIO system. Different letters mean a significant difference between control sites for each parameter in the Wilcoxon signed-rank test with p < 0.05, n = 36.
Parameters/Control Point12b34
N-NO3 [mg·L−1] 3.33 A1.63 B1.38 C1.24 D
(Min.–Max.)(1.36–9.76)(0.01–7.10)(0.02–6.16)(0.01–5.65)
N-NH4+ [mg·L−1] 0.44 AB0.29 B0.30 B0.42 A
(Min.–Max.)(0.00–1.77)(0.00–0.66)(0.00–0.97)(0.00–1.15)
PO43− [mg·L−1] 0.70 A0.52 B0.55 B0.55 B
(Min.–Max.)(0.02–2.06)(0.00–2.29)(0.00–2.04)(0.00–2.48)
A, B … other letters mean that the averages are significantly different.
Table 3. Average loads of nutrients on the inflow to and outflow from the SED-BIO system.
ParameterInflow–Outflow Average Load
[% Change] for the Whole Research Period
Discharge Year Inflow–Outflow Average Load
[% Change] for Each Discharge Year
Phosphates
[kg PO43−·year]
655.6–529.3
[19.3% **]
2016/17509.0–311.3
[38.8%]
2017/18748.3–610.3
[18.4% *]
2018/19709.5–666.3
[6.1%]
Nitrates—nitrogen
[kg N-NO3·year]
3395.8–1233.2
[63.7% **]
2016/174089.4–1247.9
[69.5% **]
2017/183767.1–1765.1
[53.1% **]
2018/192330.7–686.5
[70.5% **]
Ammonium—nitrogen
[kg N-NH3·year]
354.4–301.5
[14.9%]
2016/17407.1–311.0
[23.6%]
2017/18354.3–305.3
[13.8%]
2018/19301.8–288.1
[4.5%]
* significant with p < 0.05. ** significant with p < 0.01.
Table 4. The amount of phytoplankton (based on the concentration of chlorophyll A and the presence of cyanobacteria and their toxins (microcystins), in specific control points on the Struga Gnieźnieńska (1), in the biofiltration segment in the pond (2b) and behind the SED-BIO system (4), in the year 2016.
Sampling DateSampling PointPhytoplanktonGenesMicrocystins Toxicity (PPIA)
16S rRNAmcyE
CyanobacteriaToxigenic Genotypes
[µg·L−1]258 bp405 bp[µg·L−1]
21 July 2016160.37++2.71
2b116.03++2.62
4108.17+n/a
3 August 2016111.07+n/a
2b246.88+n/a
4116.68+n/a
23 August 201616.32+n/a
2b16.44+n/a
462.87++<0.25
6 September 201617.34+n/a
2b13.16++<0.25
427.20+n/a
26 September 201611.86+n/a
2b50.48++<0.25
438.82+n/a
17 October 201612.83+n/a
2b3.63+n/a
43.55n/a
7 November 201616.60++<0.25
2b16.22+n/a
415.47+n/a
n/a—not analyzed because no potential for microcystin production was detected; <0.25—below the threshold microcystin concentration detected by PPIA (protein phosphatase inhibition assay).
Table 5. The range of abundance of fecal indicator bacteria in different sampling points of the SED-BIO system. MPN—most probable number of cells in 100 mL.
Sampling Point
in SED-BIO
Abundance of Coliforms
(MPN·100 mL)
Abundance of
E. coli
(MPN·100 mL)
11.3 × 10³–9.2 × 1035.2 × 10–9.3 × 10²
2a6.5 × 102–2.4 × 1047.2 × 10–1.7 × 10³
39.3 × 10²–1.1 × 1041.0 × 10–4.0 × 10²
44.3 × 10²–8.7 × 1031.0 × 10–7.3 × 10²
Publisher’s Note: MDPI stays neutral with regard to jurisdictional claims in published maps and institutional affiliations.

