
How to Implement User-Friendly BLMs in the Absence of DOC Monitoring Data: A Case Study on Bulgarian Surface Waters


1
Chair of Water Supply, Sewerage, Water and Wastewater Treatment, Faculty of Hydraulic Engineering, University of Architecture, Civil Engineering and Geodesy, 1 Hr. Smirnenski Blvd., 1046 Sofia, Bulgaria
2
Chair of Analytical Chemistry, Faculty of Chemistry and Pharmacy, Sofia University St. Kliment Ohridski, 1 J. Bourchier Blvd., 1164 Sofia, Bulgaria
*
Author to whom correspondence should be addressed.
Water 2022, 14(2), 246; https://doi.org/10.3390/w14020246
Submission received: 28 November 2021
/
Revised: 5 January 2022
/
Accepted: 13 January 2022
/
Published: 15 January 2022
(This article belongs to the Special Issue Insights into Organic Carbon, Iron, Metals and Phosphorus Dynamics in Freshwaters)
Abstract
:The metal bioavailability concept is implemented in the Water Framework Directive (WFD) compliance assessment. The bioavailability assessment is usually performed by the application of user-friendly Biotic Ligand Models (BLMs), which require dissolved metal concentrations to be used with the “matching” data of the supporting physicochemical parameters of dissolved organic carbon (DOC), pH and Cadissolved. Many national surface water monitoring networks do not have sufficient matching data records, especially for DOC. In this study, different approaches for dealing with the missing DOC data are presented: substitution using historical data; the appropriate percentile of DOC concentrations; and combinations of the two. The applicability of the three following proposed substitution approaches is verified by comparison with the available matching data: (i) calculations from available TOC data; (ii) the 25th percentile of the joint Bulgarian monitoring network DOC data (measured and calculated by TOC); and (iii) the 25th percentile of the calculated DOC from the matching TOC data for the investigated surface water body (SWB). The application of user-friendly BLMs (BIO-MET, M-BAT and PNEC Pro) to 13 surface water bodies (3 reservoirs and 10 rivers) in the Bulgarian surface waters monitoring network outlines that the suitability of the substitution approaches decreases in order: DOC calculated by TOC > the use of the 25th percentile of the data for respective SWB > the use of the 25th percentile of the Bulgarian monitoring network data. Additionally, BIO-MET is the most appropriate tool for the bioavailability assessment of Cu, Zn and Pb in Bulgarian surface water bodies.
1. Introduction
The determination of metal species and their bioavailability depends crucially on Dissolved Organic Matter (DOM). The presence of DOM is specified as a Dissolved Organic Carbon (DOC) concentration, contrary to Natural Organic Matter (NOM), which is a collective organic component of water. NOM is a complex mixture of leaf litter, organic acids, proteins and many more complex organic molecules. The Total Organic Matter (TOM) constitutes Particulate Organic Matter (POM) and DOM. The organic carbon results of unfiltered samples are reported as Total Organic Carbon (TOC) and samples filtered through a 0.45 µm filter are reported as DOC. Both results equal the mass of carbon present in the mixture of organic compounds in the raw water/filtrate [1]. Sometimes TOC is reported instead of DOC, but it should be stressed that the DOC concentration will always be less than the concentration of TOC. DOC generally accounts for about 50% of DOM in typical surface water bodies and is in the range between 1 and 15 mg/L. DOC mainly comprises humic substances of natural origin, which is formed as a result of the breakdown of plant and animal tissues by chemical and biological processes or from anthropogenic sources [2].
The bioavailability of Cu, Ni and Zn depends on DOC concentrations [3,4,5], with higher concentrations of DOC resulting in reduced toxicity. Evidence suggests that the pH also has a significant impact on metal bioavailability and toxicity in aquatic environments [6,7]. Major cations (Ca2+, Na+, K+ and Mg2+) can also protect aquatic organisms against free metals by competing on the biotic binding sites, e.g., fish gills [8]. The presence of dissolved Fe and Al can affect the binding of the abovementioned metals to DOC due to their very high affinity for complexation by DOC. In such conditions, the availability of binding sites for the less strongly bound metals is reduced, resulting in an increase in their bioavailability for aquatic organisms. Normally, bodies of water that are high in Fe and Al are associated with a lower water pH (6.5–7.5), under which conditions both metals form insoluble precipitates.
DOC is a composite parameter for a heterogeneous mixture of polyfunctional polymers and contains functional groups (ligands) that bind free metal ions (the most toxic inorganic metal fraction) to reduce the interaction between free metal ions and aquatic organisms [9]. Discharge derived DOC (such as sewage effluents) is likely to be of a different composition to natural DOC and comprises proteins, amino acids, polysaccharides and synthetic chelating agents, such as ethylenediamine tetra acetic acid (EDTA). The current evidence base suggests that this latter type of DOC has a much greater capacity for binding metals compared with similar concentrations of naturally sourced DOC [10]. In bodies of water with low pH, DOM–metal complexes are weaker, resulting in a release of bioavailable ions and, therefore, an increase in the toxicity of the metal to aquatic organisms [11]. Taking DOM binding into account, the effect of considering bioavailability in environmental quality standards (EQSbioavailable) [12] has been assessed by the use of user-friendly biotic ligand models (BLMs), which has been proposed as a tool for regulating agencies. In the Netherlands, the assessment of bioavailability is incorporated into policy documents [13]. Feasibility studies on the implementation of a bioavailability-based approach for metals have been undertaken by several member states [14,15,16,17,18,19]. Guidance on how bioavailability may be incorporated into compliance assessments, classifications and local risk assessments is included in the recent EU Technical Guidance for deriving Environmental Quality Standards (EQS) under the European Water Framework Directive (WFD) [20].
High-quality surface water monitoring data provide tools for the assessment of potential risks to aquatic species. Obtaining such reliable data should follow the principles of surface water chemical monitoring under the WFD [21], including sampling, preservation and analysis [22]. The analytical methods for every analyte of interest should comply with the minimum performance requirements as stated in the QA/QC Directive [23]. A common implementation strategy of the WFD to achieve a good status and prevent any deterioration in the status (ecological and chemical) of European water bodies led to the development of methods for deriving EQSs to be used for the status assessment of surface water bodies (SWBs). Following these requirements, as a general prerequisite for WFD monitoring, EQS compliance assessment and subsequent decision-making are reliably achieved. An EQS is a limit for environmental disturbances, in particular from an ambient concentration of pollutants and wastes, which determines the maximum allowable degradation of environmental media. A water body cannot achieve a good chemical or ecological status if the EQS for any WFD Priority or Specific Substance is exceeded.
The compliance assessment follows a tiered approach, which: (i) compares the annual average concentration, calculated from monitoring data with the EQSbioavailable; (ii) uses user-friendly tools (based on Biotic Ligand Models) for the calculation of local metal bioavailability for a comparison between the measured dissolved metal concentration at a site and the EQS; and (iii) considers the local background concentrations of metals as a part of the EQS in the risk assessment [8]. The compliance assessment, which takes into account the bioavailability and uses simplified and user-friendly bioavailability tools (such as BLMs), requires that the concentration of dissolved metals (Cu, Zn, Ni, Pb and Mn) preferably be used along with data for the supporting physicochemical parameters of DOC, pH and dissolved Ca [24]. Due to temporal and spatial variations, data for all of the required input parameters (dissolved metal concentrations, dissolved Ca, DOC and pH) should ideally be “matched” to increase the reliability of the results. Without these, the simplified tools will either not run or not run reliably. The term “matched” means that the required input parameters are all determined in the same sample, obtained from the site of interest, to enable the identification of potential risks. A few of the member states (including Bulgaria) are just starting the implementation of bioavailability-based EQS and some of the required data are not fully available, especially for DOC, which is not routinely measured in Europe. In such cases, two approaches are possible when dealing with the missing DOC data: the use of historical monitoring data (e.g., data for similar and/or neighbouring catchment types) and the use of substitute data. Such approaches should be carefully chosen due to the quality of the available data—the dataset is likely to have been collected with inadequate sampling protocols, insufficient analytical sensitivity and LOQ, for a different purpose than the implementation of an EQS compliance assessment, with different sampling frequency, etc. [25,26]. Different approaches to estimating DOC have been proposed, including: UV absorbance [27,28]; colour measurements [29]; dissolved iron [30]; fluorescence measurements [31]; and a modifying factor that is dependent on the optical properties of DOC [32]. Any of the proposed approaches to estimating DOC should be based on locally derived empirical relationships and proven to be valid for the studied territory. Such data can be used for feasibility and screening assessments, but these need to be assessed on a case-by-case basis.
The present study aims to propose a methodology to the national environmental bodies for the implementation of BLM in compliance assessments when DOC data are missing. The methodology comprises a selection of appropriate substitute approaches, which are applicable for the environmental authorities and their validation, with the matching data using the three most widely used BLMs: BIO-MET; M-BAT; and PNEC Pro. In this manner, the metal bioavailability could be assessed using the most suitable pair of substitute approaches and a user-friendly BLM.
2. Materials and Methods
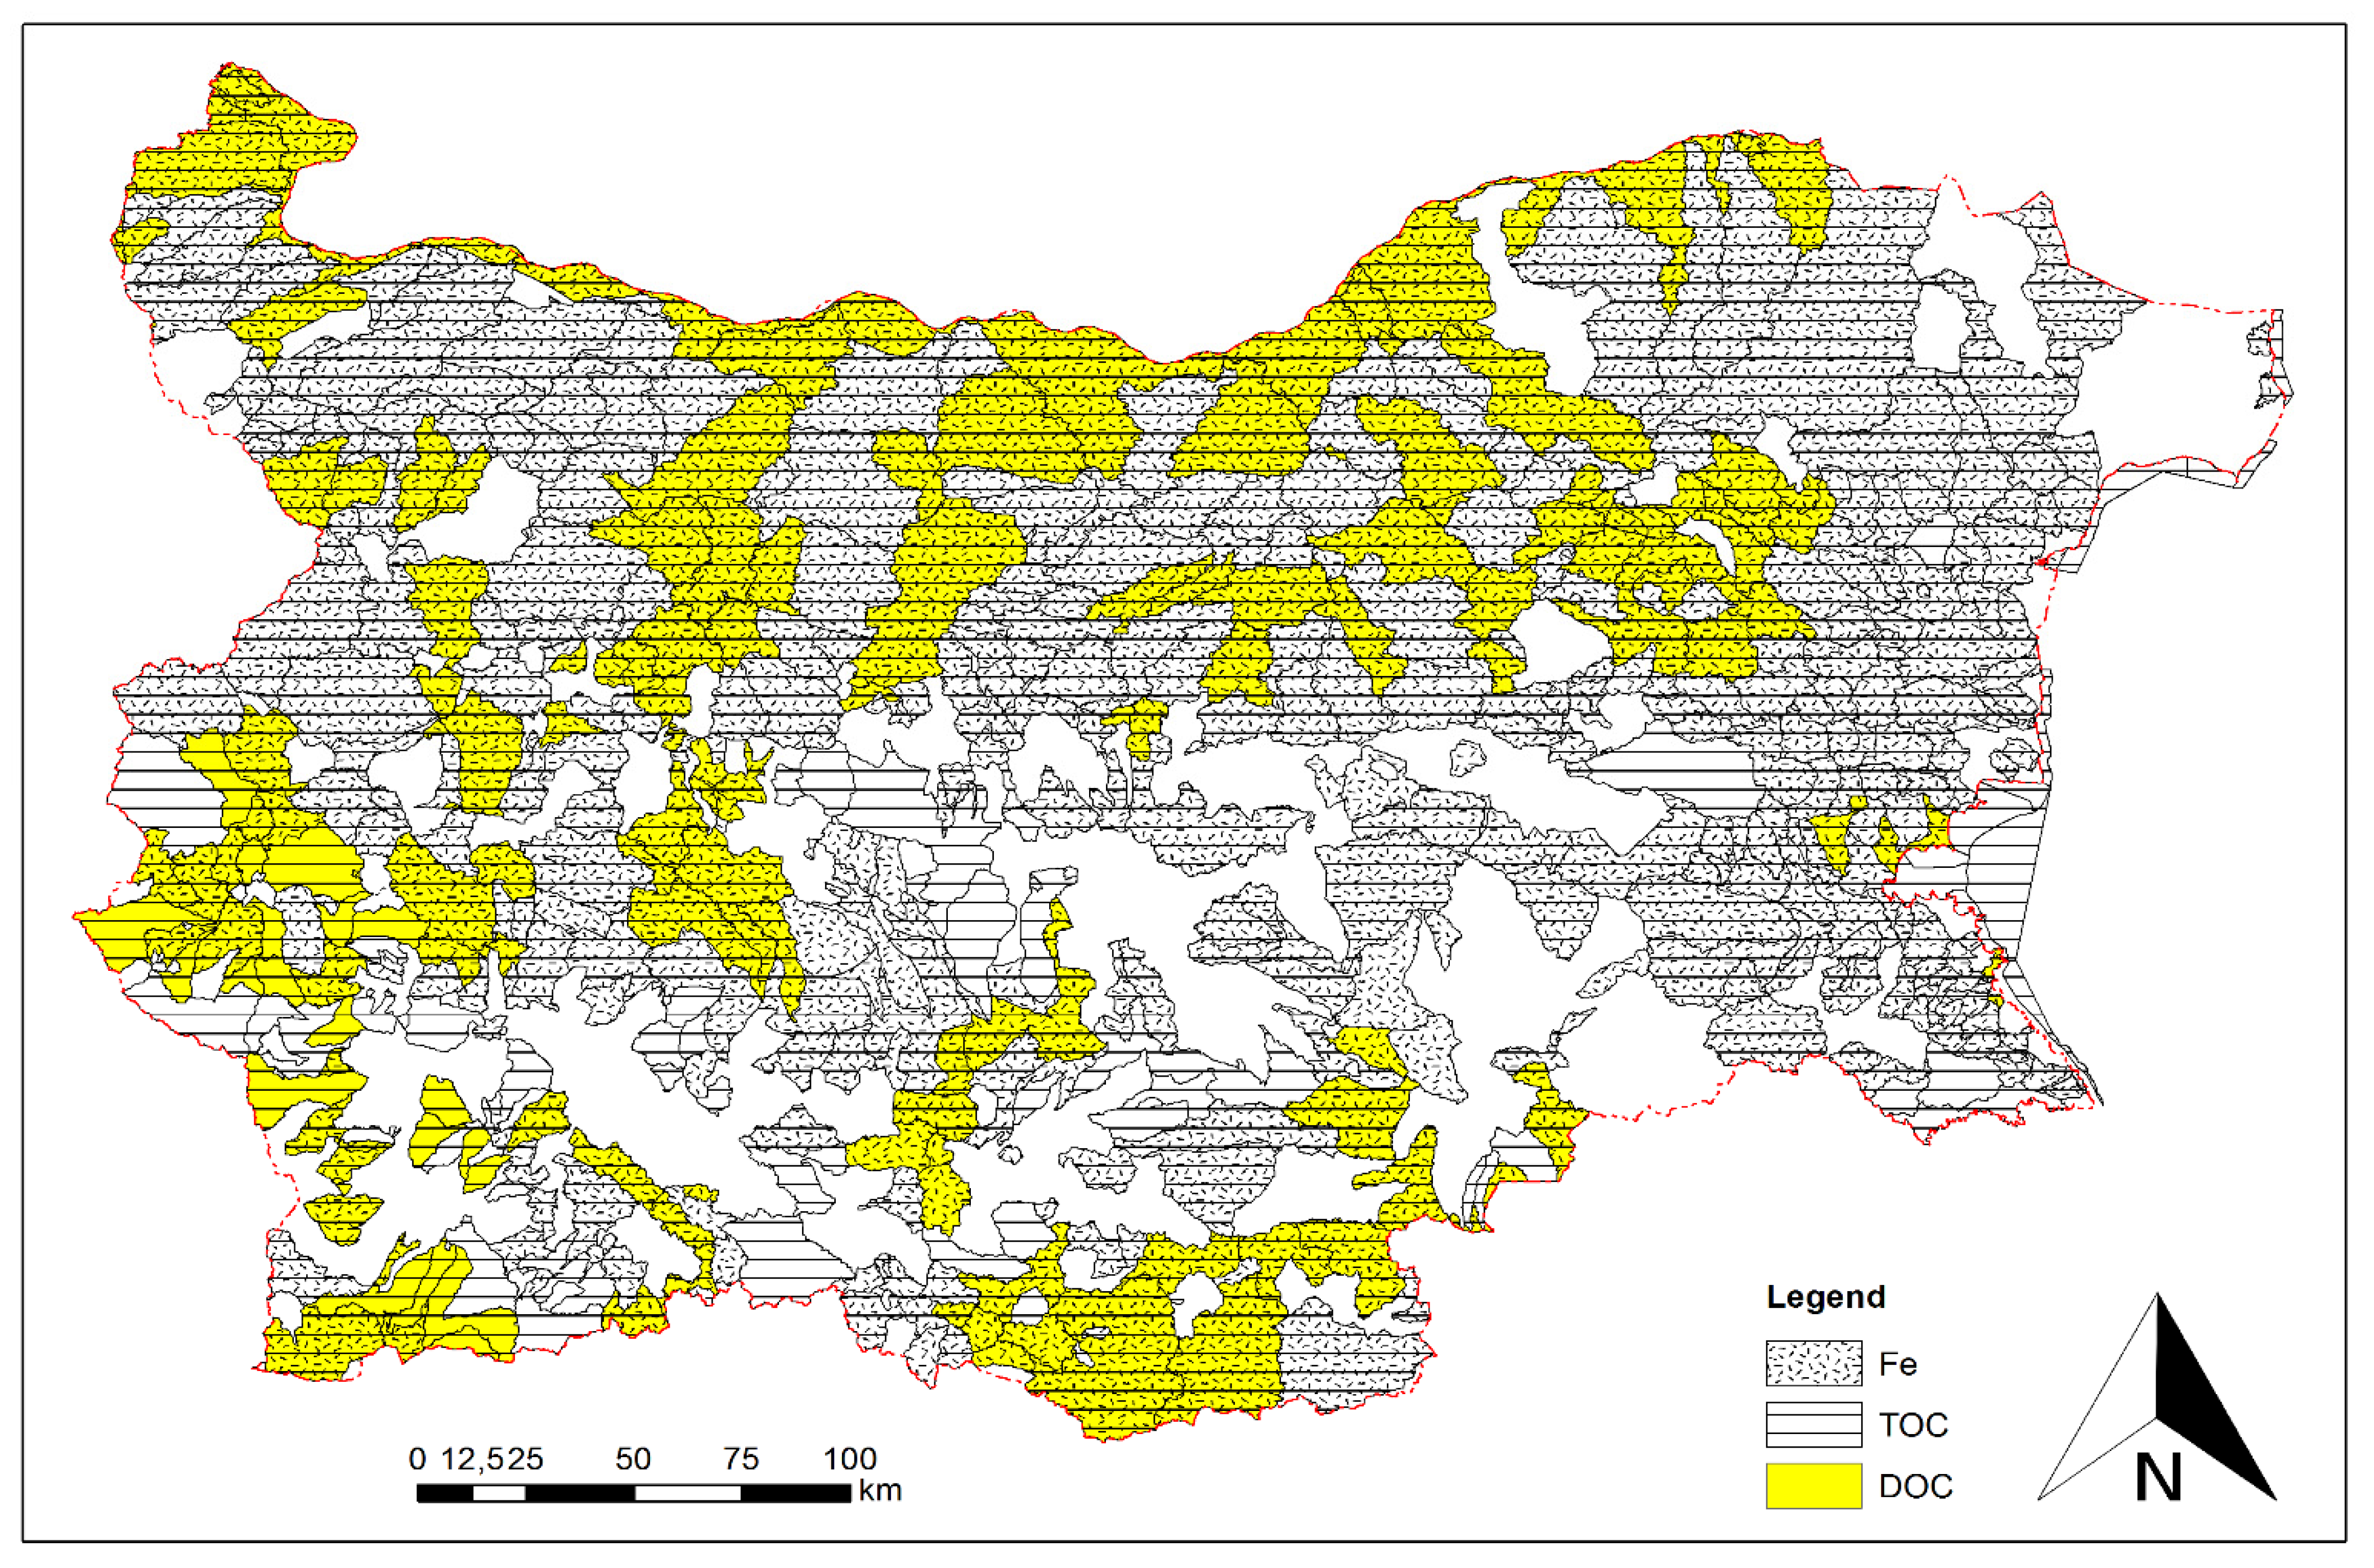
Data for the concentrations of DOC, Fedissolved and TOC were obtained by the Bulgarian Environmental Agency surface water monitoring programme. The database returned over 27,000 measurement results for around 950 SWBs for the period 1 January 2010–31 December 2020 (Figure 1).
The methods used by the different laboratories followed standardized procedures. For the determination of pH, EN ISO 10523:2012 was used; for Ca, EN ISO 14911:2002 and ISO 6058:2002 were used; for DOC and TOC, EN 1484:2001 was used, including one result for TOC that was obtained by EN ISO 6468:2006. Cu, Zn, Ni and Pb were measured using EN ISO 17294-2:2016. The basic statistics of the dataset are presented in Table 1. No outlier tests were performed and where the halved limit of quantitation (LOQ) data was presented (for either DOC, Fedissolved or TOC), the whole dataset was omitted. Where the calculated DOC/TOC ratio exceeded one, the concentrations were not used in the subsequent calculations.
User-friendly tools (based on the BLMs) were used in the metal bioavailability calculations. For the application of BIO-MET (https://bio-met.net/, last accessed 25 October 2021), M-BAT (https://www.wfduk.org, last accessed 25 October 2021) and PNEC Pro (http://www.pnec-pro.com/, last accessed 25 October 2021), data for the concentrations of pH, DOC, TOC and Cadissolved were obtained by the open data portal of the Bulgarian Environmental Agency surface water monitoring programme (https://data.egov.bg/data/view/9ee2ca78-051d-4ec8-b8f8-1a1e93ee637e, last accessed 25 October 2021). A total of 13 water bodies—3 reservoirs (Dospat Dam, Pchelina Dam and Iskar Dam) and 10 rivers (Strumeshnitsa, Mesta, Yantra, Dospat, Dragovishtitsa, Negovanka, Eleshnitsa, Struma, Rusenski Lom and Iskar) were used for the comparison during the implementation of the BLMs, and for which the matching datasets for DOC, TOC, pH, Ca, Cu, Zn, Ni and Pb were available for 2020.
3. Results
3.1. Substitutes for Missing DOC
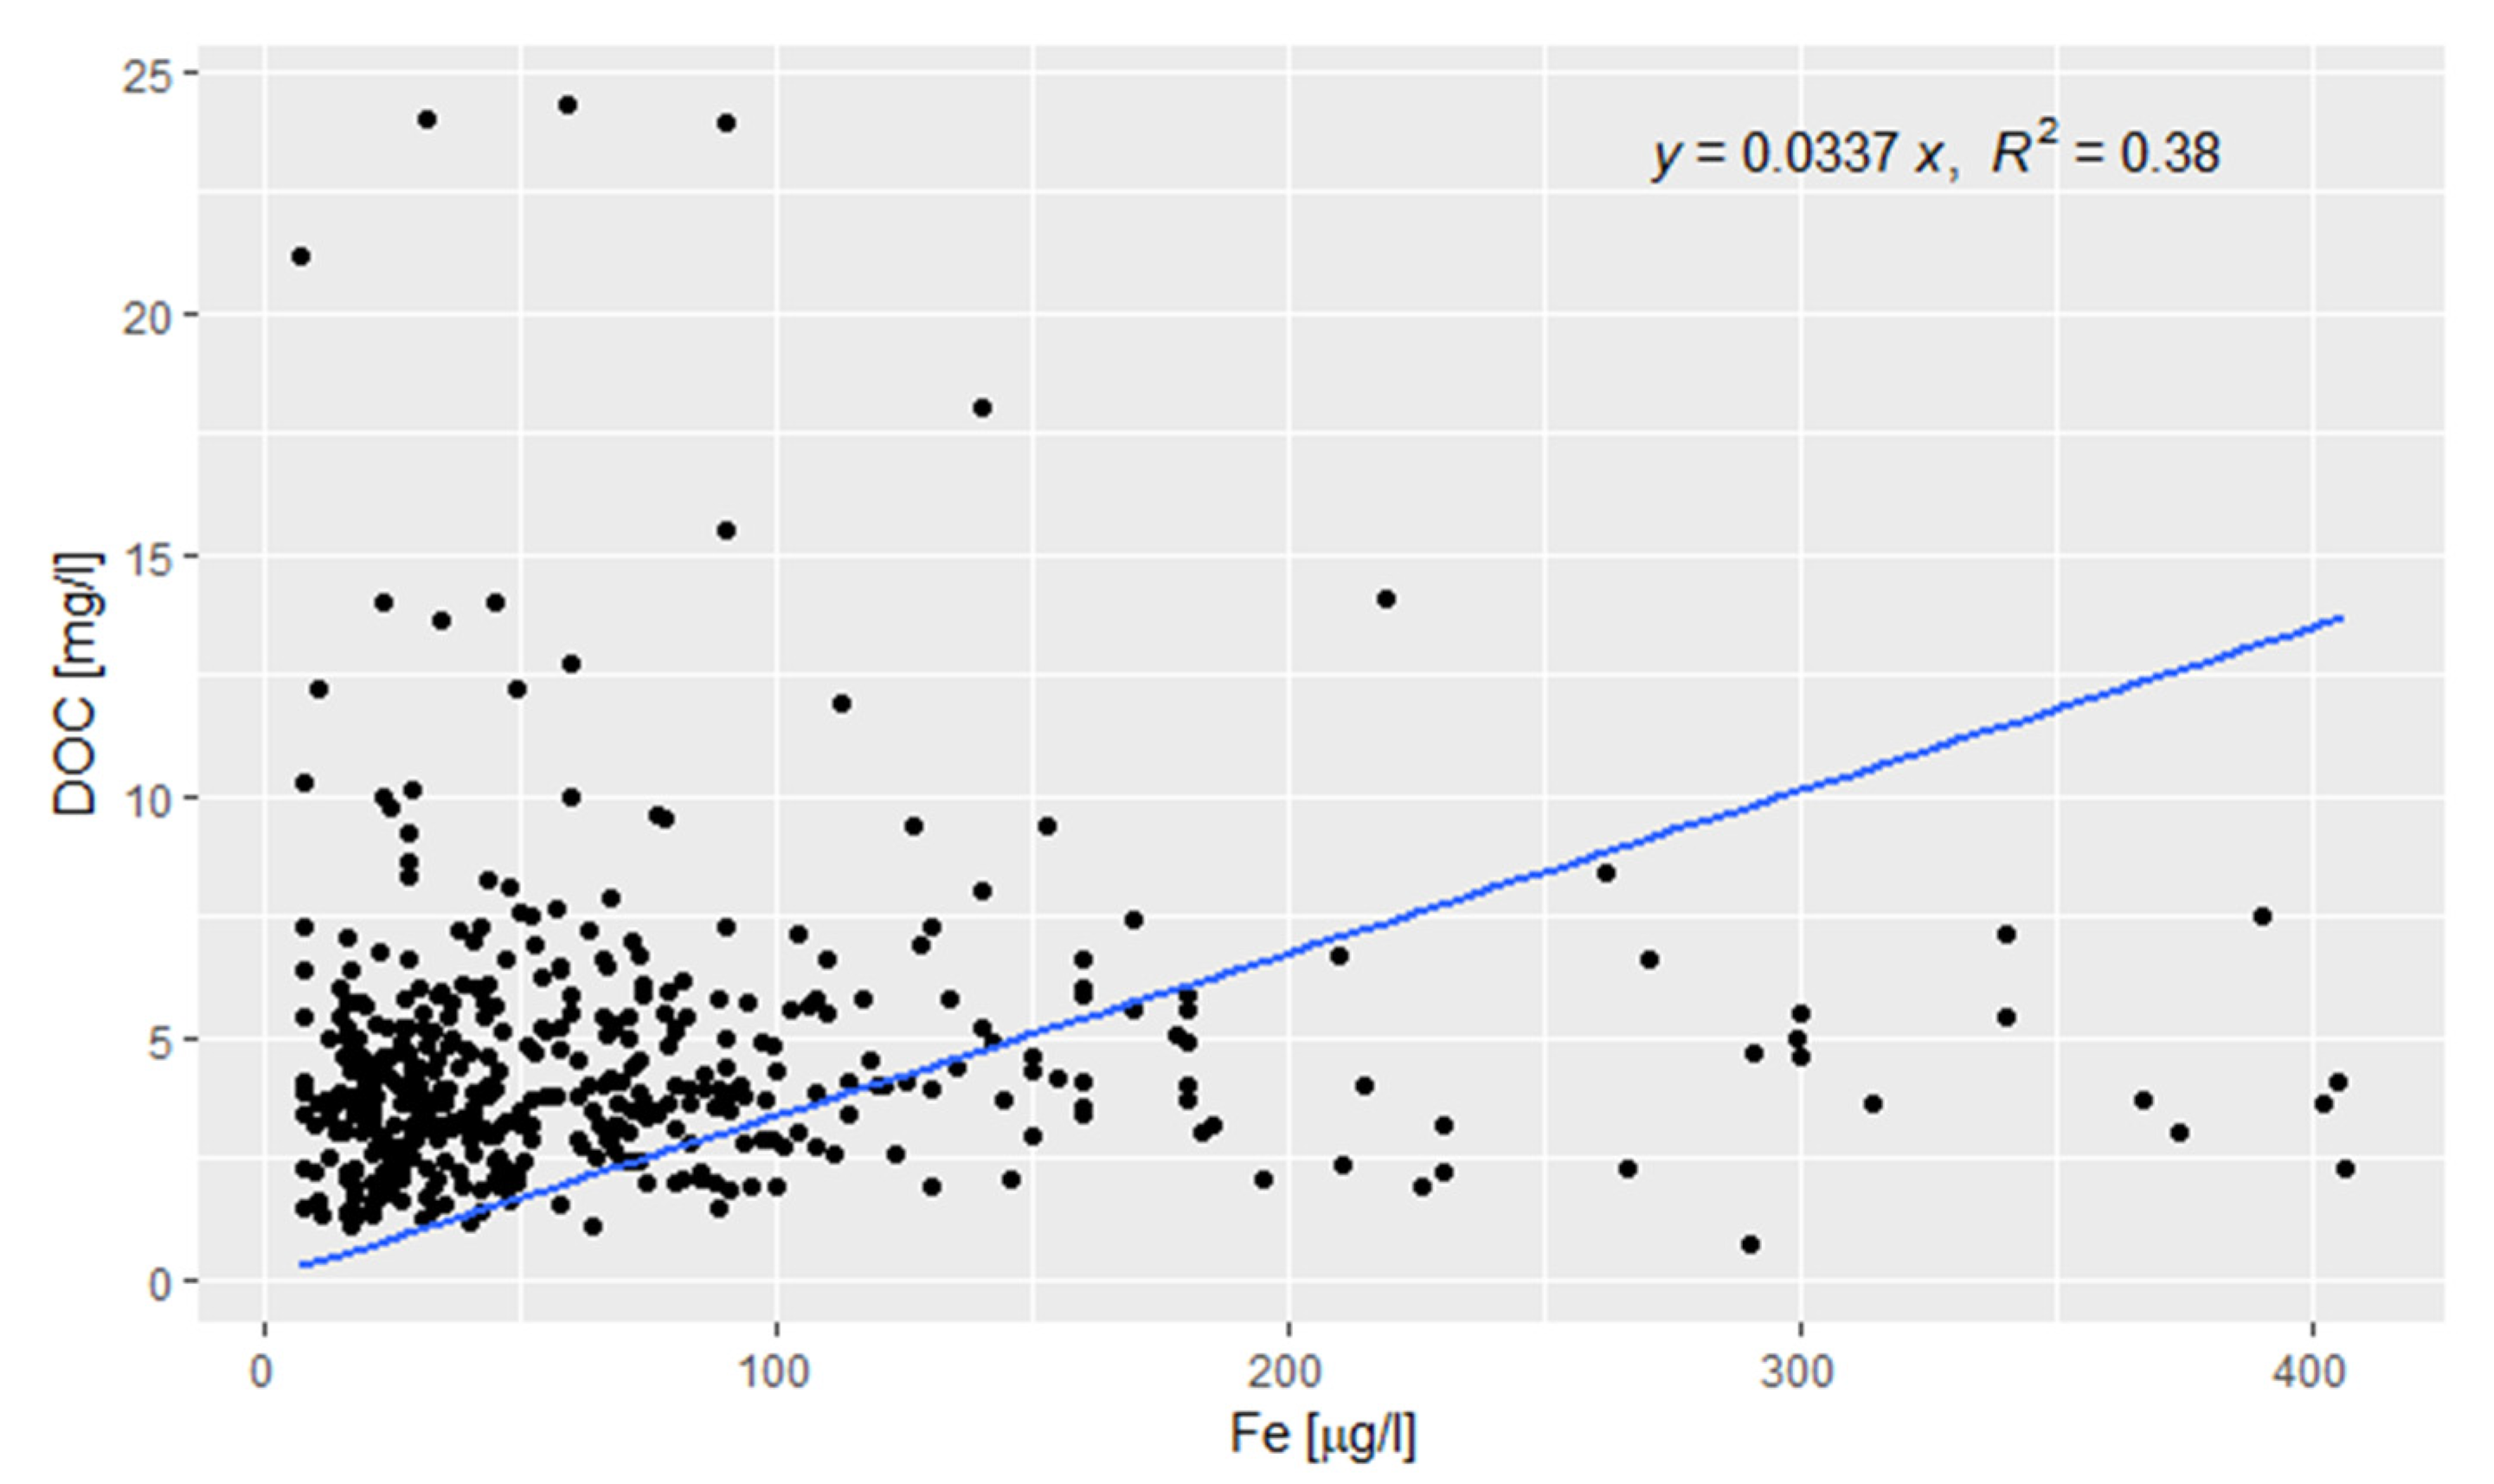
The Bulgarian Environmental Agency surface water monitoring programme revealed a total of 1829 measurement results for DOC for all monitored surface water bodies since 2010 and 13,234 measurement results for dissolved Fe. The “matching” of the data indicated 805 results for DOC and Fedissolved. Unfortunately, nearly half of the results could not be used for correlation between the parameters since most of the Fedissolved concentrations were reported as LOQ/2. The analysis showed a poor correlation (R2 = 0.38, n = 445) when “matched” data was used (Figure 2).
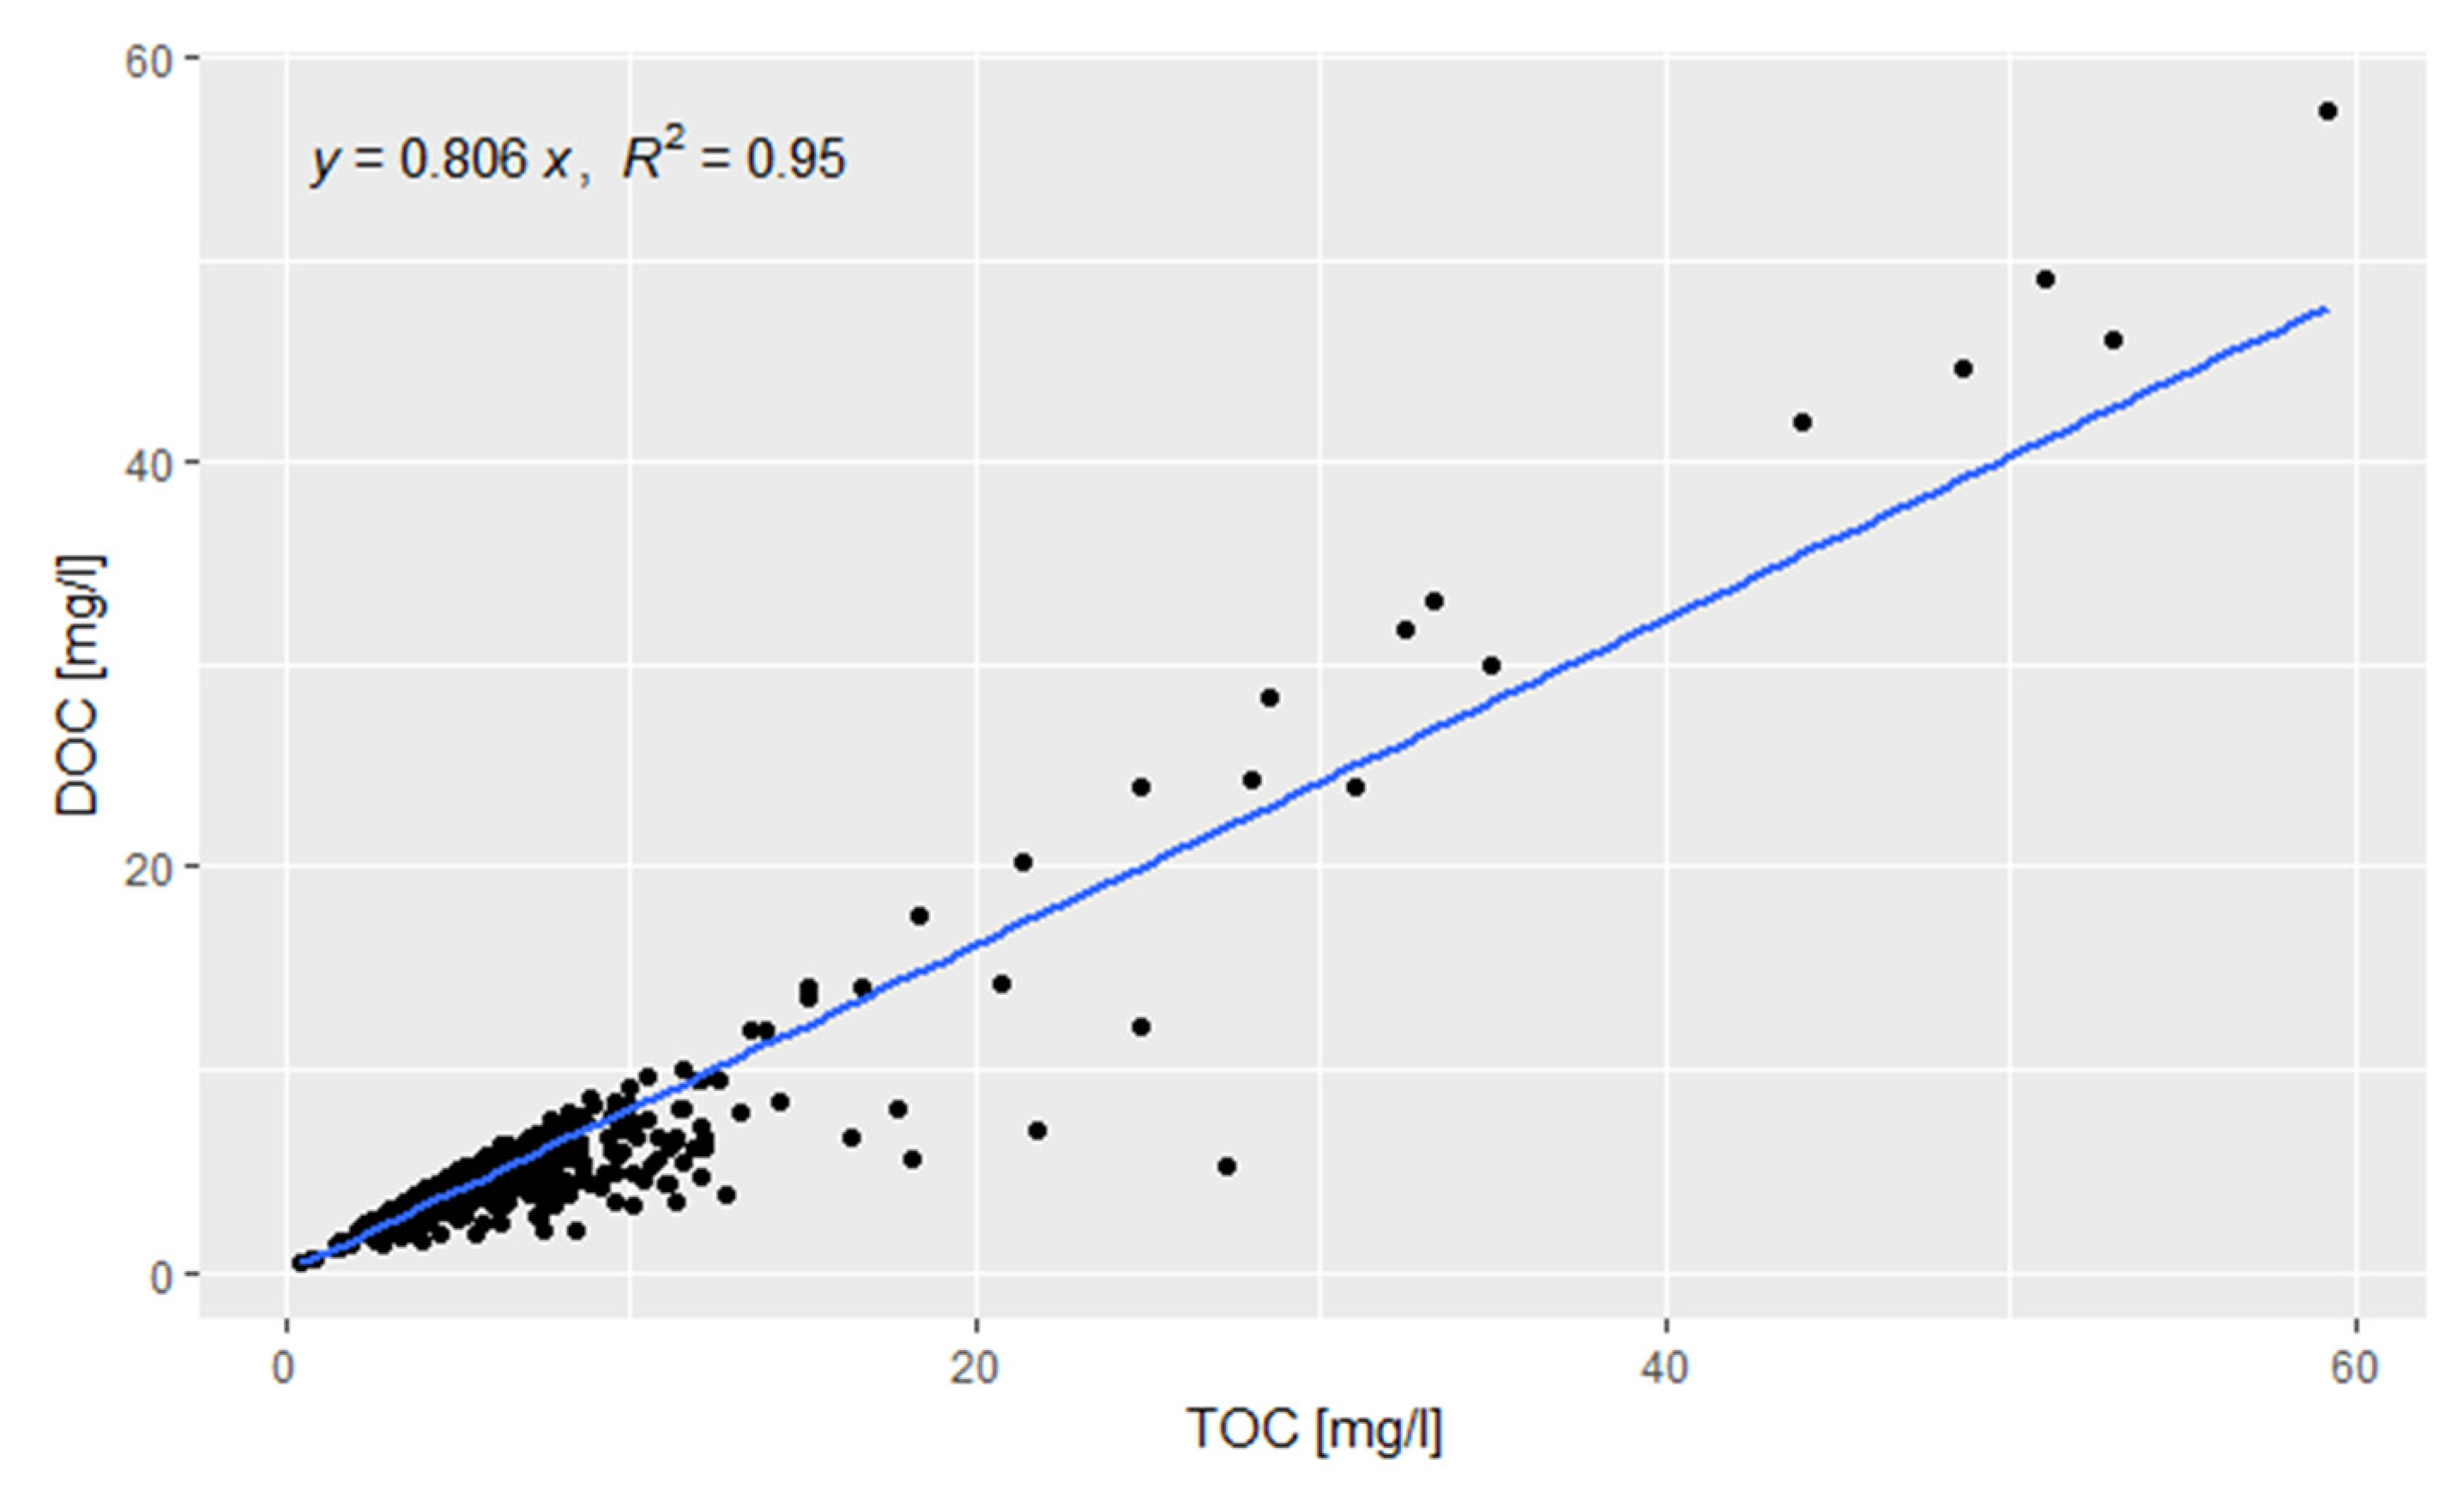
The Bulgarian Environmental Agency surface water monitoring programme contained 11,945 results for TOC concentrations in the 2010–2020 period. The “matching” data indicated 736 results for DOC and TOC. The analysis showed a significant correlation (R2 = 0.95, n = 736) when matched data was used (Figure 3) and a conversion factor DOC = 0.81 × TOC could be applied for missing DOC data.
3.2. Substitutes in the Absence of Matching Data
The UK [9] and France [18] have adopted an approach to use the 25th percentile of the DOC concentrations for estimating DOC when the matching data are unavailable. In this paper, the calculated DOC concentrations using the TOC data (DOC = 0.81 × TOC) was used as a substitute. Furthermore, the 25th percentile of the DOC concentrations (2.4 mg/L) from the Bulgarian DOC data obtained in 2020 (n = 1711) was used and compared with the results of the matching data. Additionally, the 25th percentile of the calculated DOC concentrations using the measured TOC concentration for the respective water body was used and compared with the results of the matching data.
3.3. Application of User-Friendly Models (BIO-MET, M-BAT and PNEC Pro) in Compliance Assessment
Following the tiered approach, the user-friendly BLMs were implemented on 13 water bodies (3 reservoirs and 10 rivers) with the available matching datasets for DOC, TOC, pH, Ca, Cu, Zn, Ni and Pb for 2020. The average annual concentrations that were calculated from the monitoring data were compared with the EQSbioavailable (1 μg/L for Cu, 4 μg/L for Ni, 8 μg/L for Zn and 1.2 μg/L for Pb), which was derived from the WFD [21] and national ordinance [33].
The results show 13 exceedances for Cu, 6 exceedances for Zn and 4 exceedances for Pb (Table 2). No exceedances of the average annual concentrations were observed for Ni, compared with the EQS.
When the average annual concentrations exceeded the EQS, the samples moved to the second tier where the Biotic Ligand Model-based tools (BIO-MET, M-BAT and PNEC Pro) were used for the calculation of local metal bioavailability and a comparison between the measured dissolved metal concentration at a site and the EQS was made. The DOC concentration played an important role in determining the bioavailable dissolved metal concentration.
For the calculations, the following data were used: the measured DOC concentrations; the calculated DOC from the matching TOC data (DOC = 0.81 × TOC); the 25th percentile (2.4 mg/L) of the DOC and calculated TOC for 2020 of all surface water bodies (n = 1711); and the 25th percentile of the calculated DOC from the matching TOC data for 2020 for each of the water bodies studied. An indication of whether there were exceedances was expressed as the Risk Characterization Ratio (RCR). If the RCR was lower than one, the site was considered as having “passed” the assessment and no further investigation was necessary. If the value of the RCR was greater than one, this indicated an exceedance of the EQS and led to a progression to Tier 3.
3.3.1. BLM Comparisons for Copper
The user-friendly BLM models were implemented for the 13 water bodies where the annual concentrations of Cu for 2020 exceeded the generic EQSbioavailable (1 μg/L). First, the BLM models were performed with the matching data (n = 63) for dissolved Cu, pH, dissolved Ca and DOC, and after that, the DOC values were substituted with: the calculated DOC from the available TOC data (DOC = 0.81 × TOC); the 25th percentile of the DOC data from the Bulgarian monitoring network results from 2020 (P25_BG); and by the 25th percentile of DOC data that was calculated from the TOC for the respective water body (P25_SWB), as described earlier. The calculated RCRs for all of the approaches are presented in the Supplementary Material (Figures S1–S3).
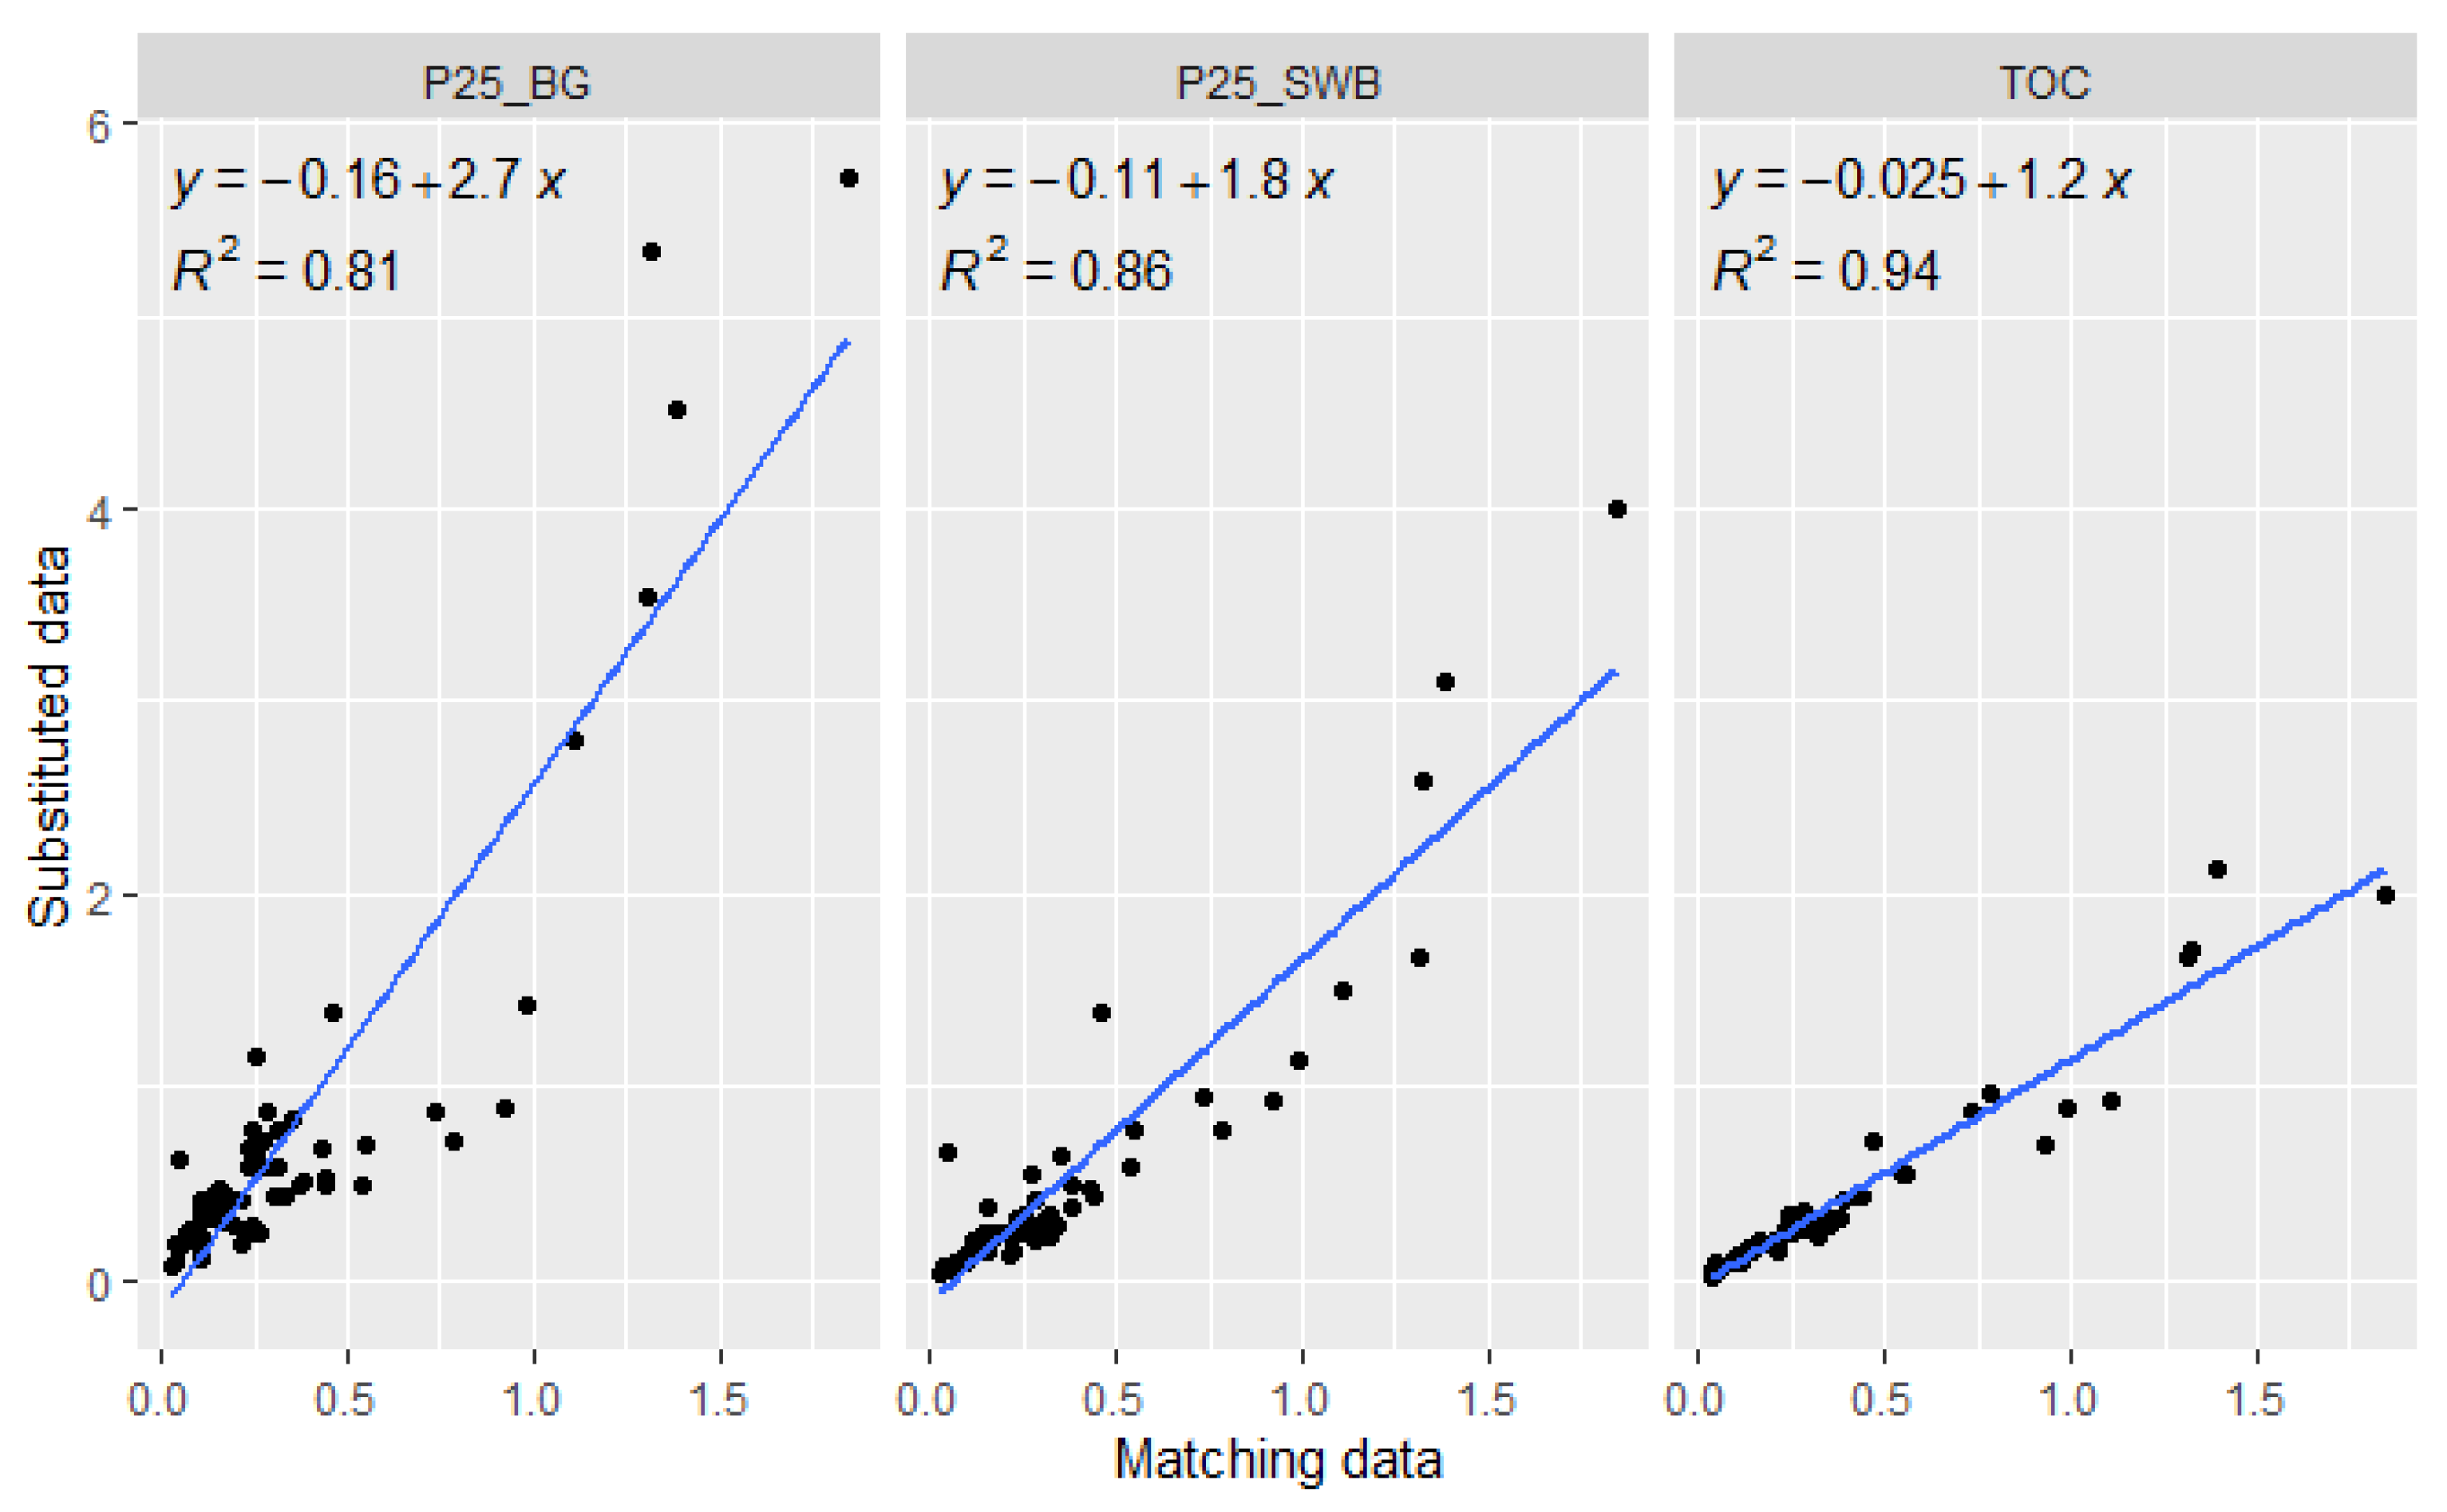
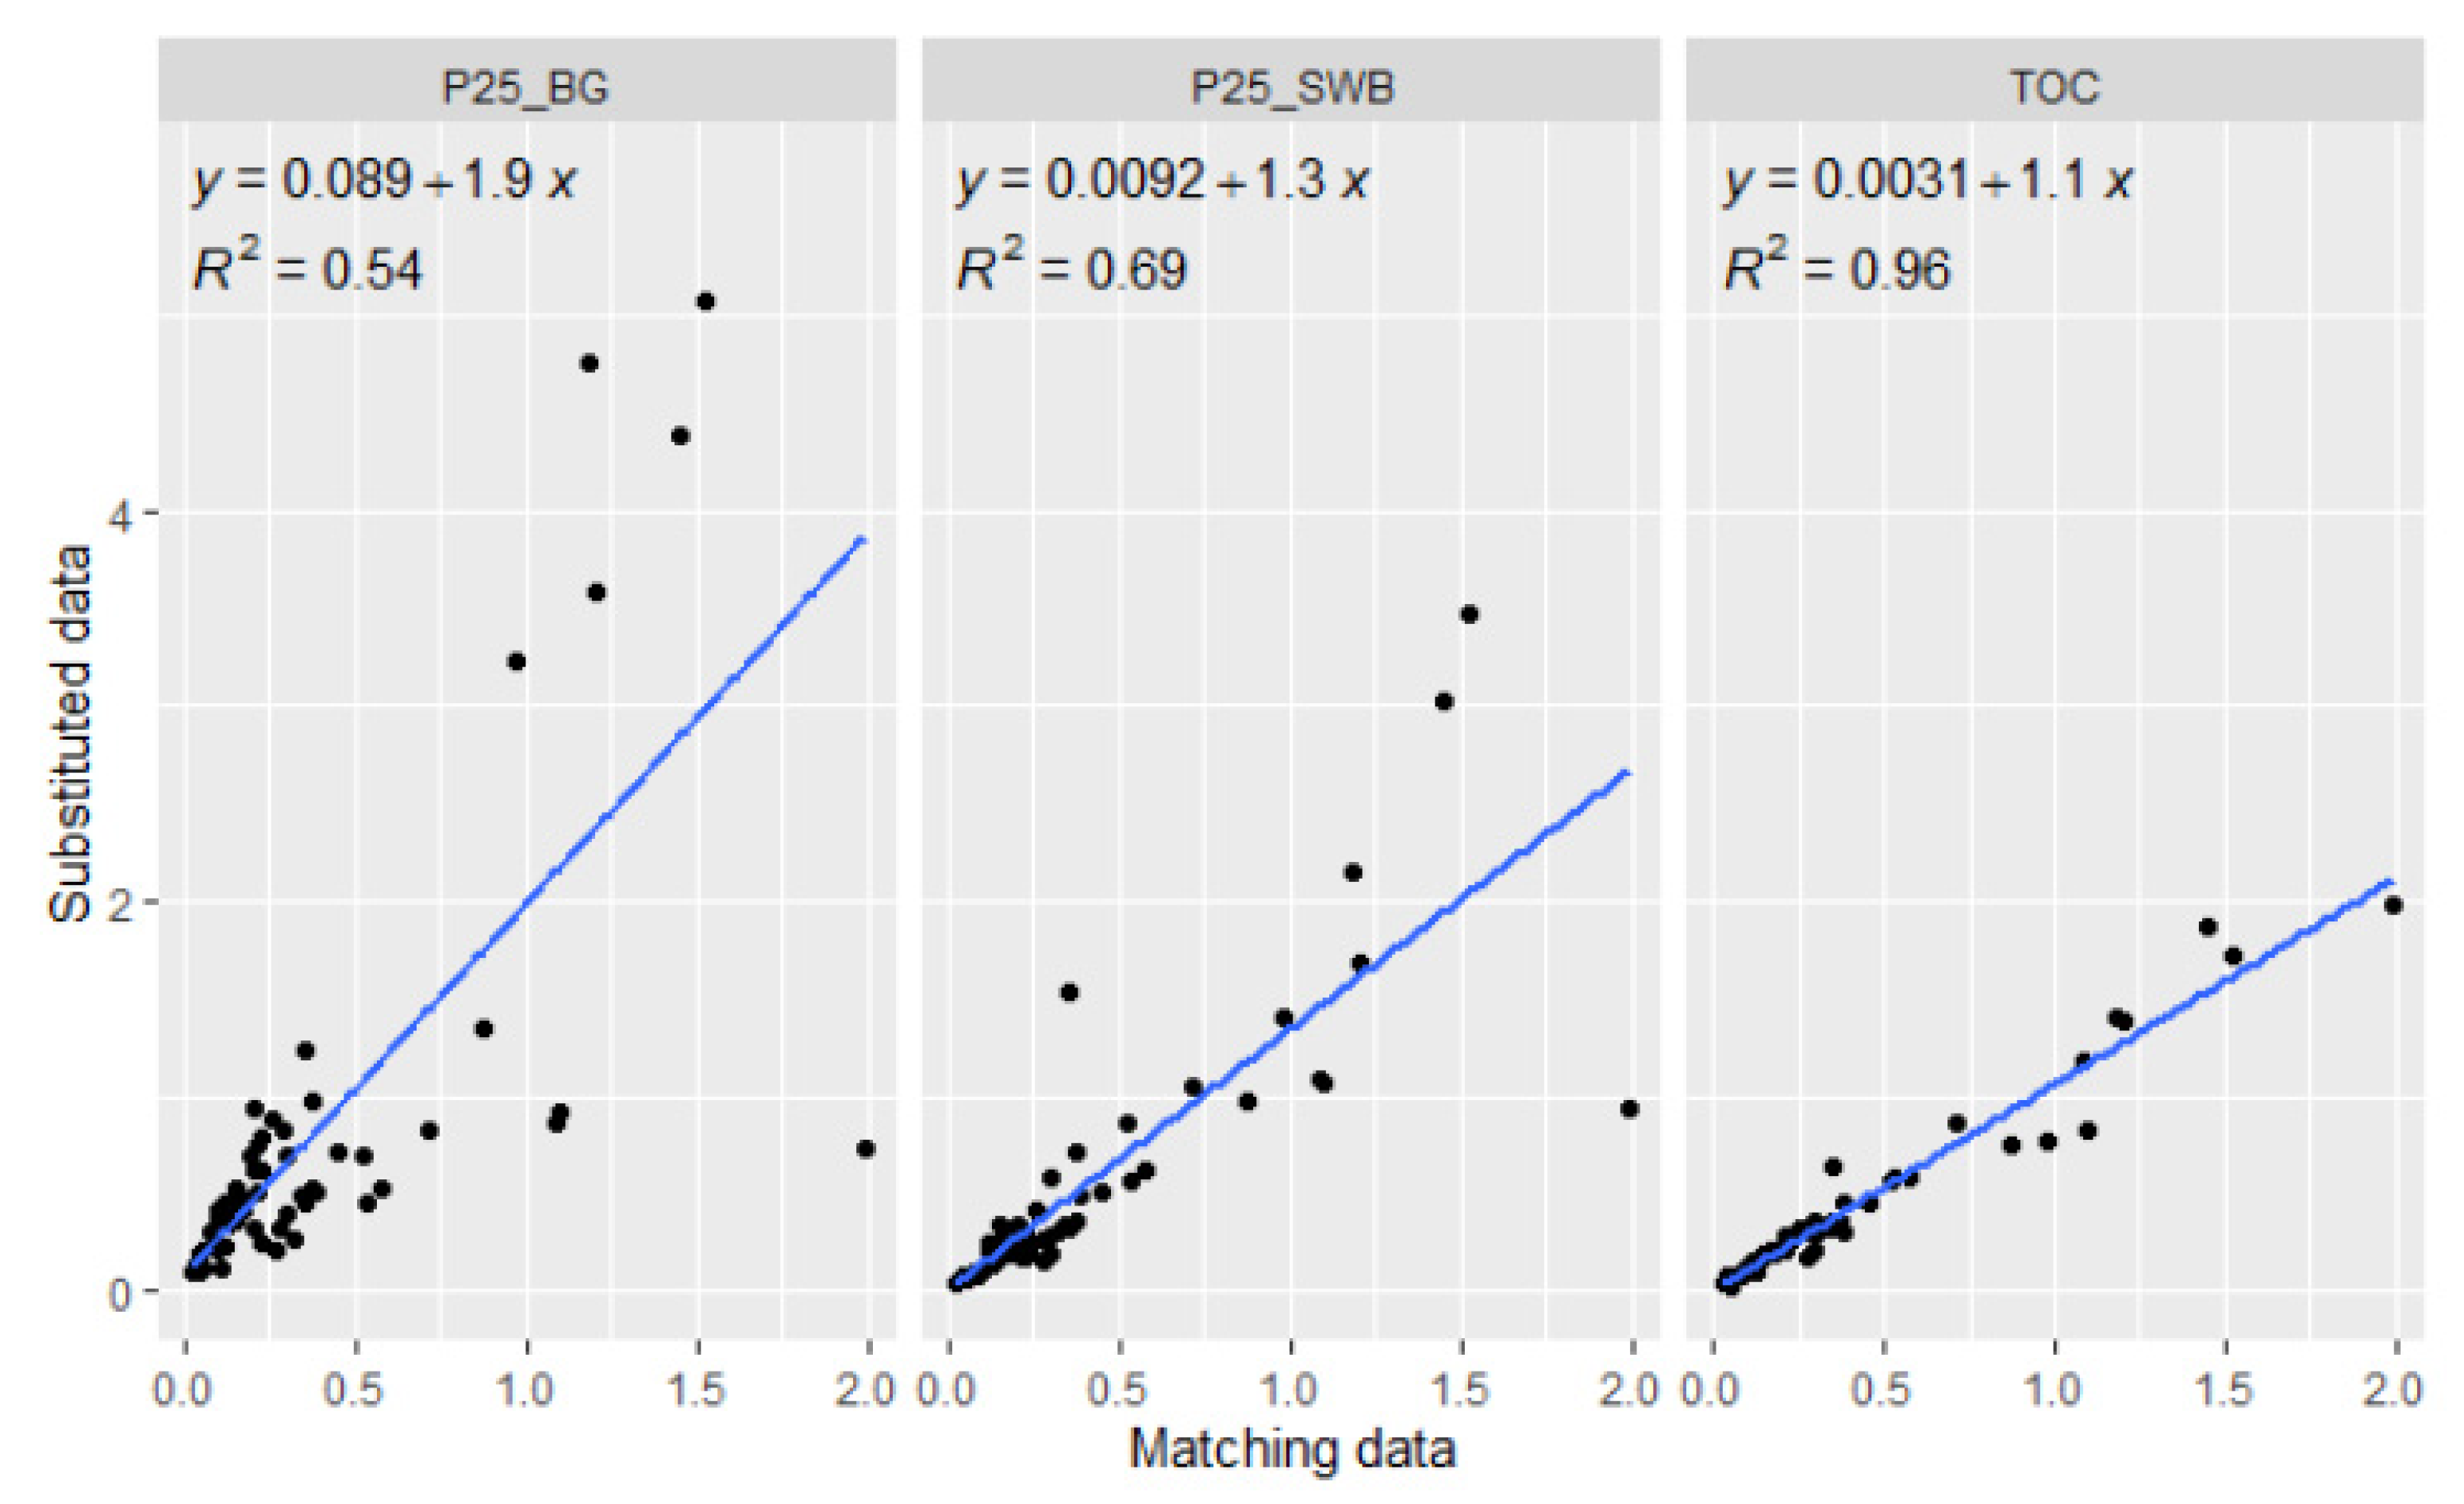
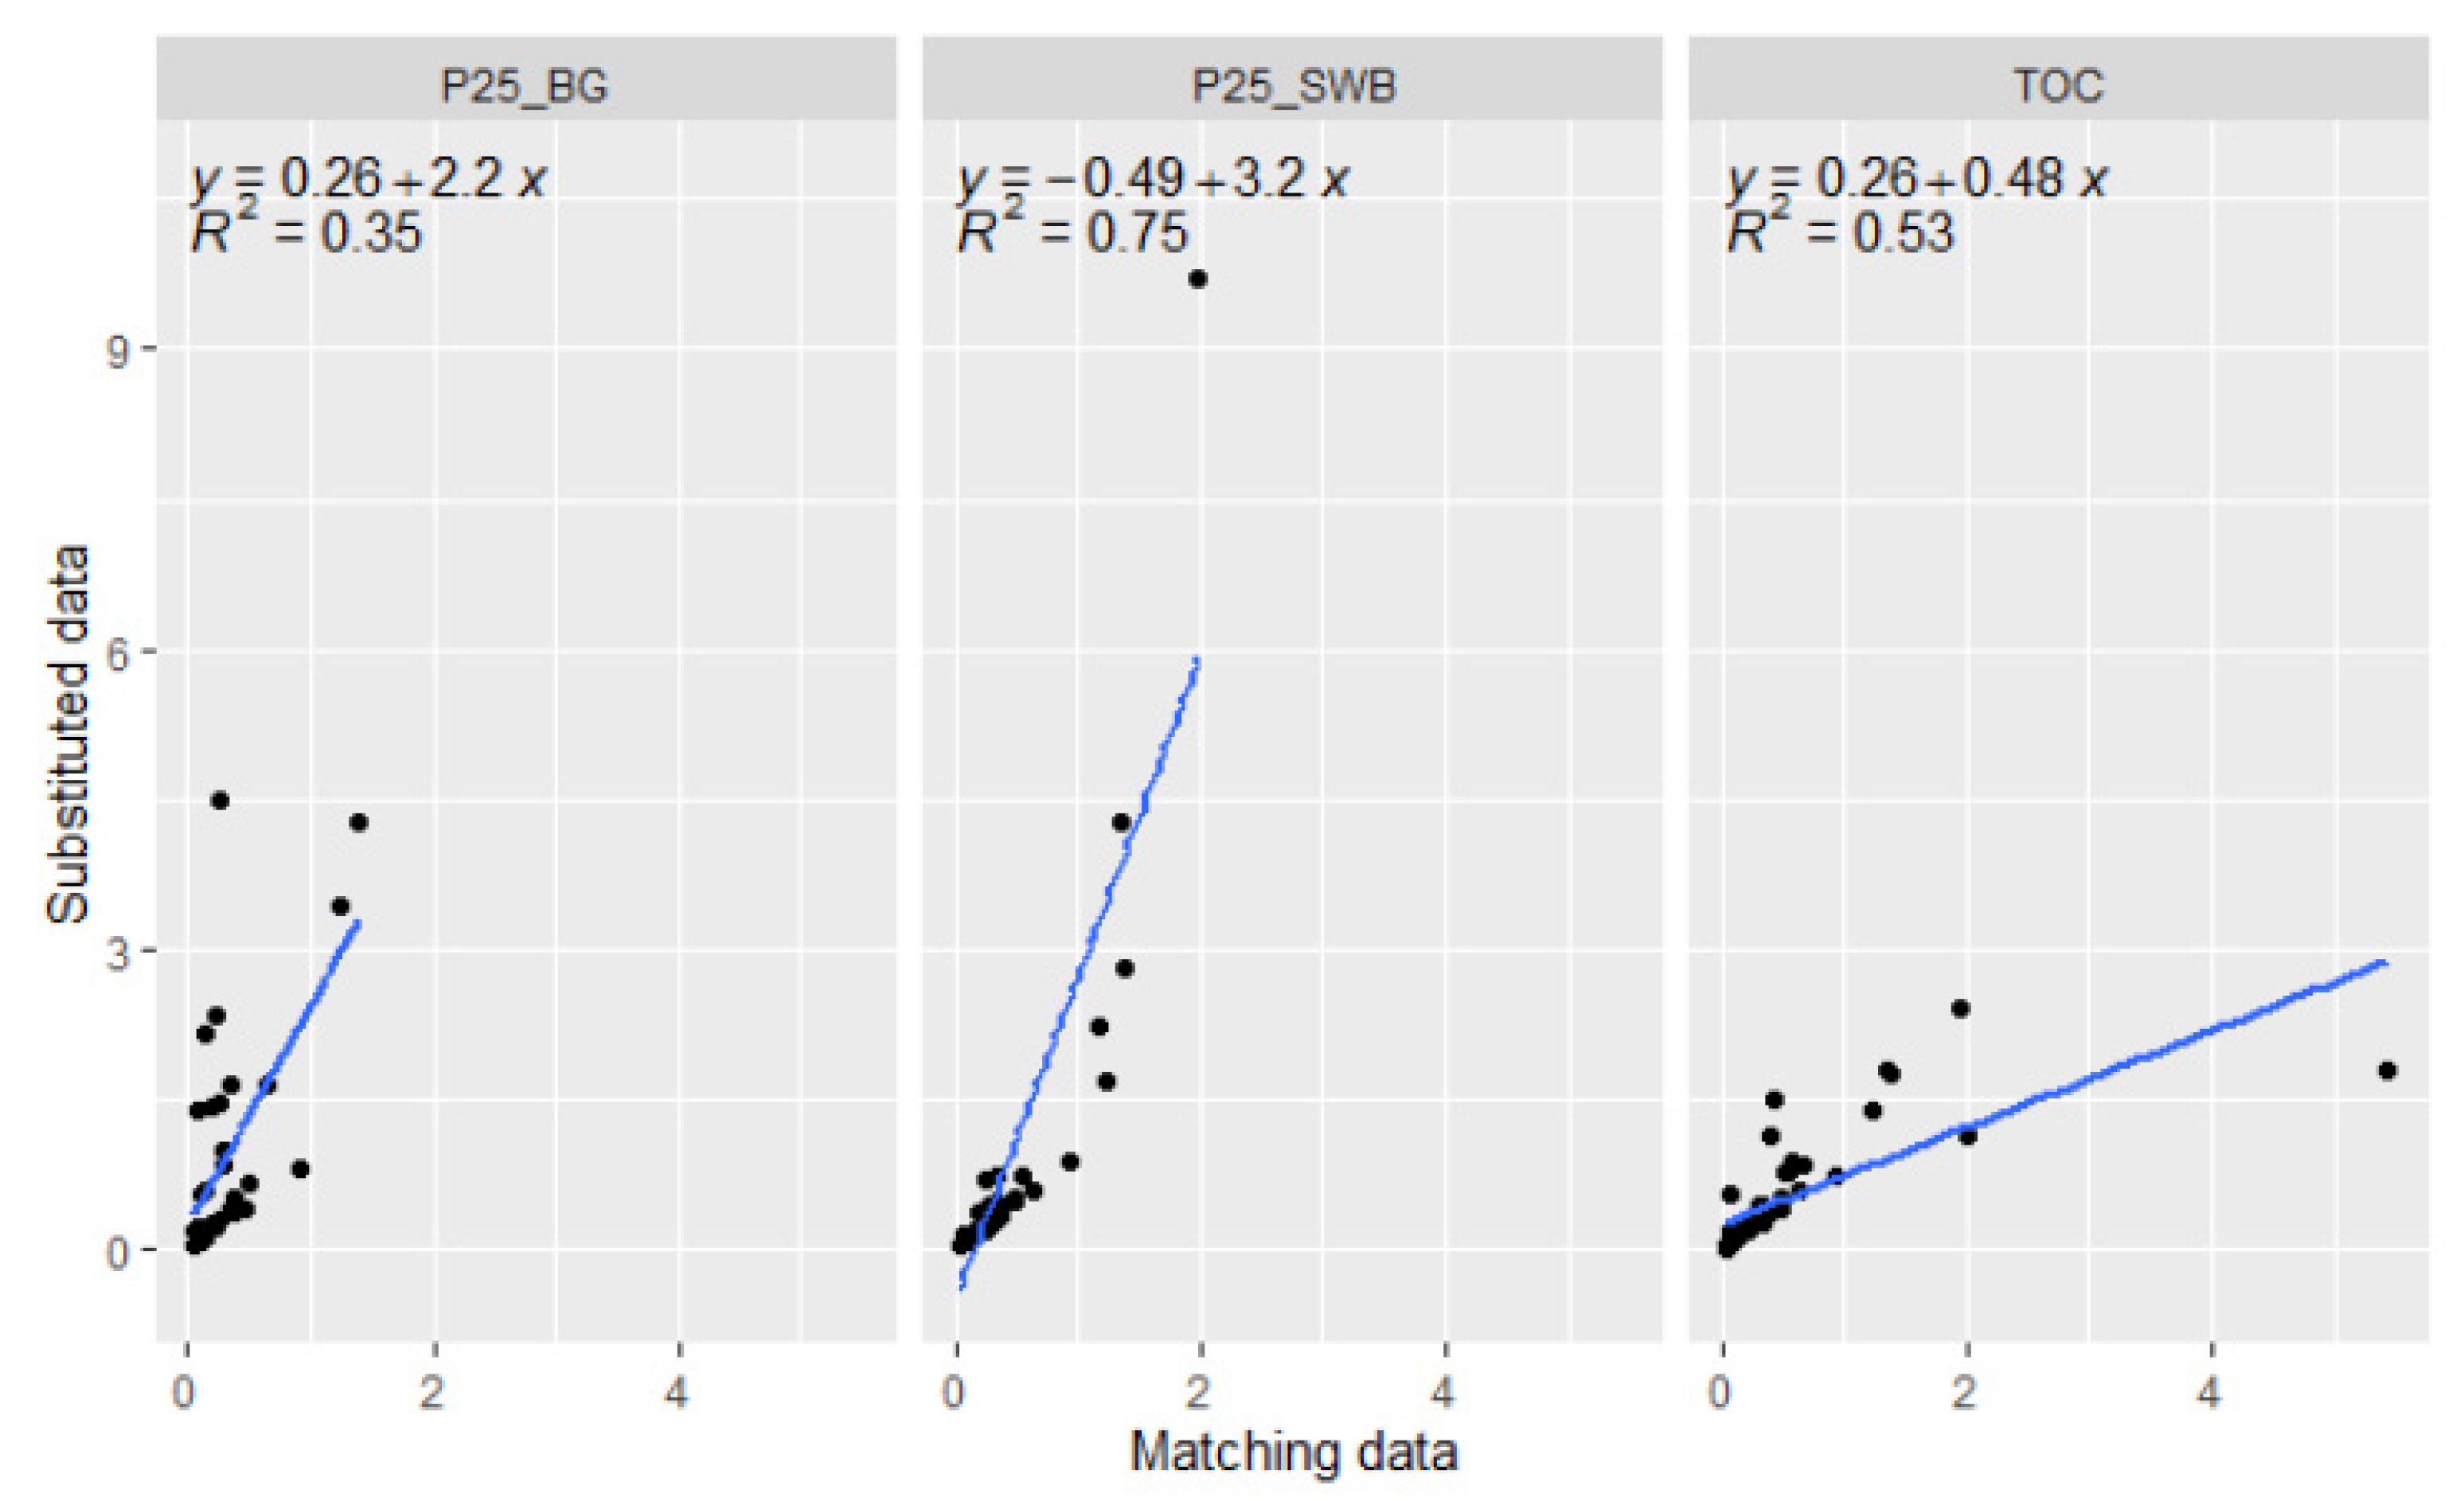
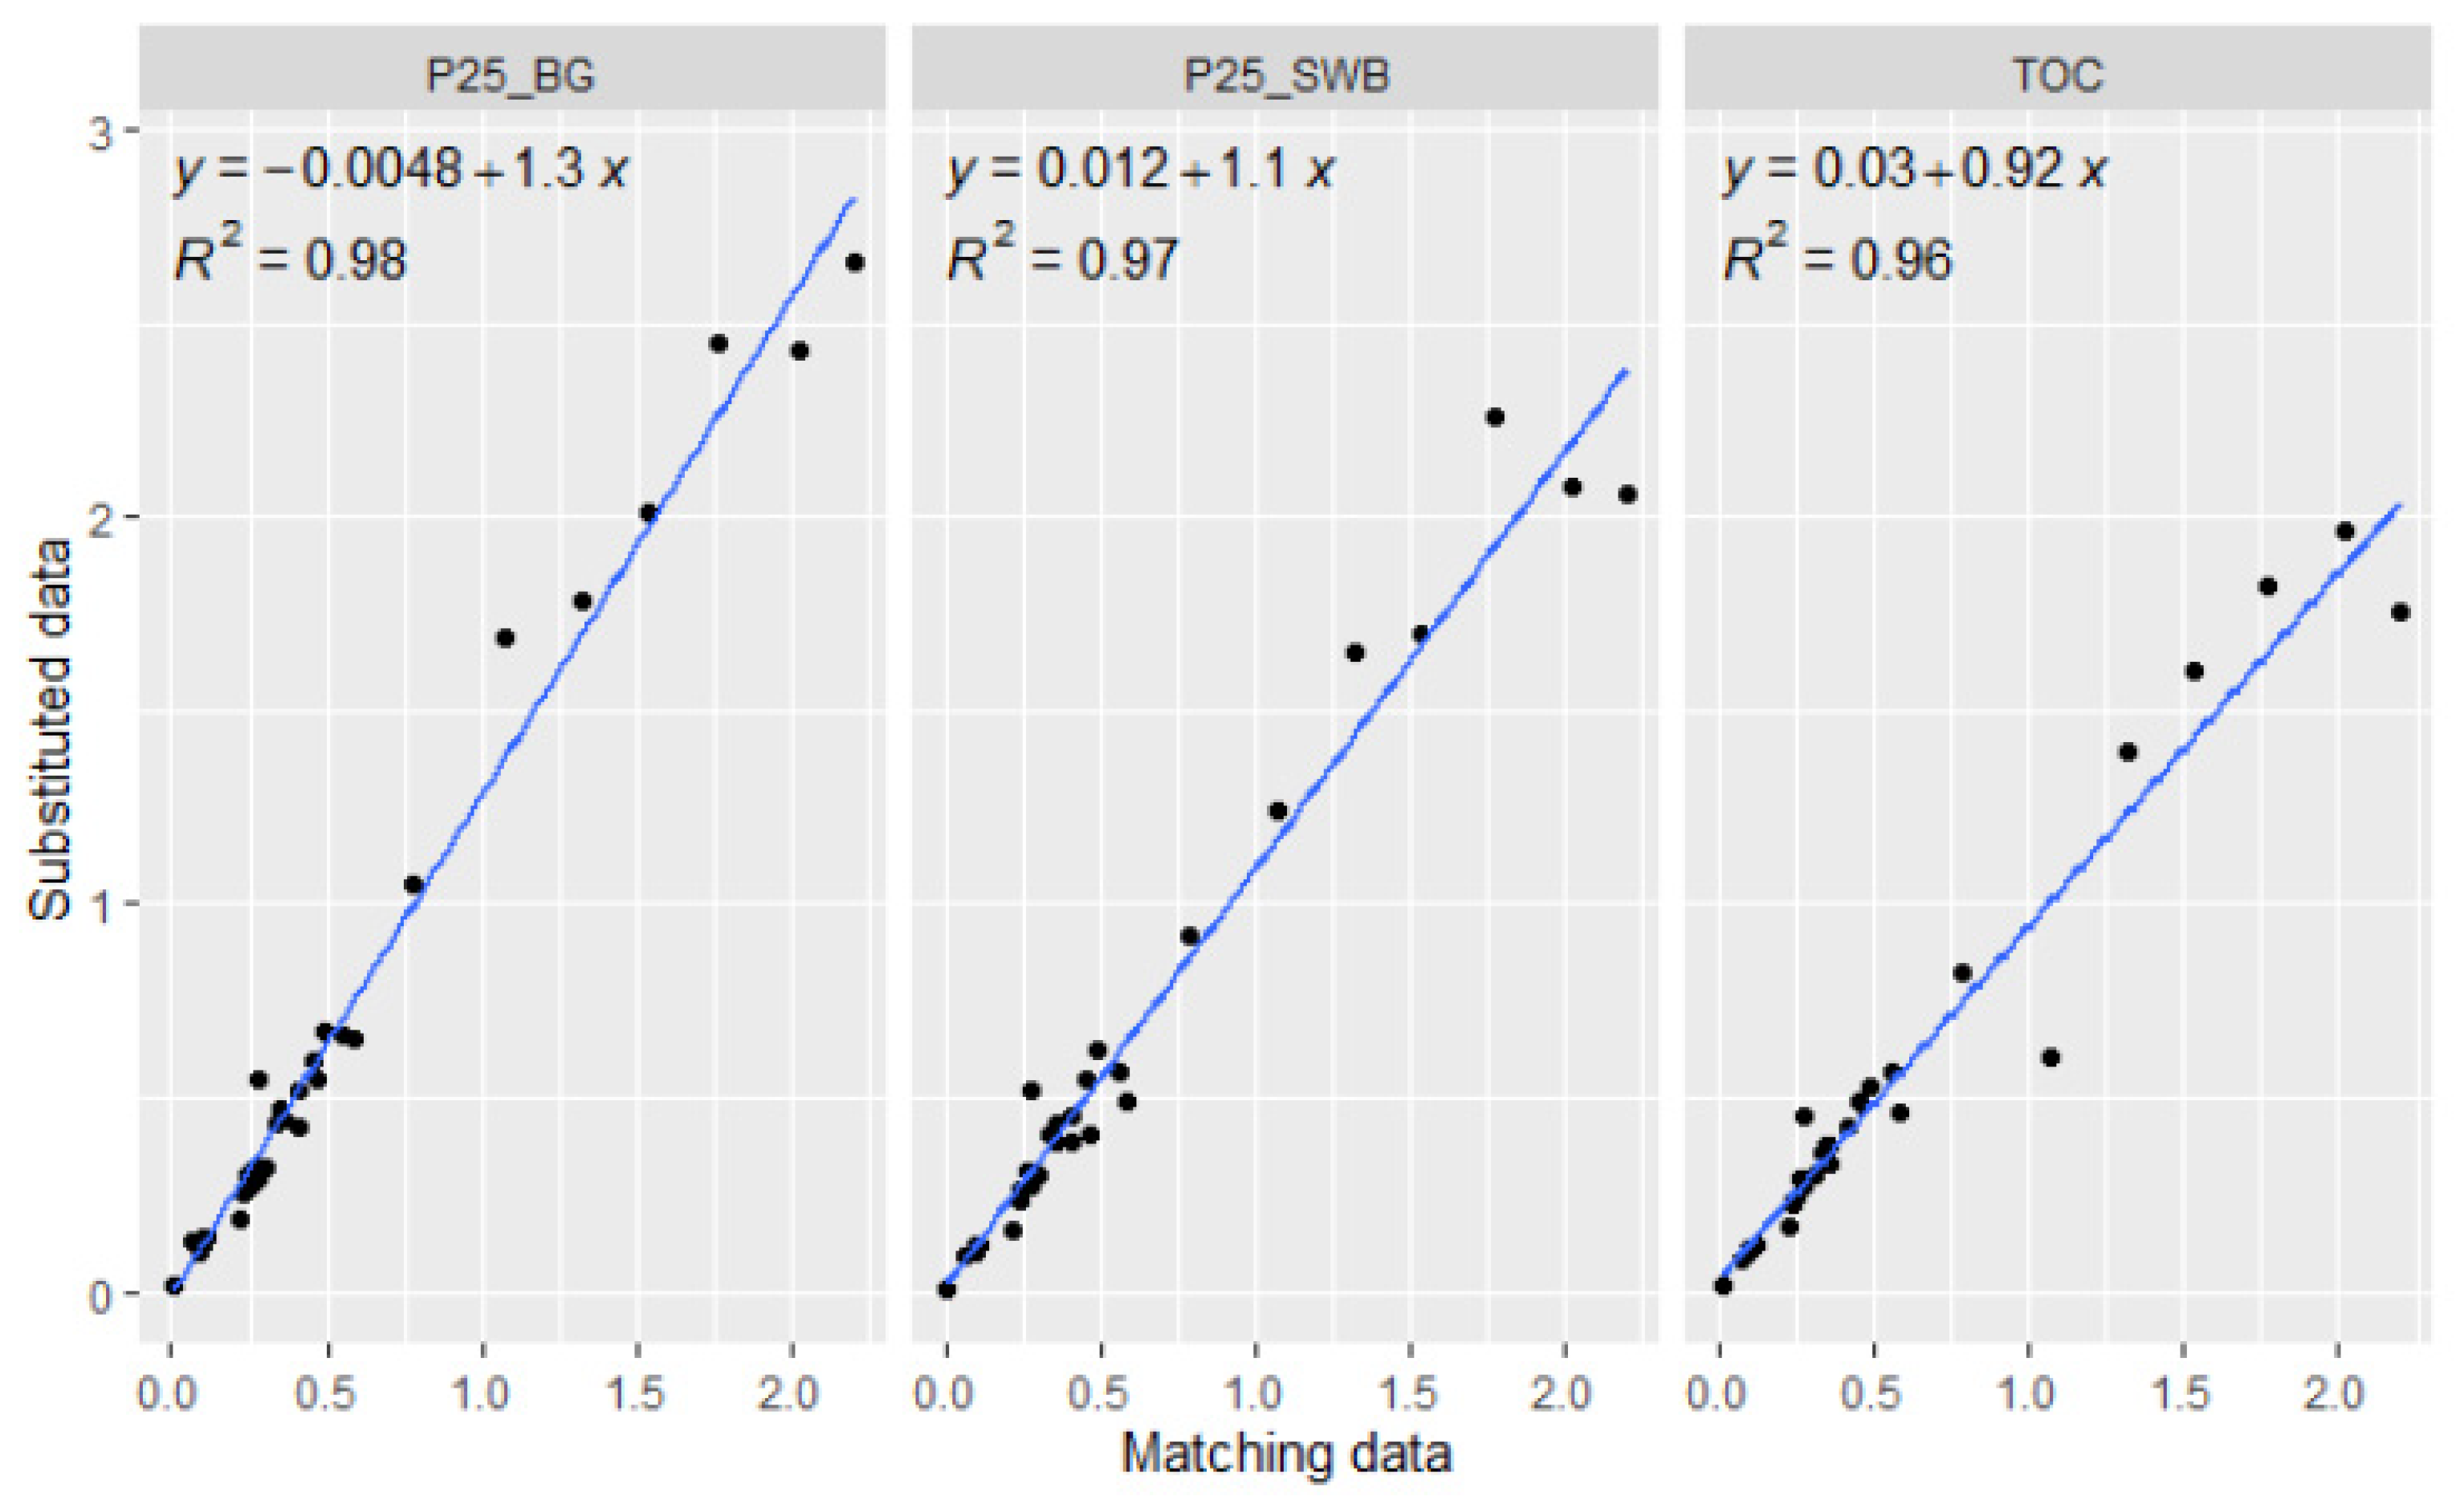
The comparisons between the Cu bioavailability results obtained by the BLM models are presented in Figure 4, Figure 5 and Figure 6. The correlations between the BIO-MET calculated RCR using matching and substituted data were very good (Figure 4). For the RCR values using percentiles approaches: P25_BG and P25_SWB were overestimated with slopes of 2.7 and 1.8, respectively. These environmental conservative estimates were more pronounced when the 25th percentile of the data from the Bulgarian monitoring network was used. The results from the M-BAT model followed a similar pattern to those of the BIO-MET (Figure 5), but the R2 values dropped to 0.54 for P25_BG and 0.69 for P25_SWB. The comparison between the RCR values obtained by the PNEC Pro model revealed lower correlations and slopes that were significantly different from one for all pairs (Figure 6). It should be mentioned that the comparison was restricted by the validated applicability domain of the PNEC Pro model, which decreased the number of calculated RCR values.
3.3.2. Comparisons for Zn
The user-friendly BLM models were implemented for the six water bodies (two reservoirs and four rivers) where the annual concentrations of Zn for 2020 exceeded the generic EQSbioavailable (8 μg/L) and the matching data (n = 34) for dissolved Zn, pH, dissolved Ca and DOC were available. The calculated RCRs are presented in the Supplementary Material (Figures S4–S6).
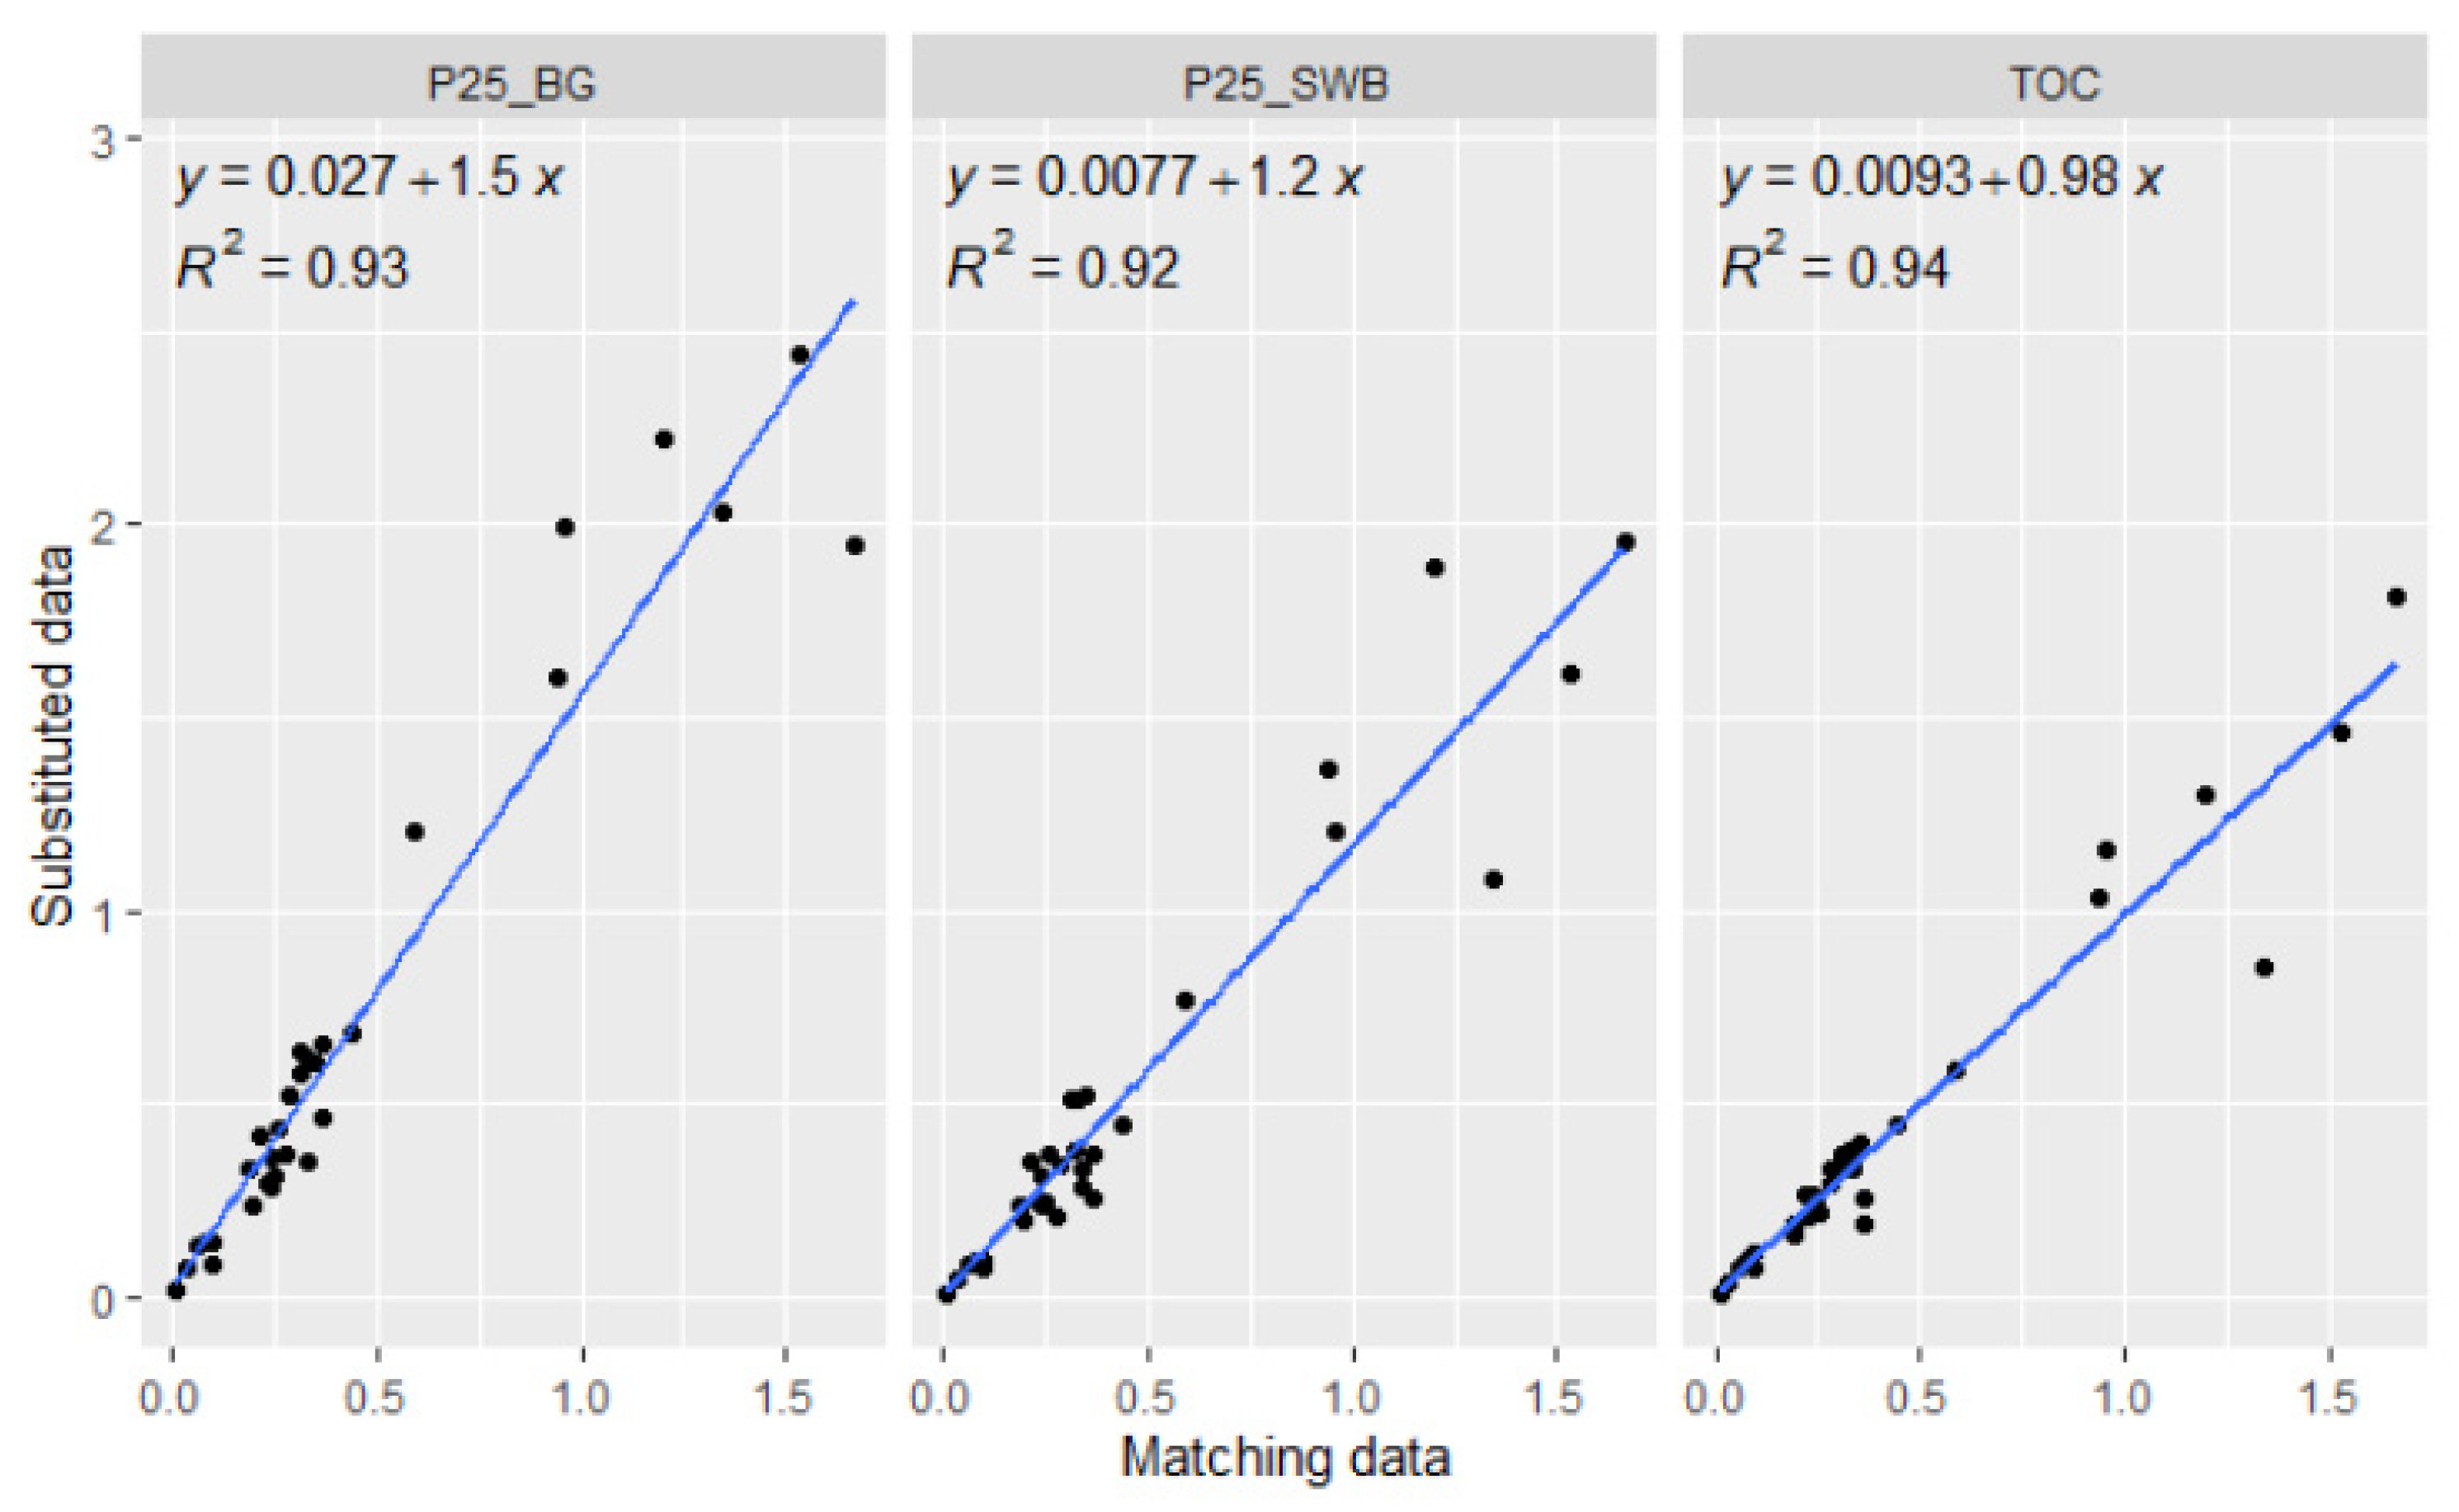
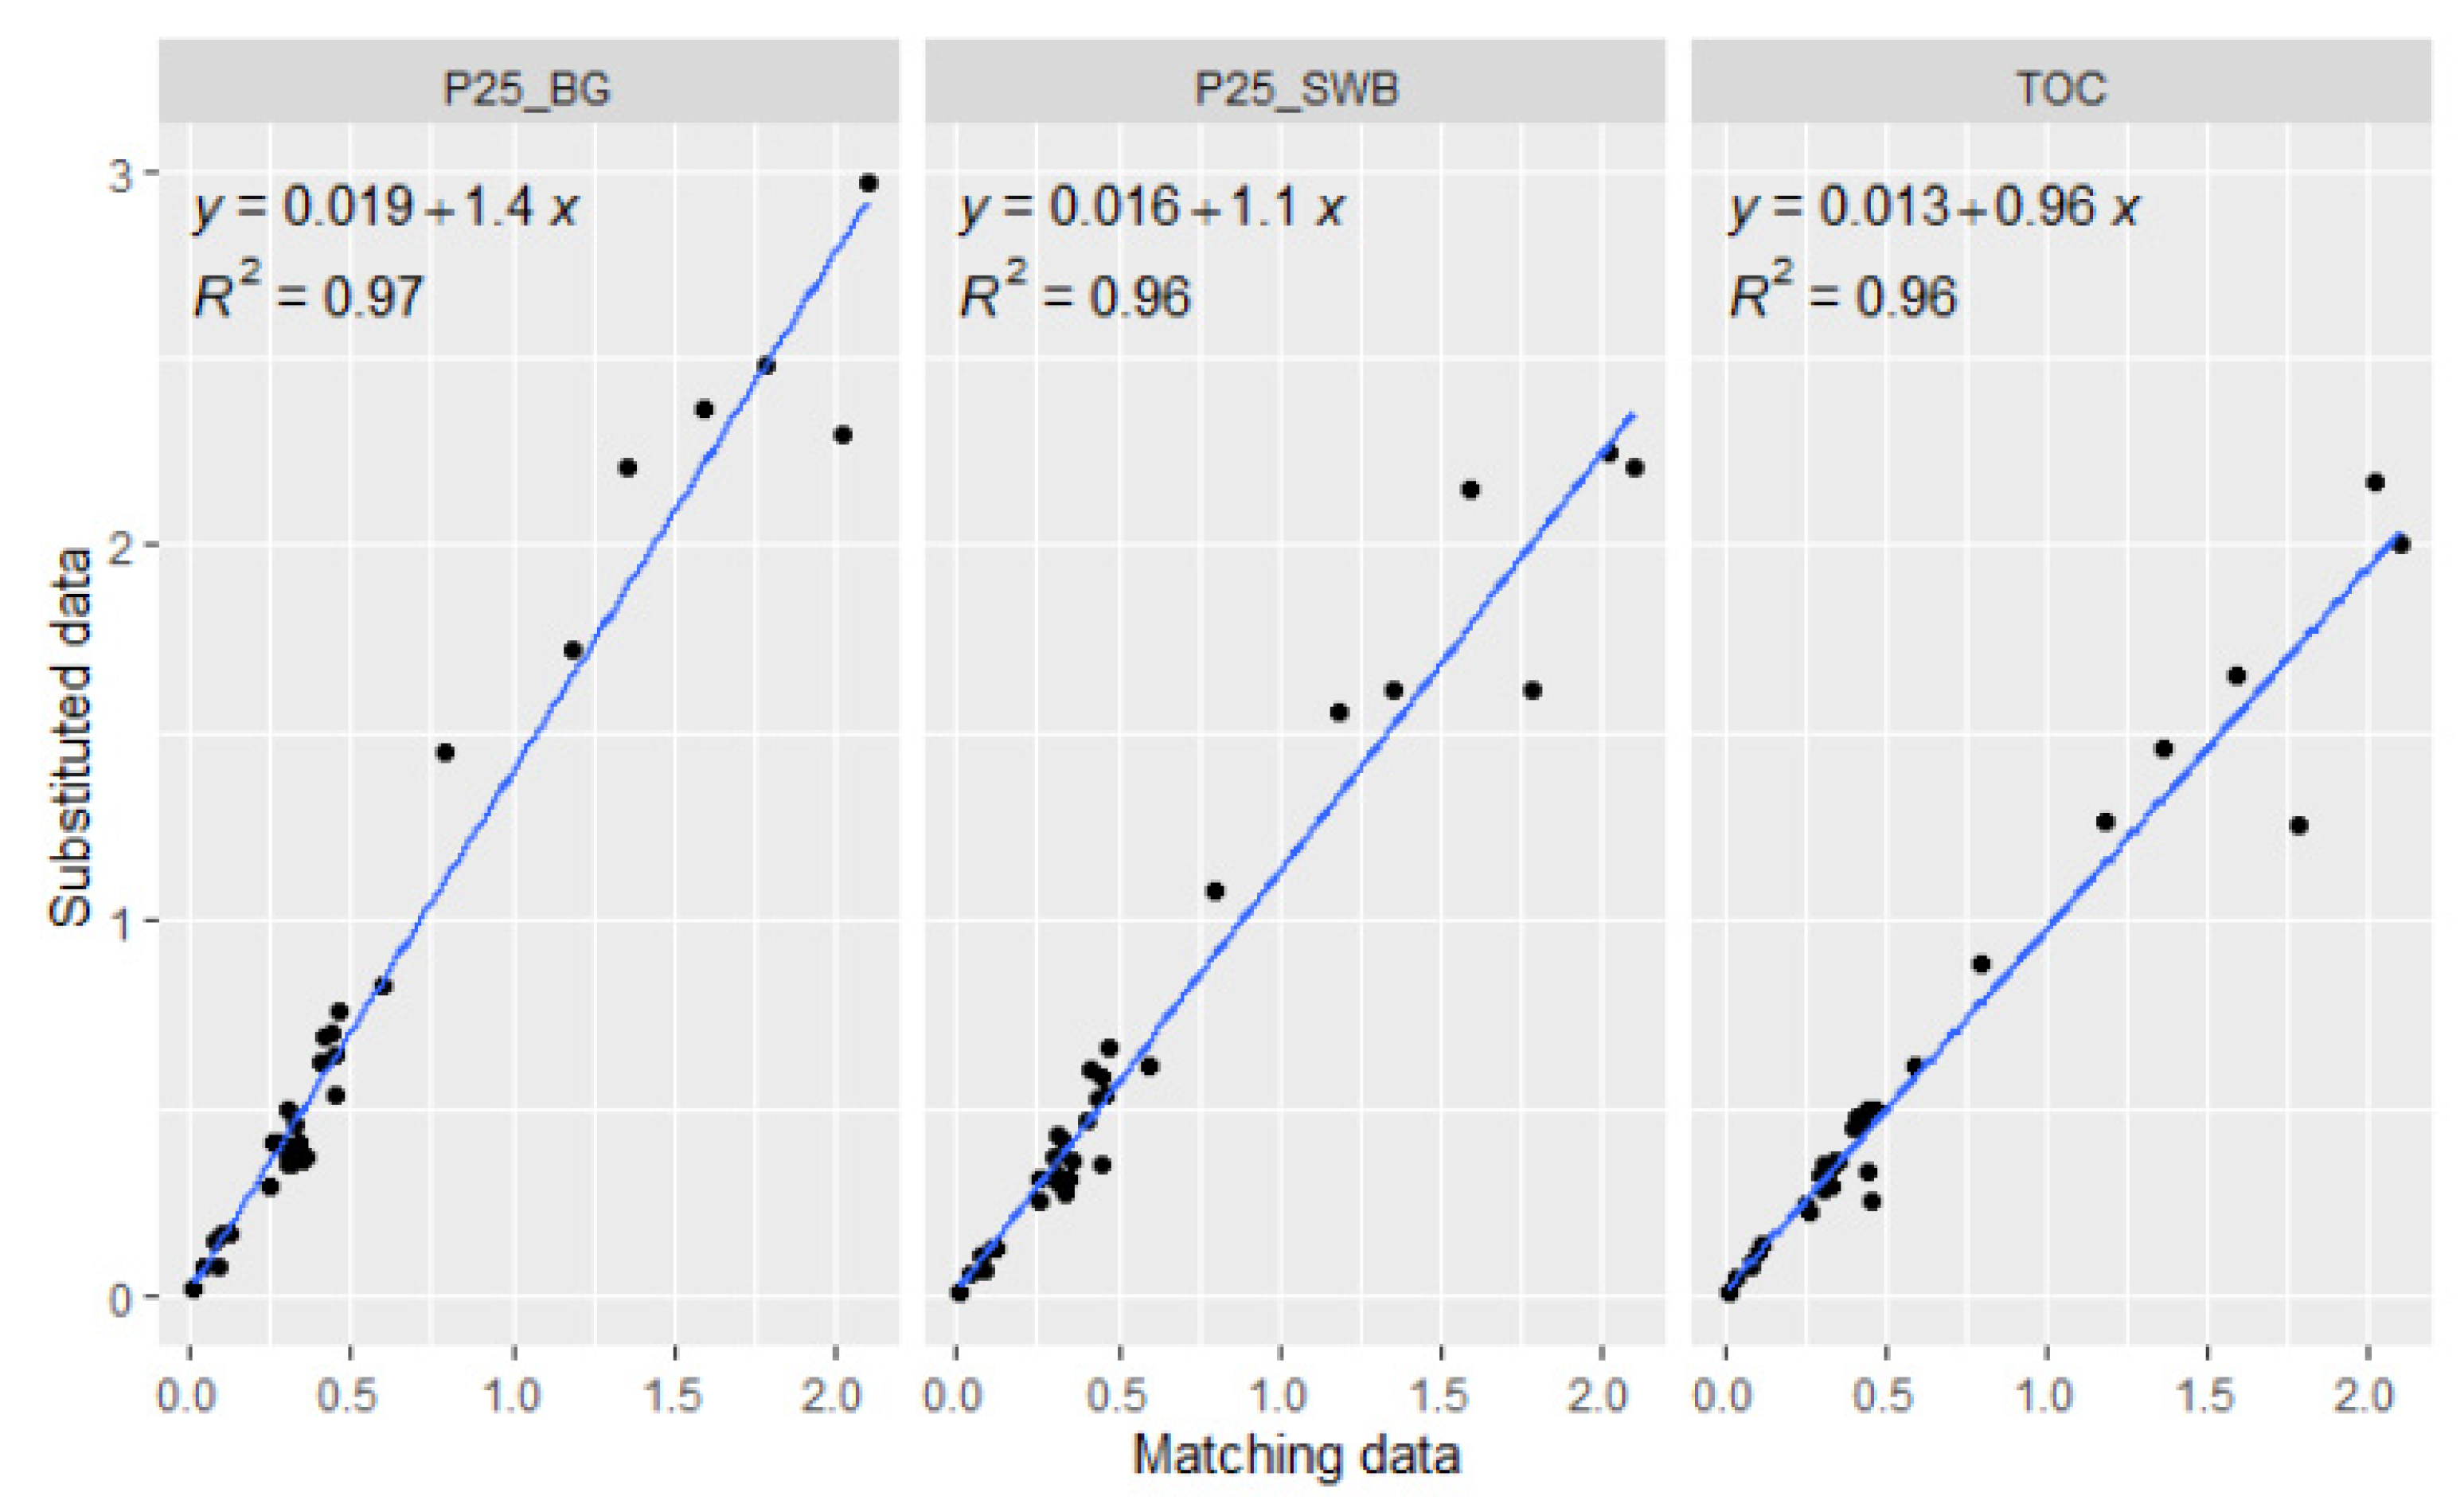
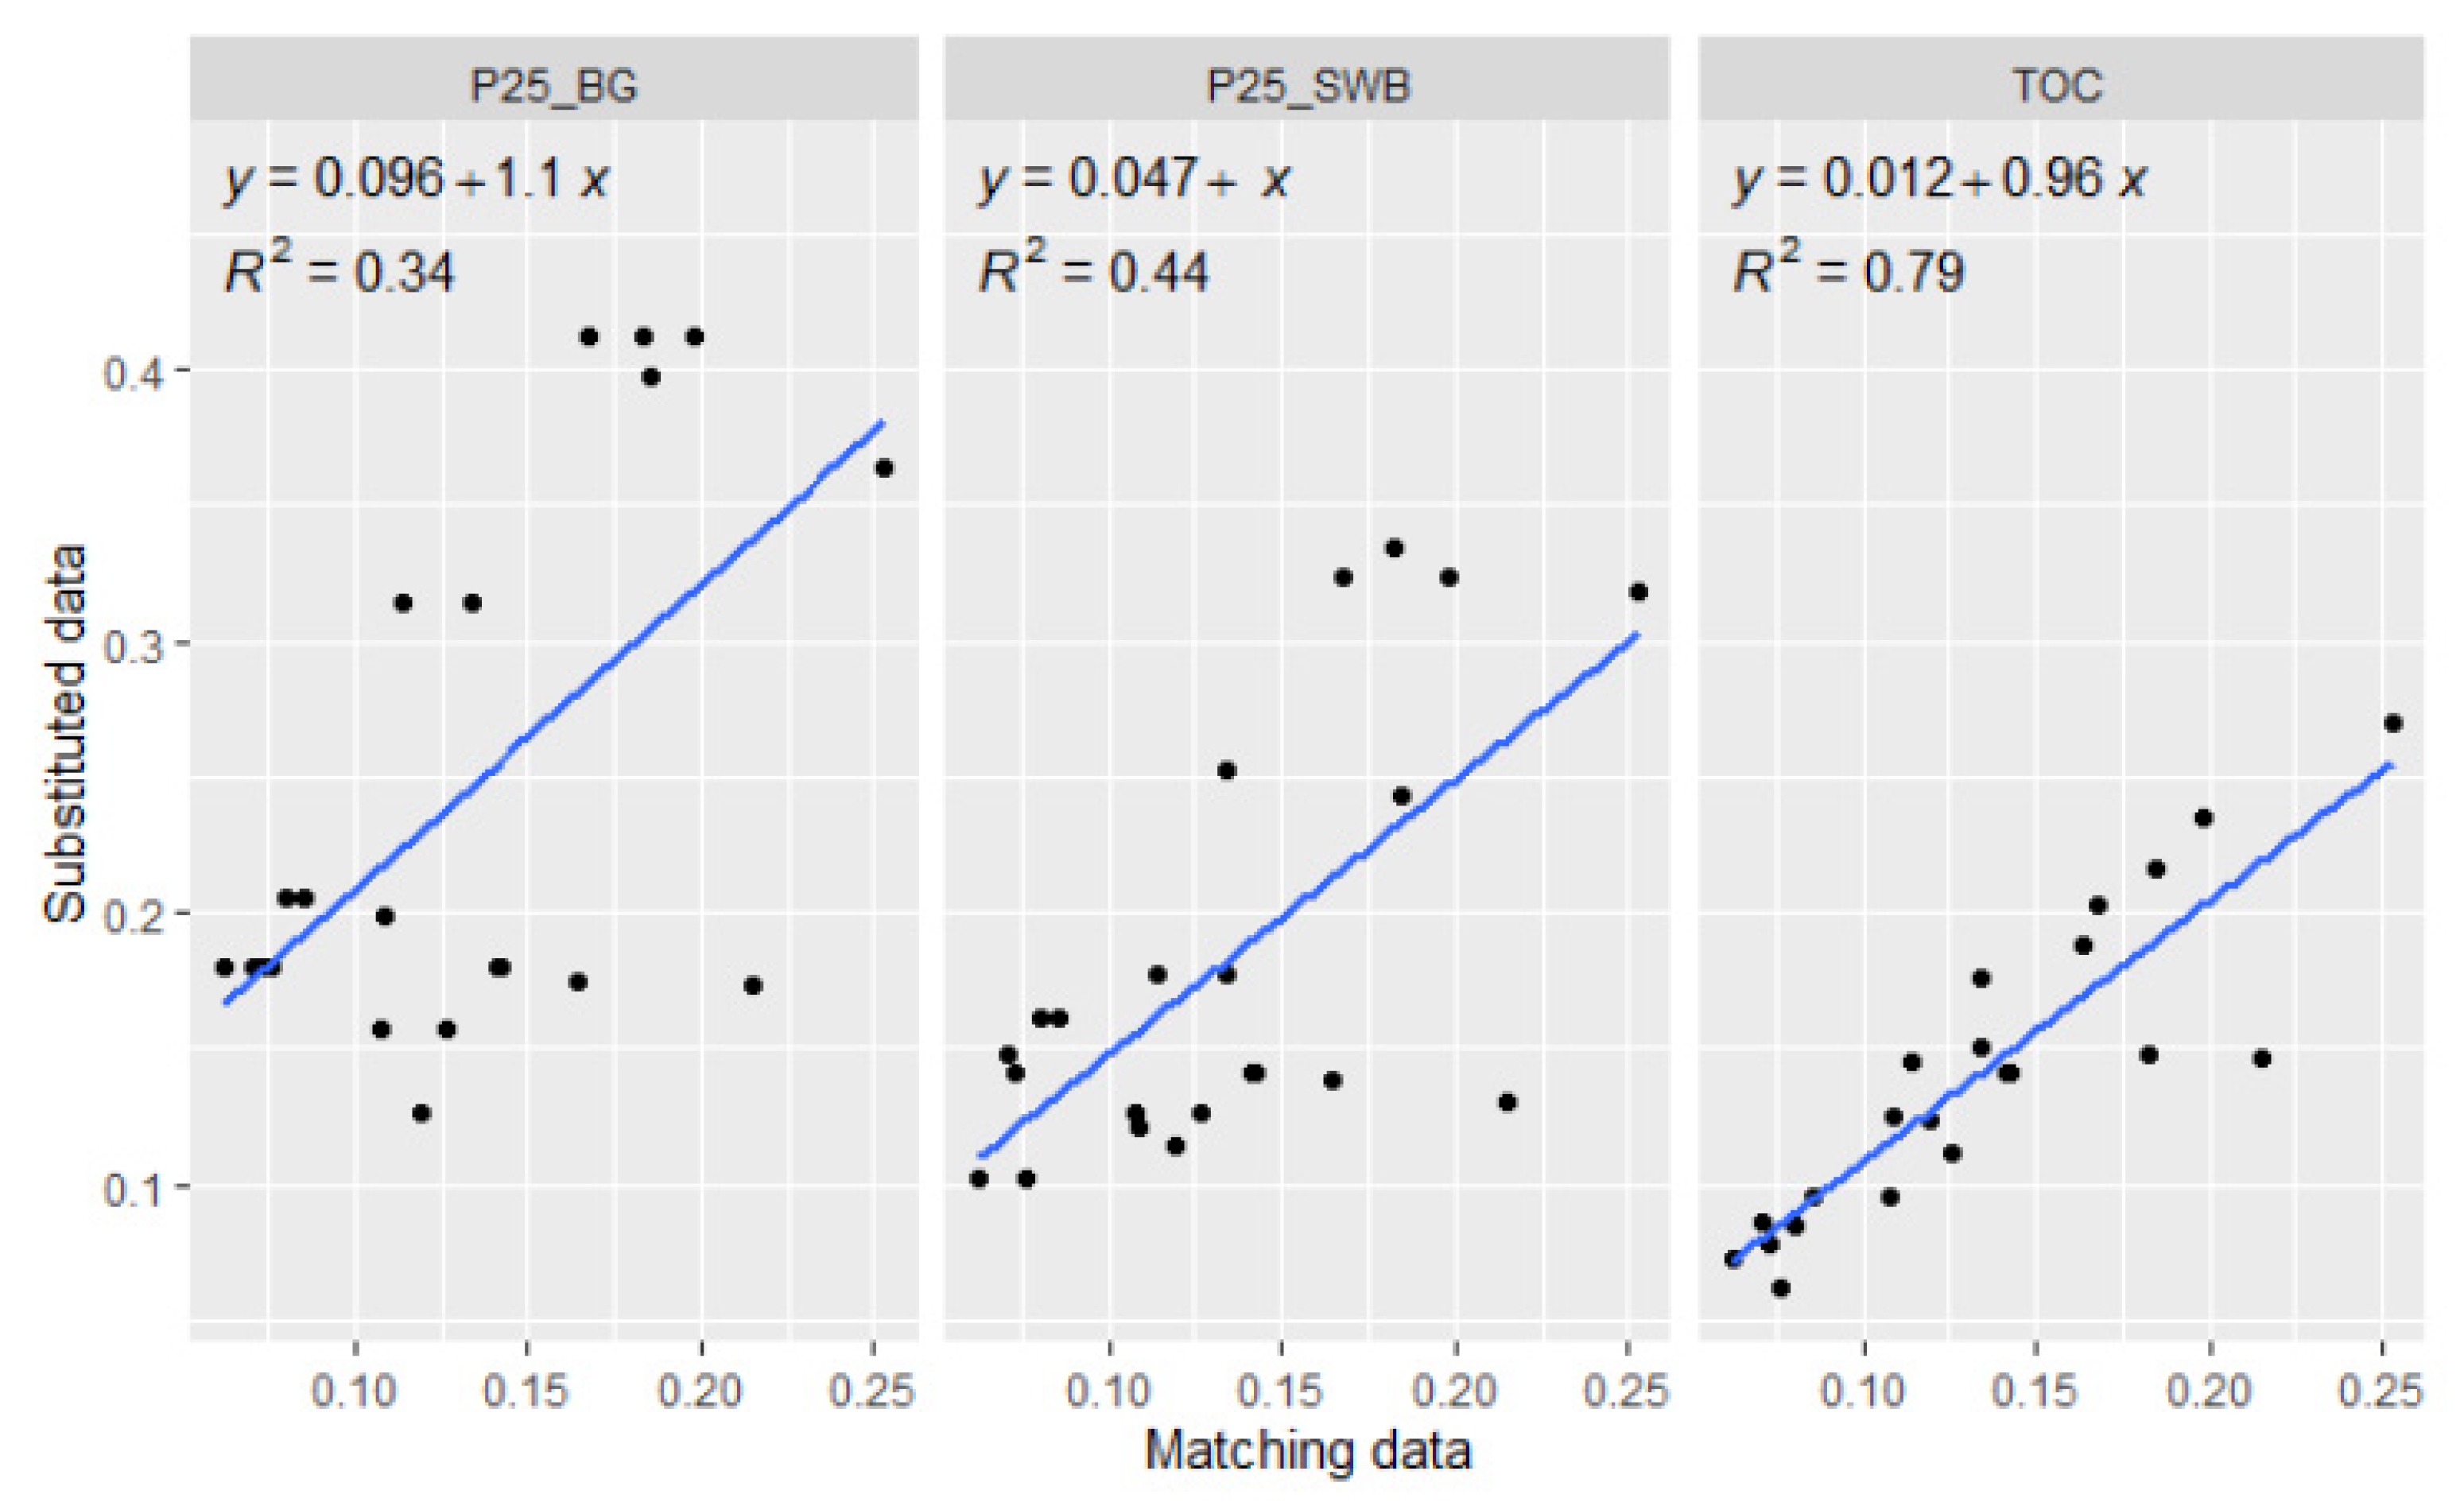
The comparison between the Zn bioavailability results obtained by the three BLM models using the matching and substituted DOC data is presented in Figure 7, Figure 8 and Figure 9. The correlations between the calculated RCRs using the matching and substituted data for all BLMs were very good (R2 > 0.90). The slopes varied between 1 and 1.5, decreasing in the order: P25_BG > P25_SWB > TOC.
3.3.3. Comparisons for Lead
The user-friendly BLM models were implemented for the four water bodies (two reservoirs and two rivers) where the annual concentrations of Pb for 2020 exceeded the EQSbioavailable (1.2 μg/L) and the matching data (n = 22) for dissolved Pb, pH, dissolved Ca and DOC were available. The calculated RCRs are presented in the Supplementary Material (Figures S7–S9).
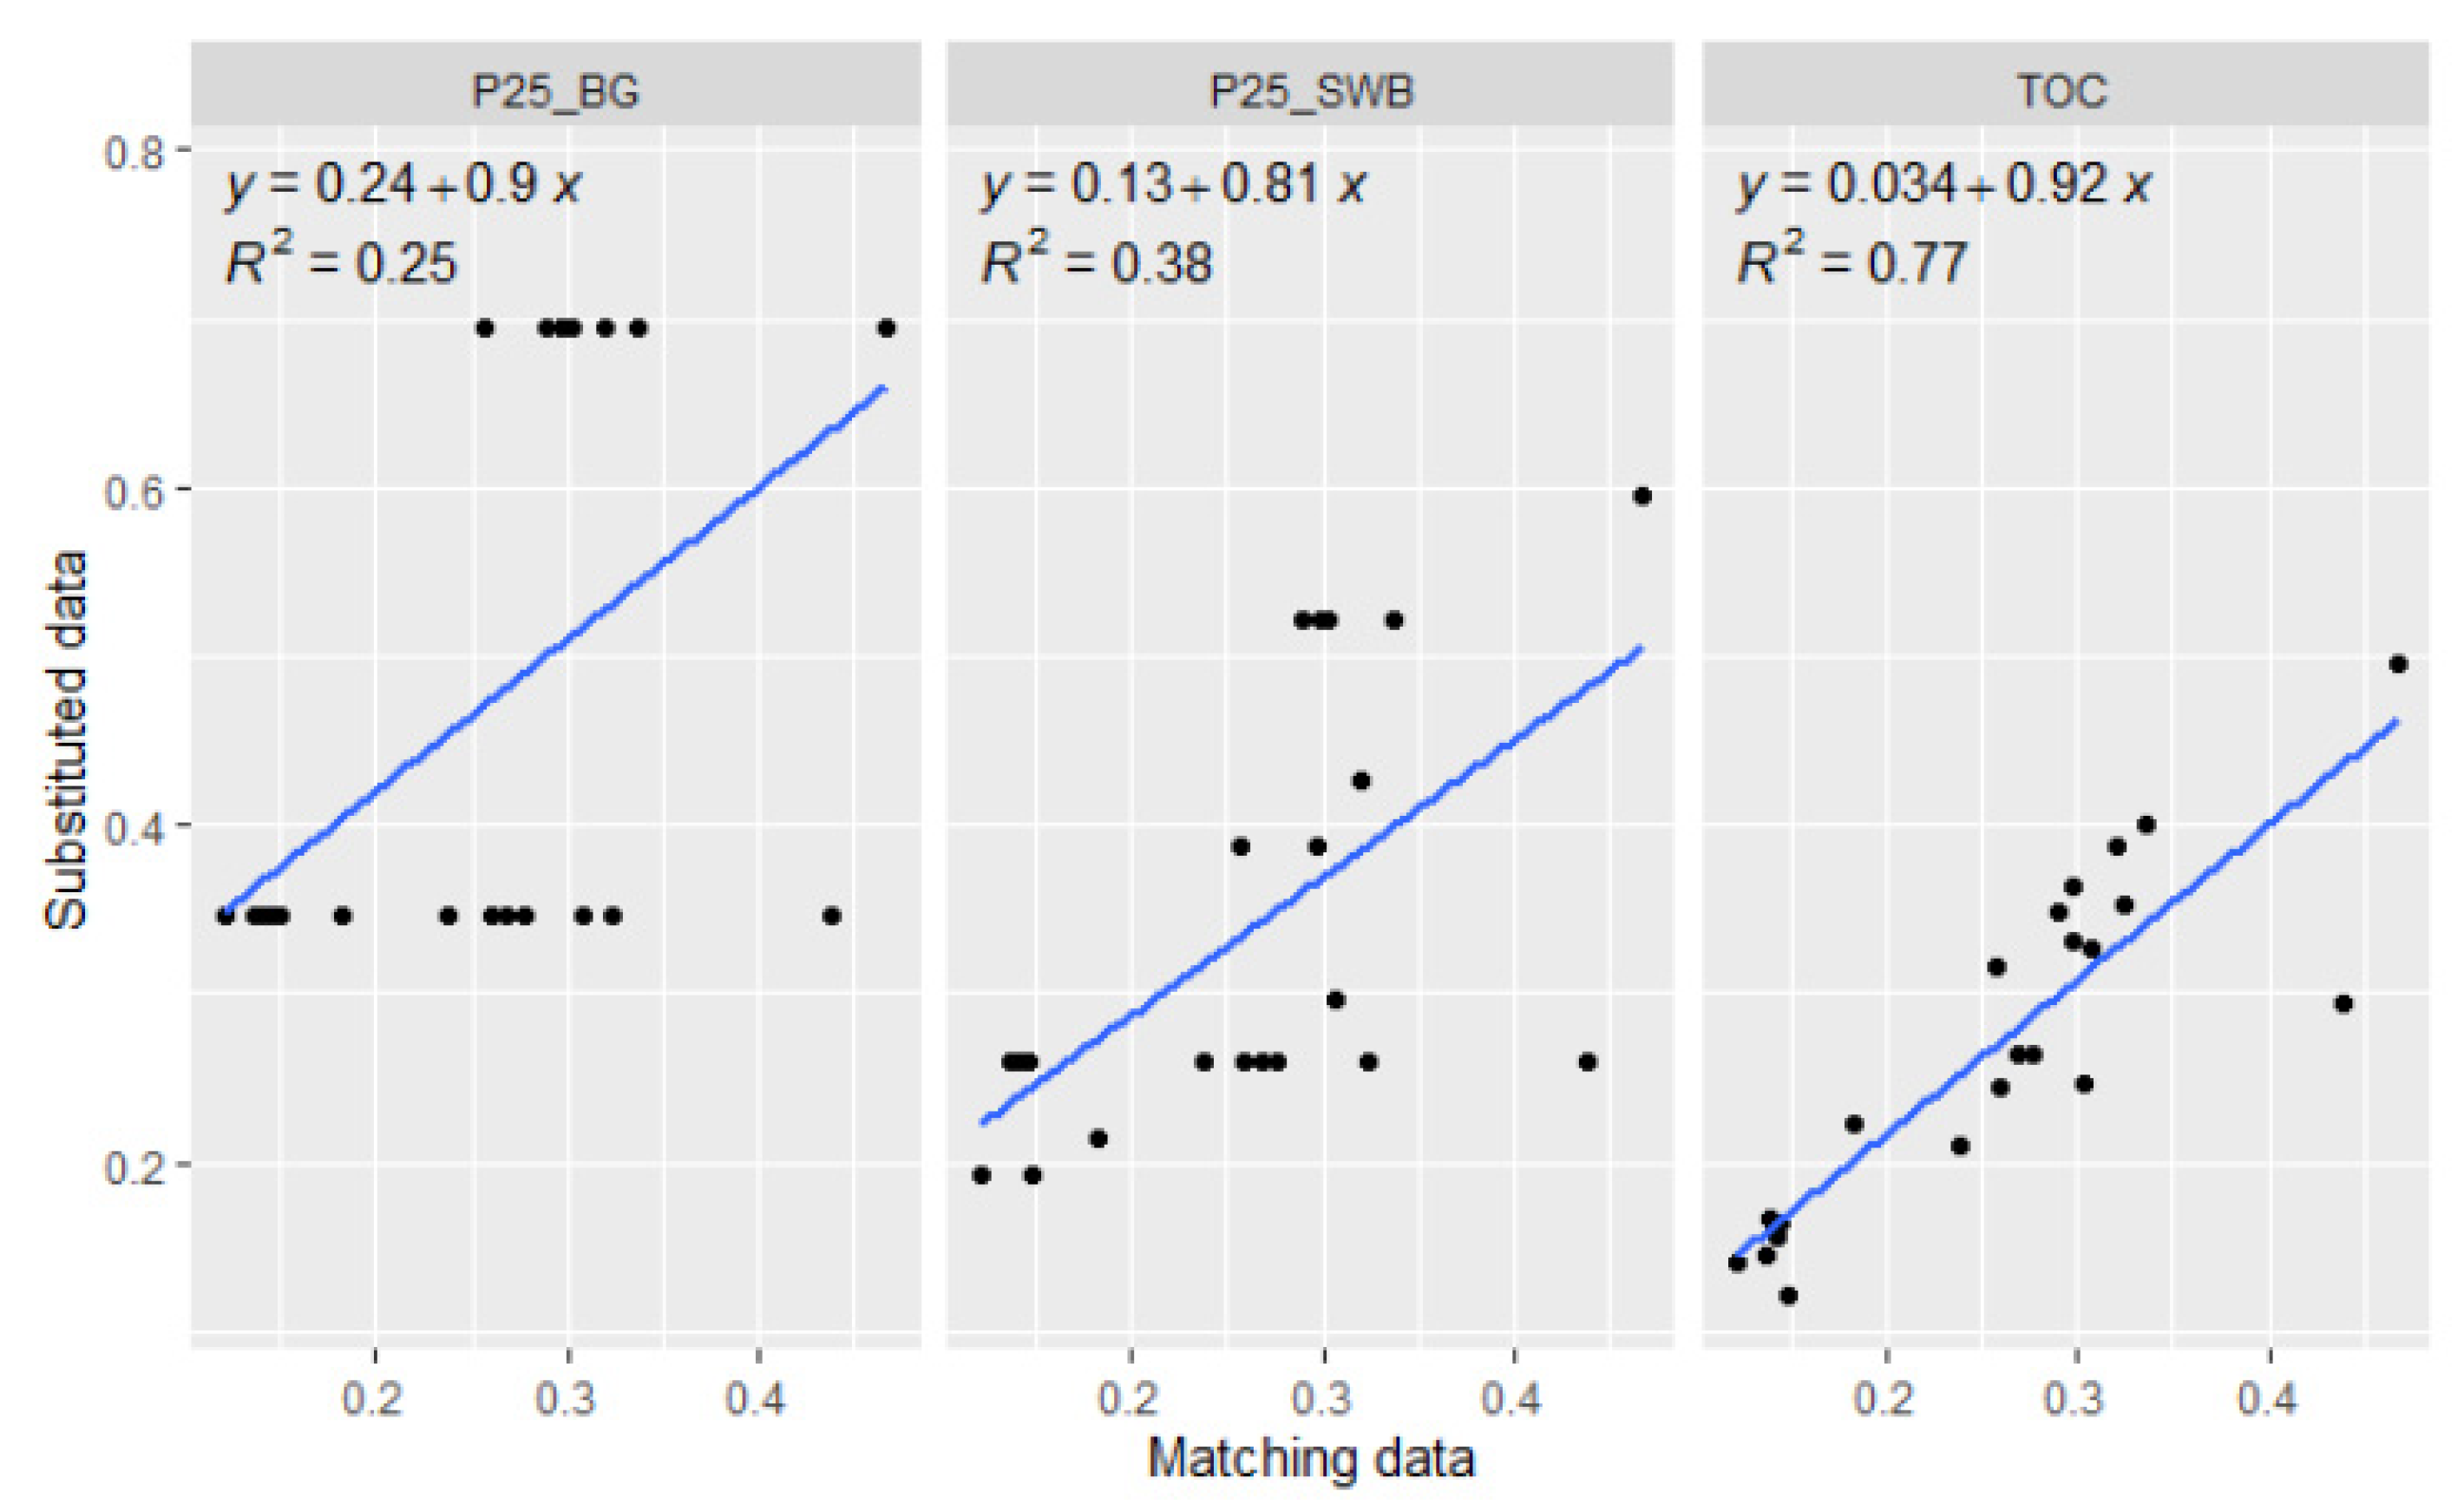
The comparison between the Pb bioavailability results obtained by the three BLM models using the matching and substituted DOC data are presented in Figure 10, Figure 11 and Figure 12. The performed linear regression analysis only showed a good agreement between the RCRs obtained using the matching data and the DOC calculated by TOC. The best result achieved by the percentile approaches was for the BIO-MET calculated RCR using P25_SWB as the substituted data.
4. Discussion
The first step in the implementation of BLMs in the case of missing DOC monitoring data is the possible substitution of the available historical data from the Bulgarian Environmental Agency surface water monitoring programme. Contrary to the practice used in Great Britain [29], the correlation obtained between the DOC and Fedissolved concentrations (Figure 2) shows that it cannot be used for the substitution of missing DOC data. The result obtained from the comparison between the available DOC and TOC data reveals that a conversion factor of DOC = 0.81 × TOC can be applied when DOC data are missing (Figure 3). This outcome is in agreement with the approach used in Finnish [34] and Swedish [11] networks, where TOC is traditionally measured and the applied conversion factors are 0.94 and 0.90, respectively. Similar to the Bulgarian monitoring data, a relationship (DOC = 0.83×TOC) is used for BLM purposes in the State of Oregon, USA [35]. Similar conversion factors were reported for rainfall and runoff samples in the USA (DOC = 0.84 × TOC) [36] and in Polish groundwater samples (DOC = 0.93×TOC) [37].
The second step of the proposed scheme for the implementation of BLMs deals with cases where no matching data are available, which is caused by the different monitoring frequencies used for metals and DOC. To overcome this problem, the environmental authorities of England and Wales [7] and France [18] and the EPA of the USA [38] propose the use of the 25th percentile of measured DOC concentrations as the input for the user-friendly BLMs. The proposed approaches in this study for dealing with the absence of matching data includes: (i) the substitution of missing DOC data using available TOC data (DOC = 0.81 × TOC) and (ii) the use of the 25th percentile of the data consisting of measured and substituted DOC values. This allows for the significant broadening of the implementation of BLMs in the Bulgarian monitoring network (Figure 1).
The comparison of the following suggested substitution approaches was performed for 13 water bodies where all data records were available.: (i) DOC calculated by TOC; (ii) 25th percentile of the joint (measured and calculated) Bulgarian monitoring network DOC data; and (iii) 25th percentile of the respective SWB with matching data.
The application of BLMs for assessing the Cu bioavailability showed the closest agreement between the BIO-MET and M-BAT results (Figure 4 and Figure 5). While both methods confirmed the applicability of the proposed substitution approaches, those based on the 25th percentile provided more conservative estimates. It should be mentioned that the correlations were better between the BIO-MET calculated RCRs using matching data and data substituted by the 25th percentile. The PNEC Pro results were unsatisfactory for all BMLs and were an indication that none of the substitution approaches could be used for this user-friendly BLM (Figure 6).
The comparison between the Zn bioavailability results obtained by all BLMs using matching and all types of substituted data confirmed the applicability of all of the proposed approaches (Figure 7, Figure 8 and Figure 9). Again, the most conservative estimates are provided by the 25th percentile of Bulgarian monitoring network data, followed by the 25th percentile of SWB data and the DOC data calculated by TOC.
The application of BLMs for the assessment of Pb bioavailability revealed a clear separation between the substituted data calculated by TOC on one side and the data substituted by the 25th percentile on the other (Figure 10, Figure 11 and Figure 12). The comparison of the calculated RCRs by all BLMs between the matching data and the DOC data calculated by TOC showed very good correlations and slopes that were close to one. The comparison between the matching data and the 25th percentile substituted data yielded lower R2 values and the slopes of the PNEC Pro comparison differed significantly from one. When using the BLM calculations in Tier 2, the results showed a great reduction in the exceedances of the samples (Table 3). For Cu, when BIO-MET was applied, 5 out of 63 samples were found to be exceedances when the measured DOC was used, 4 exceedances were found when TOC value was used (DOC = 0.81 × TOC), 8 exceedances were found when the 25th percentile of the DOC concentration was used and 7 exceedances were found when the 25th percentile of the converted TOC for the respective water body was used, in contrast to the direct comparison of the EQS to the measured copper values (57 out of 63).
Similar results were obtained using M-BAT (7, 6, 7 and 9 exceedances out of 63, respectively) and PNEC Pro (9, 8, 10 and 5 exceedances out of 63, respectively).
The results showed a reduction in the exceeding samples for BIO-MET (2, 5, 7 and 6, respectively), M-BAT (6, 6, 7 and 7, respectively) and PNEC Pro (6, 5, 7 and 6, respectively) compared with the direct comparison of the EQS to the zinc values (14 out of 34 exceeding values).
The results from the application of the BLM tools showed the greatest reduction in the exceeding samples for Pb—only one RCR value was found to be above one—when PNEC Pro was used with the 25th percentile of the Bulgarian DOC data. The direct comparison with the EQS (Tier 1) showed 8 exceedances out of 22 samples.
Generally, the user-friendly BLM tools returned a lower number of RCR exceedances when the measured DOC concentration was used compared with the other approaches, with BIO-MET returning the lowest number of exceedances.
5. Conclusions
The metal bioavailability assessment by user-friendly BLMs requires inputs for the dissolved metal concentrations and the supporting physicochemical parameters, such as DOC, pH and dissolved Ca. The main obstacle in front of the environmental authorities for the implementation of BLMs is the lack of matching data, especially for DOC. In cases where the required data are not fully available, alternative approaches are needed to fill the missing inputs.
In this study, various alternative approaches were tested to support the environmental decision-making bodies. The proposed methodology included three approaches for the substitution of missing DOC data: (i) calculation from available TOC data; (ii) the 25th percentile of the joint (measured and calculated by TOC) Bulgarian monitoring network DOC data; and (iii) the 25th percentile of the joint DOC data for the investigated SWB. For the next step, the proposed substitution approaches were validated by a comparison with the available matching data from the Bulgarian monitoring surface waters network. The comparisons were performed for the three most widely used BLMs: BIO-MET; M-BAT; and PNEC Pro. The described methodology would allow the environmental authorities to estimate the bioavailability of certain metals and then choose the best possible substitution approach by the implementation of the most appropriate BLM, which would cover as many SWBs as possible without the matching data being available.
The application of the abovementioned methodology to the Bulgarian surface waters monitoring data outlined that the suitability of the substitution approaches decreases in the following order: DOC calculated by TOC > use of the 25th percentile of the data for the respective SWB > use of the 25th percentile of the Bulgarian monitoring network data. The results obtained by the implementation of BIO-MET rendered it the most appropriate tool for the bioavailability assessment of Cu, Zn and Pb in Bulgarian surface waters.
Supplementary Materials
The following are available online at https://www.mdpi.com/article/10.3390/w14020246/s1, Figure S1: The calculated RCR for Cu using the BIO-MET and measured DOC, the TOC, the 25th percentile of the Bulgarian DOC data and the 25th percentile of the DOC = 0.81 × TOC for the respective water body; Figure S2: The calculated RCR for Cu using the M-BAT and measured DOC, the TOC, the 25th percentile of the Bulgarian DOC data and the 25th percentile of the DOC = 0.81 × TOC for the respective water body; Figure S3: The calculated RCR for Cu using the PNEC Pro and measured DOC, the TOC, the 25th percentile of the Bulgarian DOC data and the 25th percentile of the DOC = 0.81 × TOC for the respective water body; Figure S4: The calculated RCR for Zn using the BIO-MET and measured DOC, the TOC, the 25th percentile of the Bulgarian DOC data and the 25th percentile of the DOC = 0.81 × TOC for the respective water body; Figure S5: The calculated RCR for Zn using the M-BAT and measured DOC, the TOC, the 25th percentile of the Bulgarian DOC data and the 25th percentile of the DOC = 0.81 × TOC for the respective water body; Figure S6: The calculated RCR for Zn using the PNEC Pro and measured DOC, the TOC, the 25th percentile of the Bulgarian DOC data and the 25th percentile of the DOC = 0.81 × TOC for the respective water body; Figure S7: The calculated RCR for Pb using the BIO-MET and measured DOC, the TOC, the 25th percentile of the Bulgarian DOC data and the 25th percentile of the DOC = 0.81 × TOC for the respective water body; Figure S8: The calculated RCR for Pb using the M-BAT and measured DOC, the TOC, the 25th percentile of the Bulgarian DOC data and the 25th percentile of the DOC = 0.81 × TOC for the respective water body; Figure S9: The calculated RCR for Pb using the PNEC Pro and measured DOC, the TOC, the 25th percentile of the Bulgarian DOC data and the 25th percentile of the DOC = 0.81 × TOC for the respective water body.
Author Contributions
Conceptualization, T.V. and S.T.; methodology, T.V. and S.T.; software, T.V.; formal analysis, T.V. and S.T.; investigation, T.V.; resources, T.V.; data curation, T.V.; writing—original draft preparation, T.V.; writing—review and editing, S.T.; visualization, T.V.; supervision, S.T.; project administration, T.V. and S.T.; funding acquisition, T.V. and S.T. All authors have read and agreed to the published version of the manuscript.
Funding
This research was funded by the Ministry of Education and Science, Bulgarian National Science Fund, Grant DN 19/15 and by the National Science Program “Environmental Protection and Reduction of Risks of Adverse Events and Natural Disasters”, approved by the Resolution of the Council of Ministers № 577/17.08.2018 and supported by the Ministry of Education and Science (MES) of Bulgaria (Agreement № Д01-363/17.12.2020).
Institutional Review Board Statement
Not applicable.
Informed Consent Statement
Not applicable.
Data Availability Statement
The data presented in this study are available on request from the corresponding author.
Acknowledgments
The authors gratefully acknowledge the financial support of the Ministry of Education and Science, Bulgarian National Science Fund (Grant DN 19/15) and the National Science Program “Environmental Protection and Reduction of Risks of Adverse Events and Natural Disasters” (Agreement № Д01-363/17.12.2020).
Conflicts of Interest
The authors declare no conflict of interest. The funders had no role in the design of the study; in the collection, analyses or interpretation of data; in the writing of the manuscript; or in the decision to publish the results.
References
- Smith, K.; Balistrieri, L.; Todd, A. Using biotic ligand models to predict metal toxicity in mineralized systems. Appl. Geochem. 2015, 57, 55–72. [Google Scholar] [CrossRef] [Green Version]
- Thurman, E. Organic Geochemistry of Natural Waters; Martinus Nijhoff/Dr W. Junk Publishers: Dordrecht, The Netherlands, 1985; p. 497. [Google Scholar]
- De Schamphelaere, K.; Janssen, C. Development and field validation of a biotic ligand model predicting chronic copper toxicity to Daphnia magna. Environ. Toxicol. Chem. 2004, 23, 1365–1375. [Google Scholar] [CrossRef]
- Deleebeeck, N.; De Schamphelaere, K.; Janssen, C. A novel method for predicting chronic nickel bioavailability and toxicity to Daphnia magna in artificial and natural waters. Environ. Toxicol. Chem. 2008, 27, 2097–2107. [Google Scholar] [CrossRef] [PubMed]
- Heijerick, D.; De Schamphelaere, K.; Van Sprang, P.; Janssen, C. Development of a chronic zinc biotic ligand model for Daphnia magna. Ecotoxicol. Environ. Saf. 2005, 62, 1–10. [Google Scholar] [CrossRef] [PubMed]
- Di Toro, D.; Allen, H.; Bergman, H.; Meyer, J.; Paquin, P.; Santore, R. Biotic ligand model of the acute toxicity of metals. 1. Technical basis. Environ. Toxicol. Chem. 2001, 20, 2383–2396. [Google Scholar] [CrossRef]
- Ardestani, M.; van Straalen, N.; van Gestel, C. The relationship between metal toxicity and biotic ligand binding affinities in aquatic and soil organisms: A review. Environ. Pollut. 2014, 195, 133–147. [Google Scholar] [CrossRef]
- Traas, T.; Leeuwen, C. Ecotoxicological Effects. In Risk Assessment of Chemicals; Leeuwen, C., Vermeire, T., Eds.; Springer: Dordrecht, The Netherlands, 2007; p. 332. [Google Scholar]
- Technical Guidance to Implement Bioavailability-Based Environmental Quality Standards for Metals. Available online: https://bio-met.net/wp-content/uploads/2016/10/FINAL-TECHNICAL-GUIDANCE-TO-IMPLEMENT-BIOAVAILABILITYApril-2015.pdf (accessed on 5 January 2022).
- Sarathy, V.; Allen, H. Copper complexation by dissolved organic matter from surface water and wastewater effluent. Ecotoxicol. Environ. Saf. 2005, 61, 337–344. [Google Scholar] [CrossRef]
- Hoppe, S.; Gustafsson, J.; Borg, H.; Breitholtz, M. Evaluation of current copper bioavailability tools for soft freshwaters in Sweden. Ecotoxicol. Environ. Saf. 2015, 114, 143–149. [Google Scholar] [CrossRef]
- European Commission. Directive 2013/39/EU of the European Parliament and of the Council of 12 August 2013 Amending Directives 2000/60/EC and 2008/105/EC as Regards Priority Substances in the Field of Water Policy. Off. J. Eur. Union 2013, 226, 1–17. [Google Scholar]
- Workshop on Metal Bioavailability under the Water Framework Directive: Policy. Science and Implementation of Regulatory Tools. Available online: https://bio-met.net/wp-content/uploads/2016/10/110905-Draft-Bioavailability-Meeting-Report-FINAL.pdf (accessed on 5 January 2022).
- Merrington, G.; Peters, A. The Importance of Dissolved Organic Carbon in the Assessment of Environmental Quality Standard Compliance for Copper and Zinc. Available online: https://wfduk.org/sites/default/files/Media/DOC%20Report%20-%20final.pdf (accessed on 5 January 2022).
- Cousins, A.; Jönsson, A.; Iverfeldt, A. Testing the Biotic Ligand Model for Swedish Surface Water Conditions—A Pilot Study to Investigate the Applicability of BLM in Sweden; Swedish Environmental Research Institute Ltd.: Stockholm, Sweden, 2009. [Google Scholar]
- Hoppe, S.; Lithner, G.; Borg, H. Utvärdering av Användbarheten av BLM i Svenska Vatten; Stockholms Universitet: Stockholm, Sweden, 2009. [Google Scholar]
- Geoffroy, L.; Tack, K.; Andres, S. EQS for a metal: Is it possible to determine a lonely legal value? Interest of the Biotic Ligand Model (BLM)? In Proceedings of the Communication in the SETAC Annual Meeting, Seville, Spain, 23–27 May 2010. [Google Scholar]
- Tack, K. Prise en Compte de la Biodisponibilité des Métaux Selon la DCE: Guide Méthodologique; Institut National de l’Environnement industriel et des Risques: Verneuil-en-Halatte, France, 2012. [Google Scholar]
- Hommen, U.; Rüdel, H. Sensitivity Analysis of Existing Concepts for Application of Biotic Ligand Models (BLM) for the Derivation and Application of Environmental Quality Standards for Metals and Evaluation of the Approaches with Appropriate Monitoring Data Sets from German Waters. Final Report for FKZ 363 01 352, Schmallenberg, Germany. 2012. Available online: https://www.researchgate.net/profile/Heinz-Ruedel/publication/260337187_Sensitivity_analysis_of_existing_concepts_for_application_of_biotic_ligand_models_BLM_for_the_derivation_and_application_of_environmental_quality_standards_for_metals_and_evaluation_of_the_approaches_/links/02e7e530cdbd3c81da000000/Sensitivity-analysis-of-existing-concepts-for-application-of-biotic-ligand-models-BLM-for-the-derivation-and-application-of-environmental-quality-standards-for-metals-and-evaluation-of-the-approaches.pdf (accessed on 5 January 2022).
- Guidance Document No. 27 Technical Guidance for Deriving Environmental Quality Standards. In Common Implementation Strategy for the Water Framework Directive (2000/60/EC) Technical Report, Update Version. Available online: https://rvs.rivm.nl/sites/default/files/2019-04/Guidance%20No%2027%20-%20Deriving%20Environmental%20Quality%20Standards%20-%20version%202018.pdf (accessed on 5 January 2022).
- European Parliament, Council of the European Union. Directive 2000/60/EC of the European Parliament and of the Council establishing a framework for Community action in the field of water policy. Off. J. Eur. Communities 2000, 327, 1–72. [Google Scholar]
- Common Implementation Strategy for the Water Framework Directive (2000/60/EC). Guidance Document No. 19 Guidance on Surface Water Chemical Monitoring under the WFD. Available online: https://circabc.europa.eu/sd/a/e54e8583-faf5-478f-9b11-41fda9e9c564/Guidance (accessed on 5 January 2022).
- European Commission. Directive 2009/90/EC of 31 July 2009 laying down, pursuant to Directive 2000/60/EC of the European Parliament and of the Council, technical specifications for chemical analysis and monitoring of water status. Off. J. Eur. Union 2009, 201, 36–38. [Google Scholar]
- European Commission. Directive 2008/105/EC of the European Parliament and of the Council of 16 December 2008 on environmental quality standards in the field of water policy, amending and subsequently repealing Council Directives 82/176/EEC, 83/513/EEC, 84/156/EEC, 84/491/EEC, 86/280/EEC and amending Directive 2000/60/EC of the European Parliament and of the Council. Off. J. Eur. Union 2008, 348, 84–97. [Google Scholar]
- Nriagu, J.; Lawson, G.; Wong, H.; Azcue, J. A Protocol for Minimizing Contamination in the Analysis of Trace Metals in Great Lakes Waters. J. Great Lakes Res. 1993, 19, 175–182. [Google Scholar] [CrossRef]
- Horowitz, A.; Lum, K.; Garbarino, J.; Hall, G.; Lemieux, C.; Demas, C. Problems Associated with Using Filtration to Define Dissolved Trace Element Concentrations in Natural Water Samples. Environ. Sci. Technol. 1996, 30, 954–963. [Google Scholar] [CrossRef]
- Tipping, E.; Corbishley, H.; Koprivnjak, J.; Lapworth, D.; Miller, M.; Vincent, C.; Hamilton-Taylor, J. Quantification of natural DOM from UV Absorption at Two Wavelengths. Environ. Chem. 2009, 6, 472–476. [Google Scholar] [CrossRef] [Green Version]
- De Schamphelaere, K.; Vasconcelos, F.; Tack, F.; Allen, H.; Janssen, C. The effect of dissolved organic matter source on acute copper toxicity to Daphnia magna. Environ. Toxicol. Chem. 2004, 23, 1248–1255. [Google Scholar] [CrossRef]
- Comber, S.; Georges, K. Tiered Approach to the Assessment of Metal Compliance in Surface Waters; Environment Agency, Bristol, UK. Available online: https://www.wfduk.org/sites/default/files/Media/Environmental%20standards/Tiered%20approach%20metal%20compliance.pdf (accessed on 5 January 2022).
- Peters, A.; Crane, M.; Adams, W. Effects of iron on benthic macroinvertebrate communities in the field. Bull. Environ. Contam. Toxicol. 2011, 86, 591–595. [Google Scholar] [CrossRef] [PubMed]
- Mueller, K.; Fortin, C.; Campbell, P. Spatial Variation in the Optical Properties of Dissolved Organic Matter (DOM) in Lakes on the Canadian Precambrian Shield and Links to Watershed Characteristics. Aquatic. Geochem. 2012, 18, 21–44. [Google Scholar] [CrossRef]
- Schwartz, M.; Curtis, P.; Playle, R. Influence of natural organic matter source on acute copper, lead, and cadmium toxicity to rainbow trout (Oncorhynchus mykiss). Environ. Toxicol. Chem. 2004, 23, 2889–2899. [Google Scholar] [CrossRef]
- DV. Ordinace N 4 for characterisation of surface waters. DV 2013, 22, 9–46. (In Bulgarian) [Google Scholar]
- Mattsson, T.; Kortelainen, P.; Räike, A. Export of DOM from Boreal Catchments: Impacts of Land Use Cover and Climate. Biogeochemistry 2005, 76, 373–394. [Google Scholar] [CrossRef]
- DEQ. Implementation of the Freshwater Aquatic Life Water Quality Standards for Copper; Oregon Department of Environmental Quality: Portland, OR, USA, 2016.
- Kalev, S.; Toor, G. Concentrations and Loads of Dissolved and Particulate Organic Carbon in Urban Stormwater Runoff. Water 2020, 12, 1031. [Google Scholar] [CrossRef] [Green Version]
- Gooddy, D.; Hinsby, K. Organic Quality of Groundwaters. In Natural Groundwater Quality; Edmunds, W., Shand, P., Eds.; Blackwell: Oxford, UK, 2008; pp. 59–72. [Google Scholar]
- Draft Technical Support Document: Recommended Estimates for Missing Water Quality Parameters for Application in EPA’s Biotic Ligand Model; US EPA: Washington, DC, USA, 2016. Available online: https://archive.epa.gov/epa/sites/production/files/2016-02/documents/draft-tsd-recommended-blm-parameters.pdf (accessed on 5 January 2022).
Figure 1.
Data availability map.

Figure 2.
The relationship between the measured concentrations of DOC and dissolved Fe in Bulgarian surface waters.
Figure 2.
The relationship between the measured concentrations of DOC and dissolved Fe in Bulgarian surface waters.

Figure 3.
The relationship between the measured concentrations of DOC and TOC in Bulgarian surface waters.
Figure 3.
The relationship between the measured concentrations of DOC and TOC in Bulgarian surface waters.

Figure 4.
The comparison of the BIO-MET calculated RCR for Cu between the matching data and substituted data (P25_BG—the 25th percentile of the available DOC data and/or the DOC data calculated by the TOC from the Bulgarian monitoring network results during 2020; P25_SWB—the 25th percentile of the DOC data calculated by the TOC for the respective water body; TOC—the matching DOC data calculated by TOC).

Figure 5.
The comparison of the M-BAT calculated RCR for Cu between the matching data and substituted data (P25_BG—the 25th percentile of the available DOC data and/or the DOC data calculated by the TOC from the Bulgarian monitoring network results during 2020; P25_SWB—the 25th percentile of the DOC data calculated by the TOC for the respective water body; TOC—the matching DOC data calculated by TOC).

Figure 6.
The comparison of the PNEC Pro calculated RCR for Cu between the matching data and substituted data (P25_BG—the 25th percentile of the available DOC data and/or the DOC data calculated by the TOC from the Bulgarian monitoring network results during 2020; P25_SWB—the 25th percentile of the DOC data calculated by the TOC for the respective water body; TOC—the matching DOC data calculated by TOC).

Figure 7.
The comparison of the BIO-MET calculated RCR for Zn between the matching data and substituted data (P25_BG—the 25th percentile of the available DOC data and/or the DOC data calculated by the TOC from the Bulgarian monitoring network results during 2020; P25_SWB—the 25th percentile of the DOC data calculated by the TOC for the respective water body; TOC—the matching DOC data calculated by TOC).

Figure 8.
The comparison of the M-BAT calculated RCR for Zn between the matching data and substituted data (P25_BG—the 25th percentile of the available DOC data and/or the DOC data calculated by the TOC from the Bulgarian monitoring network results during 2020; P25_SWB—the 25th percentile of the DOC data calculated by the TOC for the respective water body; TOC—the matching DOC data calculated by TOC).

Figure 9.
The comparison of the PNEC Pro calculated RCR for Zn between the matching data and substituted data (P25_BG—the 25th percentile of the available DOC data and/or the DOC data calculated by the TOC from the Bulgarian monitoring network results during 2020; P25_SWB—the 25th percentile of the DOC data calculated by the TOC for the respective water body; TOC—the matching DOC data calculated by TOC).

Figure 10.
The comparison of the BIO-MET calculated RCR for Pb between the matching data and substituted data (P25_BG—the 25th percentile of the available DOC data and/or the DOC data calculated by the TOC from the Bulgarian monitoring network results during 2020; P25_SWB—the 25th percentile of the DOC data calculated by the TOC for the respective water body; TOC—the matching DOC data calculated by TOC).

Figure 11.
The comparison of the M-BAT calculated RCR for Pb between the matching data and substituted data (P25_BG—the 25th percentile of the available DOC data and/or the DOC data calculated by the TOC from the Bulgarian monitoring network results during 2020; P25_SWB—the 25th percentile of the DOC data calculated by the TOC for the respective water body; TOC—the matching DOC data calculated by TOC).

Figure 12.
The comparison of the PNEC Pro calculated RCR for Pb between the matching data and substituted data (P25_BG—the 25th percentile of the available DOC data and/or the DOC data calculated by the TOC from the Bulgarian monitoring network results during 2020; P25_SWB—the 25th percentile of the DOC data calculated by the TOC for the respective water body; TOC—the matching DOC data calculated by TOC).


Table 1.
The basic statistics of the monitoring data for the Bulgarian surface waters (2010–2020).
| Monitoring Data | |||
|---|---|---|---|
| DOC | Fedissolved | TOC | |
| Results | 1829 | 13,234 | 11,943 |
| Water bodies (n = 952) | 143 | 513 | 545 |
| Average | 5.50 mg/L | 68.61 mg/L | 6.71 mg/L |
| Standard deviation | 6.92 mg/L | 602.61 mg/L | 11.74 mg/L |
| Median | 3.80 mg/L | 22.00 mg/L | 4.80 mg/L |
Table 2.
The exceedances for Cu, Zn, Ni and Pb in the studied Bulgarian surface water bodies.
| Water Body | Cu | Zn | Ni | Pb | |
|---|---|---|---|---|---|
| 1 | Dospat Dam | + | + | ||
| 2 | Pchelina Dam | + | + | + | |
| 3 | Iskar Dam | + | + | ||
| 4 | Strumeshnitsa | + | |||
| 5 | Mesta | + | |||
| 6 | Yantra | + | |||
| 7 | Dospat | + | + | ||
| 8 | Dragovishtitsa | + | + | ||
| 9 | Negovanka | + | |||
| 10 | Eleshnitsa | + | + | ||
| 11 | Struma | + | + | + | |
| 12 | Rusenski Lom | + | + | ||
| 13 | Iskar | + |
Table 3.
The exceedances for Cu, Zn, Ni and Pb in the studies of Bulgarian surface water bodies after the application of the BLMs.
Table 3.
The exceedances for Cu, Zn, Ni and Pb in the studies of Bulgarian surface water bodies after the application of the BLMs.
| Element | BLM | Data Used | Totals | Exceedances |
|---|---|---|---|---|
| EQS Cu = 1 µg/L | Measured Cu | 63 | 56 | |
| RCR BIO-MET | Measured DOC | 63 | 5 | |
| DOC = 0.81 × TOC | 63 | 4 | ||
| 25th percentile DOC (P25_BG) | 63 | 8 | ||
| 25th percentile TOC (P25_SWB) | 63 | 7 | ||
| RCR M-BAT | Measured DOC | 63 | 7 | |
| DOC = 0.81 × TOC | 63 | 6 | ||
| 25th percentile DOC (P25_BG) | 63 | 7 | ||
| 25th percentile TOC (P25_SWB) | 63 | 9 | ||
| RCR PNEC | Measured DOC | 63 | 9 | |
| DOC = 0.81 × TOC | 63 | 8 | ||
| 25th percentile DOC (P25_BG) | 63 | 10 | ||
| 25th percentile TOC (P25_SWB) | 63 | 5 | ||
| EQS Zn = 8 µg/L | Measured Zn | 34 | 14 | |
| RCR BIO-MET | Measured DOC | 34 | 2 | |
| DOC = 0.81 × TOC | 34 | 5 | ||
| 25th percentile DOC (P25_BG) | 34 | 7 | ||
| 25th percentile TOC (P25_SWB) | 34 | 6 | ||
| RCR M-BAT | Measured DOC | 34 | 6 | |
| DOC = 0.81 × TOC | 34 | 6 | ||
| 25th percentile DOC (P25_BG) | 34 | 7 | ||
| 25th percentile TOC (P25_SWB) | 34 | 7 | ||
| RCR PNEC | Measured DOC | 34 | 6 | |
| DOC = 0.81 × TOC | 34 | 5 | ||
| 25th percentile DOC (P25_BG) | 34 | 7 | ||
| 25th percentile TOC (P25_SWB) | 34 | 6 | ||
| EQS Pb = 1.2 µg/L | Measured Pb | 22 | 8 | |
| RCR BIO-MET | Measured DOC | 22 | 0 | |
| DOC = 0.81 × TOC | 22 | 0 | ||
| 25th percentile DOC (P25_BG) | 22 | 0 | ||
| 25th percentile TOC (P25_SWB) | 22 | 0 | ||
| RCR M-BAT | Measured DOC | 22 | 0 | |
| DOC = 0.81 × TOC | 22 | 0 | ||
| 25th percentile DOC (P25_BG) | 22 | 0 | ||
| 25th percentile TOC (P25_SWB) | 22 | 0 | ||
| RCR PNEC | Measured DOC | 22 | 0 | |
| DOC = 0.81 × TOC | 22 | 0 | ||
| 25th percentile DOC (P25_BG) | 22 | 1 | ||
| 25th percentile TOC (P25_SWB) | 22 | 0 |
Publisher’s Note: MDPI stays neutral with regard to jurisdictional claims in published maps and institutional affiliations. |
© 2022 by the authors. Licensee MDPI, Basel, Switzerland. This article is an open access article distributed under the terms and conditions of the Creative Commons Attribution (CC BY) license (https://creativecommons.org/licenses/by/4.0/).
Share and Cite
MDPI and ACS Style
Venelinov, T.; Tsakovski, S. How to Implement User-Friendly BLMs in the Absence of DOC Monitoring Data: A Case Study on Bulgarian Surface Waters. Water 2022, 14, 246. https://doi.org/10.3390/w14020246
AMA Style
Venelinov T, Tsakovski S. How to Implement User-Friendly BLMs in the Absence of DOC Monitoring Data: A Case Study on Bulgarian Surface Waters. Water. 2022; 14(2):246. https://doi.org/10.3390/w14020246
Chicago/Turabian StyleVenelinov, Tony, and Stefan Tsakovski. 2022. "How to Implement User-Friendly BLMs in the Absence of DOC Monitoring Data: A Case Study on Bulgarian Surface Waters" Water 14, no. 2: 246. https://doi.org/10.3390/w14020246
Note that from the first issue of 2016, this journal uses article numbers instead of page numbers. See further details here.