
A Modified AVI Model for Groundwater Vulnerability Mapping: Case Studies in Southern Italy


Department of Civil Architectural and Environmental Engineering, Università degli Studi di Napoli Federico II, 80125 Naples, Italy
*
Author to whom correspondence should be addressed.
Water 2022, 14(2), 248; https://doi.org/10.3390/w14020248
Submission received: 7 December 2021
/
Revised: 9 January 2022
/
Accepted: 11 January 2022
/
Published: 15 January 2022
(This article belongs to the Special Issue Groundwater Vulnerability to Pollution Assessment)
Abstract
:Many methods for evaluating the aquifer’s vulnerability to pollution have been developed in the past four decades by using geographic information system (GIS) tools. However, even if the aquifer vulnerability concept is well defined and the methods have been constantly tested and compared, the problem of the choice of the best “standard” method remains. To meet these objectives, aquifer vulnerability maps are of crucial importance. The choice of method depends on several factors, including the scale of the project, the hydrogeological characteristics of the area, and data availability. Among the many methods, the AVI (Aquifer Vulnerability Index) method has been widely used as it considers only two physical parameters. The AVI Index represents the hydraulic resistance of an aquifer to vertical flow, as a ratio between the thickness of each sedimentary unit above the uppermost aquifer (D, length), and the estimated hydraulic conductivity (K, length/time) of each of these layers. The AVI Index has a time dimension and is divided into five classes. In order to avoid a widespread presence of the higher vulnerability classes, especially in shallow aquifers, the AVI classification has been modified using statistical methods. The study reports the application of the modified AVI method for groundwater pollution vulnerability, in three different areas of southern Italy, highlighting the limitations of the method in alluvial aquifers and the differences with other methods.
1. Introduction
Groundwater, accounting for over 97% of all freshwater available on earth, is a key factor for human life, but it is a vulnerable resource. In natural conditions, groundwater quality depends on aquifer lithology, groundwater flow velocity, quality of the recharge water, biological factors, and relationships with other aquifers and surface water. The worsening of the groundwater quality is due to agricultural, domestic, and industrial activities. The products deriving from these anthropogenic activities (sewage, wastes, etc.) are generally spread on the ground’s surface, and occasionally, especially in the past and in illegal practices, directly introduced into the aquifer, e.g., by wells.
The slow movement of groundwater through the vadose zone and aquifers determines that the pollution, generated by agricultural, industrial, and other anthropogenic activities (sometimes decades ago!), can affect the current groundwater quality and this can continue into the future.
In order to restore groundwater quality, large economic resources and efforts are required; groundwater remediation techniques are available and have been continuously implemented in the past years, but they are costly and only applicable to small areas.
At medium/large scale, groundwater vulnerability assessment is an effective and inexpensive tool for protecting groundwater resources from contamination. Moreover, groundwater vulnerability maps can support the assessment of the risk of contamination, if coupled with the hazard assessment.
The concept of “groundwater vulnerability” was introduced by Margat during the 1960s [1], starting from the idea that the vadose zone offers a protection against contaminants for the aquifers, through chemical reactions and physical barriers. Since the 1970s, several groundwater vulnerability assessment methods have been proposed and since the 1980s, the advent of GIS has allowed a strong improvement of these methods. Exhaustive and detailed descriptions of the main methods are in [2,3,4]. Among these, methods for precise hydrogeological environments have also been developed, e.g., to assess the vulnerability of karst aquifers [5,6].
Moreover, there are methods for intrinsic and specific vulnerability. The term “intrinsic vulnerability” indicates a susceptibility of the groundwater bodies to receive all types of contaminants, while the “specific vulnerability” indicates a susceptibility to receive one type or a family of contaminants (e.g., pesticides), considering the properties of the analysed contaminant. The intrinsic vulnerability is the object of this present study.
In general, there are three types of methods for intrinsic vulnerability assessment: empirical methods, statistical methods and parametric methods. The first are generally based on a qualitative knowledge of the lithology of the vadose zone and of the depth-to-groundwater: the more permeable the lithology and thinner the vadose zone, the more vulnerable the aquifer [7,8]. The second method to obtain the vulnerability maps by statistical simulations is to analyse the quality and reliability of the final results and to evaluate the model with the best performance [9,10]. The third method is the most common methods in groundwater vulnerability mapping. Among these, there are different approaches based on how the considered parameters affect the vulnerability: the Matrix Systems (MS), the Rating Systems (RS), and the Point Count System Models (PCSM).
In PCSM, each parameter is classified with a rating on the basis of its natural vulnerability to contamination. Each parameter has a different weight based on the function of the variable importance of the total vulnerability. Finally, the vulnerability degree depends on the weighted sum of the ratings of all the parameters.
Among the latter, the DRASTIC model [11], is the most used method worldwide to evaluate the intrinsic vulnerability of porous aquifers: it uses a lot of applications and modifications (e.g., the recent [12,13]). The AVI (Aquifer Vulnerability Index) method [14] was developed a few years after DRASTIC, utilizes the potential offered by GIS systems, and has also been widely used because it has the advantage of using only two physical parameters. Comparisons between these two methods [10,15,16,17,18,19,20] demonstrate that both AVI and DRASTIC are suitable for predicting the pollution potential for porous aquifers. The AVI method tends towards higher vulnerability outcomes than DRASTIC, especially in shallow aquifers [21].
In order to reduce this difference in outcome, a new classification for the AVI method has been developed using a statistical approach. The modified AVI method has been tested and applied to three study areas in southern Italy, with porous alluvial aquifers.
2. Materials and Methods
2.1. Study Areas
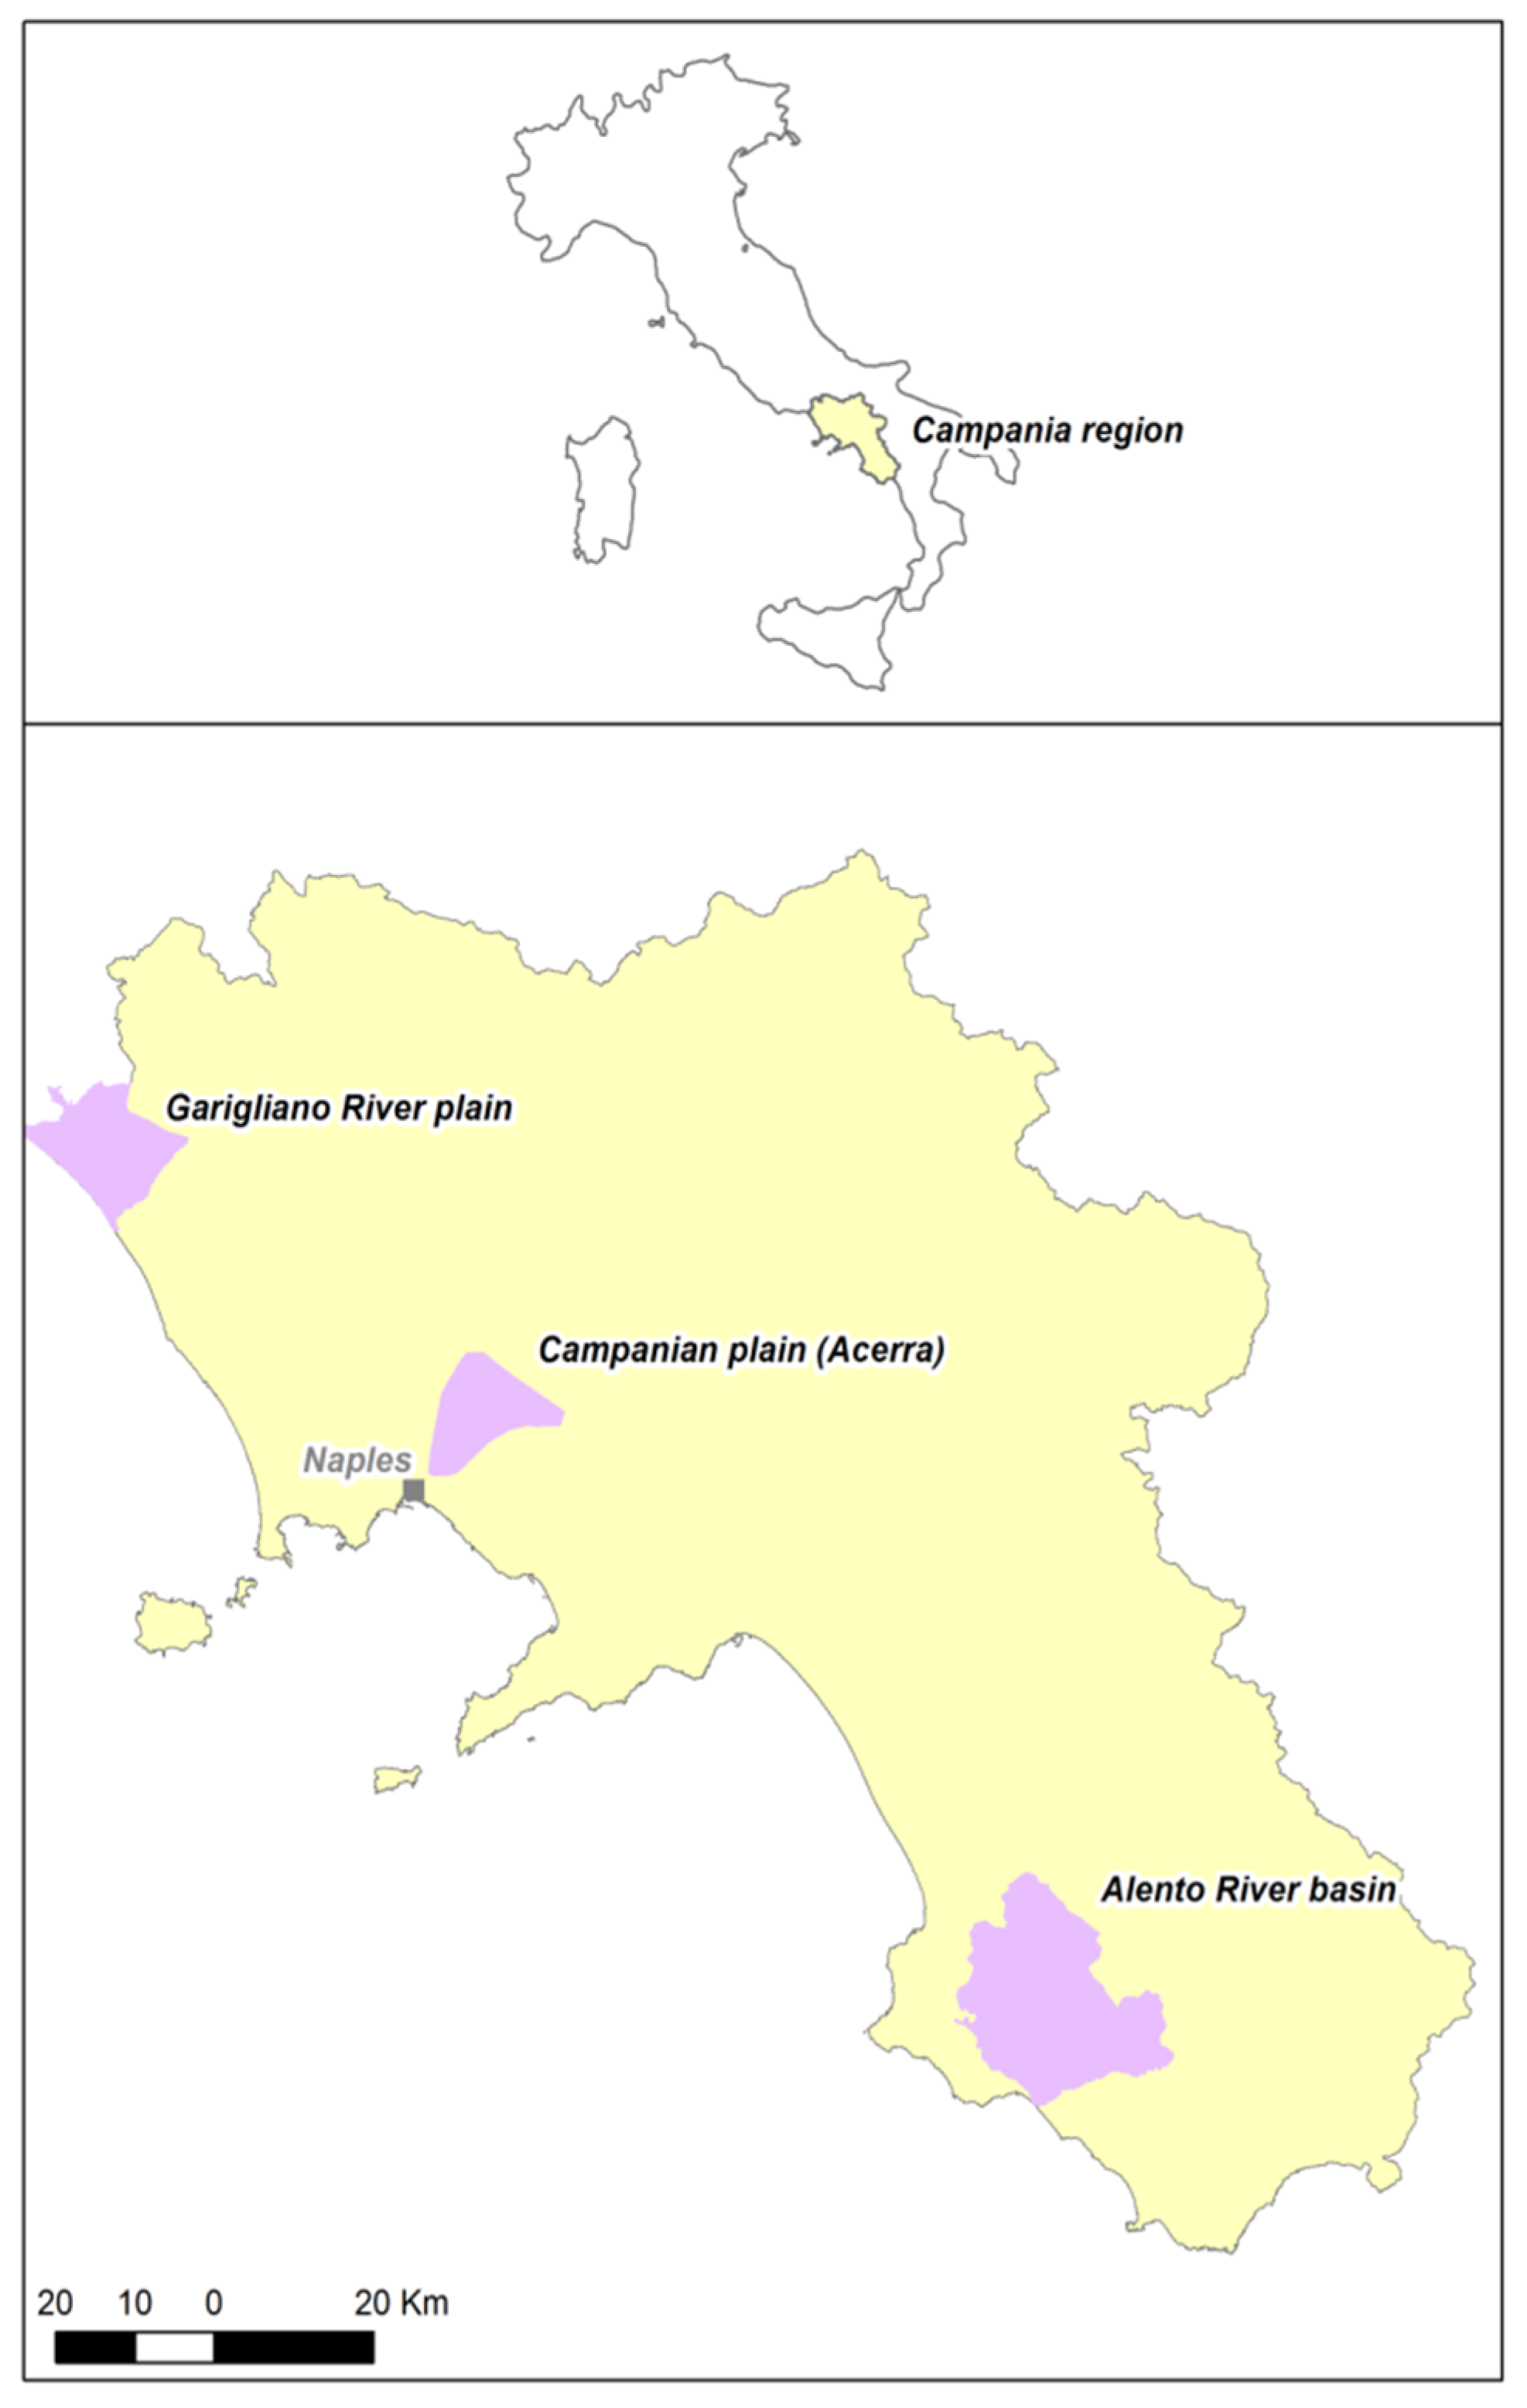
The study areas are all located in southern Italy (Figure 1) in or near the Campania region.
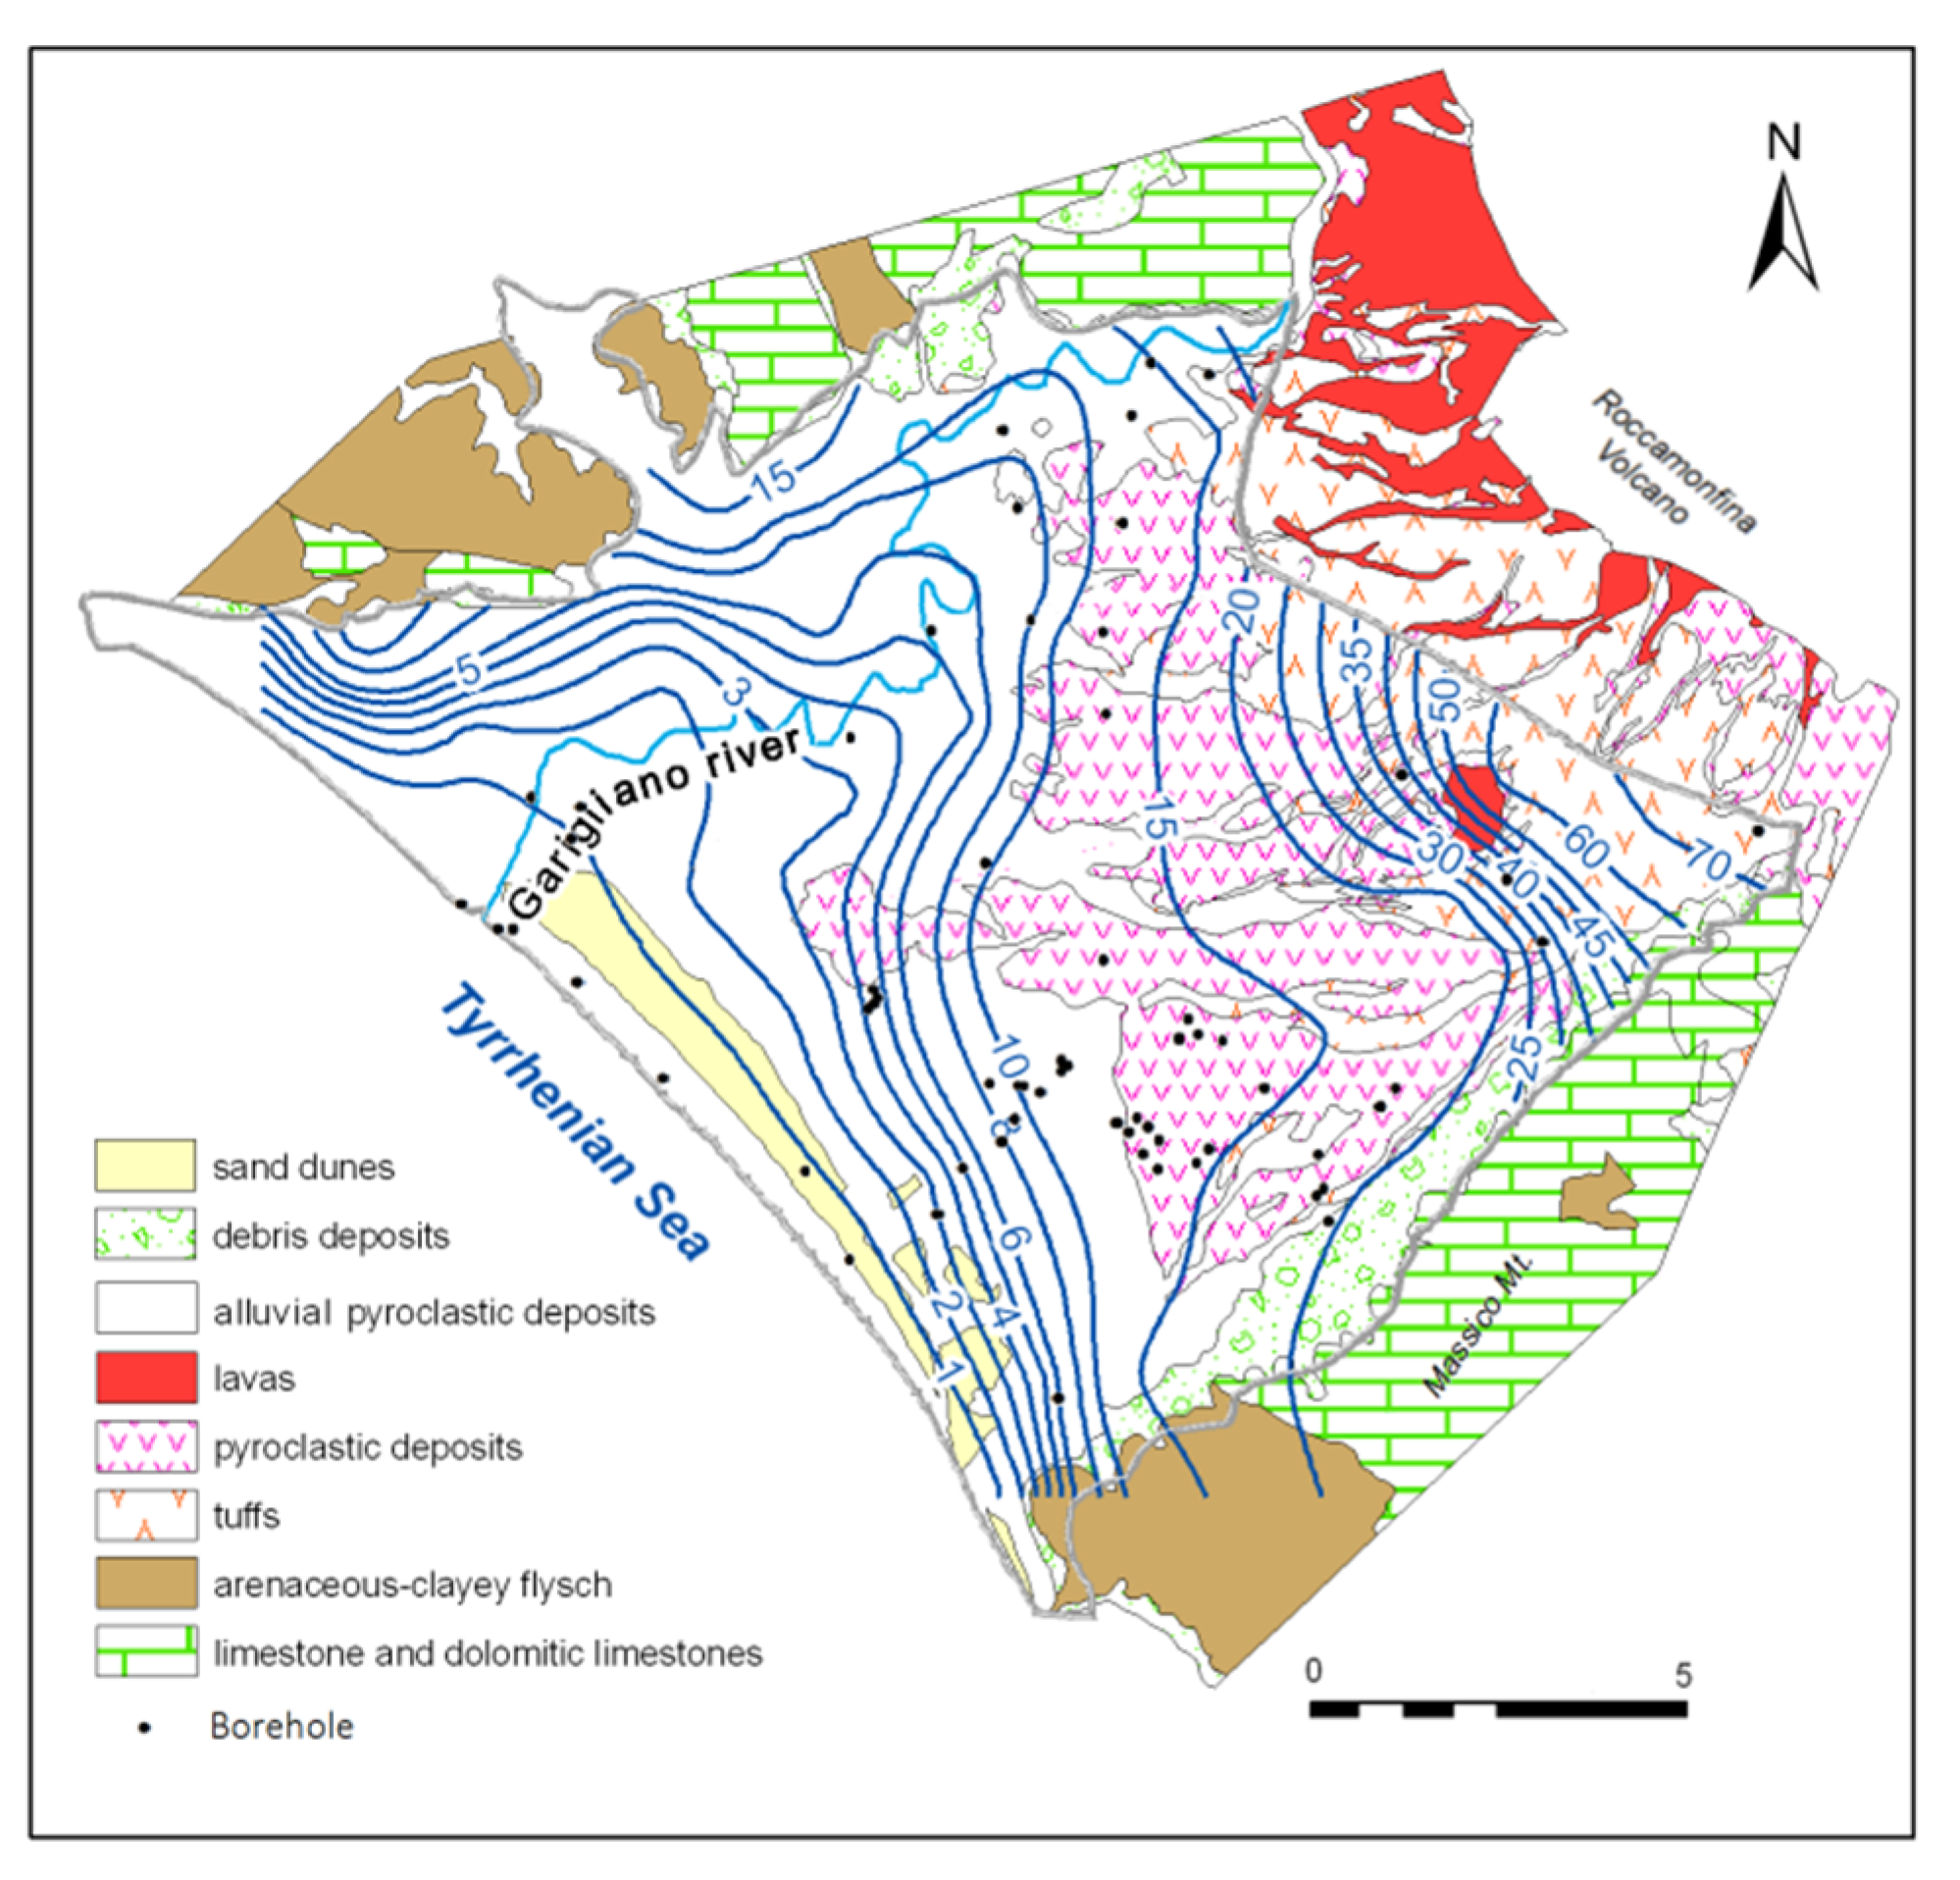
The Garigliano River Plain (about 170 km2 in area) is located at the northern border of the Campania region and it includes a small part of the Latium region. The plain overlies a graben infilled with upper Miocene–Quaternary clastic sediments, and, in the northeastern part, it is infilled with volcanoclastic deposits from the nearby Roccamonfina volcano (550 ky to 150 ky).
The groundwater body [22] consists of marine and alluvial deposits, interbedded in the northeastern sector, with pyroclastic layers of the Roccamonfina volcano. Sand dunes run along the SW border of the plain, parallel to the coastline (Figure 2). Except for the dunes, the aquifer is confined or semi-confined. The groundwater flow is directed toward the sea and the Garigliano River (Figure 2). The depth to the groundwater ranges from about 100 m a.s.l. at the foot of the slope of the Roccamonfina volcano to only a few meters in the rest of the plain, with the smallest values near the coast. About 80 boreholes are used to derive the parameters necessary for applying the vulnerability methods (Figure 2). Previous studies [21] indicate that the aquifers of this area have a high vulnerability to contamination.
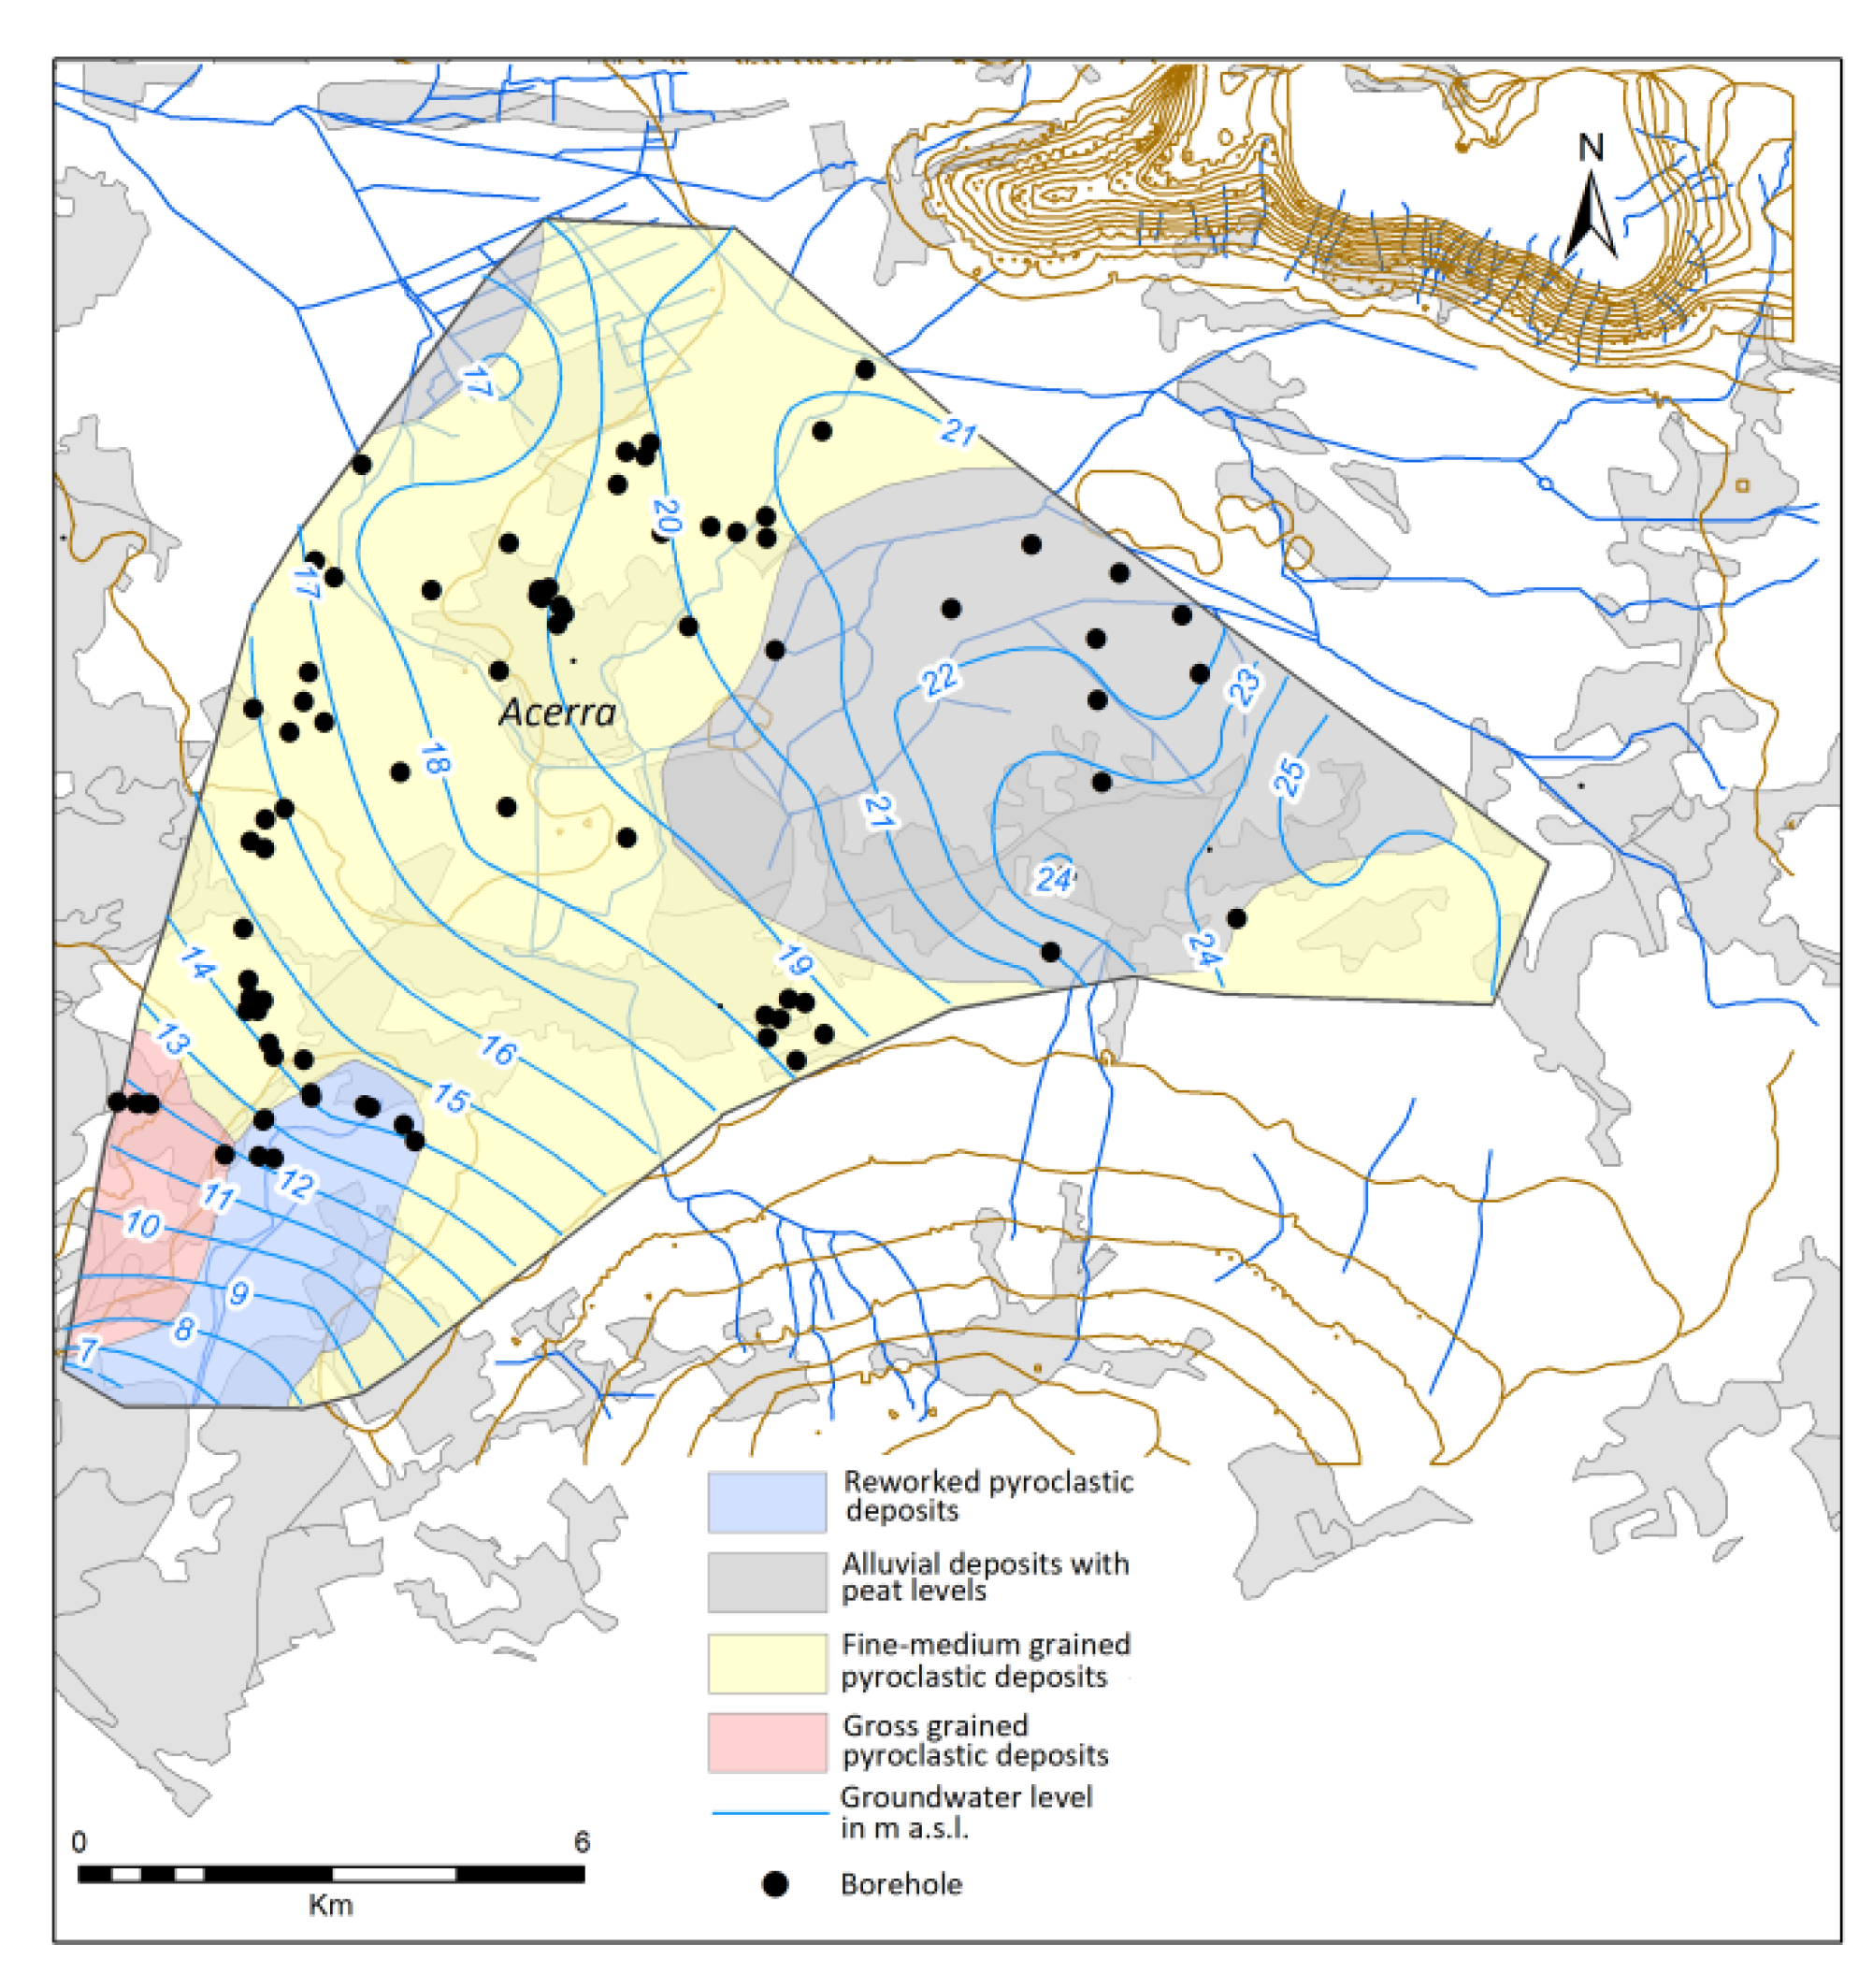
The Campanian Plain-Acerra (Figure 1) aquifer (about 130 km2 in area) is part of the eastern Plain of Naples groundwater body, and contains volcanic, alluvial, and marine deposits. It is locally possible to distinguish a shallow groundwater body in the alluvial and pyroclastic deposits over the Campanian tuff and a confined groundwater body in the pyroclastic–alluvial deposits below the tuff.
The shallow aquifer is phreatic, composed of 10–20 m of fine-medium-grained pyroclastic deposits overlying the tuff. In the southwestern part of the aquifer, toward Naples, the tuff is absent and the thickness of the aquifer is greater. The depth to water is predominantly between 5 and 10 m. There are 78 boreholes (Figure 3) that have been used to apply the vulnerability methods. Previous studies indicate that in the area there are sectors with very high vulnerability [13,15,23].
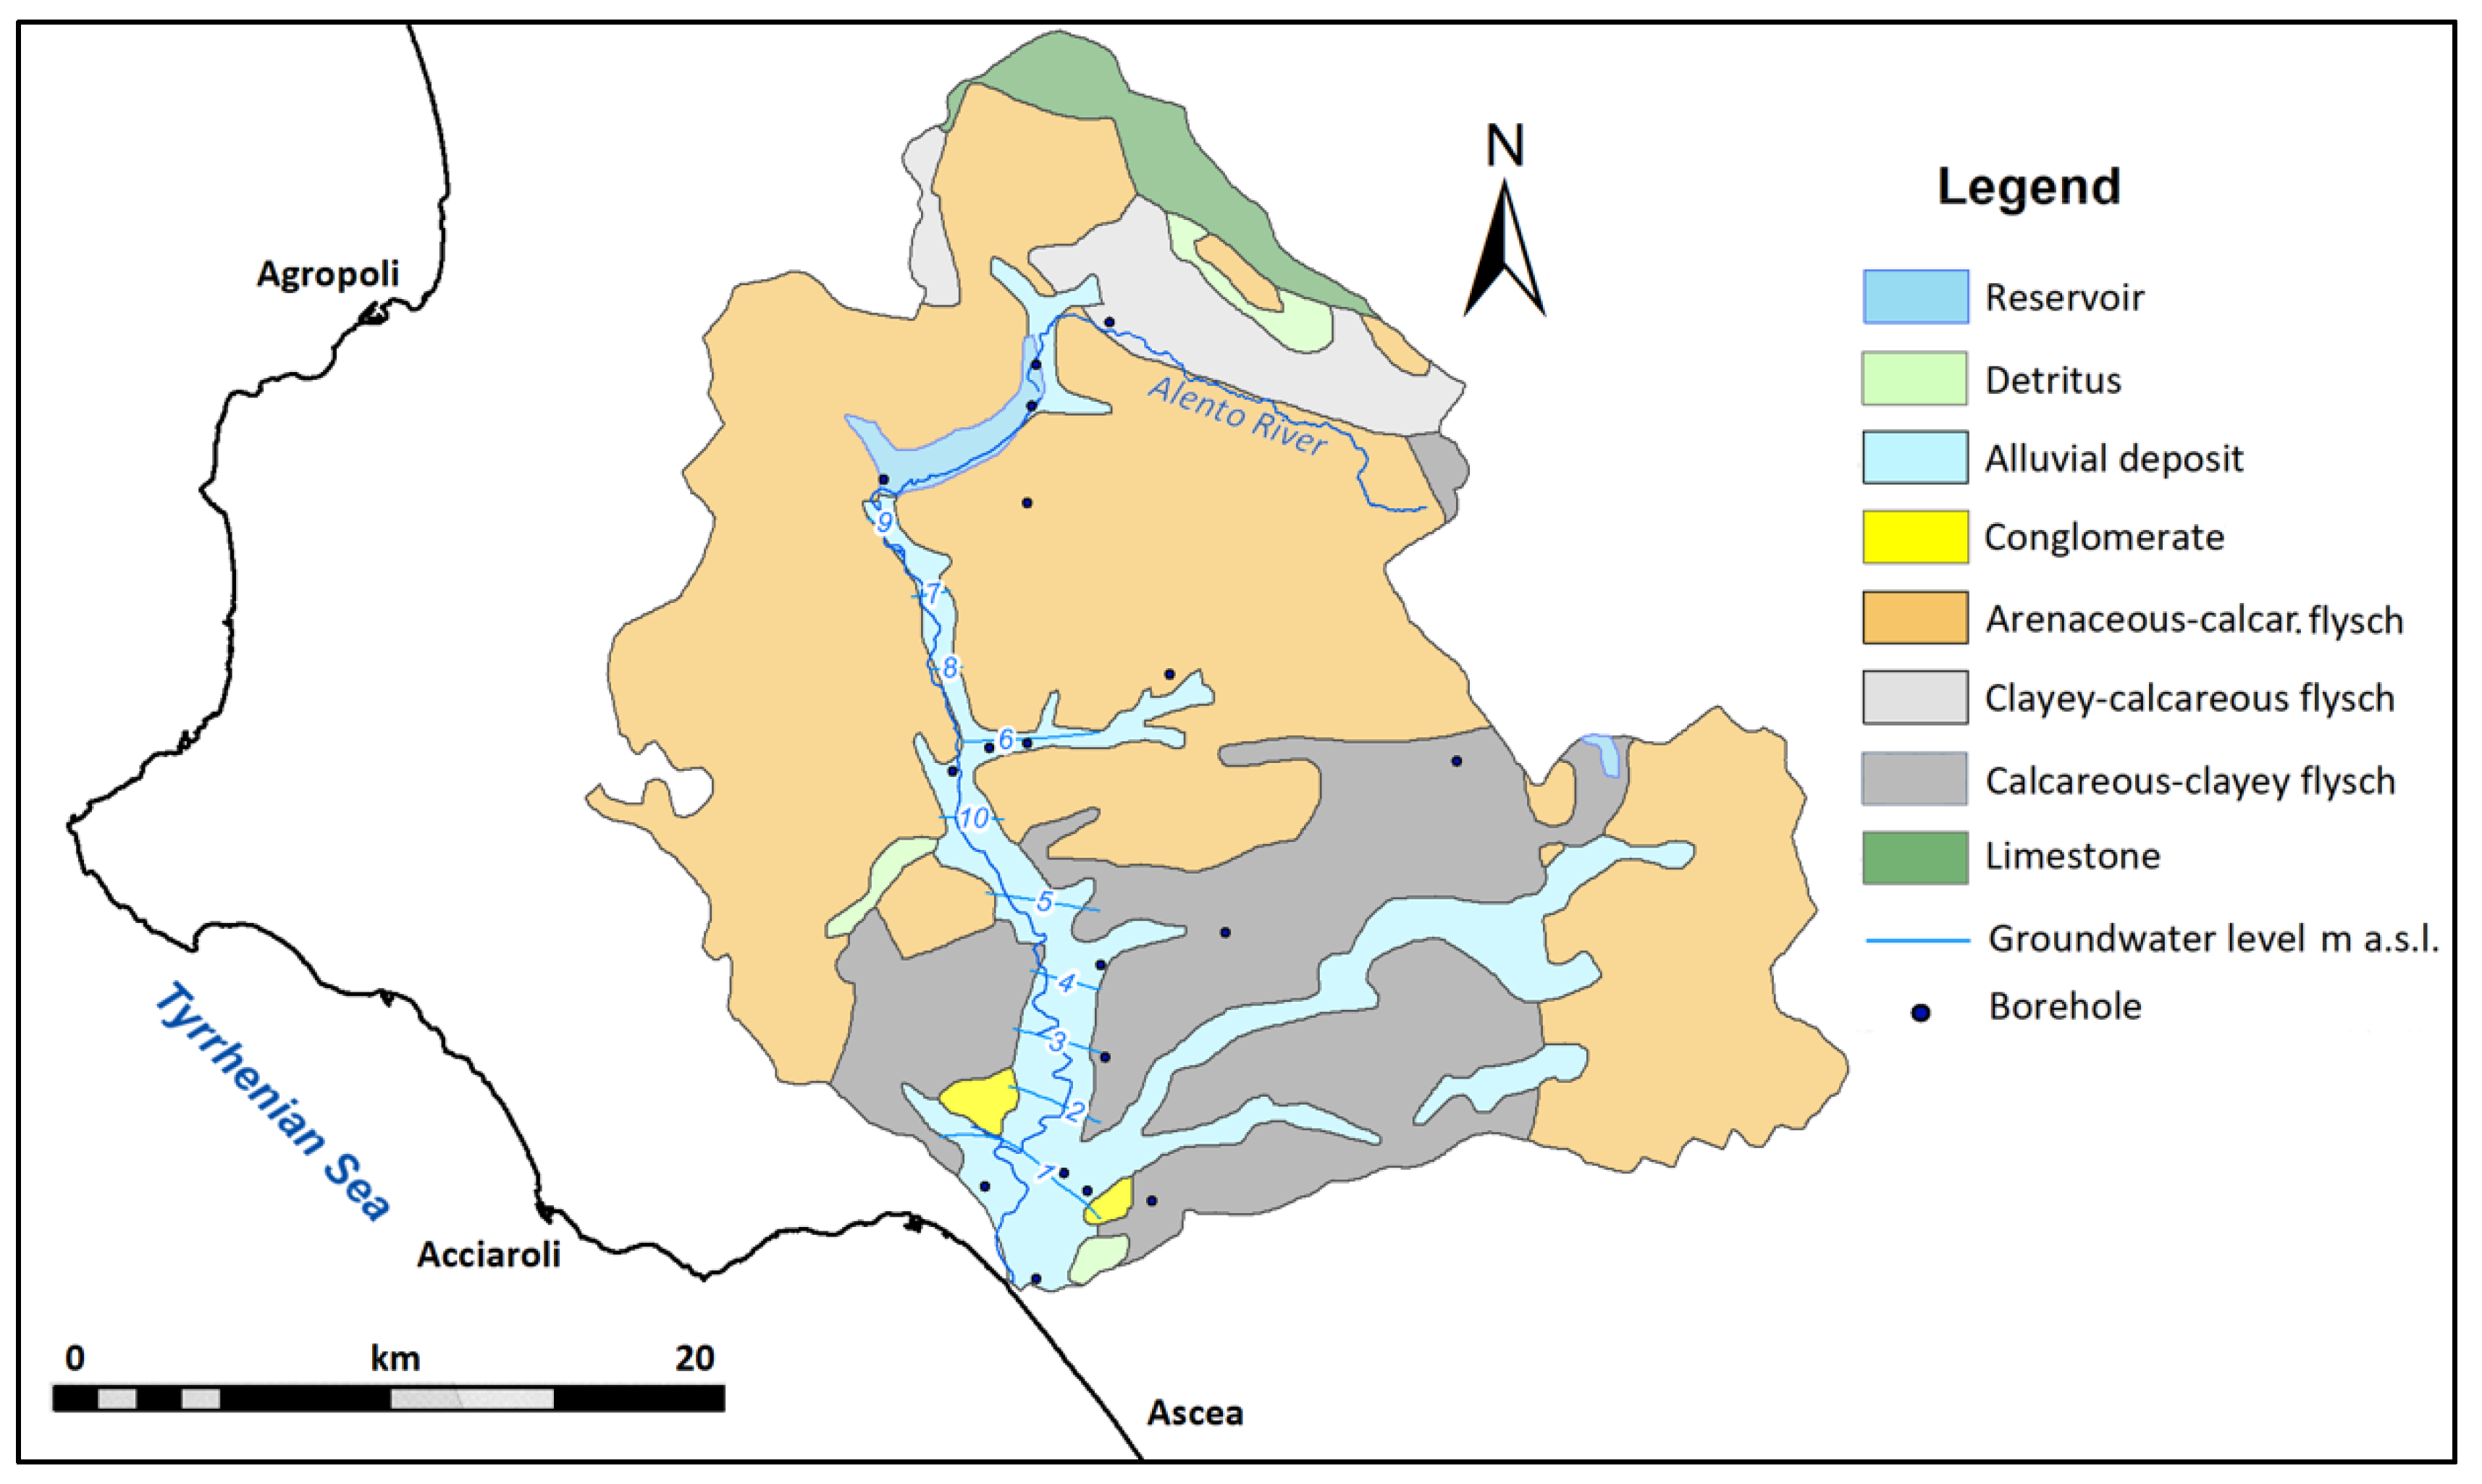
The Alento River basin (284 km2) is located in the southern part of the Campania region (Figure 1). The morphology is hilly and mountainous (85%) and includes Monte Sacro: 1705 m a.s.l., Monte Scuro: 1610 m a.s.l., and Monte Falascoso: 1494 m a.s.l. Flat areas (15%) occur at the bottom of the valleys and along the coast. There is a calcareous unit (5%, in the northern part of the basin) (Figure 4) with high karst permeability, the flysch units (from arenaceous–calcareous to calcareous–clayey), have low permeability and fragmented groundwater flow. The porous units of the plain have a permeability degree from medium to high, and they form the main aquifer of the area.
The groundwater flow is towards the sea and the groundwater levels range from 50 m a.s.l. to sea level. Stratigraphic data from 23 boreholes (Figure 4) were used in this study.
The vulnerability methods have been applied only to the Alento plain, the alluvial portion of the Alento River basin, with an area extended for about 50 km2.
2.2. The Methods and the Proposed AVI Modifications
The DRASTIC method proposed by the US Environmental Protection Agency, [11] is a PCSM that evaluates the vertical vulnerability using seven parameters: depth to water, net recharge, aquifer media, soil media, topography, impact of the vadose zone, and hydraulic conductivity. Each mapped factor is classified either into ranges (for continuous variables) or into significant media types (for thematic data), which have an impact on potential pollution. Weighting factors are applied to balance and to enhance their importance. The derived vulnerability index is a weighted sum of the rating value R of the seven factors, D, R, A, S, T, I, and C, in the study area multiplied by W, the weight associated with each factor. DRASTIC provides two weight classifications, one for normal conditions and the other one for conditions with strong agricultural activity. A classification of DRASTIC indexes is proposed in Table 1.
The AVI method computes the Aquifer Vulnerability Index (AVI) on the basis of the hydraulic resistance (C) computed as a ratio between the thickness of each sedimentary unit above the uppermost aquifer (d) and the estimated hydraulic conductivity of each of these layers (K): C = ∑di/Ki. The hydraulic resistance (vulnerability index) is an inverse indicator of vulnerability that can be used as a rough estimate of vertical travel time of water through the unsaturated layers, although important parameters controlling the travel time, such as hydraulic gradient and diffusion, are not considered.
The classification of the AVI method was created from the available borehole data for each study area (Figure 2, Figure 3 and Figure 4). Each borehole was classified on the basis of the permeability (Ki) of each stratigraphic unit present in the unsaturated zone (thickness di). The limit of the saturated zone was set equal to the piezometric level for the phreatic aquifers of the Campanian plain-Acerra and the Alento plain (the alluvial portion of the Alento River basin) and part of the Garigliano River plain. The Garigliano groundwater body is confined in the central-southern part; in this case the limit of the saturated zone is the bottom of the impermeable confining layer.
The hydraulic resistance C (in years) was calculated; the log10C was used for computational purposes. The values were interpolated using the kriging technique. The vulnerability index classification includes 5 classes (Table 1).
In order to be able to achieve a new classification that is more suitable for alluvial shallow aquifers, the interpolated maps of log10C were resampled with a low resolution (500 m) for the three study areas, with the aim of producing values comparable with the DRASTIC computations.
The cumulative frequency histogram of the values was extracted from each raster and merged into a single histogram.
3. Results and Discussion
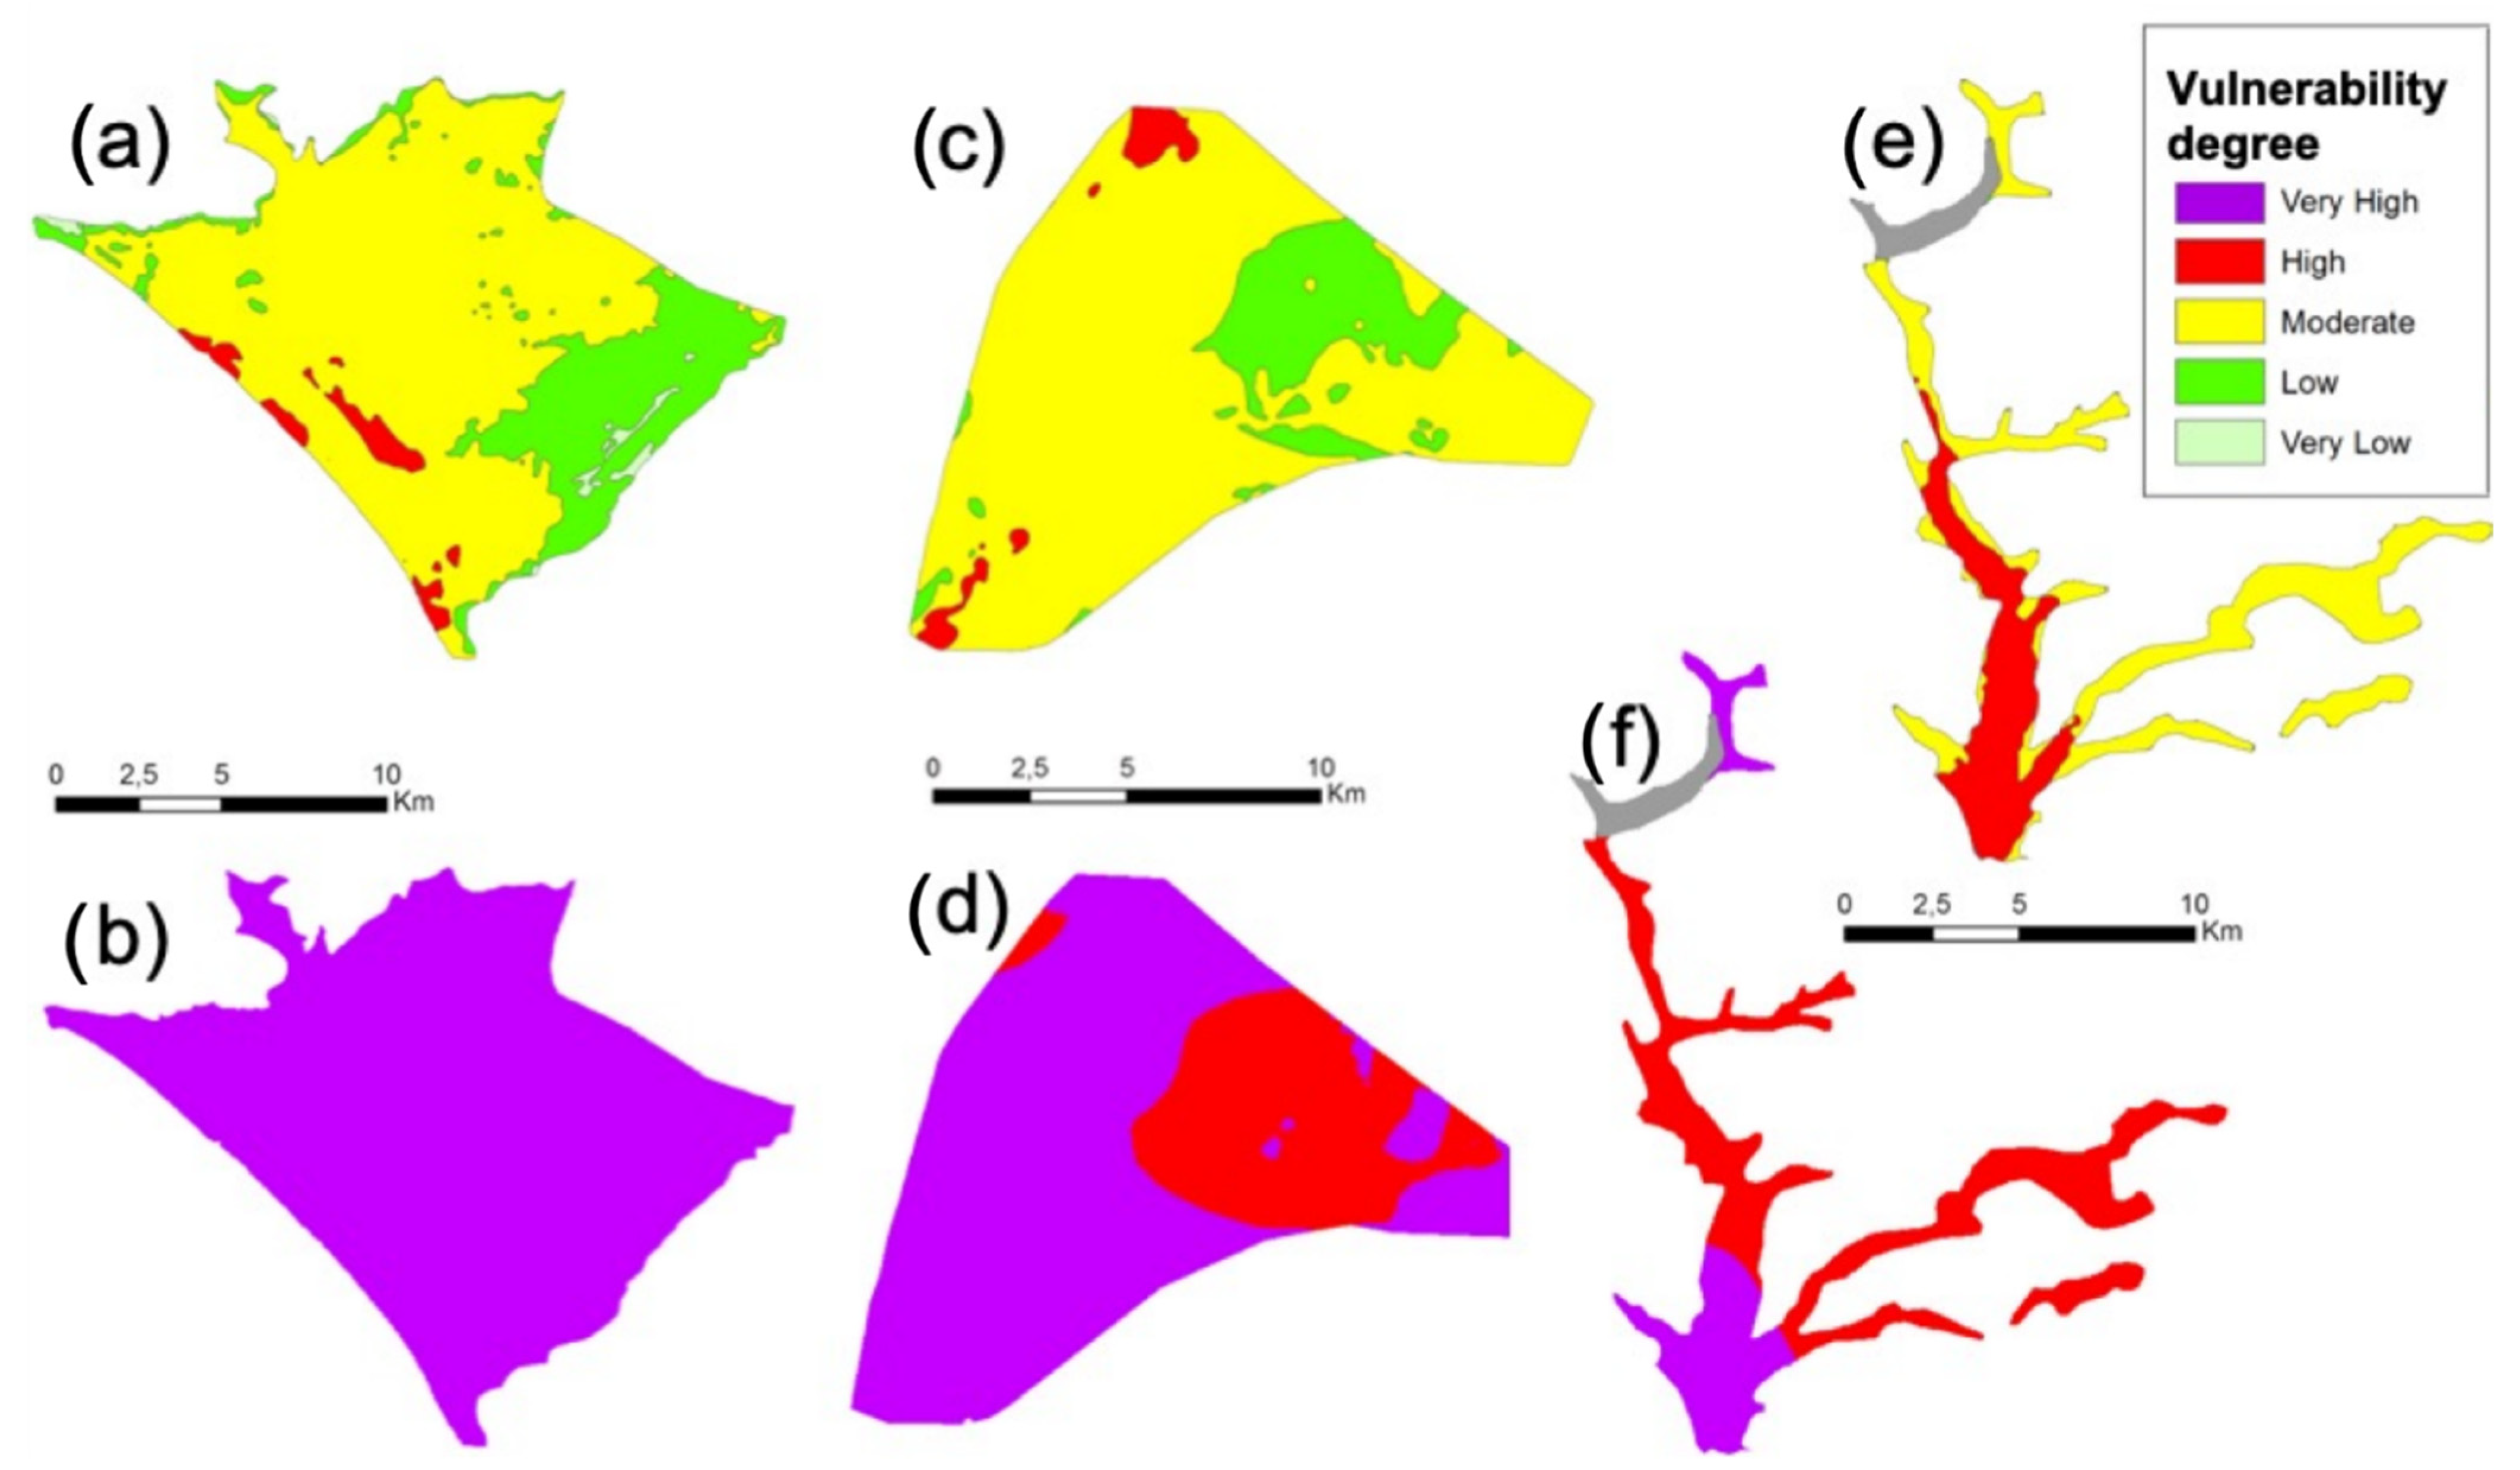
The classification of the indexes/values in vulnerability degree in function of the vulnerability method is in Table 1: vulnerability indexes have been classified in a range of five “vulnerability degrees”, from “very high” to “very low. Table 2 shows the hydraulic conductivity and thickness of the hydrogeologic units of the vadose zone for the three case studies used in the application of the AVI method. The vulnerability maps computed using the DRASTIC and the AVI methods are shown in Figure 5.
In the Garigliano River plain, the DRASTIC method (Figure 5a) indicates a prevalence of:
- -
- “High degree” of vulnerability that corresponds to the sand dunes (for the high hydraulic conductivity and the low depth to water);
- -
- “Moderate” vulnerability degree in the alluvial–marine and pyroclastic deposits;
- -
- “Low degree” of vulnerability along the SE and the NW borders of the groundwater body, due to the high values of slope (Topography) and depth to water.
The AVI method identifies for the whole plain only the “very high” degree of vulnerability (Figure 5b).
In the Campanian Plain-Acerra area, the DRASTIC method (Figure 5c) indicates a prevalence of the “moderate” vulnerability degree. The eastern sector is identified with the “low degree” of vulnerability. Very small sectors are at the “high” vulnerability degree.
The AVI method (Figure 5d) identifies basically two degrees of vulnerability: the “high” and the “very high”. It is noteworthy that the eastern sector records a decrease of the vulnerability degree in both methods, due to the presence of peat levels with very low hydraulic conductivity.
In the Alento River basin, the DRASTIC method (Figure 5e) indicates a “high” vulnerability degree in the lower part, while in the upper part of the basin the degree of vulnerability is “moderate”, according to the depth to water. This aspect is also highlighted by the AVI method (Figure 5f), that identifies an increase in the vulnerability degree from “high” to “very high” in the downstream direction. The “very high” vulnerability in the higher part of the basin is due to the presence of gravels in the firsts 10 m b.g.l., intercepted by three boreholes.
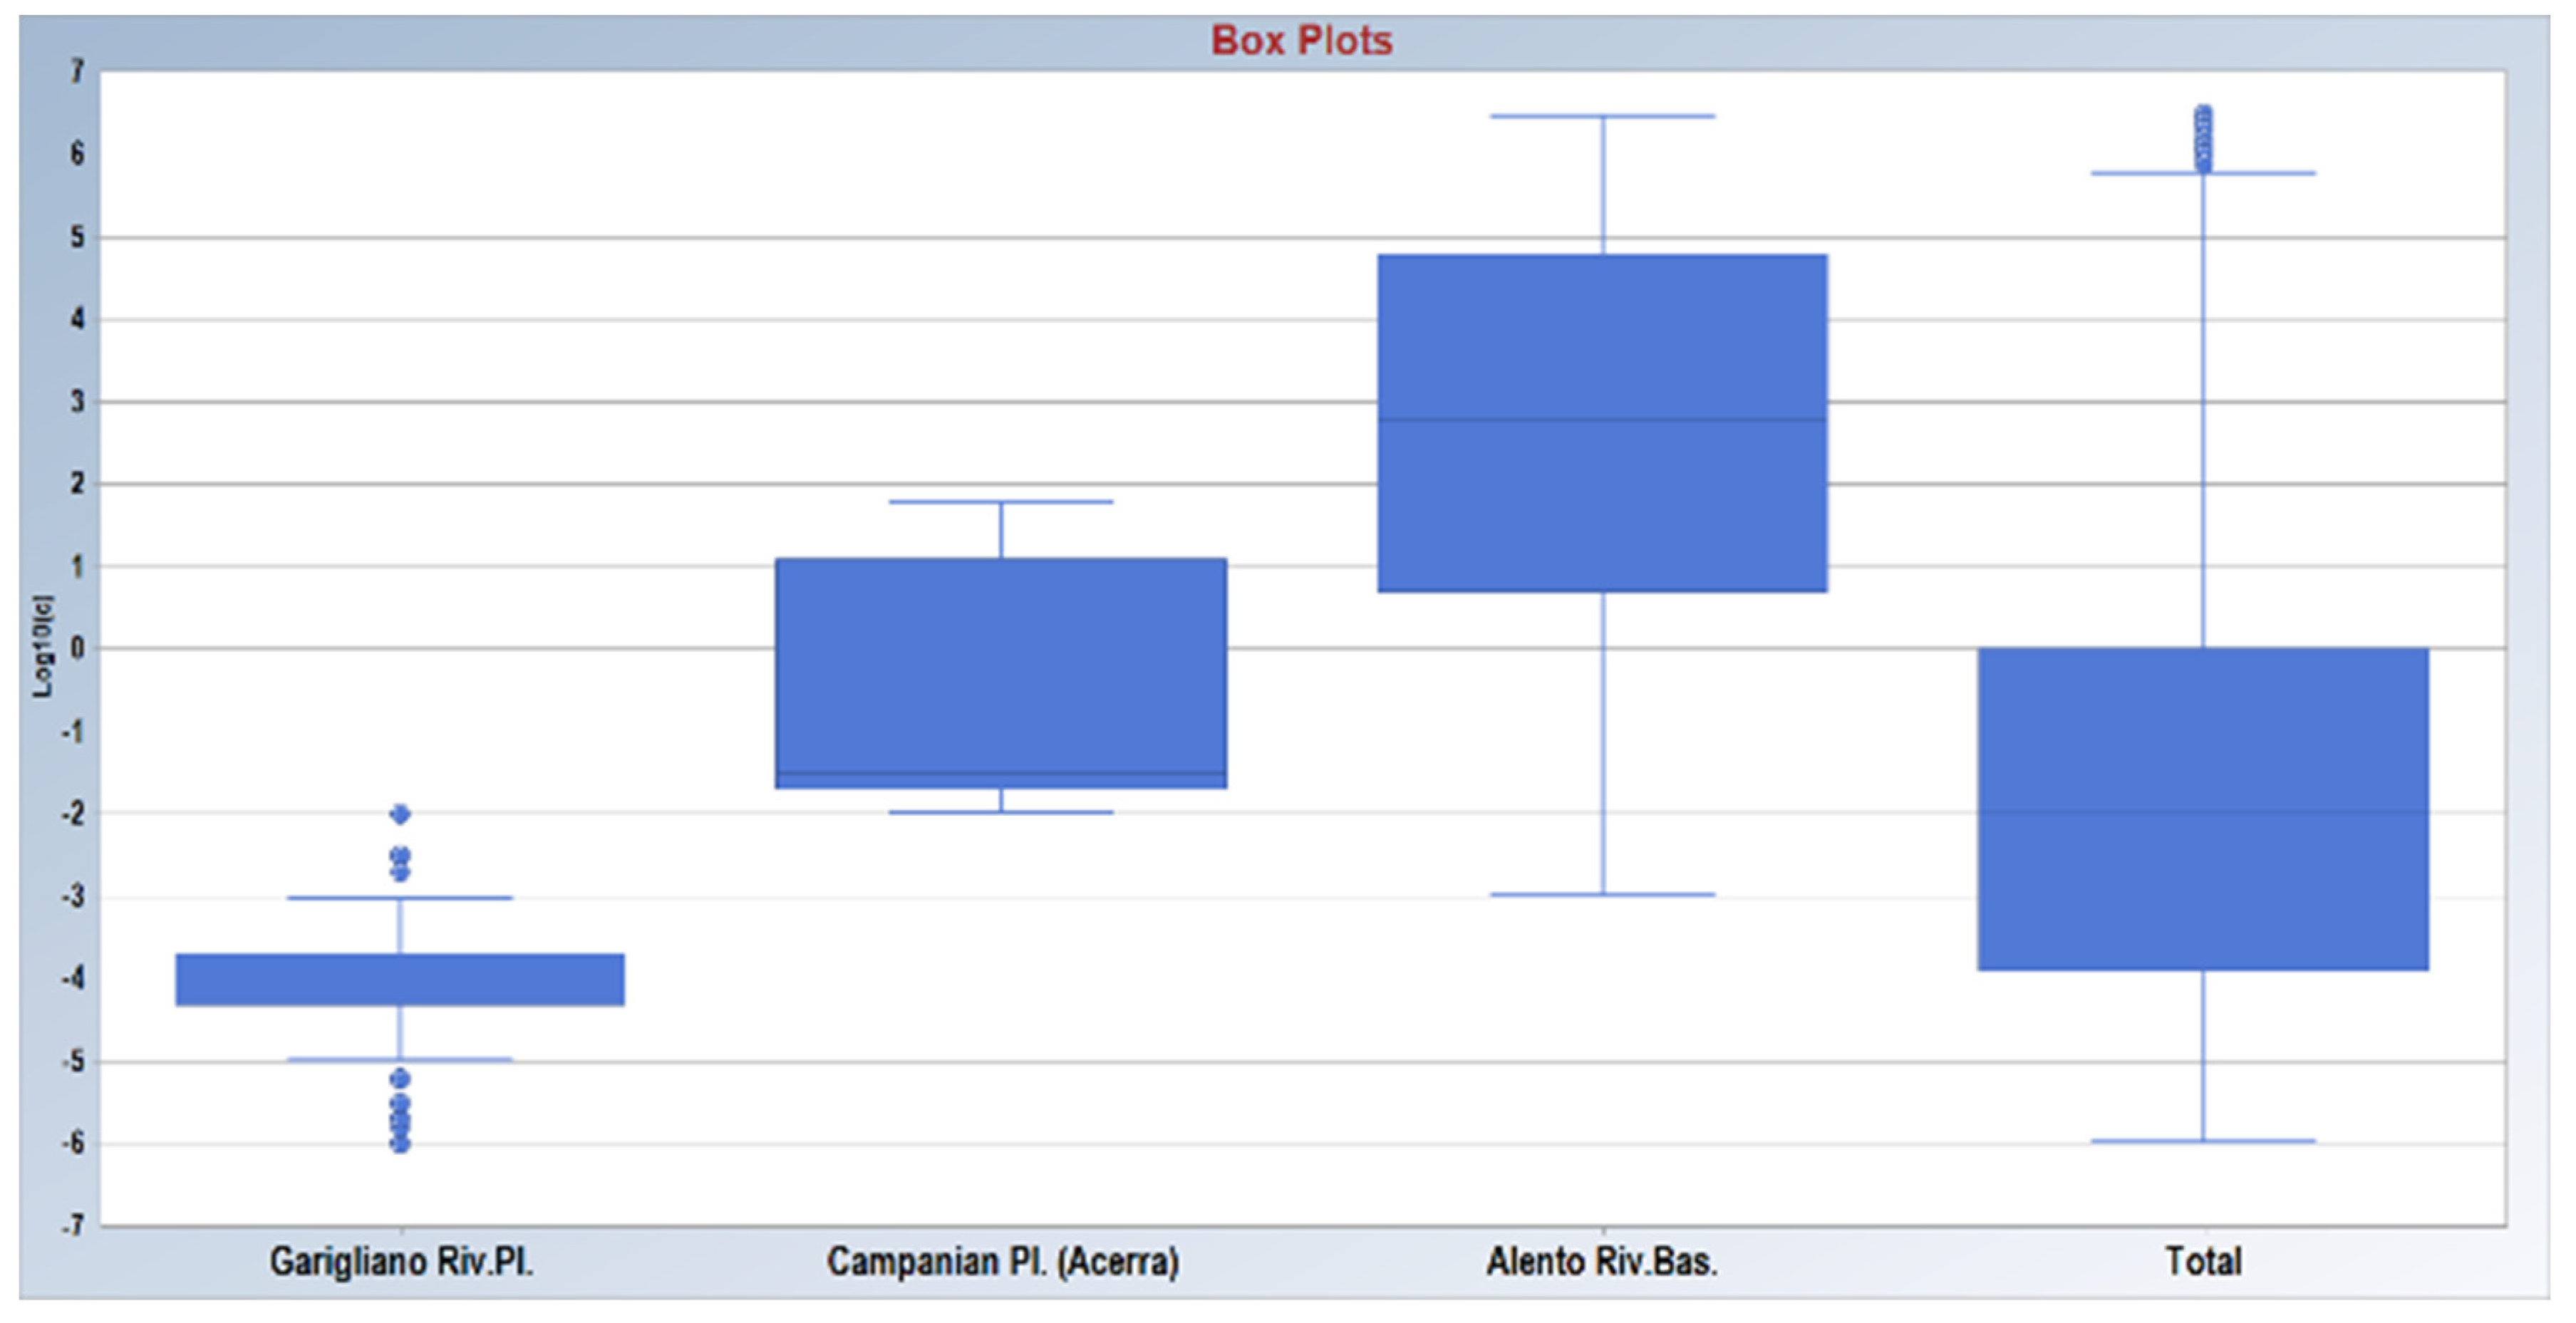
The distribution of the values of the log10C of the AVI method (Figure 6) shows the lower values for the Garigliano plain, presenting all the values ≤−2 and then in “very high” class. Indeed, in [14] the log10C < 1 is classified as a very high vulnerability (Table 1). In the same class falls the inter-quartile range (IQR) of the log10C values of the Campanian Plain. The Alento Plain shows variability, with all the vulnerability classes represented. Considering all the study areas, the inter-quartile range (IQR) of the log10C values is <1 and, therefore, it falls in the “very high” class.
The four box plots (Figure 6), which group the values calculated in the three study areas show that 50% of the values falls in the range [0, −4] or in the “very high” class. The AVI method, generally, reports a higher degree of vulnerability compared with the other methods [6,21].
The prevalence of the most vulnerable class is due to the moderate–high hydraulic conductivity of the hydrogeologic units above the aquifer and to the very small thickness of the vadose zone (Table 2). These are disadvantageous conditions for groundwater protection, but in the DRASTIC method, they are mitigated by other factors such as recharge and the conductivity of the aquifer. For this reason, we decided to subdivide the vulnerability classes in a different way, especially the one with the highest degree. With this aim in mind, a cumulative frequency histogram of the values of log10C in years for all the areas was used (Figure 7). The resulting histogram reveals three slope changes for the values lower than 1.
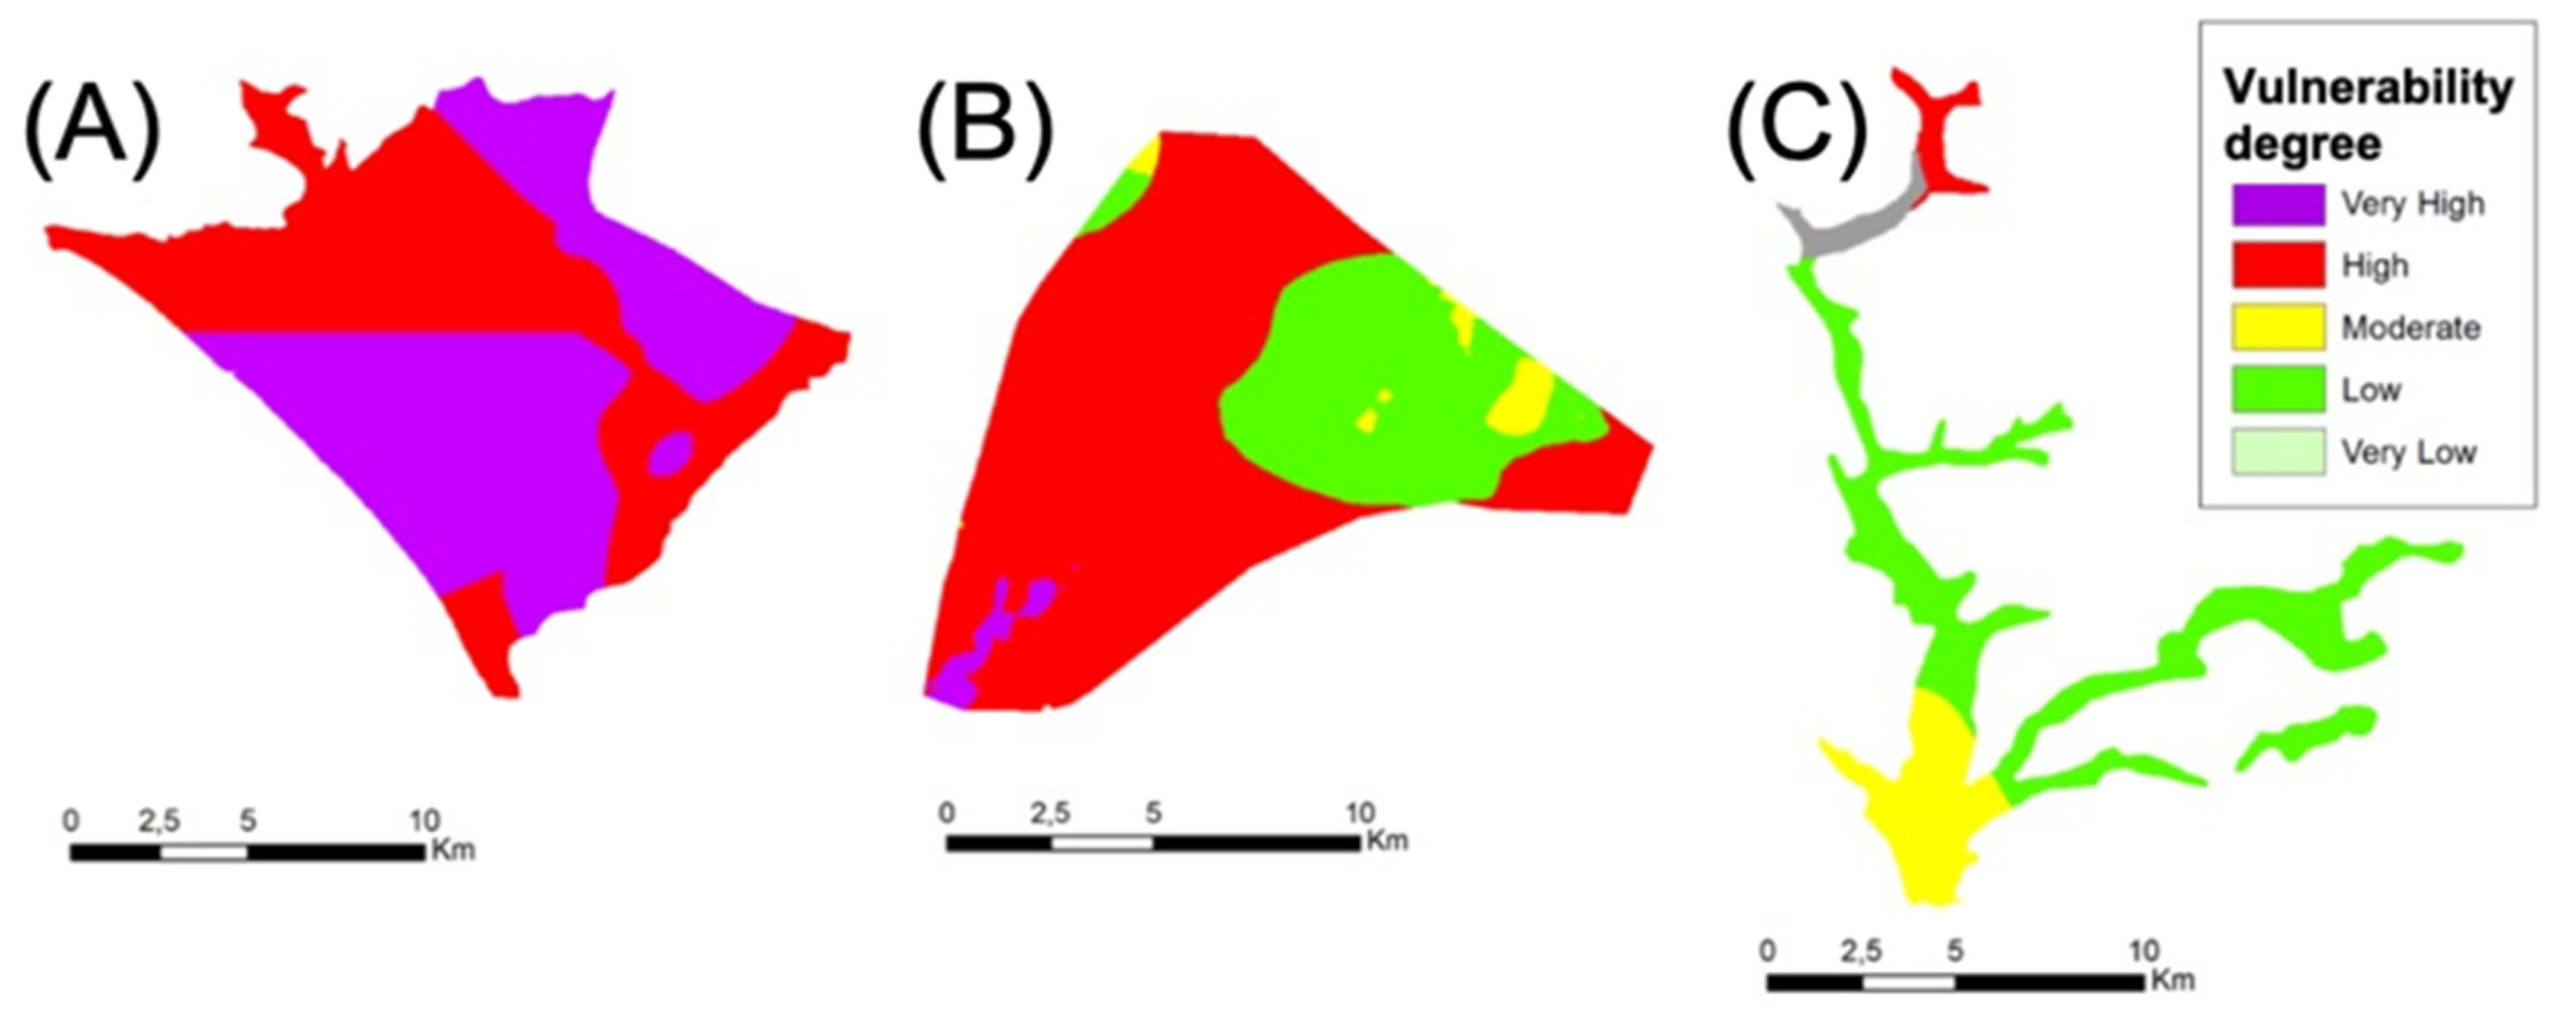
These slope changes (1, −1, −3, and 8) have been used for reclassifying the vulnerability classes, as indicated in Table 1: low, moderate, high, and very high classes were modified; in particular low, moderate, and high classes were enlarged, and the very high class was reduced in range. The AVI vulnerability maps have been reclassified on the basis of this new classification (Figure 8).
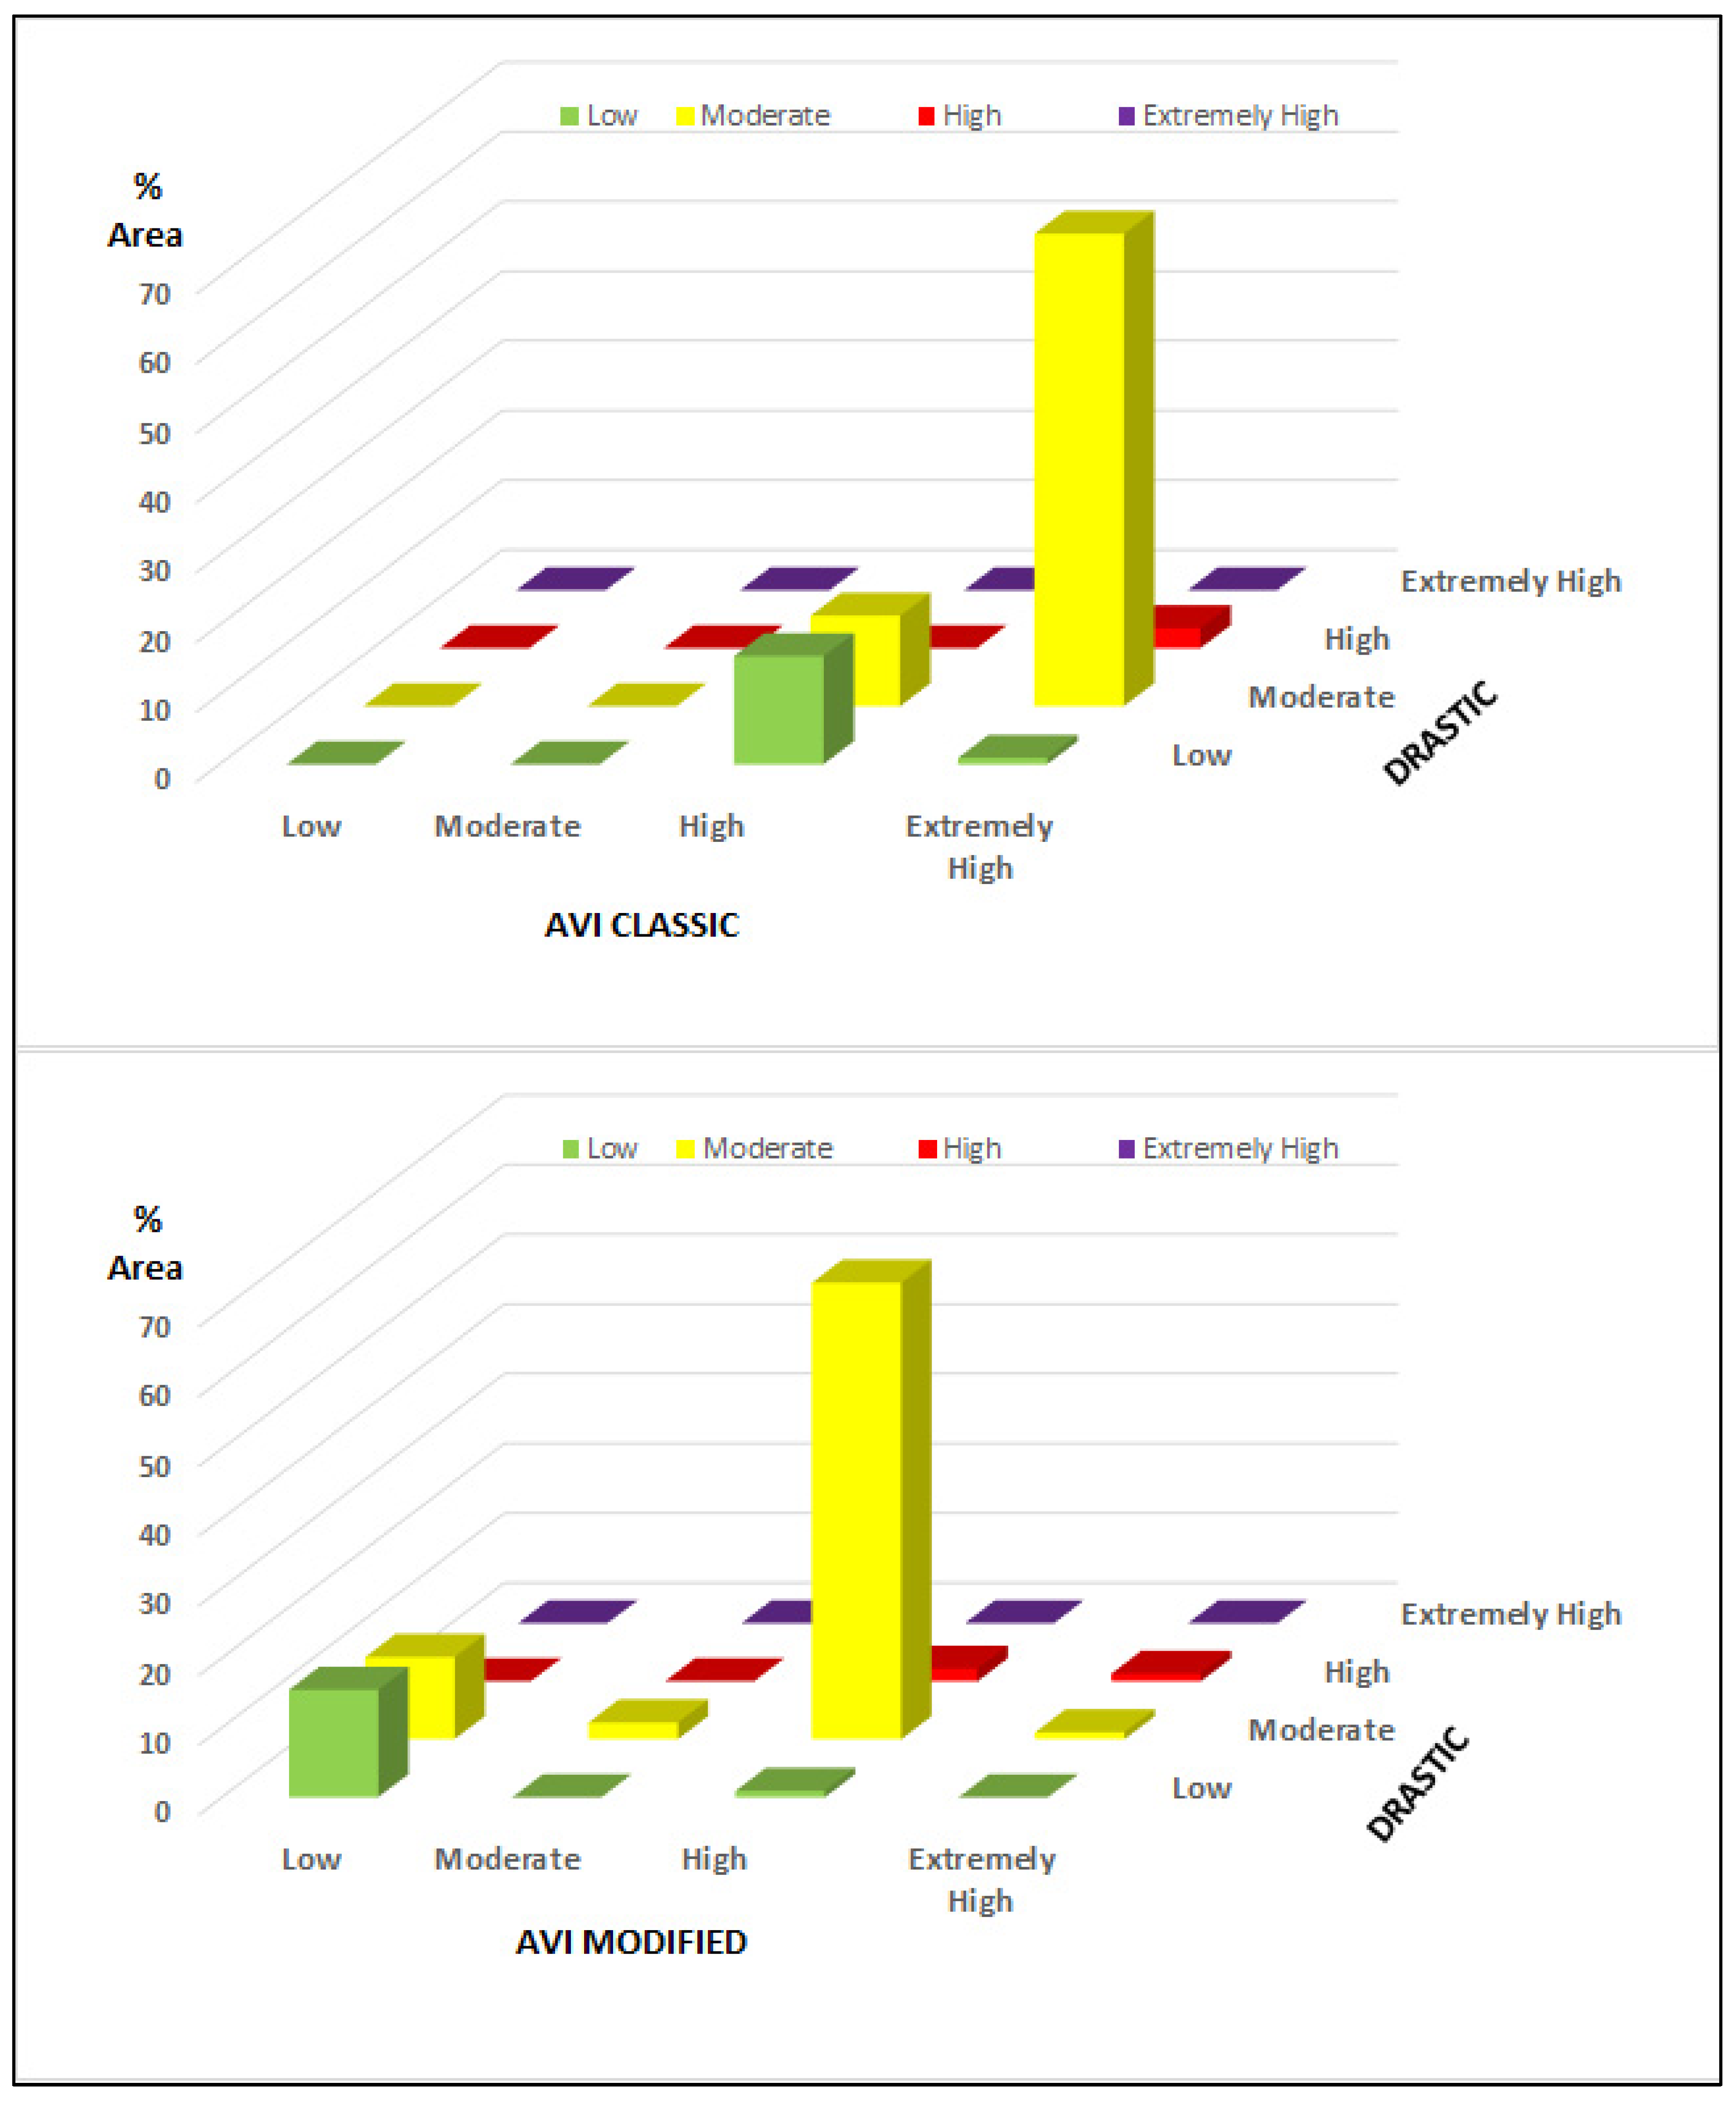
The comparison between the maps drawn using DRASTIC and the AVI methods (classic and modified) is shown in Figure 9 for the Campanian Plain-Acerra area. The 3D histogram has been drawn only for this area because in the Garigliano River Plain area the AVI classic showed only one class (see Figure 5) and the Alento valley is too small to clearly highlight the differences. The 3D diagram demonstrates a good correlation when the higher columns (representing areas) are on the diagonal. In this case, the distribution of the columns indicates that in the AVI modified method the same areas are highlighted as the more vulnerable areas, although the vulnerability maps calculated on the basis of the DRASTIC method remain less severe than using the AVI method.
4. Conclusions
This study applied modified AVI methods for groundwater pollution vulnerability in three different areas of southern Italy and compared the resulting maps with those obtained by the classic AVI method and the DRASTIC method.
AVI and DRASTIC are both suitable for porous aquifers. The limitation of the AVI method, revealed in previous studies [19,21] and confirmed by this study, consists of low differentiations of areas at different degrees of vulnerability, especially in alluvial aquifers as well as with a prevalence of the highest class of vulnerability. Some authors argue that the degree of susceptibility/vulnerability is exaggerated by AVI [24].
Moreover, previous studies [21,25] indicated that DRASTIC provides more precise results for detailed studies, while AVI is useful in relatively large basins and for quick reference purposes, not considering morphological and climatological factors such as slope, soil, and recharge, neither directly nor indirectly.
In some papers, to overcome the subjectivity of the DRASTIC model, statistical methodologies have been applied [10,26] with the aim to optimize rates and weights. Similarly, a new classification was applied to the AVI method using a statistical approach that was applied to the three alluvial aquifers.
The modified AVI method makes this method more reliable for alluvial shallow aquifers when compared with the DRASTIC method. The comparison between the two methods shows (Figure 9) that the application of the new AVI classification highlights in both methods the same areas as the more vulnerable areas. The AVI method remains more severe than the DRASTIC method with higher vulnerability classes.
The major novelty of this modified method consists of having deduced the class limits from the distribution of log10C values in three porous aquifers, while clearly distinguishing three slope changes. The modification to the AVI method could be improved on the basis of the cumulative curve of the values referring to many case studies in similar hydrogeological contexts.
The optimisation and standardisation of the AVI (Aquifer Vulnerability Index) method, which, considering only two physical parameters, is easy to apply and needs only limited data, makes it a valuable method for the requirements of sustainable development worldwide. Indeed, aquifer vulnerability maps are important tools for protecting groundwater, which is one of the Sustainable Development Goals (SDGs) of the 2030 Development Agenda of UN accounting explicitly for the significant role that groundwater plays. Among many methods, the AVI method appears to be a valuable method to be applied worldwide, especially where the scale of the project is wide, data availability is limited, and only few hydrogeological characteristics are known.
Author Contributions
Conceptualization, D.D. and M.S.; Methodology, D.D. and M.S.; Data curation D.D.; Formal Analysis, M.S.; Investigation, D.D. and M.S.; Resources, D.D. and M.S.; Writing—Original Draft Preparation, D.D. and M.S.; Writing—Review and Editing, D.D.; Visualization, M.S.; Supervision, D.D. All authors have read and agreed to the published version of the manuscript.
Funding
This research received no external funding.
Institutional Review Board Statement
Not applicable.
Informed Consent Statement
Not applicable.
Data Availability Statement
The data presented in this study are available on request from the corresponding author. The data are not publicly available due to privacy.
Conflicts of Interest
The authors declare no conflict of interest.
Article Impact Statement
The manuscript improves the knowledge in the groundwater vulnerability to pollution assessment in alluvial aquifers.
References
- Margat, J. Vulnerabilité des Nappes D’eau Souterraine a la Pollution [Groundwater Vulnerability to Contamination]; Bases Cartogr. (Doc.); BRGM: Orléans, France, 1968; Available online: https://www.scienceopen.com/document?vid=8fdbeb52-17e3-4966-83f8-6241f355f65f (accessed on 9 January 2022).
- Zwahlen, F. Vulnerability and risk mapping for the protection of carbonate (karst) aquifers, final report (COST action 620). In European Commission, Directorate-General XII Science, Research and Development; EU Publications Office (OPOCE): Brussels, Belgium, 2004; 297p. [Google Scholar]
- Kumar, P.; Bansod, B.K.; Debnath, S.K.; Thakur, P.K.; Ghanshyam, C. Index-based groundwater vulnerability mapping models using hydrogeological settings: A critical evaluation. Env. Impact Asses 2015, 51, 38–49. [Google Scholar] [CrossRef]
- Wachniew, P.; Zurek, A.J.; Stumpp, C.; Gemitzi, A.; Gargini, A.; Filippini, M.; Witczak, S. Toward operational methods for the assessment of intrinsic groundwater vulnerability: A review. Crit. Rev. Environ. Sci. Technol. 2016, 46, 827–884. [Google Scholar] [CrossRef]
- Doerfliger, N.; Zwahlen, F. EPIK: A new method for outlining of protection areas in karstic environment. In International Symposium and Field Seminar on “Karst Waters and Environmental Impacts”; Günay, G., Jonshon, A.I., Eds.; Balkema: Rotterdam, The Netherlands, 1997; pp. 117–123. [Google Scholar]
- Vias, J.M.; Andreo, B.; Perles, M.J.; Carrasco, F. A comparative study of four schemes for groundwater vulnerability mapping in a diffuse flow carbonate aquifer under Mediterranean climatic conditions. Environ. Geol. 2005, 47, 586–595. [Google Scholar] [CrossRef]
- Albinet, M.; Margat, J. Cartographie de la vulnérabilité à la pollution des nappes d’eau souterraine. Bull. BRGM 1970, 2, 4. [Google Scholar]
- Mimi, Z.A.; Assi, A. Intrinsic vulnerability, hazard and risk mapping for karst aquifers: A case study. J. Hydrol. 2009, 364, 298–310. [Google Scholar] [CrossRef]
- Sorichetta, A.; Masetti, M.; Ballabio, C.; Sterlacchini, S.; Beretta, G.P. Reliability of groundwater vulnerability maps obtained through statistical methods. J. Environ. Manag. 2011, 92, 1215–1224. [Google Scholar] [CrossRef] [PubMed]
- Bonfanti, M.; Ducci, D.; Masetti, M.; Sellerino, M.; Stevenazzi, S. Using statistical analyses for improving rating methods for groundwater vulnerability in contamination maps. Environ. Earth Sci. 2016, 75, 1–10. [Google Scholar] [CrossRef] [Green Version]
- Aller, L.; Bennett, T.; Lehr, J.; Petty, R.J.; Hackett, G. DRASTIC: A Standardized System for Evaluating Ground Water Pollution Potential Using Hydrogeologic Settings; US Environmental Protection Agency: Washington, DC, USA, 1987; p. 455.
- Barzegar, R.; Asghari Moghaddam, A.; Norallahi, S.; Inam, A.; Adamowski, J.; Alizadeh, M.R.; Bou Nassar, J. Modification of the DRASTIC framework for mapping groundwater vulnerability zones. Groundwater 2020, 58, 441–452. [Google Scholar] [CrossRef] [PubMed]
- Catani, V.; Zuzolo, D.; Esposito, L.; Albanese, S.; Pagnozzi, M.; Fiorillo, F.; De Vivo, B.; Cicchella, D. A new approach for aquifer vulnerability assessment: The case study of Campania Plain. Water Resour. Manag. 2020, 34, 819–834. [Google Scholar] [CrossRef]
- Stempvoort, D.V.; Ewert, L.; Wassenaar, L. Aquifer vulnerability index: A GIS-compatible method for groundwater vulnerability mapping. Can. Water Resour. J. 1993, 18, 25–37. [Google Scholar] [CrossRef] [Green Version]
- Corniello, A.; Ducci, D.; Napolitano, P. Comparison between parametric methods to evaluate aquifer pollution vulnerability using a GIS: An example in the Piana Campana, Southern Italy. In Engineering Geology and the Environment; Balkema: Rotterdam, The Netherlands, 1997; pp. 1721–1726. [Google Scholar]
- Gogu, R.C.; Hallet, V.; Dassargues, A. Comparison of aquifer vulnerability assessment techniques. Application to the Néblon river basin (Belgium). Environ. Geol. 2003, 44, 881–892. [Google Scholar] [CrossRef]
- Draoui, M.; Vias, J.; Andreo, B.; Targuisti, K.; El Messari, J.S. A comparative study of four vulnerability mapping methods in a detritic aquifer under mediterranean climatic conditions. Environ. Geol. 2008, 54, 455–463. [Google Scholar] [CrossRef]
- Shirazi, S.M.; Imran, H.M.; Akib, S. GIS-based DRASTIC method for groundwater vulnerability assessment: A review. J. Risk. Res. 2012, 15, 991–1011. [Google Scholar] [CrossRef]
- Anornu, G.K.; Kabo-Bah, A.T. Evaluation of AVI and DRASTIC methods for groundwater vulnerability mapping. J. Environ. Ecol. 2013, 4, 126. [Google Scholar] [CrossRef] [Green Version]
- Oke, S.A.; Vermeulen, D. Evaluation of the comparison of four groundwater vulnerability methodologies: A case study of Dahomey Basin shallow aquifers, Nigeria. In Groundwater Vulnerability and Pollution Risk Assessment; CRC Press: Boca Raton, FL, USA, 2020; pp. 127–137. [Google Scholar]
- Ducci, D.; Sellerino, M. Vulnerability mapping of groundwater contamination based on 3D lithostratigraphical models of porous aquifers. Sci. Total Environ. 2013, 447, 315–322. [Google Scholar] [CrossRef] [PubMed]
- Ducci, D.; Corniello, A.; Sellerino, M. Hydrostratigraphical setting and groundwater quality status in alluvial aquifers: The low Garigliano River Basin (Southern Italy), case study. In Proceedings of the IAH Conference on Groundwater Quality Sustainability, Krakow, Poland, 12–17 September 2010; pp. 12–17, ISBN 9788322619797. [Google Scholar]
- Fusco, F.; Allocca, V.; Coda, S.; Cusano, D.; Tufano, R.; De Vita, P. Quantitative assessment of specific vulnerability to nitrate pollution of shallow alluvial aquifers by process-based and empirical approaches. Water 2020, 12, 269. [Google Scholar] [CrossRef] [Green Version]
- George, N.J. Integrating hydrogeological and second-order geo-electric indices in groundwater vulnerability mapping: A case study of alluvial environments. Appl. Water Sci. 2021, 11, 123. [Google Scholar] [CrossRef] [PubMed]
- Gogu, R.C.; Dassargues, A. Current trends and future challenges in groundwater vulnerability assessment using overlay and index methods. Environ. Geol. 2000, 39, 549–559. [Google Scholar] [CrossRef]
- Balaji, L.; Saravanan, R.; Saravanan, K.; Sreemanthrarupini, N.A. Groundwater vulnerability mapping using the modified DRASTIC model: The metaheuristic algorithm approach. Environ. Monit. Assess. 2021, 193, 1–19. [Google Scholar]
Figure 1.
Locations of the study areas in Campania region (Italy). Light yellow signifies the region (source: ISTAT: Italian Institute of Statistics) and violet signifies the study areas.
Figure 1.
Locations of the study areas in Campania region (Italy). Light yellow signifies the region (source: ISTAT: Italian Institute of Statistics) and violet signifies the study areas.

Figure 2.
Hydrogeological map of the Garigliano River plain (modified from [22]).
Figure 2.
Hydrogeological map of the Garigliano River plain (modified from [22]).

Figure 3.
Hydrogeological map of the Campanian Plain-Acerra area. The grey line delimitates the shallow aquifer. Original drawing.
Figure 3.
Hydrogeological map of the Campanian Plain-Acerra area. The grey line delimitates the shallow aquifer. Original drawing.

Figure 4.
Hydrogeological map of the Alento River basin. Original drawing.

Figure 5.
Vulnerability maps for (a,b) Garigliano River plain; (c,d) Campanian plain Acerra; and (e,f) Alento plain (in grey reservoir area), mapped using the original DRASTIC (a,c,e) and AVI (b,d,f) methods [11,14].

Figure 6.
Box plots of the distribution of log10C for the three study areas.

Figure 7.
Cumulative frequency histogram of the log10C values for the three study areas.

Figure 8.
Vulnerability maps for (A) Garigliano River plain; (B) Campanian plain-Acerra; and (C) Alento plain (in grey reservoir area), drawn according to the reclassified AVI method.
Figure 8.
Vulnerability maps for (A) Garigliano River plain; (B) Campanian plain-Acerra; and (C) Alento plain (in grey reservoir area), drawn according to the reclassified AVI method.

Figure 9.
The 3D histogram showing the comparison of the areas as a percentage of the vulnerability classes between the maps when evaluated using the DRASTIC method and the AVI methods (classic and modified) for the Campanian Plain-Acerra area.
Figure 9.
The 3D histogram showing the comparison of the areas as a percentage of the vulnerability classes between the maps when evaluated using the DRASTIC method and the AVI methods (classic and modified) for the Campanian Plain-Acerra area.


Table 1.
Vulnerability degree as a function of the indexes of the vulnerability methods: DRASTIC (D), AVI Classic (AVI C), and AVI Reclassified (AVI R).
Table 1.
Vulnerability degree as a function of the indexes of the vulnerability methods: DRASTIC (D), AVI Classic (AVI C), and AVI Reclassified (AVI R).
| Vulnerability Degree | D | AVI C | AVI R |
|---|---|---|---|
| Very Low | <85 | >4 | >4 |
| Low | 85–115 | 3–4 | 1–4 |
| Moderate | 116–162 | 2–3 | −1–1 |
| High | 163–193 | 1–2 | −3.8–−1 |
| Very High | >193 | <1 | <−3.8 |
Table 2.
Hydraulic conductivity (K) and thickness (t) of the hydrogeologic units (HU) of the vadose zone for each groundwater body (GWB).
Table 2.
Hydraulic conductivity (K) and thickness (t) of the hydrogeologic units (HU) of the vadose zone for each groundwater body (GWB).
| GWB | HU | K m/s | t m |
|---|---|---|---|
| Garigliano River Plain | Debris deposits | 600 × 10−4 | 5–100 |
| Alluvial–pyroclastic deposits | 700 × 10−4 | ||
| Tuffs | 100 × 10−6 | ||
| Campanian Plain- Acerra | Pyroclastic–alluvial–marine deposits | 700 × 10−4 | 10–20 |
| Tuffs | 100 × 10−6 | ||
| Alento River Basin | Alluvial deposits | 600 × 10−4 | 0–10 |
Publisher’s Note: MDPI stays neutral with regard to jurisdictional claims in published maps and institutional affiliations. |
© 2022 by the authors. Licensee MDPI, Basel, Switzerland. This article is an open access article distributed under the terms and conditions of the Creative Commons Attribution (CC BY) license (https://creativecommons.org/licenses/by/4.0/).
Share and Cite
MDPI and ACS Style
Ducci, D.; Sellerino, M. A Modified AVI Model for Groundwater Vulnerability Mapping: Case Studies in Southern Italy. Water 2022, 14, 248. https://doi.org/10.3390/w14020248
AMA Style
Ducci D, Sellerino M. A Modified AVI Model for Groundwater Vulnerability Mapping: Case Studies in Southern Italy. Water. 2022; 14(2):248. https://doi.org/10.3390/w14020248
Chicago/Turabian StyleDucci, Daniela, and Mariangela Sellerino. 2022. "A Modified AVI Model for Groundwater Vulnerability Mapping: Case Studies in Southern Italy" Water 14, no. 2: 248. https://doi.org/10.3390/w14020248
Note that from the first issue of 2016, this journal uses article numbers instead of page numbers. See further details here.