
Assessment of the Impact of Climate Extremes on the Groundwater of Eastern Croatia


1
Faculty of Civil Engineering and Architecture, Josip Juraj Strossmayer University of Osijek, 31000 Osijek, Croatia
2
Vodovod Osijek, Water Supply Department, Poljski Put 1, 31000 Osijek, Croatia
*
Author to whom correspondence should be addressed.
Water 2022, 14(2), 254; https://doi.org/10.3390/w14020254
Submission received: 16 December 2021
/
Revised: 10 January 2022
/
Accepted: 12 January 2022
/
Published: 16 January 2022
(This article belongs to the Section Hydrology)
Abstract
:This paper analyzes the groundwater in the deep Quaternary aquifer of Eastern Croatia. These waters are collected at the Vinogradi Pumping Station (Osijek, Croatia) for the needs of public water supply. This research aimed to assess the impact of climate extremes, namely, high air temperatures and low rainfall, on the quantity and quality of groundwater. On the basis of data from the Vinogradi Pumping Station in the period 1987–2015, three extremely warm and low-water years were singled out. For these three years, the following were analyzed: climate diagrams, groundwater levels (in the piezometers closest to and farthest from the pumping station), and the quality of the affected groundwater. The results of this research indicate that the reaction of aquifers to the analyzed extreme climatic conditions for the observed period was manifested in the variation of the amplitude of groundwater levels by a maximum of 4–5 m. Considering the total thickness of the affected layers (60–80 m), this variation is not a concern from the point of view of water supply. As for the quality of groundwater, it was found to be of constant quality in its composition and was not affected by climatic extremes.
1. Introduction
The 2011 World Health Organization (Geneva, Switzerland) guidelines state that climate change could negatively affect water quality for human consumption due to increasing and frequent temperature extremes and more frequent and intense rainfall. These conditions lead to increased sedimentation and changes in the chemical composition, total organic carbon, and microbiological safety of water [1]. The impact of climate change in Europe is visible through an increase in temperature, changes in the amount of precipitation, and a decrease in the amount of ice and snow [2,3,4].
Climate change is a change in the properties and distribution of elements of climate over a period of decades or longer. The UNFCCC claims that climate variability is directly and indirectly impacted by human activities that affect changes in the atmosphere, and that are observed in comparable time periods. The causes of climate change arise as a result of interactions between water, atmosphere, and soil, and alterations in any of these systems can be the result of human, natural, or joint action. One of the main causes is the change of greenhouse gas concentrations in the atmosphere [5,6,7].
Climate instability is present in all seasons, and the consequences of climate change are evident worldwide [8]. Several authors have analyzed the impact of climate change on extreme events, and their impact on groundwater. The results of these analyses are studies such as one monitoring the quantity and quality of groundwater based on the priority of monitoring wells [9], or one forecasting groundwater levels in the plains of Southwestern Iran in order to optimize the planning and management of groundwater resources [10]. A study done at the Selfdrud Basin in Iran proposes an algorithm (based on set theory) for the regionalization of watersheds. The algorithm contains a grouping step and a classification step, and uses canonical correlation with the cluster analysis method [11].
Climate change can affect the quality of water for human consumption in many different ways [12]. The anthropogenic impact on groundwater expressed through the requirements of agriculture affects the reduction of groundwater levels. As a solution to mitigate the reduction of groundwater deficit, some authors have suggested methods based on an optimal socialist cooperative game theory model in the agricultural sector [13] and a new combined framework for sustainable development [14].
Drinking water shortages will affect the global economy [15], and key problems include water shortages for various plants as well as deterioration in water quality exacerbated by floods and droughts, various pollutants, salinization of coastal areas, and rising water temperatures. These changes also affect the water quality of aquatic habitats [16]. The effects of climate change are evident both globally and locally, and it is possible to predict that even more drastic scenarios will emerge in the future. Many scientists have analyzed the impact of climate change on water—mostly surface water [17,18,19,20]. There are few examples of the analysis of the impact of climate change on groundwater [21]. Groundwater is one of the most important natural resources, especially for water supply [22]. Tanaka et al. [23] analyzed the ability of the California’s water supply system to adapt to climate and demographic change, and concluded that the system is stable and adaptable to intense climate change. In contrast, significant problems related to climate change and water scarcity in Mediterranean Europe were presented by Iglesias et al. [24], who propose a possible solution in the form of strategic groundwater use and better water management at the basin level. Ojo et al. [25] analyzed the impact of climate change on water resources and water management in West Africa and concluded that it is crucial to adjust water demand to climate change. In an integrated approach to assessing the impact of climate and socioeconomic change on groundwater recharge in East Anglia in the UK, Holman [26] warns of the large impact of soil above aquifers and its changing characteristics over time.
Climate change, one of the major environmental challenges facing mankind, has caused intermittent droughts in many regions, resulting in reduced water resources [27]. Groundwater quality is a consequence of the summary effects of natural and anthropogenically conditioned processes that occur in the unsaturated and saturated zones [28], which in certain conditions can lead to elevated concentrations of certain substances in groundwater that exceed drinking water standards. Scientific research shows that climate change trends will continue in the future [29,30,31]. Projections of the future state of the climate, modeled by different climate models and of global and regional significance, show indications of an undoubted increase in average annual air temperatures, which are thus even more pronounced in their seasonal values [32,33]. Climatic parameters that predominantly affect the state and possible changes in the sector of water resources and hydrology are precipitation, air temperature, evapotranspiration, and runoff [34,35]. It is necessary to observe changes across different time scales—from the level of annual values and trends of their fluctuations, through their intra-annual distribution to changes in their daily and hourly values, which is especially important when assessing flood risk [36,37] and possible consequences of short-term heavy rainfall [38].
2. Study Area
The Republic of Croatia belongs to the group of relatively water-rich countries where water resources are not yet a limiting factor in development. According to UNESCO (Paris, France research from 2003), Croatia ranks 5th in Europe in terms of the availability and richness of water resources, and 42nd in the world. According to data for 2012, almost half of the affected water for the Republic of Croatia (460 million m3 year−1) serves public water supply, where groundwater accounts for 49% and sources an additional 35% (84% in total) of the affected quantities [39].
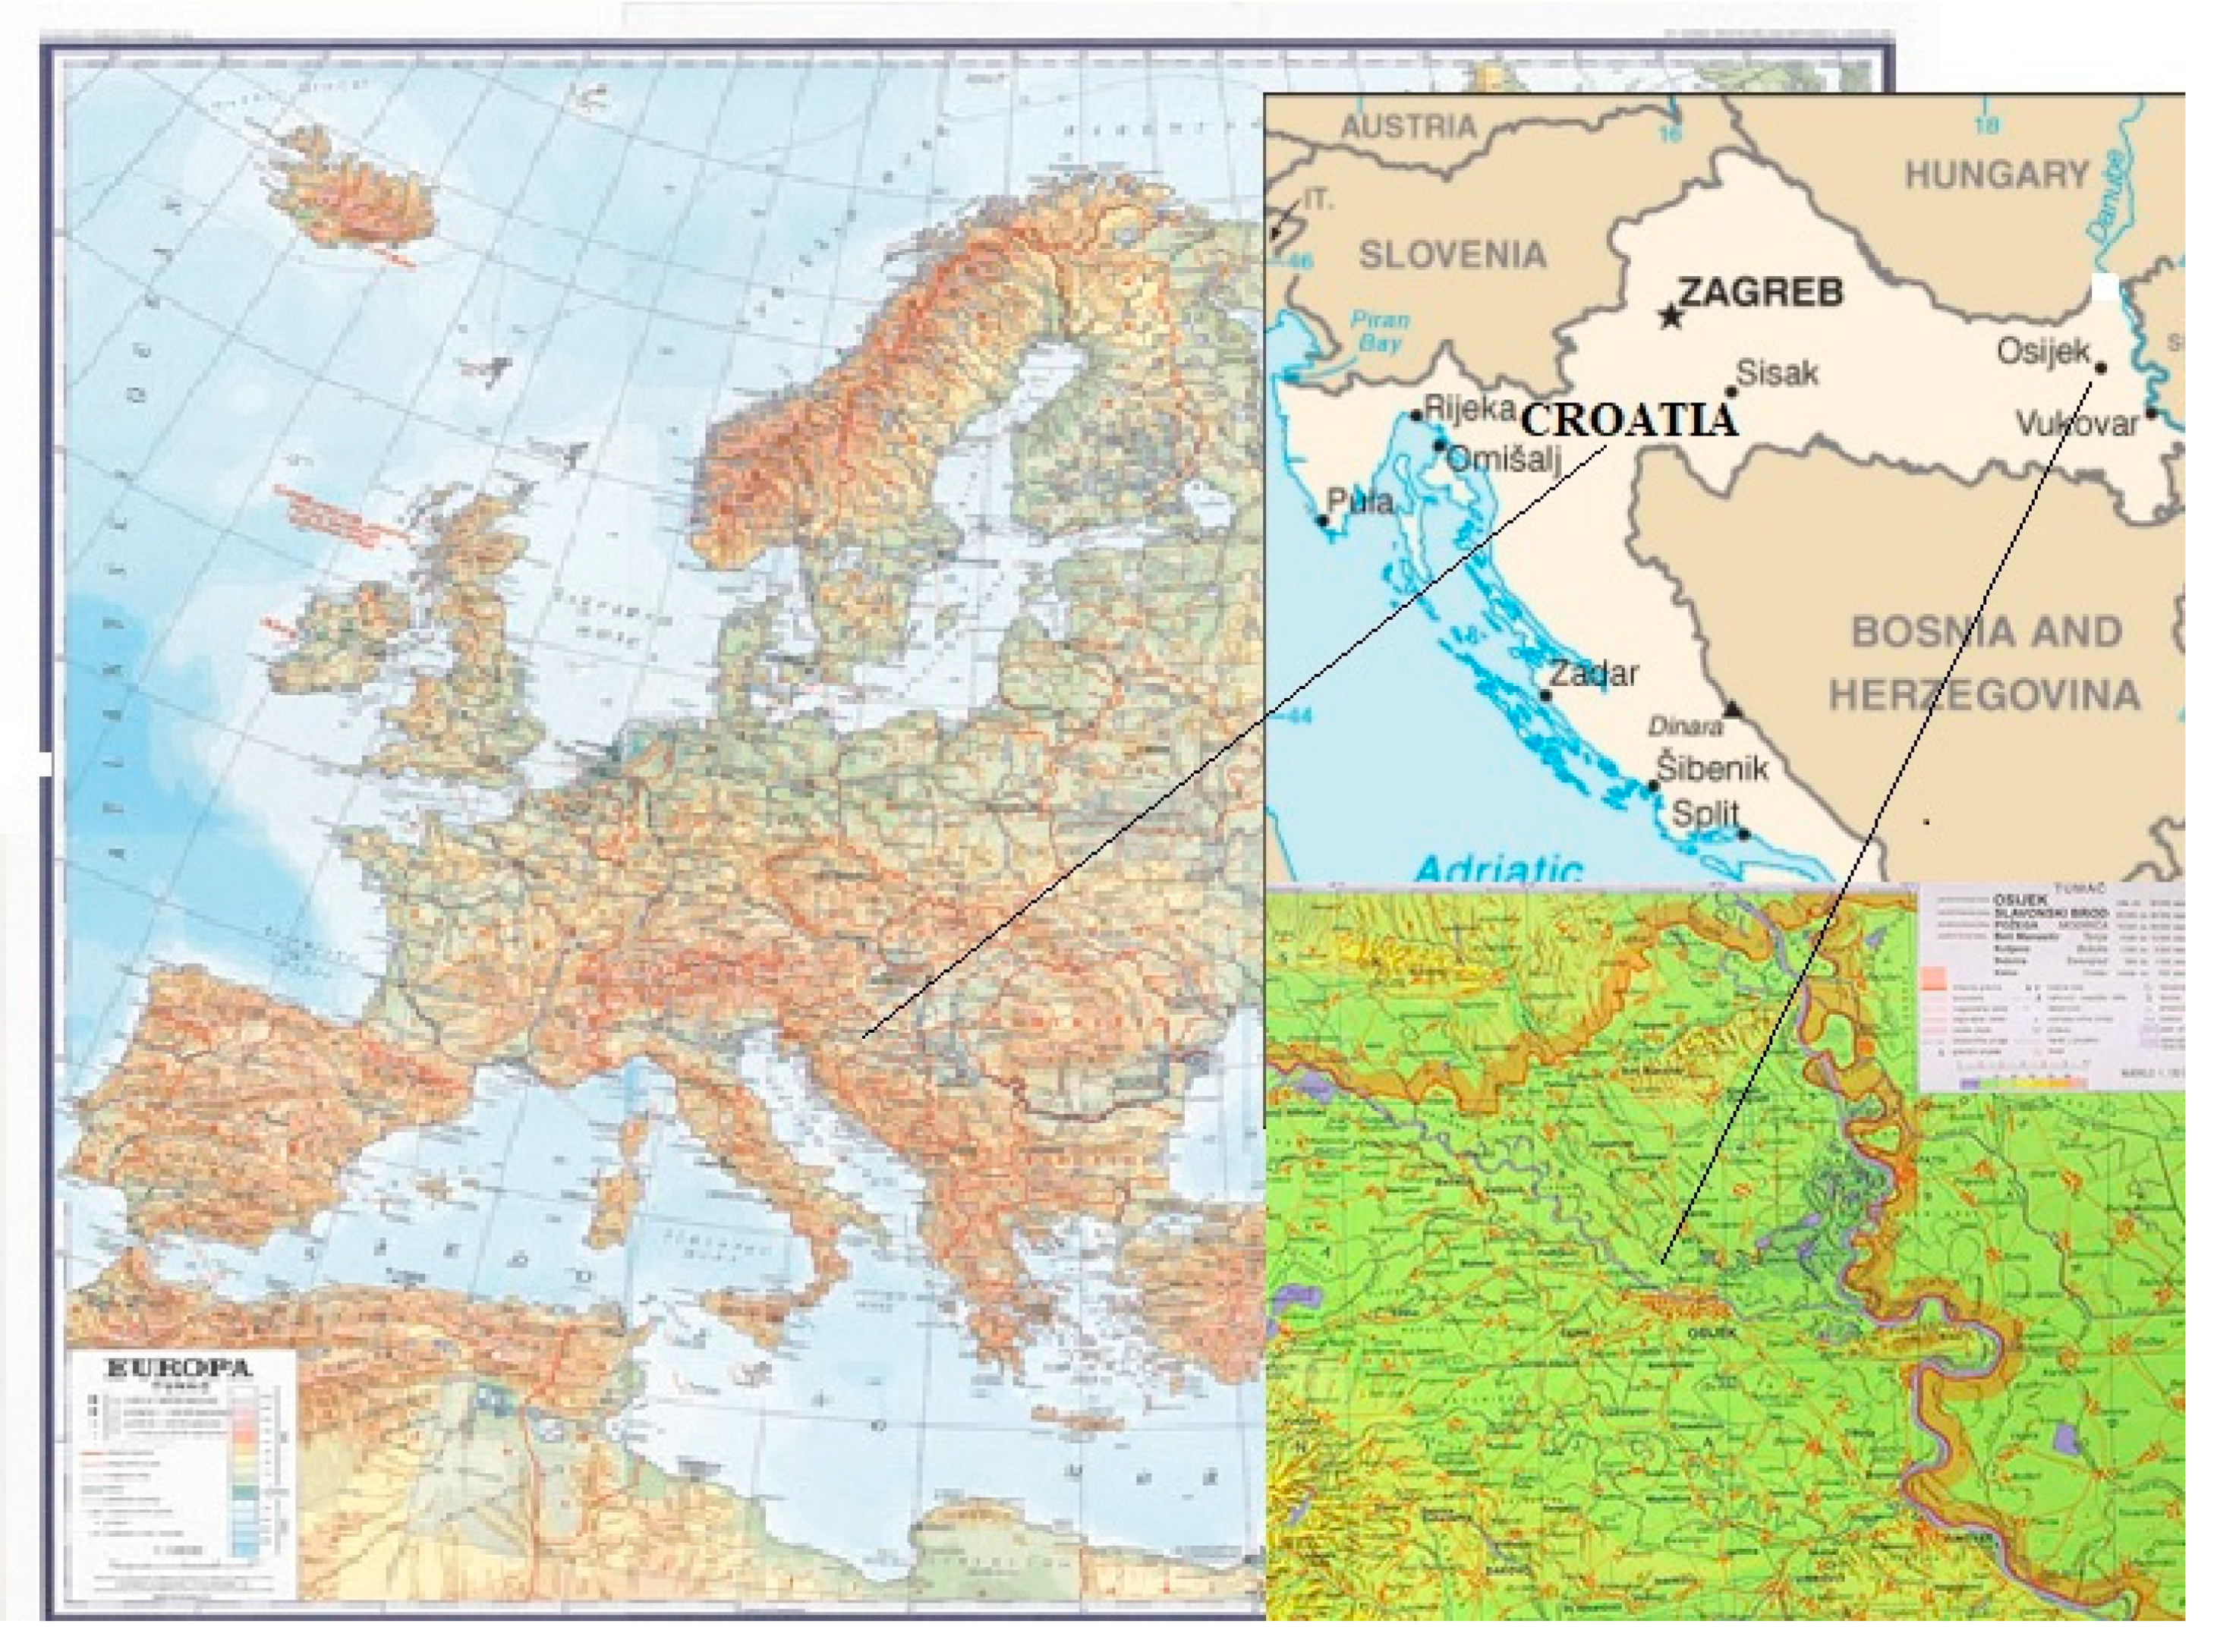
In this paper, attention is focused on groundwater as one of the most important segments of the ecosystem, with a specific focus on the effect of recorded extreme hydrometeorological conditions (changes in extremely wet, dry, or hot seasons) on groundwater levels in deep alluvial Quaternary aquifers at Osijek’s Vinogradi Pumping Station, Osijek, Croatia (Figure 1).
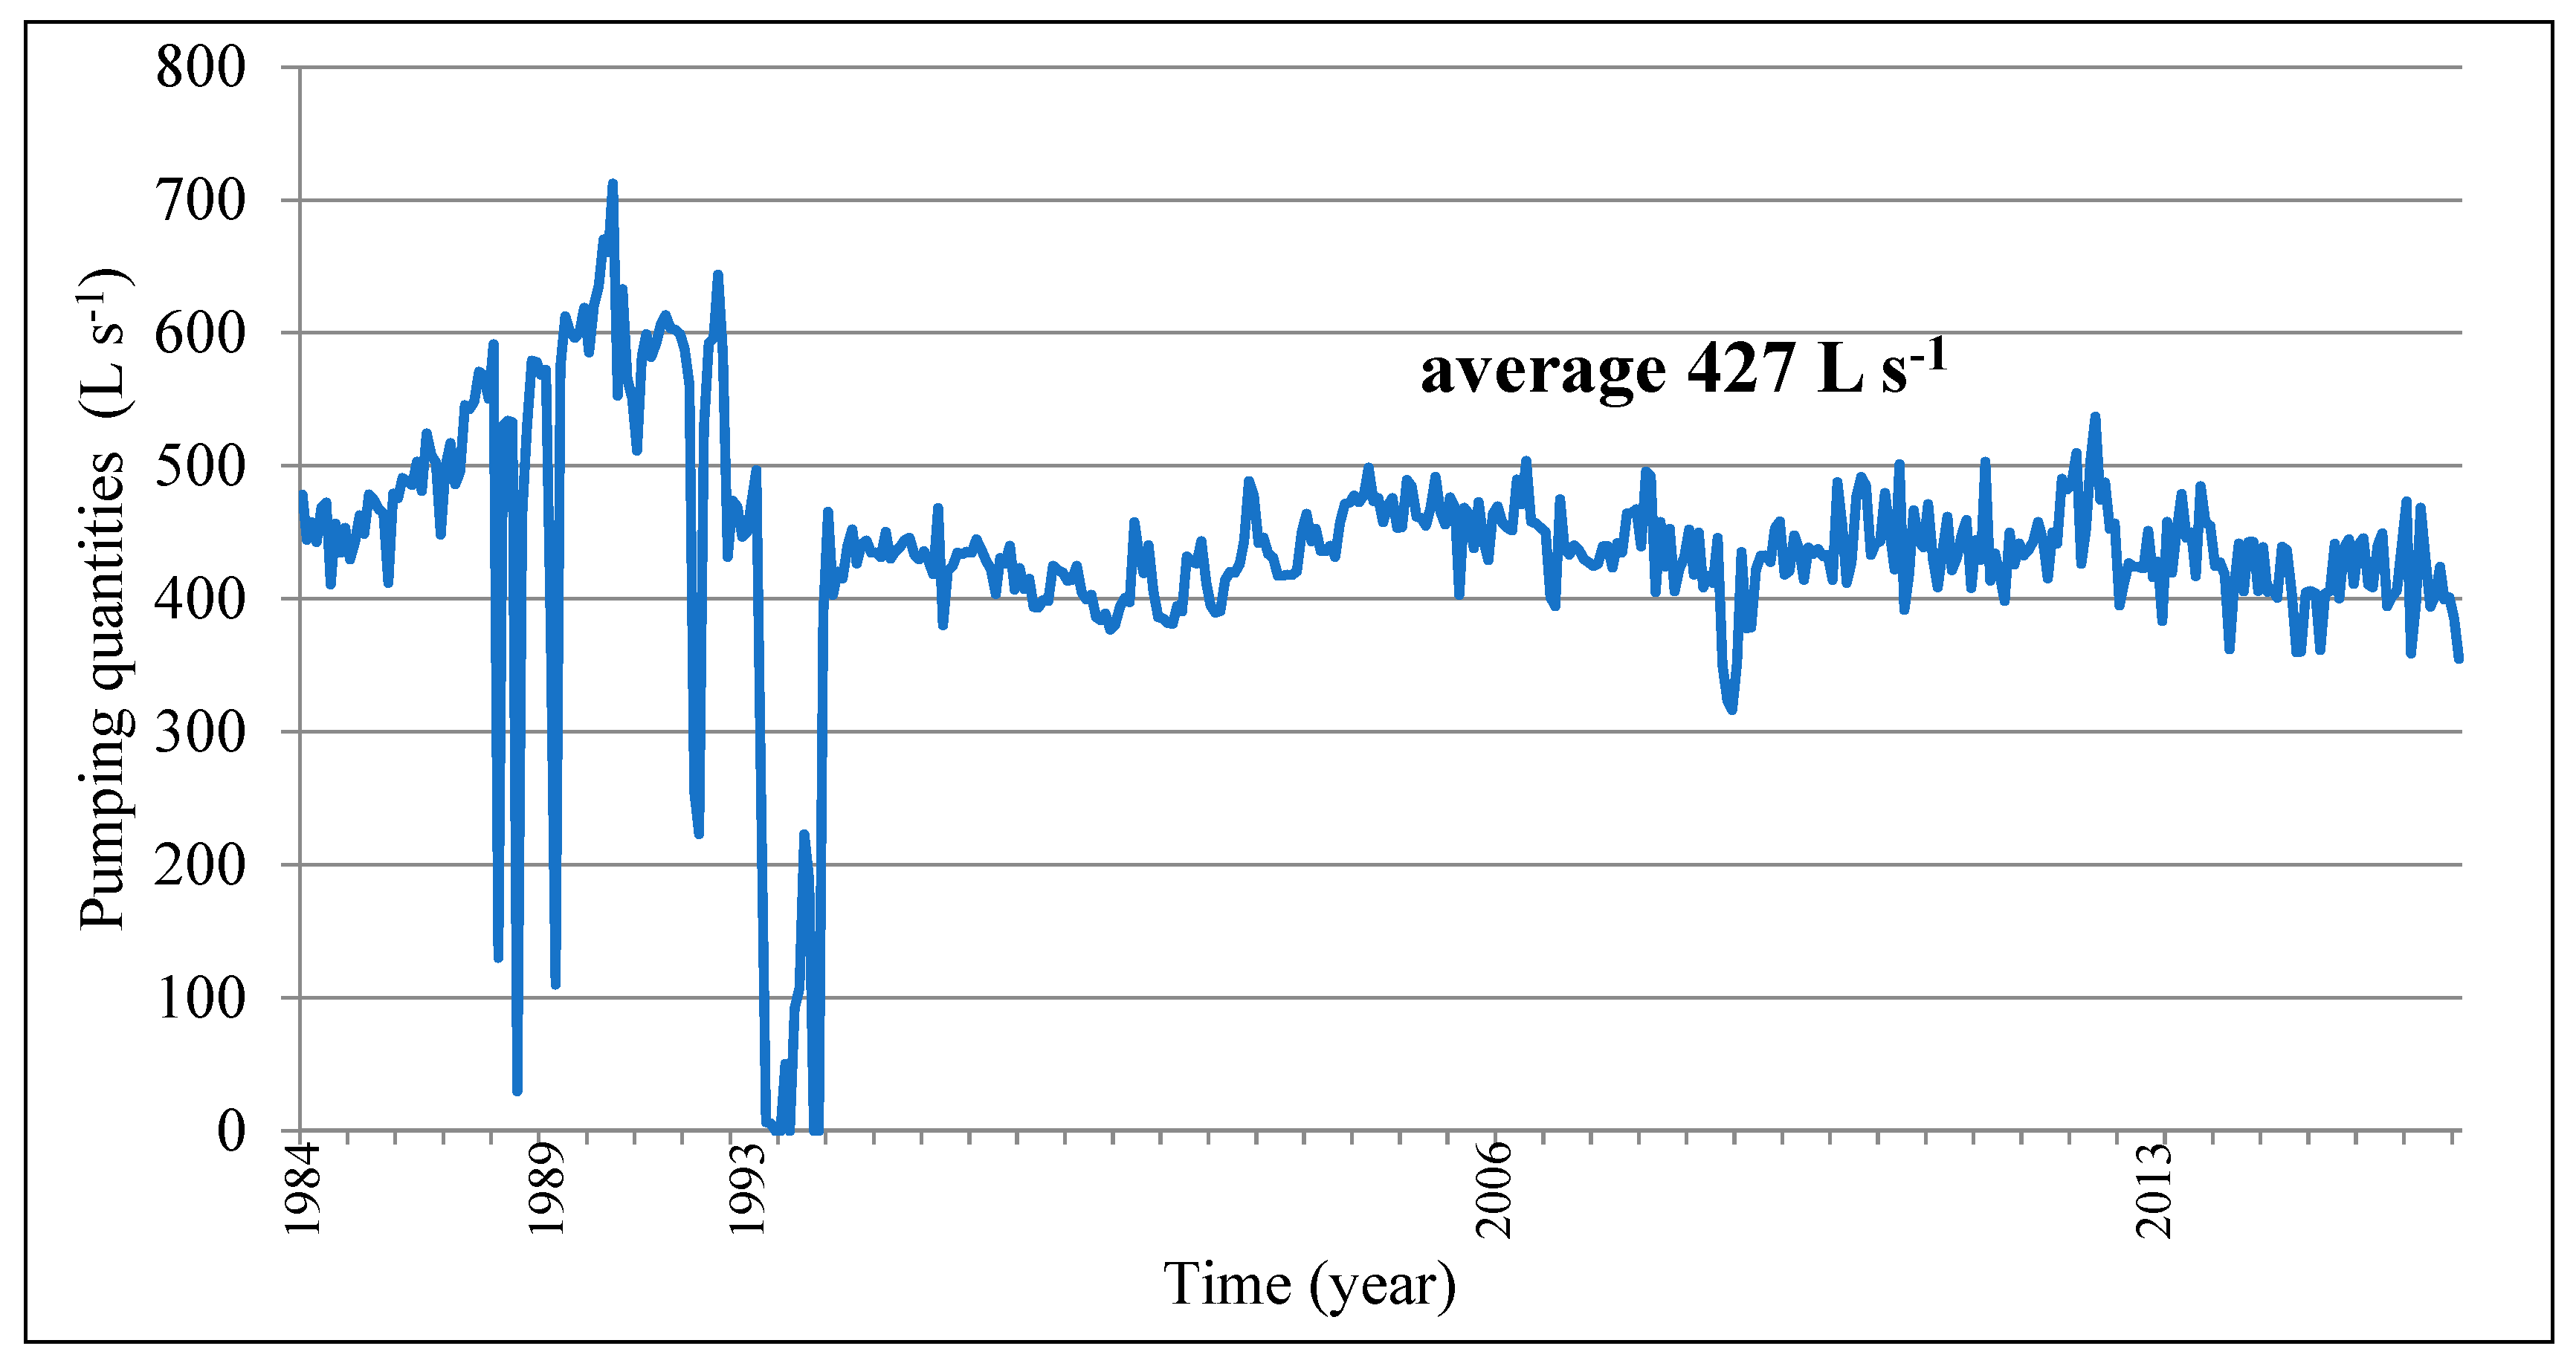
The Vinogradi Pumping Station, Osijek, Croatia is the largest in the Republic of Croatia where water is taken from sandy aquifers. It is affected by a complex of aquifers with very pronounced heterogeneity and relatively low hydraulic conductivity, from which quantities of about 450 L s−1 are drawn (Figure 2). For the most part, the aquifer is built of uniform fine- to medium-grained sand with thinner and thicker layers of silt and clay. An important feature of the structure of Quaternary deposits is the alternation of coarse-clastic and fine-clastic layers.
Pumping quantities are measured individually for each well and in total for the entire Vinogradi Pumping Station, Osijek, Croatia. Each well is equipped with an automatic flow meter and the measured quantities are stored and processed in the system of central monitoring and management of the pumping station. The total quantities of pumped water are measured at the connecting pipeline of raw water DN 800, at the exit from the pumping station, and at the entrance to the water production plant.
The first years of operation of the pumping station from 1984 to 1986 were marked by a relatively uniform amount of pumping. Its value ranged from 411 to 478 L s−1. Pumping volumes gradually increased between 1986 and 1990, exceeding 600 L s−1 Ln 1990 and 1991—a pumping volume of 712 L s−1 was recorded during this period. The operation of the pumping station was characterized by frequent interruptions caused by problems with the raw water pipeline between the pumping station and the production plant, which resulted in a very uneven mode of operation until the closure of the pumping station in March 1994. After the reconstruction of the raw water pipeline and re-entry of the pumping station into operation in December 1994, pumping volumes are gradually stabilizing at an average of 427 L s−1, with a decreasing tendency in the total pumped volumes in the last two years of the research period (Figure 3).
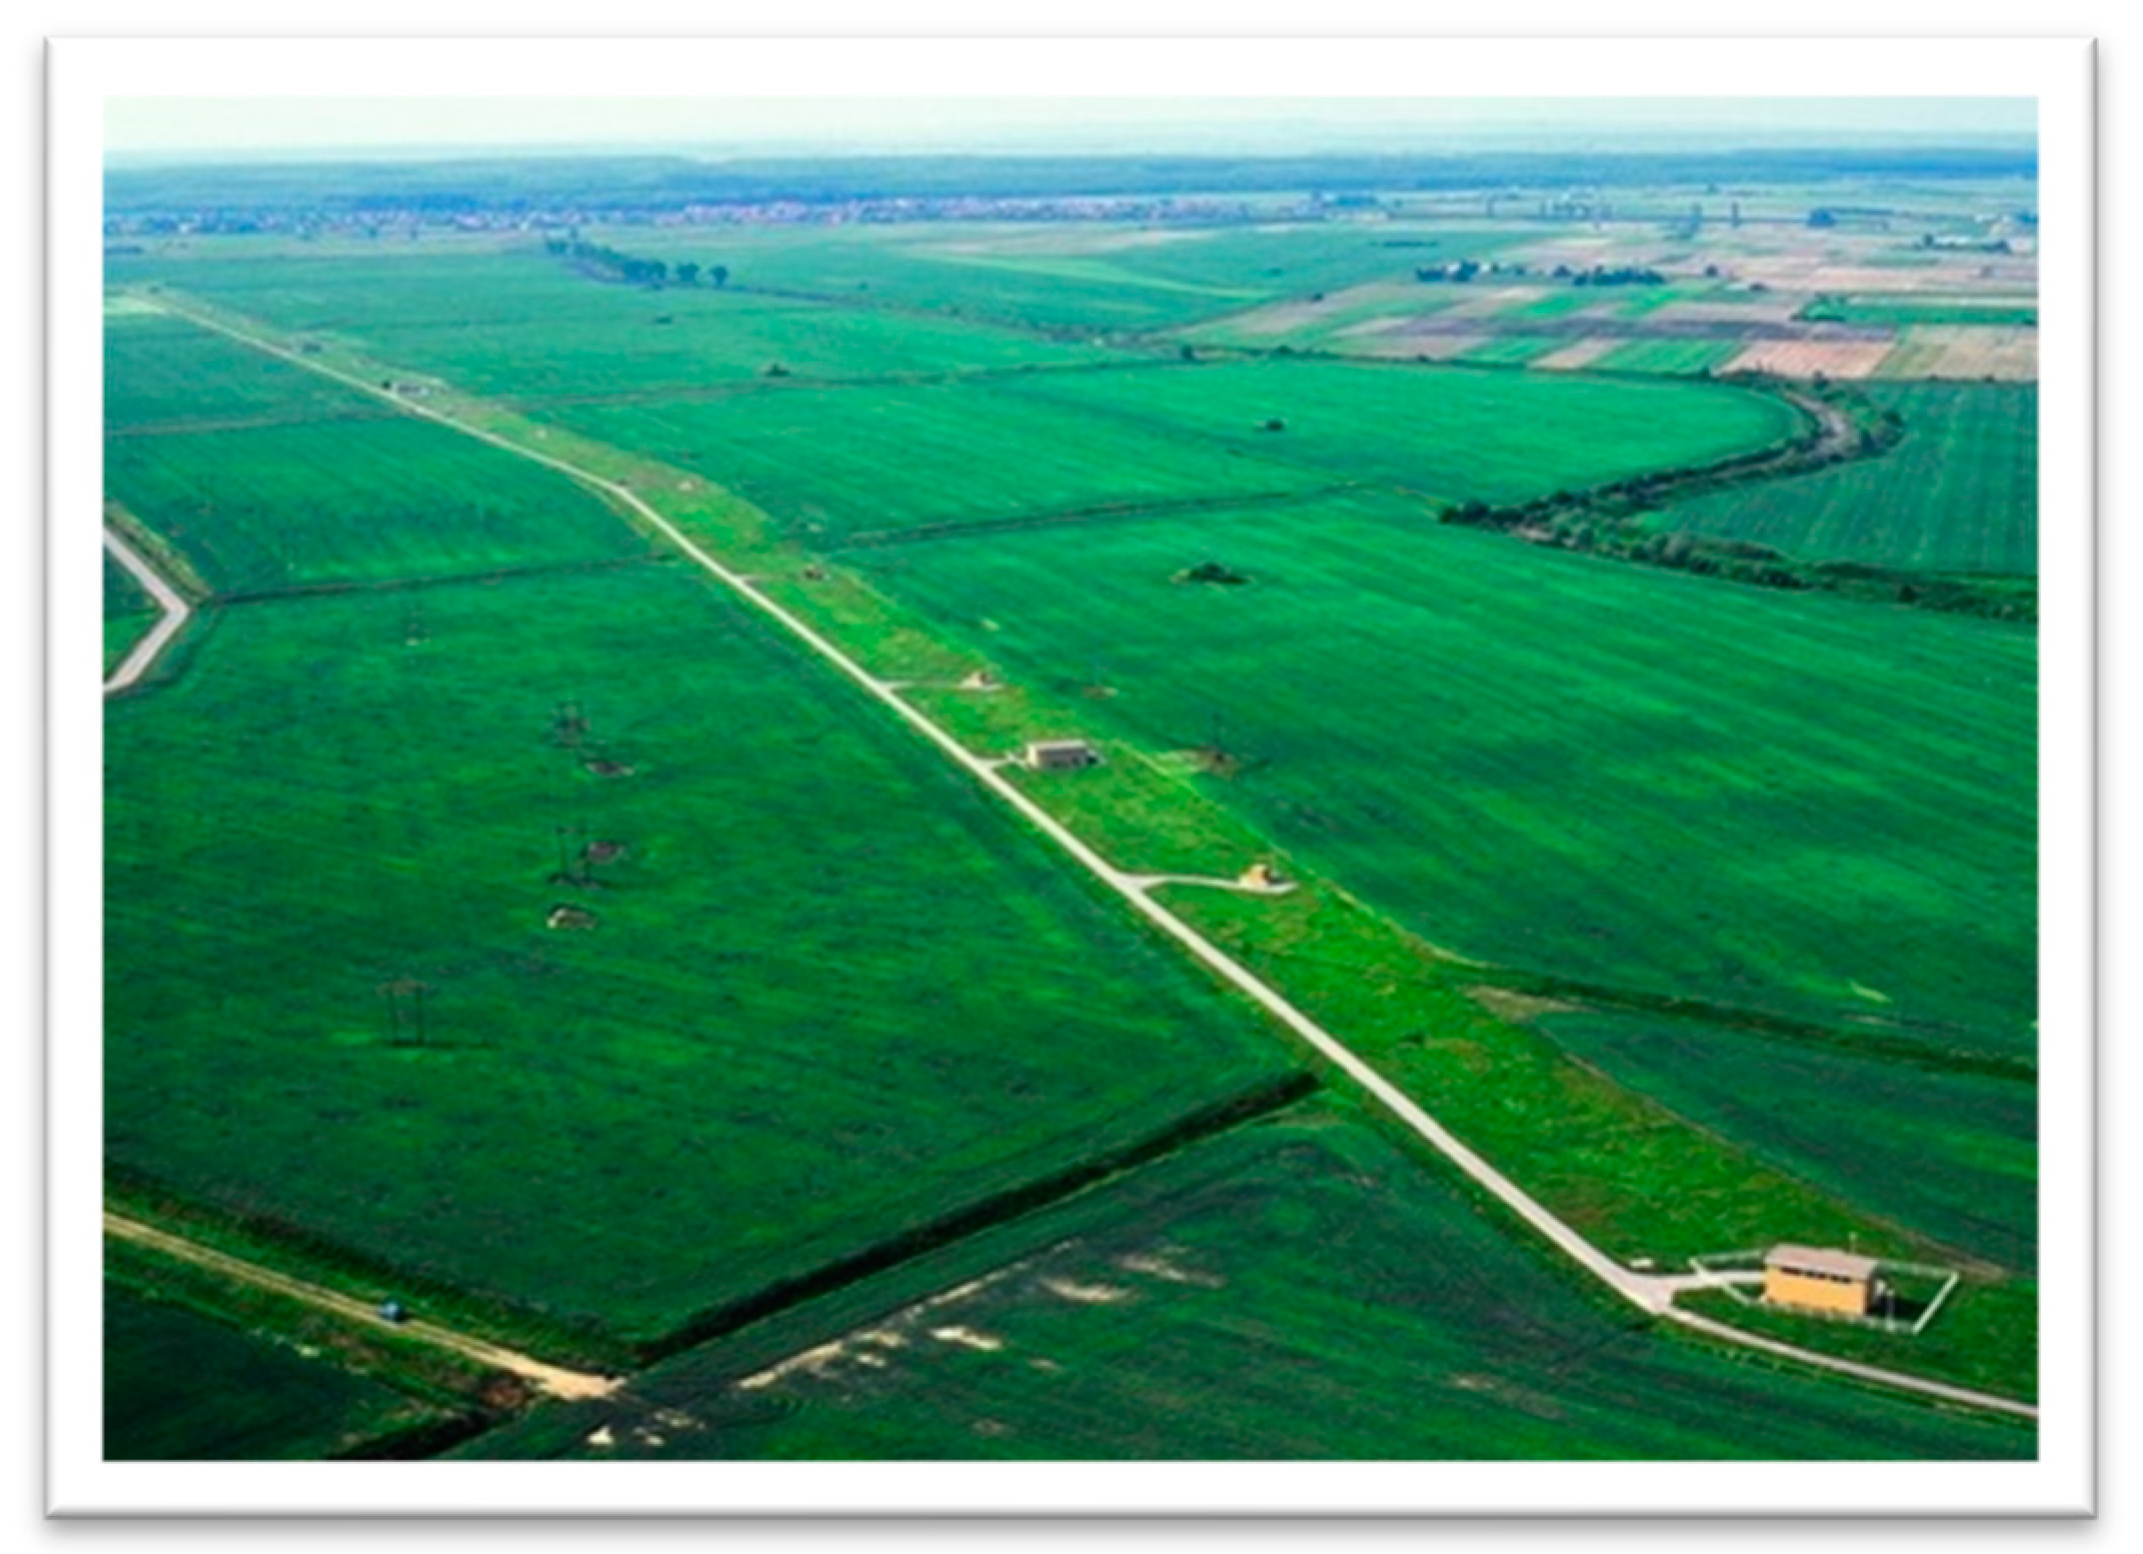
In the regional sense, the Vinogradi Pumping Station (Osijek, Croatia) belongs to the grouped water body known as the “Eastern Slavonia—Drava and Danube basin”, which stretches into the far east of the Republic of Croatia. It is characterized by vast plains in which thick clastic deposits were deposited during the Quaternary (Figure 4).
The present morphology is largely the result of post-Pliocene movements that are strongly pronounced in this area. Extensive research has been conducted for the mentioned area, and data on the work of the Vinogradi Pumping Station, Osijek, Croatia have been recorded since its commissioning in mid-1984.
3. Materials and Methods
Chemical and microbiological analyses of groundwater performed by the drinking water laboratory of the company Vodovod Osijek (Osijek, Croatia) were collected for research in this paper. Samples were taken once a month, and sometimes more frequently at 18 wells.
In the microbiological analyses performed during the observed period, no deviation from the legally established standards was recorded—that is, no defect in the natural water of the deep alluvial aquifer in microbiological terms was found. Natural water, thanks to the reducing ambient conditions of the layer from which it is pumped, does not contain microorganisms. This feature of the natural water of deep alluvial aquifers is certainly a significant natural advantage. The chemical quality of natural water is analyzed in more detail below.
The natural quality of groundwater in this area is conditioned by the deposition of the aquifers, which took place in a reductive environment, so it is expected that they will have an increased content of iron, manganese, and ammonia in some places.
In order to assess the impact of climatic extremes and gain insight into changes in the chemical characteristics of groundwater quality, the dominant parameters of water quality in the observed area are analyzed below, specifically iron, manganese and ammonia. The analysis aimed to prove that these parameters are under the dominant influence of the aquifer environment. The analysis of nitrate concentration, in addition to the influence of climatically extreme years, also indicated possible anthropogenic impact. The analysis of the mentioned groundwater quality parameters was performed by comparing the concentrations determined by sampling at the Vinogradi Pumping Station, Osijek, Croatia and the maximum permissible concentration (MPC) in accordance with the ordinance on compliance parameters, methods of analysis, monitoring and safety plans for human consumption (Croatia).
4. Results
4.1. Climate Indicators
The analysis of annual precipitation from the Osijek Meteorological Station, Osijek, Croatia for the period from 1980 to 2015 (Figure 5) highlights three low-water years in 2000, 2003, and 2011. In the continuation of this research, these three low-water years will be considered in more detail.
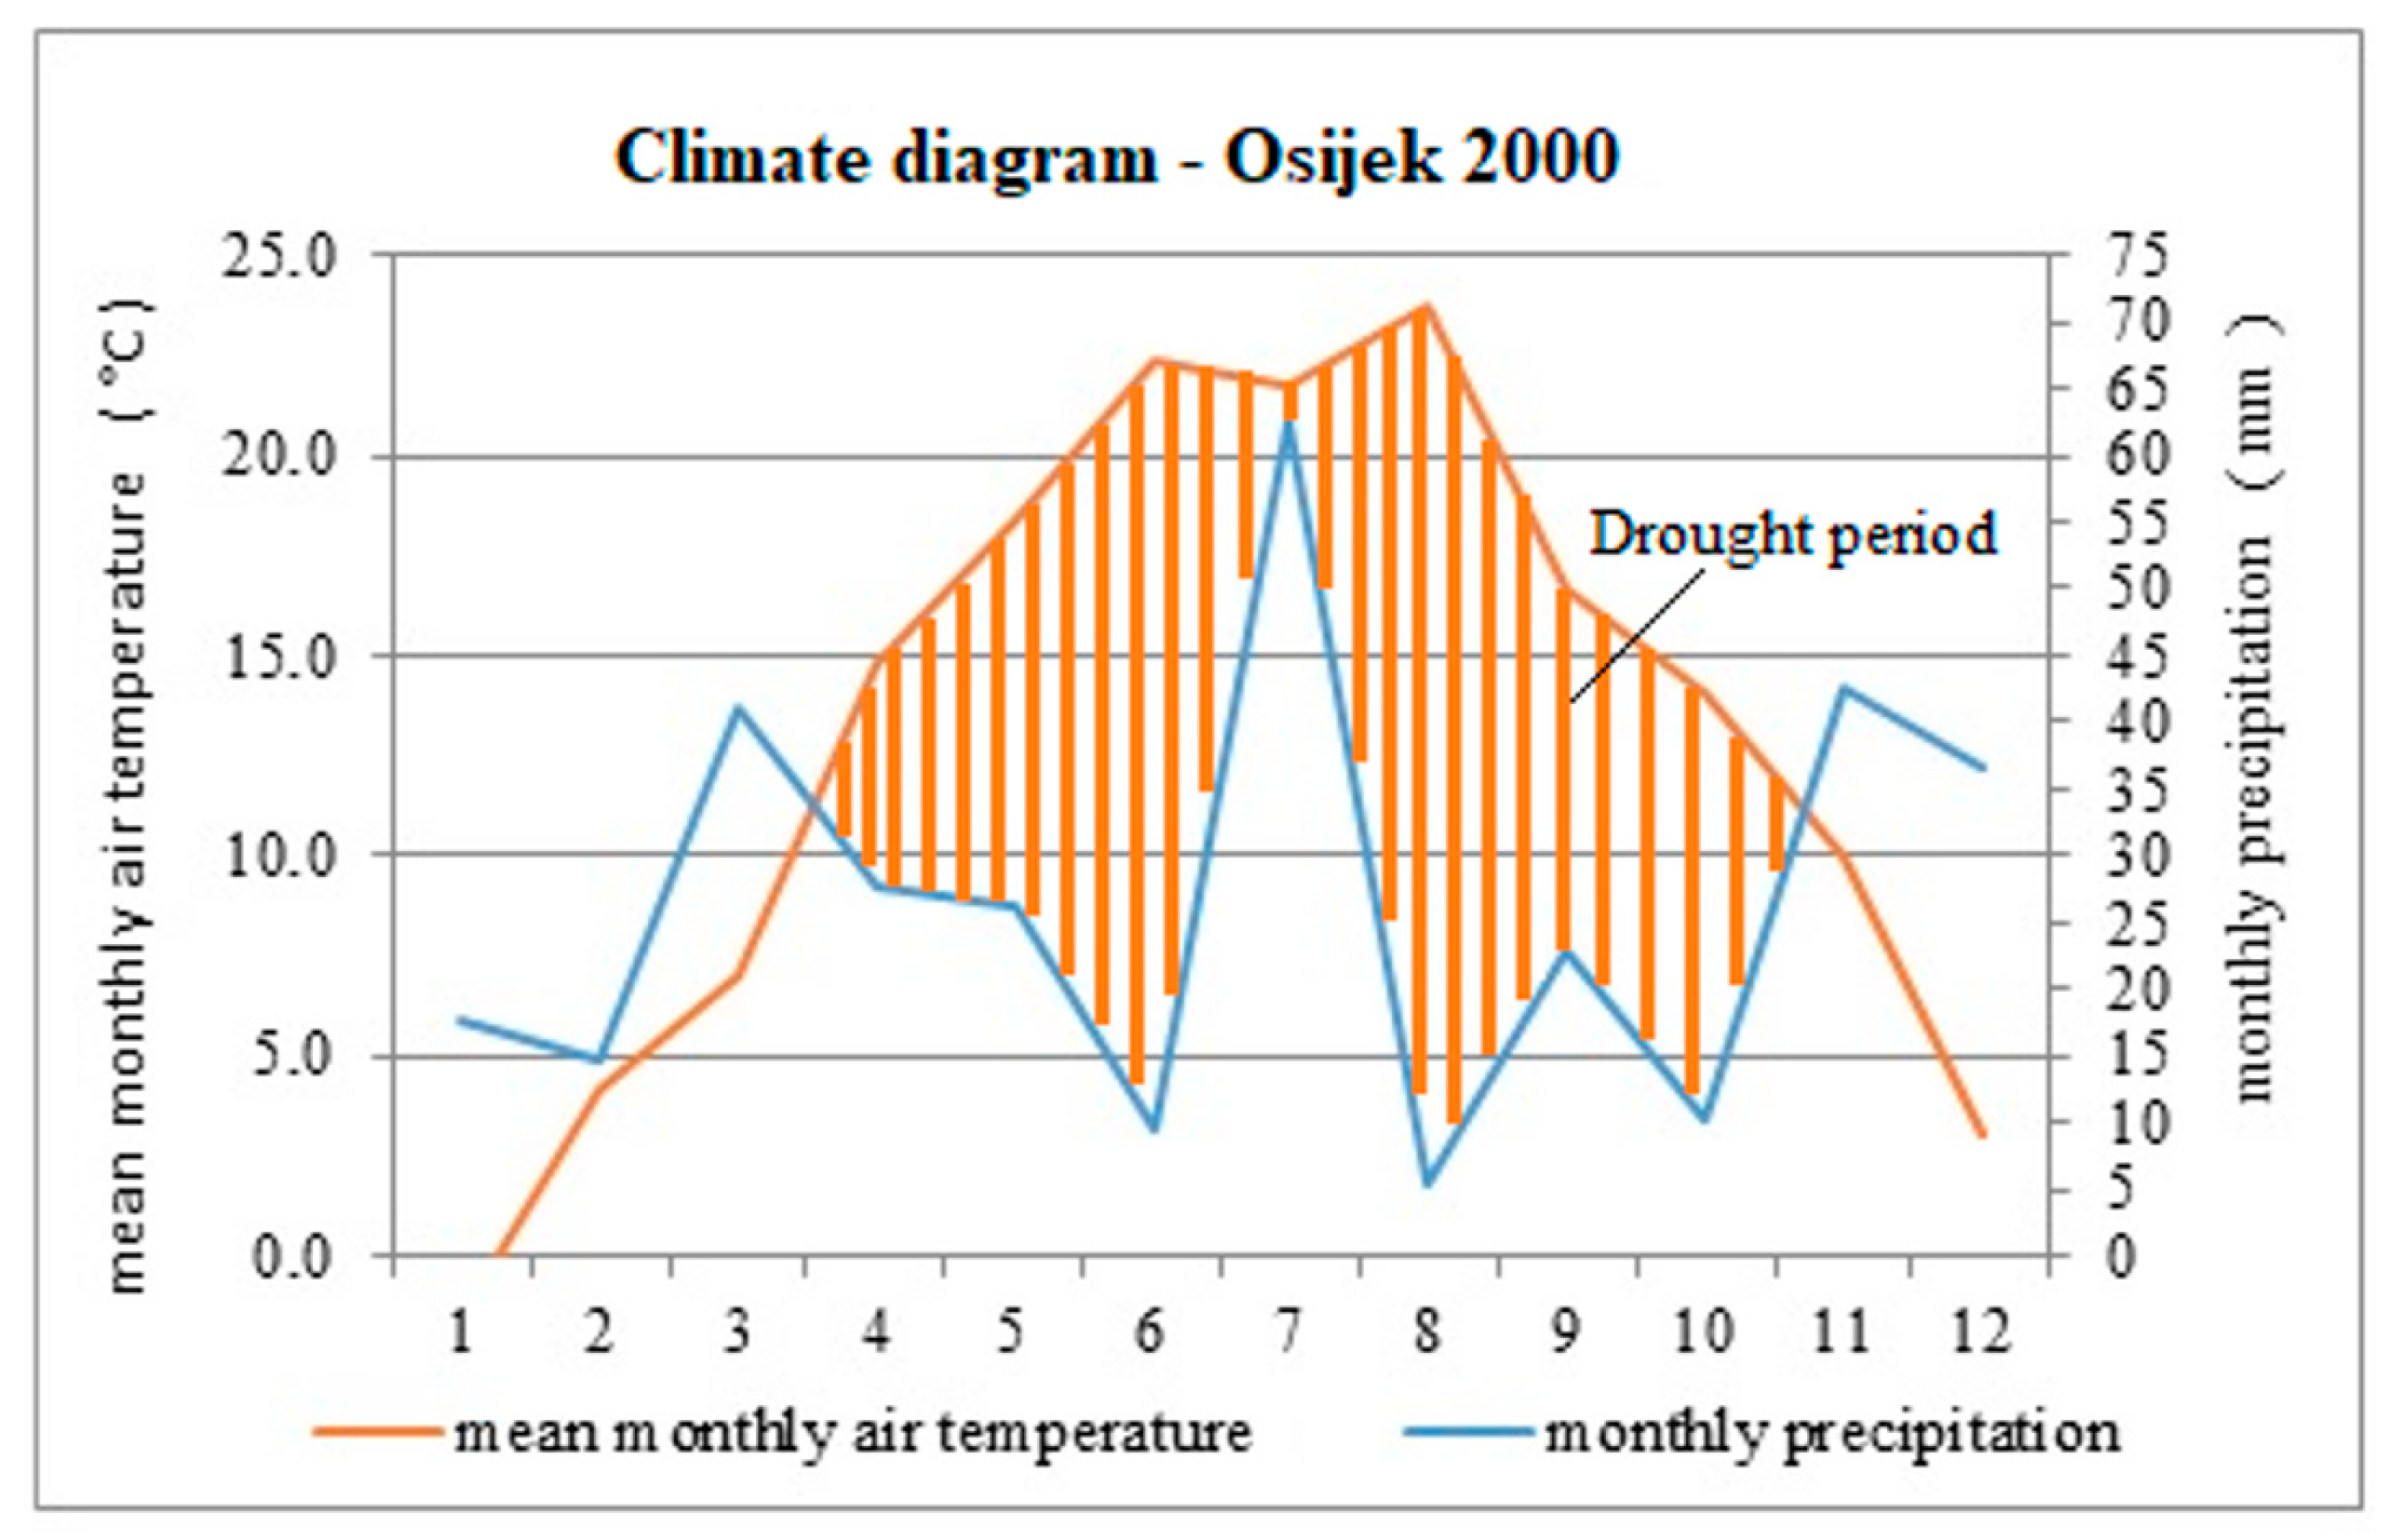
The climate diagram for Osijek, Croatia for 2000 confirms the characteristics of weather conditions were in the “extreme” category (Figure 6). The drought period according to the Walter–Lieth climate diagram prevailed for almost the whole year. The wet period occurred in January, February, March, and December. The year 2000 was classified as being both extremely warm and extremely dry, according to the deviation of the average annual air temperature and the annual amounts of precipitation, respectively.
The climate diagram for Osijek, Croatia for 2003 shows the dry period from February to September. A defining characteristic of this year is the occurrence of significantly above-average precipitation in October of 132 mm. The average precipitation in that month was 59.9 mm. The deviation of mean annual air temperature from the average for the period 1961–1990 means that 2003 can be classified in the category of “warm” for the observed area of the wider surroundings of Osijek, Croatia (Figure 7). Given the annual precipitation in 2003, it was also very dry.
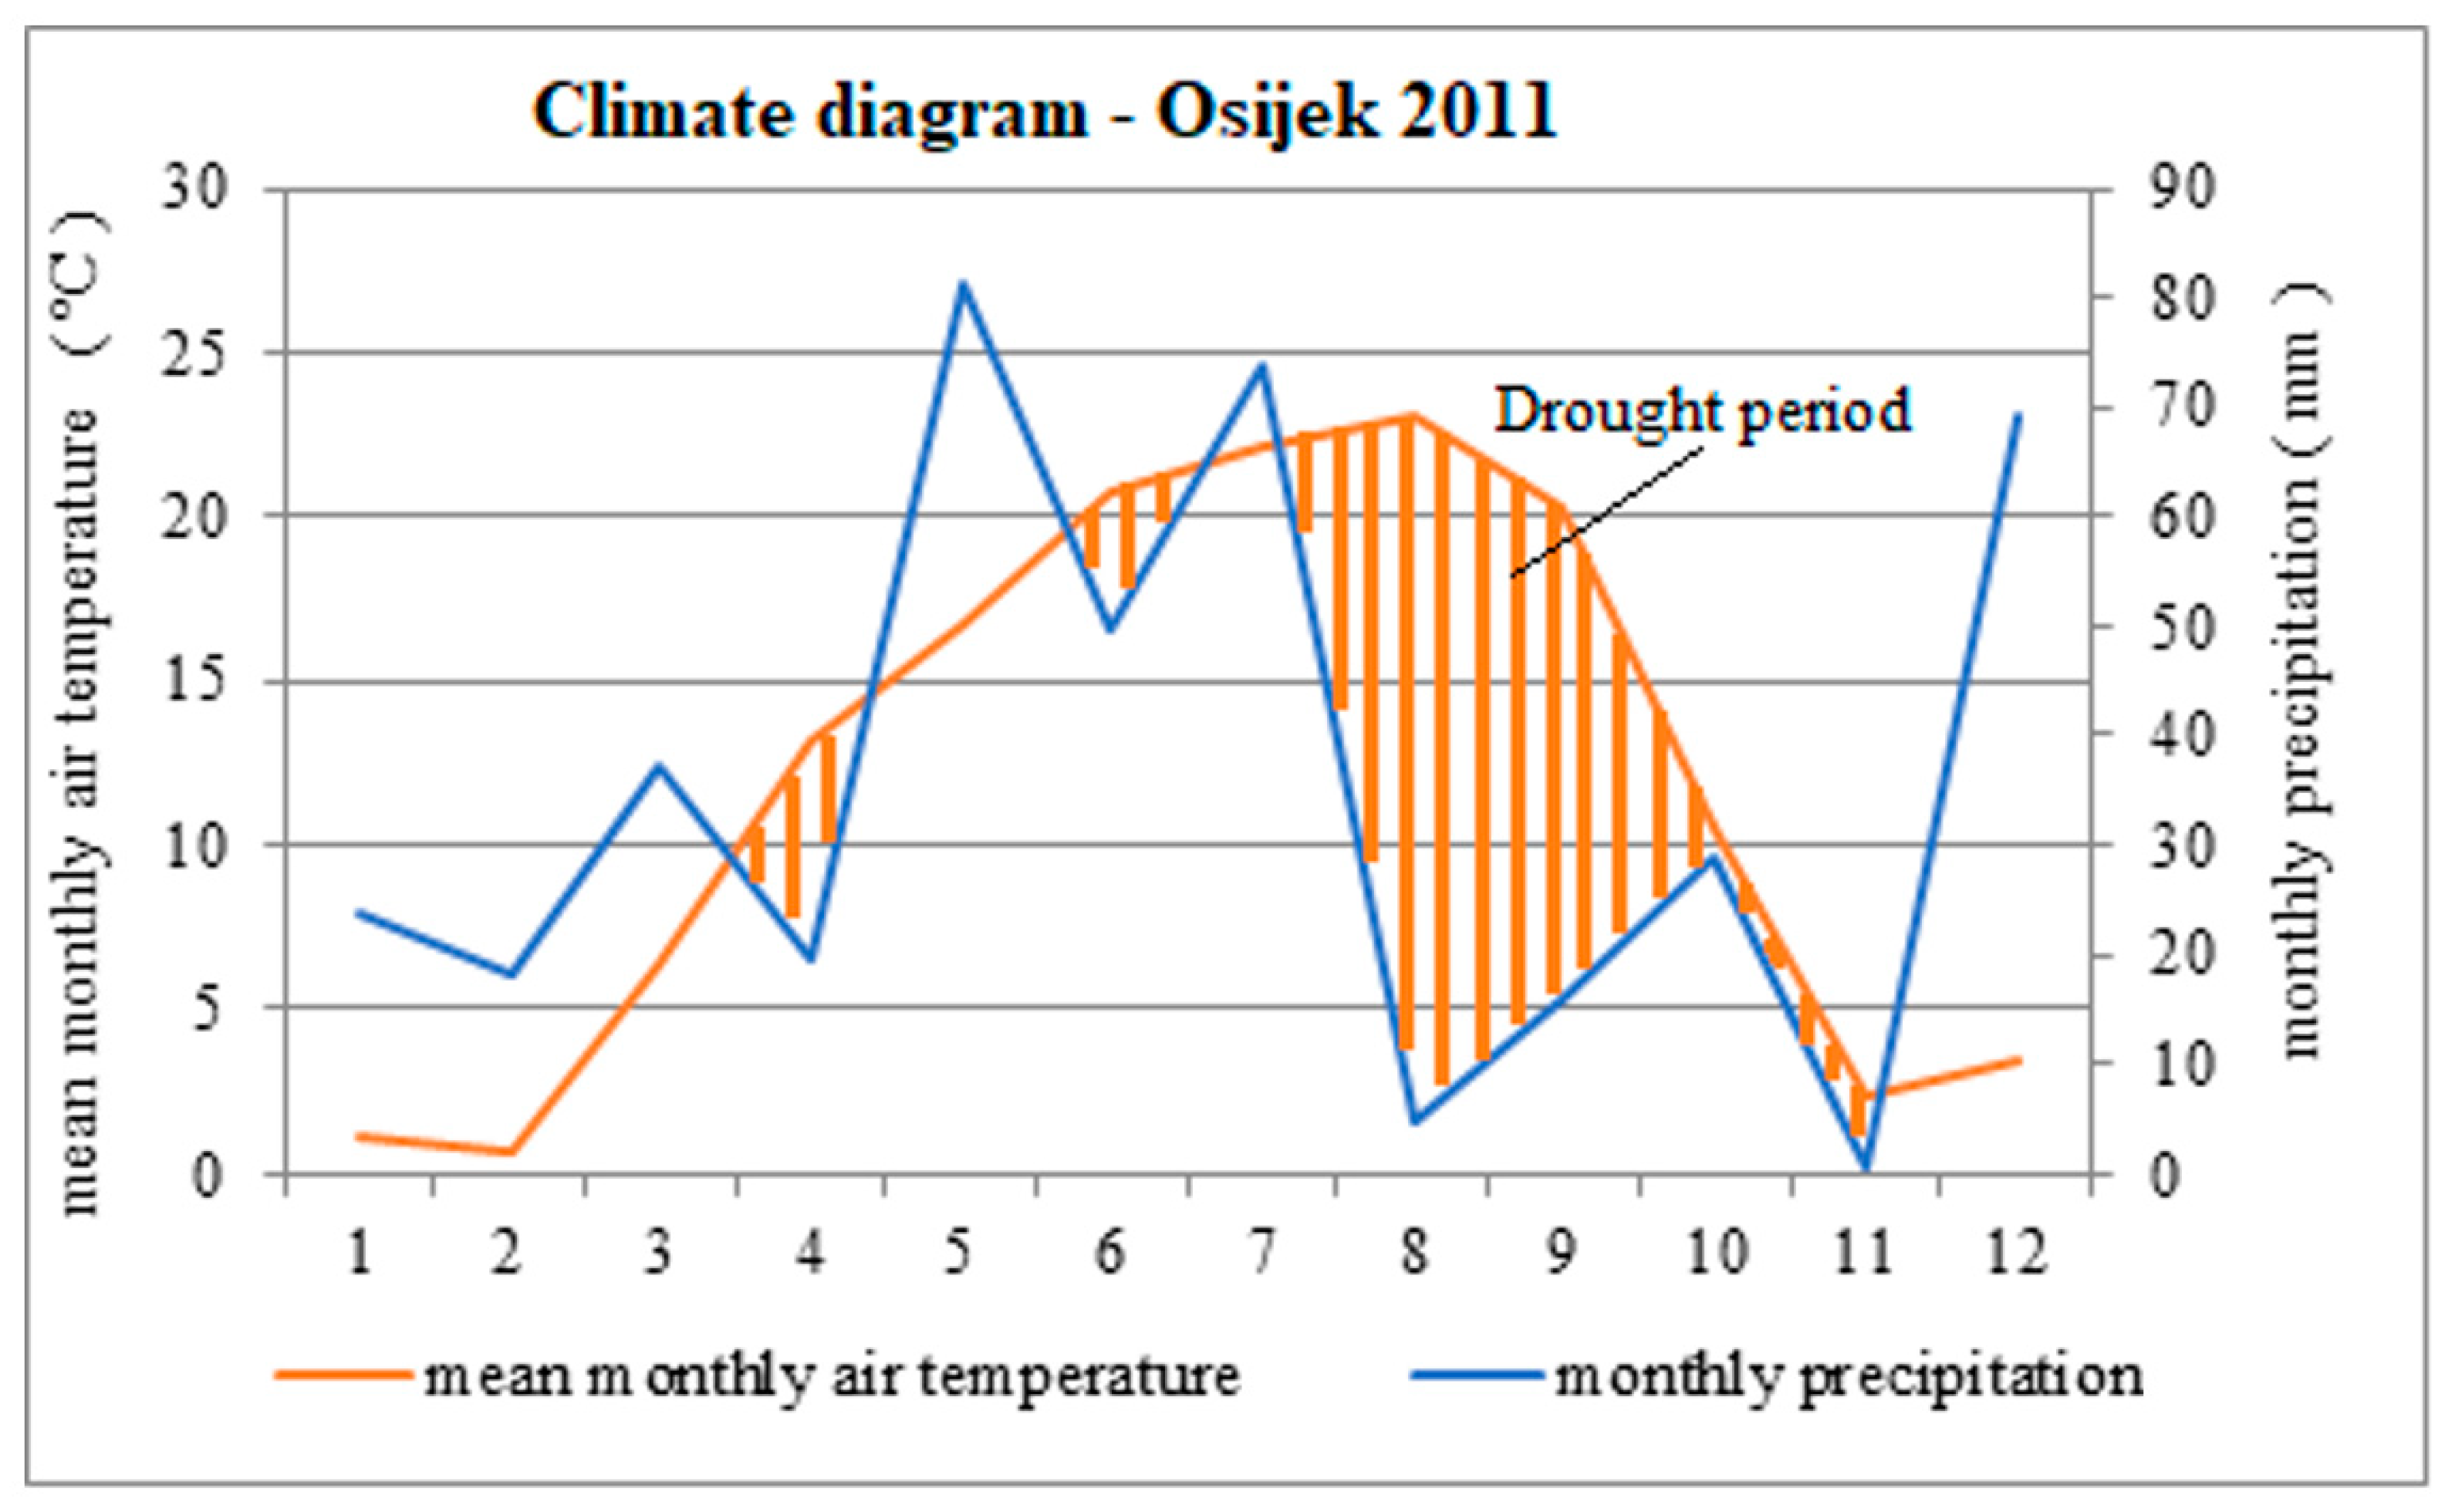
The following climate diagram for 2011 shows the alternation of dry and rainy periods on an almost monthly basis (Figure 8). Deviation of the mean annual air temperature from the average for the years 1961–1990 classifies 2011 in the category of “very warm”. Given the annual precipitation, 2011 was also extremely dry.
The basic characteristics of the precipitation regime and air temperature regime in 2000, 2003, and 2011 are given in Table 1. The positive sign of the temperature regime coincides with the negative sign of precipitation. The lack of precipitation (i.e., the negative deviation from the precipitation average) was accompanied by above-average air temperatures [40].
4.2. Water Levels in Piezometers
Level charts of individual piezometers are considered below in order to better understand the response of aquifers to extreme low-water years. Monitoring the effects of climate on groundwater levels requires the observation of wells that respond to climate iability and are ideally located away from pumping and irrigation. Among the observed group of piezometers that can be treated as representative of remote piezometers, Piezometer Pz 3 was the closest piezometer to pumping station that was considered (approx. 950 m away) and Pz 8 was the farthest piezometer (approx. 5500 m away). If groundwater reserves are large, dry periods will have little or no impact on long–term aquifer water storage [41].
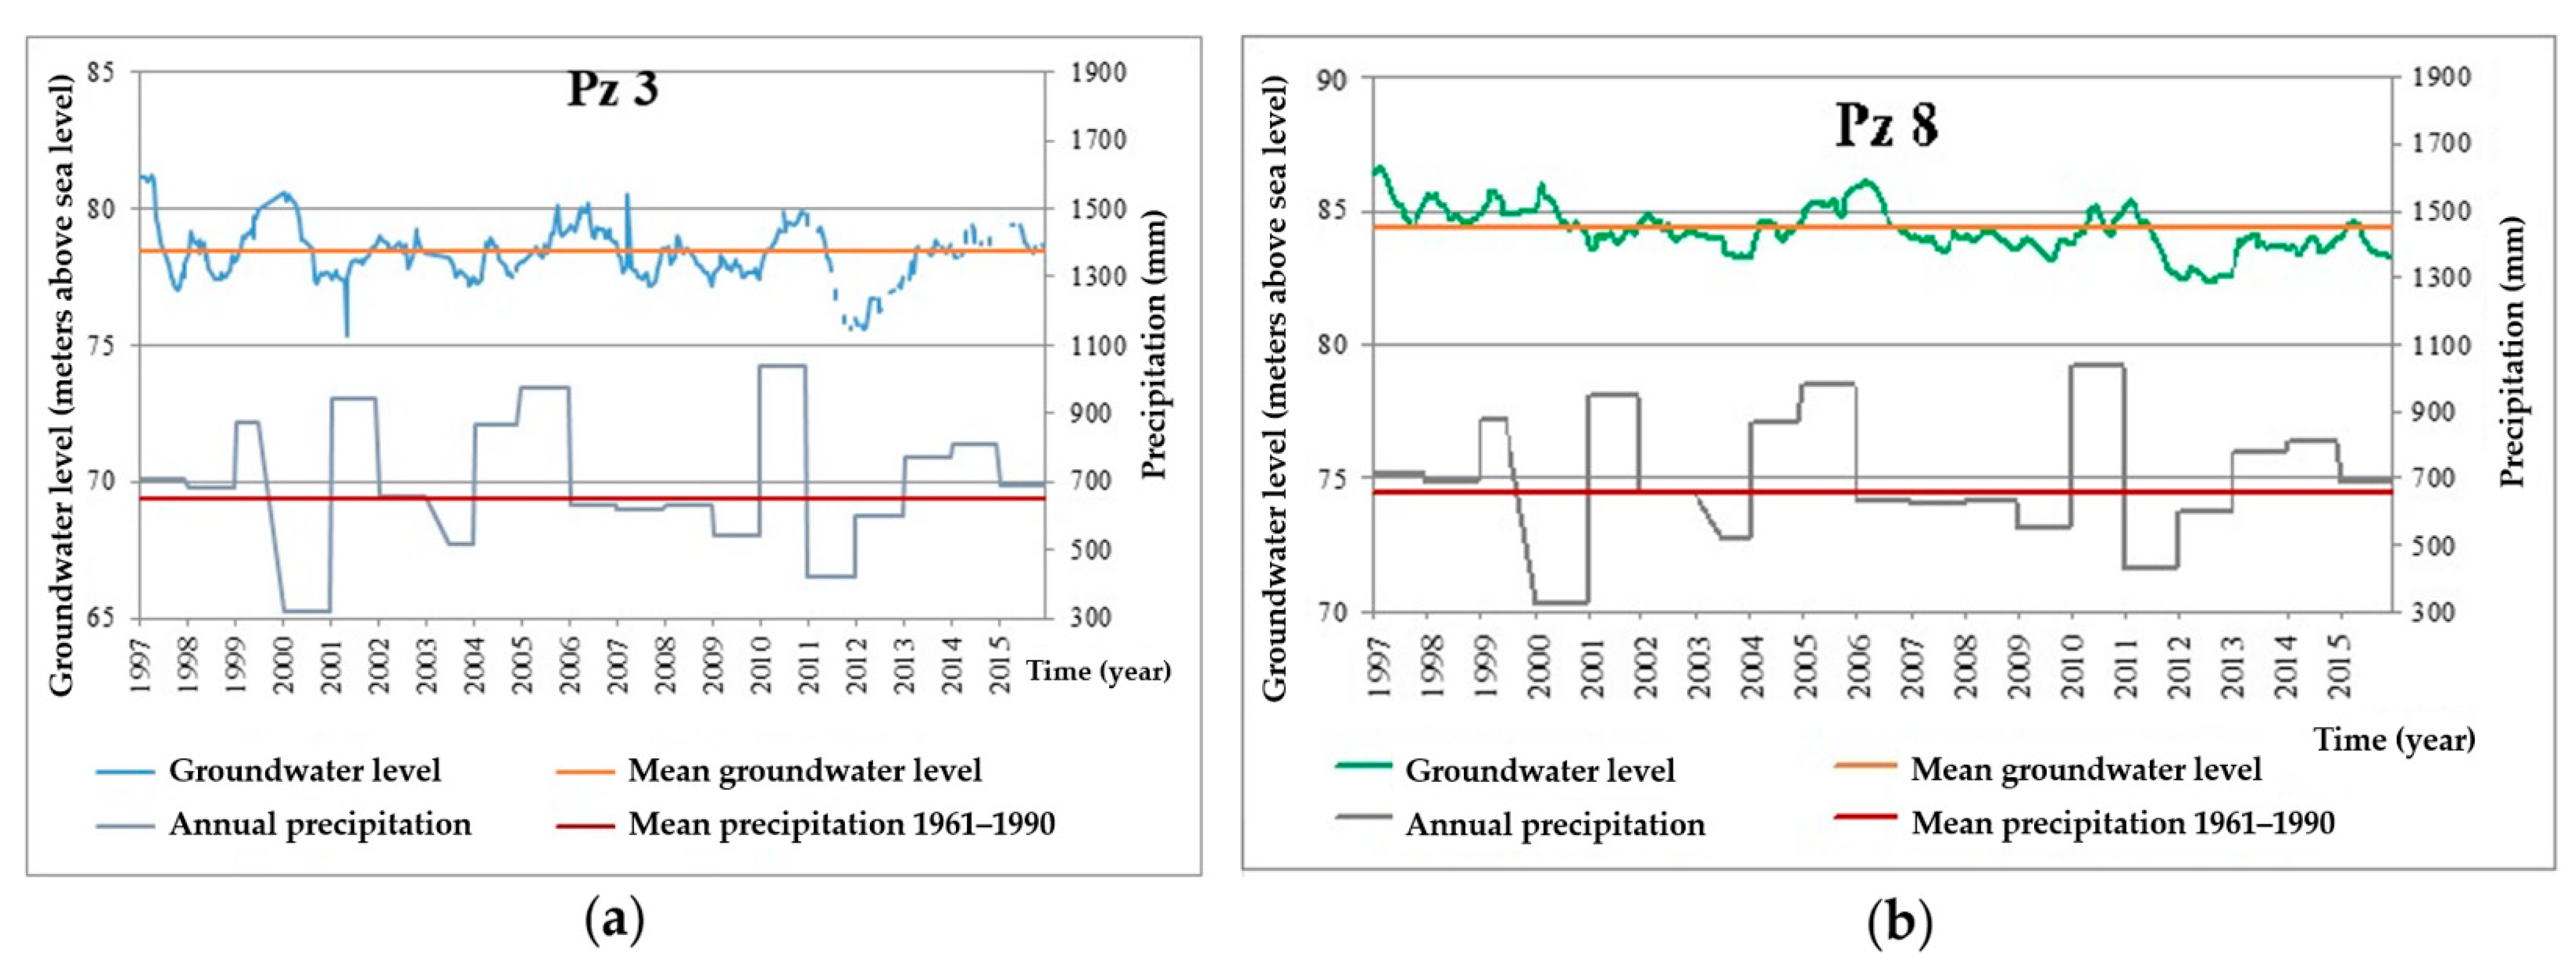
Fluctuations in groundwater levels are characterized by a uniform seasonal rhythm (Figure 9).
The standard deviation and coefficient of variation for fluctuations in groundwater levels in Pz 3 showed slightly higher values than the same parameters for fluctuations of levels in Pz 8. This can be explained by the fact that Pz 8 is the furthest piezometer from the groundwater, while at Pz 3, which is closer to the pumping station, a slight influence of the amount of pumping can be observed (Table 2).
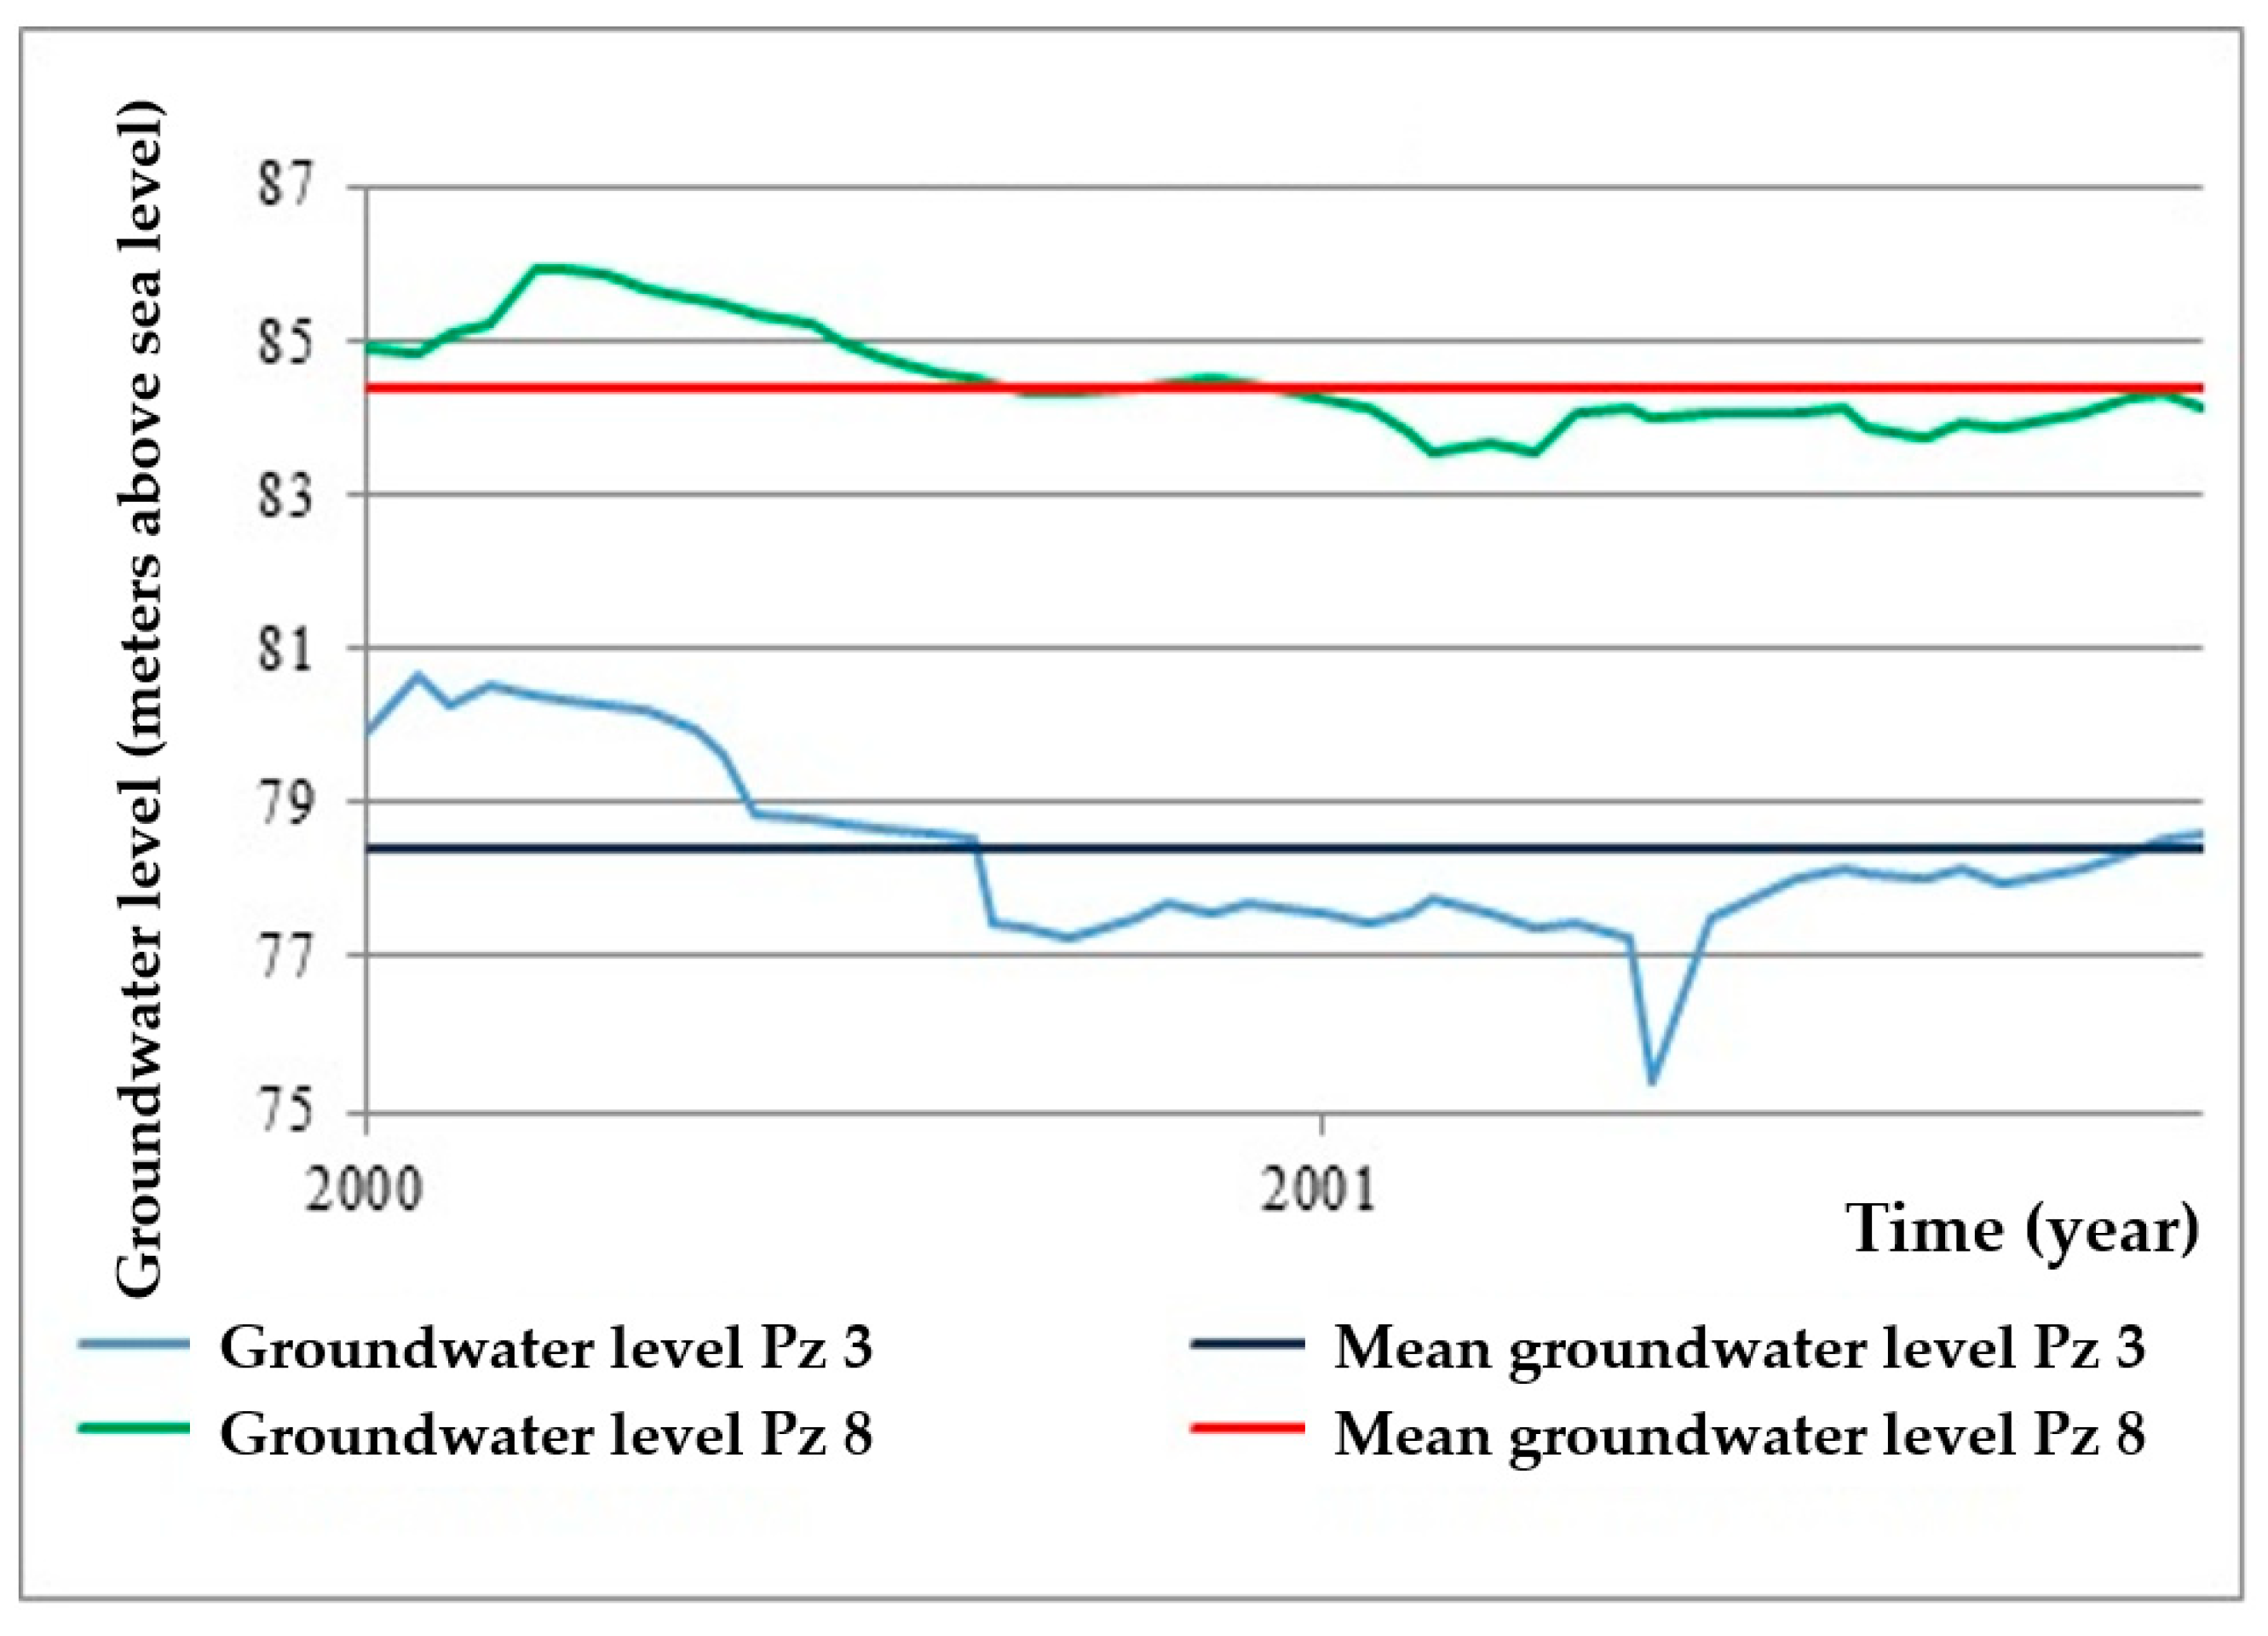
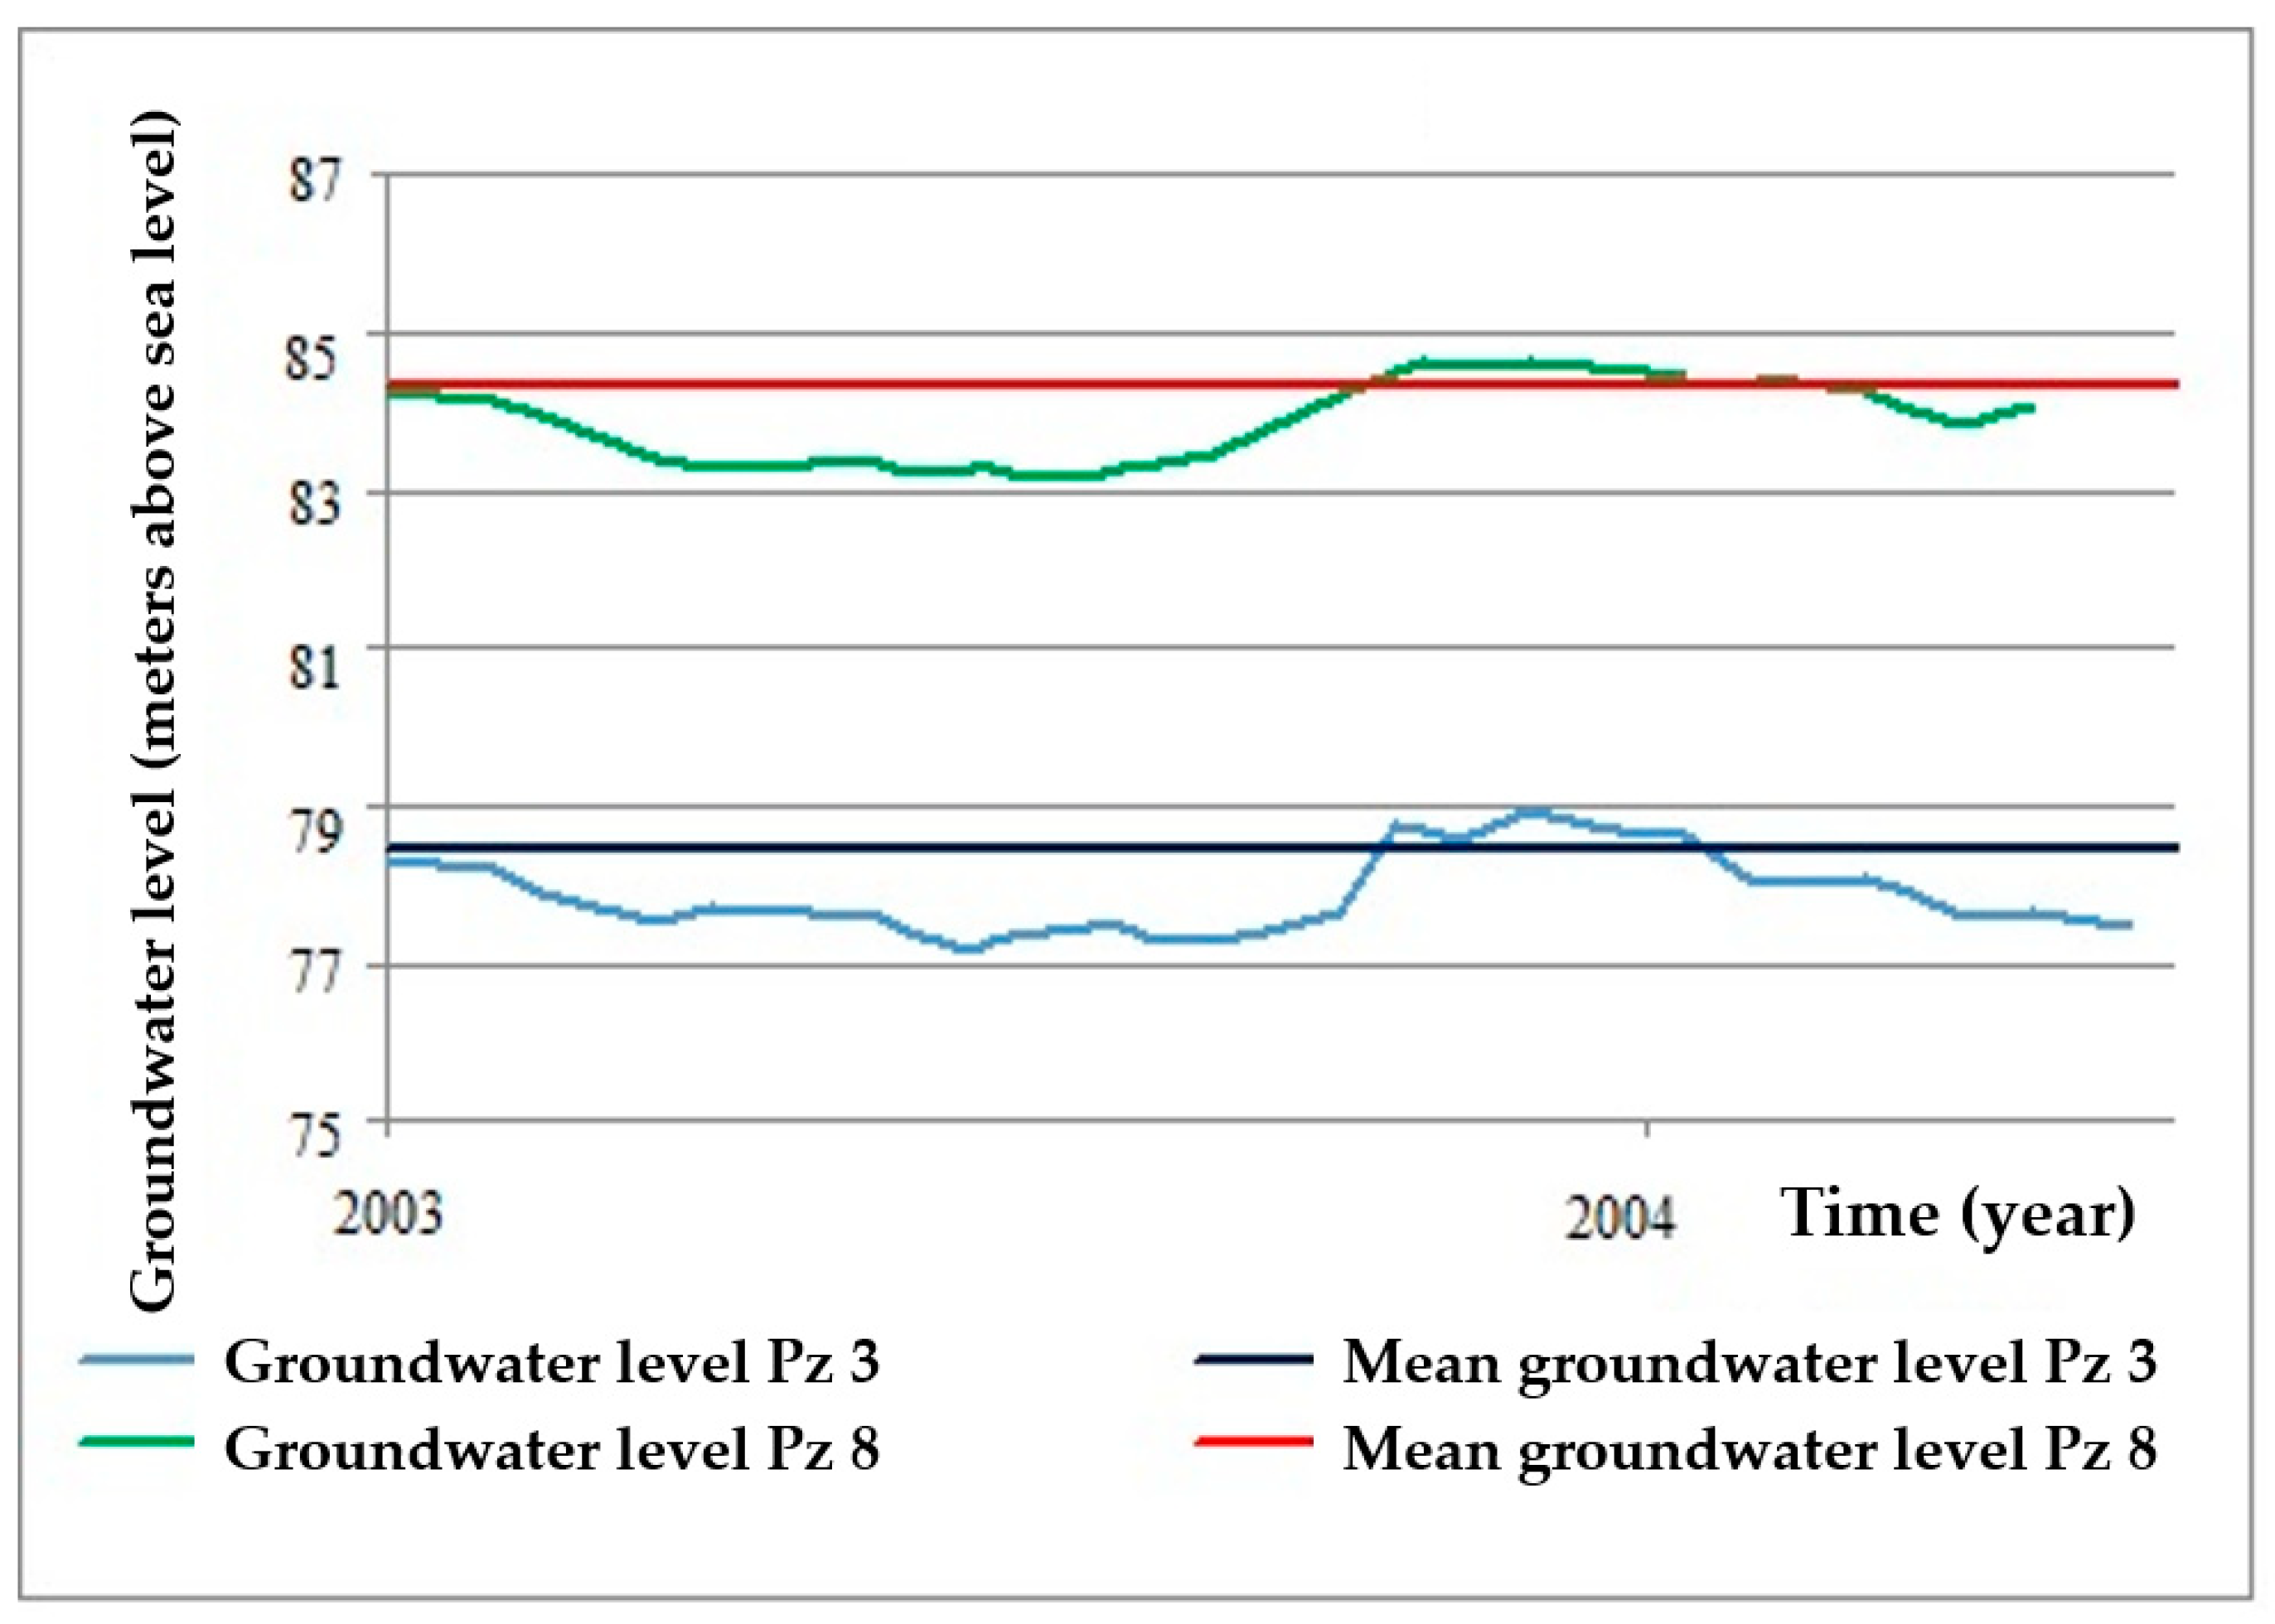
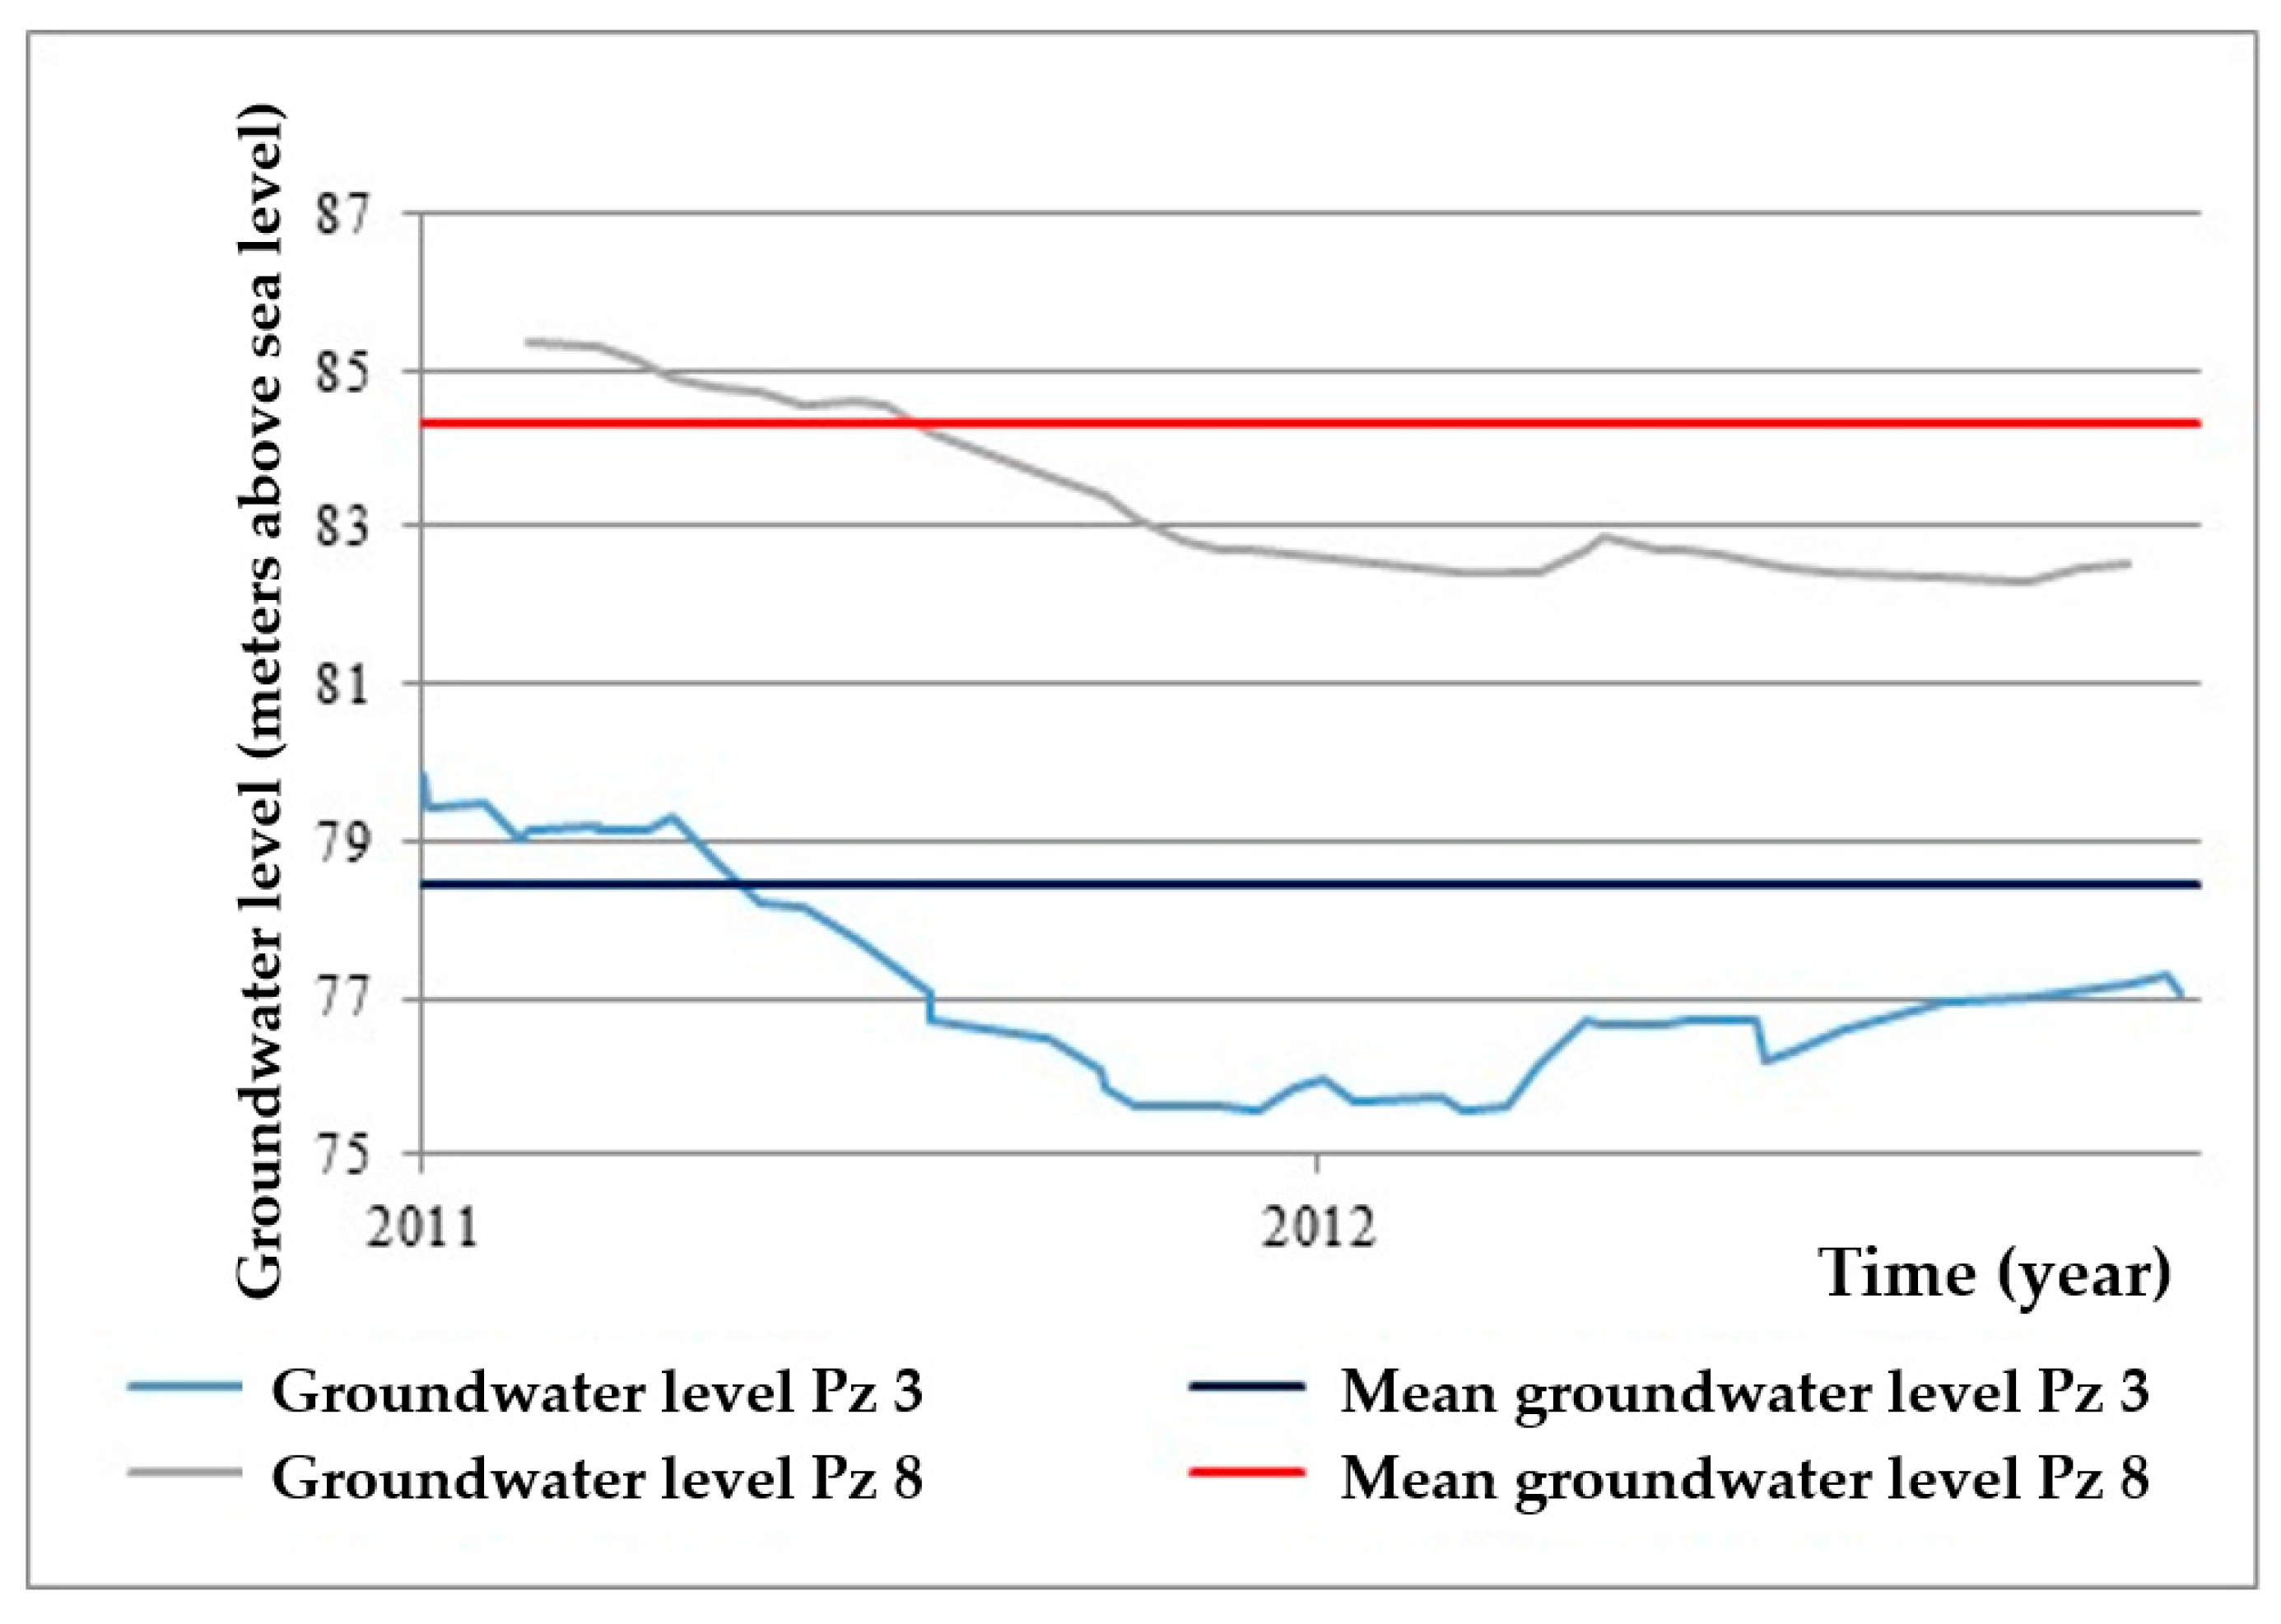
A more pronounced amplitude of lowering groundwater levels in Pz 3 and Pz 8 can be observed in 2000–2001, 2003–2004, and 2011–2012 (Figure 10, Figure 11 and Figure 12), which coincides with the recorded amount of precipitation in 2000, 2003, and 2011. Those years were characterized as extremely deficient in relation to the multi-year average precipitation (Table 2).
Water levels in piezometers Pz 3 and Pz 8 and the most important hydrological parameters show that the system’s response to very pronounced differences in precipitation was manifested in a slight variation in the amplitude of groundwater levels, ranging from 1.46 to 4.32 m in Pz 8 and from 1.8 to 5.84 m in Pz 3. Coefficients of variation of 0.0067 to 0.0174 for Pz 3 and from 0.0063 to 0.0125 for Pz 8 confirm the previous statement (Table 2).
4.3. Groundwater Quality of the Vinogradi Pumping Station, Osijek, Croatia
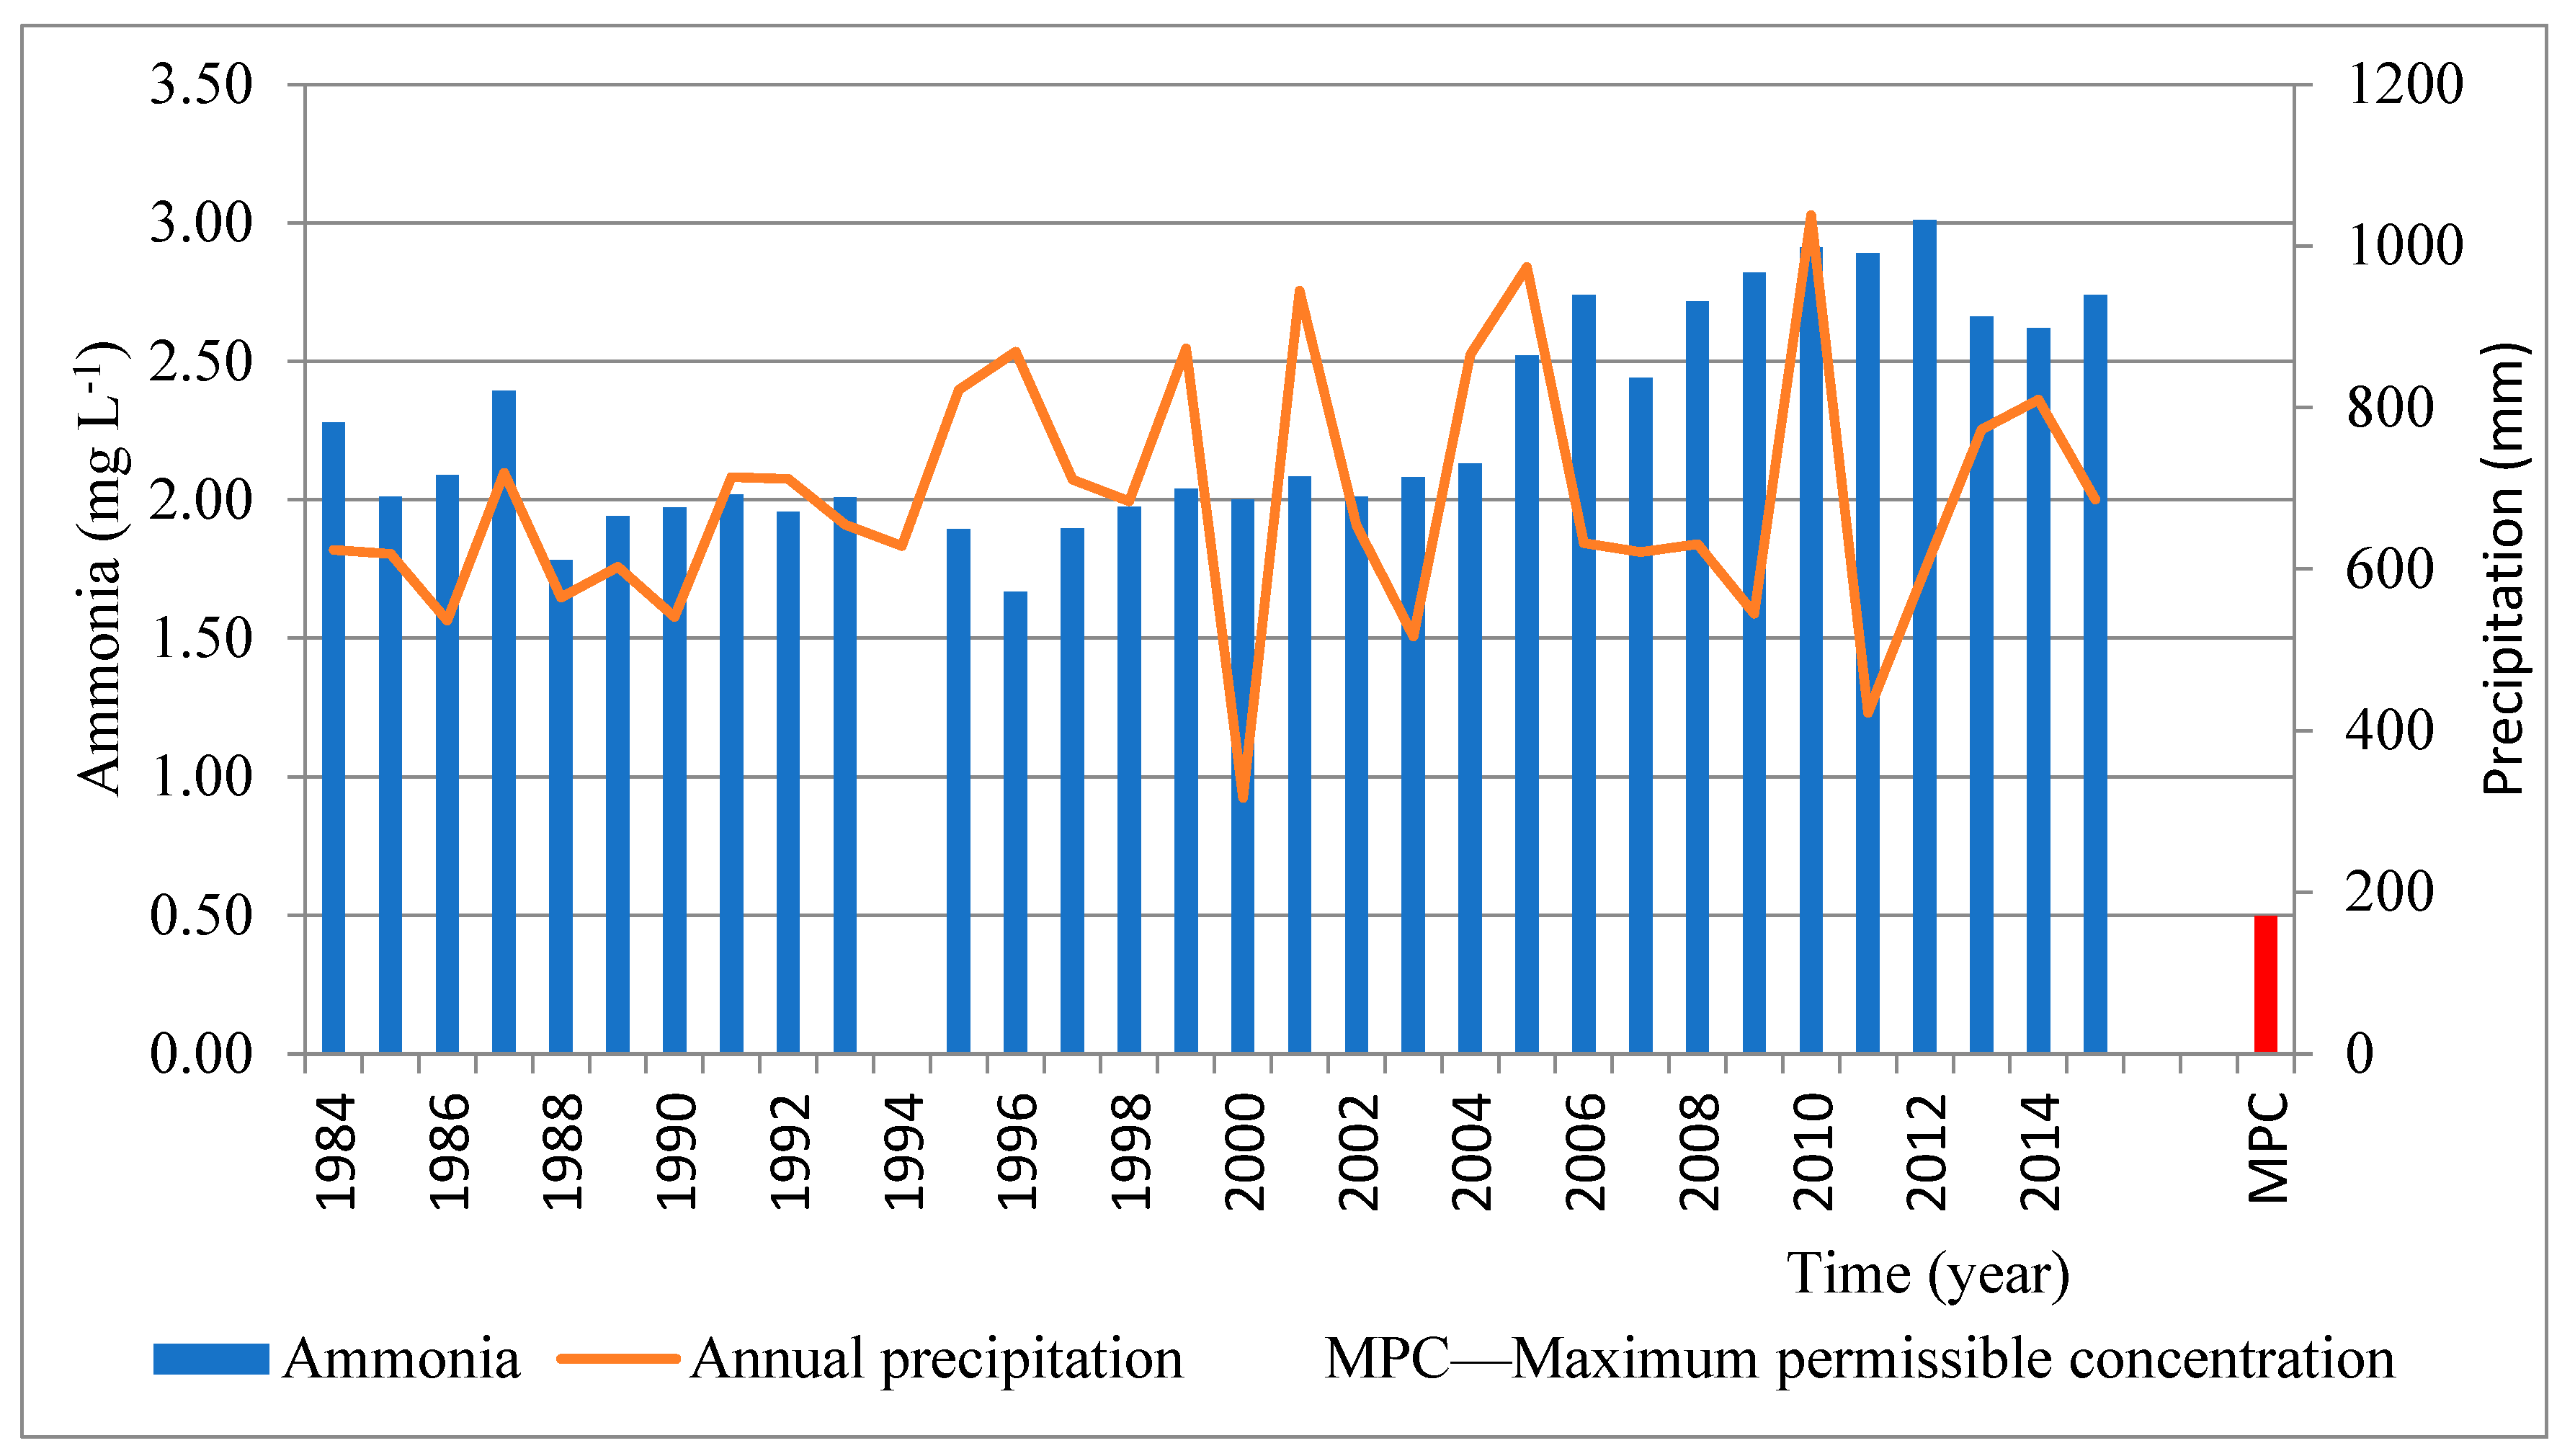
Groundwater samples from wells were analyzed for the concentrations of iron (Fe), manganese (Mn), and ammonia (NH3). Figure 13, Figure 14 and Figure 15 show the concentrations of iron, manganese, and ammonia in groundwater sampled at the wells of the Vinogradi Pumping Station, Osijak, Croatia in the period from 1984 to 2015. Values presented include the averaged annual values of iron, manganese, and ammonia concentrations in raw water (obtained by averaging the values per well for 12 annual samples), the maximum permissible concentration (MPC) according to the current legislation of the Republic of Croatia, and the total annual precipitation.
Analyzing the fluctuations in the concentrations of these elements, it is immediately apparent that their values in natural water were significantly higher than the maximum concentrations permitted by law (Table 3).
Iron concentrations ranged from a minimum of 1.22 mg L−1 to a maximum of 1.63 mg L−1. Sporadic fluctuations in concentration coincide with the “aging” of wells [37]. Manganese concentrations ranged from a minimum of 0.08 mg L−1 to a maximum of 0.20 mg L−1. Figure 11 shows that after the Pumping Station resumed operation in 1994, the concentration stabilized at an average of about 1 mg L−1.
The presence of ammonia was especially striking, with concentrations reaching six times higher than allowed values. There has been a slight increase in concentrations since 2004, stabilizing at an average concentration of 2.5 mg L−1
The general state of natural water chemistry changed little during the period of exploitation of the Vinogradi Pumping Station, Osijak, Croatia. The chemical composition of the groundwater has been stable. This is primarily due to the environment of the layer from which groundwater is pumped and its dominant impact on natural water quality.
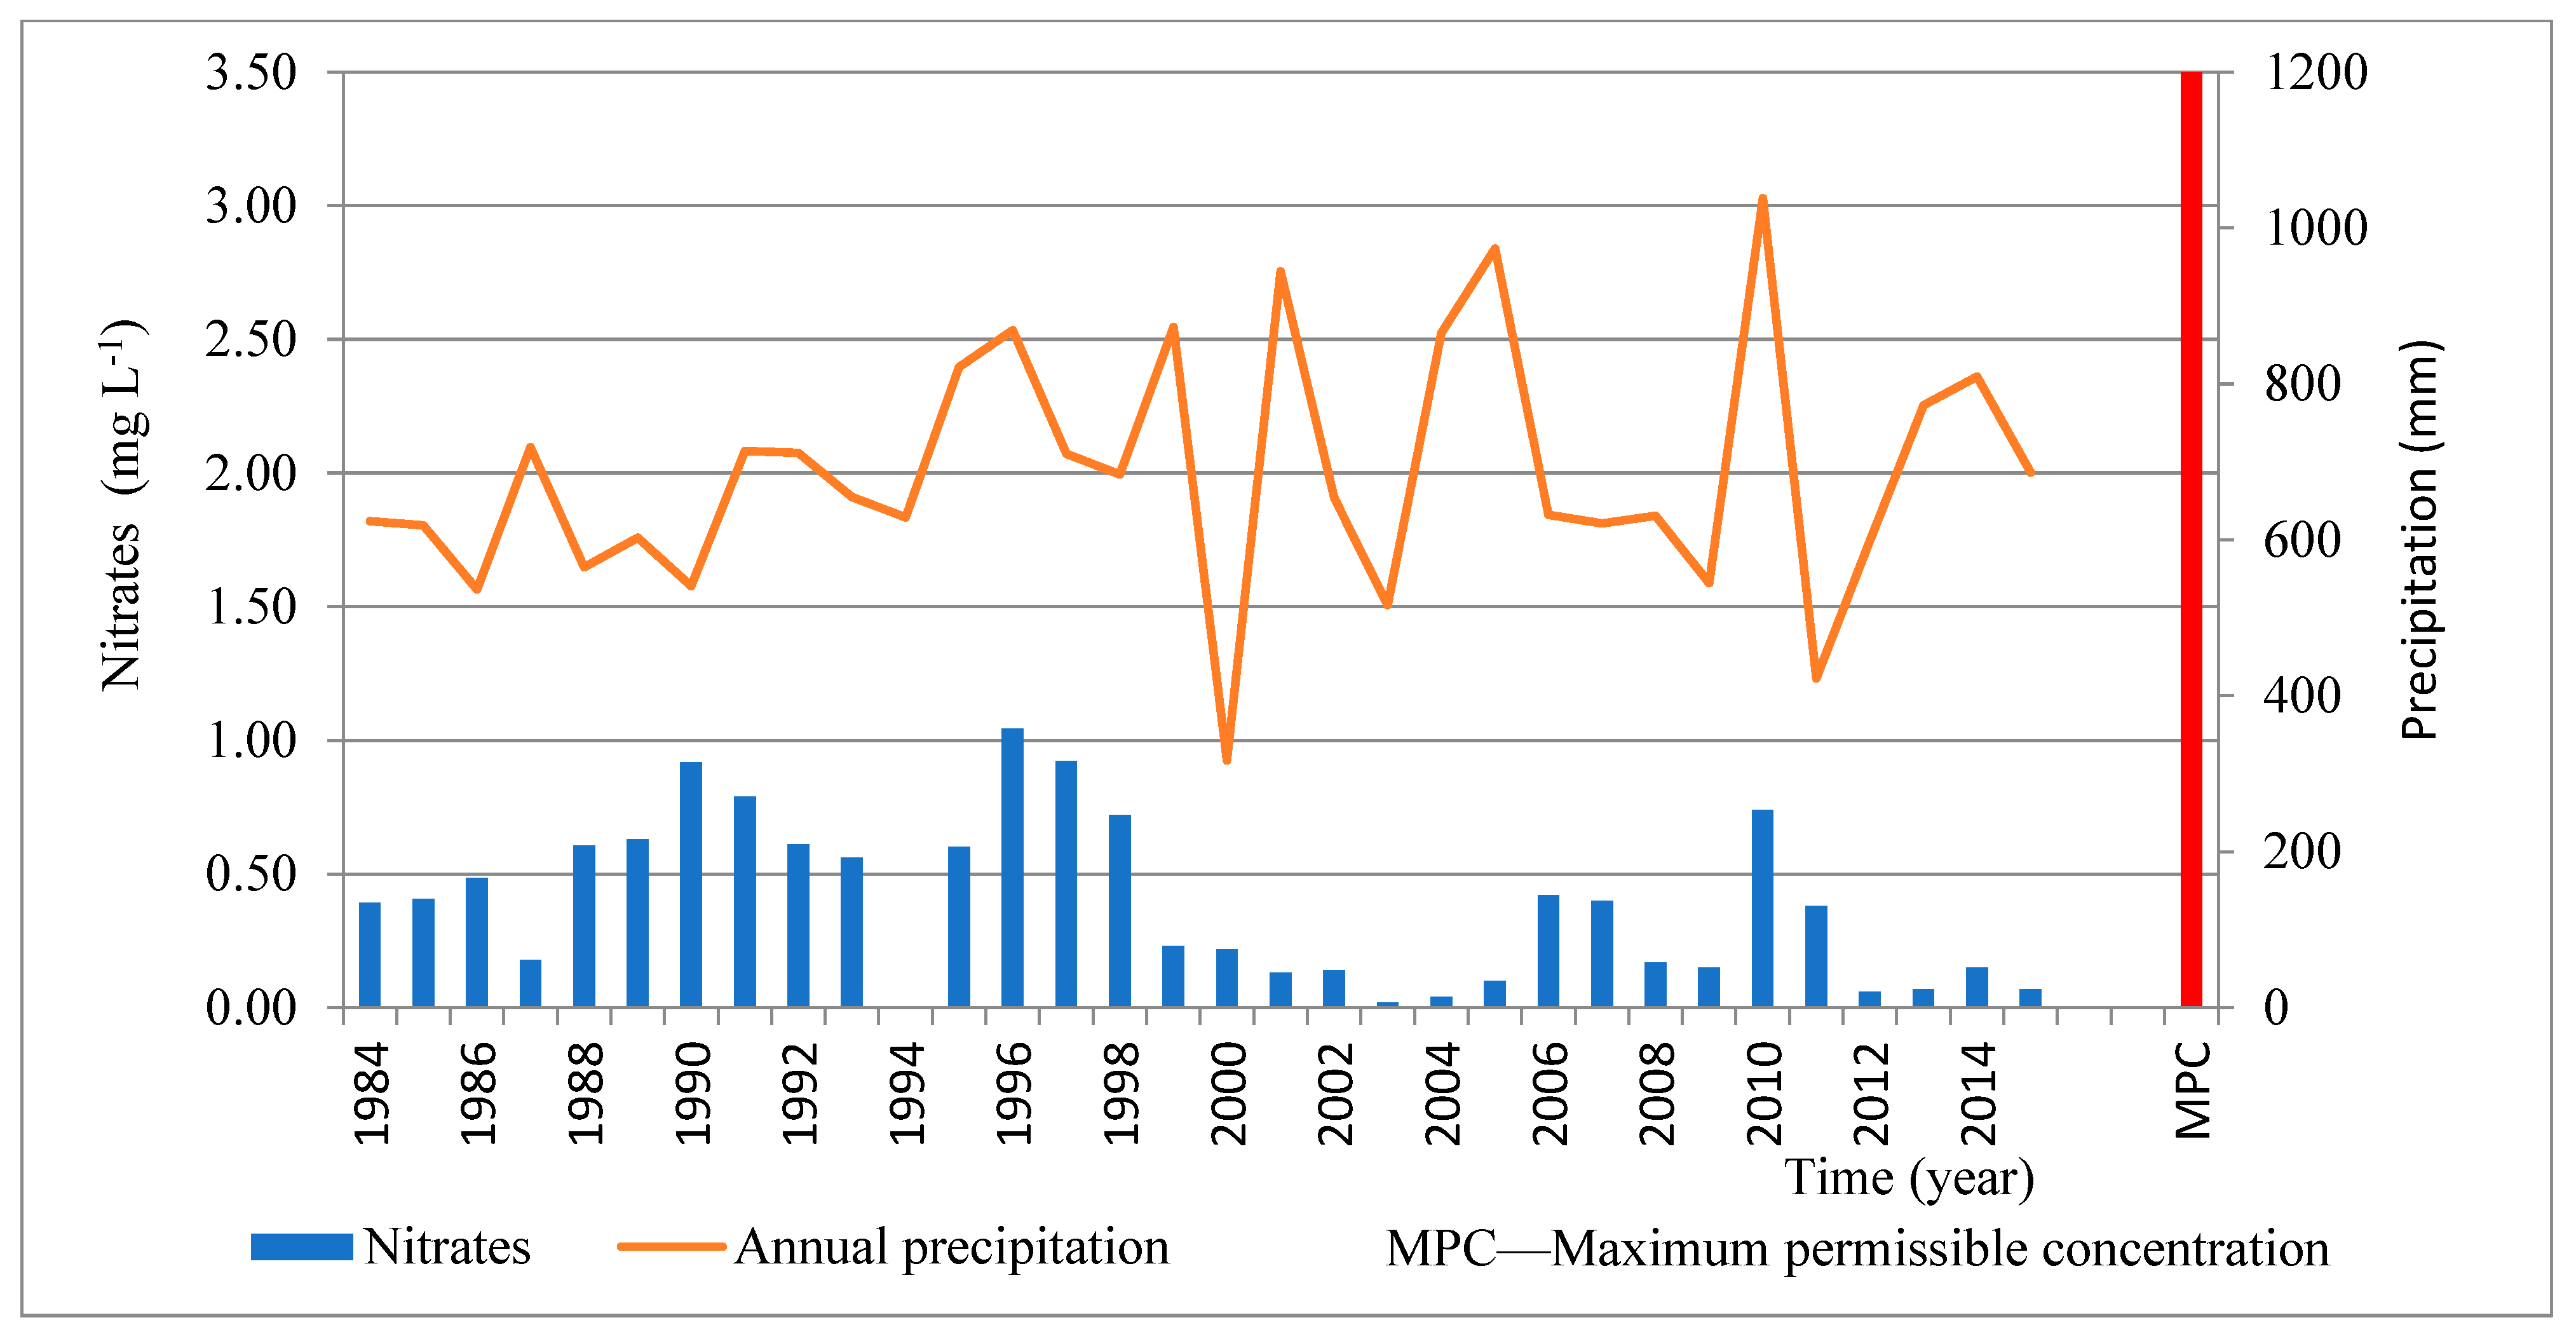
Nitrates are analyzed in groundwater samples from wells. Figure 16 shows the concentration of nitrate in groundwater sampled at the wells of the Vinogradi Pumping Station, Osijek, Croatia in the period from 1984 to 2015. The averaged annual values of ammonia concentrations in raw water (obtained by averaging the values per well for 12 annual samples), the maximum permissible concentration (MPC) according to the current legislation of the Republic of Croatia, and the total annual precipitation are presented.
Nitrate concentrations in the groundwater of the Vinogradi Pumping Station, Osijek, Croatia ranged from 0.02 mg L−1 to 1.04 mg L−1. These concentrations are far below the statutory MPC of 50 mg L−1. The natural quality of groundwater in terms of nitrates is very satisfactory, and favorable natural conditions ensure proper protection against the possible pollution of groundwater with nitrates of agricultural origin.
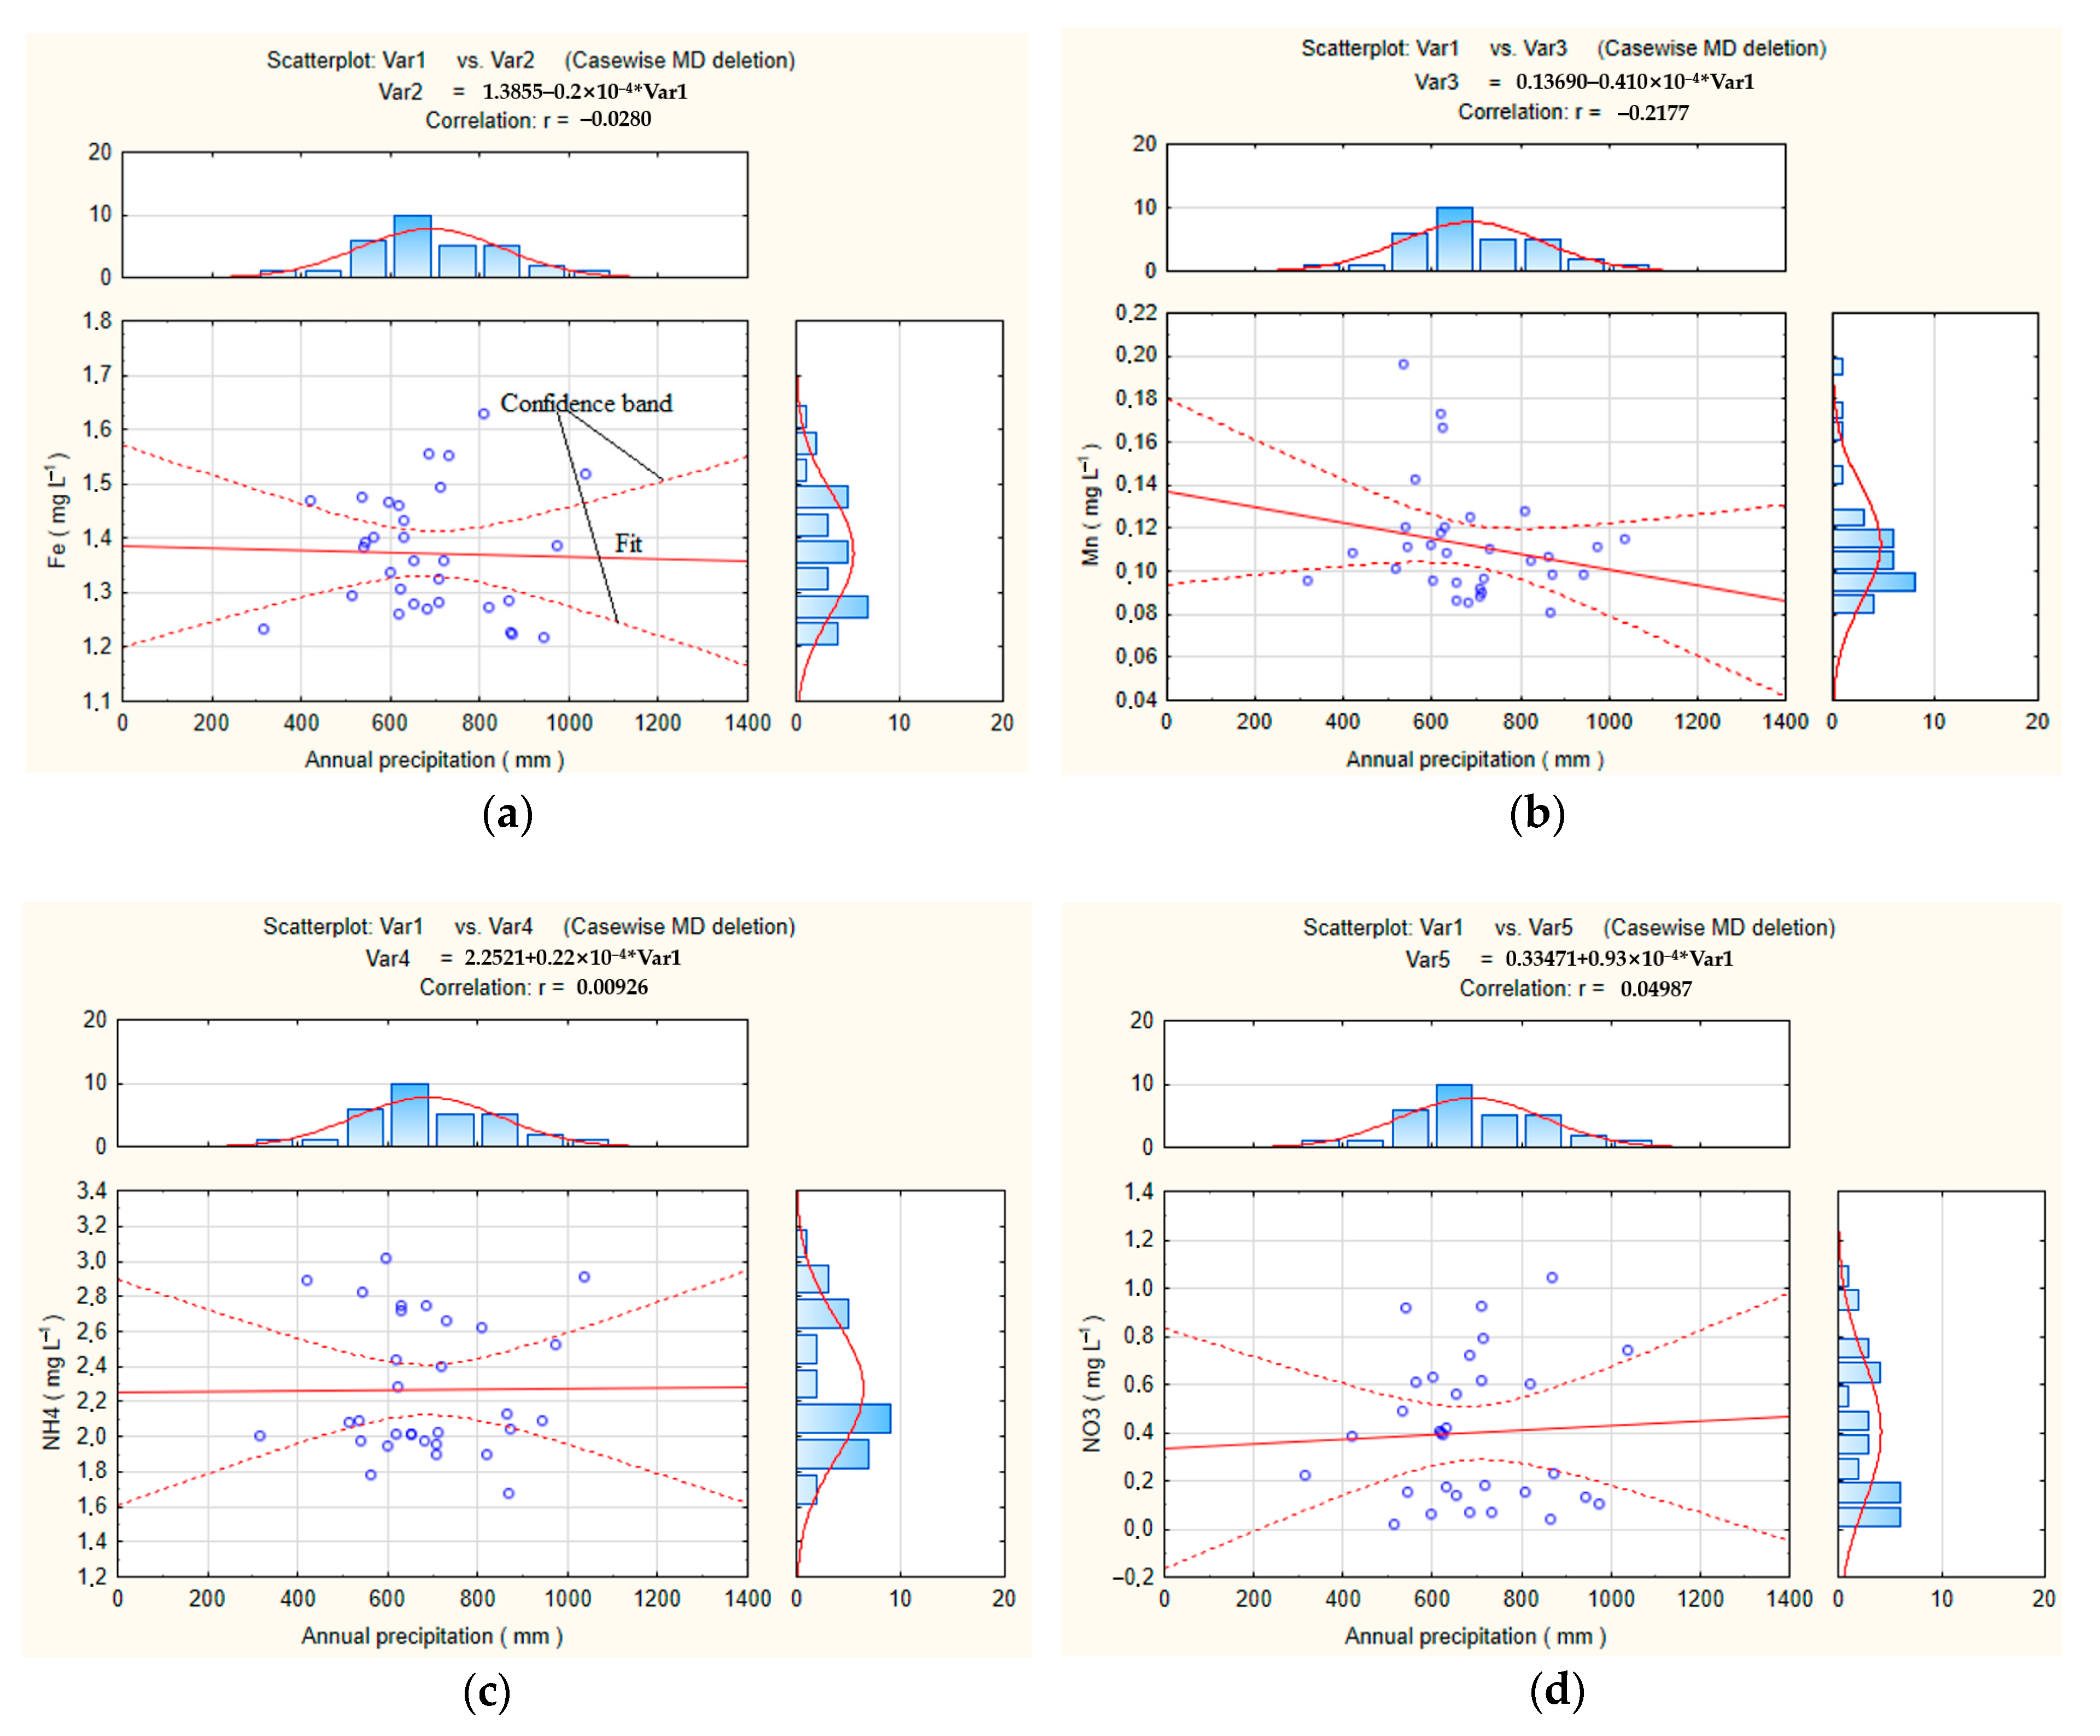
As part of the research, a correlation analysis was performed between the average annual concentrations of iron, manganese, ammonia, and nitrate in groundwater and the annual precipitation in the period from 1984 to 2015. The correlation coefficients (Table 4) point to the conclusion that there is no correlation between pollutant concentration and precipitation amounts (Figure 17a–d).
5. Conclusions
Comparing historical data on precipitation and air temperatures in the period from 1980 to 2015, we determined that this period (36 years) was marked by the occurrence of extremely dry and extremely hot years. Extreme changes in the precipitation regime also took place on various weather scales—from within the month to perennial trends. We also determined that these extremes are becoming more frequent and more intense. The reaction of aquifers and the water supply system was checked for 2000, 2003, and 2011, which stood out as years with a pronounced deficit of precipitation.
The reaction of aquifers to very pronounced differences in precipitation for the observed period was manifested in variations in groundwater levels by a maximum of 4–5 m. Given the total thickness of the affected layers of 60–80 m, this is not a problematic situation from the perspective of water supply.
The results of the analysis of characteristic groundwater quality parameters for the investigated aquifer (iron, manganese, and ammonia) suggest that there was no correlation between short-term changes in parameters and precipitation, further confirming that these elements in water are solely controlled by sedimentation in a reductive environment.
In addition to the quality parameters which are characteristic of the groundwater quality of deep alluvial aquifers, we also evaluated the nitrates. Changes in nitrates compared to the established MPC usually signals pollution by anthropogenic sources (most often as a result of intensive agriculture and over-fertilization with nitrogen-based fertilizers). During the entire period of operation of the Vinogradi Pumping Station, Osijek, Croatia, no significant concentrations of nitrate in groundwater were recorded. The thickness of the cover layer of about 40 m, heterogeneity of the aquifer system, and infiltration period from the surface to the aquifer of more than 90 days are the most important factors controlling groundwater pollution of the Osijek aquifer and changes in its natural water quality.
This research provides evidence that the groundwater of deep alluvial aquifers maintains qualitative and quantitative stability in conditions of extreme climate precipitation, which allows the stability of public water supply in conditions of climate change.
The water quality is unsuitable for direct use in water supply, but the development of technological and technical disciplines has established conditioning procedures that purify water to healthy standards. Due to the stability and minimal variability of raw water quality, the set water conditioning does not need to be adjusted and changed, because constant input parameters give constant output parameters. In terms of groundwater quantities, these aquifers are characterized by high yields that are minimally variable, even in conditions of extreme hydrological phenomena.
The qualitative and quantitative stability of groundwater, and its resistance to natural and anthropogenic influences, support its status as a significant source for public water supply. These characteristics of deep alluvial aquifers give them the character of strategic reserves of the Republic of Croatia.
Author Contributions
Conceptualization, M.Š. and J.Z.; methodology, M.Š. and J.Z.; formal analysis, M.Š. and J.Z.; resources, J.Z.; data curation, M.Š. and J.Z.; writing—original draft preparation, M.Š.; writing—review and editing, M.Š. and J.Z. All authors have read and agreed to the published version of the manuscript.
Funding
This research received no external funding.
Institutional Review Board Statement
Not applicable.
Informed Consent Statement
Not applicable.
Data Availability Statement
Data are available on demand from corresponding author.
Conflicts of Interest
The authors declare no conflict of interest.
References
- World Health Organization. Guidelines for Drinking-Water Quality, 4th ed.; World Health Organization: Geneva, Switzerland, 2011; Available online: https://apps.who.int/iris/handle/10665/44584 (accessed on 5 July 2019).
- Christensen, O.; Christensen, J. Intensification of extreme European summer precipitation in a warmer climate. Glob. Planet. Chang. 2004, 44, 107–117. [Google Scholar] [CrossRef]
- Kundzewicz, Z.; Radziejewski, M.; Pińskwar, I. Precipitation extremes in the changing climate of Europe. Clim. Res. 2006, 31, 51–58. [Google Scholar] [CrossRef]
- Frei, C.; Schöll, R.; Fukutome, S.; Schmidli, J.; Vidale, P.L. Future change of precipitation extremes in Europe: Intercomparison of scenarios from regional climate models. J. Geophys. Res. Earth Surf. 2006, 111. [Google Scholar] [CrossRef] [Green Version]
- Singh, V.P.; Mishra, A.K.; Chowdhary, H.; Khedun, C.P. Climate Change and Its Impact on Water Resources. In Modern Water Resources Engineering; Springer: Berlin, Germany, 2013; Volume 15, pp. 525–569. [Google Scholar] [CrossRef]
- Walther, G.-R. Community and ecosystem responses to recent climate change. Philos. Trans. R. Soc. B Biol. Sci. 2010, 365, 2019–2024. [Google Scholar] [CrossRef] [PubMed]
- Lenoir, J.; Hattab, T.; Pierre, G. Climatic microrefugia under anthropogenic climate change: Implications for species redistribution. Ecography 2016, 40, 253–266. [Google Scholar] [CrossRef]
- Adedeji, O.; Reuben, O.; Olatoye, O. Global Climate Change. J. Geosci. Environ. Prot. 2014, 2, 114–122. [Google Scholar] [CrossRef]
- Yousefi, H.; Omidi, M.J.; Moridi, A.; Sarang, A. Groundwater Monitoring Network Design Using Optimized DRASTIC Method and Capture Zone Analysis. Int. J. Environ. Res. 2021, 15, 807–817. [Google Scholar] [CrossRef]
- Rezaei, M.; Mousavi, S.-F.; Moridi, A.; Gordji, M.E.; Karami, H. A new hybrid framework based on integration of optimization algorithms and numerical method for estimating monthly groundwater level. Arab. J. Geosci. 2021, 14, 994. [Google Scholar] [CrossRef]
- Ahani, A.; Nadoushani, S.S.M.; Moridi, A. Regionalization of watersheds based on the concept of rough set. Nat. Hazards 2020, 104, 883–899. [Google Scholar] [CrossRef]
- Döll, P.; Zhang, J. Impact of climate change on freshwater ecosystems: A global-scale analysis of ecologically relevant river flow alterations. Hydrol. Earth Syst. Sci. 2010, 14, 783–799. [Google Scholar] [CrossRef] [Green Version]
- Rezaei, M.; Mousavi, S.-F.; Moridi, A.; Eshaghi, M.; Karami, H. An Optimal Socialist Cooperative Game Theory Model in Agricultural Sector (Case Study: Dezful-Andimeshk Plain). Int. J. Nonlinear Anal. Appl. 2021, 12, 12719–12731. [Google Scholar]
- Malmir, M.; Javadi, S.; Moridi, A.; Neshat, A.; Razdar, B. A new combined framework for sustainable development using the DPSIR approach and numerical modeling. Geosci. Front. 2021, 12, 101169. [Google Scholar] [CrossRef]
- Kundzewicz, Z.; Mata, L.J.; Arnell, N.W.; Döll, P.; Jimenez, B.; Miller, K.; Oki, T.; Şen, Z.; Shiklomanov, I. The implications of projected climate change for freshwater resources and their management. Hydrol. Sci. J. 2008, 53, 3–10. [Google Scholar] [CrossRef]
- Woodward, G.; Perkins, D.; Brown, L. Climate change and freshwater ecosystems: Impacts across multiple levels of organization. Philos. Trans. R. Soc. B Biol. Sci. 2010, 365, 2093–2106. [Google Scholar] [CrossRef] [PubMed] [Green Version]
- Whitehead, P.G.; Wilby, R.L.; Battarbee, R.W.; Kernan, M.; Wade, A.J. A review of the potential impacts of climate change on surface water quality. Hydrol. Sci. J. 2009, 54, 101–123. [Google Scholar] [CrossRef]
- Delpla, I.; Jung, A.-V.; Baures, E.; Clement, M.; Thomas, O. Impacts of climate change on surface water quality in relation to drinking water production. Environ. Int. 2009, 35, 1225–1233. [Google Scholar] [CrossRef] [PubMed]
- Mujere, N.; Moyce, W. Climate Change Impacts on Surface Water Quality. In Environmental Sustainability and Climate Change Adaptation Strategies; IGI Global Book: Hershey, PA, USA, 2017; pp. 97–115. [Google Scholar] [CrossRef]
- Marchane, A.; Tramblay, Y.; Hanich, L.; Ruelland, D.; Jarlan, L. Climate change impacts on surface water resources in the Rheraya catchment (High Atlas, Morocco). Hydrol. Sci. J. 2017, 62, 979–995. [Google Scholar] [CrossRef]
- Green, T.R. Linking climate change and groundwater. In Integrated Groundwater Management; Springer: Cham, Switzerland, 2016; pp. 97–141. [Google Scholar]
- Gurdak, J.S.; Hanson, R.T.; Green, T.R. Effects of climate variability and change on groundwater resources of the United States. In Fact Sheet; US Geological Survey: Reston, VA, USA, 2009. [Google Scholar] [CrossRef]
- Tanaka, S.K.; Zhu, T.; Lund, J.R.; Howitt, R.E.; Jenkins, M.W.; Pulido, M.A.; Tauber, M.; Ritzema, R.S.; Ferreira, I.C. Climate Warming and Water Management Adaptation for California. Clim. Chang. 2006, 76, 361–387. [Google Scholar] [CrossRef]
- Iglesias, A.; Garrote, L.; Flores, F.; Moneo, M. Challenges to Manage the Risk of Water Scarcity and Climate Change in the Mediterranean. Water Resour. Manag. 2006, 21, 775–788. [Google Scholar] [CrossRef]
- Ojo, O.; Oni, F.; Ogunkunle, O. Implications of climate variability and climate change on water resources availability and water resources management in West Africa. In Water Resources Systems—Water Availability and Global Change; Franks, S., Bloschl, S., Kumagai, M., Musiake, K., Rosbjerg, D., Eds.; International Association of Hydrological Sciences: Wallingford, UK, 2003; pp. 37–47. [Google Scholar]
- Holman, I.P. Climate change impacts on groundwater recharge-uncertainty, shortcomings, and the way forward? Appl. Hydrogeol. 2005, 14, 637–647. [Google Scholar] [CrossRef] [Green Version]
- Afshar, M.H.; Şorman, A.; Tosunoğlu, F.; Bulut, B.; Yilmaz, M.T.; Mehr, A.D. Climate change impact assessment on mild and extreme drought events using copulas over Ankara, Turkey. Theor. Appl. Clim. 2020, 141, 1045–1055. [Google Scholar] [CrossRef]
- Ducci, D.; de Melo, M.T.C.; Preziosi, E.; Sellerino, M.; Parrone, D.; Ribeiro, L. Combining natural background levels (NBLs) assessment with indicator kriging analysis to improve groundwater quality data interpretation and management. Sci. Total. Environ. 2016, 569–570, 569–584. [Google Scholar] [CrossRef]
- Rimi, R.H.; Rahman, S.H.; Abedin, M.Z. Recent climate change trend analysis and future prediction at Satkhira District, Bangladesh. IOP Conf. Ser. Earth Environ. Sci. 2009, 6, 472014. [Google Scholar] [CrossRef]
- Ilori, O.W.; Ajayi, V.O. Change Detection and Trend Analysis of Future Temperature and Rainfall over West Africa. Earth Syst. Environ. 2020, 4, 493–512. [Google Scholar] [CrossRef]
- Mahmood, R.; Jia, S.; Zhu, W. Analysis of climate variability, trends, and prediction in the most active parts of the Lake Chad basin, Africa. Sci. Rep. 2019, 9, 6317. [Google Scholar] [CrossRef] [PubMed] [Green Version]
- Semenov, M.A. Development of high-resolution UKCIP02-based climate change scenarios in the UK. Agric. For. Meteorol. 2007, 144, 127–138. [Google Scholar] [CrossRef]
- MacLean, I.M.D. Predicting future climate at high spatial and temporal resolution. Glob. Chang. Biol. 2019, 26, 1003–1011. [Google Scholar] [CrossRef] [PubMed] [Green Version]
- Caballero, Y.; Voirin-Morel, S.; Habets, F.; Noilhan, J.; Lemoigne, P.; Lehenaff, A.; Boone, A. Hydrological sensitivity of the Adour-Garonne river basin to climate change. Water Resour. Res. 2007, 43. [Google Scholar] [CrossRef] [Green Version]
- Jyrkama, M.I.; Sykes, J.F. The impact of climate change on spatially varying groundwater recharge in the grand river watershed (Ontario). J. Hydrol. 2007, 338, 237–250. [Google Scholar] [CrossRef]
- Didovets, I.; Krysanova, V.; Bürger, G.; Snizhko, S.; Balabukh, V.; Bronstert, A. Climate change impact on regional floods in the Carpathian region. J. Hydrol. Reg. Stud. 2019, 22, 100590. [Google Scholar] [CrossRef]
- Şen, Z.; Al Alsheikh, A.; Al-Turbak, A.S.; Al-Bassam, A.M.; Al-Dakheel, A.M. Climate change impact and runoff harvesting in arid regions. Arab. J. Geosci. 2011, 6, 287–295. [Google Scholar] [CrossRef]
- Bürger, G.; Heistermann, M.; Bronstert, A. Towards Subdaily Rainfall Disaggregation via Clausius–Clapeyron. J. Hydrometeorol. 2014, 15, 1303–1311. [Google Scholar] [CrossRef]
- Croatian Water Management Strategy/Strategija upravljanja vodama, Hrvatske vode. 2009. Available online: https://www.voda.hr/hr/strategija-upravljanja-vodama (accessed on 15 June 2019).
- Zima, J. The Effect of Climate Changes on the Ground Water Status of Deep Alluvial Aguifers in Function of Ensuring the Public Water Supply Reability. Ph.D. Thesis, Faculty of Civil Engineering Osijek, Strossmayer University of Osijek, Osijek, Croatia, July 2019. [Google Scholar]
- Taylor, C.J.; Alley, W.M. Ground-Water-Level Monitoring and the Importance of Long-Term Water-Level Data; US Geological Survey: Denver, CO, USA, 2001. [Google Scholar] [CrossRef]
Figure 1.
Study area: Europa—Croatia-Osijek (45°33′ N 18°41′ E/45.55° N 18.68° E—geographic coordinates Osijek, Croatia).
Figure 1.
Study area: Europa—Croatia-Osijek (45°33′ N 18°41′ E/45.55° N 18.68° E—geographic coordinates Osijek, Croatia).

Figure 2.
Profile of Quaternary deposits affected by wells of Vinogradi Pumping Station.

Figure 3.
Total pumping quantities of water from 1984 to 2015.

Figure 4.
Photograph of the Vinogradi Pumping Station, Osijek, Croatia (Fund of documents of the company “Vodovod Osijek, Osijek, Croatia” 2000).
Figure 4.
Photograph of the Vinogradi Pumping Station, Osijek, Croatia (Fund of documents of the company “Vodovod Osijek, Osijek, Croatia” 2000).

Figure 5.
Annual precipitation for Osijek, Croatia for the period 1980–2015.

Figure 6.
Climate diagram for Osijek, Croatia for the year 2000.

Figure 7.
Climate diagram for Osijek, Croatia for the year 2003.

Figure 8.
Climate diagram for Osijek, Croatia for the year 2011.

Figure 9.
(a) Fluctuation of groundwater levels in Pz 3 in the period 1997–2015; (b) fluctuation of groundwater levels in Pz 8 in the period 1997–2015.
Figure 9.
(a) Fluctuation of groundwater levels in Pz 3 in the period 1997–2015; (b) fluctuation of groundwater levels in Pz 8 in the period 1997–2015.

Figure 10.
Fluctuations of groundwater levels Pz 3 and Pz 8 during 2000 and 2001.

Figure 11.
Fluctuations of groundwater levels at Pz 3 and Pz 8 during 2003 and 2004.

Figure 12.
Fluctuations of groundwater levels Pz 3 and Pz 8 during 2011 and 2012.

Figure 13.
Concentrations of iron in groundwater sampled at the Vinogradi pumping station, Osijek, Croatia in the period 1984–2015.
Figure 13.
Concentrations of iron in groundwater sampled at the Vinogradi pumping station, Osijek, Croatia in the period 1984–2015.

Figure 14.
Manganese concentrations in groundwater sampled at the Vinogradi Pumping Station, Osijek, Croatia in the period 1984–2015.
Figure 14.
Manganese concentrations in groundwater sampled at the Vinogradi Pumping Station, Osijek, Croatia in the period 1984–2015.

Figure 15.
Concentrations of ammonia in groundwater sampled at the Vinogradi pumping station, Osijek, Croatia in the period 1984–2015.
Figure 15.
Concentrations of ammonia in groundwater sampled at the Vinogradi pumping station, Osijek, Croatia in the period 1984–2015.

Figure 16.
Nitrate concentrations in groundwater sampled at the Vinogradi Pumping Station, Osijek, Croatia in the period 1984–2015.
Figure 16.
Nitrate concentrations in groundwater sampled at the Vinogradi Pumping Station, Osijek, Croatia in the period 1984–2015.

Figure 17.
Correlation of annual precipitation and concentration of (a) iron; (b) manganese; (c) ammonia; and (d) nitrate in groundwater in the period 1984–2015.
Figure 17.
Correlation of annual precipitation and concentration of (a) iron; (b) manganese; (c) ammonia; and (d) nitrate in groundwater in the period 1984–2015.


Table 1.
Deviation of annual precipitation and air temperature in 2000, 2003, and 2011.
| Year | Deviation Annual Precipitation | Deviation Annual Temperature |
|---|---|---|
| 2000 | extremely dry | extremely warm |
| 2003 | very dry | warm |
| 2011 | extremely dry | very warm |
Table 2.
Comparison of hydrological parameters for Pz 3 and Pz 8 in the years 2000–2001, 2003–2004, 2011–2012, and the period 1997–2015.
Table 2.
Comparison of hydrological parameters for Pz 3 and Pz 8 in the years 2000–2001, 2003–2004, 2011–2012, and the period 1997–2015.
| 2000–2001 | 2003–2004 | 2011–2012 | 1997–2015 | |||||
|---|---|---|---|---|---|---|---|---|
| Pz 3 | Pz 8 | Pz 3 | Pz 8 | Pz 3 | Pz 8 | Pz 3 | Pz 8 | |
| Minimum level (meters above sea level) | 75.37 | 83.51 | 77.16 | 83.18 | 75.57 | 82.32 | 75.37 | 82.32 |
| Maximum level (meters above sea level) | 80.63 | 85.92 | 78.96 | 84.64 | 79.81 | 85.34 | 81.21 | 86.64 |
| Difference max and min level (m) | 5.26 | 2.41 | 1.80 | 1.46 | 4.24 | 3.02 | 5.84 | 4.32 |
| Arithmetic mean of sequence 97–15 (meters above sea level) | 78.36 | 84.30 | 78.36 | 84.30 | 78.36 | 84.30 | 78.36 | 84.30 |
| Standard deviation (m) | 1.162 | 0.673 | 0.528 | 0.528 | 1.362 | 1.049 | 1.019 | 0.868 |
| Coefficient of variation | 0.014 | 0.008 | 0.006 | 0.006 | 0.017 | 0.012 | 0.013 | 0.010 |
Table 3.
Concentrations of Fe, Mn, NH4, and NO3 in the period 1984–2015.
| Fe (mg L−1) | Mn (mg L−1) | NH4 (mg L−1) | NO3 (mg L−1) | |
|---|---|---|---|---|
| MPC | 0.2 | 0.05 | 0.5 | 50 |
| Min | 1.22 | 0.08 | 1.67 | 0.02 |
| Max | 1.63 | 0.20 | 3.01 | 1.04 |
Table 4.
Correlation coefficients between average annual concentrations of iron, manganese, ammonium, and nitrate in groundwater and the amount of annual precipitation in the period 1984–2015.
Table 4.
Correlation coefficients between average annual concentrations of iron, manganese, ammonium, and nitrate in groundwater and the amount of annual precipitation in the period 1984–2015.
| Fe (mg L−1) | Mn (mg L−1) | NH4 (mg L−1) | NO3 (mg L−1) | |
|---|---|---|---|---|
| Precipitation (mm) | −0.027962 | −0.2177654 | 0.009258 | 0.04986 |
Publisher’s Note: MDPI stays neutral with regard to jurisdictional claims in published maps and institutional affiliations. |
© 2022 by the authors. Licensee MDPI, Basel, Switzerland. This article is an open access article distributed under the terms and conditions of the Creative Commons Attribution (CC BY) license (https://creativecommons.org/licenses/by/4.0/).
Share and Cite
MDPI and ACS Style
Šperac, M.; Zima, J. Assessment of the Impact of Climate Extremes on the Groundwater of Eastern Croatia. Water 2022, 14, 254. https://doi.org/10.3390/w14020254
AMA Style
Šperac M, Zima J. Assessment of the Impact of Climate Extremes on the Groundwater of Eastern Croatia. Water. 2022; 14(2):254. https://doi.org/10.3390/w14020254
Chicago/Turabian StyleŠperac, Marija, and Jasna Zima. 2022. "Assessment of the Impact of Climate Extremes on the Groundwater of Eastern Croatia" Water 14, no. 2: 254. https://doi.org/10.3390/w14020254
Note that from the first issue of 2016, this journal uses article numbers instead of page numbers. See further details here.