
Groundwater Nitrate Pollution Sources Assessment for Contaminated Wellfield


1
Center for Advanced Computing and Modelling, University of Rijeka, Radmile Matejcic 2, 51000 Rijeka, Croatia
2
Faculty of Engineering, University of Rijeka, Vukovarska 58, 51000 Rijeka, Croatia
3
Faculty of Geotechnical Engineering, University of Zagreb, Hallerova aleja 7, 42000 Varaždin, Croatia
*
Author to whom correspondence should be addressed.
Water 2022, 14(2), 255; https://doi.org/10.3390/w14020255
Submission received: 14 December 2021
/
Revised: 7 January 2022
/
Accepted: 13 January 2022
/
Published: 16 January 2022
(This article belongs to the Special Issue Groundwater Vulnerability to Pollution Assessment)
Abstract
:Nitrates are one of the most common groundwater contaminants and they come from different sources. The paper presents a study of groundwater quality at Varaždin wellfield in the north part of Croatia. The nitrate concentration at this location has been above the maximum allowed concentration for several decades, which has made the opening of new wellfields costly. Based on the previously developed groundwater flow model, a model that covers the narrow area of the wellfield is developed. The influential zone of the observed wellfield in working conditions is determined. Based on the developed model, the sources of nitrate pollution are located, which can be generally divided into non-point and point sources. Considering the time of groundwater retention in the horizontal flow, it is concluded that the water protection zones are marked following the applicable ordinance. Based on the developed groundwater flow model at the observed wellfield, a simulation of nitrate pollution propagation by advection and dispersion processes is performed. The simulation results point out the location of the poultry landfill as the largest source of nitrate pollution. However, poultry farms, which are located in the influence area of the wellfield, also contribute significantly to the nitrate concentration at the wellfield.
1. Introduction
Quality water supply is one of the necessary preconditions for sustainable development, but in the last few decades, due to more frequent and intensive anthropogenic sources, negative impacts on water supply systems have occurred. On the one hand, there is a constant increase in the need for quality water, and on the other hand, due to the increased emission of harmful substances into the environment, the degradation of groundwater quality is almost inevitable. With the growth of the human population and the increase in the quality of life, the need for drinking water has been also growing, so it was estimated that global water consumption has been increased seven times since the beginning of the 20th century [1]. This leads to the opening of new wellfields or increasing the pumping rate of the existing ones. For sustainable development and further improvement of the quality of life, the protection of groundwater as the main source of drinking water should be one of the main global priorities.
Agricultural production is recognized worldwide as one of the main sources of groundwater pollution; primarily because nitrates are an important component of mineral fertilizers. Several studies have shown that the application of fertilizers and pesticides in agriculture significantly increases nitrate concentrations in surface and groundwater [2,3,4,5]. In order to increase agricultural areas and to improve conditions for food production, different amelioration measures are applied, which significantly contribute to the degradation of groundwater quality [6,7,8]. Namely, every lowland catchment presents a sensitive eco-system with a slow flow and a high level of groundwater [9,10]. Such hydrogeological conditions enable pollutants to penetrate easily from surface to subsoil, where they can stay for a long period of time. This violates the natural balance between water and nutrients [11] and increases nitrate concentrations in surface and groundwater [12]. Additionally, the results of numerous studies show that the maximum allowable concentration (MAC) is often exceeded [13,14,15].
In order to protect water resources and to mitigate negative consequences of nitrate pollution resulting from agricultural practices, the European Union has adopted certain measures in the Nitrate Directive document [16]. As a full EU member, the Republic of Croatia is obligated to follow its directions, such as those regarding the protection of its rich water resources [17,18]. In Croatia and the EU, the maximum allowable nitrate concentration (MAC NO3−) in water for human consumption is 50 mg/L NO3− [19,20].
Numerical models of groundwater flow are now common techniques used for water resource management and they present a simplified version of the real system and the processes that take place within it [21,22]. The models define groundwater levels and groundwater retention time. Numerical models of pollution propagation, which are an upgrade to the numerical model of groundwater flow, are also common techniques today for the purpose of estimating the pollution propagation and searching for their sources. Lee et al. [23] used groundwater modeling to identify the source and transport path of pollution that was caused by inorganic matter and artificial sweeteners in the groundwater of an agricultural area in Korea. Wang et al. [24] conducted a comprehensive evaluation model of ammonia pollution trends in a groundwater source area along a river in residential areas. The simulation results show that the ammonia pollution plume over time mainly affecting the groundwater quality. These methods are also used as tools to improve the accuracy of recognizing zones susceptible to water pollution in agriculturally rich valley of a lowland river [25]. Additionally, a recent research by numerical methods shows how land use and farming practices may affect groundwater quality [26].
The obtained data from numerical modeling are also used to assess the risk of contamination of drinking water sources, to determine the priorities of remediation works, and to optimally define water protection zones in order to preserve or even improve the quality of groundwater at wellfields. Additionally, sources of pollution can be successfully determined using numerical methods. Recent research shows that cesspits and sewer networks can be major sources of nitrate pollution, and the process of reducing concentrations naturally to achieve water potability again takes several decades [27].
The observed location used to be the largest wellfield in the Varaždin‘s water supply network. Due to the high nitrate concentrations, the wellfield has been inactive since 2004. It is believed such a high nitrate concentration at the Varaždin wellfield has been caused by the application of mineral fertilizers in agriculture [28]. However, there are other wellfields in the vicinity of the observed area where agricultural land is also present, but groundwater nitrate concentrations are significantly lower [29]. If the application of mineral fertilizers had been the dominant pollution source at the Varaždin wellfield, the nitrate concentration would have been similar at the other wellfields in this area, too. The research into the causes of such a high nitrate concentration at this particular location has been conducted, and its results imply that mineral fertilizer application is not the only dominant cause for such a condition. Therefore, this paper aims to:
- Based on the previously developed groundwater flow model given by other authors, develop a new model that covers the narrow area of the wellfield and define dominant nitrate pollution sources;
- Develop a numerical simulation of nitrate pollution propagation in groundwater at the observed wellfield;
- Assess contributions from located point pollution sources;
- Point out a necessity that every wellfield with a significant increase in a pollutant concentration should be analyzed separately.
2. Materials and Methods
2.1. The Study Area
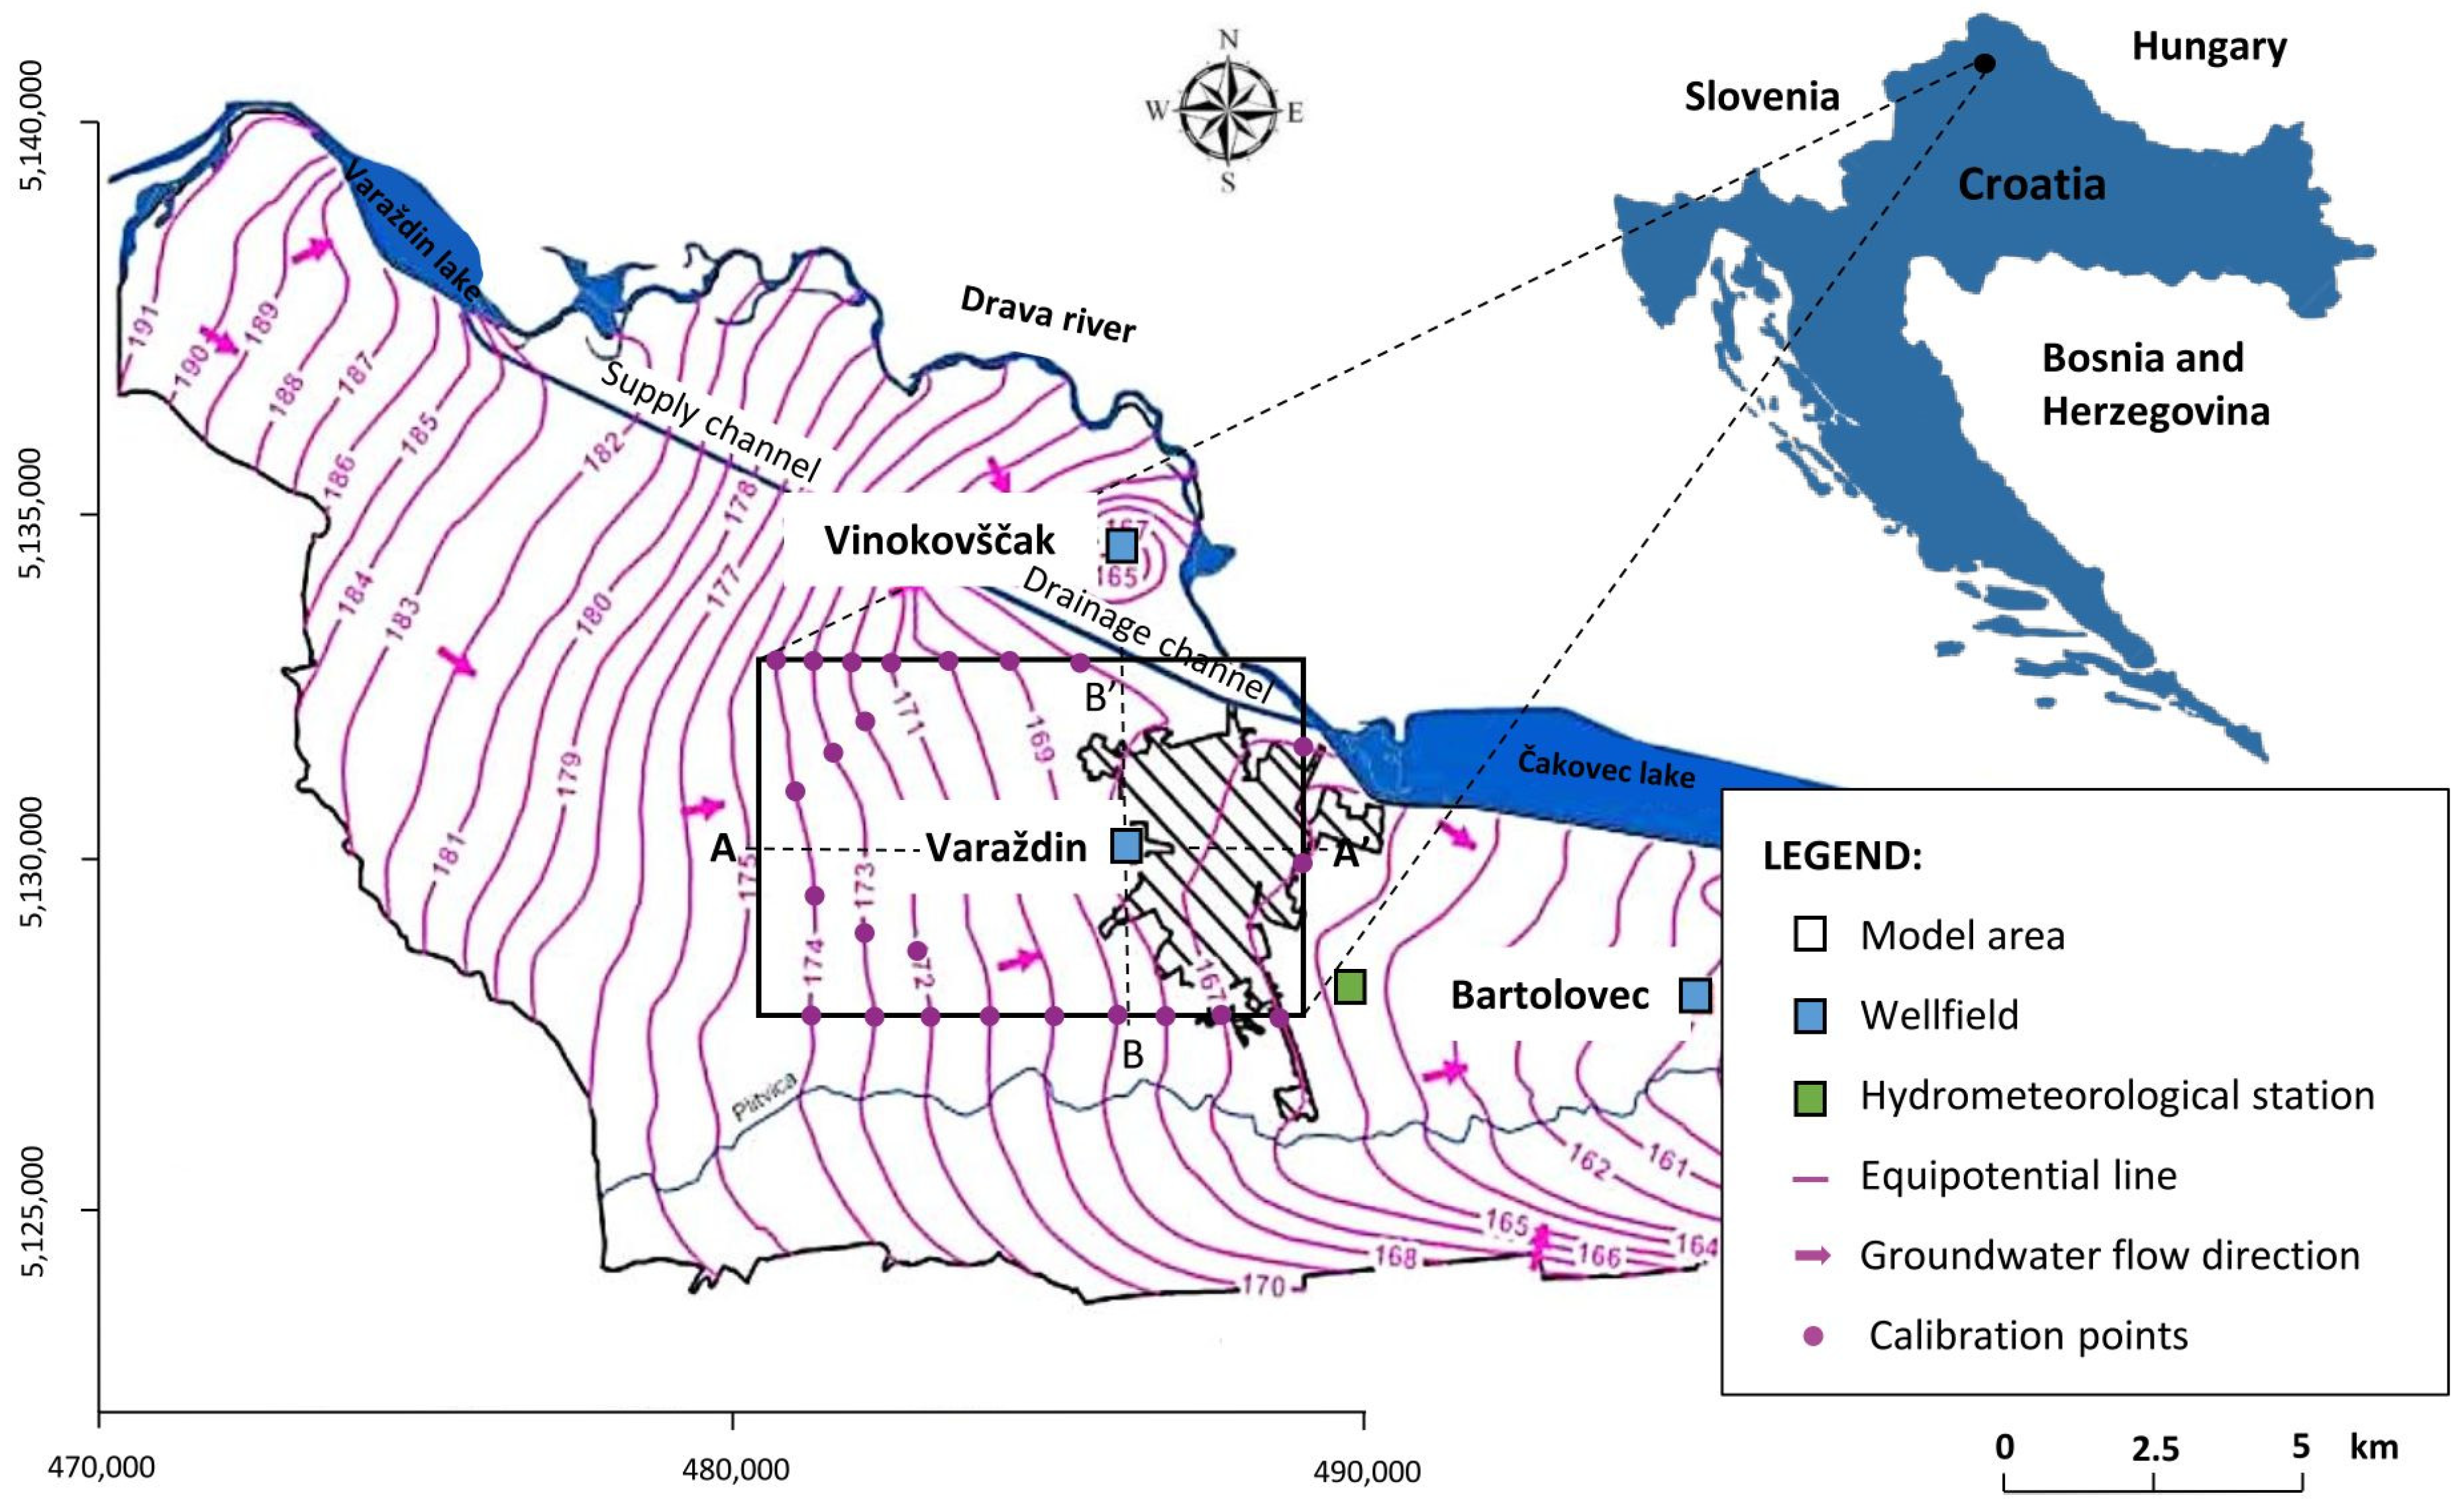
The study area is located in the north of the Republic of Croatia while the micro-location covers the wider area of the Varaždin wellfield (Figure 1), located near the town of Varaždin. The wellfield with two other wellfields (Bartolovec and Vinokovščak) is located around the town and the related infrastructure constitutes the regional water supply network of Varaždin.
Groundwater is pumped from the same alluvial aquifer system built of Quaternary sand and gravel and it was found to be of good quality at all the wellfields, except the nitrate concentration at Varaždin wellfield (Table 1). The value of this groundwater quality parameter was higher than at the Bartolovec and Vinokovščak wellfields [29]. In the Varaždin regional water supply network, the nitrate concentration was reduced by increasing the pumping rates at the wellfields Bartolovec and Vinokovščak where the values were below MAC NO3− [31]. Due to the constantly high level of nitrate concentration, the Varaždin wellfield has been inactive since 2004.
2.2. Geological and Hydrogeological Conditions
The geological structures consist of coarse-grained sediments of gravel and sand (middle and upper Pliocene age), while the underlying sediments are composed of silt and clay (upper Tertiary age) [32].
The aquifer is parallel with the Drava River and its thickness increases from the west to the east. At the far west end, the thickness is 5 m, while in the town of Varaždin it is about 75 m. In the eastern part the thickness of the aquifer increases to its maximum value of 148 m and then it decreases gradually. The aquifer is composed of two permeable gravel and sand layers, divided mostly by a semipermeable silty and clay aquitard [33]. The upper layer of the aquifer is composed of coarse-grained gravel and sand, while the lower part is composed mostly of finer-grained gravel with sand. The groundwater flow is in the west-east direction and it is parallel to the Drava River. The quality of groundwater is significantly higher in the lower layer of the aquifer at the Bartolovec wellfield [29].
The hydraulic conductivity values change slightly in the plan from 100 to 300 m/day, so it is higher in the west and lower in the east what is the consequence of the size drop of the granulometric fractions in the west-east direction. At the location of the Varaždin wellfield, the hydraulic conductivity values were measured to be in the range 185–241 m/day for the upper and 92.6 m/day for the lower layer [30].
2.3. Experimental Data
The groundwater quality at Varaždin wellfield was controlled at eight wells (B3 to B10) and five piezometers (P23, P25, P26, P29, and P30) from the upper aquifer layer by regular sampling in the period from 1994 to 2003. The periodicity of the sampling was at least once a week for the active wells and at least once a month for the piezometers according to the valid regulations [17]. The activity of wells during the observed period had been changing, which means that different combination of wells was active in a particular period. Since the water was drawn from the upper layer of the same part of the aquifer at all the sampling locations, the results of the analysis relate to it.
2.4. Groundwater Flow Model
In the case of a steady groundwater flow in a heterogeneous aquifer in which the main directions of anisotropy coincide with the coordinate axes it can be expressed by the following expression [34]:
where
- Kii
- - hydraulic conductivity tensor (L/T);
- h
- - groundwater level (L);
- qs
- - volumetric flow representing the source/sink of water in case of pumping/extraction water in/out of the system (L3/T);
The solution of Equation (1) was carried out numerically by the finite difference method and for this purpose, the MODFLOW code was used [35] as part of the software tool GMS 10.3 (Groundwater Modeling System). The simulation was performed for steady flow conditions.
2.4.1. Model Area
The domain of the model is determined in such a way that a sufficient distance in all directions from each well, where the effect on groundwater flow under working conditions of the wellfield is negligible is taken. Namely, some research shows that the well influence radius in unconfined aquifers with a hydraulic conductivity value of 200 m/day can be expected up to 1500 m [36], while the Kusakin [37] and Siechardt [38] methods show the well influence radius for the observed wellfield below 1000 m. As recent research suggests careful use of the well influence radius [39], a value of 3000 m as the minimum distance from the well to the edges of the domain is used. In the simulation process, it is found that the change of groundwater level at the domain boundaries due to a different amount of pumping rates at the wellfield is negligible, which justifies described approach.
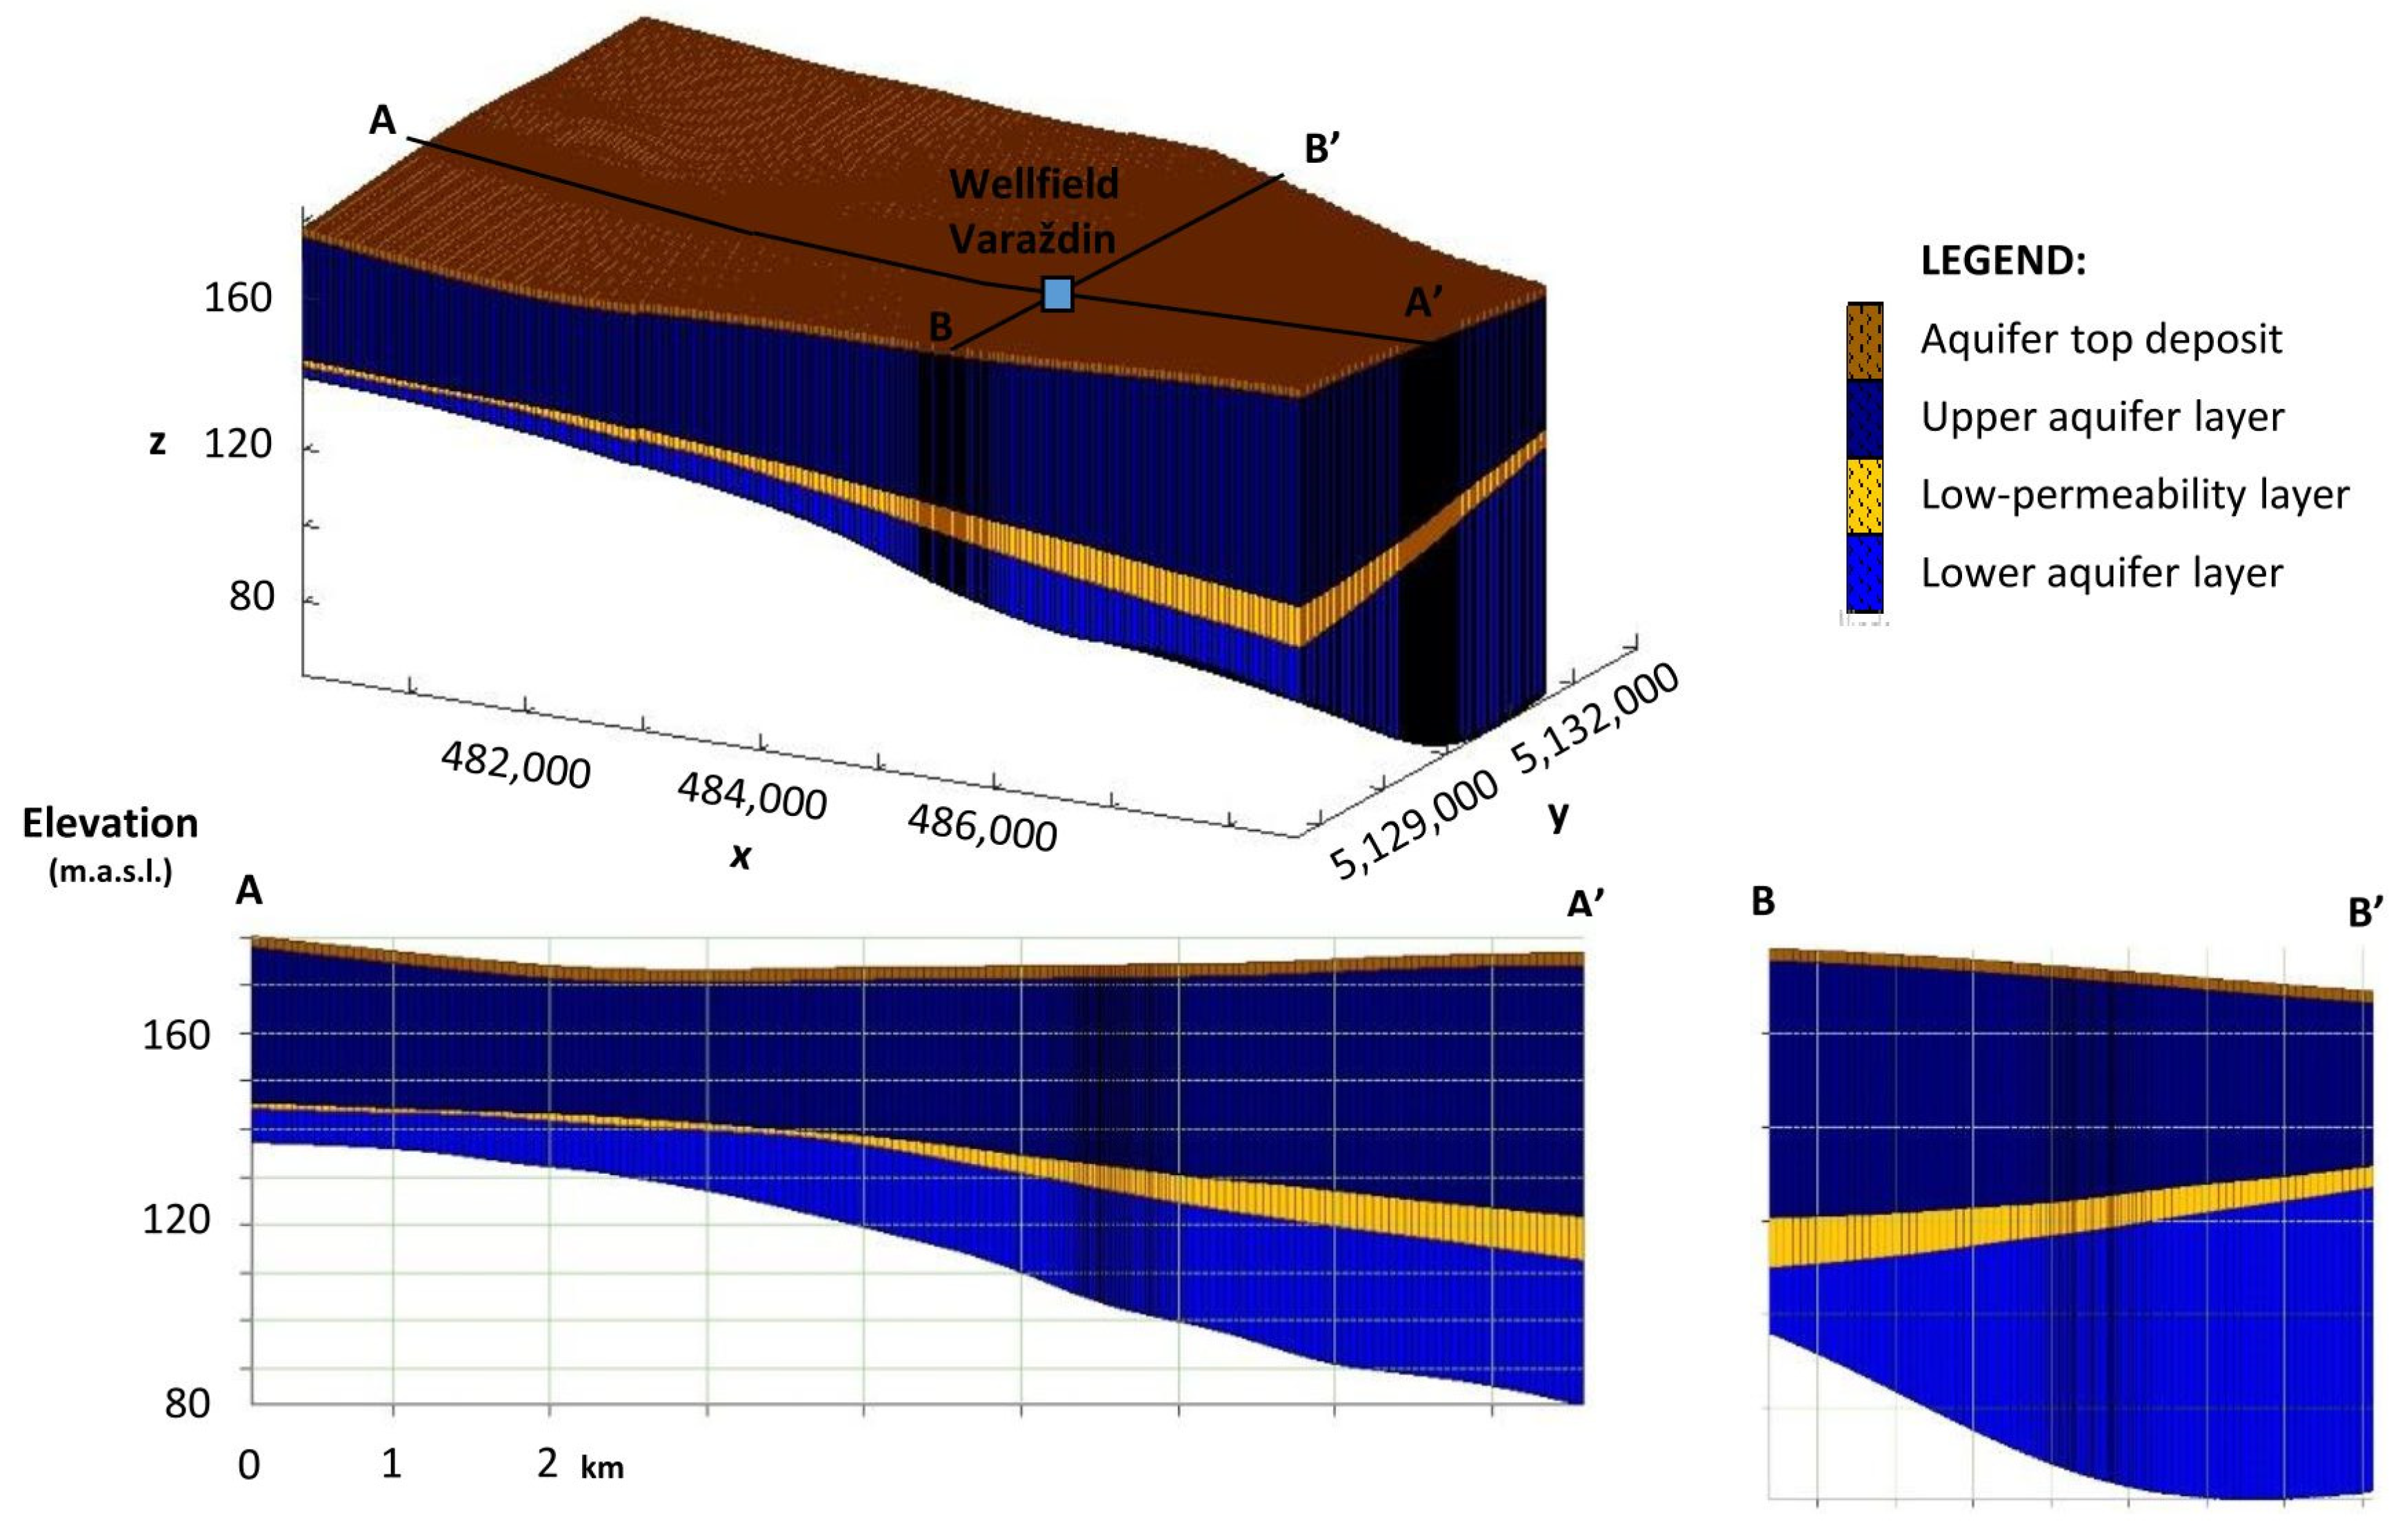
The horizontal discretization is done by an orthogonal grid using the finite difference method. The size of the spatial elements is 50 m × 50 m, to be reduced to 25 m × 25 m in the area of the wellfield, due to a more accurate display of the flow in the areas of larger gradients. The vertical discretization is made using four layers representing the aquifer top deposits, then the upper aquifer layer, the low-permeability layer, and the lower aquifer layer (Figure 2). The thicknesses of aquifer layers were taken from the results of previous researches [30,32].
2.4.2. Hydrogeological Model Parameters
Values of hydraulic conductivity were obtained in the calibration process of groundwater level given in the previous study, where values of 213 m/day for the upper and 92 m/day for the lower aquifer layer at the observed area were determined [30]. In the model area, horizontal isotropy was assumed, while vertical anisotropy was expressed by the ratio Kh/Kv = 1/10. The values of the horizontal and vertical hydraulic conductivity of the aquifer top deposits (silt and sand) are 0.1 m/day and 0.01 m/day, and the values of the low-permeability layer of clay, which divides the aquifer into two parts are 1 × 10⁻³ m/day and 1 × 10⁻⁴ m/day, which corresponds to the soil type value range in previous researches [40]. The values of effective porosity are estimated based on the lithological composition of the aquifer, which for both aquifer layers are 23% [41], while for the top deposit and low permeability layer are estimated to be 38% [42].
2.4.3. Groundwater Flow Model Setup
At the Varaždin wellfield, the pumping rate was systematically reduced from 1998 to 2004, when the wellfield was set to inactive mode. To determine the impact of the wellfield in full working conditions, the value of the pumping rate before the pumping reduction (the year 1997) was simulated. Eight wells from the upper aquifer layer were active (B3–B10) with a total annual pumping rate of 9,183,429.20 m3. To simulate the pumping rate at the wells, the daily average of 3145.01 m3/day was calculated. This value was used for each well to determine the impact area of the wellfield. Within the GMS software, theNeumann boundary condition–well is used in this purpose.
Groundwater precipitation recharge is imposed on the surface cell layer, which represents the boundary with a constant inflow. To determine the vertical balance, the precipitation regime at the hydrometeorological station of Varaždin (Figure 1) in 1997 was considered. In that year, the total rainfall was 880 mm. Based on previous research in the wellfield area, the value of effective infiltration of 35% of total precipitation (308 mm) was adopted [43]. Within the GMS software, the Neumann boundary condition–precipitation is used in this purpose.
Dirichlet boundary condition–groundwater head is set at the model boundaries while the exact values of the boundary heads are obtained through the calibration process. This boundary condition allows the determination of the groundwater level and the groundwater flow is simulated at a speed sufficient to satisfy a given gradient. Calibration is completed using the measured values at the control points shown in Figure 1 [30].
2.5. Nitrate Pollution Propagation
Due to their high solubility, nitrates tend to be carried by water. Gardner [44] concluded that two main processes are involved in nitrogen transport: advection and dispersion. The mathematical description of the transport of pollution in groundwater, without chemical reactions and decomposition of pollutants, can be expressed by the advection-dispersion equation [45]:
where:
- C
- - pollution concentration (M/L3);
- n
- - porosity;
- t
- - time (T);
- xi
- - distance along the corresponding Cartesian coordinate axis (L);
- Dij
- - hydrodynamic dispersion coefficient tensor (L2/T);
- vi
- - groundwater flow rate (L/T);
- qs
- - flow per unit volume of aquifer representing the source (positive) or sink (negative) of fluid into the aquifer (1/T);
- Cs
- - source or sink pollution concentration (M/L3).
The solution of Equation (2) is carried out numerically by the finite difference method. For this purpose, the MT3DMS code [45] was used as part of the software tool GMS 10.3 (Groundwater Modeling System) and it represents an upgrade to the groundwater flow model using the MODFLOW finite difference method.
The simulation was performed as advection-dispersion transport of nitrates. Although the denitrification process can take place in areas with higher proportions of fine-grained sediment and organic matter in the aquifer, previous research shows that these processes are very weak or even insignificant and that nitrates are transported over long distances by groundwater [46]. Having in mind that the results and the fact that the model domain in this study is relatively small, the approach of nitrate transport to the processes of advection and dispersion is justified.
2.5.1. Hydrodynamic Dispersion
The coefficient of hydrodynamic dispersion is defined as the sum of effective molecular diffusion and mechanical dispersion. The role of molecular diffusion in groundwater pollution transport is very small and can be neglected in modeling pollution transport [45]. Due to this mentioned reason, this process has not been considered in this study.
Dispersivity is a transport parameter and it often changes with the distance over which pollution travel. A good first approximation for the longitudinal dispersivity is to use a value of 10% of the transport distance [47], while Mallants et al. [48] provide the best estimate for the longitudinal dispersivity based on a few experimental studies and empirical formulas given by different authors [49,50,51]. Having in mind various dispersivity relations given by different authors, the resulting empirical formula accounts for all the empirical investigations given by the three mentioned authors. In this way, the new empirical formula can be incorporated into the numerical model providing authors the certainty that relevant scientific investigations are incorporated into the model averaging the experimental curves and data. The curves created by Neuman [49] and Xu and Eckstein [51] have two common points, so they are taken as two firm points in the construction of the new curve. They represent experimental laboratory and field dispersivity values in the range up to 250 m distance. Dispersivity values for distances greater than 250 m are obtained using numerical values given by Gelhar [50] in a way that the average point was calculated based on the numerical values grouped inside the range of 280 m to 1000 m distance range. The fourth point was calculated as the average point of Gelhar numerical values grouped in a distance range 2000–10,000 m. The linear regression through the four mentioned points produces the following linear equation:
The value of longitudinal dispersivity was determined based on the distance of the largest point source of pollution to the geographical center of the wellfield using Equation (3). To quantify the effect of three-dimensional dispersivity is necessary to determine the values of transverse horizontal (αTH) and transverse vertical dispersivity (αTV). These values were obtained in the model calibration process in a way that the deviation between the measured and simulated values of nitrate concentrations at the control points was minimum. Based on the presented facts, the value of longitudinal dispersivity of 30 m, transverse horizontal 12 m, and transverse vertical 1 m was adopted.
2.5.2. Pollution Propagation Boundary Conditions
The inflow of nitrate into the aquifer is achieved by infiltration through the unsaturated zone. The amount of nitrate in the leachate depends primarily on anthropogenic sources on the surface. In the area of the Varaždin wellfield, there are several anthropogenic sources of pollution that affect the concentration of nitrates in groundwater, which can generally be divided into a point and non-point sources. Non-point sources include agricultural areas located north, west, and south from the wellfield, the urban area of the town of Varaždin located northwest and west, and the natural background level. Point sources primarily include several poultry farms, which are located in the western area, and a poultry landfill on the southwest side of the wellfield.
Using statistical and geostatistical methods in the previous study [52], the nitrate concentration of non-point pollution sources in the Varaždin area was estimated to be 35.92 mg/L NO3− and this value is set on all boundaries. Having in mind the groundwater flow direction, only the values on the western boundary are of practical importance for the model results in the Varaždin wellfield area.
3. Results and Discussion
The conducted scientific research is based on the findings published in the scientific and professional literature on nitrate pollution of groundwater, as well as in the field of numerical modeling and statistical methods. Having in mind that wellfields are particularly vulnerable due to the impact on groundwater flow, today more attention is paid to the protection of their influencal zones, which is crucial for good quality water [53,54]. The U.S. Environmental Protection Agency defines this zone as as the surface and underground area surrounding a well or wellfield through which pollution is likely to move towards the well or wellfield. The scientific contribution of this research is based on the fact that using numerical models of groundwater flow and pollution propagation in interaction with statistical methods, with knowledge or good approximation of input parameters, point sources of nitrate pollution in the influential wellfield zone can be located and quantified.
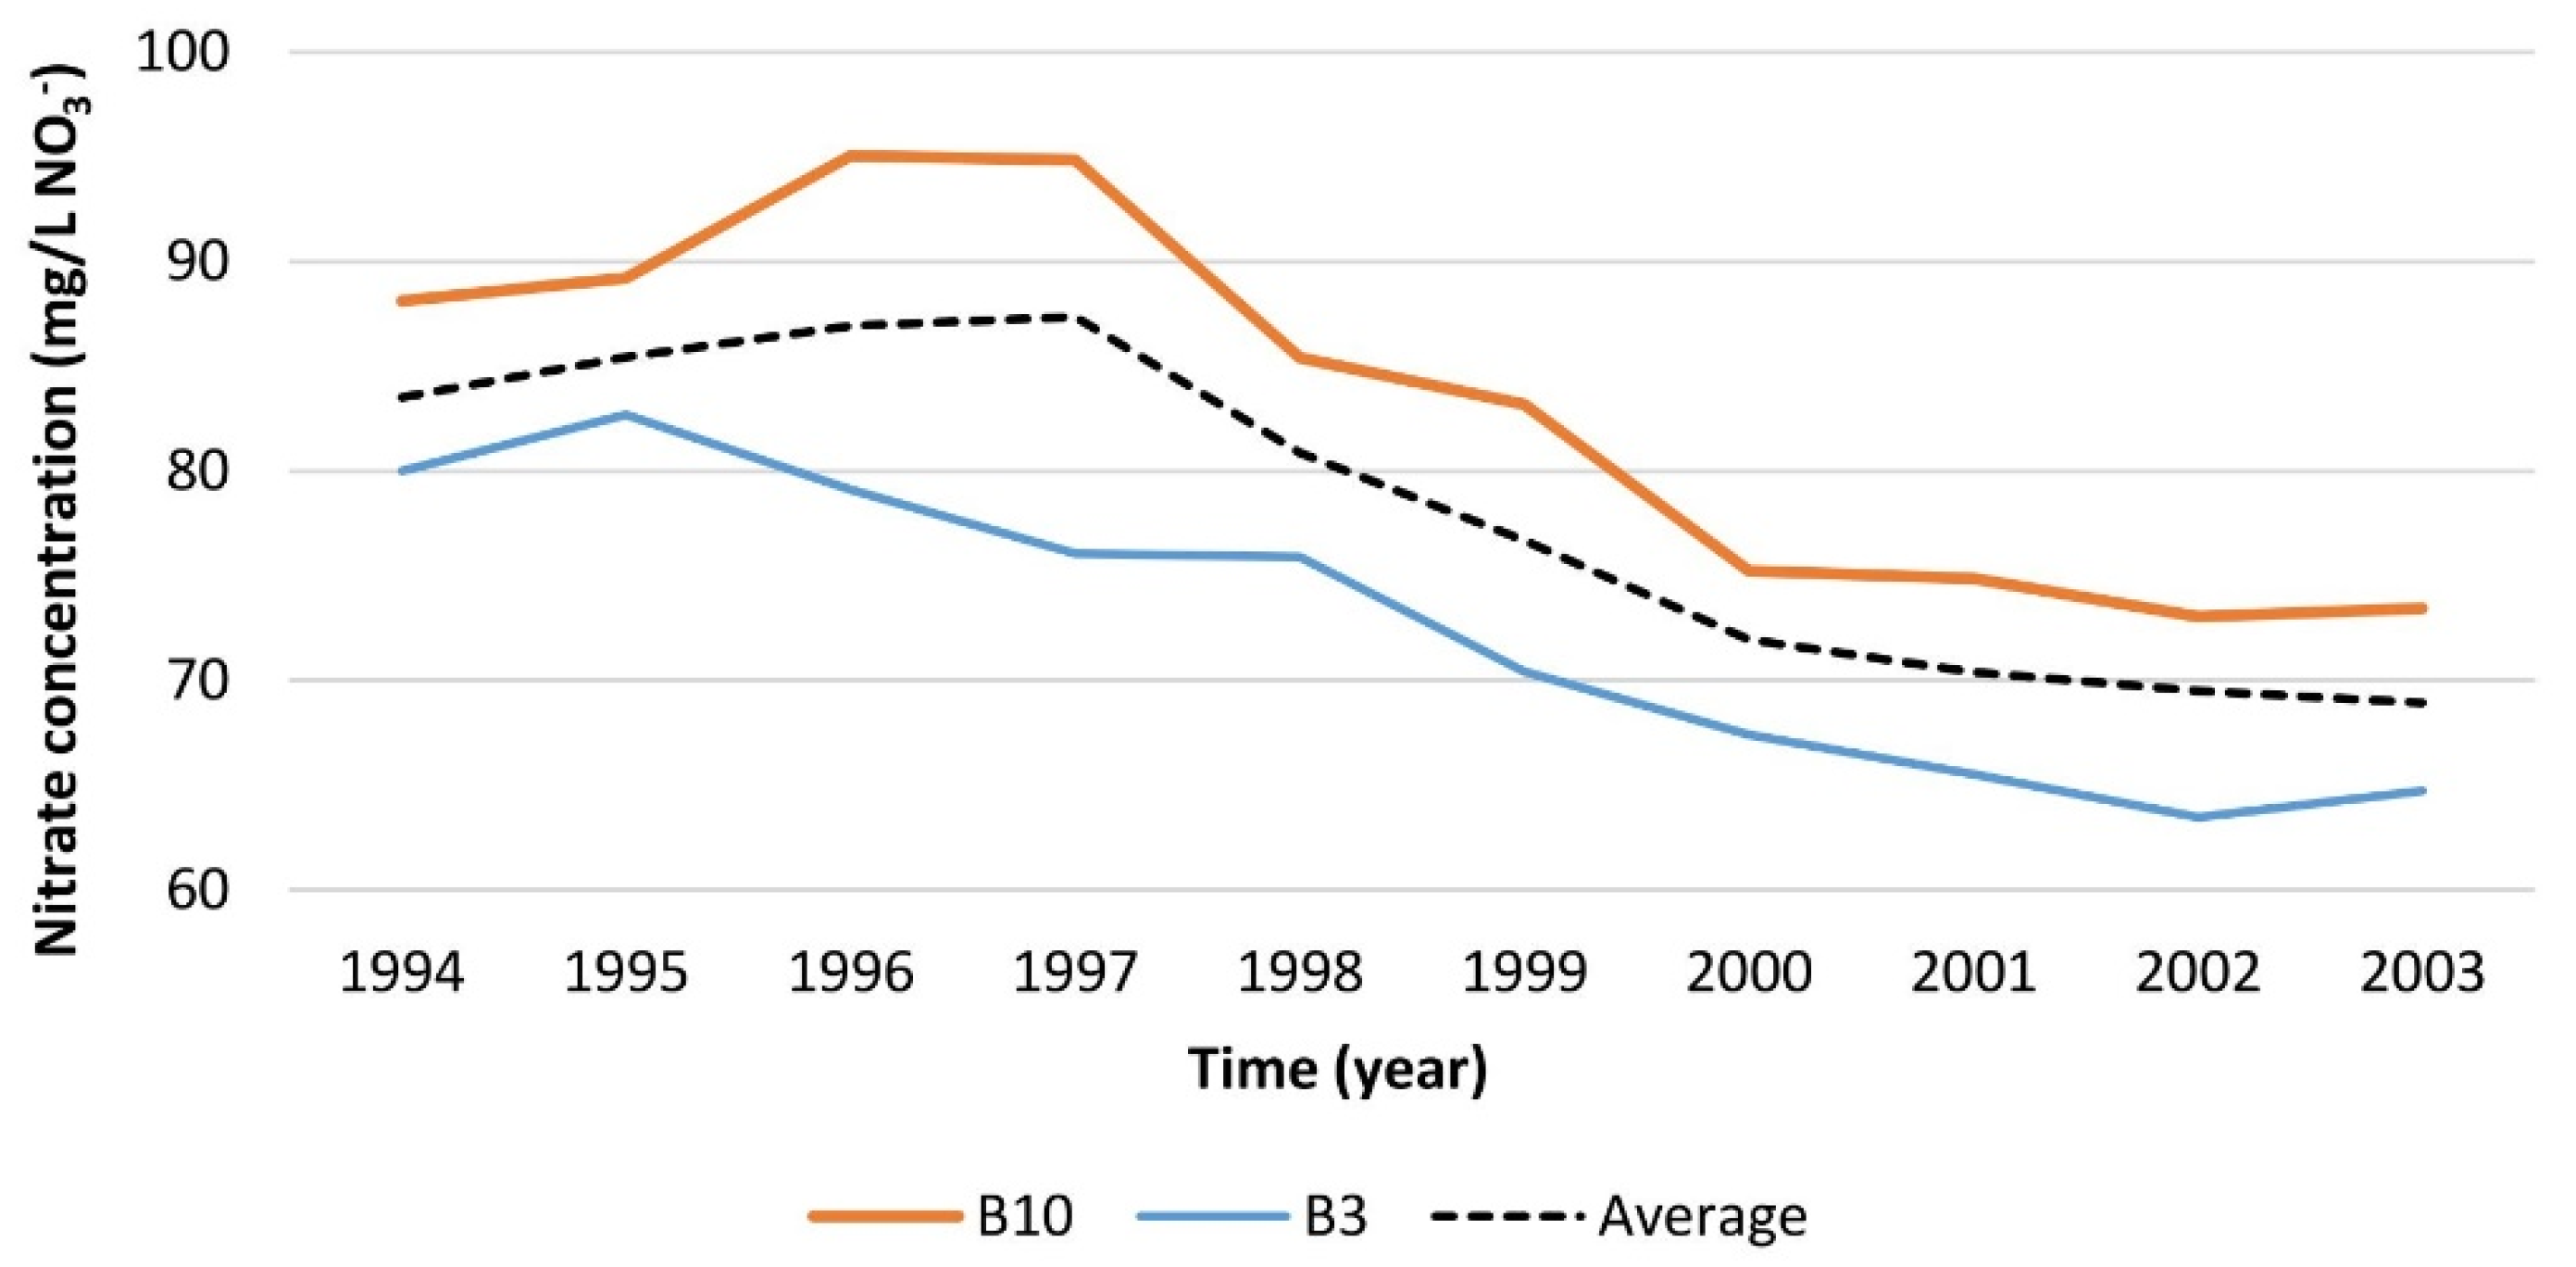
The first step in nitrate pollution sources assessment is to obtain the spatial distribution of nitrate concentration at the Varaždin wellfield. For this purpose, nitrate concentration annual averages at wells were observed. A 10-year period from 1994 to 2003 was set when the wellfield was active. During the observed period, the nitrate concentration was higher at some wells compared to other ones. The lowest nitrate concentration was recorded at well B3 and the highest at well B10, while the values at other wells were within that interval (Figure 3). Good consistency of the annual average curves was also observed, so as the concentration at one well increases, it increases at the other wells and vice versa. This confirms the value of the coefficient of correlation of annual average nitrate concentrations at wells B3 and B10 which is calculated to be 0.86.
The analysis of the time series determines the existence of regular ratios of nitrate concentration in wells. For this reason, it is justified to calculate the arithmetic means of the nitrate concentration () during the observed period at each well and piezometer (Table 2). The obtained nitrate concentration values will be used as control values when calibrating the nitrate pollution propagation simulation.
By the developed conceptual model, which is defined by aquifer geometry, hydrogeological parameters, boundary conditions, and calibrated based on previous research, a simulation of groundwater flow in the narrow area of the Varaždin wellfield, is obtained.
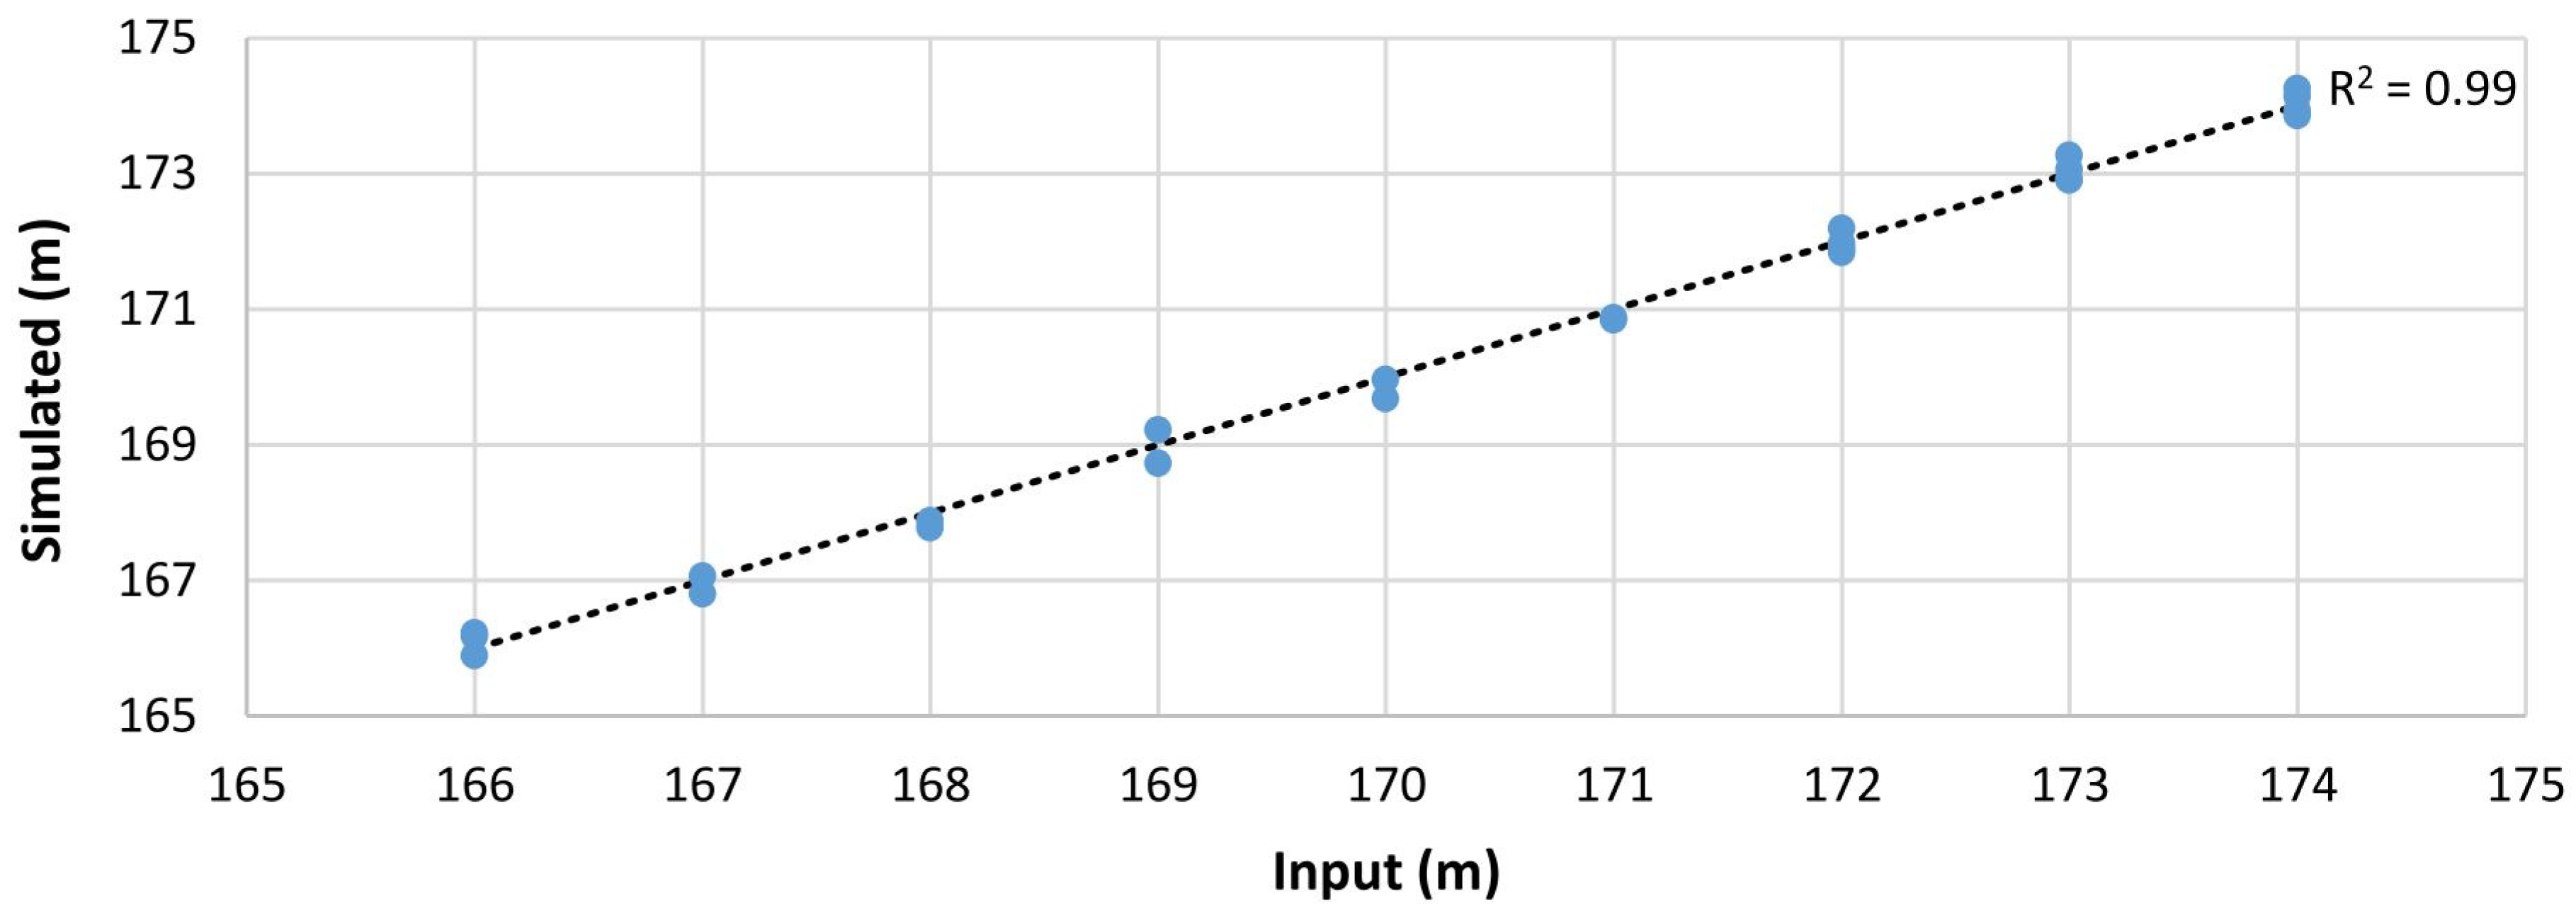
In Figure 4, a diagram shows the relation of the groundwater heads at the boundary and simulated values of groundwater levels in control points. Model verification is carried out as presented in [55], so the residual mean error is calculated to be −0.023 m, absolute residual mean error is 0.153 m, root mean square error is 0.172 m, normalized root mean square error is 2.15%, while the value of the coefficient of determination is found to be 0.99.
To determine the inflow zone of the wellfield, a simulation of particle tracking is performed. The MODPATH program code [56] is used for this purpose and it is often used in groundwater resource management today [23,25]. The program uses a semi-analytical particle tracking scheme that allows obtaining an analytical expression of the particle path within each cell by the finite difference method. The particle path is calculated by tracking a particle from one cell to another, assuming that all particles move at an effective water flow rate until they reach the model boundary or satisfy another completion criterion. To determine the inflow area of the wellfield, backward particle tracking where the particles are tracked from the endpoint, in this case from the wells in the reverse direction towards the model boundaries is simulated. The limit of the simulation was set at 4000 days.
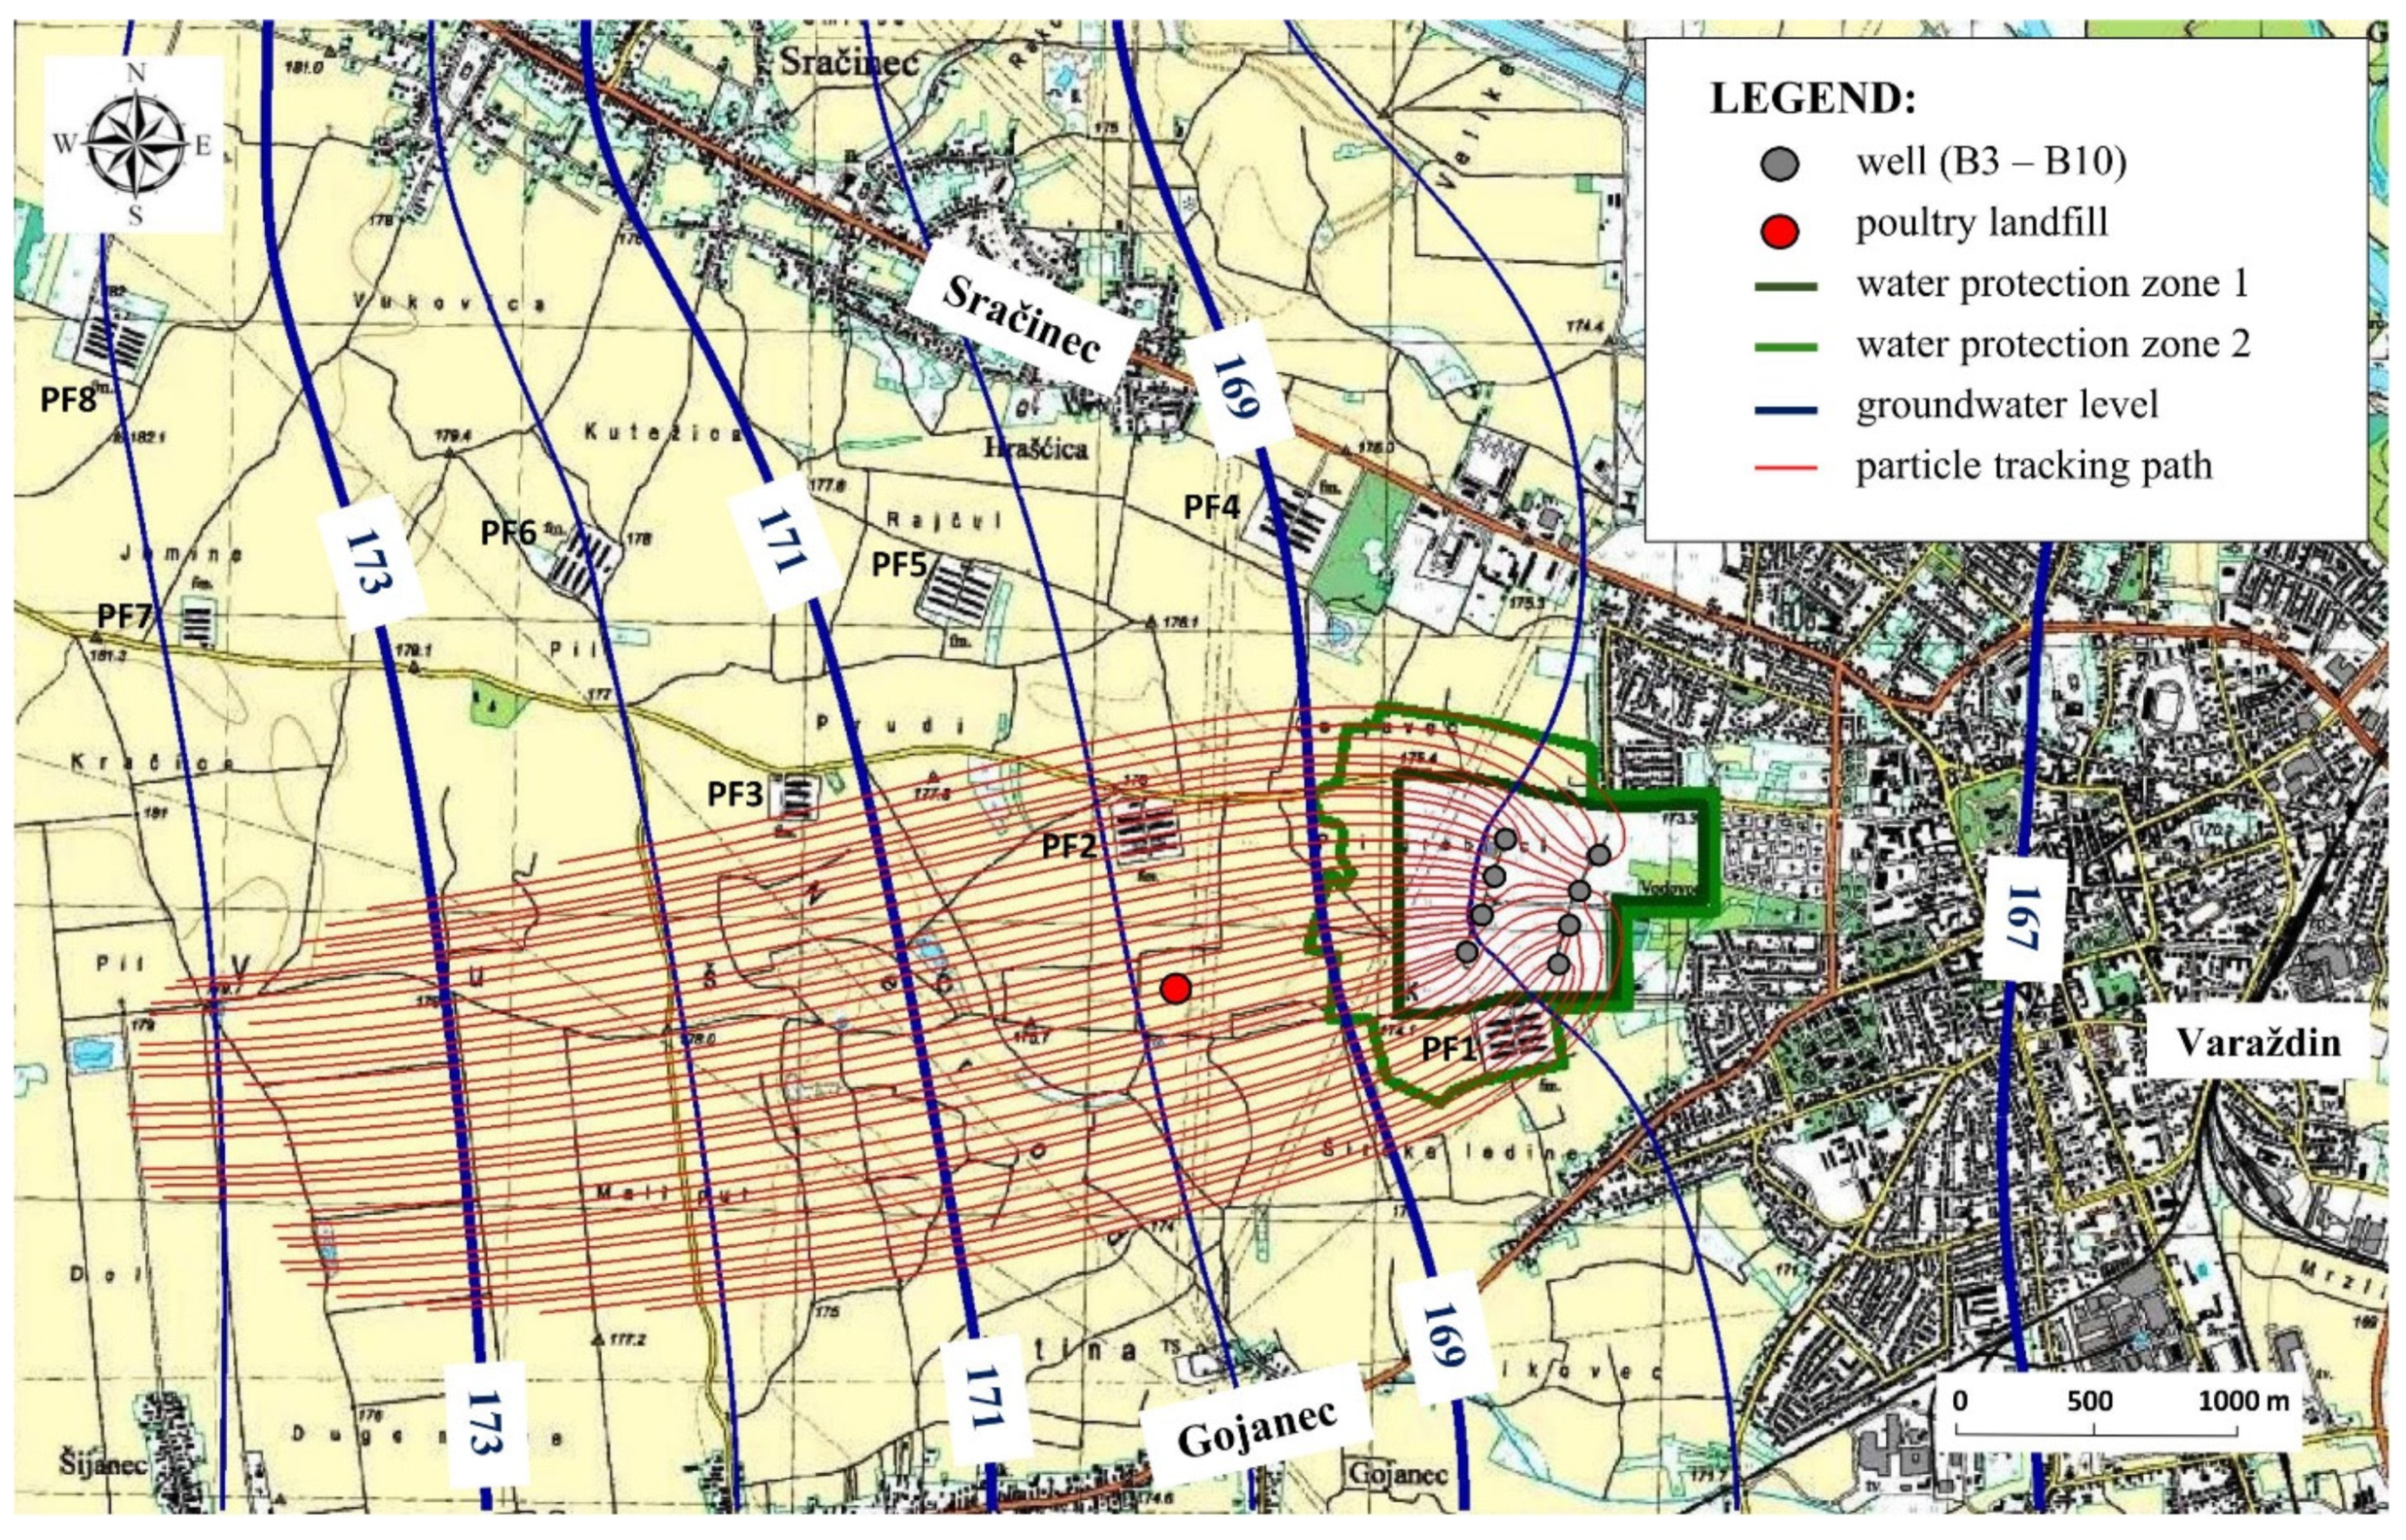
The simulation of particle tracking shows that the inflow zone of the wellfield extends slightly southwest and approximately 1 kilometer to the north and south (Figure 5). Additionally, the simulation results show that the water protection zones were marked following the valid national regulation [57]. The estimated retention time of groundwater in the horizontal flow from the boundaries of the first water protection zone to the closest well is estimated to be about 200 days, and from the second water protection zone to the well about 400 days. On the west side of the inflow area, there are mostly agricultural areas, which can be observed as non-point pollution sources. In addition, three poultry farms are located in the inflow zone, one on the south side (PF1), two on the northwest side (PF2 and PF3), and a poultry landfill on the southwest side, which are classified as point sources of pollution (Figure 5). Previous research shows that leachate from poultry farms contains nitrate concentration values of up to 180 mg/L NO3− [58].
The performed simulation of nitrate pollution propagation is steady, which means that the nitrate inflow is constant in the observed period. The values of nitrate concentrations in the area of the poultry landfill and poultry farms, located in the inflow area of the wellfield, were determined in the model calibration process in such a way that the sum of square residual values between simulated and measured values at control points (B3–B10 and P23–P30) is the smallest. The values of the residuals (Δ) and the squared residuals (Δ2) of the simulated and measured values at the control points are shown in Table 2, while the residual mean error is 0.905 mg NO3−/L, absolute residual mean error is 1.615 NO3−/L, root mean square error is 2.441 NO3−/L, and normalized root mean square error is found to be 13.28%.
A comparison of the measured and simulated values of nitrate concentration at the control points is shown in Figure 6. The correlation coefficient concerning the direction of perfect fit is 0.94, which represents a strong correlation between the two data sets. A t-test was performed and the obtained value of t = 9.14 is higher than the critical value tα = 2.20 at the 95% significance level, so the model can be considered reliable.
Considering advection–dispersion processes and initial conditions, nitrate concentration values in groundwater in the area of point sources of pollution are estimated and the results are shown in Table 3.
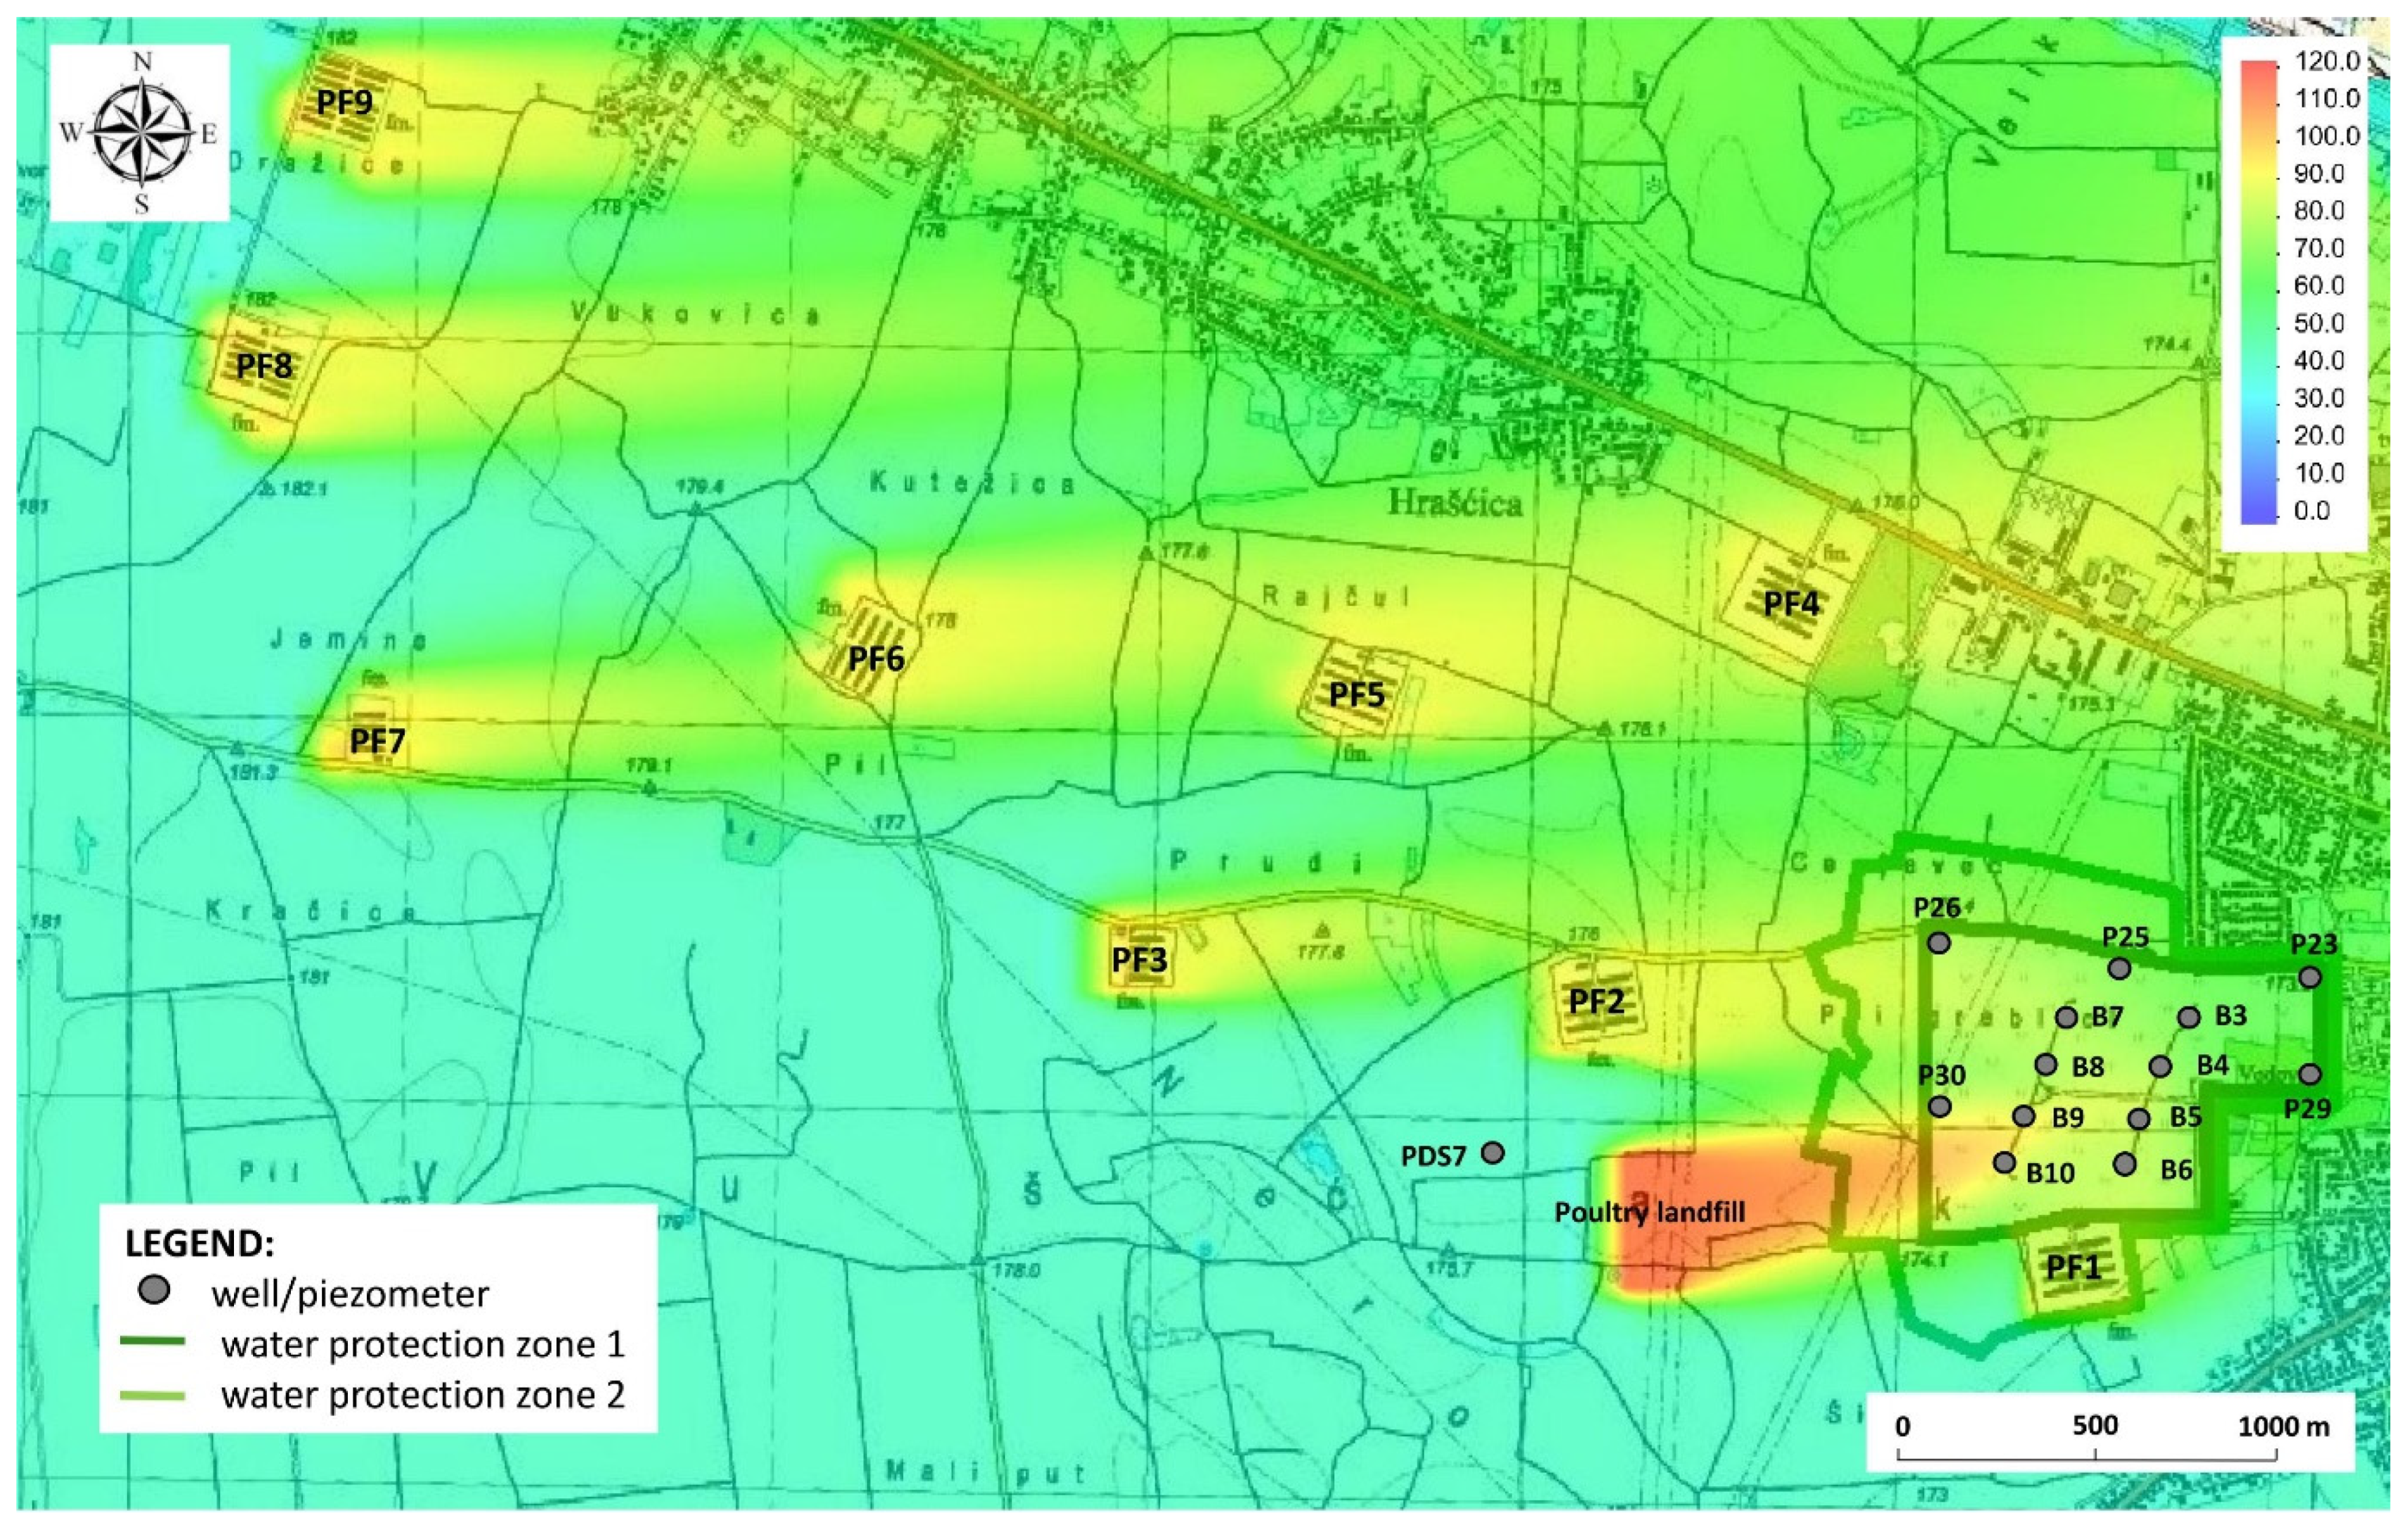
In the upstream western area from the location of the poultry landfill, there is a PDS7 piezometer (Figure 7) from which groundwater in the upper aquifer layer was sampled in the period 2004–2006. During this period, the nitrate concentration at this measurement site did not exceed the value of 41 mg NO3−/L [30]. These results show that in the west upstream area from the landfill the nitrate concentration is lower compared to the east downstream area.
The simulation results indicate that the located point sources of pollution have the greatest influence on the nitrate concentration in the area of the Varaždin wellfield (Figure 7). The estimated initial value in the area of poultry landfills is 114 mg/L NO3−, while in the area of poultry farms it ranges from 80 to 87 mg/L NO3−.
Considering that there are several poultry farms (PF4–PF9) in the wider northwestern area of the Varaždin wellfield, a simulation of nitrate transport from these locations is also conducted. The estimated nitrate concentration value from the poultry farm PF3, as the highest estimated value is used at these locations. The simulation results show that the pollution from these farm locations spreads north and they do not affect the nitrate concentration in the area of the Varaždin wellfield (Figure 7).
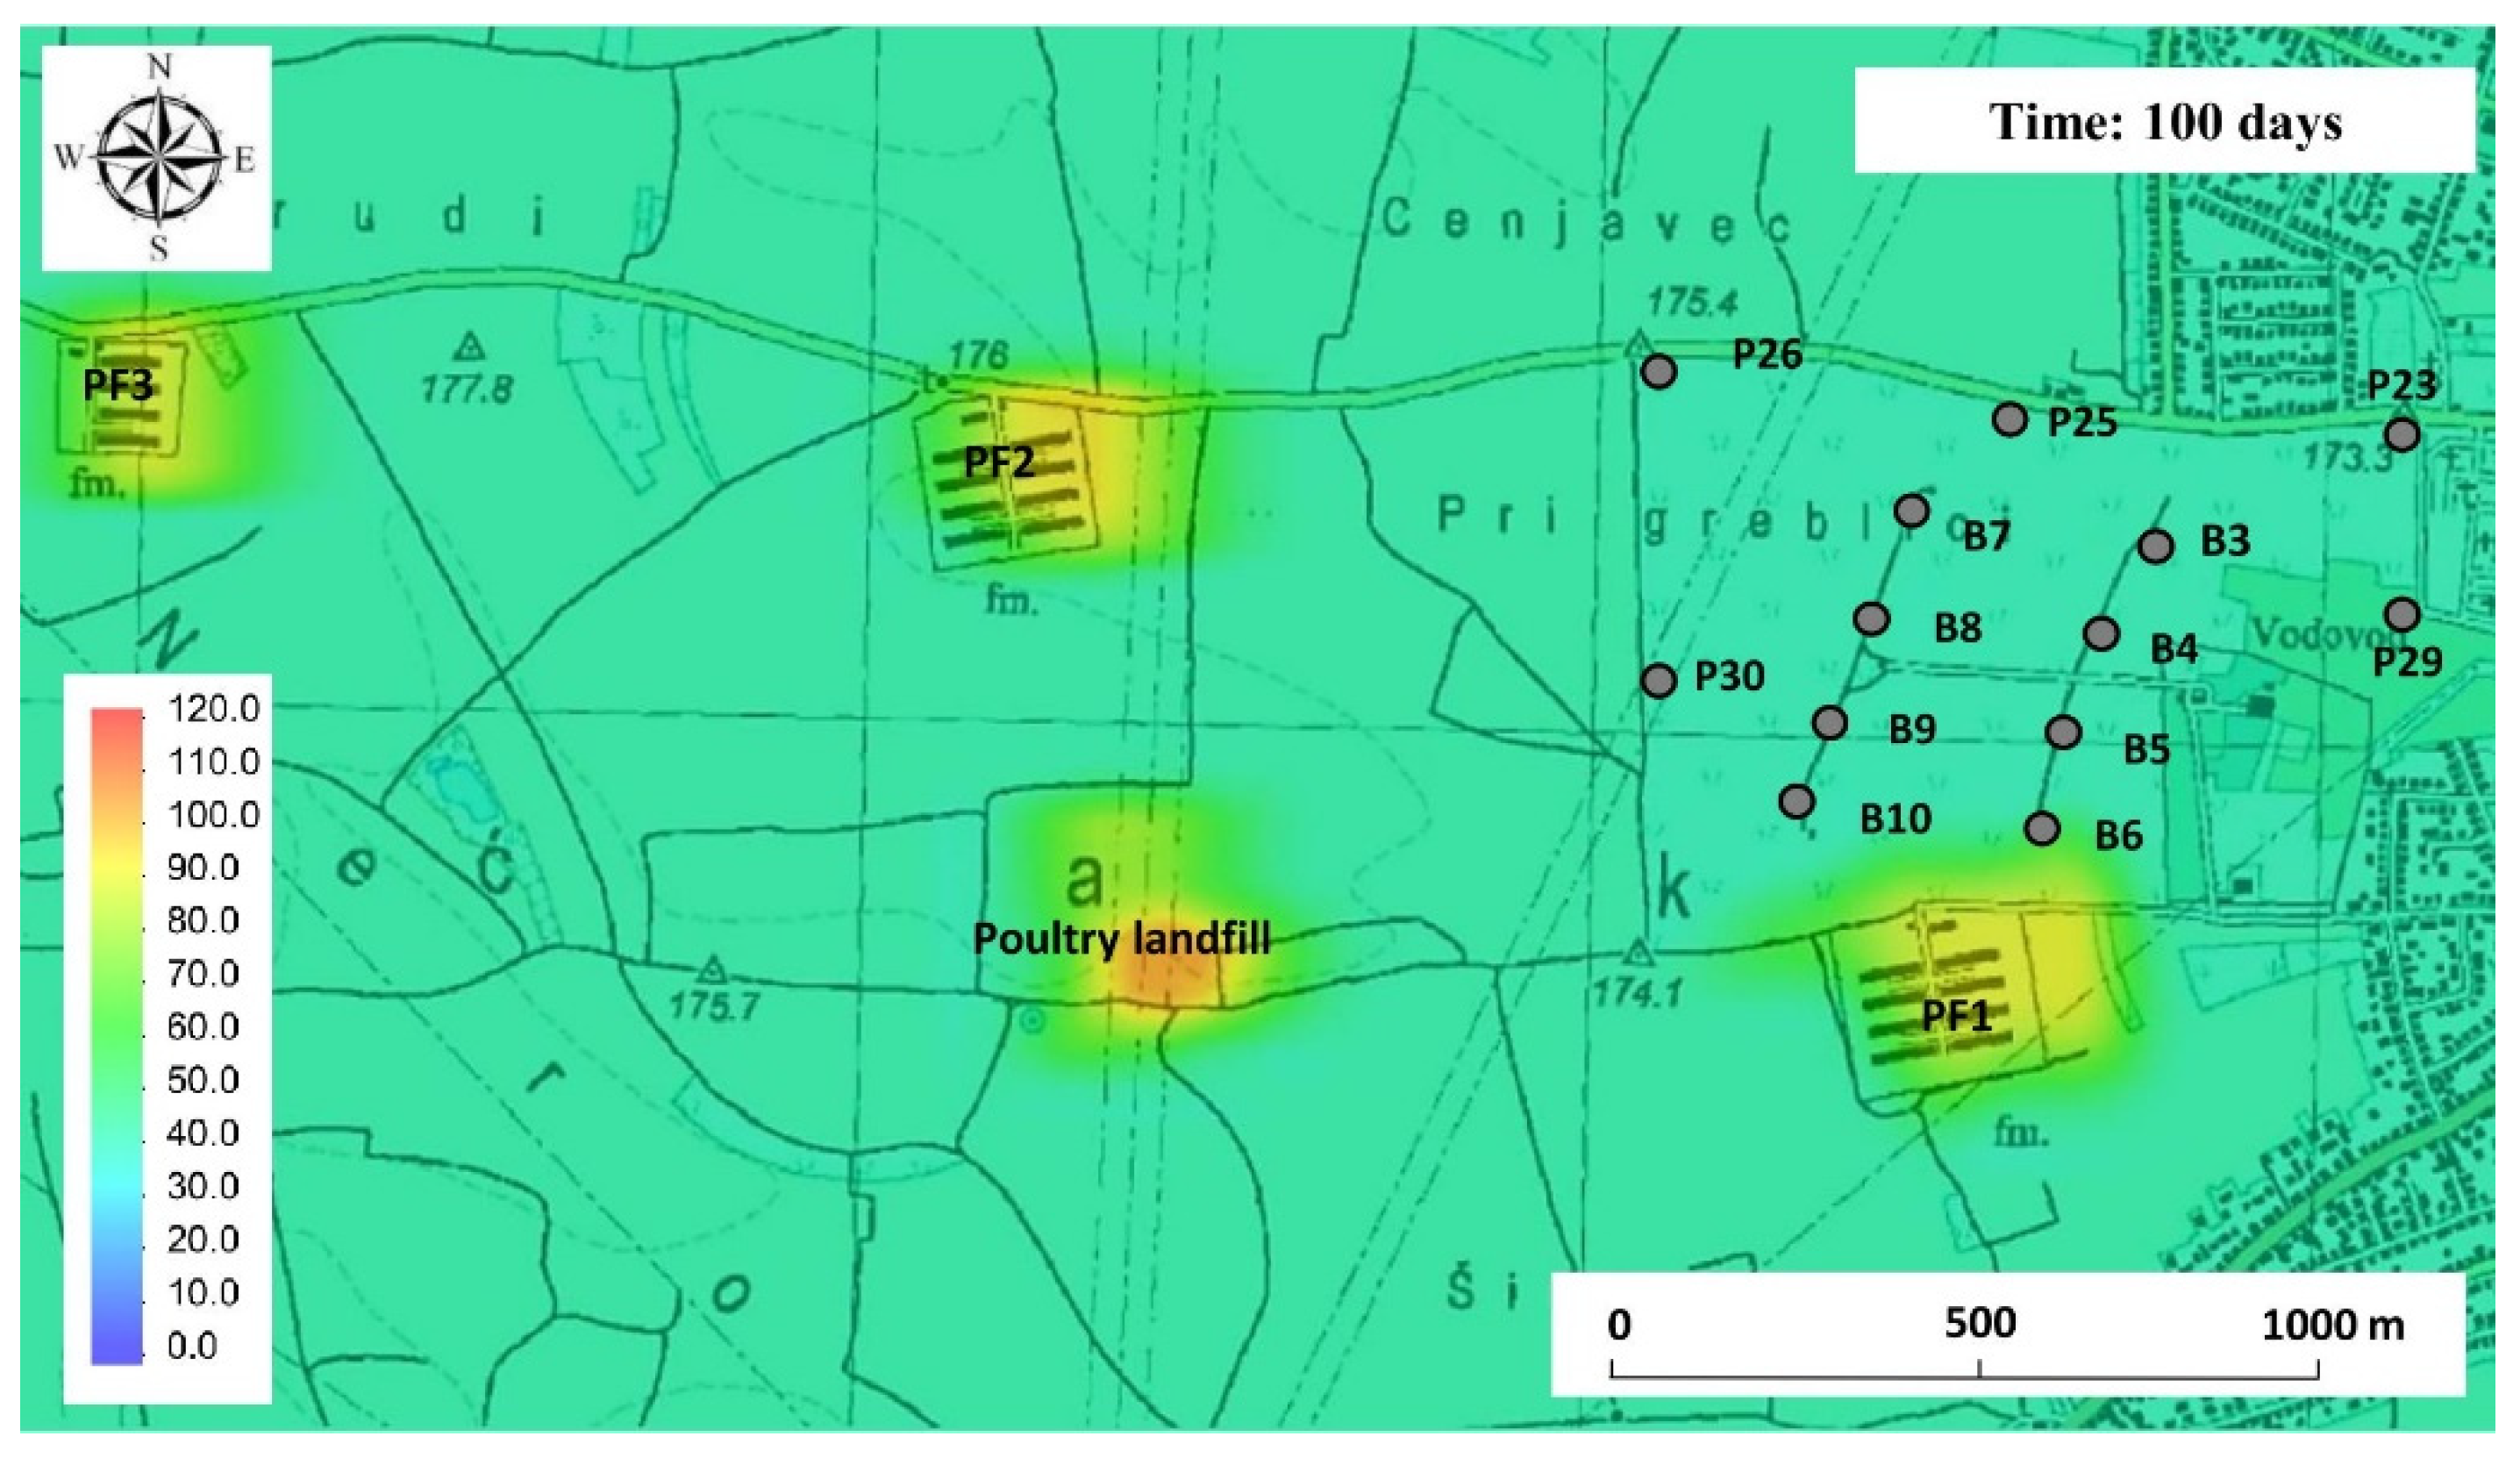
The performed analyses indicate that point sources of pollution in the vicinity of Varaždin wellfield are the dominant sources of nitrate pollution, with the focus on the southwestern area as indicated in [59]. Additional simulation to estimate the time required for the pollution to be carried by the advection and dispersion processes from the located point sources of pollution to beyond the boundary of the wellfield was performed. Nitrate input from the area of point sources of pollution was simulated only as an impulse condition, while in the rest of the simulation process there is no nitrate input.
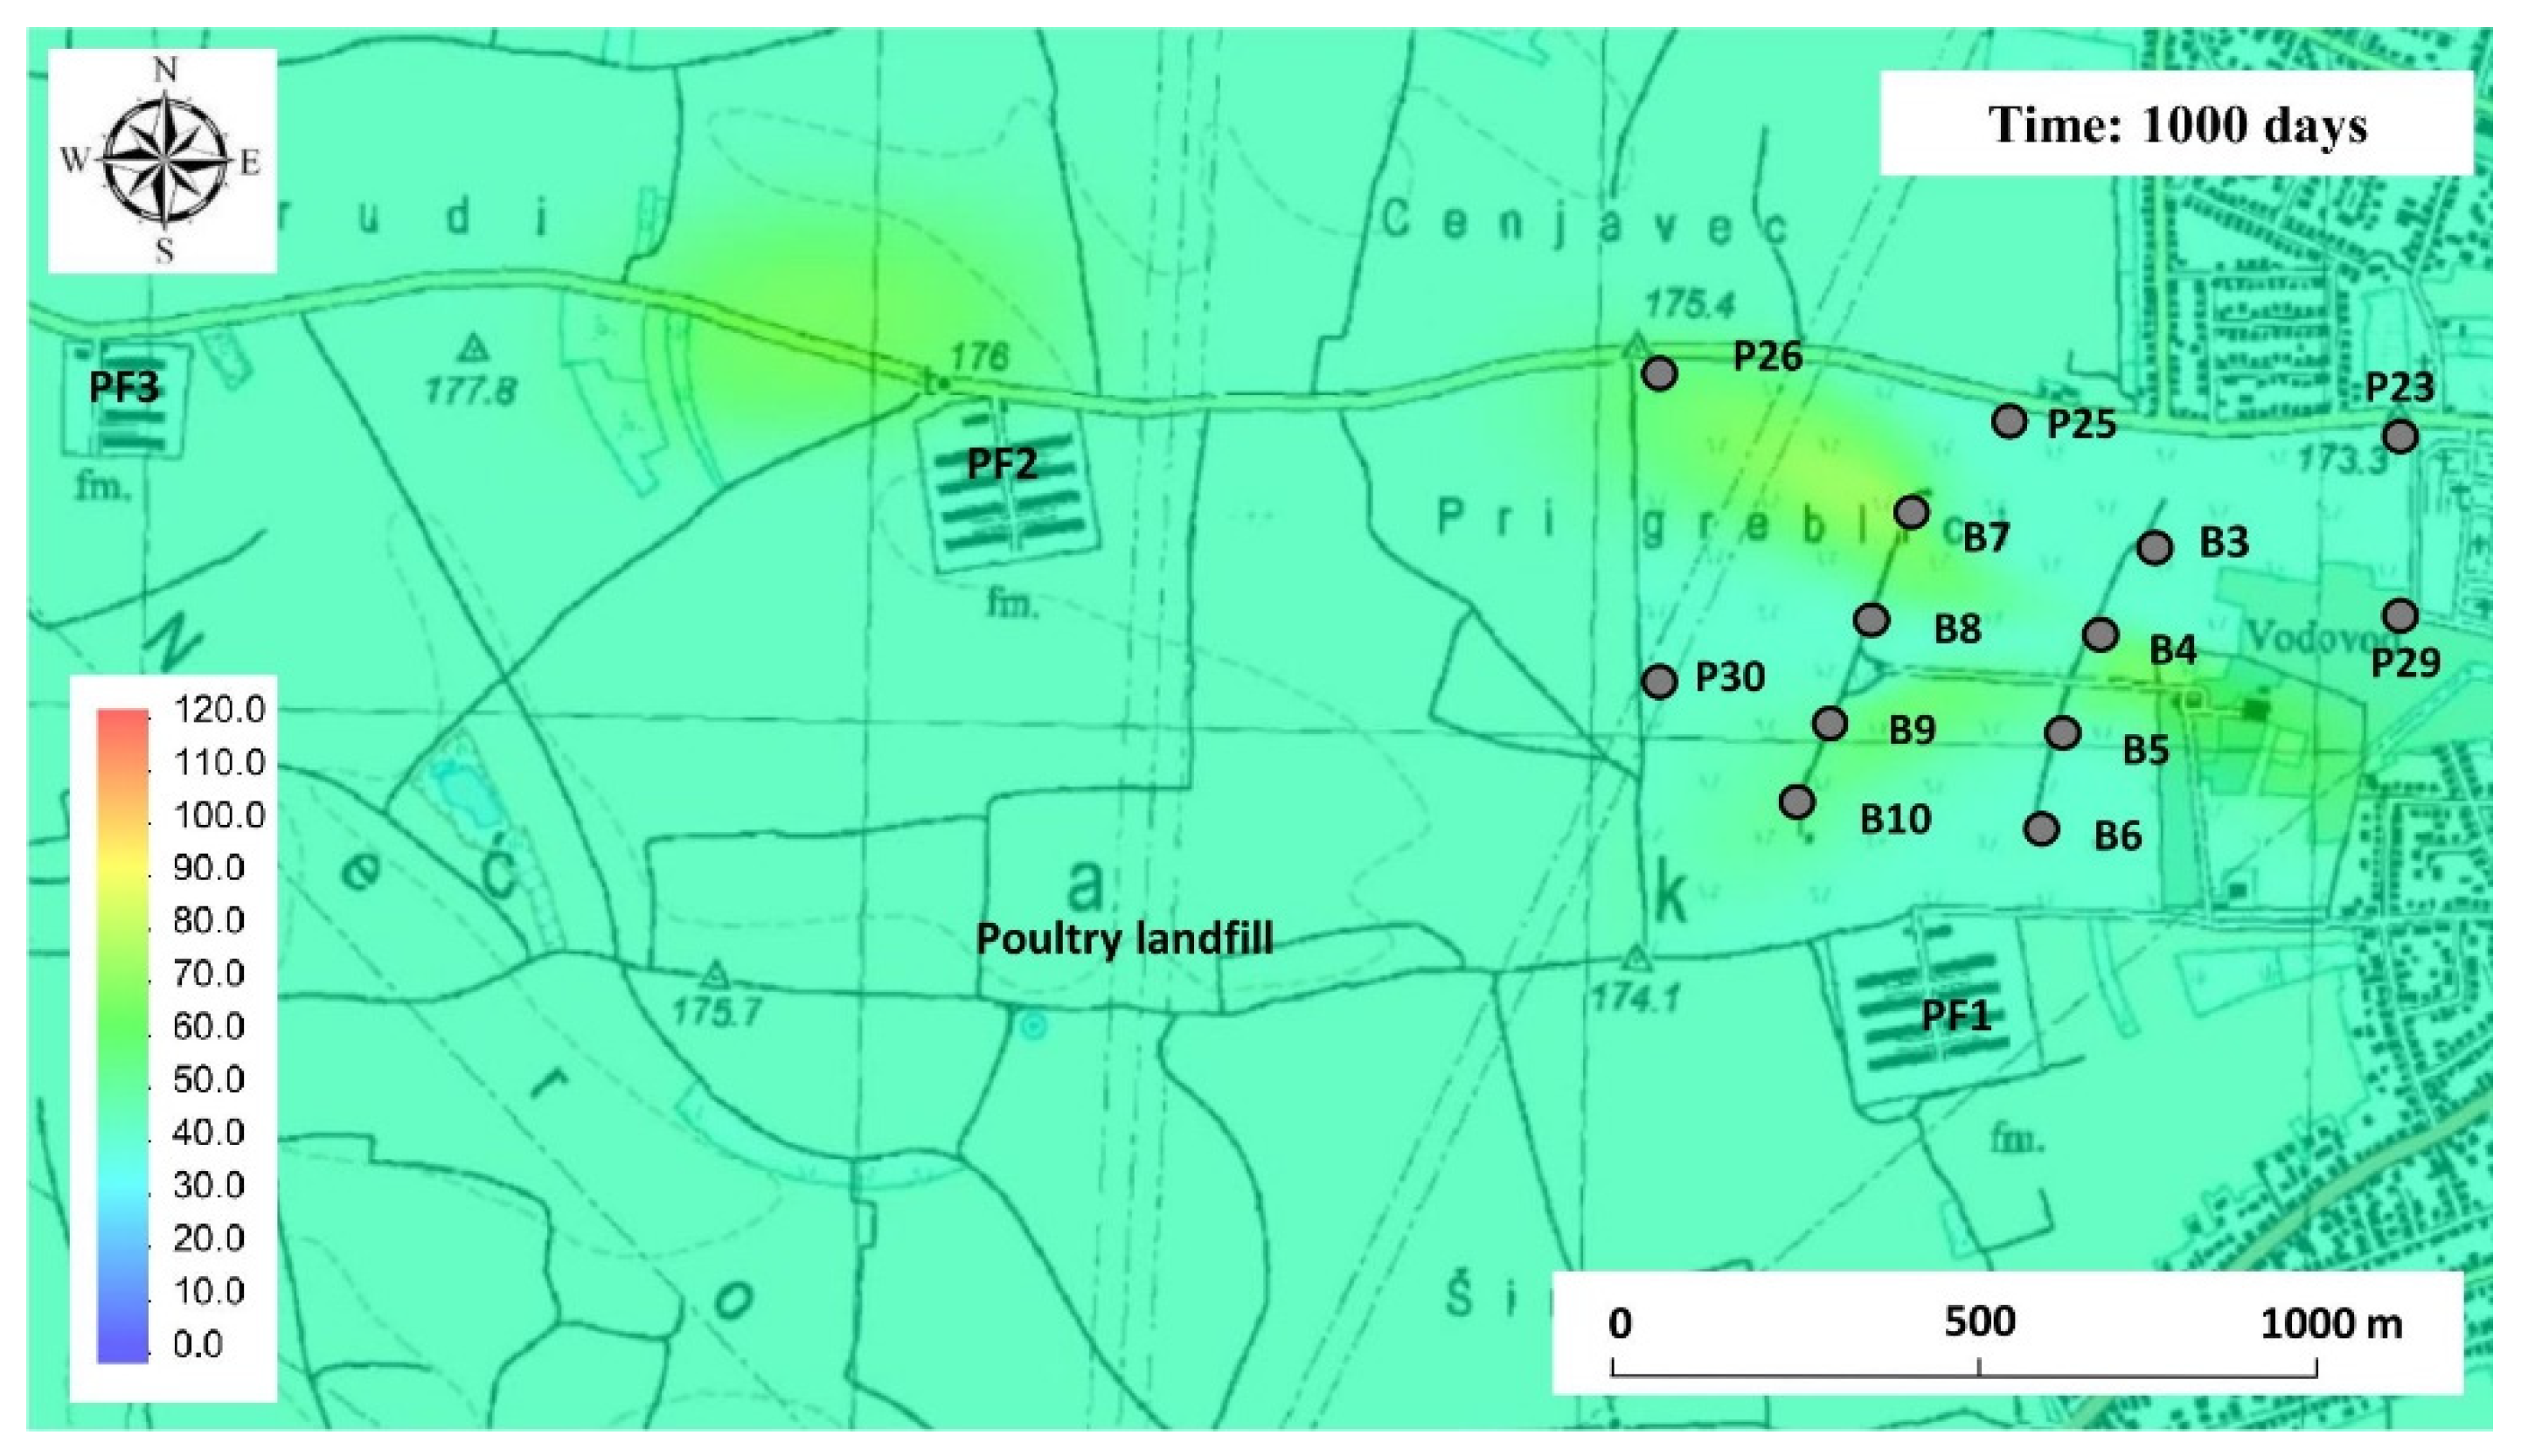
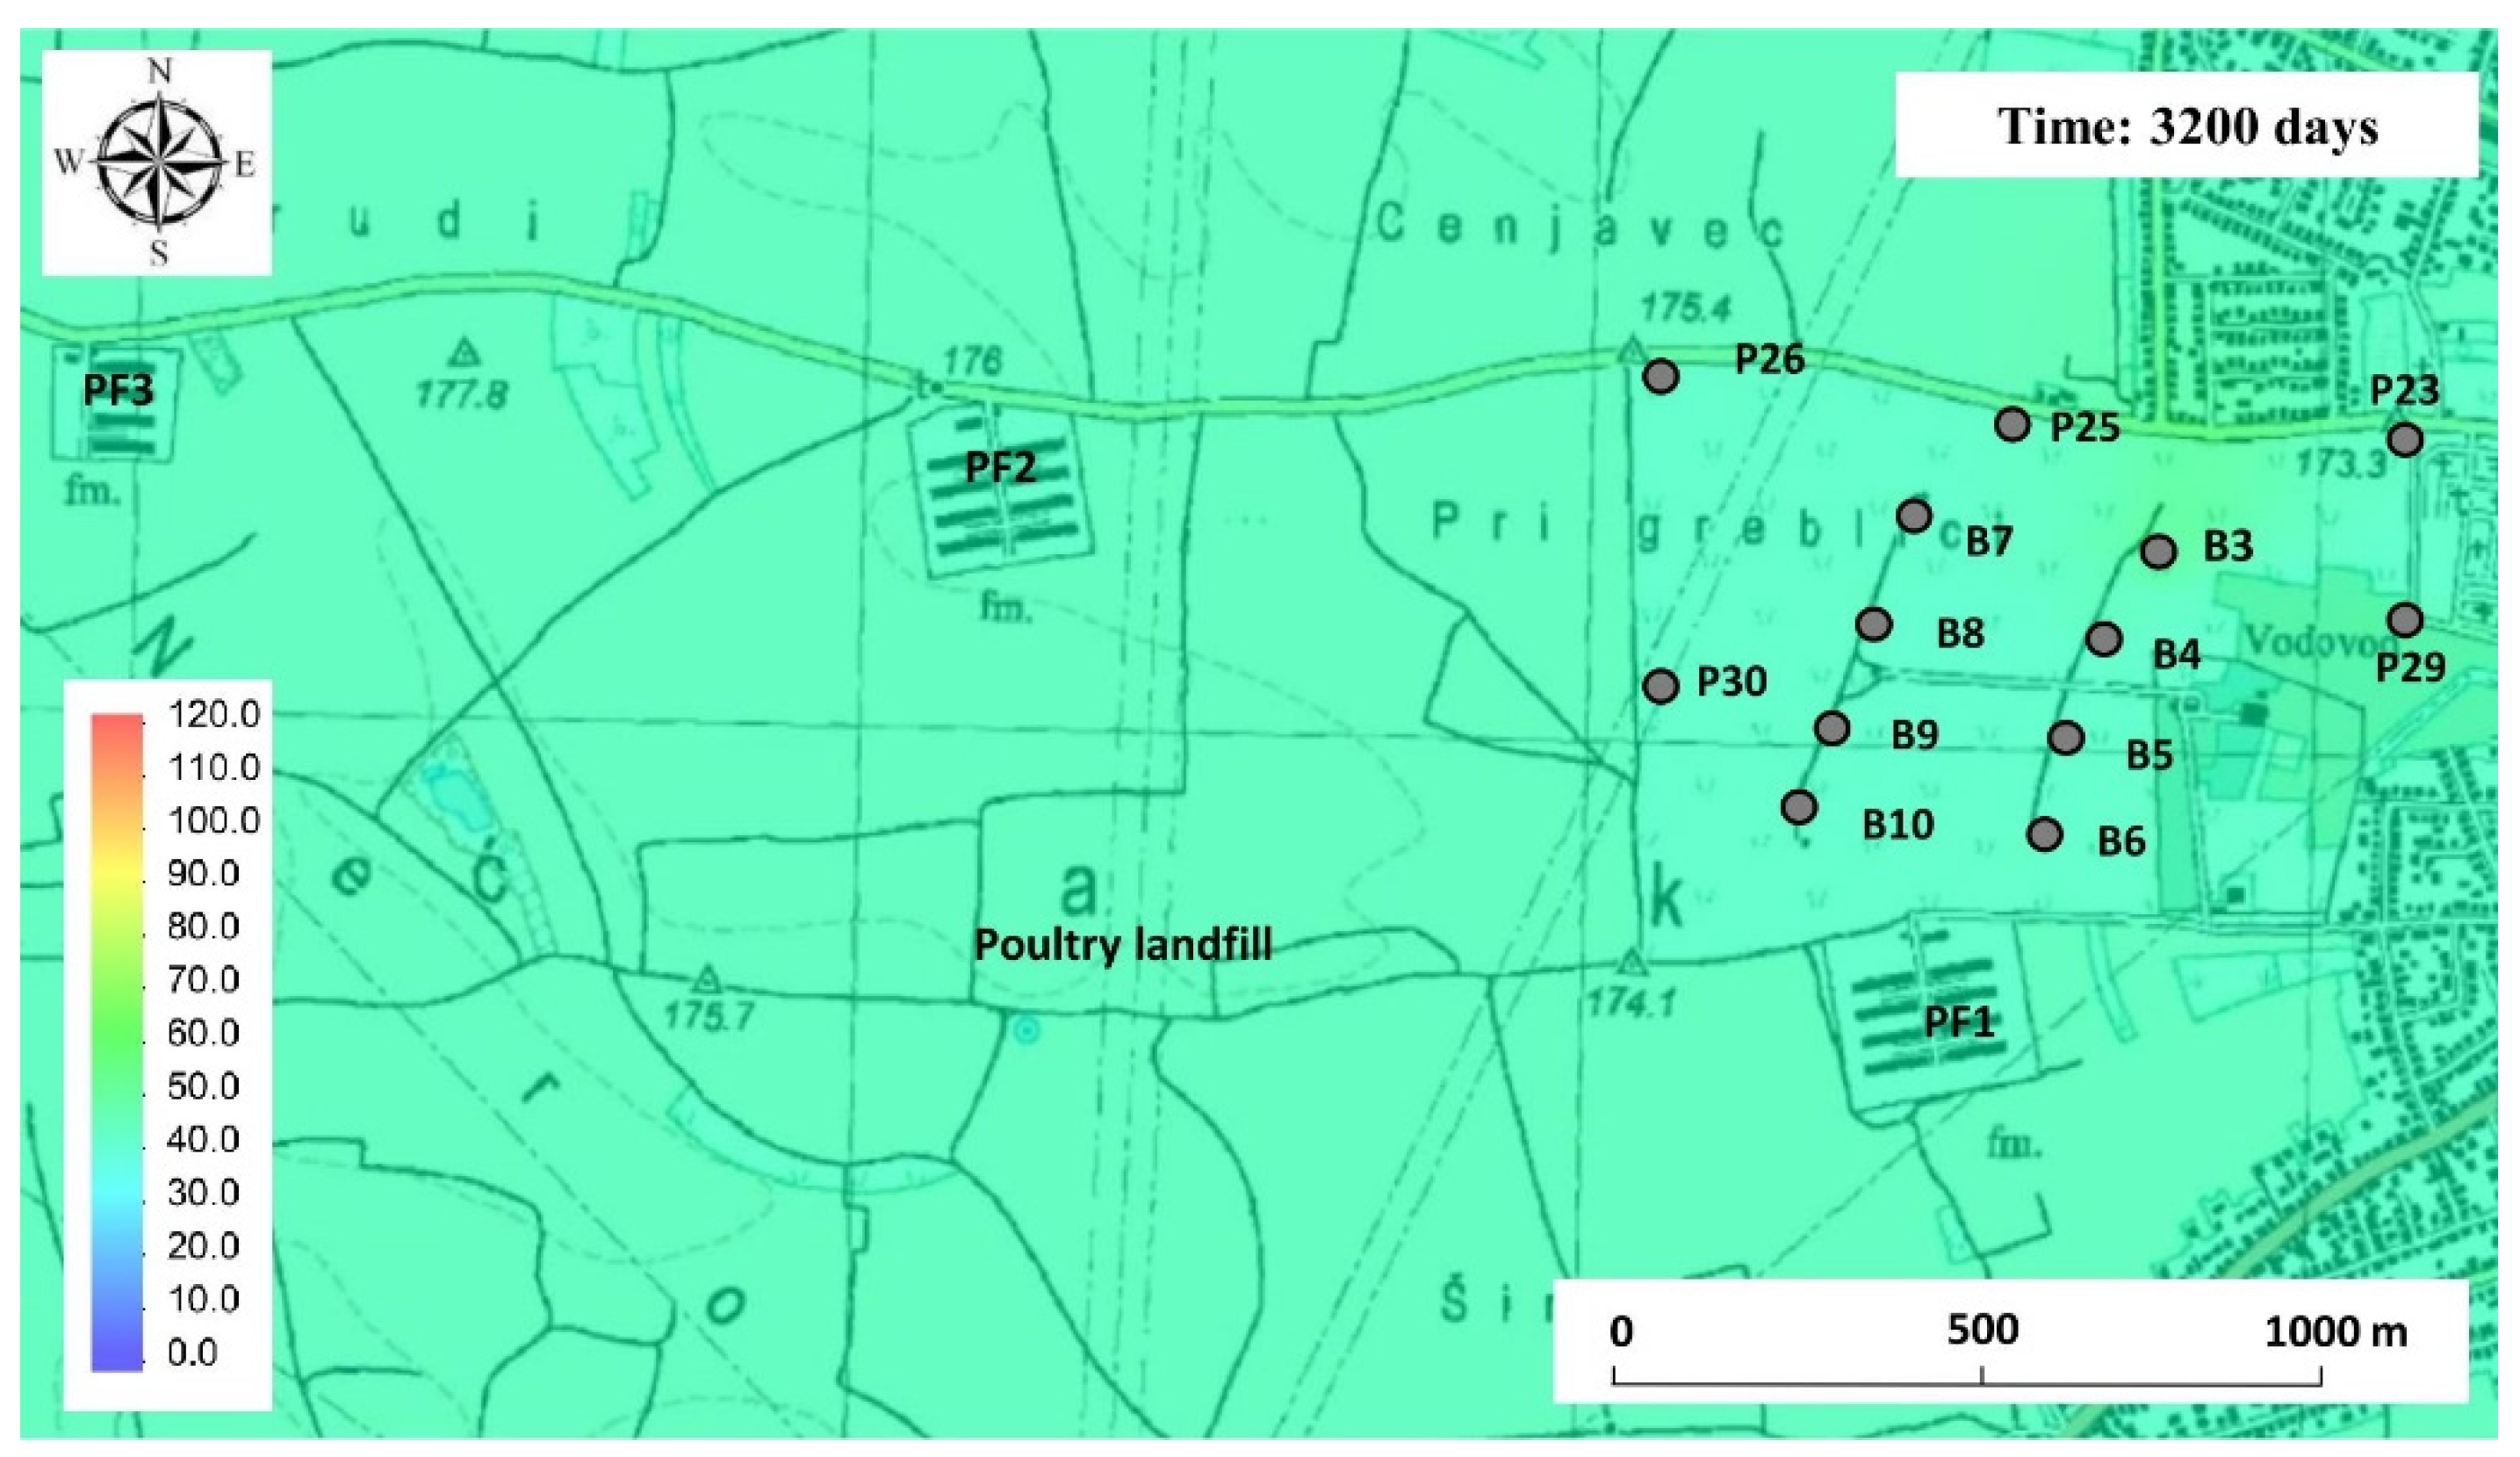
Figure 8 shows the state of the simulation after 100 days. The time required to lose the impact of the poultry landfill when that source would not be active is about 1000 days (Figure 9), while the time required to lose the impact of the furthest poultry farm in the northwestern part of the wellfield is estimated to 3200 days (Figure 10).
The results in this paper justify the presented approach and the methodology can be applied to the locations of other wellfields with high pollution concentration, as an effective method in locating and quantifying pollution sources. However, each wellfield should be approached individually in order to properly setup the research concept and determine the input parameters to obtain reliable results.
4. Conclusions
To determine the impact of the inflow zone of the Varaždin wellfield, a numerical model of groundwater flow was developed and a significant impact of pumping on groundwater flow was observed. In the wellfield influence zone, agricultural areas as non-point sources of nitrate pollution and poultry farms and a poultry landfill as point sources of pollution were located.
Considering the time of groundwater retention in the horizontal flow, it is concluded that the water protection zones are determined according to the applicable national regulations.
The conducted simulations show that it is crucial to locate all point sources of pollution in the vicinity of the wellfield, to obtain reliable quantification results because the absence of only one source significantly reduces the accuracy of the simulation. The results indicate that the largest point source of pollution is the poultry landfill, and a significant contribution is also made by poultry farms located in the inflow area. However, to finally confirm these results, additional extensive field measurements are still needed in terms of groundwater sampling in the immediate upstream and downstream areas of point sources of pollution.
In order to improve the quality of groundwater at the Varaždin wellfield, it is necessary to remove the poultry landfill and regulate the operation of poultry farms, which are located in the inflow zone, to release as little nitrate pollution as possible. If possible, a solution for relocating these facilities should be found in the long term period. Namely, although the protection zones are marked following the valid regulations, the results in this paper show that to improve groundwater quality at the location of Varaždin wellfield it is necessary to further protect the inflow zone and reduce the number of point anthropogenic pollution sources.
Author Contributions
Conceptualization, M.Š. and L.K.; methodology, M.Š. and I.K.; software, M.Š. and L.K.; validation, M.Š., R.B. and L.K.; formal analysis, I.K.; investigation, M.Š. and I.K.; resources, R.B.; data curation, M.Š. and I.K.; writing—original draft preparation, M.Š.; writing—review and editing, L.K., I.K. and R.B.; visualization, M.Š.; supervision, L.K. and R.B.; funding acquisition, L.K. All authors have read and agreed to the published version of the manuscript.
Funding
This work was supported by the Center for Advanced Computing and Modelling, University of Rijeka, EU project KLIMOD KK.05.1.1.02.0017 (Operativni program Konkurentnost i kohezija 2014–2020.) Faculty of Engineering, University of Rijeka, led by Lado Kranjcevic.
Institutional Review Board Statement
Not applicable.
Informed Consent Statement
Not applicable.
Data Availability Statement
The data presented in this study are available in this article. Additional data are available on request from the corresponding author.
Conflicts of Interest
The authors declare no conflict of interest.
References
- Kundzewicz, Z.W. Water resources for sustainable development. Hydrol. Sci. J. 1997, 42, 467–480. [Google Scholar] [CrossRef]
- Wendland, F.; Bergmann, S.; Eisele, M.; Gömann, H.; Herrmann, F.; Kreins, P.; Kunkel, R. Model-Based Analysis of Nitrate Concentration in the Leachate—The North Rhine-Westfalia Case Study, Germany. Water 2019, 12, 550. [Google Scholar] [CrossRef] [Green Version]
- Almasri, M.N.; Kaluarachchi, J.J. Modular neural network to predict the nitrate distribution in groundwater using the on ground nitrogen loading and recharge data. Environ. Model. Softw. 2005, 20, 851–871. [Google Scholar] [CrossRef]
- Donoso, G.; Cancino, J.; Magri, A. Effects of agricultural activities on water pollution with nitrate and pesticides in the central valley of Chile. Water Sci. Technol. 1999, 39, 49–60. [Google Scholar] [CrossRef]
- McLay, C.D.A.; Dragten, R.; Sparling, G.; Sevarajah, N. Predicting groundwater nitrate concentrations in a region of mixed agricultural land use: A comparison of three approaches. Environ. Pollut. 2001, 115, 191–204. [Google Scholar] [CrossRef]
- Hubrechts, L.; Feyen, J.; Patyn, J.; Bronders, J.; Refsgaard, A.; Basberg, L.; Larsen, O.; Vlieghe, C.; Buysee, M. Development of a groundwater abstraction modelling environment for drinking water supply. In Nitrate in Groundwater; Razowska-Jaworek, L., Sadurski, A., Eds.; Balkema: Leiden, The Netherlands, 2002; pp. 221–233. [Google Scholar]
- Sapek, A. Agricultural activities as a source of nitrate in groundwater. In Nitrate in Groundwater; Razowska-Jaworek, L., Sadurski, A., Eds.; Balkema: Leiden, The Netherlands, 2002; pp. 3–13. [Google Scholar]
- Stockmarr, J.; Nyegaard, P. Nitrate in Danish groundwater. In Nitrate in Groundwater; Razowska-Jaworek, L., Sadurski, A., Eds.; Balkema: Leiden, The Netherlands, 2002; pp. 187–199. [Google Scholar]
- Müller, L.; Behrendt, A.; Schindler, U. Structure aspects of the soil landscape and soil properties of two lowland sites in North-East Germany. Arch. Agron. Soil Sci. 2007, 50, 289–307. [Google Scholar] [CrossRef]
- Schmalz, B.; Tavares, F.; Fohrer, N. Assessment of nutrient entry pathways and dominating hydrological processes in lowland catchments. Adv. Geosci. Eur. Geosci. Union 2007, 11, 107–112. [Google Scholar] [CrossRef] [Green Version]
- Krause, S.; Bronstert, A.; Zehe, E. Ground water—Surface water interactions in a North German lowland floodplain—Implications for the river discharge dynamics and riparian water balance. J. Hydrol. 2007, 347, 404–417. [Google Scholar] [CrossRef]
- Sanches Perez, J.M.; Antiguedad, I.; Arrate, I.; Garcia-Linares, C.; Morell, I. The influence of nitrate leaching through unsaturated soil on groundwater pollution in an agricultural area of the Basque country: A case study. Sci. Total. Environ. 2003, 317, 173–187. [Google Scholar] [CrossRef] [Green Version]
- Dević, G.; Đorđević, D.; Sakan, S. Natural and anthropogenic factors affecting the groundwater quality in Serbia. Sci. Total Environ. 2014, 468–469, 933–942. [Google Scholar] [CrossRef] [PubMed]
- Reddy, A.G.S.; Kumar, K.N.; Rao, D.S.; Rao, S.S. Assessment of nitrate contamination due to groundwater pollution in north eastern part of Anantapur District. Environ. Monit. Assess. 2009, 148, 463–476. [Google Scholar] [CrossRef]
- Sărmăşan, C.; Drăghici, S.; Daina, L. Identification, communication and management of risks relating to drinking water pollution in Bihor County. Environ. Eng. Manag. J. 2008, 7, 769–774. [Google Scholar] [CrossRef]
- Council Directive 91/676/EEC of 12 December 1991 concerning the protection of waters against pollution caused by nitrate from agricultural sources. Off. J. 1991, 375, 1–8.
- Ordinance on Conformity Parameters and Analysis Methods, Monitoring and Water Safety Plans for Human Consumption; Official Gazette of the Republic of Croatia: Zagreb, Croatia, 2017; 125/2017.
- Regulation on the Water Quality Standard; Official Gazette of the Republic of Croatia: Zagreb, Croatia, 2013; 73/13, 151/14, 78/15, 61/16.
- Council Directive 98/83/EC of 3 November 1998 on the quality of water intended for human consumption. Off. J. 1998, 330, 32–54.
- Commission Directive 2015/1787 of 6th of October 2015 amending Annexes II and III to Council Directive 98/83/EC on the quality of water intended for human consumption. Available online: https://www.legislation.gov.uk/eudr/2015/1787/contents (accessed on 13 December 2021).
- Bear, J.; Cheng, A.H.-D. Modeling Groundwater Flow and Contaminant Transport; Springer: New York, NY, USA, 2010; 815p. [Google Scholar]
- Bordas, J.M. Modeling Groundwater Flow and Contaminant Transport in Fractured Aquifers. Ph.D. Thesis, Air Force Institute of Technology, Dayton, OH, USA, 2005; 106p. [Google Scholar]
- Lee, C.M.; Hamm, S.Y.; Yun, S.M.; Oh, J.E.; Kim, M.; Kim, H.K. Indication of Groundwater Contamination Using Acesulfame and Other Pollutants in a Rural Area of Korea. Water 2018, 10, 1731. [Google Scholar] [CrossRef] [Green Version]
- Wang, Z.; Zhao, X.; Xie, T.; Wen, N.; Yao, J. A Comprehensive Evaluation Model of Ammonia Pollution Trends in a Groundwater Source Area along a River in Residential Areas. Water 2021, 13, 1924. [Google Scholar] [CrossRef]
- Sieczka, A.; Bujakowski, F.; Falkowski, T.; Koda, E. Morphogenesis of a Floodplain as a Criterion for Assessing the Susceptibility to Water Pollution in an Agriculturally Rich Valley of a Lowland River. Water 2018, 10, 399. [Google Scholar] [CrossRef] [Green Version]
- Szymkiewicz, A.; Potrykus, D.; Jaworska-Szulc, B.; Gumuła-Kawęcka, A.; Pruszkowska-Caceres, M.; Dzierzbicka-Głowacka, L. Evaluation of the Influence of Farming Practices and Land Use on Groundwater Resources in a Coastal Multi-Aquifer System in Puck Region (Northern Poland). Water 2020, 12, 1042. [Google Scholar] [CrossRef] [Green Version]
- Hirata, R.; Cagnon, F.; Bernice, A.; Henrique Maldaner, C.; Galvão, P.; Marques, C.; Terada, R.; Varnier, C.; Cathryn Ryan, M.; Bertolo, R. Nitrate Contamination in Brazilian Urban Aquifers: A Tenacious Problem. Water 2020, 12, 2709. [Google Scholar] [CrossRef]
- Gjetvaj, G. Identification of the origin of nitrates in groundwater of the Varaždin region (Croatian title: Identifikacija porijekla nitrata u podzemnim vodama Varaždinske regije). Hrvat. Vode 1993, 1, 247–252. [Google Scholar]
- Kovač, I.; Kovačev-Marinčić, B.; Novotni-Horčička, N.; Mesec, J.; Vugrinec, J. Comparative analysis of nitrate concentrations in the upper and lower layers of the Varaždin aquifer (Croatian title: Komparativna analiza koncentracije nitrata u gornjem i donjem sloju Varaždinskog vodonosnika). Rad. Zavod Znan. Varaždin 2013, 28, 41–57. [Google Scholar] [CrossRef] [Green Version]
- Larva, O. Aquifer Vulnerability at Catchment Area of Varaždin Pumping Sites (Croatian title: Ranjivost Vodonosnika na Priljevnom Području Varaždinskih Crpilišta). Ph.D. Thesis, Faculty of Mining, Geology and Petroleum Engineering, University of Zagreb, Zagreb, Croatia, 2008; 198p. [Google Scholar]
- Novotni-Horčička, N.; Šrajbek, M.; Kovač, I. Nitrates in the Varaždin Regional Water Supply System (Croatian title: Nitrati u Regionalnom vodovodu Varaždin). Voda i javna vodoopskrba); Hrvatski zavod za javno zdravstvo: Baška, Croatia, 2010; pp. 123–131. [Google Scholar]
- Urumović, K. The quaternary aquifer complex in the Varaždin area (Croatian title: O kvartnom vodonosnom kompleksu u području Varaždina). Geološki Vjesn. 1971, 24, 109–118. [Google Scholar]
- Urumović, K.; Prelogović, E.; Hlevnjak, B.; Mayer, D. Hydrogeological relations of the Varaždin aquifer (Croatian title: Hidrogeološki odnosi varaždinskog vodonosnika). Geološki Vjesn. 1990, 43, 149–158. [Google Scholar]
- Langevin, C.D.; Hughes, J.D.; Banta, E.R.; Niswonger, R.G.; Panday, S.; Provost, A.M. Documentation for the MODFLOW 6 Groundwater Flow Model; U.S. Department of the Interior, U.S. Geological Survey: Reston, VA, USA, 2017; 197p. [Google Scholar]
- McDonald, M.G.; Harbaugh, A.W. A Modular Three-Dimensional Finite Difference Ground-Water Flow Model; Techniques of Water-Resources Investigations of the U.S. Geological Survey; Open-File Report 83-875; USGS: Reston, VA, USA, 1988; Book 6, Chapter A1. [Google Scholar]
- China Geological Survey. Handbook of Hydrogeology, 2nd ed.; Geological Publishing House: Beijing, China, 2012.
- Aravin, V.I.; Numerov, S.N. Theory of Motion of Liquids and Gases in Undeformable Porous Media; Gostekhizdat: Moscow, Russia, 1953; 616p. (In Russian) [Google Scholar]
- Chertousov, M.D. Hydraulics; Gosenergouzdat: Moscow, Russia, 1962; 630p. (In Russian) [Google Scholar]
- Zhai, Y.; Cao, X.; Jiang, Y.; Sun, K.; Hu, L.; Teng, Y.; Wang, J. Further discussion on the influence radius of a pumping well: A parameter with little scientific and practical significance that can easily be misleading. Water 2021, 13, 50. [Google Scholar] [CrossRef]
- Gjetvaj, G. Identification of Dispersiveness Parameters in Radial Flow (Croatian title: Identifikacija Parametara Disperzivnosti u Radijalnom Toku); Zbornik radova X; savjetovanja Jugoslavenskog društva za hidraulička istraživanja: Sarajevo, Yugoslavia, 1990; pp. 436–440. [Google Scholar]
- Coduto, D.P. Geotehnical Engineering: Priciples and Practices; Prentice Hall: Hoboken, NJ, USA, 1999; 759p. [Google Scholar]
- Lubczynski, M.; Roy, J. MRS contribution to hydrogeological system parametrization. Near Surf. Geophys. 2005, 131–139. [Google Scholar] [CrossRef]
- Patrčević, V. Hydrological Analysis of the Vertical Water Balance of Groundwater in the Area of River Alluvium (Croatian title: Hidrološka Analiza Vertikalne Vodne Bilance Podzemnih Voda na Prostoru Riječnog Aluvija). Ph.D. Thesis, Faculty of Civil Engineering, University of Zagreb, Zagreb, Croatia, 1995; 161p. [Google Scholar]
- Gardner, W.H. Methods of Soil Analysis: Part 1 Physical and Mineralogical Properties, Including Statistics of Measurement and Sampling, 9.1; American Society of Agronomy: Madison, WI, USA, 1965; pp. 82–127. [Google Scholar]
- Zheng, C.; Wang, P.P. MT3DMS—A modular Three-Dimensional Multispecies Transport Model for Simulation of Advection, Dispersion, and Chemical Reactions of Contaminants in Groundwater Systems; Contract Report for U.S. Army Corps of Engineers, SERDP 99, 239, Tuscalossa, Alabama; U.S. Army Corps of Engineers: Washington, DC, USA, 1999. [Google Scholar]
- Kovač, Z.; Nakić, Z.; Barešić, J.; Parlov, J. Nitrate origin in the Zagreb aquifer system. Geofluids 2018, 2018, 2789691. [Google Scholar] [CrossRef] [Green Version]
- Anderson, M.P. Movement of contaminants in groundwater: Groundwater transport-advection and dispersion. In Groundwater Contamination. Studies in Geophysics; National Academy Press: Washington, DC, USA, 1984; pp. 37–45. [Google Scholar]
- Mallants, D.; Marivoet, J.; Volckaert, G. Review of Recent Literature on the Dispersivity Parameter for Saturated and Fractured Porous Media; Technical Note 44; Dept. WiD, SCK-CEN: Mol, Belgium, 1998. [Google Scholar]
- Neuman, S.P. Universal scaling of hydraulic conductivities and dispersivities in geologic media. Water Resour. Res. 1990, 26, 1749–1758. [Google Scholar] [CrossRef]
- Gelhar, L.W.; Mantaglou, A.; Welty, C.; Rehfeldt, K.R. A Review of Field Scale Physical Solute Transport Processes in Unsaturated and Saturated Porous Media; EPRI Topicl Report EA-4190; Electric Power Research Institute: Palo Alto, CA, USA, 1985. [Google Scholar]
- Xu, M.J.; Eckstein, Y. Use of Weighted Least-Squares Method in Evaluation of the Relationship Between Dispersivity and Field Scale. Ground Water 1995, 33, 905–908. [Google Scholar] [CrossRef]
- Šrajbek, M.; Kovač, I.; Novotni-Horčička, N.; Kranjčević, L. Assessment of average contributions of point and diffuse pollution sources to nitrate concentration in groundwater by nonlinear regression. Environ. Eng. Manag. J. 2020, 19, 95–104. [Google Scholar] [CrossRef]
- Eberts, S.M.; Thomas, M.A.; Jagucki, M.L. Factors Affecting Public-Supply Well Vulnerability to Contamination: Understanding Observed Water Quality and Anticipating Future Water Quality; U.S. Department of the Interior, U.S. Geological Survey: Reston, VA, USA, 2013; 132p. [Google Scholar]
- Fileccia, A. Some simple procedures for the calculation of the influence radius and well head protection areas (theoretical approach and a field case for a water table aquifer in an alluvial plain). Ital. J. Groundw. 2015, AS14065, 007–023. [Google Scholar] [CrossRef]
- Bujakowski, F.; Ostrowski, P.; Sopel, Ł.; Zlotoszewska-Niedziałek, H. Connection between glacitectonic forms and groundwater flow in the Vistula River Valley. Landf. Anal. 2014, 26, 61–69. (In Polish) [Google Scholar] [CrossRef]
- Pollock, D.W. User Guide for MODPATH Version 6—A Particle-Tracking Model for MODFLOW; U.S. Department of the Interior, U.S. Geological Survey: Reston, VA, USA, 2012; 70p. [Google Scholar]
- Ordinance on the Conditions for Determining the Zone of Sanitary Protection of Wellfields, Official Gazette of the Republic of Croatia: Zagreb, Croatia, 2013; 47/13.
- Marković, T. Vulnerability Assessment of Unsaturated Zone by Geochemical Modelling (Croatian title: Određivanje Osjetljivosti Nesaturirane Zone Geokemijskim Modeliranjem). Ph.D. Thesis, Faculty of Mining, Geology and Petroleum Engineering, University of Zagreb, Zagreb, Croatia, 2007; 146p. [Google Scholar]
- Kranjčević, L.; Šrajbek, M.; Grbčić, L.; Čarija, Z. Analysis of well field nitrates pollution distribution in agricultural area. In Proceedings of the 29th DAAAM International Symposium, Zadar, Croatia, 24–27 October 2018; pp. 1053–1058. [Google Scholar]
Figure 1.
Geographical position of the the Bartolovec, Varaždin and Vinokovščak wellfields, the model area with groundwater equipotential lines calibrated on 20 March 2003 [30].
Figure 1.
Geographical position of the the Bartolovec, Varaždin and Vinokovščak wellfields, the model area with groundwater equipotential lines calibrated on 20 March 2003 [30].

Figure 2.
The 3D model of the study area with the representative hydrogeological cross-sections.

Figure 3.
Time series of nitrate concentration annual averages in groundwater at the Varaždin wellfield.
Figure 3.
Time series of nitrate concentration annual averages in groundwater at the Varaždin wellfield.

Figure 4.
Relation of input groundwater heads at the boundary and simulated values of groundwater levels in control points.
Figure 4.
Relation of input groundwater heads at the boundary and simulated values of groundwater levels in control points.

Figure 5.
Groundwater flow simulation.

Figure 6.
Comparison of measured and simulated values of nitrate concentrations at the control points.
Figure 6.
Comparison of measured and simulated values of nitrate concentrations at the control points.

Figure 7.
Nitrate pollution propagation.

Figure 8.
Nitrate pollution propagation by impulse initial conditions—100 days.

Figure 9.
Nitrate pollution propagation by impulse initial conditions—1000 days.

Figure 10.
Nitrate pollution propagation by impulse initial conditions—3200 days.


Table 1.
Arithmetic means of certain groundwater quality parameters at the observed wellfields in the period 1994–2003.
Table 1.
Arithmetic means of certain groundwater quality parameters at the observed wellfields in the period 1994–2003.
| Parameter | Unit | Varaždin | Bartolovec | Vinokovščak | MAC * |
|---|---|---|---|---|---|
| Nitrate | mg/L NO3− | 79.41 | 23.96 | 18.23 | 50 |
| Nitrites | mg/L NO2− | 0.00 | 0.00 | 0.00 | 0.5 |
| pH value | 7.45 | 7.40 | 7.41 | 6.5–9.5 | |
| KMnO4 consumption | mg/L O2 | 0.87 | 0.71 | 0.79 | 5 |
| Electro-conductivity | mS/cm | 585 | 560 | 550 | 2500 |
| Chlorides | mg/L Cl− | 17.64 | 23.74 | 14.51 | 250 |
| Amonium ion | mg/L NH4+ | 0.02 | 0.02 | 0.03 | 0.5 |
* MAC–Maximum Allowable Concentration.
Table 2.
Arithmetic means of nitrate concentration at control points and deviation values obtained by nitrate pollution propagation simulation.
Table 2.
Arithmetic means of nitrate concentration at control points and deviation values obtained by nitrate pollution propagation simulation.
| Well/Piezometer | (mg/L NO3−) | Δ | Δ2 |
|---|---|---|---|
| B3 | 74.14 | 5.18 | 26.83 |
| B4 | 75.35 | 0.98 | 0.96 |
| B5 | 76.70 | −3.08 | 9.49 |
| B6 | 80.04 | −0.08 | 0.01 |
| B7 | 76.71 | −0.60 | 0.36 |
| B8 | 81.42 | 5.34 | 28.52 |
| B9 | 85.92 | −0.67 | 0.45 |
| B10 | 87.80 | 0.39 | 0.15 |
| P23 | 65.03 | 3.18 | 10.11 |
| P25 | 71.67 | 0.40 | 0.16 |
| P26 | 77.40 | −0.18 | 0.03 |
| P29 | 68.62 | 0.44 | 0.19 |
| P30 | 87.00 | 0.47 | 0.22 |
| ∑Δ2 | 77.48 | ||
| 5.96 |
Table 3.
Estimated values of nitrate concentration in the area of point sources of pollution.
| Point Source of Pollution | Estimated Value of Nitrate Concentration (mg/L NO3−) |
|---|---|
| Poultry landfill | 114 |
| Poultry farm (PF1) | 80 |
| Poultry farm (PF2) | 86 |
| Poultry farm (PF3) | 87 |
Publisher’s Note: MDPI stays neutral with regard to jurisdictional claims in published maps and institutional affiliations. |
© 2022 by the authors. Licensee MDPI, Basel, Switzerland. This article is an open access article distributed under the terms and conditions of the Creative Commons Attribution (CC BY) license (https://creativecommons.org/licenses/by/4.0/).
Share and Cite
MDPI and ACS Style
Šrajbek, M.; Kranjčević, L.; Kovač, I.; Biondić, R. Groundwater Nitrate Pollution Sources Assessment for Contaminated Wellfield. Water 2022, 14, 255. https://doi.org/10.3390/w14020255
AMA Style
Šrajbek M, Kranjčević L, Kovač I, Biondić R. Groundwater Nitrate Pollution Sources Assessment for Contaminated Wellfield. Water. 2022; 14(2):255. https://doi.org/10.3390/w14020255
Chicago/Turabian StyleŠrajbek, Marko, Lado Kranjčević, Ivan Kovač, and Ranko Biondić. 2022. "Groundwater Nitrate Pollution Sources Assessment for Contaminated Wellfield" Water 14, no. 2: 255. https://doi.org/10.3390/w14020255
Note that from the first issue of 2016, this journal uses article numbers instead of page numbers. See further details here.