Article

Detecting the Quantitative Hydrological Response to Changes in Climate and Human Activities at Temporal and Spatial Scales in a Typical Gully Region of the Loess Plateau, China

1
School of Water and Environment, Chang’an University, Xi’an 710064, China
2
Key Laboratory of Subsurface Hydrology and Ecological Effects in Arid Region, Chang’an University, Ministry of Education, Xi’an 710064, China
3
College of Geological Engineering and Geomatics, Chang’an University, Xi’an 710064, China
4
State Key Laboratory Base of Eco-Hydraulic in Arid Area, Xi’an University of Technology, Xi’an 710048, China
*
Author to whom correspondence should be addressed.
Water 2022, 14(2), 257; https://doi.org/10.3390/w14020257
Submission received: 30 November 2021 / Revised: 8 January 2022 / Accepted: 13 January 2022 / Published: 16 January 2022

Abstract

:
This study examined the Chabagou River watershed in the gully region of the Loess Plateau in China’s Shaanxi Province, and was based on measured precipitation and runoff data in the basin over a 52-year period (1959–2010), land-use types, normalized difference vegetation index (NDVI), and other data. Statistical models and distributed hydrological models were used to explore the influences of climate change and human activity on the hydrological response and on the temporal and spatial evolution of the basin. It was found that precipitation and runoff in the gully region presented a downward trend during the 52-year period. Since the 1970s, the hydrological response to human activities has become the main source of regional hydrological evolution. Evapotranspiration from the large silt dam in the study area has increased. The depth of soil water decreased at first, then it increased by amount that exceeded the evaporation increase observed in the second and third change periods. The water and soil conservation measures had a beneficial effect on the ecology of the watershed. These results provide a reference for water resource management and soil and water conservation in the study area.

1. Introduction

In recent years, climate change and human activities have jointly driven the evolution of the hydrological system of the Loess Plateau in China [1,2]. As the intensity of the transformation of the natural environment by human activities in the area continues to increase, temporal and spatial changes in the hydrological processes are complex, and the direction in which these processes are evolving becomes increasingly uncertain [3]. Significant changes are evident in the hydrological processes of most river watersheds in the Loess Plateau [4]. The increase in temperature has accelerated the process of evapotranspiration in river basins and, in most of them, the excessive use of water due to human activities has significantly changed the distribution pattern of water resources [5,6]. Studies carried out in regions of the Loess Plateau have used different methods to investigate the trend of runoff changes in river basins and to analyze their source, and they have shown that human activities have gradually become the main driving factor of the evolution of the hydrological system in the most recent 30 years [7,8,9].
The availability of natural water resources in the Loess Plateau is seriously insufficient for such an important farming area. The river basin is ecologically fragile, and research on the attribution of runoff changes in the Plateau has attracted considerable attention. Many studies have quantitatively analyzed the factors driving runoff changes in river basins to explore trends over multiple years. The methods used can be divided into two main groups: empirical statistics and hydrological modelling. Different quantitative methods have different bases and structures; therefore, the study results may have a large degree of uncertainty [10,11,12].
The Loess Plateau (34–40° N, 103–114° E) is situated in the northern part of central China (Figure 1) and is known for its serious water erosion of the soil. Due to low vegetation coverage, frequent rainstorms and drastic land-use changes, this region has seen the most severe cases of soil and water loss in China [13]. Since the 1970s, a series of soil and conservation measures have been implemented in the Loess Plateau which changed the land use pattern [4,14,15].
As a consequence, soil erosion and water loss have been effectively controlled and the ecosystem has improved considerably [16]. Although soil and water conservation programs have successfully addressed the ecological and environmental problems of the region, they have also affected the runoff process of the river basin, complicating runoff changes [17,18]. As they are affected by unique climate change characteristics and high-intensity human activity, the changes in the hydrological process in this area are complex, both temporally and spatially. At present, research has shown that the quantitative results obtained using different methods with limited hydrological and meteorological data input varied in different regions of the Loess Plateau [19].
The Chabagou River Watershed is a gully area typical of the Loess Plateau, featuring heavy water and soil erosion, and to some extent represents the characteristics of the Loess Plateau in general. Since the 1950s, a series of water and soil conservation measures have been adopted (silt dams, terraces, afforestation, etc.), which have greatly changed the land-use pattern and effectively controlled the loss of water and soil in the Chabagou River Watershed [20]. Few scholars have studied the impact of the temporal and spatial distribution of silt dams on runoff and soil water in the Chabagou watershed. To better understand the impacts of climate change and human activities on runoff changes, the Chabagou River watershed was selected as the study area for the present study. The statistical model and the distributed hydrological model were exhaustively used to explore the hydrological response and spatiotemporal evolution characteristics of the region under the influence of climate change and human activities. The long-term influence of the large-scale silt dam on the hydrological processes of the river basin was quantitatively analyzed. The findings may provide a theoretical basis for the scientific management and sustainable utilization of water resources, and for soil conservation in a typical gully river basin on the Loess Plateau.

2. Study Area

The Chabagou River watershed (109°47′ E–110°03′ E, 37°38′ N–37°48′ N) is located in Shaanxi Province, Northwest China, and is a secondary tributary of the Wuding River system of the Yellow River. In this study, the Chabagou River watershed area extracted from a Digital Elevation Model (DEM) with a resolution of 30 m × 30 m provided by the Resources and Environmental Science Data Center, Chinese Academy of Sciences (http://www.resdc.cn, accessed on 24 September 2021) was 185 m2. The altitude of the research watershed varies between 894 and 1262 m above sea level (m a.s.l.) (Figure 1). This river watershed contains plateau ridges, ridges, hills and gully landforms with broken terrain and sparse vegetation, typical of the core area of the Loess Plateau in northern Shaanxi. The annual precipitation is confined to the June-October flood season, which consists mostly of heavy rainfalls of short duration. According to the available records, the annual average precipitation from 1959 to 2010 was 450 mm, with a precipitation runoff coefficient of about 10%. Annual average evaporation was 1228 mm, and the precipitation evaporation ratio was 0.37. The location, water system and meteorological stations in the study area are shown in Figure 1. Since the 1950s in this area, large-scale silt dams (storage capacity > (0.1)106 m3) were built in the region to prevent soil erosion. From 1965 to 1980, water and soil conservation measures (terraces, silt dams and sand-retaining dams) began to be constructed on a large scale. After 1980, the intensity of returning farmland to forest and grassland was gradually increased. By the beginning of this century, soil and water conservation measures had been effective. According to statistics reported in Mo, more than 500 silt dams had been built in the Chabagou River watershed by 2000 [21]. And the location of selected silt dams (storage capacity > (0.1) 106 m3) is shown in Figure 2. Table 1 shows basic information of five large silt dams (storage capacity of more than (0.5)106 m3).

3. Data and Research Methods

3.1. Data

Daily weather data (precipitation, temperature, hours of sunlight, wind speed, etc.) was recorded from 1959 to 2010 at 13 meteorological stations in the Chabagou River Watershed, and daily river runoff data was recorded at the Caoping Station, an export-controlled hydrological station. This information is available in the Yellow River Hydrological Yearbook and from the China Meteorological Data Service Centre (http://data.cma.cn, accessed on 10 September 2021). Remote sensing images with a spatial resolution of 30” (corresponding to about 1 km at the equator) were collected during 1980–2010. For six periods (1980, 1990, 1995, 2000, 2005, 2010) land-use type data and sorted long-sequence normalized difference vegetation index (NDVI) data were obtained from the Geospatial Data Cloud (http://www.gscloud.cn, accessed on 20 May 2021).

3.2. Research Methods

3.2.1. Determination of Baseline Period and Change Periods

Determining the appropriate baseline period and change periods is an important step to study the contribution rate of climate change and human activities to watershed runoff change. Commonly used techniques for assessing the abrupt change point include the Mann-Kendall test [22,23], the ordered clustering method [24], and cumulative anomaly method [12]. Thus, we employed the above three abrupt change methods to determine the baseline period and change periods in this study.

3.2.2. Trend Test Method

A stable and regular trend change was noted for the long-term evolution of the runoff system. There are many time series trend discrimination methods which have been widely used in the field of hydrology. Using a variety of trend judgment methods for comparison can improve the rationality of the conclusion. Guo et al. used five methods, such as Mann-Kendall test and Spearman rank correlation coefficient method, to analyze the trend of runoff in the Minjiang River Basin in China [25]. Lyu et al. used the Spearman rank correlation coefficient method and Mann-Kendall test to analyze the trend of hydrometeorological factors in Fenhe River Basin in China [26]. In this study, the Mann Kendall test trend test and Spearman rank correlation method [27] are used to analyze the temporal variation trend and significance of rainfall, runoff and temperature, and study the temporal variation characteristics of the watershed.

3.2.3. Hydrological Response Quantitative Method

The relative contribution rates of the influence of climate and of human activities to the change of runoff were calculated from three statistical models and a hydrological simulation model. Uncertainty analyses of the results of the four methods were carried out to explore their applicability in the complex environment of the Loess Plateau region, and the stable years indicated by the four methods in the study area were determined to obtain reliable results.

3.2.4. Quantitative Method of Hydrological Response Based on Statistical Modeling

The empirical statistical method examines the time-series changes of runoff by establishing the relationship between runoff and related meteorological variables. Its advantages are that the formula is simple and clear, and the amount of calculation is small. In this paper, three empirical statistical methods: slope change rate cumulant quantity (SCRCQ) [28], runoff reduction method [29], and Budyko-based methods [2]) were used to quantify the influencing factors of runoff change in the Chabagou River watershed.

Slope Change Rate Cumulant Quantity (SCRCQ)

In this approach, the sum of all the influencing factors of the variable is defined as 1, and relative changes of the variable value over a given time period are calculated from the ratio of the slope change of each influencing factor over time related to the slope change of runoff accumulated over the same period.
C P = 100   ×   [ ( S P 1 S P 2 ) | S P 2 | ] [ ( S R 1 S R 2 ) | S R 2 | ] ,
C T = 100   ×   [ ( S T 1 S T 2 ) | S T 2 | ] [ ( S R 1 S R 2 ) | S R 2 | ] ,
C H = 100     C P C T .
where SR2 and SR1 are the slopes of linear fitting equations for years and cumulative runoff depth (mm/a); SP2 and SP1 are the slopes of the linear fitting equations for years and accumulated precipitation (mm/a); ST2 and ST1 are the slopes of the linear fitting equations for years and accumulated temperature (mm/a); CP is the contribution rate of precipitation to runoff change (%); CT is the contribution rate of evaporation to runoff change (%); and CH is the contribution rate of human activities to runoff depth change (%).

Runoff Reduction Method

The principle of the runoff reduction method is to assume that the runoff depth R1 in the reference period is the mean value of the measured runoff depth in that period. The difference between the measured runoff depth R1 in the period affected by human activities and R1 in the reference period consists mainly of human activities and climate change. The contribution rate of climate change and human activities to the runoff depth is given by
η 1 = R 1   R 2 R 1     R 1 × 100 % ,
η 2 = R 1   R 2 R 1   R 1 × 100 % .
where R1 is the natural runoff depth in baseline period; R1 is the measured runoff depth after abrupt change; R2 is the simulated runoff depth after abrupt change; and η1 and η2 are respectively the contribution rate of human activities and climate change to runoff change.

Budyko-Based Methods

Budyko suggested that runoff changes may be assessed by long-term water and heat balance [30,31]. Gong et al. [32] used the improved expression of the Budyko equation proposed by Wang et al. [33] to explore the attribution of runoff changes in the Xiaoli River Watershed on the Loess Plateau:
E P =   1 + E P P ( 1 + E P P ) 2 4 ε (   2   ε ) E P P 2 ε ( 2     ε ) .
where E is the evaporation capacity; the Penman-Monteith equation recommended by the World Food and Agriculture Organization is the annual potential evaporation [34]; and P is the precipitation.
The parameter ε in the Budyko equation is calibrated from the hydrological series in the base period of the study area. The contribution of climate change and human activities to runoff change is:
Δ R h = P 2 ( E 2 P 2 E 2 P 2 ) ,
Δ R C = Δ R   Δ R h .
where P2 is the precipitation during the change period; E2 is the watershed evaporation due to climate change alone; E2 is the evaporation during the change period; ΔR is the total variation of runoff depth; ΔRh is the contribution of human activities to the variation of runoff depth; and ΔRC is the contribution of climate change to runoff depth change.

Quantitative Method of Hydrological Response Based on the GBHM

Hydrological simulation is a useful tool for quantifying the runoff response to climate and human activities. Yang et al. proposed a hydrological model for a river basin based on hillside hydrology (GBHM), in which the hillside is the basic unit [35,36]. It considers the influence of changes in the subsurface and the spatial distribution of rainfall on the hydrological response of the river basin, and uses an equation to express its runoff process as a “hillside-gully” system [37]. In the present study, the key parameters of the model were adjusted to better explore the extent to which human activities and climate factors cause changes in runoff in the study area and the impact of changes in the subsurface, and also to assess the effect of major soil and water conservation measures on the temporal and spatial changes of runoff in the region. Figure 3 shows the modified model. Here, the model parameters are vegetation, ground surface, soil water and river-related parameters [3]. The quantitative separation method of the model is as follows [38]:
H C M R   J M = C ,  
H M C   H M C = S ,  
( H M R   J M ) ( H M C   H M R ) = C ,
( H S   J S ) ( H M R   J M ) = H .
where JM is the simulated runoff in the baseline period; JS is the measured runoff in the baseline period; HMC is the simulated runoff due to human activities during the change period; HS is the measured runoff during the change period; C is the climate change effect on runoff; H is the human activities effect on runoff; S is meteorological variation effect on runoff.

3.3. Research Framework

Various methods were used in this study to analyze the trend and abrupt years of river basin runoff change, based on the long series of available meteorological and hydrological and subsurface change data. A statistical model and a distributed hydrological model were used to analyze the temporal and spatial hydrological responses of a river basin disturbed by climate change and human activities. The input data of the statistical models include daily precipitation data of the Chabagou River watershed rainfall station and daily temperature data and daily runoff data of Caoping hydrological station. The input data of the distributed hydrological model includes daily meteorological data (precipitation, temperature, evaporation, etc.), annual land use type data, annual NDVI data and DEM data in the Chabagou River watershed. Combined with subsurface data, the variation in subsurface conditions of runoff and confluence due to typical human activities such as soil and water conservation measures were studied. A GBHM was constructed to simulate changes of hydrological variables (runoff depth at different times, for example) and to quantitatively analyze the impact of the existing large silt dams on the hydrological process. Figure 4 shows the research framework.

4. Time-Series Changes of Hydro-Meteorological Elements in a River Watershed

4.1. Analysis and Stage Division of River Watershed Runoff Time Series Changes

The M-K mutation trend test method, the ordered clustering method, and the cumulative anomaly method were adopted in this study to compare and analyze the annual runoff sequence in the Chabagou River Watershed from 1959 to 2000. The mutation years calculated by the M-K method are 1960, 1966 and 2004, and calculated by the ordered clustering method are 1965 and 2000; calculated by the cumulative anomaly method, abrupt changes occurred in 1965, 1968 and 1997. Historical data shows that organization of water and soil conservation in the Chabagou River Watershed stagnated during the difficult three-year period from 1960 to 1962, only gradually recovering in 1964 when a period of concentrated construction of silt dams and terraces began. After 1978, the construction of the silt dam was basically complete. By 1998, the water and soil conservation and management of the Chabagou River Watershed had achieved results. Therefore, 1965, 1978 and 1997 were selected as the mutation years in the study area. Figure 5 is a runoff mutation test chart of the watershed; Table 2 lists the mutation test year determined by the three methods.

4.2. Trend

Spearman’s rank correlation coefficient method and the M-K mutation trend test were used to analyze the long-term trend and significance of runoff evolution. The precipitation and runoff depth in the watershed show a non-significant downward trend at a 5% level of significance. Temperature shows a significant upward trend at a 5% level of significance, consistent with the increasing trend of global temperature [39]. Table 3 shows the change trends detected for meteorological elements in the watershed.

5. Historical Land-Use Types and NDVI Changes

5.1. Land-Use Types

Silt dams have been constructed in the Chabagou River Watershed since the 1950s to control water and soil loss. After 1970, a series of water and soil conservation measures were introduced (terraces, afforestation and sand-deposition dams), which have had a major impact on types of land usage [14]. The present study analyzes the temporal and spatial changes of land-use types in the Chabagou River Watershed over many years (the data for land-use types in 1960 are from the Yellow River Hydrological Yearbook, and the data for land-use types from 1980 to 2000 are from six land-use maps). Table 4 shows that from 1980 to 2000, the area of grassland decreased by 0.21 km2, forest land decreased by 0.448 km2 and cultivated land increased by 0.51 km2. In the first 10 years from 1980, silt dams and farmland were built on a large scale in the Chabagou River Watershed. The focus on vegetation restoration and returning farmland to forest and grassland began during 1991–2000; overall, however, the areas of grassland and forest land continued to decrease. The most significant change is the land used in construction, which increased from 0.15 km2 in 1980 to 0.31 km2 in 2000. These figures illustrate that human activities continued to intensify convective impact and degrade forest and grassland by transferring them to land under cultivation and construction. However, during the 10 years from 2000 to 2010, 0.031 km2 of water area was generated, the area of grassland increased by 1.289 km2, and forested land increased by 0.298 km2. Construction land remained basically unchanged, and the area of cultivated land decreased significantly. Soil and water conservation measures such as returning farmland to forest and grassland have achieved remarkable results in the past 10 years, and the vegetation in the watershed has shown benign development.
It can be seen from Figure 6a that the construction land in the central and western parts of the watershed increased from 1980 to 2000, and concentrated forests and grasslands were converted into arable land in the central and eastern parts of the watershed. Land usage changed mainly in the middle and lower reaches of the river watershed; human activities are concentrated in those areas, and have had little impact on the upstream region. Figure 6b shows that the conversion of cultivated land to forest and grassland and the conversion of grassland to forest land occurred over the entire river watershed from 2000 to 2010, and many small-scale water areas appeared downstream. Land usage changed from the original local concentration to a variety of land types. The reason is that soil and water conservation measures have been carried out throughout the watershed, and diversified land types have developed. The upper reaches mostly show the conversion of cultivated land to forested land; the middle and lower reaches mostly show the conversion of cultivated land to grassland, indicating more effective water and soil conservation upstream.

5.2. NDVI Change Trend Analysis

The inter-annual variation of vegetation coverage was analyzed for long-sequence NDVI data from 1980 to 2010. Figure 7 shows that the NDVI of the river watershed in the second change period demonstrated a slight upward trend, and the NDVI in the third change period increased slightly. The NDVI has shown a clear growth trend. At this stage, soil and water conservation measures in the Chabagou River Watershed have had a significant effect, and vegetation coverage has increased rapidly. The NDVI was the lowest in 2000, at 22.1% and highest in 2007, at 40.7%. The size of vegetation coverage affects the strength of water conservation. Large vegetation coverage and strong water conservation are conducive to the formation of runoff.

6. Hydrological Response Attribution

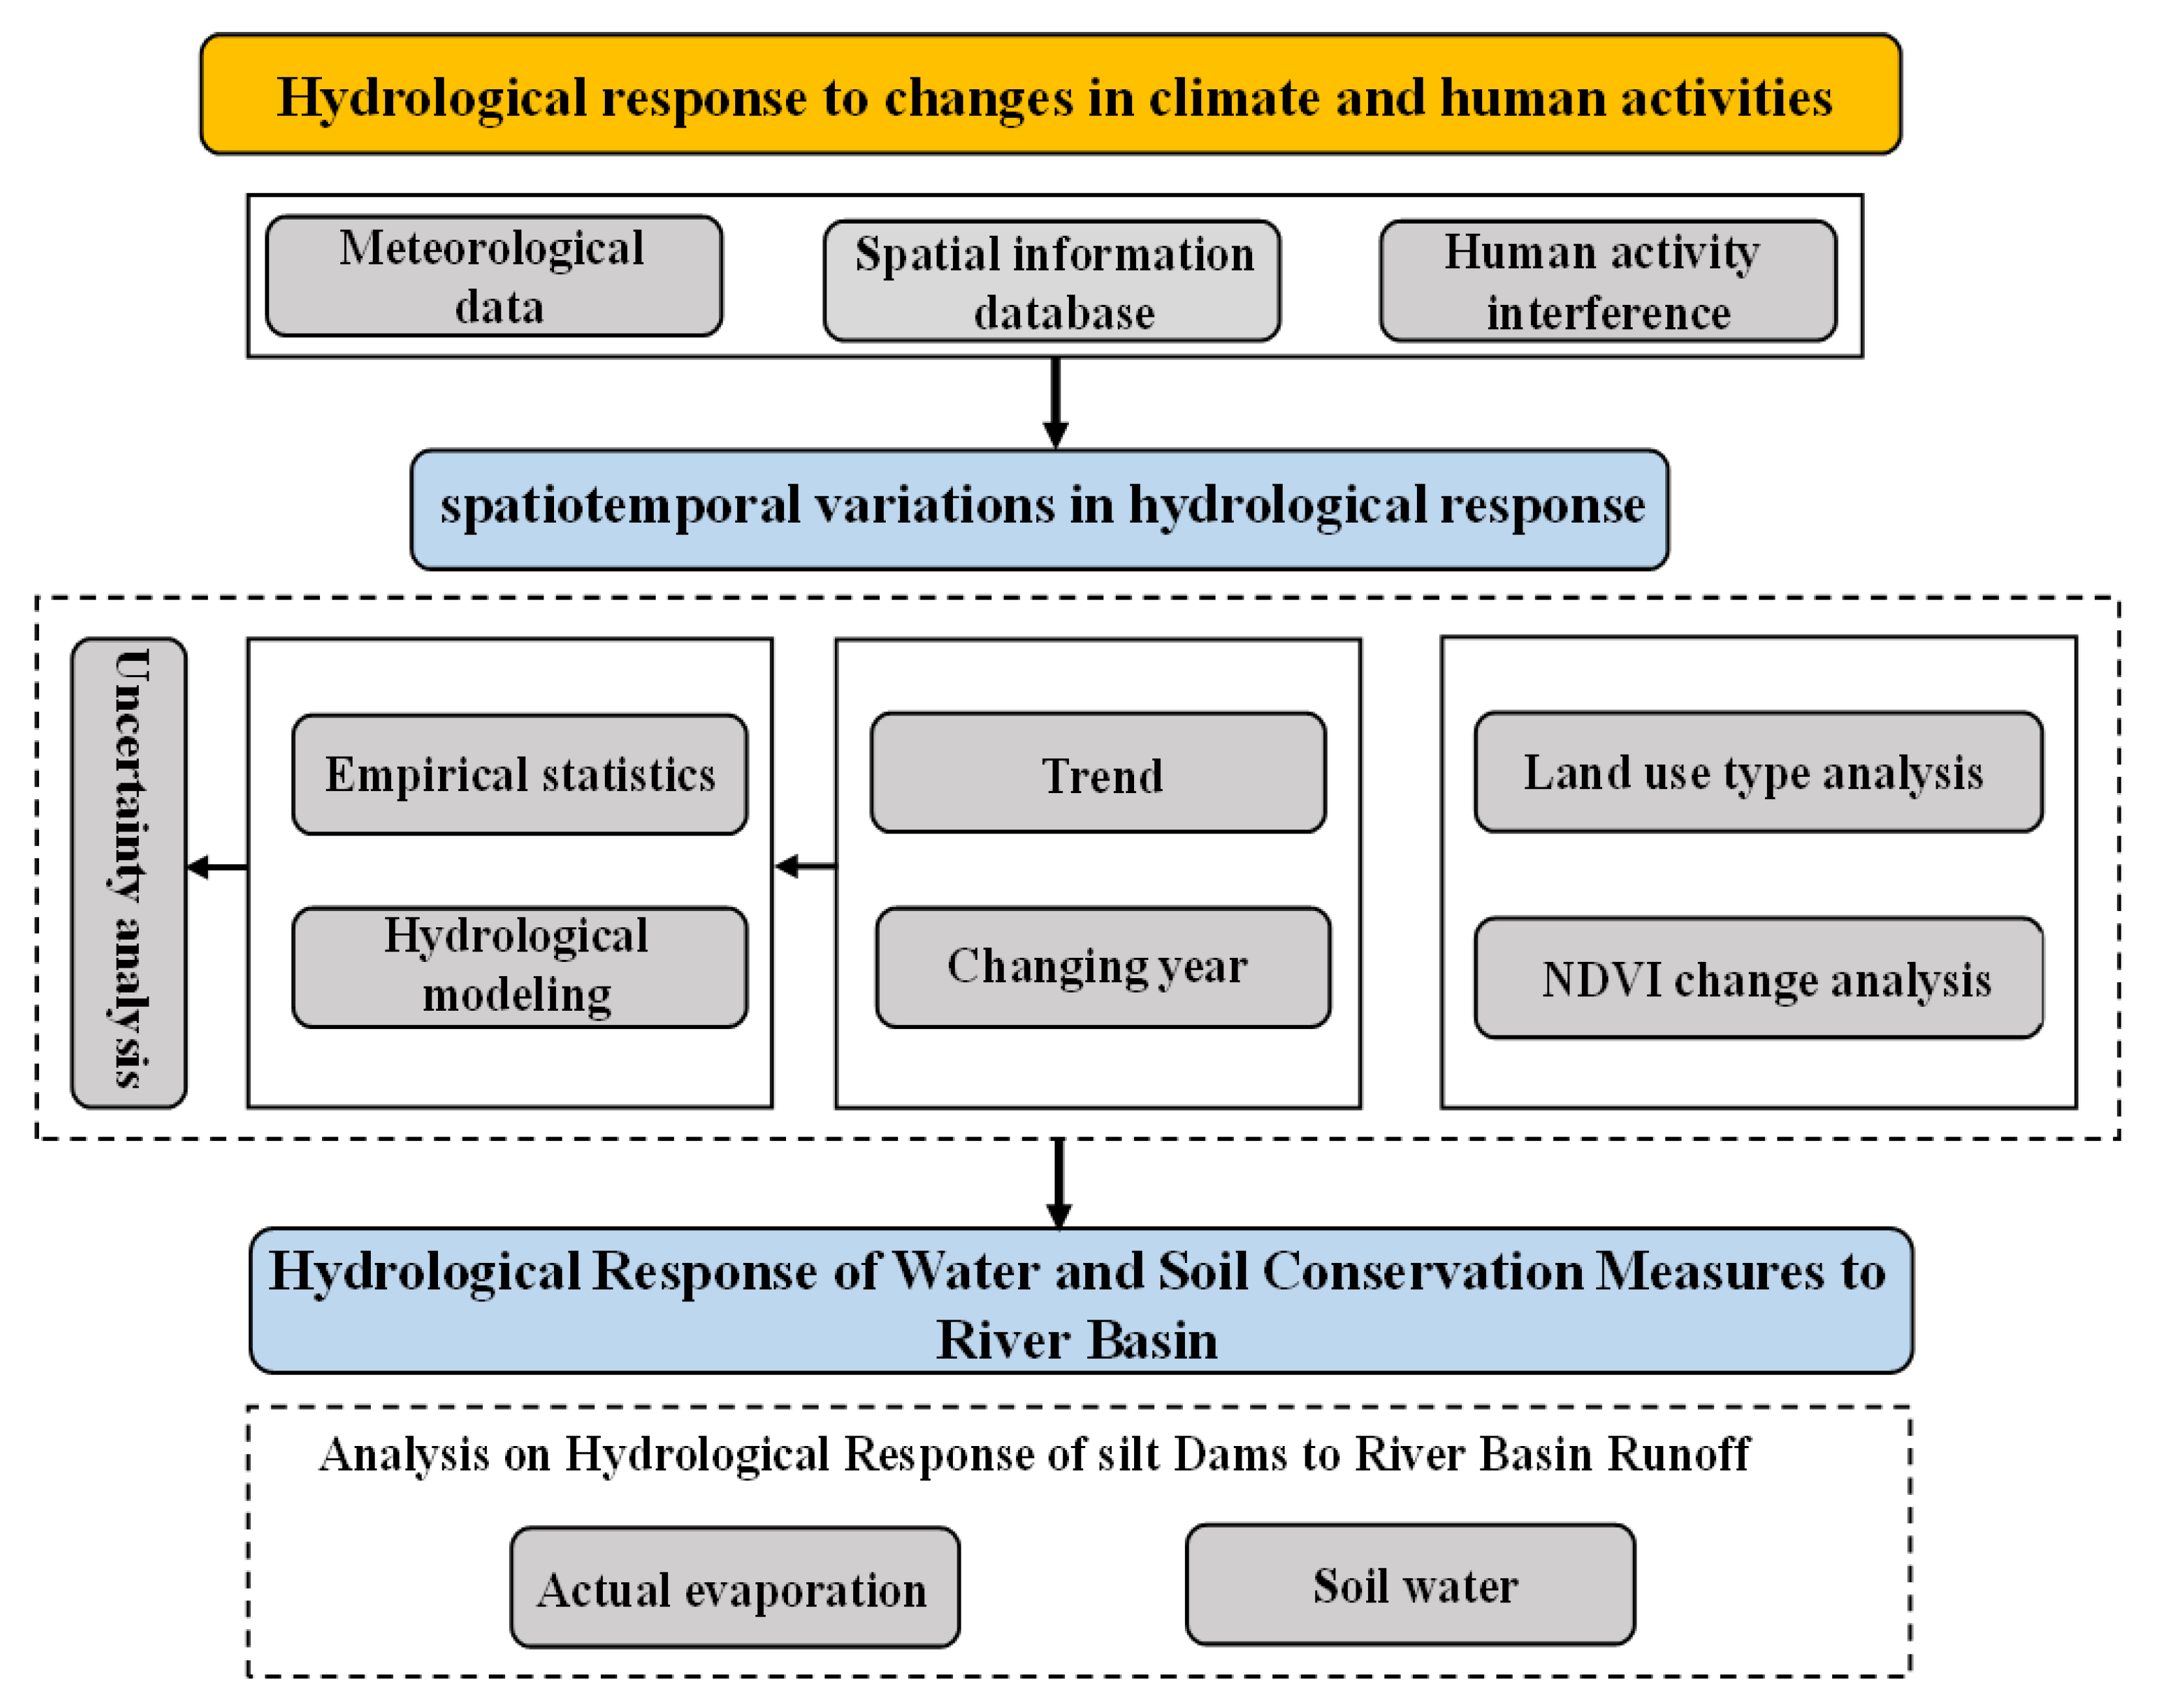
Quantitative results of hydrological responses were based on statistical models and distributed hydrological models. Uncertainty analysis of those responses and hydrological response evaluation for large-scale silt dams (storage capacity > (0.5)106 m3) were conducted for the GBHM.

6.1. Analysis of Results Based on Slope Change Rate Cumulant Quantity

Table 5 lists reduced runoff depths in the three change periods compared with the runoff depth in the baseline period. The runoff depth (17.21 mm) is the biggest decrease, occurring in the second change period. Precipitation decreased in the first and second change periods, and increased in the third period. The temperature decreased slightly in the first change period, and increased in the second and third change periods. The contribution rate of climate change (precipitation and temperature) and human activities to the change in runoff is shown in Table 6. The contribution rates of climate change and human activities to the reduction of runoff during the first change period were 80.23% and 19.77%, respectively; the contribution rates of climate change and human activities during the second change period were 30.30% and 69.69%, respectively; in the third change period, runoff reduction was mainly attributed to climate change (76.57%) compared with human activities (23.43%).

6.2. Analysis of Results Based on Runoff Reduction Method

The multiple change points in annual runoff depth in the Chabagou River Watershed were analyzed by fitting the precipitation and runoff time series in the baseline period, giving the regression equation Y = 0.1489 X · ( 4.6421 ) . The simulated runoff depths for the three change periods were calculated from the regression equation, and the amount of influence of human activities and climate change were calculated by the runoff reduction method, resulting in 53.92% for human activity and 46.08% for climate change. In the second change period the contribution rates of climate change and human activities were 28.69% and 71.31%, respectively, and 35.72% and 64.28% in the third change period.
Of the two change periods, human activities initially had the greater effect on runoff depth, followed by a lesser effect. The measured runoff depths during the change period were less than the natural runoff depth in the baseline period, to varying degrees. This trend indicates that the decrease in runoff depth was due to human activities and climate change. Human activities in the second and third change periods became the main factor for runoff changes. Table 7 shows the contribution rates to runoff reduction.

6.3. Analysis of Results Based on Budyko Method

The Budyko equation derived from the similarity assumption based on Wang et al. [33] was adopted as a reference. After calibration, the subsurface parameter in this study was found to be ε = 1.47. Figure 8 shows the attribution analysis results of runoff changes. Table 8 shows that the contribution rates of climate change and human activities to runoff changes in the watershed during the first change period were 48.86% and 51.14%; the contributions were 45.35% and 54.65% in the second change period, and 48% and 52% overall, respectively. Human activities contributed more than climate change to runoff changes for the three change periods. Human activities in the second change period contributed most to runoff.

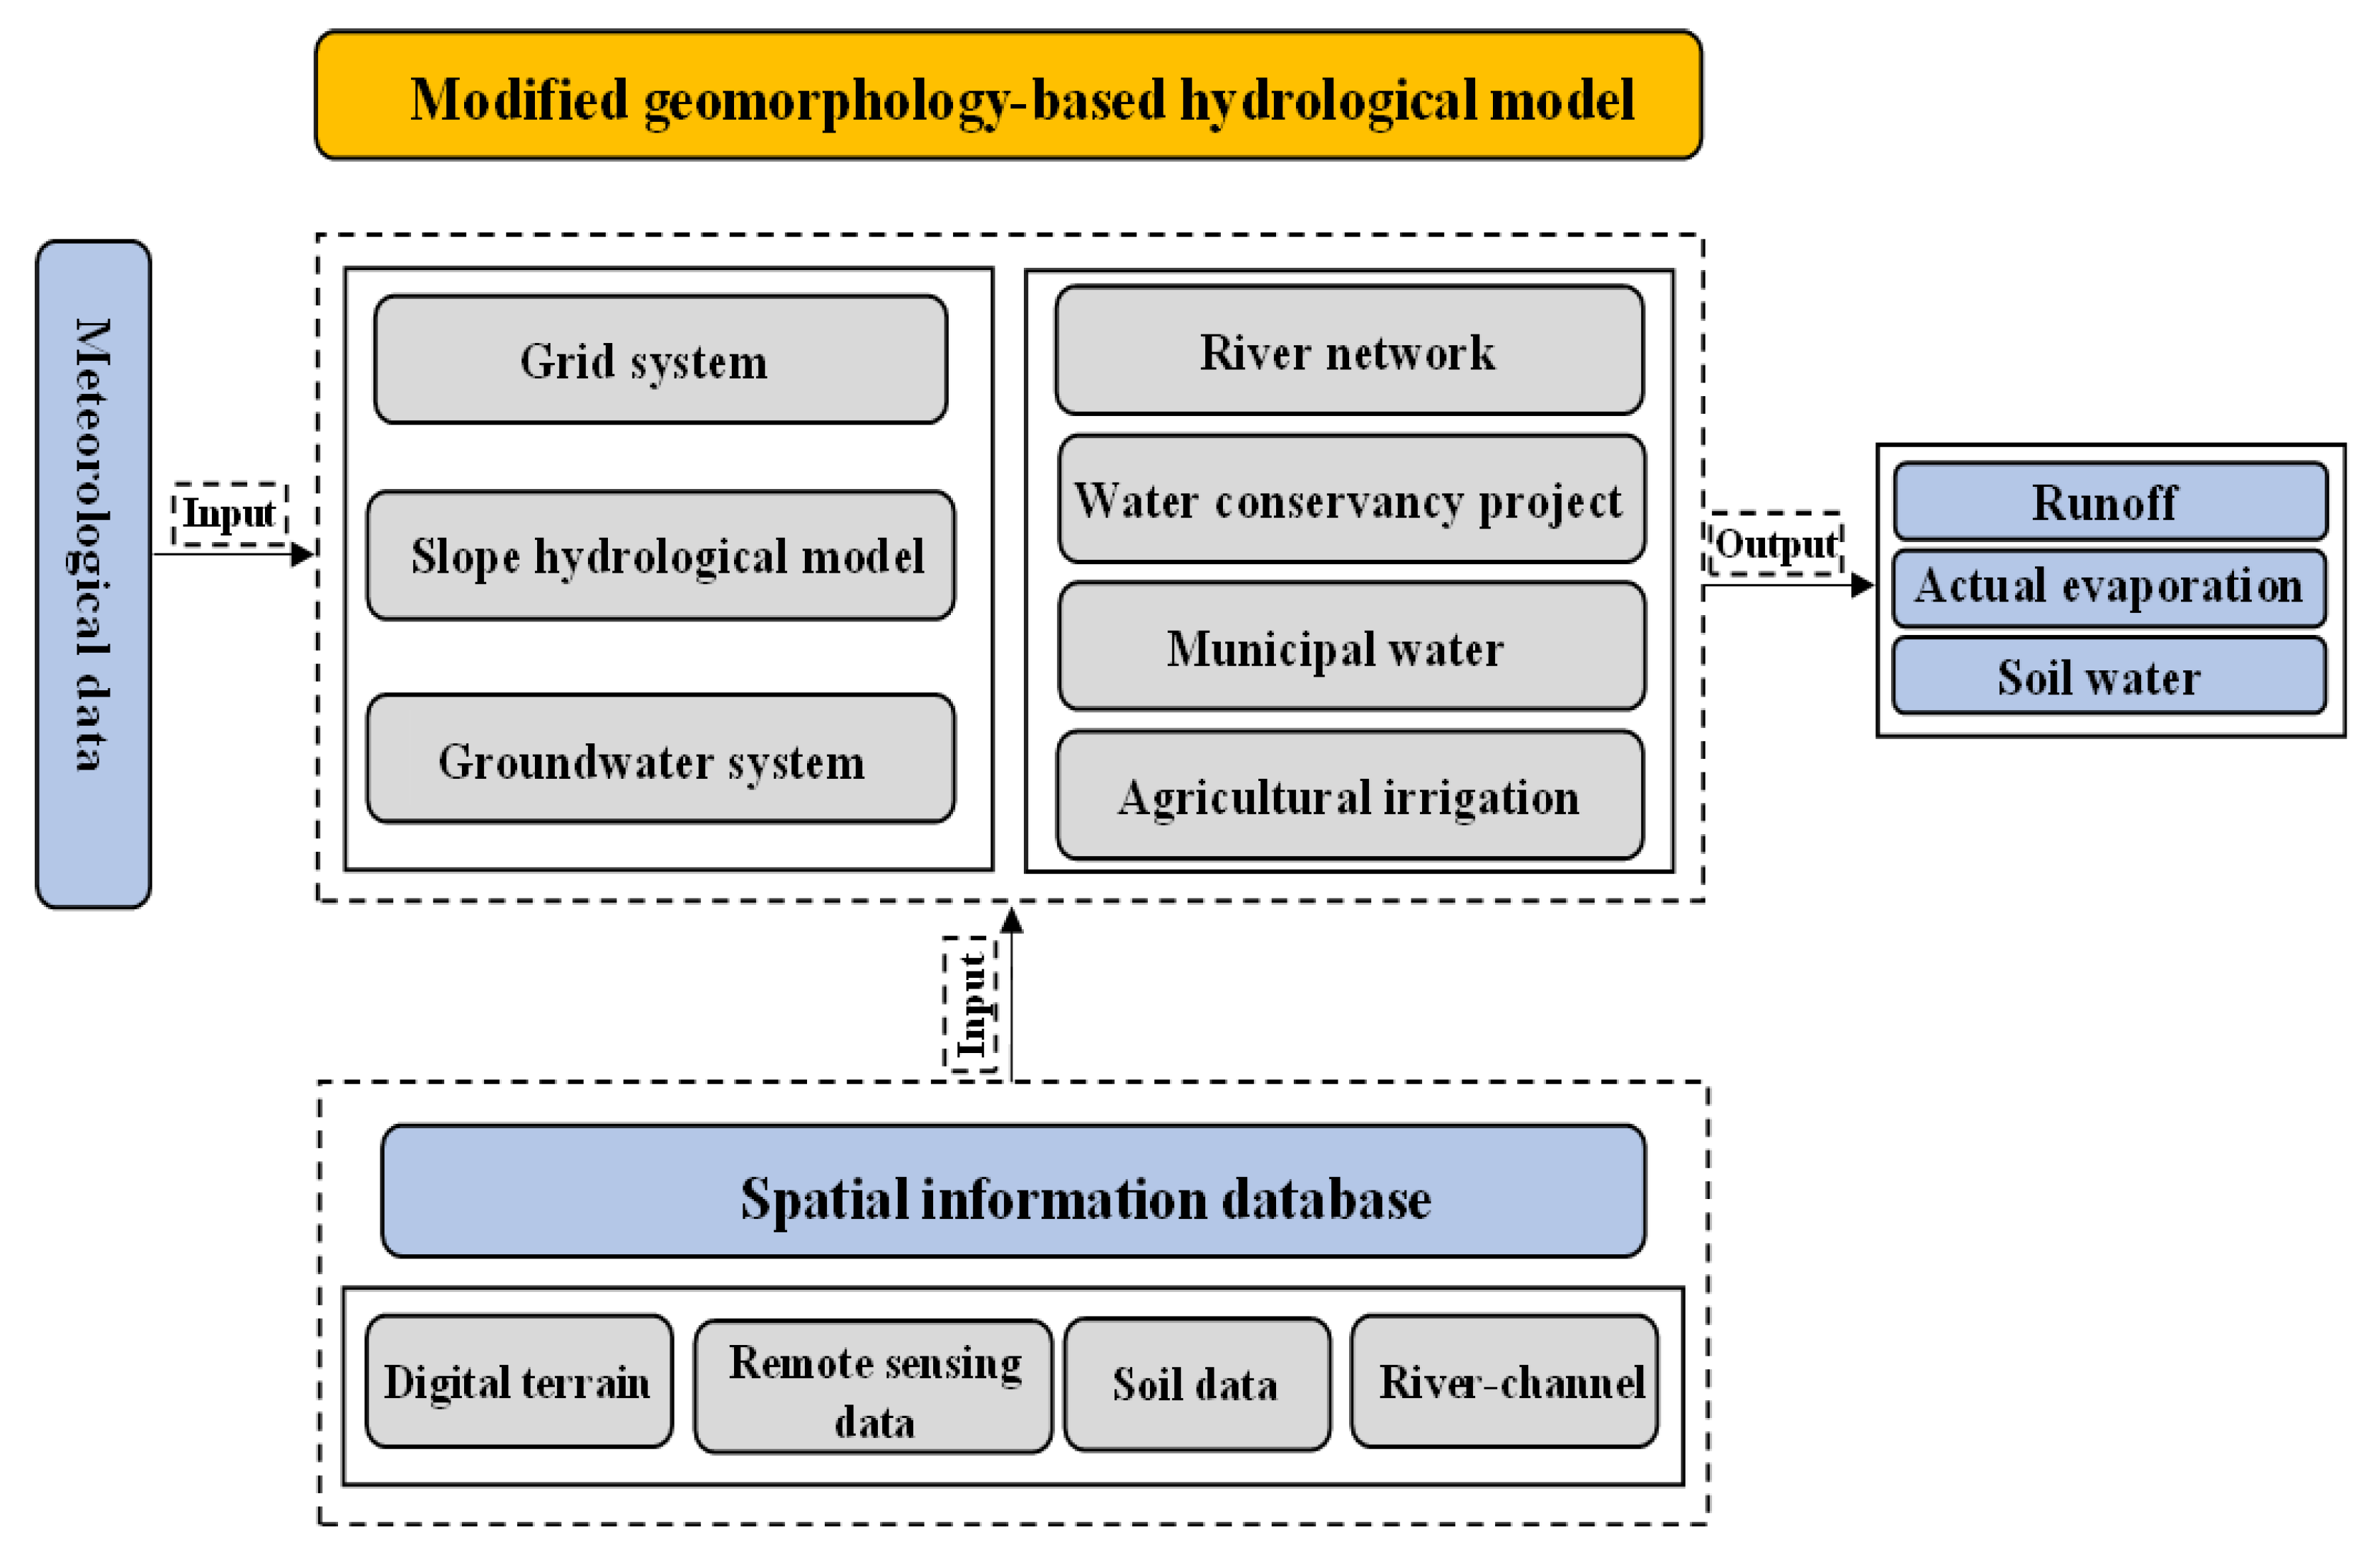
6.4. River Watershed Hydrological Response Simulation Based on the GBHM

In 
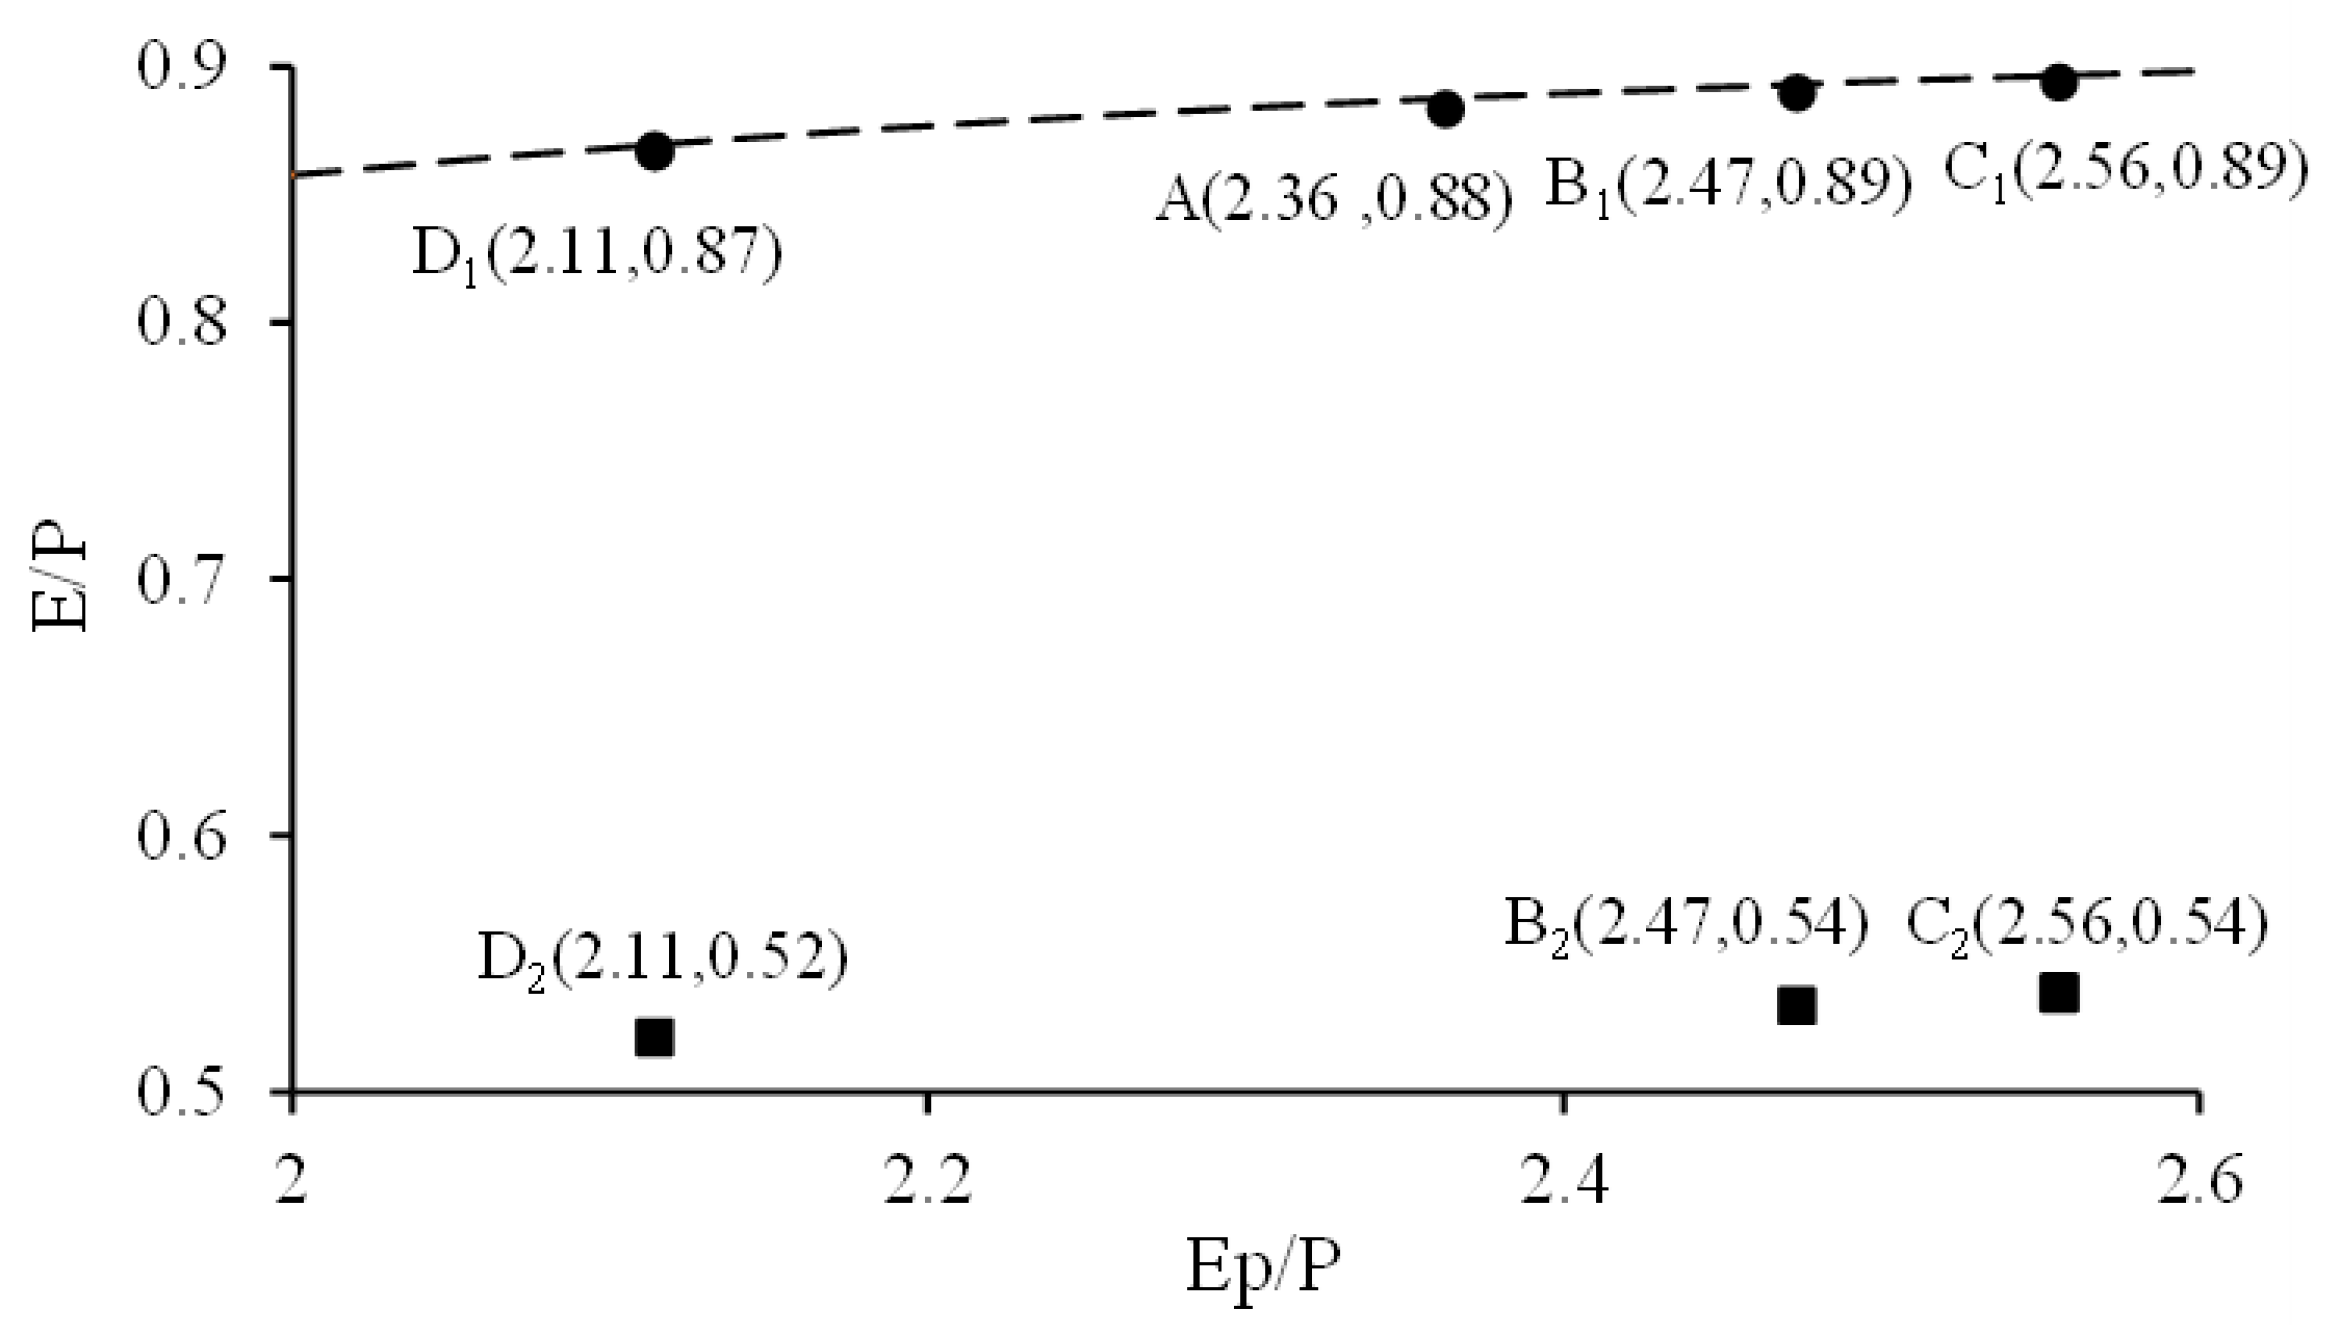
Table 9 it is seen that the ratio of potential evaporation to precipitation first increased and then decreased. The maximum value of 3.87 appeared in the second change period; the actual evaporation to precipitation ratio appears to be erratic, and the maximum value occurred in the third change period. Graphs of runoff depth and soil water are trough-like throughout the entire hydrological sequence, which first decreases and then increases. A graph of the ratio of soil water to precipitation appears as a valley; a graph of runoff depth to precipitation ratio appears as a peak, with the maximum appearing in the first period.
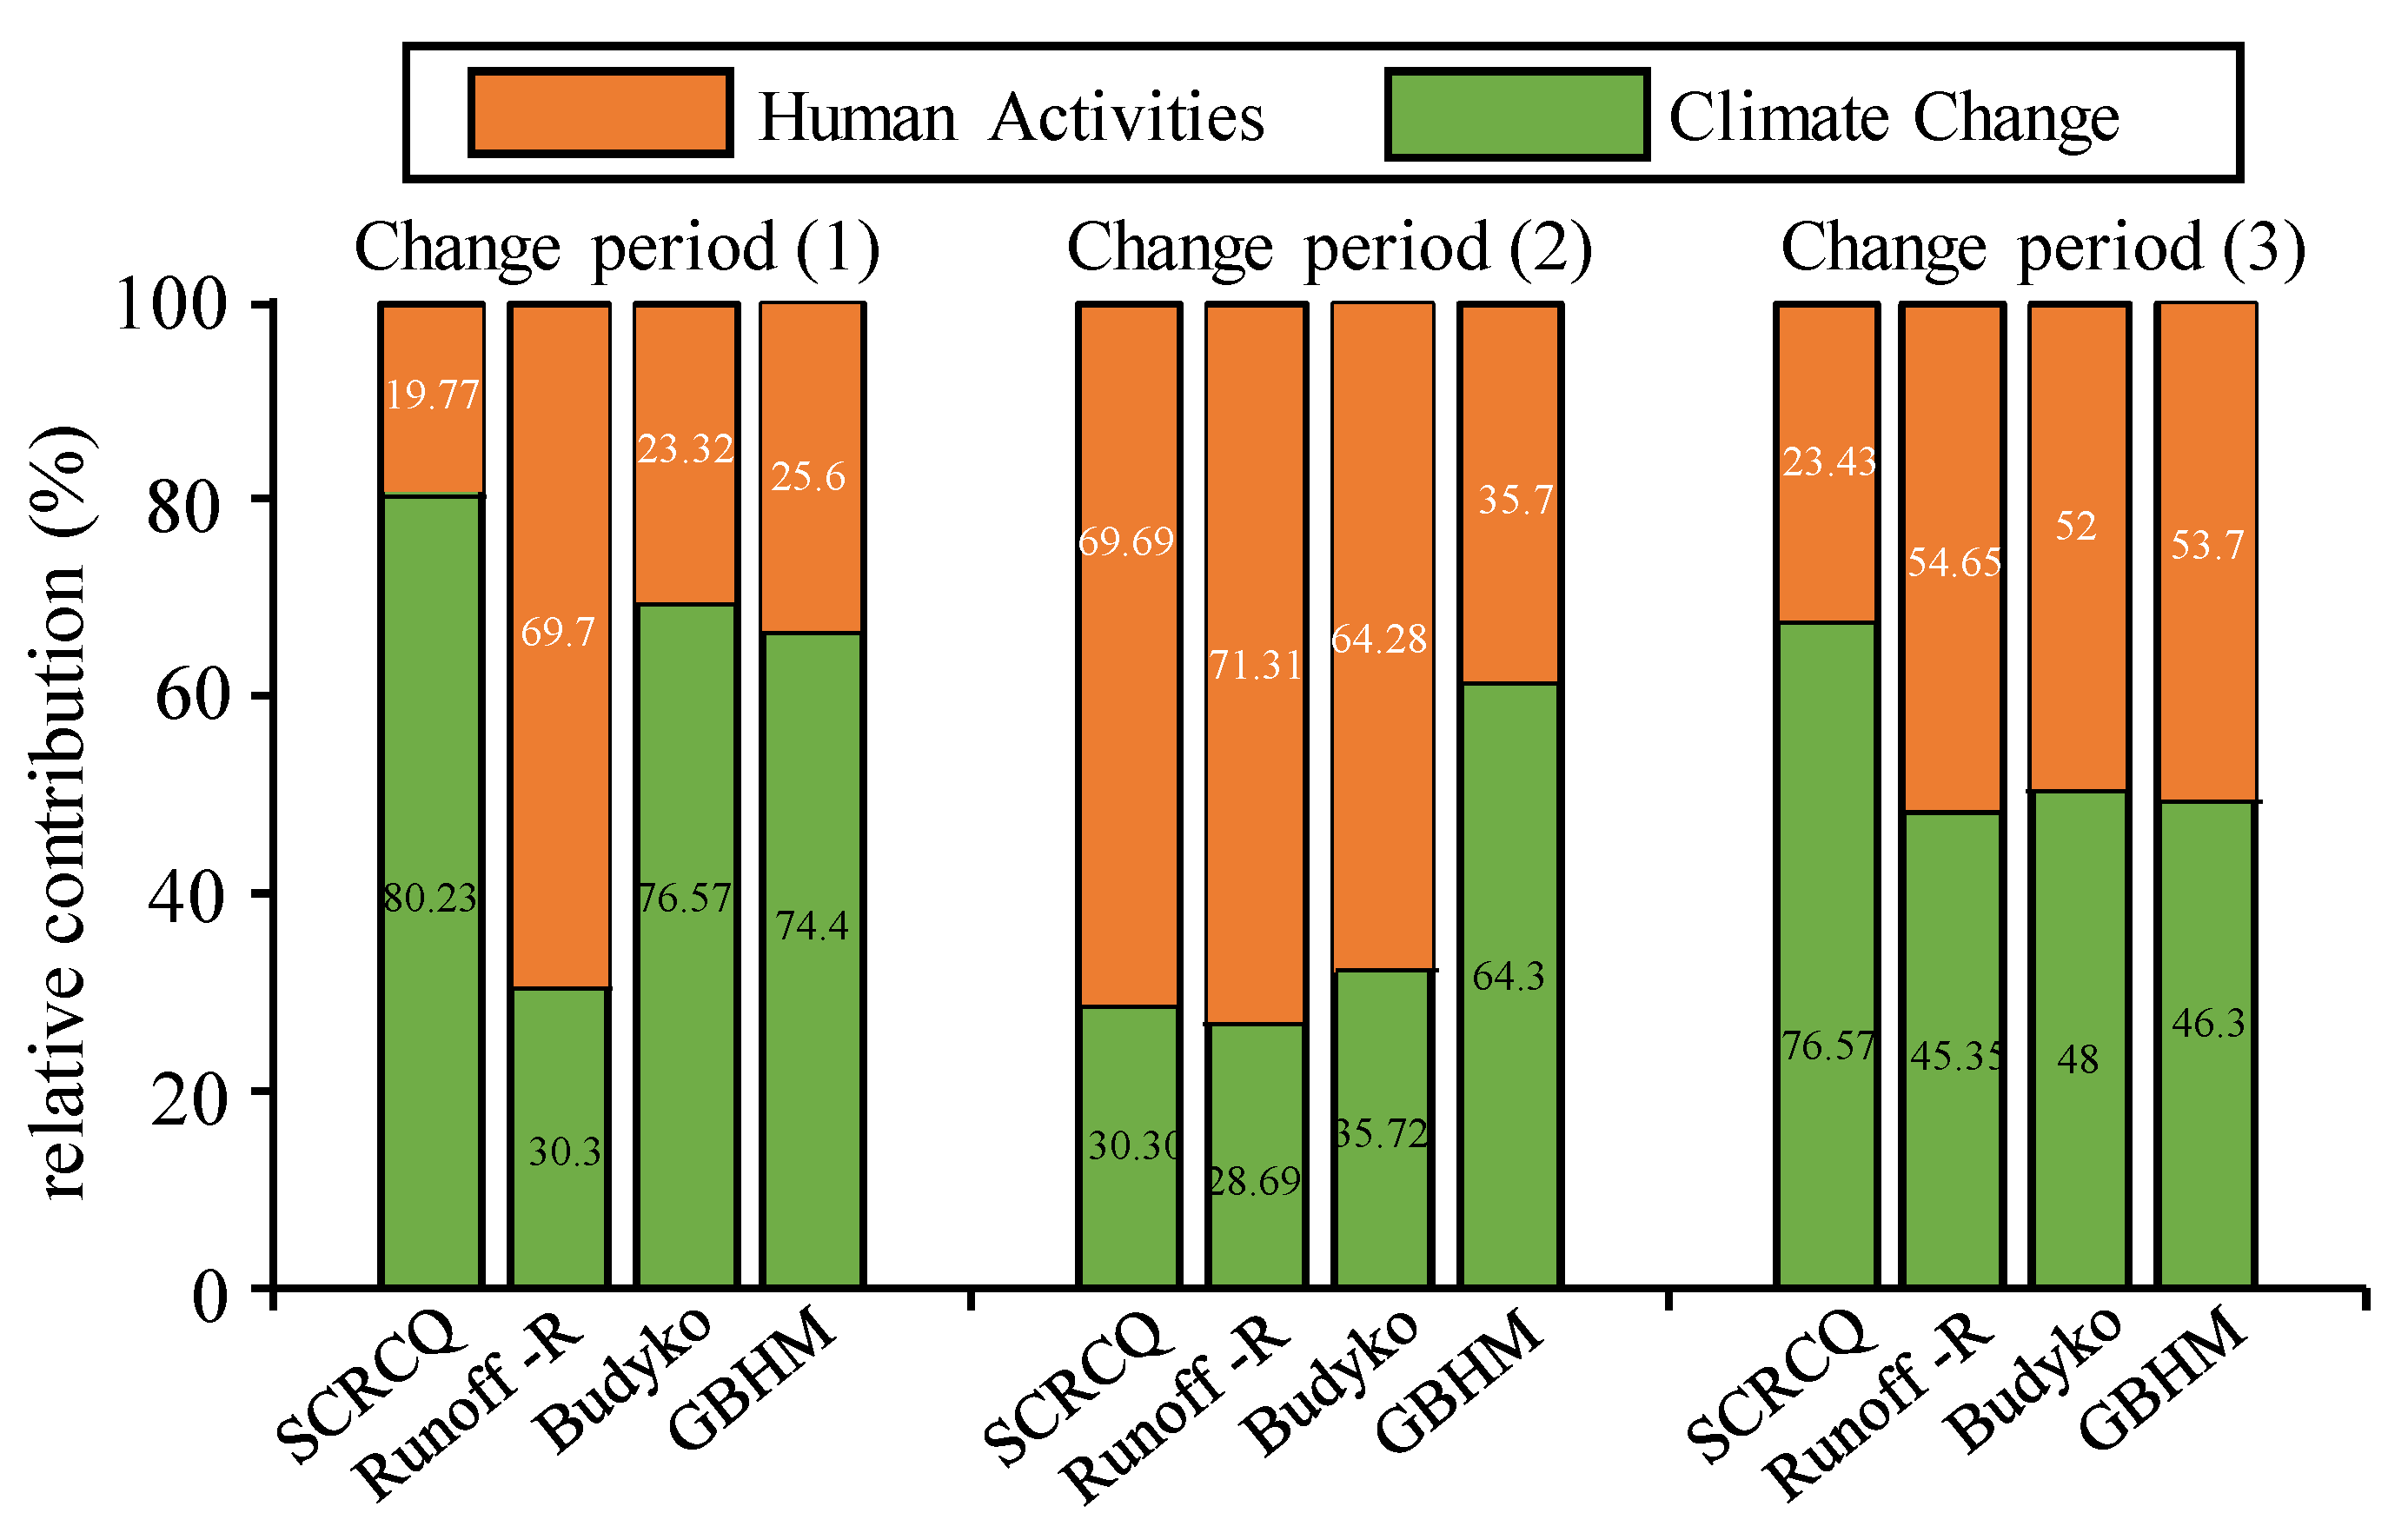
In the first change period, the ratio of precipitation to evaporation increased and the ratio of precipitation to soil water and runoff decreased, indicating that the vigorous development of soil and water conservation measures such as silt dams rapidly reduced runoff. In addition, the soil-water content was also reduced significantly by tree felling and the degradation of grasslands. The contribution rate of human activities to runoff during this period was 74.4%, which was the main driving factor for the change of runoff in the river watershed.
In the second change period, the conversion of precipitation to soil water increased, and the conversion to evaporation and runoff decreased. The reason was that under the influence of soil and water conservation measures, vegetation coverage increased and the proportion of forest and grass increased, intercepting runoff. This is consistent with the changes in the NDVI and land-use types. During this period, the control weight of human activities on runoff changes decreased, and the runoff contribution rate was 64.3%.
In the third change period, the conversion of precipitation to evaporation and soil water increased, while the conversion to runoff remained unchanged. It shows that vegetation coverage continued to increase, vegetation interception and transpiration capabilities were enhanced, and the development of soil and water conservation measures slowed. When a silt dam was full or destroyed, runoff increased again; therefore, evaporation and soil water both continued to increase. Runoff depth also increased, which is also related to the increase in precipitation during the third change period. During this period, the contribution rate of human activities to the runoff of the watershed was 53.7%. The control weight of human activities on the runoff changes in the river watershed continues to decline, but it is still the main driving factor. Figure 9 is a graph of simulation results.
Comparing the second and third change periods, the conversion rate of precipitation to soil water and runoff slowed due to the construction of silt dams. Other human activities also slowed and then remained basically unchanged. The soil and water conservation measures in the Chabagou River Watershed produced a benign change.
During the first change period, the SCRCQ indicated that climate change was the main factor controlling runoff (as calculated by the runoff reduction method and the GBHM hydrological model). The Budyko method also indicated that climate change was the main runoff controlling factor during that period.
In the second change period, the GBHM hydrological model indicated that climate change contributed more to runoff. The other three methods indicated that human activities contributed more to runoff. Compared with the first change period, the contribution rate of human activities to runoff calculated by the four methods in this change period shows an upward trend, corresponding to the period of concentrated construction of large-scale silt dams, sand dams and terraces in the Chabagou River Watershed.
In the third change period, the contribution rate of climate change to runoff calculated by the SCRCQ was the main controlling factor, but the calculation results of the other three methods show that the contribution rate of climate change to runoff is less than that of human activities. Soil and water conservation measures were effective in the third change period, and human activities were slightly weaker than in the second change period. The average temperature during the third change period was 1.21 °C higher than in the second period. Therefore, the contribution rate of human activities to runoff calculated by the SCRCQ is covered by the abnormal rise in temperature, resulting in a rapid decline in the contribution rate of human activities to the change of runoff.
On the whole, the contribution rates of human activities and climate change to runoff in the Chabagou River Watershed were quite different in the first change period, and it is considered that climate change was the main driving factor of runoff change in the study area. Human activities in the region during the second change period were significantly different. The proportion of the contribution rate of runoff was strengthened, and human activities are considered to have been the main driving factor of runoff change in the study area. In the third change period, the impact proportion of human activities on the river watershed decreased, but human activities are still the main controlling factor of river watershed runoff change. Figure 10 shows the contribution to runoff changes estimated by the four methods.

6.5. Uncertainty Analysis of Quantitative Results of Hydrological Response

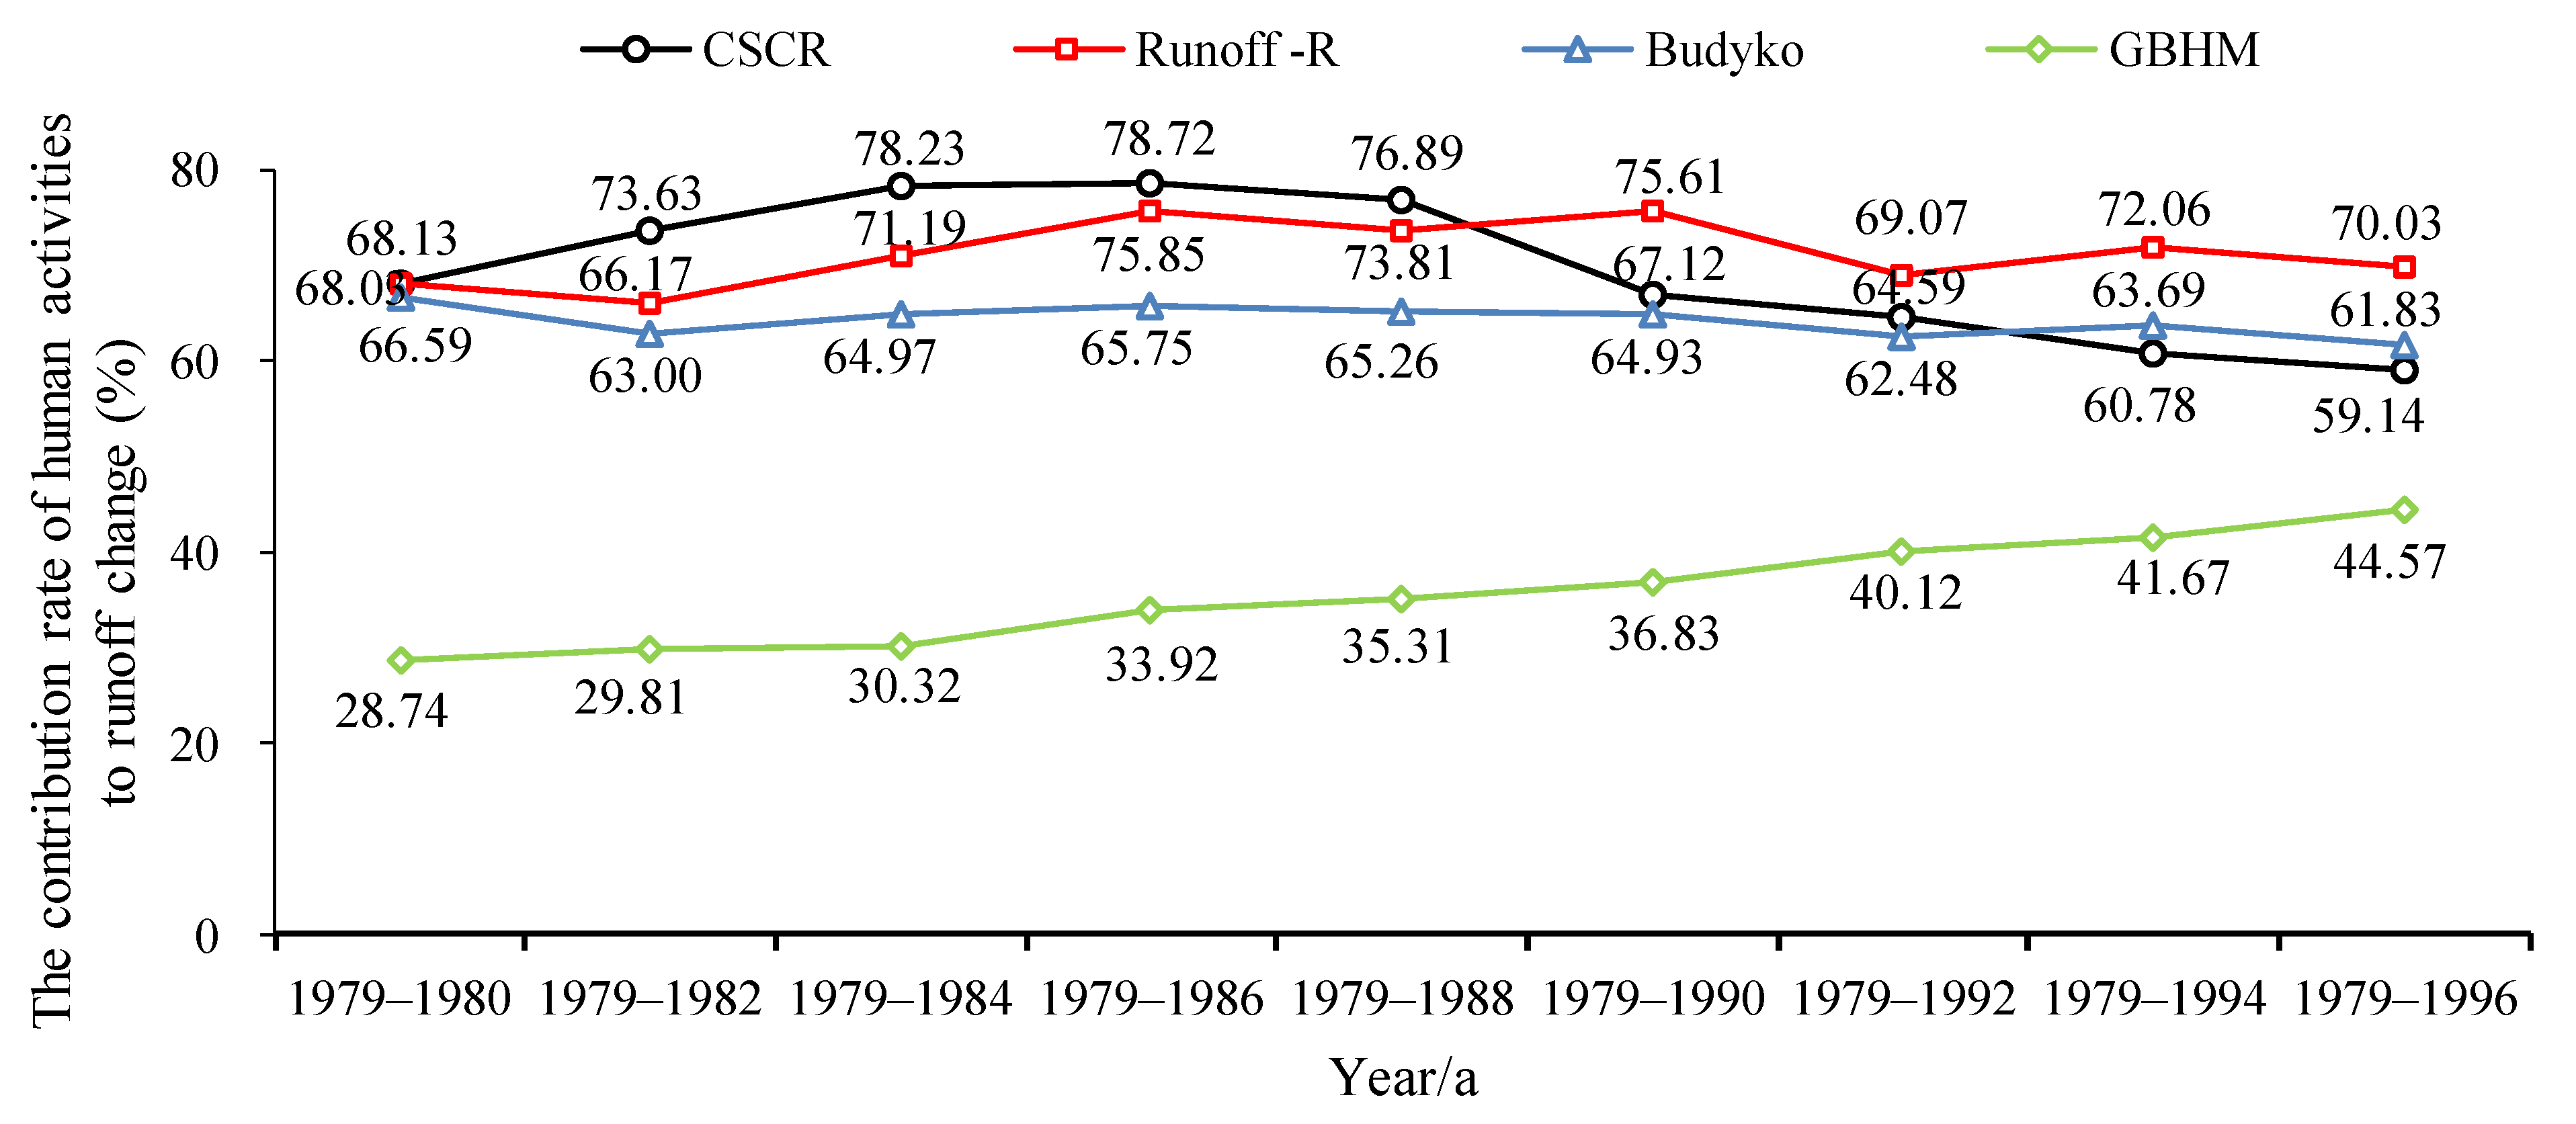
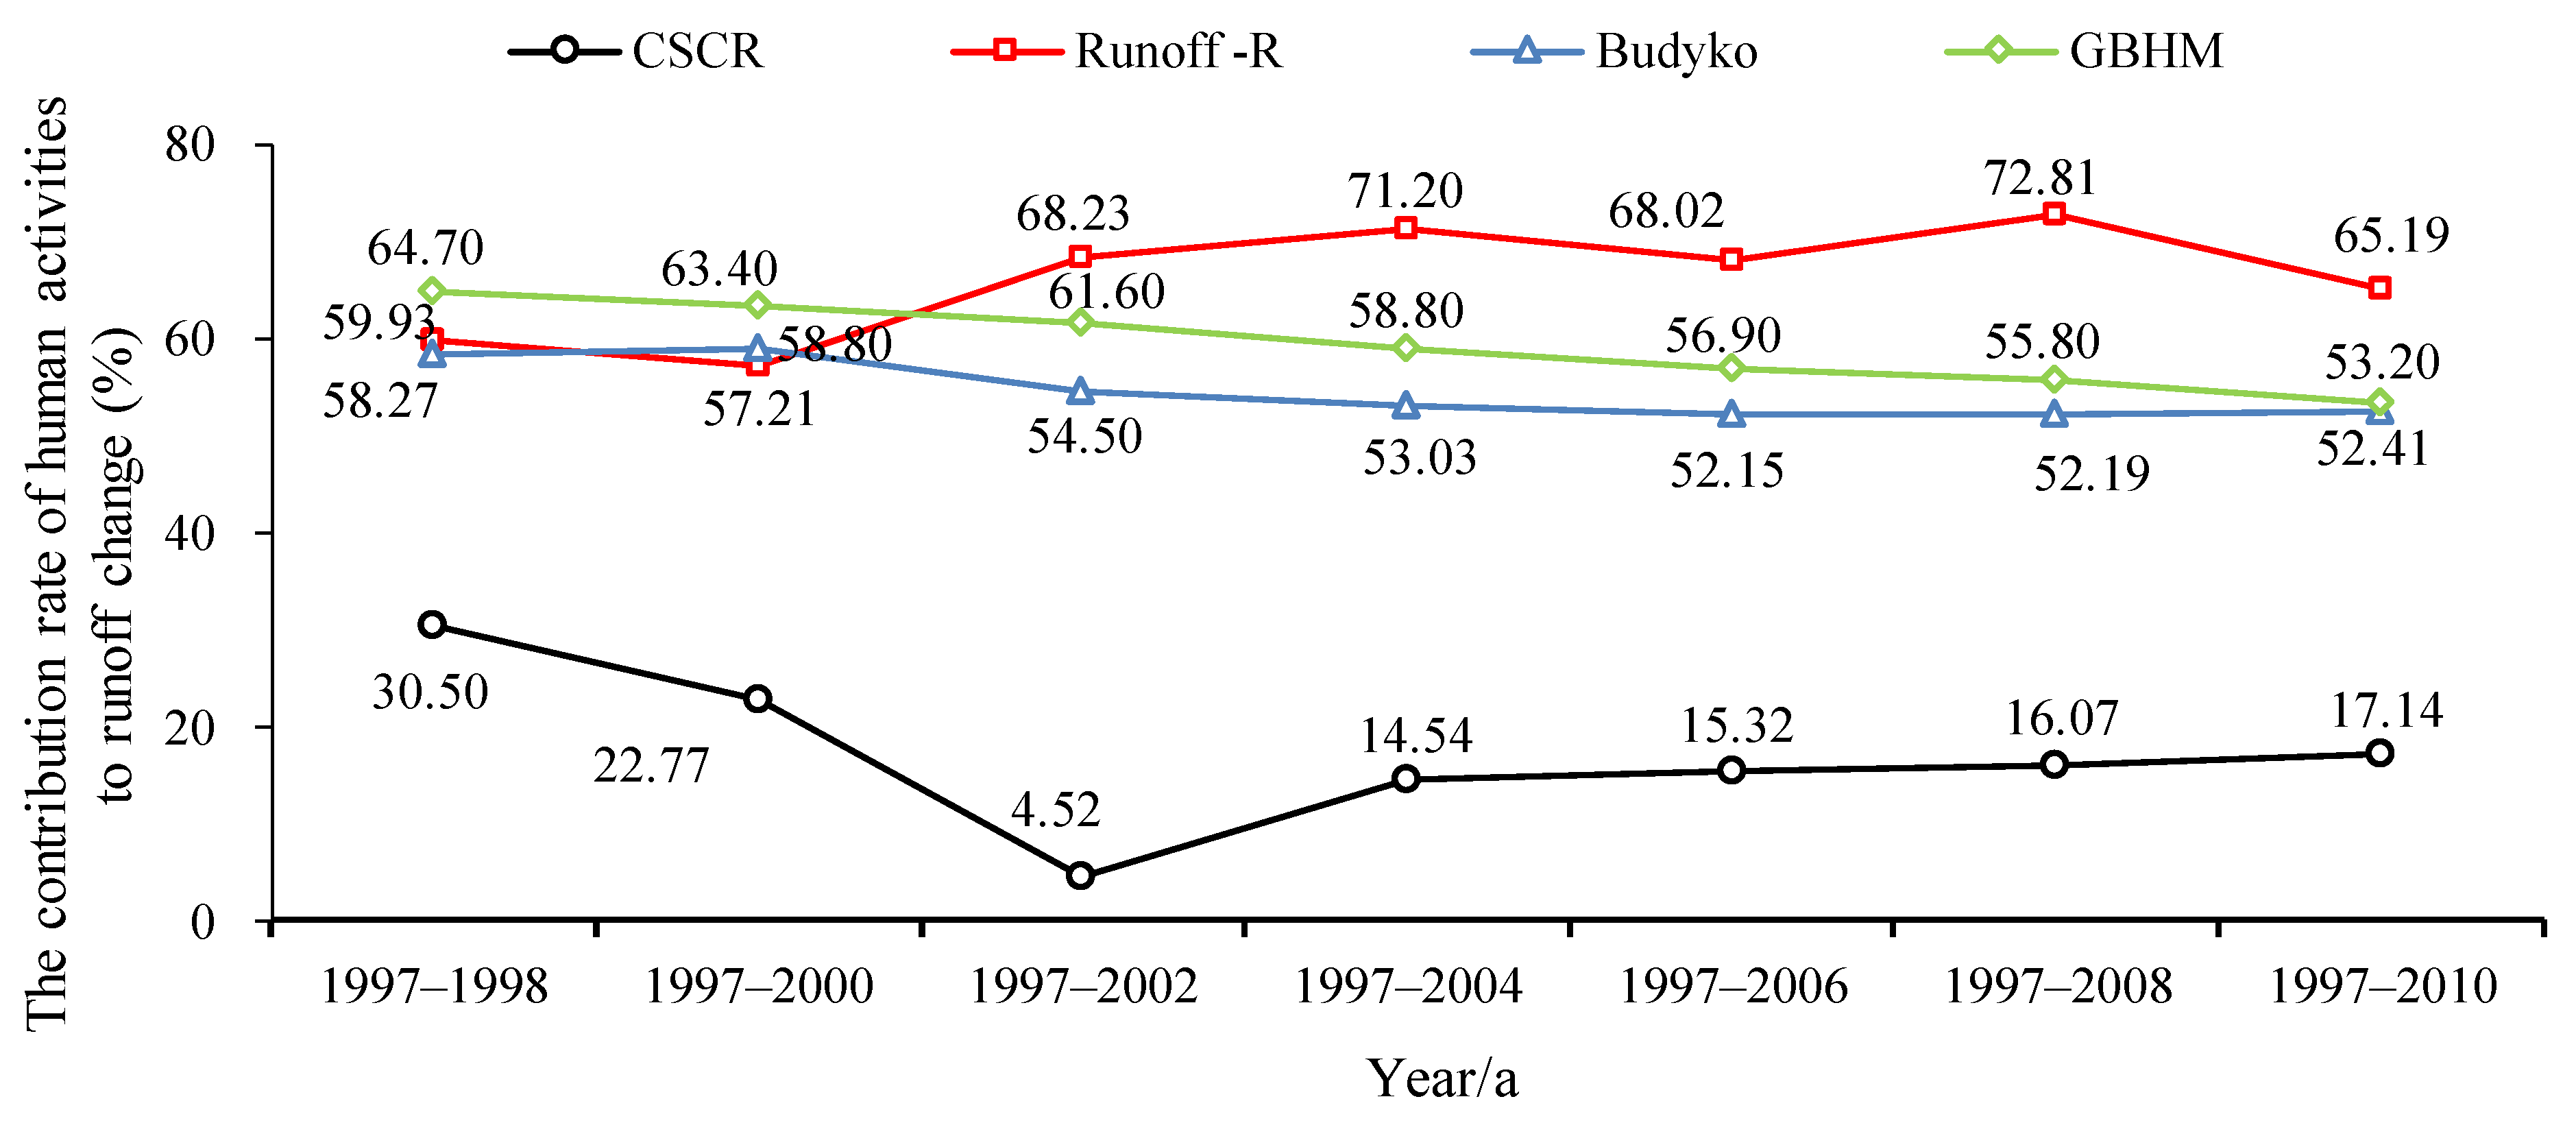
In order to determine the uncertainty of the results of the four methods and their applicability in the complex environment of the Loess Plateau, the contribution rates of human activities and climate change to runoff change in the Chabagou River Watershed from 1979 to 1996, and 1997 to 2010, were calculated by the four methods at two-year intervals. The results are shown in Figure 11 and Figure 12.
The trend calculated by the Budyko method is more stable; the runoff reduction method produced a zigzag pattern. The SCRCQ method and runoff reduction method were basically stable after 2004. The hydrologic model and Budyko method consider not only hydrological and meteorological data when calculating the runoff contribution rate, but also the changes in the subsurface of the basin, making it more stable and reliable than the runoff reduction method and the SCRCQ method. The four methods are considered to be stable in sequences of more than 8 years.
Figure 11 and Figure 12 illustrate the uncertainty analysis diagram for the four methods in change periods (2) and (3). Figure 11 shows that, in change period (2), as the number of years increased, the quantitative ratios obtained by the hydrologic model, the Budyko method and Runoff-R changed more steadily. The average range of human activity changes was 11.5%, 7.15%, and 11.31%, respectively. Figure 12 shows that, in change period (3), as the number of years increased, the quantitative ratios obtained by the hydrologic model and Budyko method changed more steadily. The average range of human activity changes was 11.5% and 11.31%. In addition, the SCRCQ method generated results that were not consistent with those obtained from the other statistical model methods. This was due to the parameter estimation in the linear fitting equations for years and accumulated precipitation and accumulated evaporation, which may be related to the increase of temperature and precipitation in change period (3).

6.6. Hydrological Response Assessment of Large-Scale Silt Dams Based on the GBHM

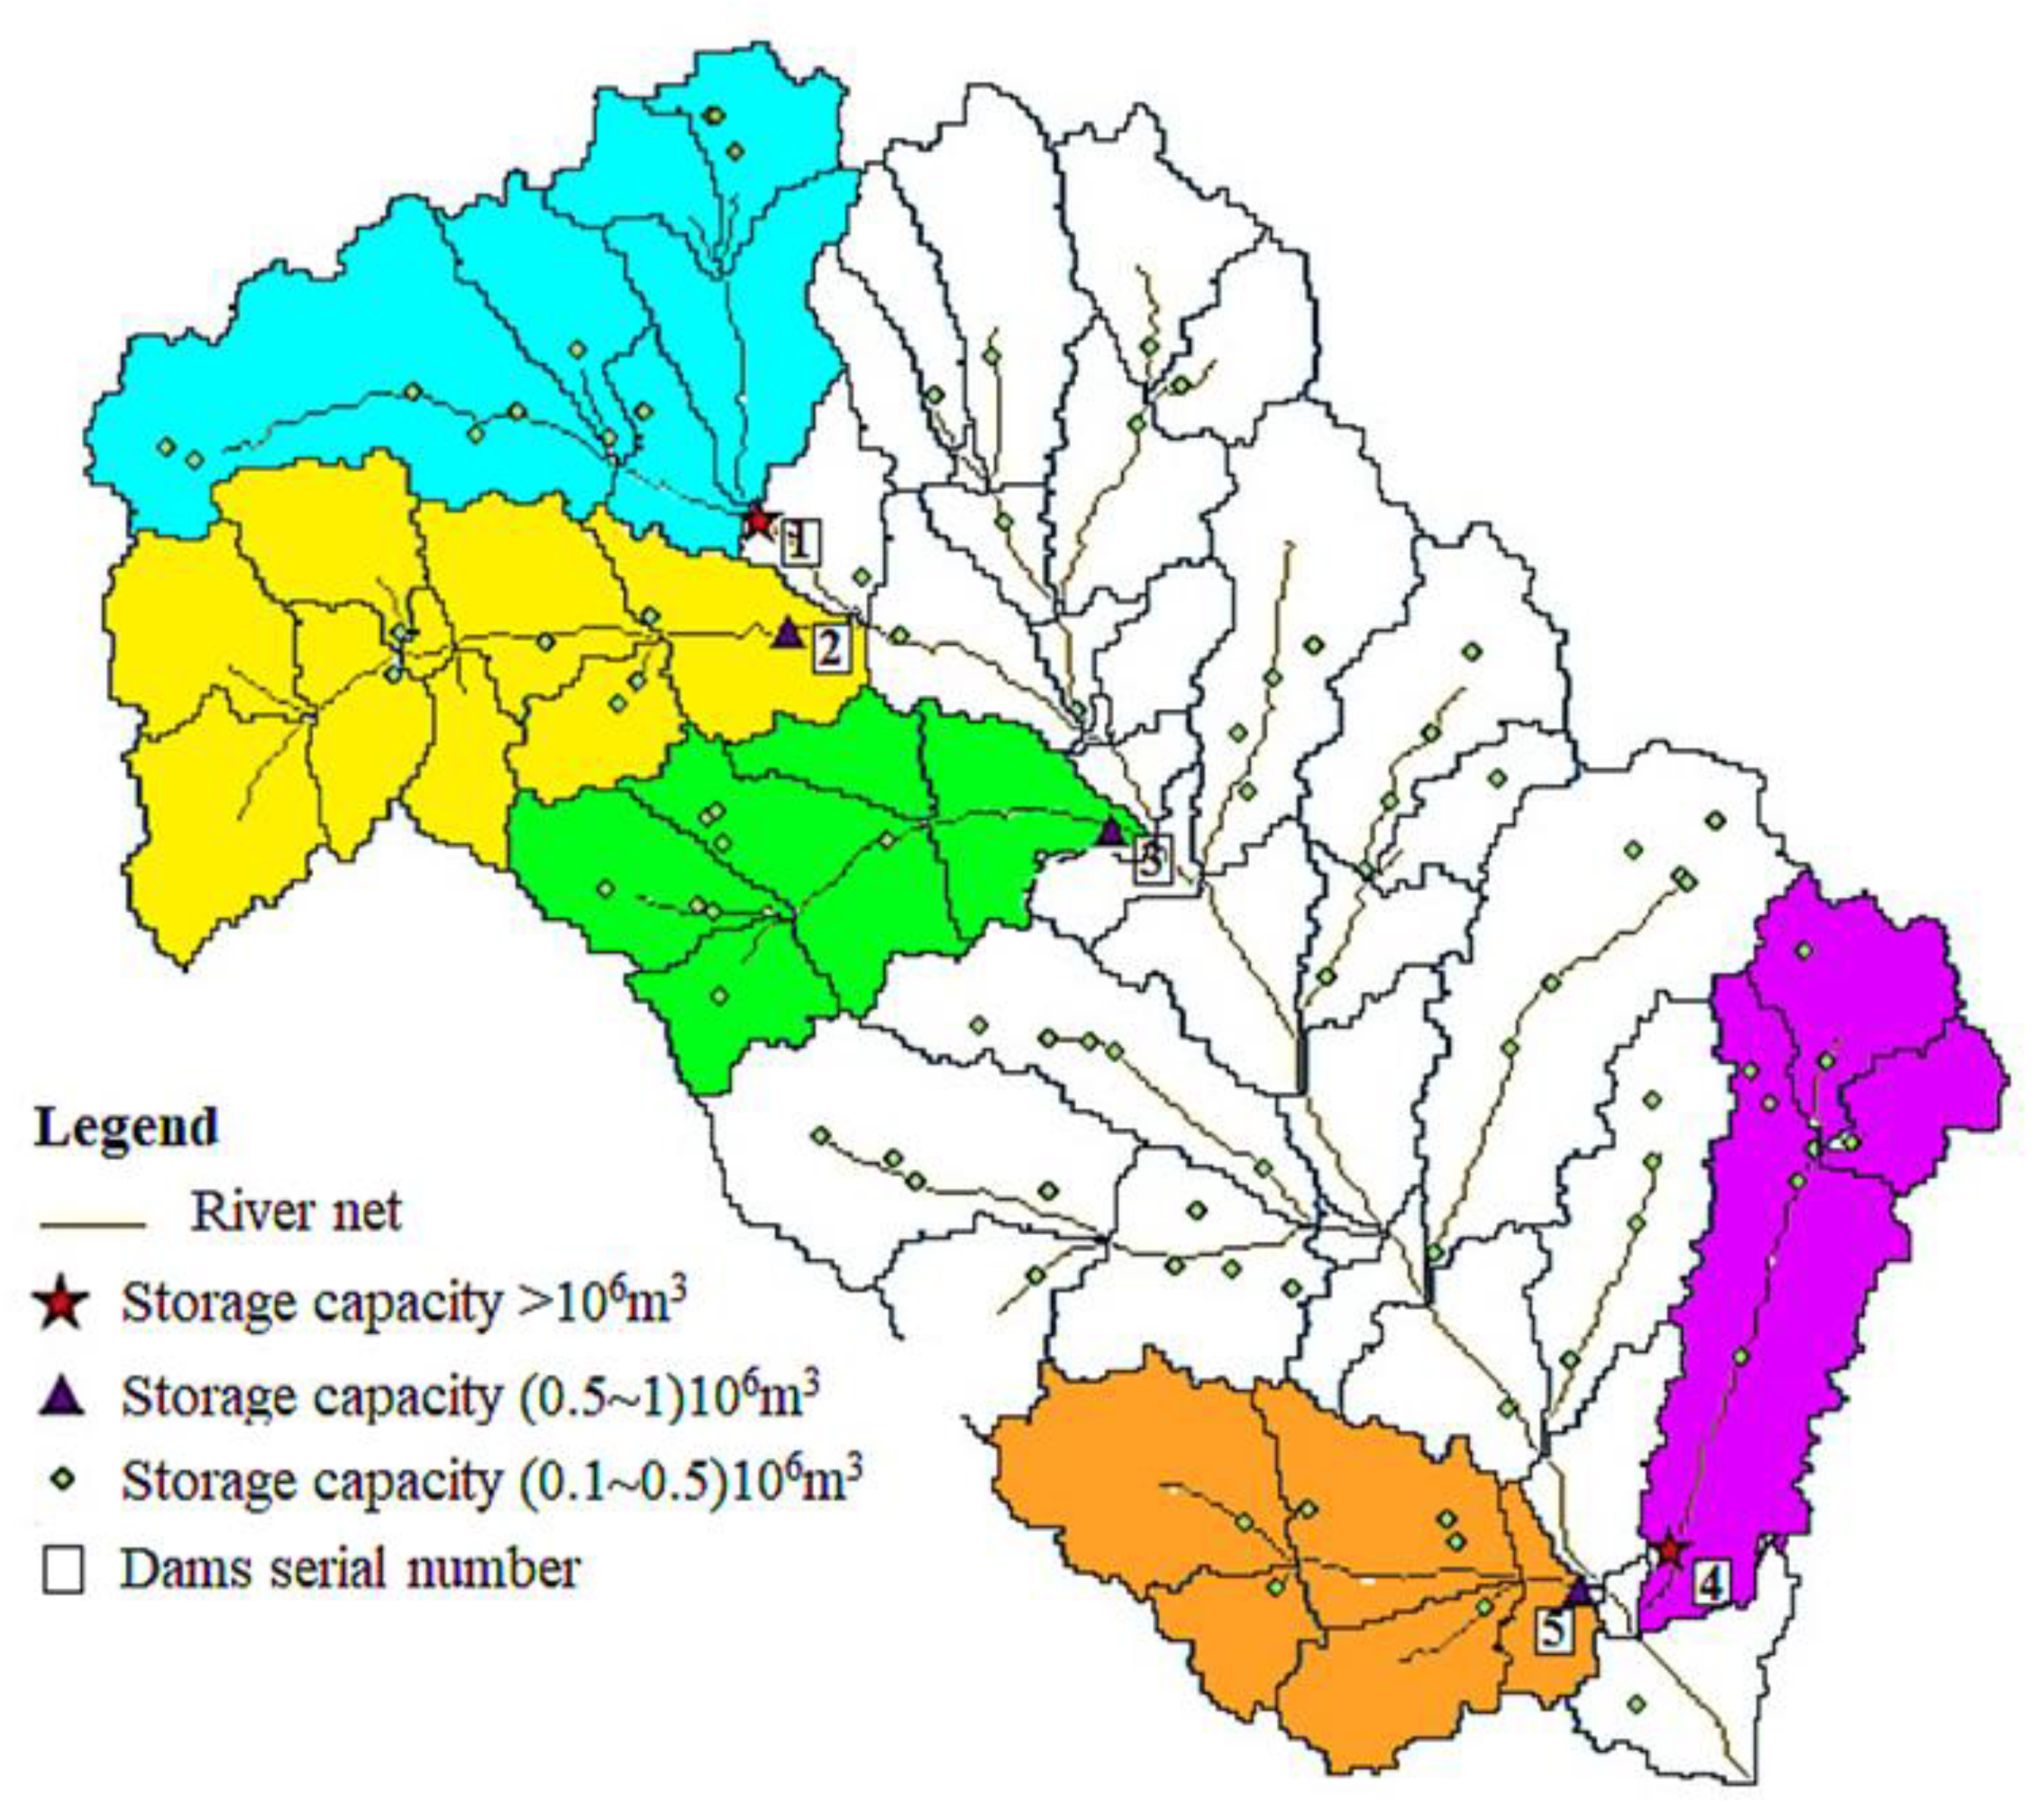
According to statistics by Mo et al. [20] and others on the cumulative large-scale silt dams and newly built large-scale silt dams in the Chabagou River Watershed, the construction period 1972–1976 saw intensive construction, when a total of 94 large-scale silt dams were built. By 2000, 157 large-scale silt dams and more than 500 silt dams had been built, and the Xuan wan reservoir was built in 1974. After the flood season in 1977 and 1978, only 370 silt dams remained. Large-scale silt dams with a storage capacity of more than 106 m3 were built in 1975 and large-scale silt dams with a storage capacity of more than (0.5)106 m3 were built between 1972 and 1978 [25]. Figure 13 shows the changes in the number of large-scale silt dams in the watershed.
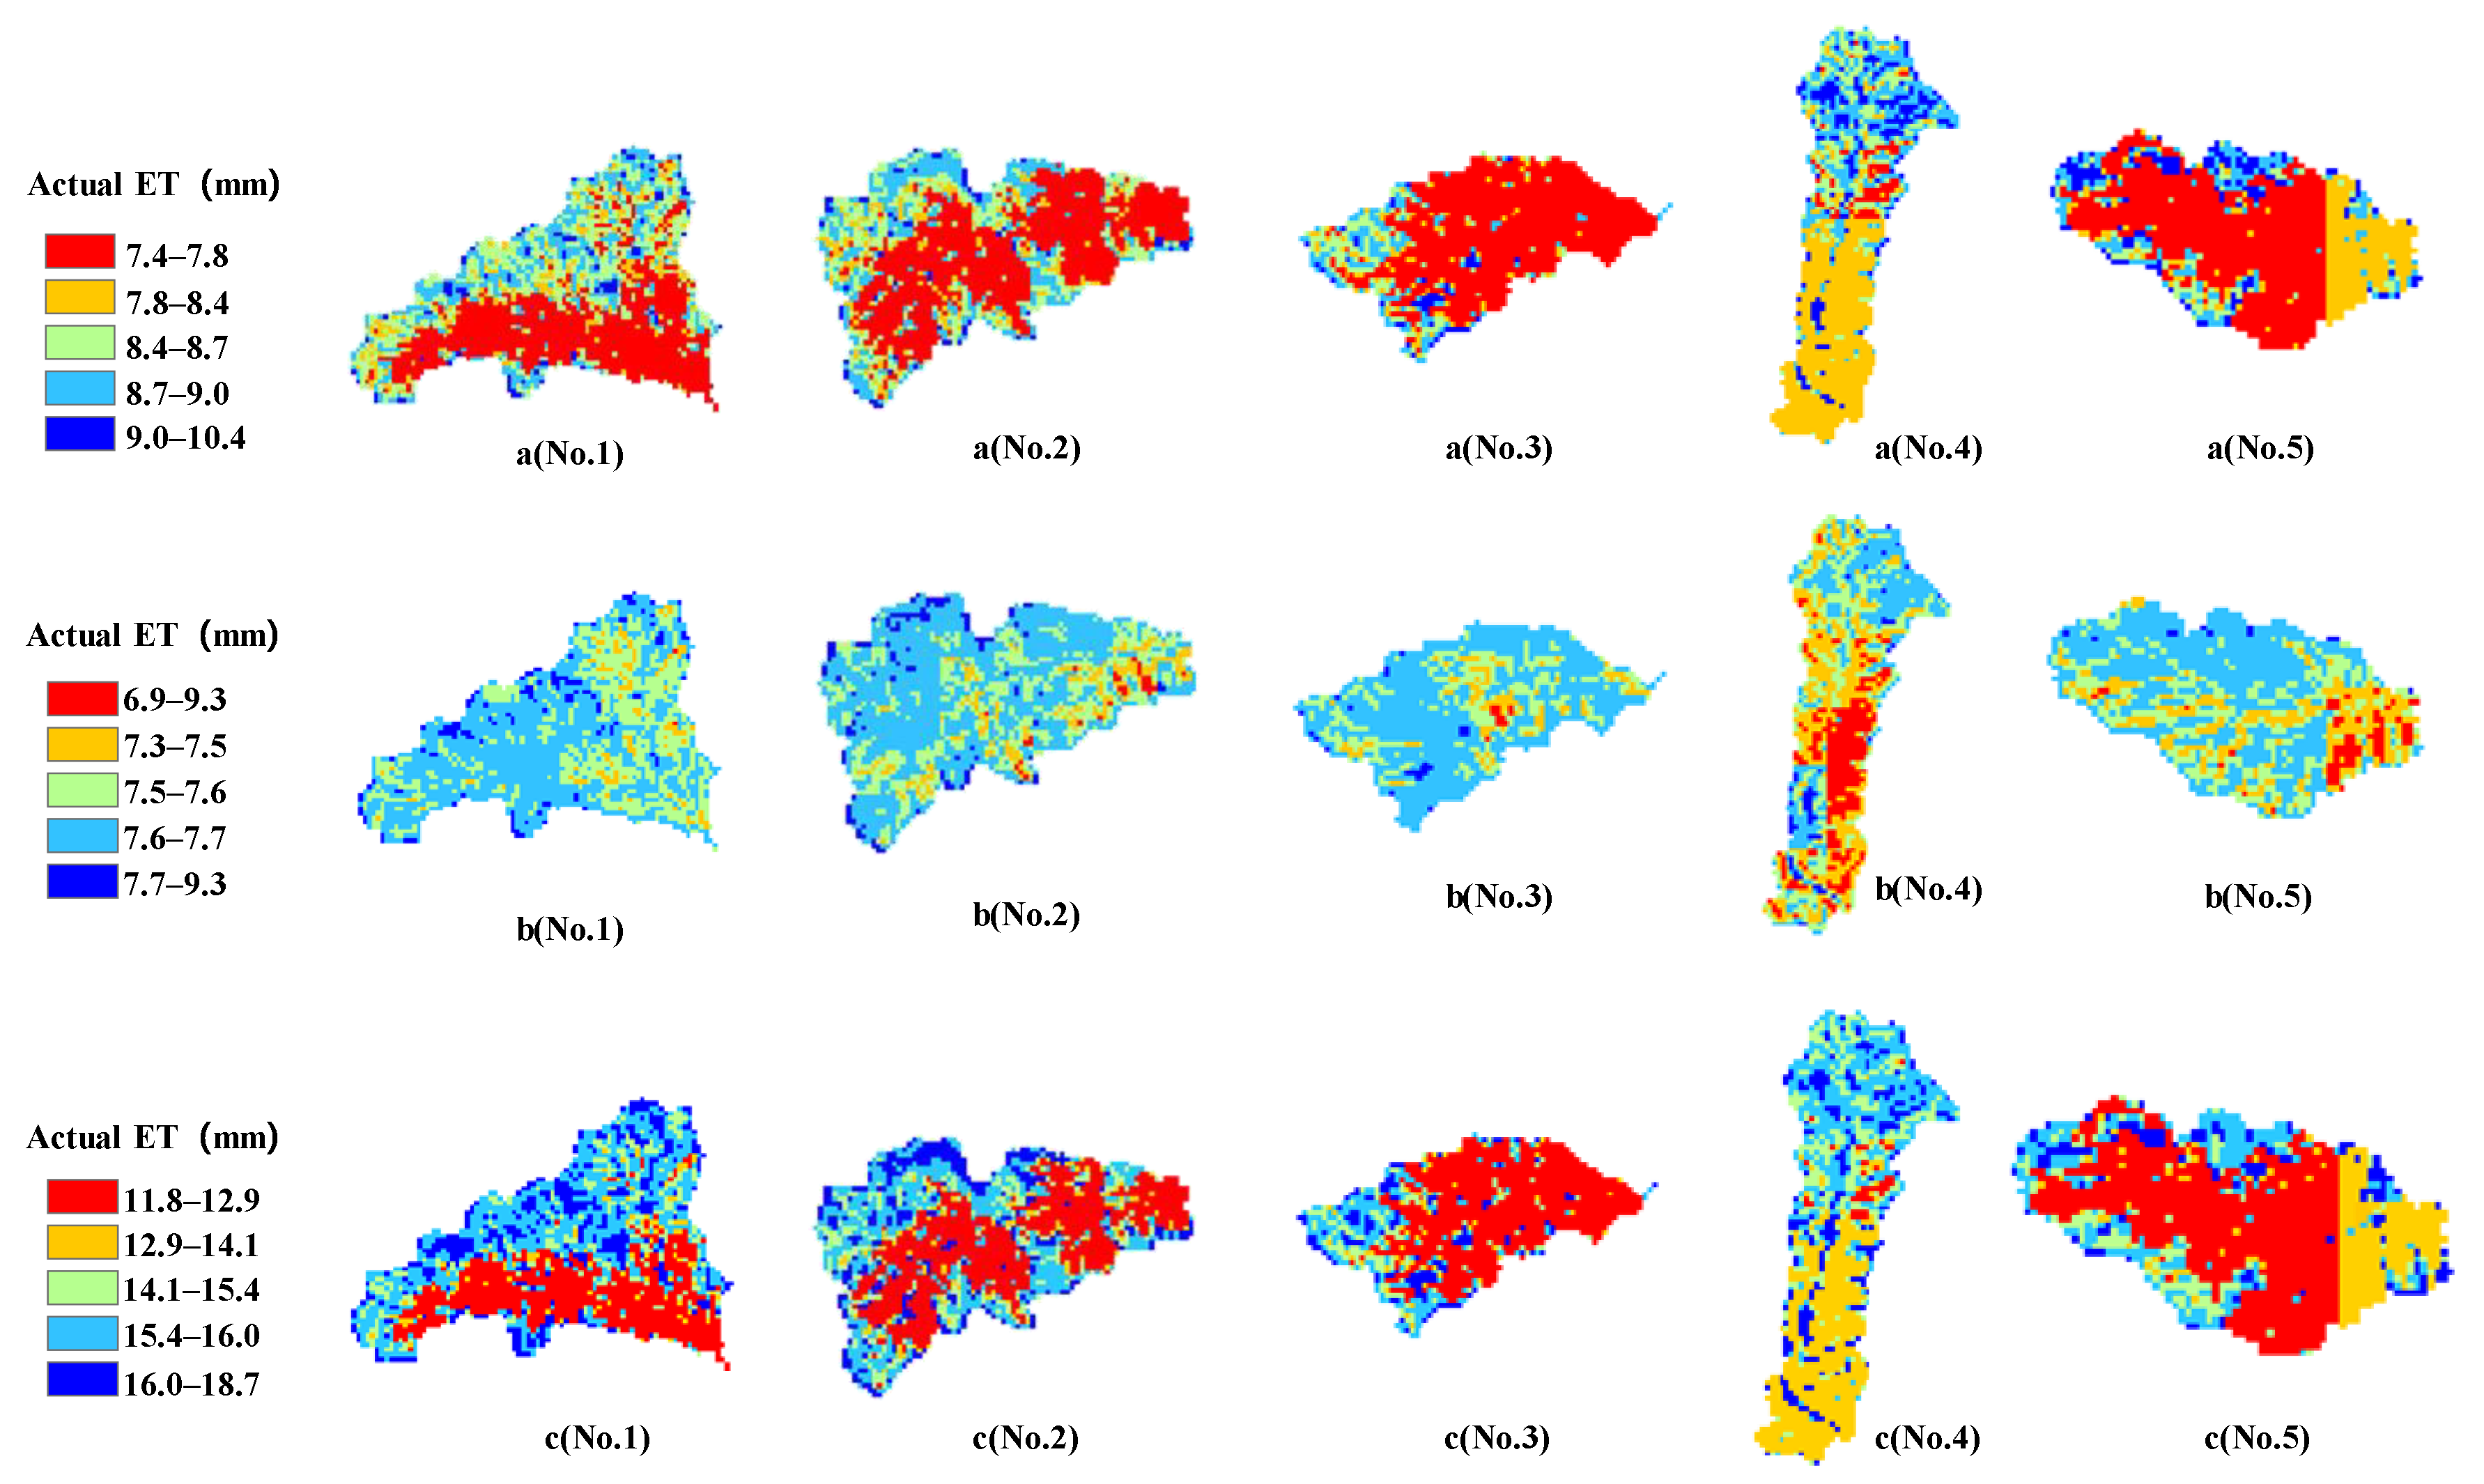
The evaporation in the sub-watersheds controlled by the five large-scale silt dams (storage capacity > (0.5)106 m3) increased in the first and third change periods, but for different reasons. In the first change period, a large number of check dams were built to intercept the runoff and increase the reservoir area, resulting in increased evaporation. In the third change period, soil and water conservation measures were complete. With the increase in surface vegetation, transpiration capacity in the sub-watershed also increased, and was evident as increased evaporation. The actual evaporation in the sub-watersheds controlled by the five large-scale silt dams increased continuously. In the first change period, evaporation from No. 1 and No. 2 large-scale silt dams increased most rapidly at a rate of 0.1. The actual evaporation growth rate of the upstream silt dam controlling the sub-catchment was faster than for the downstream large-scale silt dam.
During the second change period, the actual evaporation growth rate of the No. 4 large-scale silt dam was the highest due to the decrease of forest and grassland and the increase of residential area in the watershed. The evaporation growth rate in the sub-watershed controlled by the No. 1 large-scale silt dam was greatest in the third change period. This is generally reflected in the rapid growth of evaporation in the sub-watershed controlled by the northwestern large-scale silt dam. The reason is that the change in the type of land use in the sub-watershed controlled by No. 1 and 2 large-scale silt dams was small, and the effect of the soil and water conservation measures in these two sub-watersheds was not obvious.
The soil water in the sub-watersheds controlled by the five large-scale silt dams showed an increasing trend in the third change period. The soil water in the first change period was less than in the baseline period, because the large-scale silt dam was in the peak period of construction at that time, and the soil and water conservation measures had not been affected. Also, the surface vegetation had been greatly damaged, and the soil water capacity had been reduced. Conversely, in the second and third change periods, under the influence of soil and water conservation and other measures the surface vegetation had been restored, and the soil water conservation capacity was being continually enhanced.
The soil water in sub-watersheds controlled by Nos. 4 and 5 large-scale silt dams decreased most in the first change period for the reason that a large number of large-scale silt dams were under construction in the upper and middle reaches during this period. Downstream runoff was reduced, and the decrease in soil water was more obvious. The greatest increase in soil water occurred in the sub-watershed controlled by the No. 2 large-scale silt dam during the second change period, whereas the smallest increase of soil water occurred in the sub-watershed controlled by the No. 5 large-scale silt dam because part of the forest and grassland in that area was converted into cultivated land at that time.
In the third change period, the increase of soil water in the sub-watershed controlled by the downstream large-scale silt dam was smaller than in the sub-watershed controlled by the upstream and midstream large-scale silt dams. Compared with the first and second change periods, evaporation and soil water increased most in the third change period. This was related to the increased rainfall in this period, and because the most obvious effect of soil and water conservation measures was seen in this period. The increase of soil water in the second and third change periods was greater than the evaporation increase, which shows that the water and soil conservation measures had a benign effect on the ecology of the river watershed.
Table 10 shows the simulated evaporation and soil water in the sub-watershed controlled by five large-scale silt dams. Figure 14 and Figure 15 show the spatial variation of actual evaporation and soil water in a sub-watershed controlled by a large-scale silt dam.
With the “Northern Work Conference” and the Yellow River Watershed Governance Symposium held in the early 1970s, the Chabagou River Watershed entered a period of large-scale construction and development. Due to the small amount of silt dam construction, strong check-up capacity and beneficial effect of sand blocking and land reclamation, silt dams were appearing everywhere in the watershed. In addition, with social development and the rapid increase in land set aside for construction, the properties of the subsurface changed significantly. After 1980, more than 20% of the reservoirs and silt dams were destroyed by water, and the construction of silt dams entered its lowest period. Most silt dams gradually silted up over time, and the improvement in runoff was gradually reduced. With the implementation of the new plan for soil and water conservation, scientific and reasonable construction and development, and the vigorous promotion of returning farmland to forest and grassland, the runoff of the watershed increased over that in the 1970s.
Taken together, the impact of human activities on runoff was first strengthened and then slightly weakened. Human activities have become an important factor affecting runoff changes in the Chabagou River Watershed. In order to improve the ecological environment of the watershed as a typical river watershed of the Loess Plateau, and to achieve sustainable development, effective measures need to be formulated to restrict the impact of human activities on runoff.

7. Conclusions and Discussion

This study used long-sequence measured meteorological and hydrological data and NDVI data together with multi-period data on land usage to assess the attribution of the Chabagou River Watershed runoff changes, adopting a variety of methods. Based on empirical statistics and hydrological model methods, the impact of different factors on the river watershed runoff changes were analyzed using hydrological model simulation methods to explore the ecological changes in the sub-watershed controlled by large-scale dams.
(1)
Spearman’s rank correlation coefficient method and the M-K mutation trend test method were used to analyze the trend of precipitation, runoff and temperature in the basin from 1959 to 2010. The results show that the runoff depth and precipitation are decreasing, but the trend is not significant. The temperature shows a significant upward trend. The 1959–2010 period, in which abrupt changes of runoff occurred, was analyzed by an ordered clustering method, M-K mutation trend test, and the cumulative anomaly method. The results revealed that abrupt changes in the annual runoff sequence occurred in 1966, 1978, and 1997.
(2)
From 1980 to 2000, the amount of land set aside for construction in the central and western parts of the river basin increased, and concentrated forests and grasslands were transformed into cultivated land in some areas of the central and eastern parts. Land-use changes mostly occurred in the middle and lower reaches of the river watershed. From 2000 to 2010, a water area of 0.031 km2 was formed, the area of grassland and forest land increased by 1.289 km2 and 0.298 km2, respectively, construction land remained basically unchanged, and the area of cultivated land decreased significantly. The types of land use changed from local concentration to a mixture of multiple land types.
(3)
Taking 1959–1966 as the baseline period and 1967–1978, 1979–1997, and 1998–2010 as three change periods, the analysis of the attribution of river basin runoff in these change periods was carried out using the empirical statistical method and the hydrological simulation method of the GBHM. The results indicate that climate change in the Chabagou River watershed was the main driver of runoff variation in the first change period. In the second period, the contribution rate of human activities to runoff increased significantly and became the main controlling factor. In the third change period, the degree of the contribution rate of human activities to river watershed runoff decreased, but continued to be the main driving factor of river watershed runoff variation.
(4)
Each method has its own computational characteristics. The uncertainty analysis of the response of water resources to climate change and human activities shows that the commonly used methods require at least eight years of hydro-climatological observations, when is more reliable. In addition, the SCRCQ method can also generate results that are not consistent with those obtained by other statistical model methods, because of parameter estimation in the linear fitting equations for years, and accumulated precipitation and temperature. Hydrological modeling is the most difficult but the most reliable method. In the study of hydrological responses under changing environments, the results obtained by different methods should be compared, and the one that is most suitable for its research conditions should be selected.
(5)
The GBHM simulation indicates that the ratio of potential evaporation to precipi-tation appeared to increase first and then decrease, with the maximum value of 3.87 appearing in the second change period. The actual evaporation in the sub-basins controlled by the five large silt dams continued to increase during the three change periods, while soil water decreased at first, and then increased. The increase in soil water in the second and third change periods was greater than the increase in actual evaporation, which indicates the beneficial effect of water and soil conservation measures on the ecology of the river watershed.
(6)
The main conclusions of this study are tenable for catchments similar to the Chabagou River watershed, which contributes to the ongoing debate on the detection and modeling of mechanisms through which climate change and human activities affect the hydrological situation in the semi-arid regions of the Loess Plateau. In order to improve the ecological environment of the Loess Plateau, and to achieve sustainable development, effective measures need to be formulated to reduce the impact of human activities on runoff. Our future investigations will focus on the hydrological and ecological impact of different soil and water conservation measures.

Author Contributions

All authors contributed to the work. J.L. conceived and de-signed the study; P.G. performed the computations and data analysis; X.Z., P.L. and D.M. offered technical guidance; S.M. supply the daily runoff data; W.Y. proofread and edited the manuscript. All authors have read and agreed to the published version of the manuscript.

Funding

This research was funded by the General Financial Grant from the China Postdoctoral Science Foundation (2017M623088), the Shaanxi Postdoctoral Science Foundation 2018, the National Natural Foundation of China (51679185) and the National Key R&D Program of China (2018YFE0103800). And the APC was funded by the General Financial Grant from the China Postdoctoral Science Foundation (2017M623088).

Data Availability Statement

Not applicable.

Acknowledgments

We sincerely thank the Key Laboratory of Subsurface Hydrology and Ecological Effects in Arid Region, Ministry of Education. The authors are grateful to the Editor and anonymous reviewers for their constructive comments and suggestions.

Conflicts of Interest

The authors declare that they have no conflicts of interest.

References

  1. Zhang, Z.X.; Ceng, X.; Xu, C.Y.; Yuan, L.F.; Yang, B.; Yan, S.F. Evaluating the non-stationary relationship between precipitation and streamflow in nine major basins of China during the past 50 years. J. Hydrol. 2011, 409, 81–93. [Google Scholar] [CrossRef]
  2. Yang, D.W.; Zhang, S.L.; Xu, X.Y. Attribution analysis for runoff decline in Yellow River Basin during past fifty years based on Budyko hypothesis. Sci. Sin. 2015, 45, 1024–1034. [Google Scholar]
  3. Lyu, J.Q.; Mo, S.H.; Luo, P.P.; Zhou, M.; Shen, B.; Nover, D. A quantitative assessment of hydrological responses to climate change and human activities at spatiotemporal within a typical catchment on the Loess Plateau, China. Quat. Int. 2019, 527, 1–11. [Google Scholar] [CrossRef]
  4. Dou, L.; Huang, M.B.; Hong, Y. Statistical Assessment of the Impact of Conservation Measures on Runoff Responses in a Watershed of the Loess Plateau, China. Water Resour. Manag. 2009, 23, 1935–1949. [Google Scholar] [CrossRef]
  5. Vorosmarty, C.J.; Green, P.; Salisbury, J.; Lammers, R.B. Global water resources: Vulnerability from climate change and population growth. Science 2000, 289, 284–288. [Google Scholar] [CrossRef] [Green Version]
  6. Wei, X.D.; Wang, N.; Luo, P.P.; Yang, J.; Zhang, J.; Lin, K.L. Spatiotemporal Assessment of Land Marketization and Its Driving Forces for Sustainable Urban–Rural Development in Shaanxi Province in China. Sustainability 2021, 13, 7755. [Google Scholar] [CrossRef]
  7. Hao, X.M.; Chen, Y.N.; Xu, C.C.; Li, W.H. Impacts of climate change and human activities on the surface runoff in the Tarim River Basin over the last fifty years. Water Resour. Manag. 2008, 22, 1159–1171. [Google Scholar] [CrossRef]
  8. Jiang, R.G.; Xie, J.C.; He, H.; Luo, J.; Zhu, J.; Glade, T.; Murty, T.S. Use of four drought indices for evaluating drought characteristics under climate change in Shaanxi, China, 1951–2012. Nat. Hazards 2015, 75, 2885–2903. [Google Scholar] [CrossRef]
  9. Mu, X.M.; Li, Y.; Gao, P. The runoff declining process and water quality in Song hua jiang River catchment, China, under global climatic change. Clean-Soil Air Water 2012, 40, 394–401. [Google Scholar] [CrossRef]
  10. Zuo, D.P.; Xu, X.W.; Zhao, J.; Zhao, F.F. Identification of streamflow response to climate change and human activities in the Wei River Basin, China. Water Resour. Manag. 2014, 28, 833–851. [Google Scholar] [CrossRef]
  11. Gao, G.; Fu, B.; Wang, S.; Liang, W.; Jiang, X. Determining the hydrological responses to climate variability and land use/cover change in the Loess Plateau with the Budyko framework. Sci. Total Environ. 2016, 557–558, 331–342. [Google Scholar] [CrossRef]
  12. Wang, S.J.; Yan, Y.X.; Yan, M.; Zhao, X.K. Contributions of precipitation and human activities to the runoff change of the Huangfuchuan drainage basin: Application of comparative method of the slope changing ratio of cumulative quantity. Acta Geogr. Sin. 2012, 67, 388–397. (In Chinese) [Google Scholar]
  13. Shi, H.; Shao, M. Soil and water loss from the Loess Plateau in China. J. Arid Environ. 2000, 45, 9–20. [Google Scholar] [CrossRef] [Green Version]
  14. Li, L.J.; Zhang, L.; Wang, H.; Wang, J.; Yang, J.W.; Jiang, D.J.; Li, J.Y.; Qin, D.Y. Assessing the impact of climate variability and human activities on streamflow from the Wuding River basin in China. Hydrol. Processes 2007, 21, 3485–3491. [Google Scholar] [CrossRef]
  15. Fang, H.Y.; Cai, Q.G.; Chen, H.; Li, Q.Y. Temporal changes in suspended sediment transport in a gullied loess basin: The lower Chabagou Creek on the lxless Plateau in China. Earth Surface Processes Landf. 2008, 33, 1977–1992. [Google Scholar] [CrossRef]
  16. Miao, C.Y.; Kong, D.X.; Wu, J.W.; Duan, Q.Y. Functional degradation of the water sediment regulation scheme in the lower Yellow River: Spatial and temporal analyses. Sci. Total Environ. 2016, 551–552, 16–22. [Google Scholar] [CrossRef]
  17. Zhao, G.J.; Li, E.H.; Mu, X.M.; Wen, Z.M.; Rayburg, S.; Tian, P. Changing trends and regime shift of streamflow in the Yellow River basin. Stoch. Environ. Res. Risk Assess. 2015, 29, 1331–1343. [Google Scholar] [CrossRef]
  18. Luo, P.P.; Xu, C.Y.; Kang, S.X.; Huo, A.D.; Lyu, J.Q.; Zhou, M.M.; Daniel, N. Heavy metals in water and surface sediments of the Fenghe River Basin, China: Assessment and source analysis. Water Sci. Technol. 2021, 84, 3072–3090. [Google Scholar] [CrossRef] [PubMed]
  19. Zhao, G.J.; Tian, P.; Mu, X.M.; Jiao, J.Y.; Wang, F.; Gao, P. Quantifying the impact of climate variability and human activities on streamflow in the middle reaches of the Yellow River basin. China. J. Hydrol. 2014, 519, 387–398. [Google Scholar] [CrossRef]
  20. Liu, Z.Y. Study and Application of a Distributed Hydrological Model on the Loess Plateau. Doctoral Thesis, Tsinghua University, Beijing, China, 2005. [Google Scholar]
  21. Mo, S.H.; Gong, Y.; Li, J.; Shen, B. Impact of human activities on flood process in Chabagou Basin of the Loess Plateau, China. J. Basin Sci. Eng. 2019, 27, 492–507. (In Chinese) [Google Scholar]
  22. Mann, H.B. Non-parametric tests against trend. Econometrica 1945, 13, 245–259. [Google Scholar] [CrossRef]
  23. Kendall, M.G. Rank Correlation Measures; Charles Griffin & Co. Ltd.: London, UK, 1975. [Google Scholar]
  24. Da, A.; Dias, C. Copula Inference for Finance and Insurance. Doctoral Thesis, ETH, Zurich, Switzerland, 2004. [Google Scholar]
  25. Guo, W.; Xu, G.H.; Shen, J.; Du, T. Research on runoff variation trend and hydrological situation variation in Minjiang River Basin. Yanggtze River 2018, 49, 64–68. (In Chinese) [Google Scholar]
  26. Lyu, J.Q. The Hydrological Response to Climate Change and Human Activity in Typical Regions, Northwest China. Doctoral Thesis, Xi’an University of Technology, Xi’an, China, 2012. [Google Scholar]
  27. Zar, J.H. Significance Testing of the Spearman Rank Correlation Coefficient. J. Am. Statist. Assoc. 2003, 67, 578–580. [Google Scholar] [CrossRef]
  28. Wang, S.J.; Li, L.; Yan, M. The contributions of climate change and human activities to the runoff yield changes in the middle Yellow River Basin. Geogr. Res. 2013, 32, 395–402. (In Chinese) [Google Scholar]
  29. Yang, S.Y.; Jiang, R.G.; Xie, J.C.; Zhu, J.W.; Wang, J. Trend and attribution analysis of runoff in Jinghe River. J. Xi’an Univ. Technol. 2019, 35, 186–191. (In Chinese) [Google Scholar]
  30. Budyko, M.I. Evaporation under natural conditions. Gidrometeorizdat, Leningrad; English translation by IPST: Jerusalem, Israel, 1948. [Google Scholar]
  31. Budyko, M.I. Climate and Life; Academic Press: New York, NY, USA, 1974. [Google Scholar]
  32. Gong, Y.; Mo, S.H.; Li, Z.L.; Shen, B. Study on runoff response in Xiaoli Basin based on Budyko equation. J. Xi’an Univ. Technol. 2018, 34, 439–446. (In Chinese) [Google Scholar]
  33. Wang, D.B.; Tang, T. A one-parameter Budyko model for water balance captures emergent behavior in Darwinian hydrologic models. Geophys. Res. Lett. 2014, 41, 4569–4577. [Google Scholar] [CrossRef] [Green Version]
  34. Allen, R.G. Crop Evapotranspiration-Guidelines for Computing Crop Water Requirements; Food and Agriculture Organization of the United Nations: Rome, Italy, 1998. [Google Scholar]
  35. Yang, D.W.; Herath, S.; Musiake, K. Development of a geomorphology-based hydrological model for large catchments. Proc. Hydraul. Eng. 1998, 42, 169–174. [Google Scholar] [CrossRef] [Green Version]
  36. Yang, D.W.; Herath, S.; Musiake, K. A hillslope-based hydrological model using catchment area and width functions. Hydrol. Sci. J. 2009, 47, 49–65. [Google Scholar] [CrossRef]
  37. Yang, D.W.; Koilke, T.; Tanizawa, H. Application of a distributed hydrological model and weather radar observations for flood management in the upper Tone River, Japan. Hydrol. Processes 2004, 18, 3119–3132. [Google Scholar] [CrossRef]
  38. Xu, Z.X. Hydrological Model; Science Press: Beijing, China, 2009. [Google Scholar]
  39. Bannister, D.; Herzog, M.; Graf, H.F.; Hosking, J.S.; Short, C.A. An assessment of recent and future temperature change over the Sichuan Basin, China, using CMIP5 climate models. J. Clim. 2017, 30, 6701–6722. [Google Scholar] [CrossRef] [Green Version]
Figure 1. Location of the Chabagou River watershed and analyzed hydrological stations.
Water 14 00257 g001
Figure 2. Distribution of select silt dams (storage capacity is > (0.1)106 m3) in the Chabagou River Watershed. (The selected sub-watersheds controlled by five large-scale silt dams are marked by different colors).
Water 14 00257 g002
Figure 3. Structural summary of the GBHM used in this analysis.
Water 14 00257 g003
Figure 4. Research methods and technology flow chart used in this study.
Water 14 00257 g004
Figure 5. Abrupt runoff transition test chart of Chabagou River Watershed using (a) Mann-Kendall mutation trend test; and (b) the ordered clustering method.
Water 14 00257 g005
Figure 6. Variation of land transfer in the Chabagou River Watershed 1980–2000 (a) and 2000–2010 (b).
Water 14 00257 g006
Figure 7. Annual NDVI variation trend in different periods in Chabagou River Watershed.
Water 14 00257 g007
Figure 8. Attribution based on Budyko theory.
Water 14 00257 g008
Figure 9. Maps showing the spatial distribution of annual runoff: (a) average; (b) actual evaporation; and (c) soil water. Data is for change period 1 (1967–1978), change period 2 (1979–1997) and change period 3 (1998–2010).
Water 14 00257 g009
Figure 10. Comparison of the relative contributions of climate change and human activities to decreases in runoff calculated by the four methods. (SCRCQ = slope change rate cumulative quantity; Runoff-R = the runoff reduction method).
Water 14 00257 g010
Figure 11. In the change period (2), Uncertainty analysis diagram for the four methods in change period (3) (SCRCQ = slope change rate cumulative quantity; Runoff-R = the runoff reduction method).
Water 14 00257 g011
Figure 12. In the change period (3), Uncertainty analysis diagram for the four methods in change period (3) (SCRCQ = slope change rate cumulative quantity; Runoff-R = the runoff reduction method).
Water 14 00257 g012
Figure 13. Changes in number of silt dams (storage capacity > (0.1)106 m3) in the Chabagou River Watershed.
Water 14 00257 g013
Figure 14. Simulated spatial variation of evaporation of large-scale silt dams. (a = change period (1); b = change period (2); c = change period (3)).
Water 14 00257 g014
Figure 15. Simulated spatial variation of soil water in large-scale silt dams. (a = change period (1); b = change period (2); c = change period (3)).
Water 14 00257 g015
Table 1. General information of the five large-scale silt dams with storage capacity > (0.5)106 m3 in the watershed.
NumberLongitude (°E)Latitude (°N)DEM (m a.s.l.)Control Area (km2)
No.1109°52′33″37°44′58″1042.1414.07
No.2109°52′31″37°44′30″1031.8317.07
No.3109°54′53″37°43′29″1001.6314.86
No.4109°58′40″37°39′26″960.2122.3
No.5109°58′08″37°39′27″929.0324.61
Table 2. Summary of change segment results for hydro-meteorological variables. M-K = Mann-Kendall test; O-L = ordered clustering method; C-A = cumulative anomaly method.
Change SegmentsM-KO-LC-APeriod
Baseline period1959–19601959–19651959–19651959–1966
Change period (1)1961–19661966–19991966–19681967–1978
Change period (2)1967–20042000–20101969–19971979–1997
Change period (3)2005–2010 1998–20101998–2010
Table 3. Detected variation trends of meteorological elements in Chabagou River Watershed. Sp = Spearman’s rank correlation coefficient; M-K = Mann-Kendall test.
Meteorological ElementsSpM-KResult
runoff depth↓-↓-↓-
precipitation↓-↓-↓-
temperature↑+↑+↑+
Note: ↑ and ↓ denote upward or downward trend; (+) detect significant trend at a 5% level of significance; (-) detect no significant trend at a 5% level of significance.
Table 4. Proportions of major land-use types in the Chabagou River Watershed in 1960, 1980, 1990, 1995, 2000, 2005 and 2010.
Land Use1960198019901995200020052010
Crop (%)10.0056.9957.0657.2757.2757.2456.39
Forest (%)4.103.153.152.532.912.913.07
Pasture (%)039.7739.7140.0339.6539.6940.35
Bare soil (%)83.70000000
Residential area (%)00.090.090.170.170.170.17
water (%)0000000.02
Table 5. Slope change rate of cumulative runoff precipitation and air temperature.
Change SegmentsAccumulation Runoff DepthAccumulation PrecipitationAccumulation Temperature
SlopeGradientSlopeGradientSlopeGradient
Baseline period53.61 423.57 8.05
Change period (1)46.95–0.12377.14–0.117.97–0.01
Change period (2)36.40–0.32393.94–0.078.270.03
Change period (3)52.57–0.02498.270.189.590.19
Table 6. Contribution rate of runoff change by the slope change rate cumulant quantity.
Change SegmentsClimate ChangeHuman Activities
Change period (1)80.23%19.77%
Change period (2)30.30%69.69%
Change period (3)76.57%23.43%
Table 7. Contribution rate of runoff change by the runoff reduction method.
Change SegmentsRunoff DepthClimate ChangeHuman Activities
Real ValueSimulate ValueVariationContributeVariationContribute
(mm)(mm)(mm)(%)(mm)(%)
Baseline period59.38
Change period (1)52.9555.913.4753.922.9646.08
Change period (2)36.152.76.6828.6916.671.31
Change period (3)46.6558.324.5535.728.1864.28
Table 8. Rates of contribution to runoff change by the Budyko method.
Change SegmentsClimate ChangeHuman Activities
Contribution (mm)Contribution Rate (%)Contribution (mm)Contribution Rate (%)
Change period (1)–138.2448.86144.6751.14
Change period (2)–113.4445.35136.7354.65
Change period (2)–152.9048.00165.6452.00
Table 9. Estimated changes in runoff based on the GBHM due to climate variability and land-use changes in the Chabagou River Watershed.
PeriodPrecipitation (mm)Evapotranspiration (mm)Actual Evapotranspiration (mm)
ET/P Actual ET/P
Baseline period381.61098.42.88198.460.52
Change period (1)325.591136.493.49201.340.62
Change period (2)329.241273.173.87151.390.46
Change period (3)4811136.082.36308.110.64
PeriodSoil Water (mm)Runoff Depth (mm)Proportional Change in Annual Runoff (%)
S/P R/PCClimateHHuman
Baseline period13.170.0356.230.15
Change period (1)7.550.0225.90.0874.425.6
Change period (2)15.50.0521.30.0635.764.3
Change period (3)29.90.0630.340.0646.353.7
Table 10. Simulated evaporation and soil water in sub-watershed controlled by five large-scale silt dams (In = increase).
PeriodNo.1No.2No.3
Actual ETInSoil WaterInActual ETInSoil WaterInActual ETInSoil WaterIn
Baseline period193.3 mm 11.7 mm 194.6 mm 11.1 mm 200.8 mm 12.6 mm
Change period (1)213.4 mm0.108.2 mm0.30213.6 mm0.108.1 mm0.27213.2 mm0.068.9 mm0.29
Change period (2)198 mm0.0217.6 mm0.50197.9 mm0.0217.6 mm0.59197.7 mm0.0217.6 mm0.40
Change period (3)305 mm0.5830.6 mm1.62304.9 mm0.5730 mm1.70307.9 mm0.5331 mm1.46
PeriodNo.4No.5Average
Actual ETInSoil WaterInActual ETInSoil WaterInActual ETInSoil WaterIn
Baseline period202.3 mm 12.3 mm 201.5 mm 13.9 mm 198.5 mm 12.32 mm
Change period (1)220.2 mm0.098.5 mm0.31214.3 mm0.068.1 mm0.42198.5 mm0.088.36 mm0.32
Change period (2)190 mm0.0617.5 mm0.42196.8 mm0.0217.5 mm0.26198.5 mm0.0317.56 mm0.43
Change period (3)314.7 mm0.5631 mm1.52304.9 mm0.5129.1 mm1.09198.5 mm0.5530.34 mm1.48
Publisher’s Note: MDPI stays neutral with regard to jurisdictional claims in published maps and institutional affiliations.

