Article

Enhancing Informed Decisions for Coastal Groundwater Sustainability: A Network Analysis of Water-Related Indicator Results from 122 Cities

1
Department of Civil and Environmental Engineering, Hongik University, Seoul 04066, Korea
2
Department of Land, Water and Environmental Research, Korea Institute of Civil Engineering and Building Technology, Goyang-si 10223, Korea
3
KWR Water Research Institute, Groningenhaven 7, 3430 BB Nieuwegein, The Netherlands
4
Copernicus Institute of Sustainable Development, Utrecht University, Princetonlaan 8a, 3584 CB Utrecht, The Netherlands
*
Author to whom correspondence should be addressed.
Water 2022, 14(2), 262; https://doi.org/10.3390/w14020262
Submission received: 20 December 2021 / Revised: 12 January 2022 / Accepted: 13 January 2022 / Published: 17 January 2022

Abstract

:
In many places around the globe, groundwater has been threatened by various pressures, which calls for better management strategies for groundwater sustainability. In this study, we suggest a novel framework for identifying factors critical to coastal groundwater based on results from City Blueprint (CB) assessments. By compiling the 5856 indicator results of the City Blueprint Approach (CBA) from 122 cities and analyzing the correlation between these indicators, we constructed City Blueprint networks (CBN) by using a complex network modeling approach for three groups of cities: all 122 cities, 40 coastal, and 82 non-coastal cities. These networks were then analyzed for their node centralities to identify major factors that influence coastal groundwater management. Interestingly, our analysis revealed that groundwater has various indirect but important links with the factors that are typically unexplored in the literature. We also assessed the CB of the two largest coastal cities in South Korea. By combining the results of network analysis and CB assessment of the two cities, we could identify the indicators that are potentially at risk regarding coastal groundwater. We propose the CBN as a novel approach to unveil underestimated or hidden factors related to the target system (e.g., groundwater), which allows extensive options for sustainable groundwater management.

1. Introduction

Global water use has been increasing primarily by growth in population and economic activities [1]. While the majority of global water resources are used by the agricultural sector, large cities (e.g., megacities) form additional drivers that exacerbate the stress on water resources [2,3,4]. A large number of cities are located in coastal regions, which implies that, when it is compounded with their expanding ecological footprint, these cities can contribute to already diminishing freshwater resources. To meet increasing freshwater demands along with the diminishing surface water in some regions, the groundwater extraction has been continuously elevated, causing adverse effects on its quantity and quality, such as groundwater overexploitation [5] and groundwater contamination [6]. Especially in coastal regions, salinization by seawater intrusion, which is the landward incursion of seawater caused by sea-level rise or over-pumping, is often the major contributor that makes groundwater management more difficult [7,8,9].
Groundwater often serves as a primary water resource in coastal cities. Therefore, to cope with increasing demands and diminishing resources in terms of both quantity and quality, it is necessary to establish a strategy for coastal groundwater sustainability [5,10]. We follow the definition of groundwater sustainability as the development and use of groundwater in a manner that can be maintained for an indefinite time without causing unacceptable environmental, economic, or social consequences [11]. As a part of the effort, various studies have developed and applied indicators or indices for evaluating the sustainability of groundwater management; for example, see [12] and Table 1 therein. However, when multiple indicators were used, generally, those indicators were assessed independently, assuming that improving a specific indicator would directly affect the sustainability of groundwater regardless of the inter-dependence on and dynamics of other indicators. Indeed, factors that contribute to groundwater sustainability tend to be interrelated in a complex way, often over-emphasizing the role of a specific indicator while other factors are neglected or under-emphasized. Thus, an indicator analyzed independently for assessing groundwater management sustainability (e.g., [13,14]) can provide only a rather limited understanding of the entire system, which includes a complex network of environmental, economic, and social sustainability aspects [15].
In the Republic of Korea (South Korea hereafter), the groundwater usage of coastal cities is generally larger than the national average or that of non-coastal cities. For instance, in Busan and Incheon, two of the largest coastal cities in Korea, 5.9% and 7.0% of freshwater use is from groundwater, while the figures are only 3% and 1.7% for the national average and the capital Seoul, respectively. In South Korea, most of the groundwater is used for domestic (41.4%) and agricultural purposes (51.9%). In Busan and Incheon, domestic uses are larger than agricultural: 75.3% and 57.8% for domestic whereas agriculture use, respectively, 14.4% and 38.9% of the supplied groundwater [16,17].
The City Blueprint Approach (CBA) is a diagnosis tool for assessing sustainable urban water management [18,19]. A city can benchmark other leading cities by comparing indicator scores with those cities [18]. While the CBA incorporates a broad set of indicators to cover the factors that are both, directly and indirectly, related to urban water management, the relationships or interactions between those indicators are not well accounted for. Revealing inter-relationships between indicators is important as it enables the identification of critical factors that play a central role in affecting groundwater systems and thus their management. By addressing such key factors, various groundwater management aspects can be addressed simultaneously. To explore the possibility of constructing inter-relationships between the indicators and identifying critical indicators in a scientific way, we apply a network analysis approach.
Various systems that have been analyzed by the complex network approach often consist of physical elements, and the relationships between them are clearly defined. Examples include the World Wide Web [20], water distribution systems [21], power grids [22,23], road networks [24], and ecological networks [25]. There are only a few types of a network that consists of factors (e.g., as non-physical elements) influencing a system and their associations. One example is found in psychological studies (i.e., symptom network), in which mental disorders (e.g., depression, anxiety disorders, and abuse) are defined as nodes, and interactions between symptoms are defined as edges [26,27,28]. The main purpose of this network analysis is to identify major symptoms that have a critical effect on, for example, HIV infection [29].
The overarching goal of this study started from acknowledging that existing indicators for groundwater sustainability often had been analyzed and assessed independently without scrutinizing the relationships between the indicators. The revelation of the relationships between the indicators is important because it will help decision-makers to prioritize the improvement of management factors and avoid over-investment and mismanagement. It also helps to discover the critical but hidden indicators, which were conventionally under-emphasized because of unclear relationships or geo-physically in a distant location. Since its first development and application, City Blueprint indicators data have been continuously accumulated for more than 120 cites, which enabled us to conduct a statistical analysis to reveal relationships between the indicators. Moreover, we adopted a complex network approach that has been extensively used for analyzing the connectivity and topology of components embedded in a networked system. In sum, the objectives of this study are to (1) assess the current status of water management of Busan and Incheon, the two major coastal cities in South Korea, by applying CBA, (2) identify major influencing factors of coastal groundwater by network analysis through the construction of a factor network based on the CBA results of 122 cities (40 coastal cities and 82 non-coastal cities), and (3) suggest strategies for more informed decisions that can improve the sustainability of groundwater management in cities across the globe and particularly in the cities of Busan and Incheon in South Korea.

2. Materials and Methods
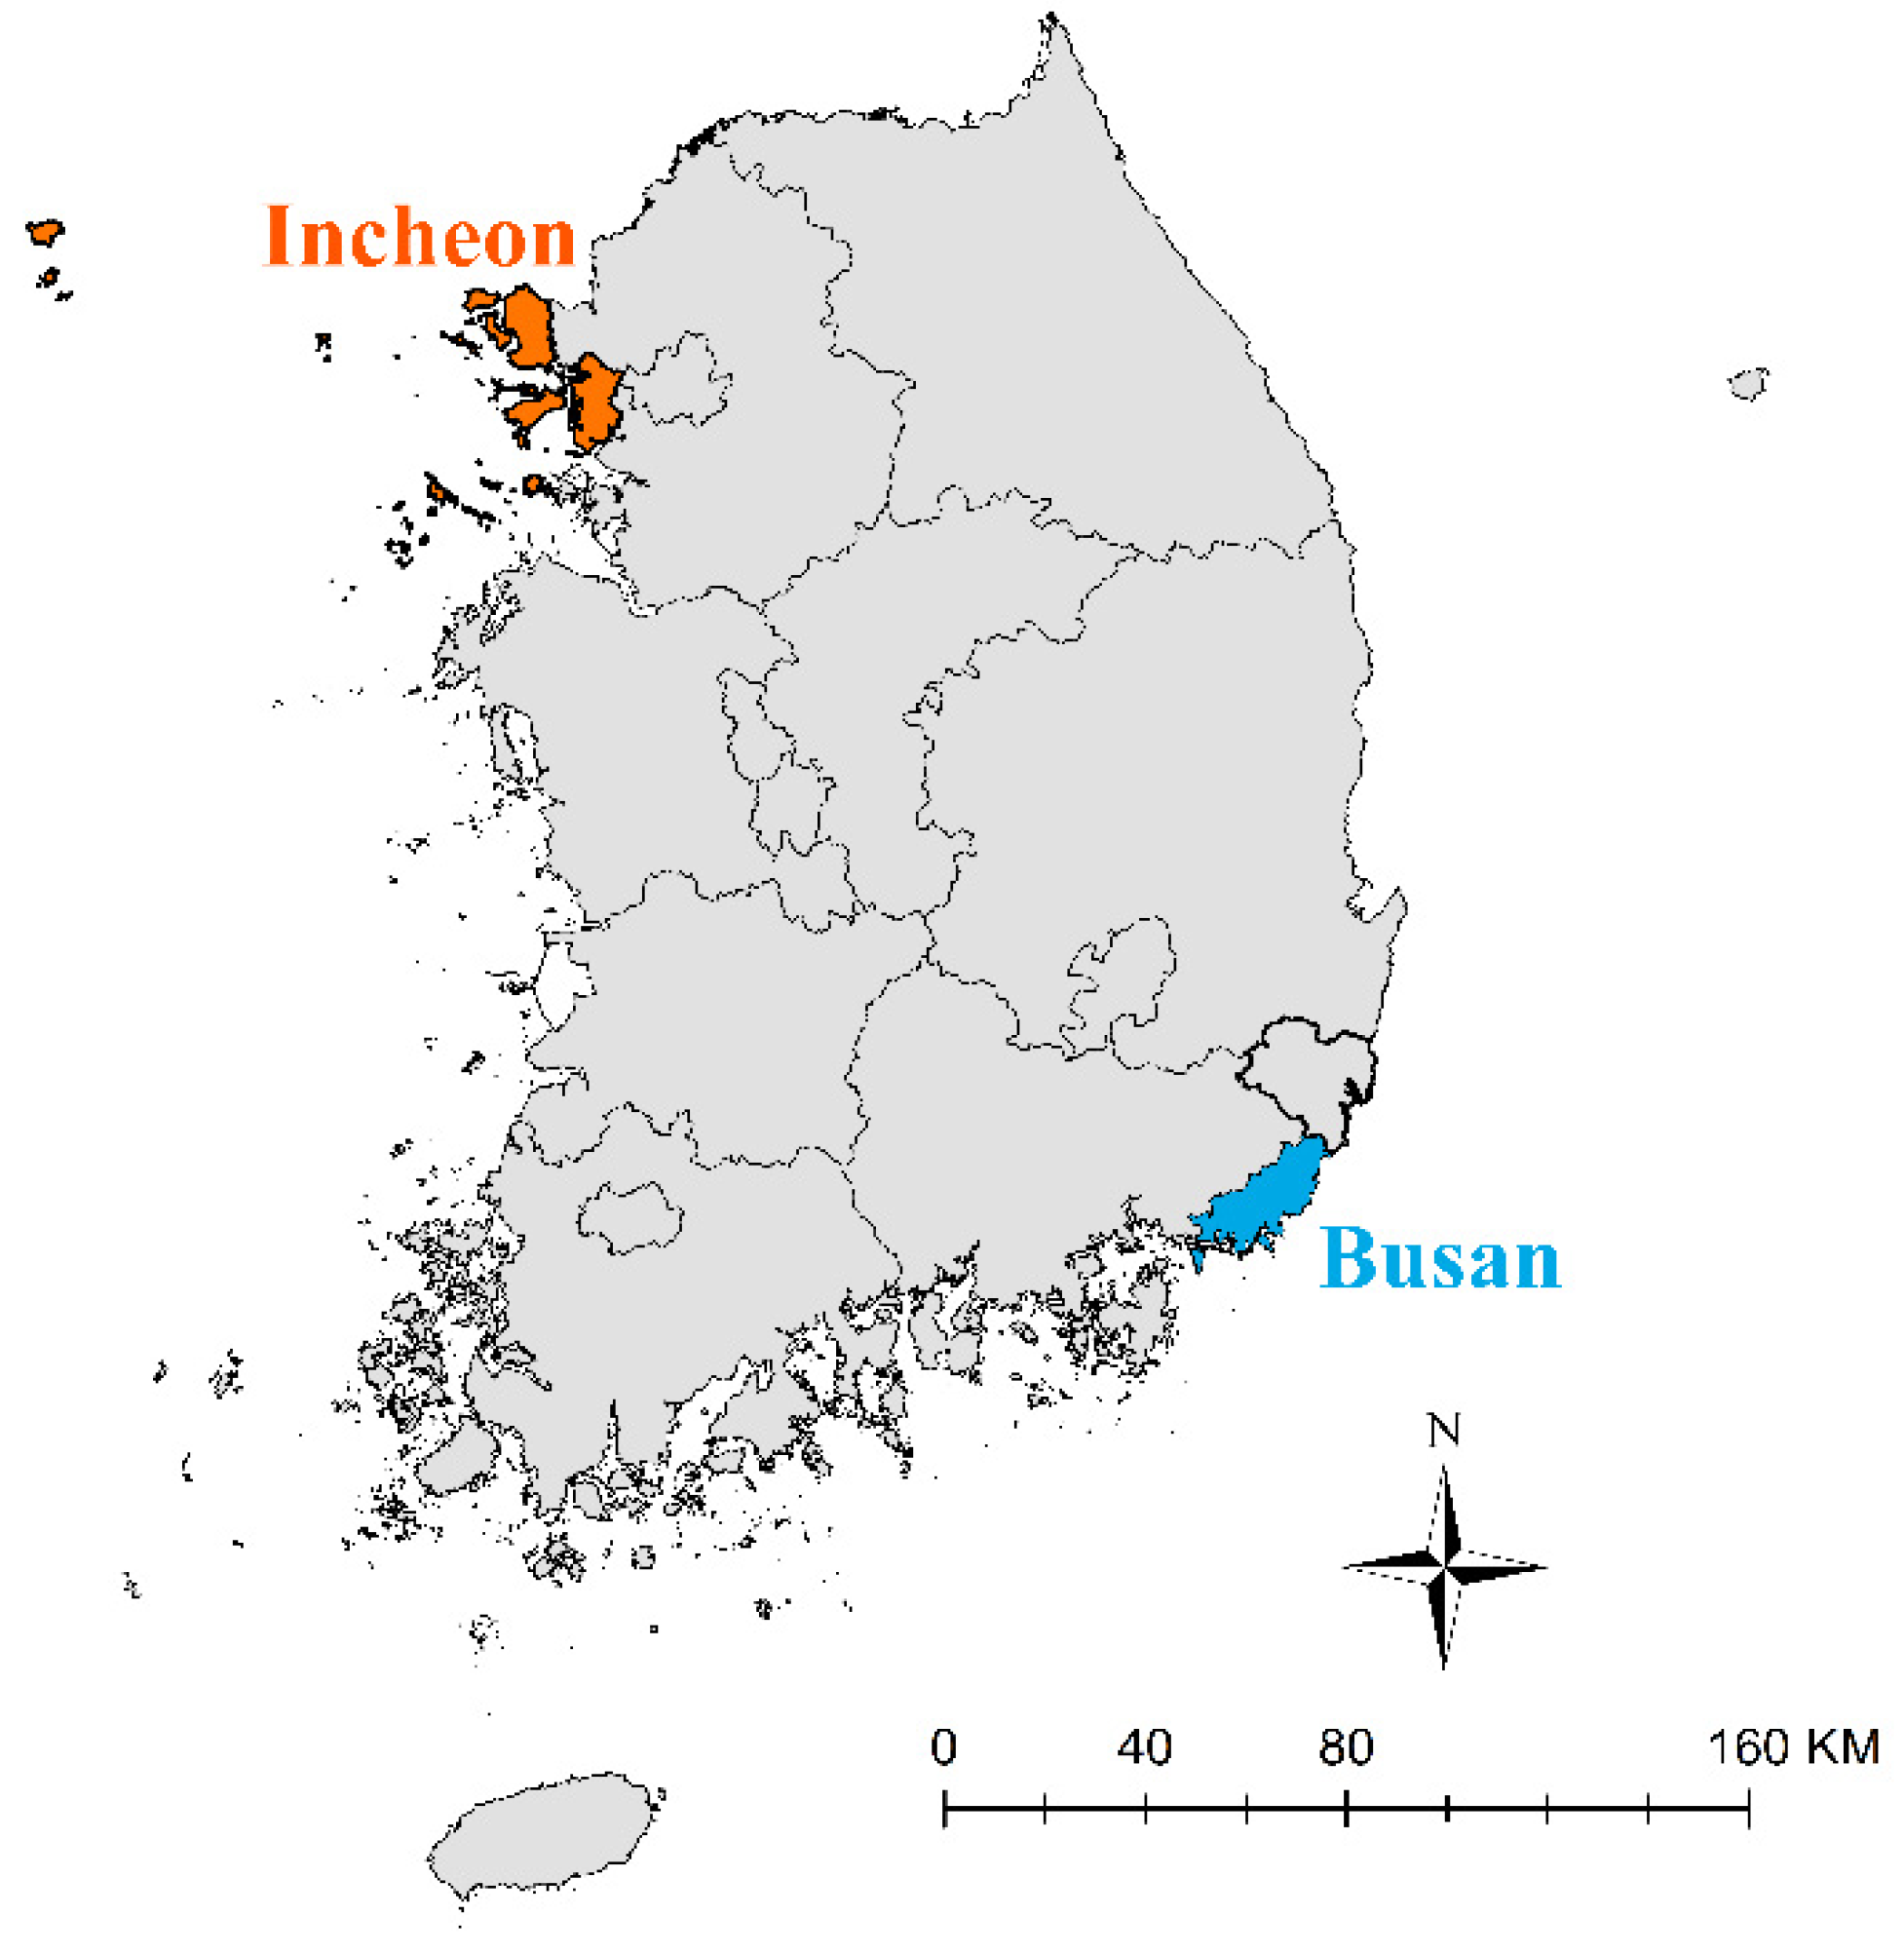
2.1. Study Area

For the analysis, we selected Busan and Incheon, which are the largest coastal cities in South Korea (Figure 1). As described earlier, the portions of groundwater use for their freshwater sources in these two cities are larger than the national average and capital Seoul. These portions are expected to rise because the recent water management policy set by the South Korean government requires diversification and expansion of freshwater sources. Moreover, due to their location close to coasts, the vulnerability of the groundwater systems that support these two cities is likely to increase by seawater intrusion. These anticipated increases in both groundwater demand and vulnerability call for the more proactive management for sustainability, which requires clear identification of factors or indicators critical to the groundwater system.
Busan has a population of 3.4 million [30] and is located on the Southeastern tip of the Korean Peninsula (Figure 1). Within the city, discharge from groundwater and contamination have frequently occurred along subway tunnels [31]. On the coastal part, the groundwater along the Suyeong Bay has been reported as being vulnerable to seawater intrusion because the area is composed of sand beaches and reclaimed land [32]. Moreover, the coastal aquifer of the Nakdong River delta is contaminated by seawater and chemical components of sediments [33].
Incheon has a population of 3.0 million [30] and is the second-largest coastal city after Busan. Incheon is located in the northwestern part of South Korea, downstream of the Han River, and its shoreline faces the Yellow Sea (Figure 1). The shallow groundwater in this city exhibited a very high level of Electrical Conductivity (EC), which indicates a deterioration of groundwater quality [34]. Specifically, among 12 seawater intrusion monitoring networks in Incheon, three measured between 1000 to 3000 μs/cm, which affects vegetation and agricultural practices and four of them measured over 3000 μs/cm, which requires a desalinization treatment prior to human consumption [35]. Typically, EC below 1500 μs/cm is regarded as freshwater, whereas over 2500 μs/cm as being unrecommendable for human consumption and over 10,000 μs/cm as being unsuitable for human consumption and irrigation [36]. Moreover, over 7200 small and medium-sized manufacturers in this city have discharged large amounts of untreated wastewater, which further pollutes the already vulnerable groundwater [37].

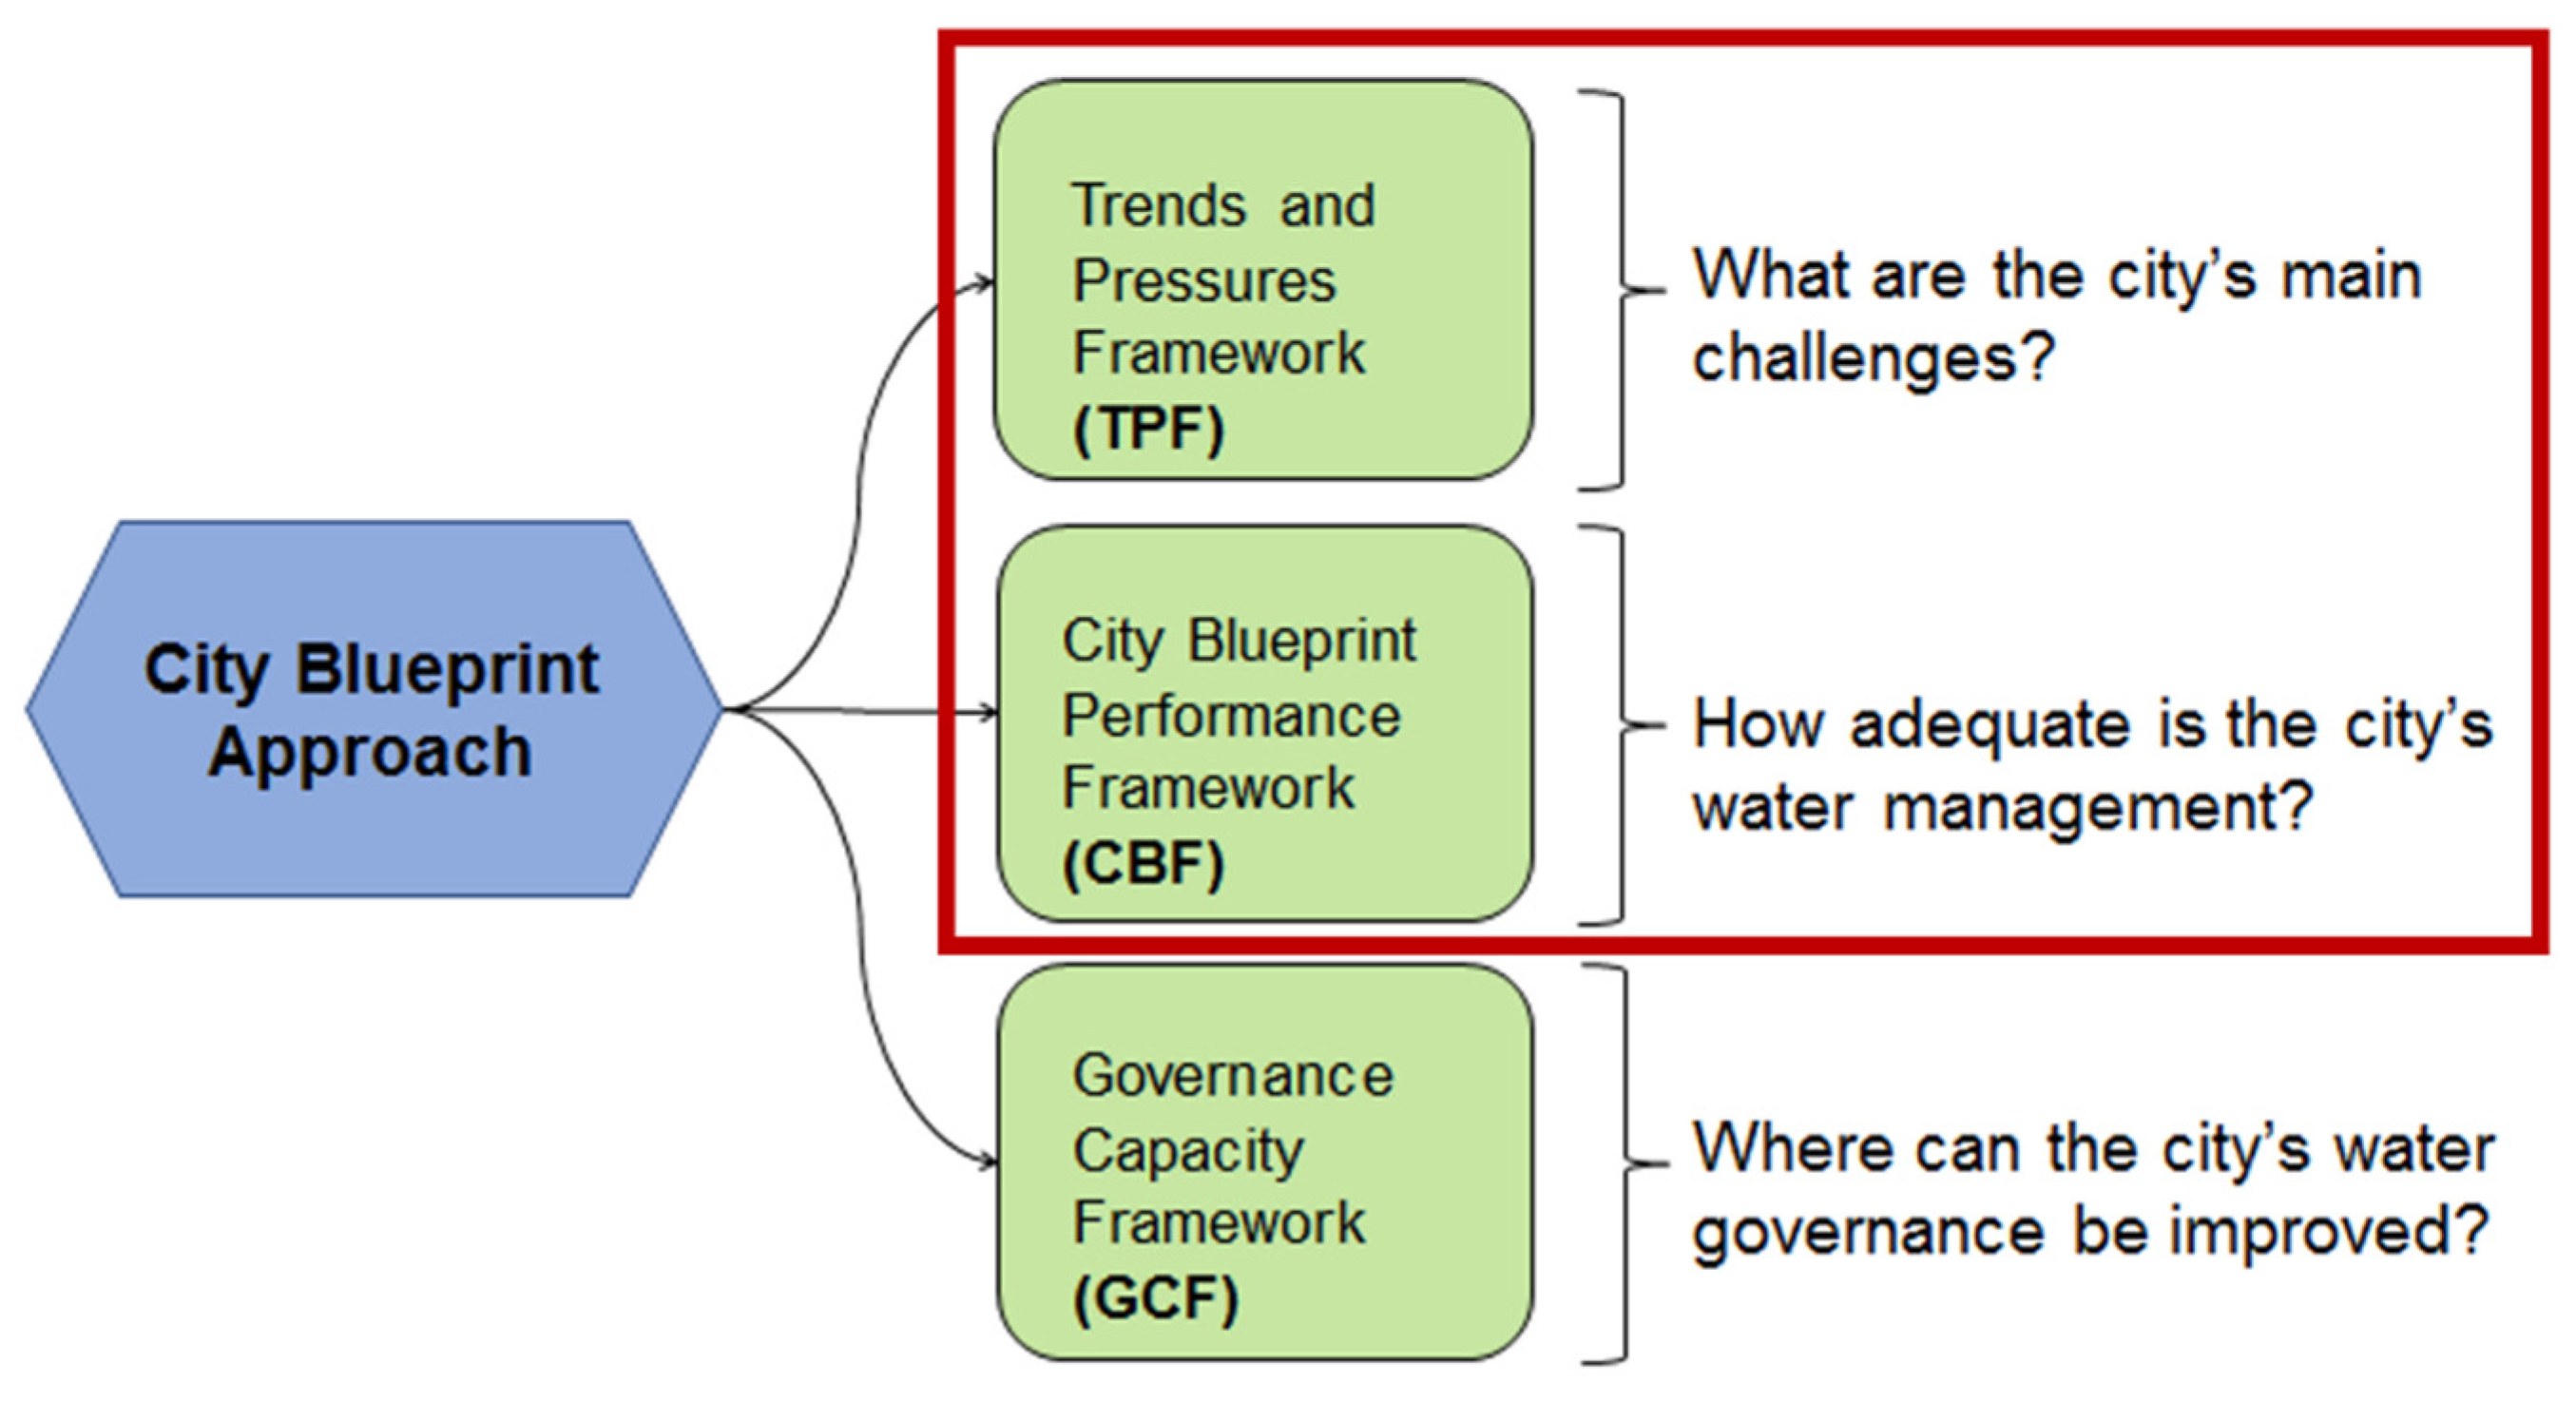
2.2. City Blueprint Approach

A City Blueprint Approach (CBA) is a tool for assessing the sustainability of urban water management with multiple indicators, which are standardized for Integrated Water Resources Management (IWRM) on a city level [18,19,38,39]. The CBA reflects the wide scope and many stakeholders, and it covers a broad range of aspects, such as water security, water quality, drinking water, sanitation, infrastructure, biodiversity, attractiveness, and governance [18,40]. The CBA consists of three complimentary frameworks: the Trends and Pressures Framework (TPF), the City Blueprint Framework (CBF), and the Governance Capacity Framework (GCF) (Figure 2). The TPF assesses the main challenges among four categories (social, environmental, financial, and governance) of urban IWRM, the CBF assesses water management of the city, and the GCF assesses the capacity to govern specific urban water challenges, such as groundwater management [18]. For our analysis, TPF and CBF are selectively used because these two frameworks (1) evaluate mostly by using public data and (2) include indicators of groundwater scarcity (in TPF) and groundwater quality (in CBF), which are the main focus of this study. The data of TPF and CBF for 122 cities in 52 countries were obtained from previous studies (e.g., [41,42,43,44]) and the TPF and CBF databases.
The TPF comprises 24 indicators, which are divided into four categories (Table 1). The 24 TPF indicators are standardized to a scale of 0–10 and expressed as a ‘degree of concern’: no concern (0–2), little concern (2–4), medium concern (4–6), concern (6–8), and great concern (8–10). Typically, national-scale data are available for calculating TPF in most countries. However, in our two case study cities, city-level data were also used for some indicators (i.e., urbanization rate, female participation, urban drainage flood, seawater intrusion, heat risk, air quality, unemployment rate, and poverty rate).
The CBF also comprises 24 indicators, which are divided into seven categories: basic water services, water quality, wastewater treatment, water infrastructure, solid waste, climate adaptation, and plans and actions (Table 1). Most of the CBF indicators are calculated by city-level data and standardized to a scale of 0–10, in which a higher score implies a good performance and a low score a poor performance.

2.3. Correlation Analysis

The accumulation of City Blueprint data from more than 120 cites since 2012 when the approach was first developed, was our motivation to build the City Blueprint (CB) network (see Section 2.4). Although some data may have been outdated, most of the data were compiled in less than a decade, which seems to be suitable for city-wise or nation-wise analysis. Before constructing the network, by using the scores of 48 indicators obtained from 122 cities, correlation analysis was conducted to identify indicators that are significantly correlated with groundwater. As the scores for each indicator did not follow a normal distribution, we used Spearman’s rank correlation coefficient (rs) by transforming the scores into ranks [45]. The rs between variables x and y is calculated as in Equation (1).
r s = 1 n i = 1 n ( ( R ( x i ) R ( x ) ¯ ) × ( R ( y i ) R ( y ) ¯ ) ) 1 n i = 1 n ( R ( x i ) R ( x ) ¯ ) 2 × 1 n i = 1 n ( R ( y i ) R ( y ) ¯ ) 2
where, R(x) and R(y) are the ranks of x and y, and R ( x ) ¯ and R ( y ) ¯ are the mean ranks.
The correlations between 48 indicators are calculated for three groups of cities: (1) the total of 122 cities, (2) the subgroup of 40 coastal cities, and (3) a subgroup of 82 non-coastal cities. Coastal cities are those at the interface or transition areas between land and sea, including large inland lakes [46].

2.4. Construction of City Blueprint Network

We constructed the so-called City Blueprint (CB) network to identify major influencing factors of the groundwater. The CB network was composed of groundwater-related indicators in the City Blueprint framework as nodes, and correlation between the nodes (see Equation (1)) was used to form edges (see Tables S1–S3 for correlation heatmaps for the three cases). Node numbers (ID), which were given to all indicators, are shown in Table 2. While a correlation coefficient reflects the strength of inter-relationship between a pair of nodes, it does not provide a causal relationship between those nodes. For this reason, the groundwater-centered CB network is constructed as an undirected weighted network.
The weights of edges are assigned based on correlation coefficients of which the absolute value is equal to or greater than 0.5. Then, groundwater-related indicators were selected by limiting the indicators to those that had 1st and 2nd-level linkages with the indicators of groundwater scarcity (ID #10) and quality (ID #30). That is, 1st-level indicators are directly linked with either groundwater scarcity or quality, while 2nd-level indicators are directly linked with 1st-level indicators (Figure 3). Note that a 2nd-level indicator can be linked with more than one 1st-level indicator. As a result, coastal groundwater scarcity and quality have a 2nd-level linkage to each other. There were five indicators, including, for example, urban drainage flood (ID #5) and land subsidence (ID #8), which had 1st-level linkage with coastal groundwater scarcity (ID #10). Moreover, there were 10 indicators, including, for example, land subsidence (ID #8) and seawater intrusion (ID #11), which had 1st-level linkage with coastal groundwater quality (ID #30).

2.5. Metrics for Network Analysis

Identifying a high centrality node is important to find a key component of a network [47,48]. For the case of the CB network, high centrality may indicate which indicator plays a critical role in affecting the groundwater system and should have a high priority for managing groundwater sustainability. We calculated three network metrics, node strength (i.e., weighted degree centrality) [48], weighted closeness centrality (closeness hereafter) [49], and weighted betweenness centrality (betweenness hereafter) [50], for analyzing the groundwater-centered CB network. Table 3 shows the description of each weighted metric. The node strength (s(i)) is calculated by multiplying the adjacency matrix (Aij) by weights between node i and j. For calculating closeness and betweenness, the weighted shortest path ( d i j w ), which is calculated by the minimum value of the reciprocal sum of weights, was calculated. The closeness of node i ( C C w ( i ) ) is calculated by the reciprocal of the sum of the d i j w from node i to node number N, and betweenness ( C B w ( i ) ) is calculated by the sum of the number of weighted shortest paths between node j and k that go through node i ( g j k w ( i ) ) divided by those paths ( g j k w ).

3. Results

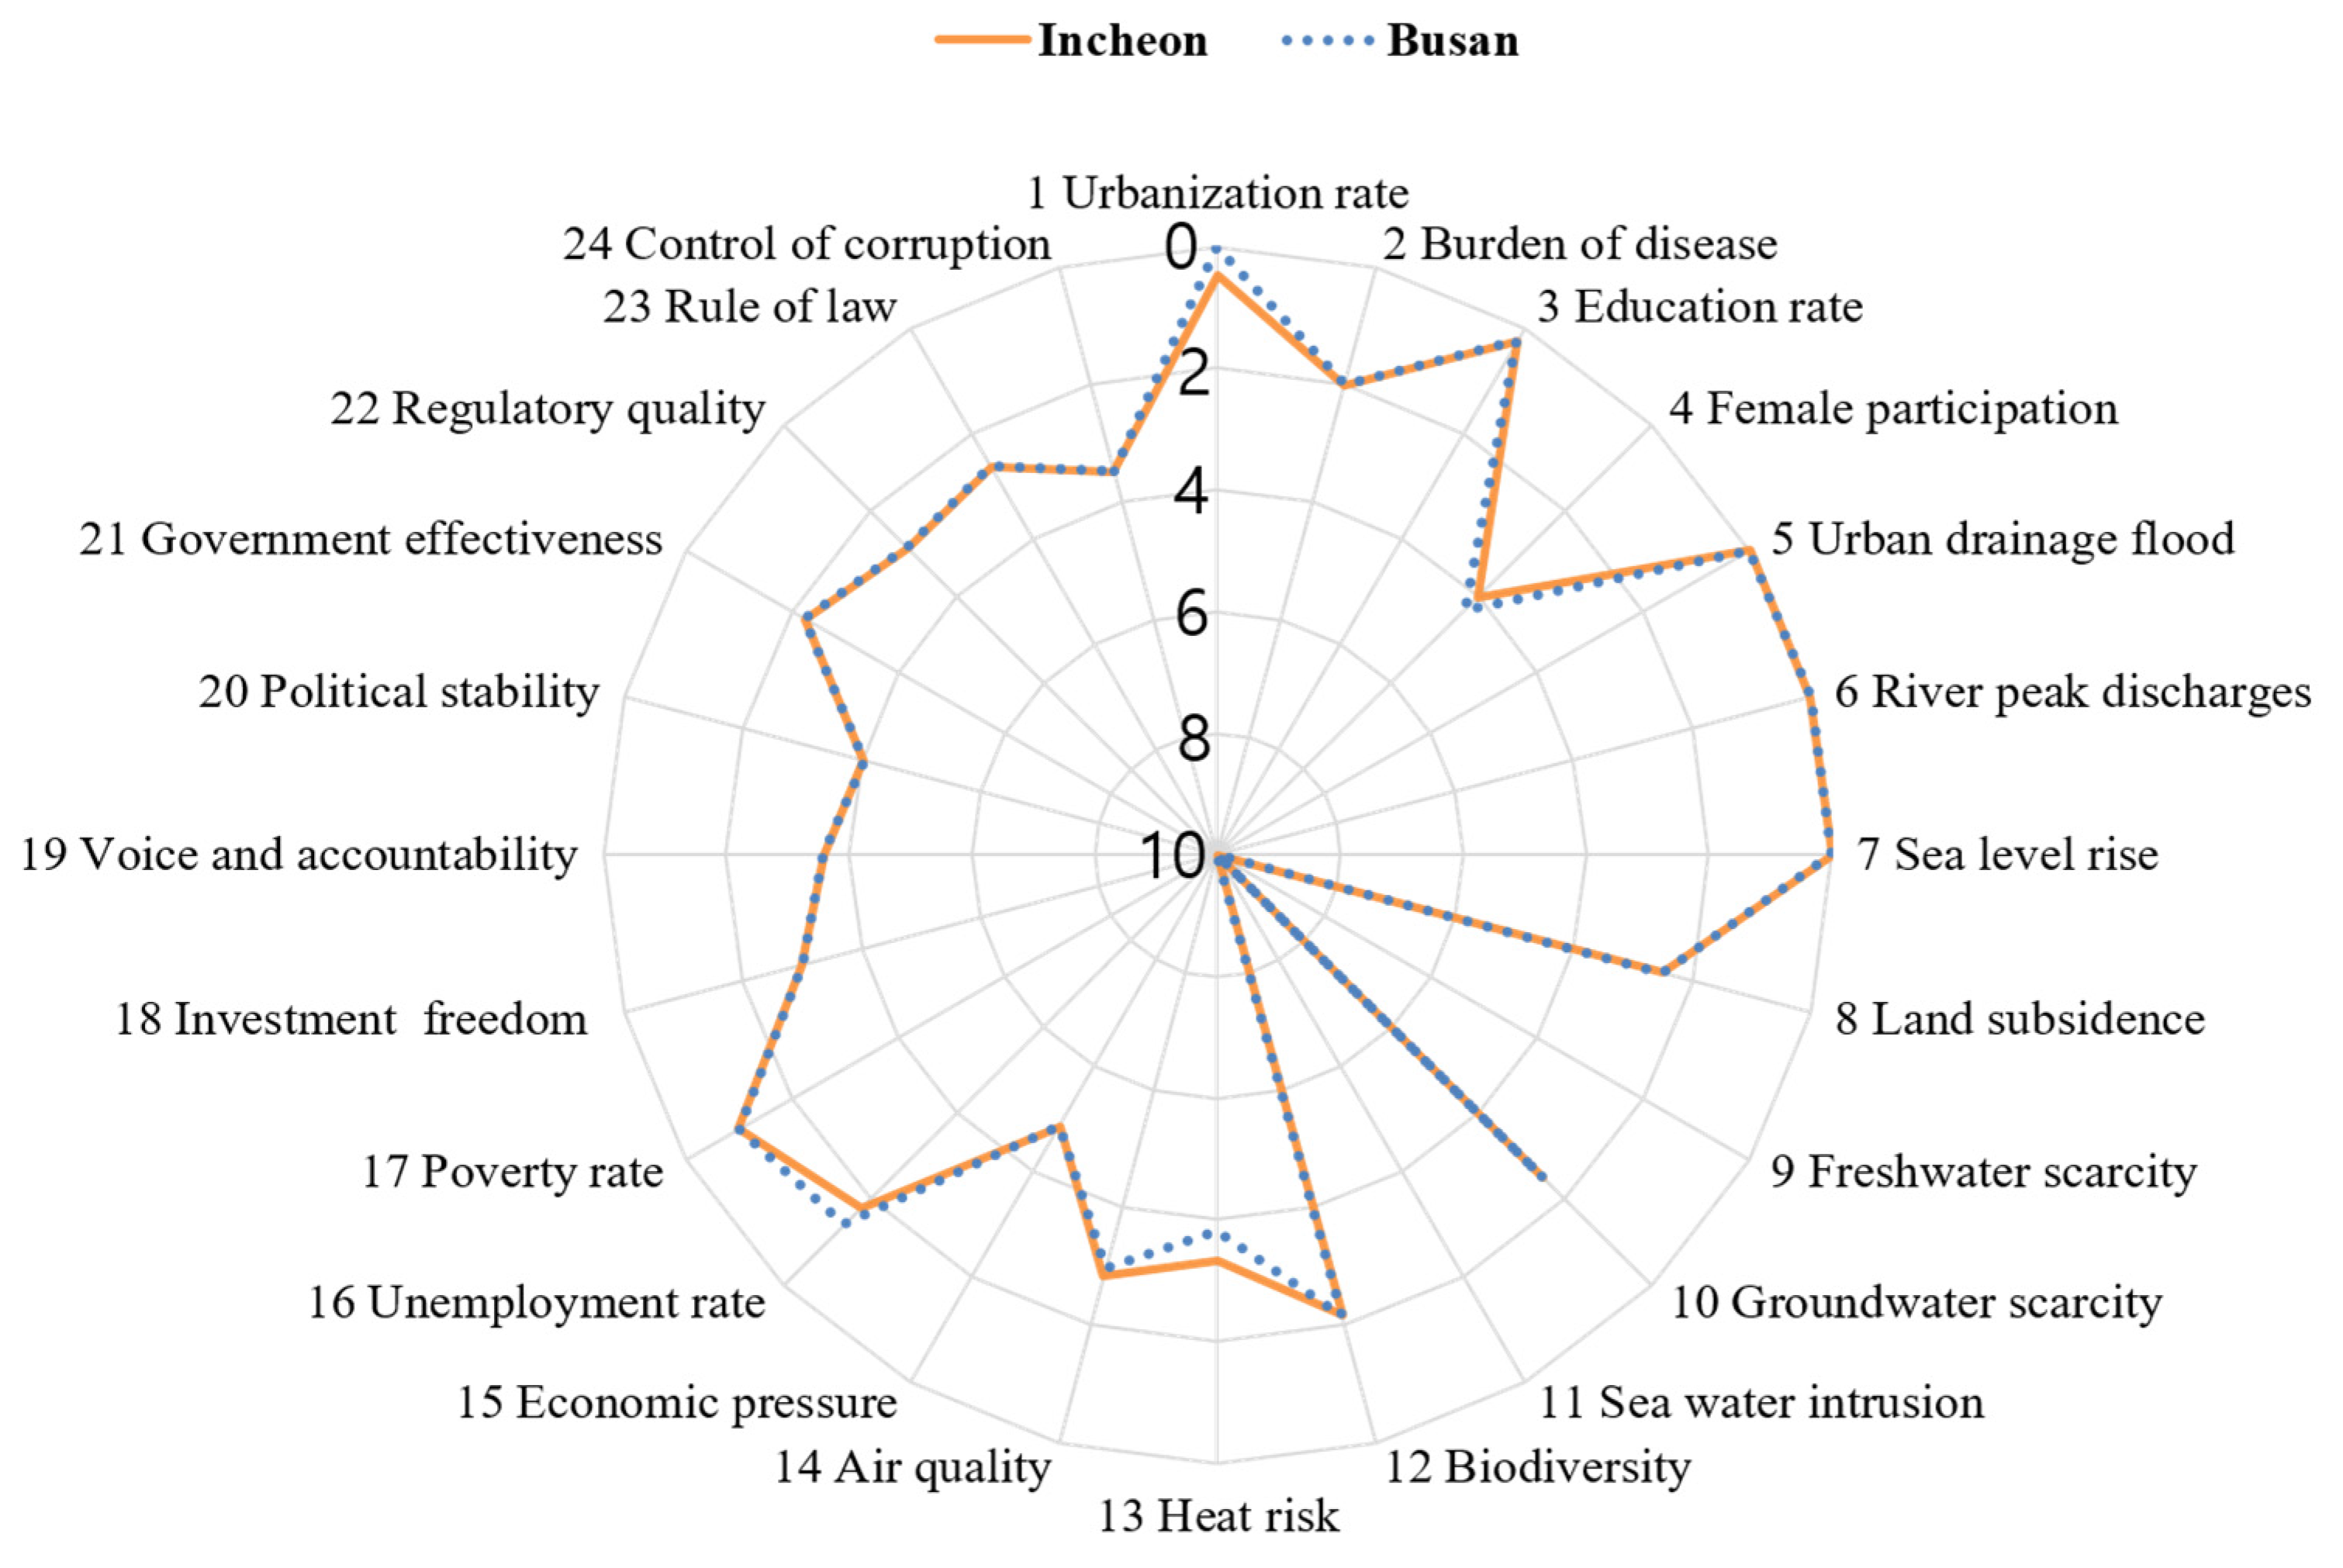
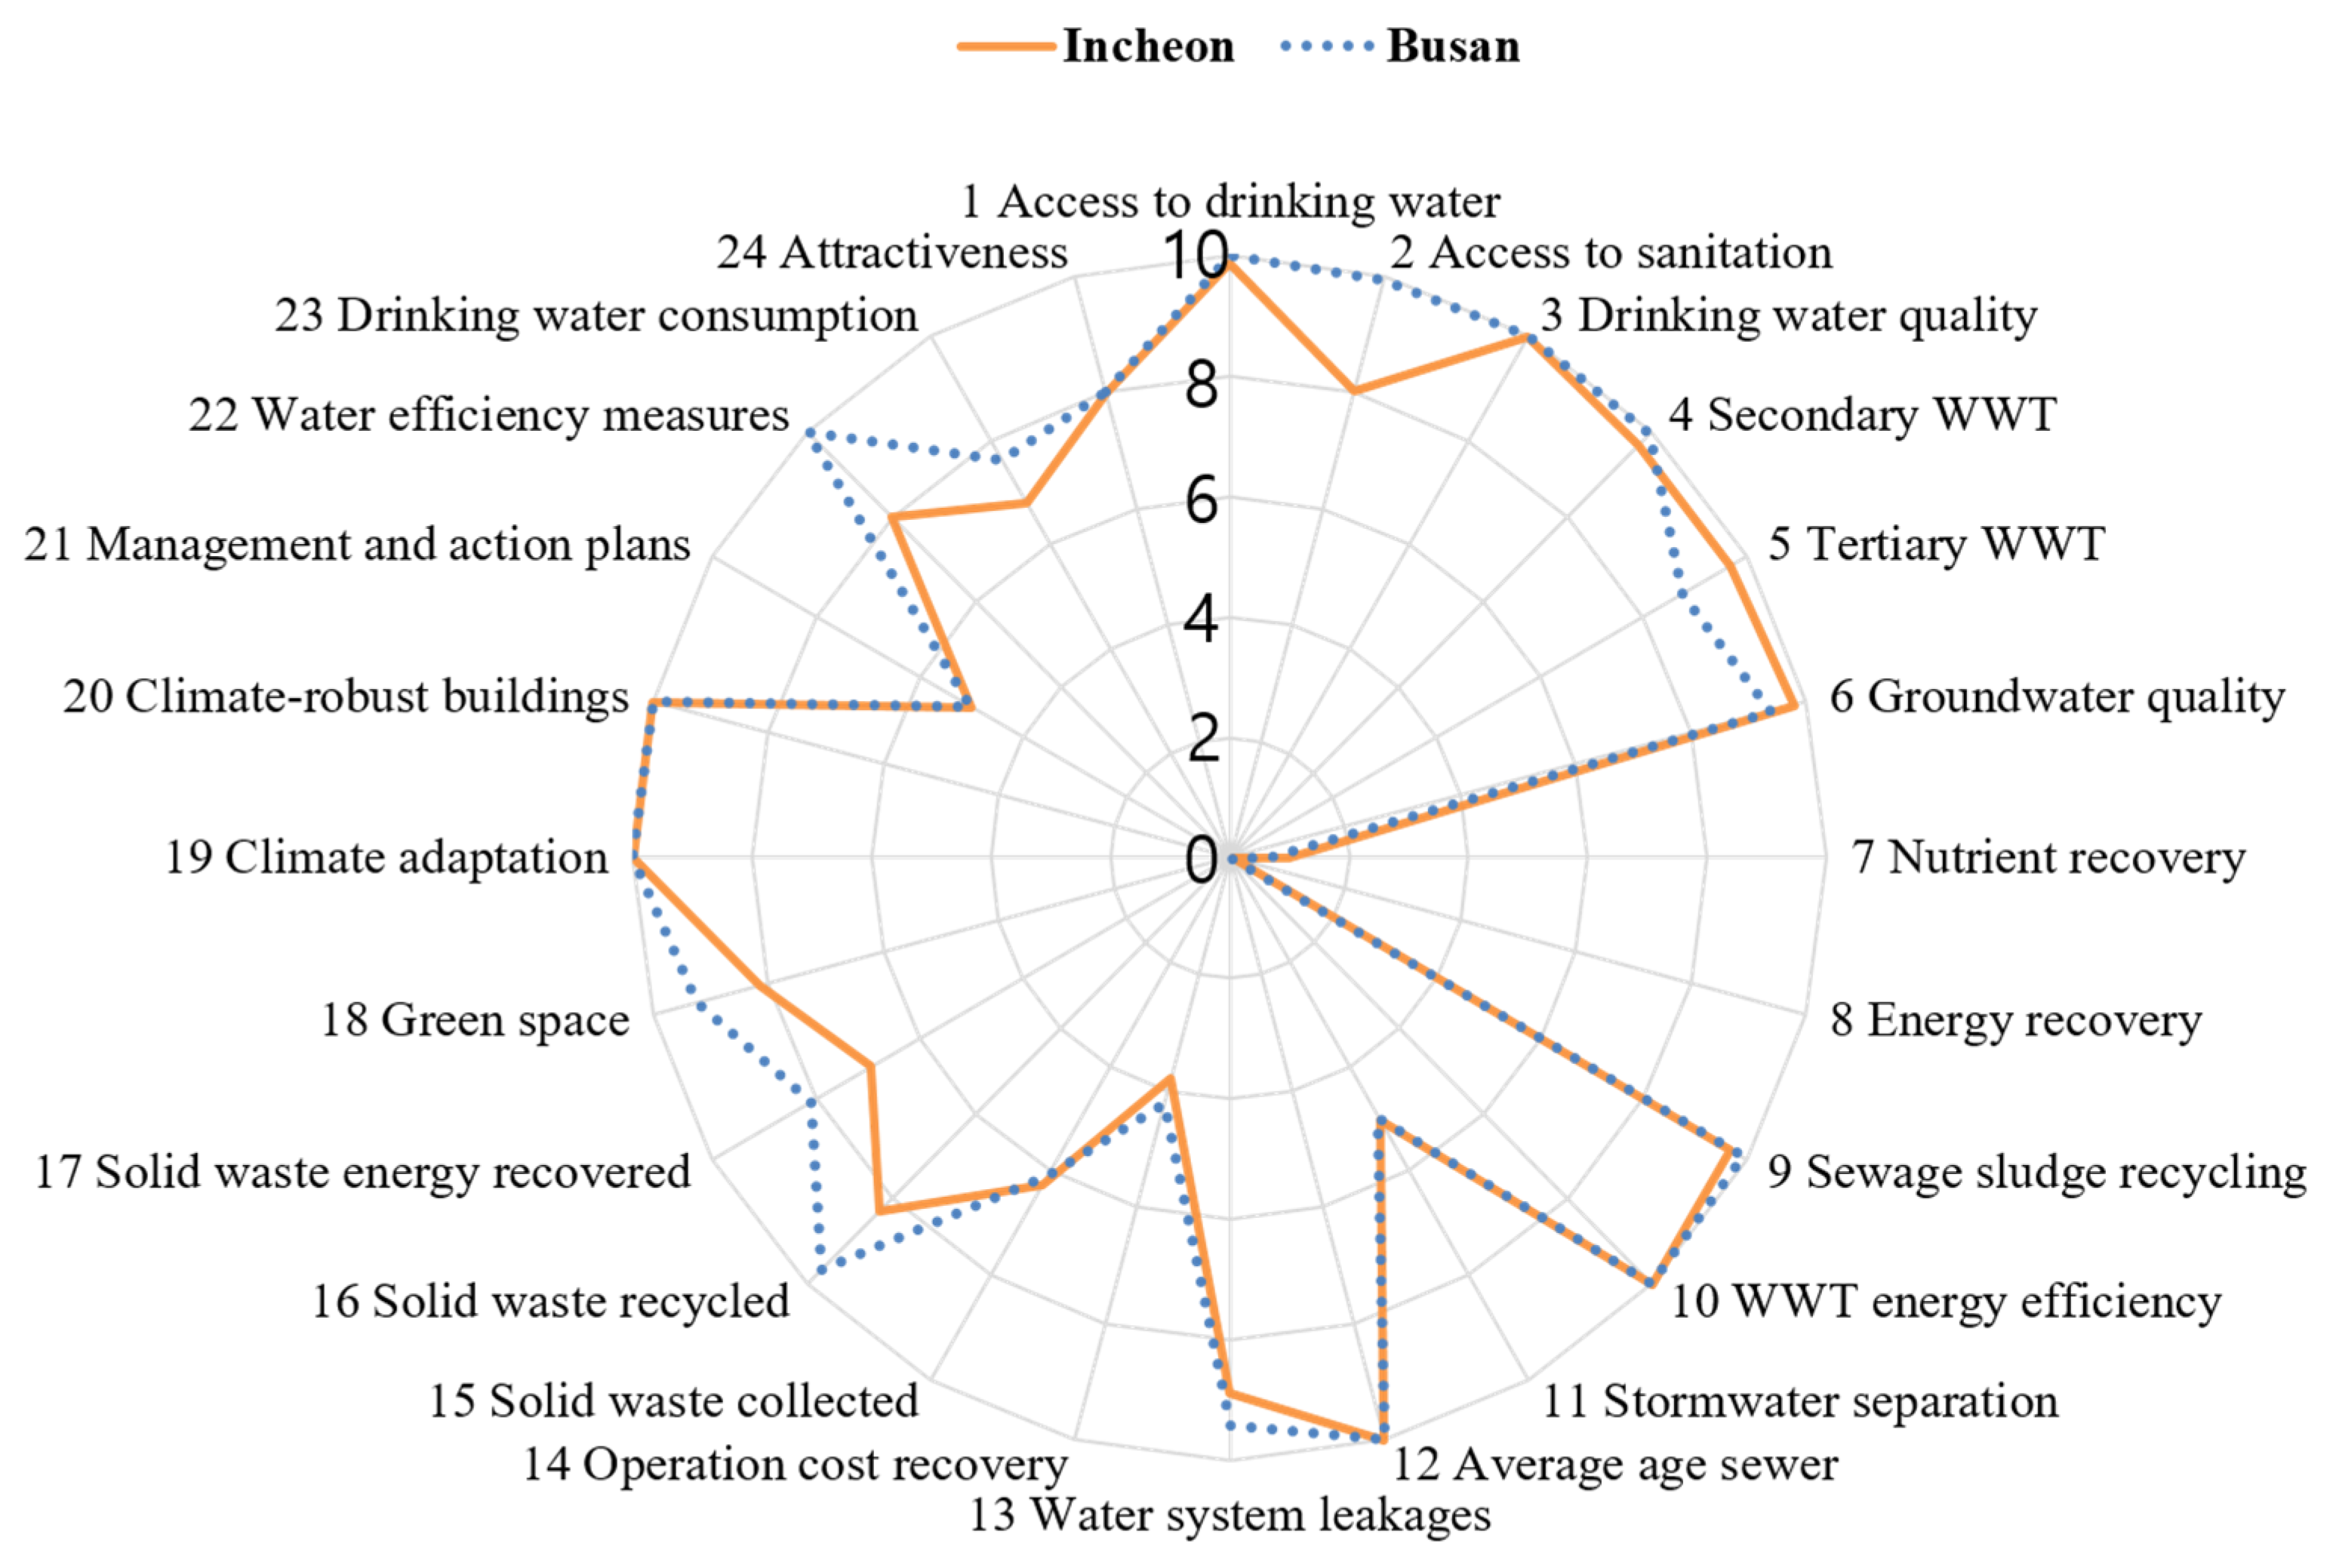
3.1. City Blueprint of Busan and Incheon

Figure 4 shows the results of the TPF of Incheon (orange solid line) and Busan (blue dotted line). The lower the value in the radar chart, the lesser the concern for an indicator. Note that we drew this TPF diagram in an inverse direction to those typically presented in other City Blueprint studies to make it consistent with the directions for CBF in Figure 5 and apply it in correlation analysis and interpretation. The overall results of TPF for Incheon demonstrate that the majority of indicators are at the level of ‘no concern’ or ‘little concern’. Specifically, 10 out of 24 indicators were at the level of ‘no concern’, and 11 indicators were at the level of ‘little concern’. Among the rest, only one indicator (economic pressure) showed ‘medium concern’ while two indicators (freshwater scarcity and seawater intrusion) showed ‘great concern’. The indicator of freshwater scarcity is calculated by the abstracted freshwater as a percentage of total renewable resources (including surface water and groundwater sources). The percentage of renewable resource abstract of Korea was 41.9% in 2017 [51]. In addition, the indicator of seawater intrusion is assessed based on a quick literature check in which seawater intrusion and groundwater salinization were reported. According to the seawater intrusion monitoring network, seawater intrusion frequently occurred in Incheon and Busan [35]. In Incheon, five out of the total eight monitoring stations showed over 10,000 µs/cm of EC, which indicates this groundwater is not suitable for human consumption and irrigation [36]. In Busan, two out of the total three monitoring stations showed over 10,000 µs/cm of EC.
The similarity of the TPF results of the two cities was somewhat expected because many indicators were assessed by using national-level data due to the lack of city-level data. Moreover, South Korea is rather a small country geographically in which distanced regions may have similar environmental, economic, and social characteristics or contexts. However, given that the focus of this research is on coastal groundwater, it is noteworthy that the indicators of ‘freshwater scarcity’ and ‘seawater intrusion’ are at ‘great concern’ whereas ‘groundwater scarcity’ showed ‘little concern’. Although these indicators are assessed as having a different degree of concern, they are highly correlated or connected such that they may converge to a similar degree of concern in the coming future (this will be discussed more in the next section).
Figure 5 shows the results of CBF of Incheon (orange solid line) and Busan (blue dotted line). Although the majority of indicators, including groundwater quality, obtained high scores for Incheon, there were several indicators that needed attention. For example, the indicators of energy recovery, operation cost recovery, nutrient recovery, and management and action plans scored below 5, which indicates that these indicators should be given top priorities for improving urban water sustainability. A similar trend among the indicators was also found for Busan.

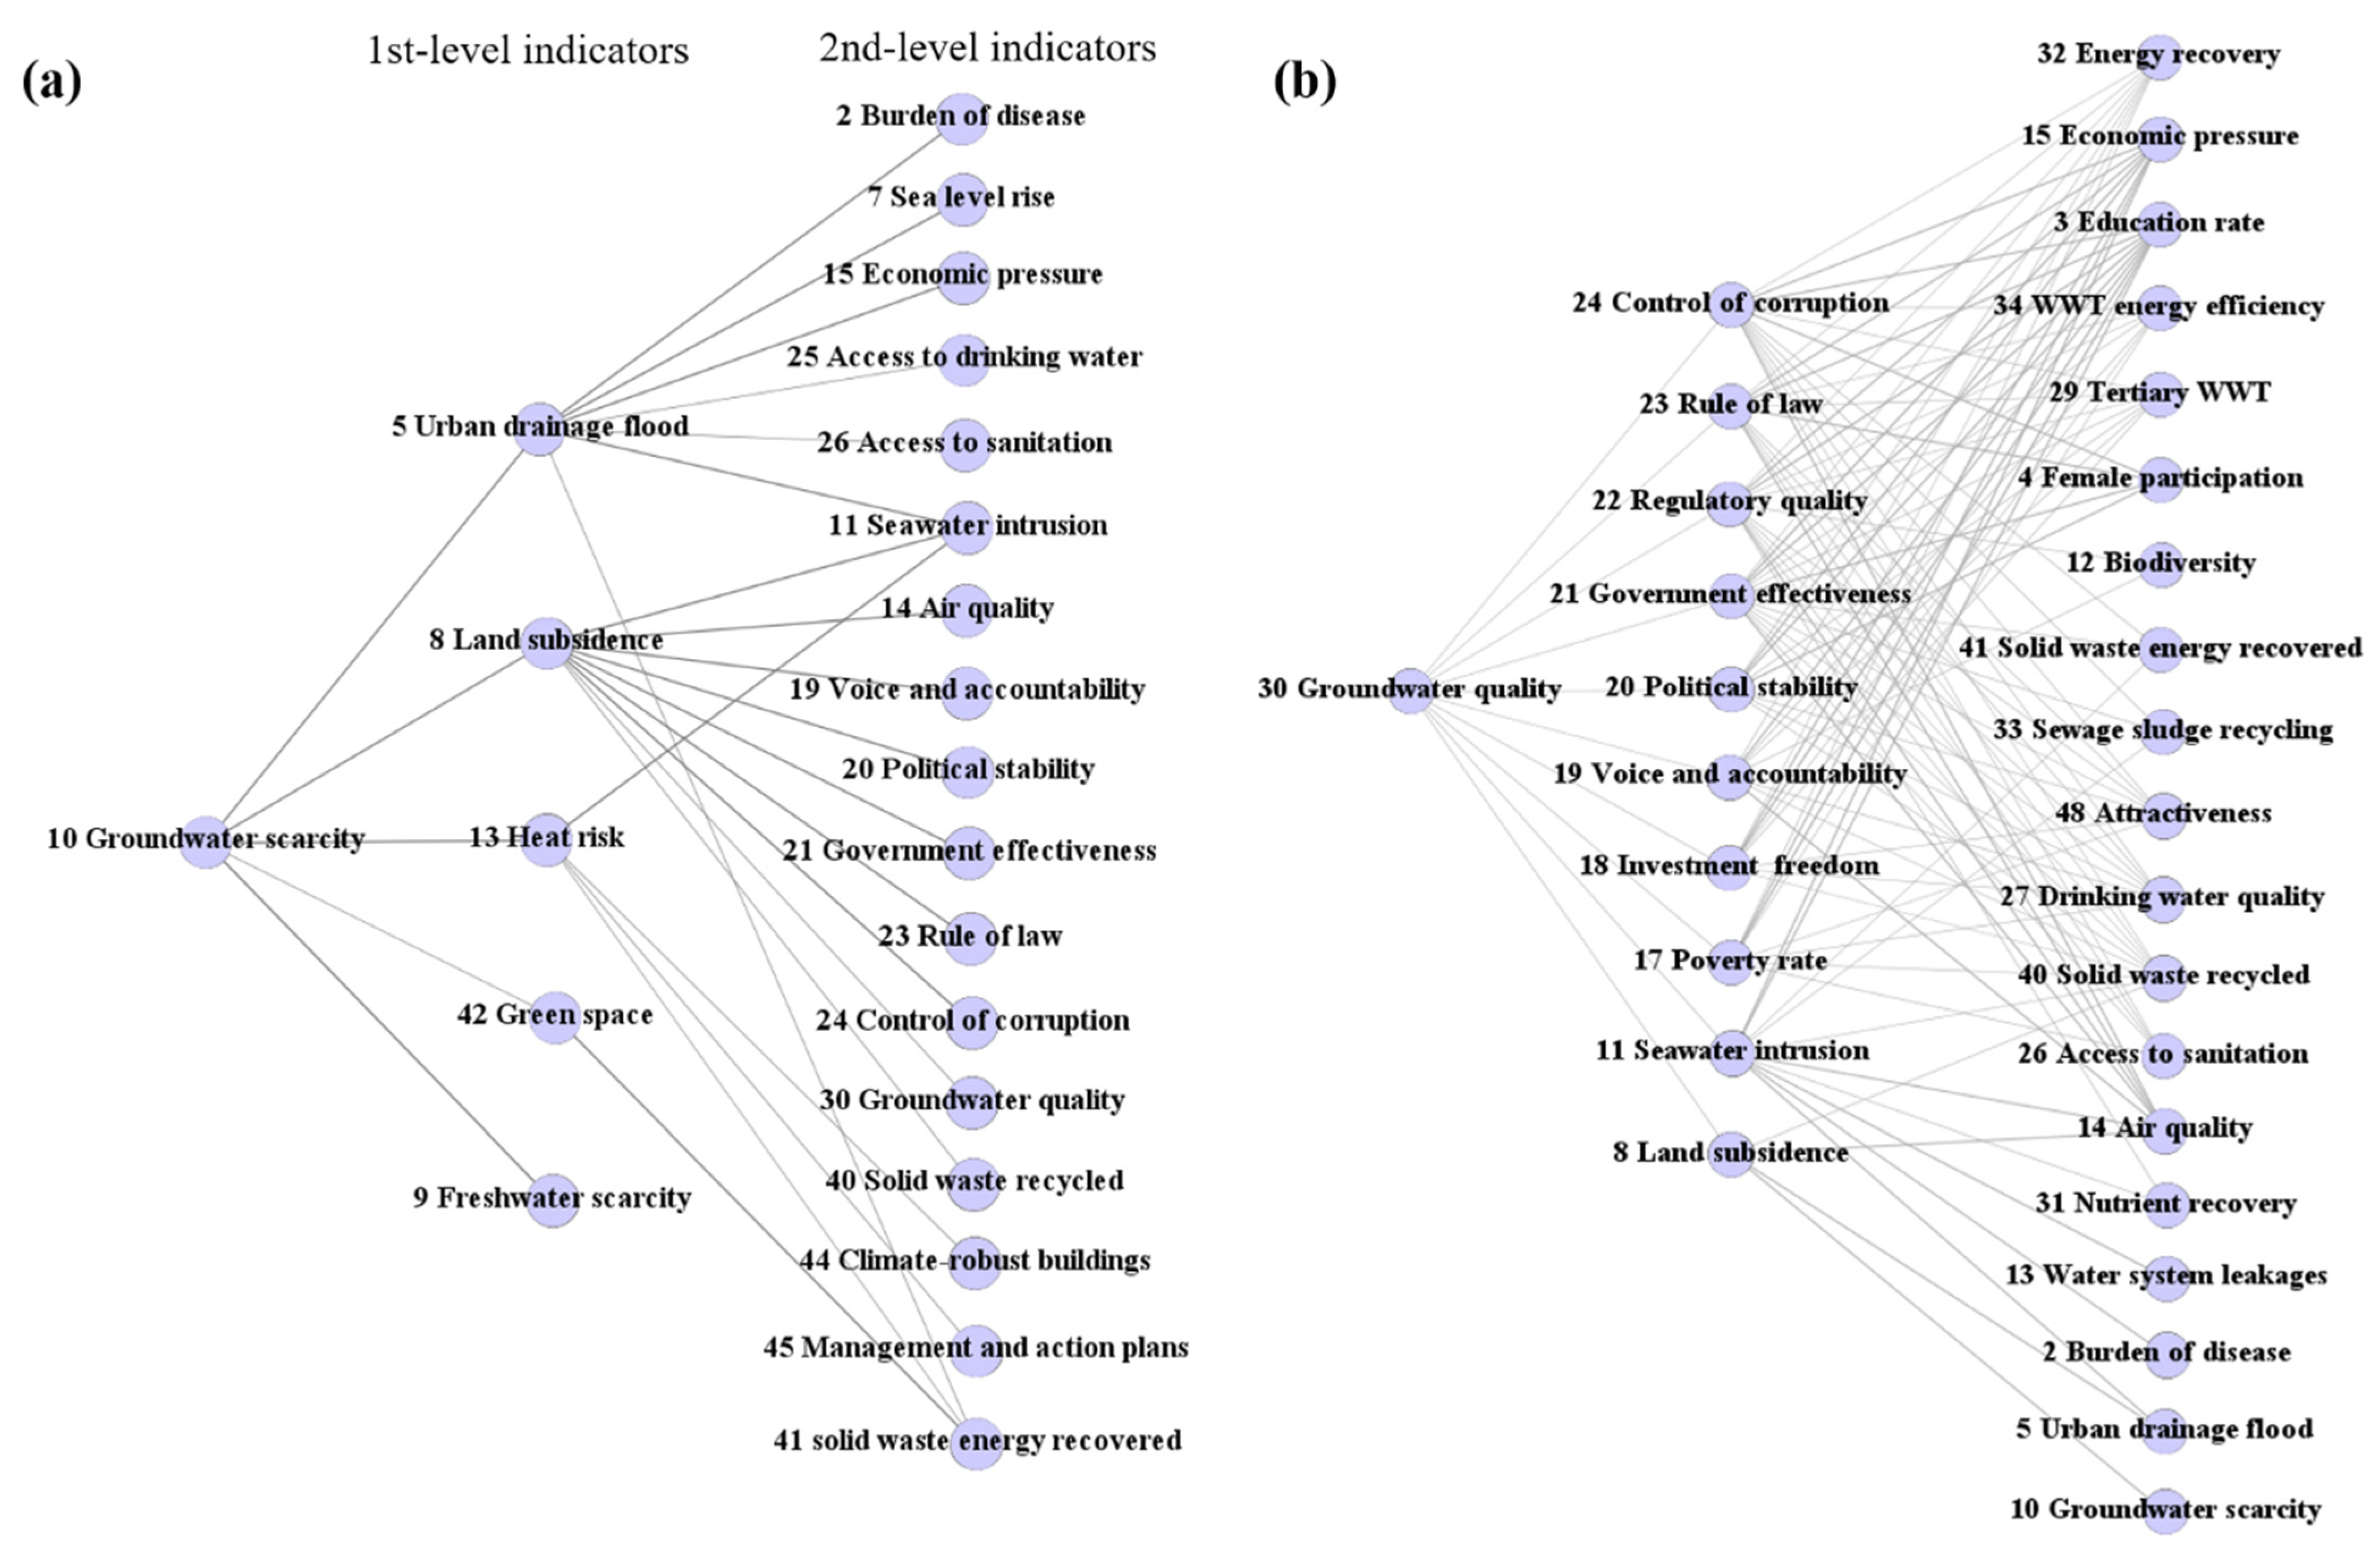
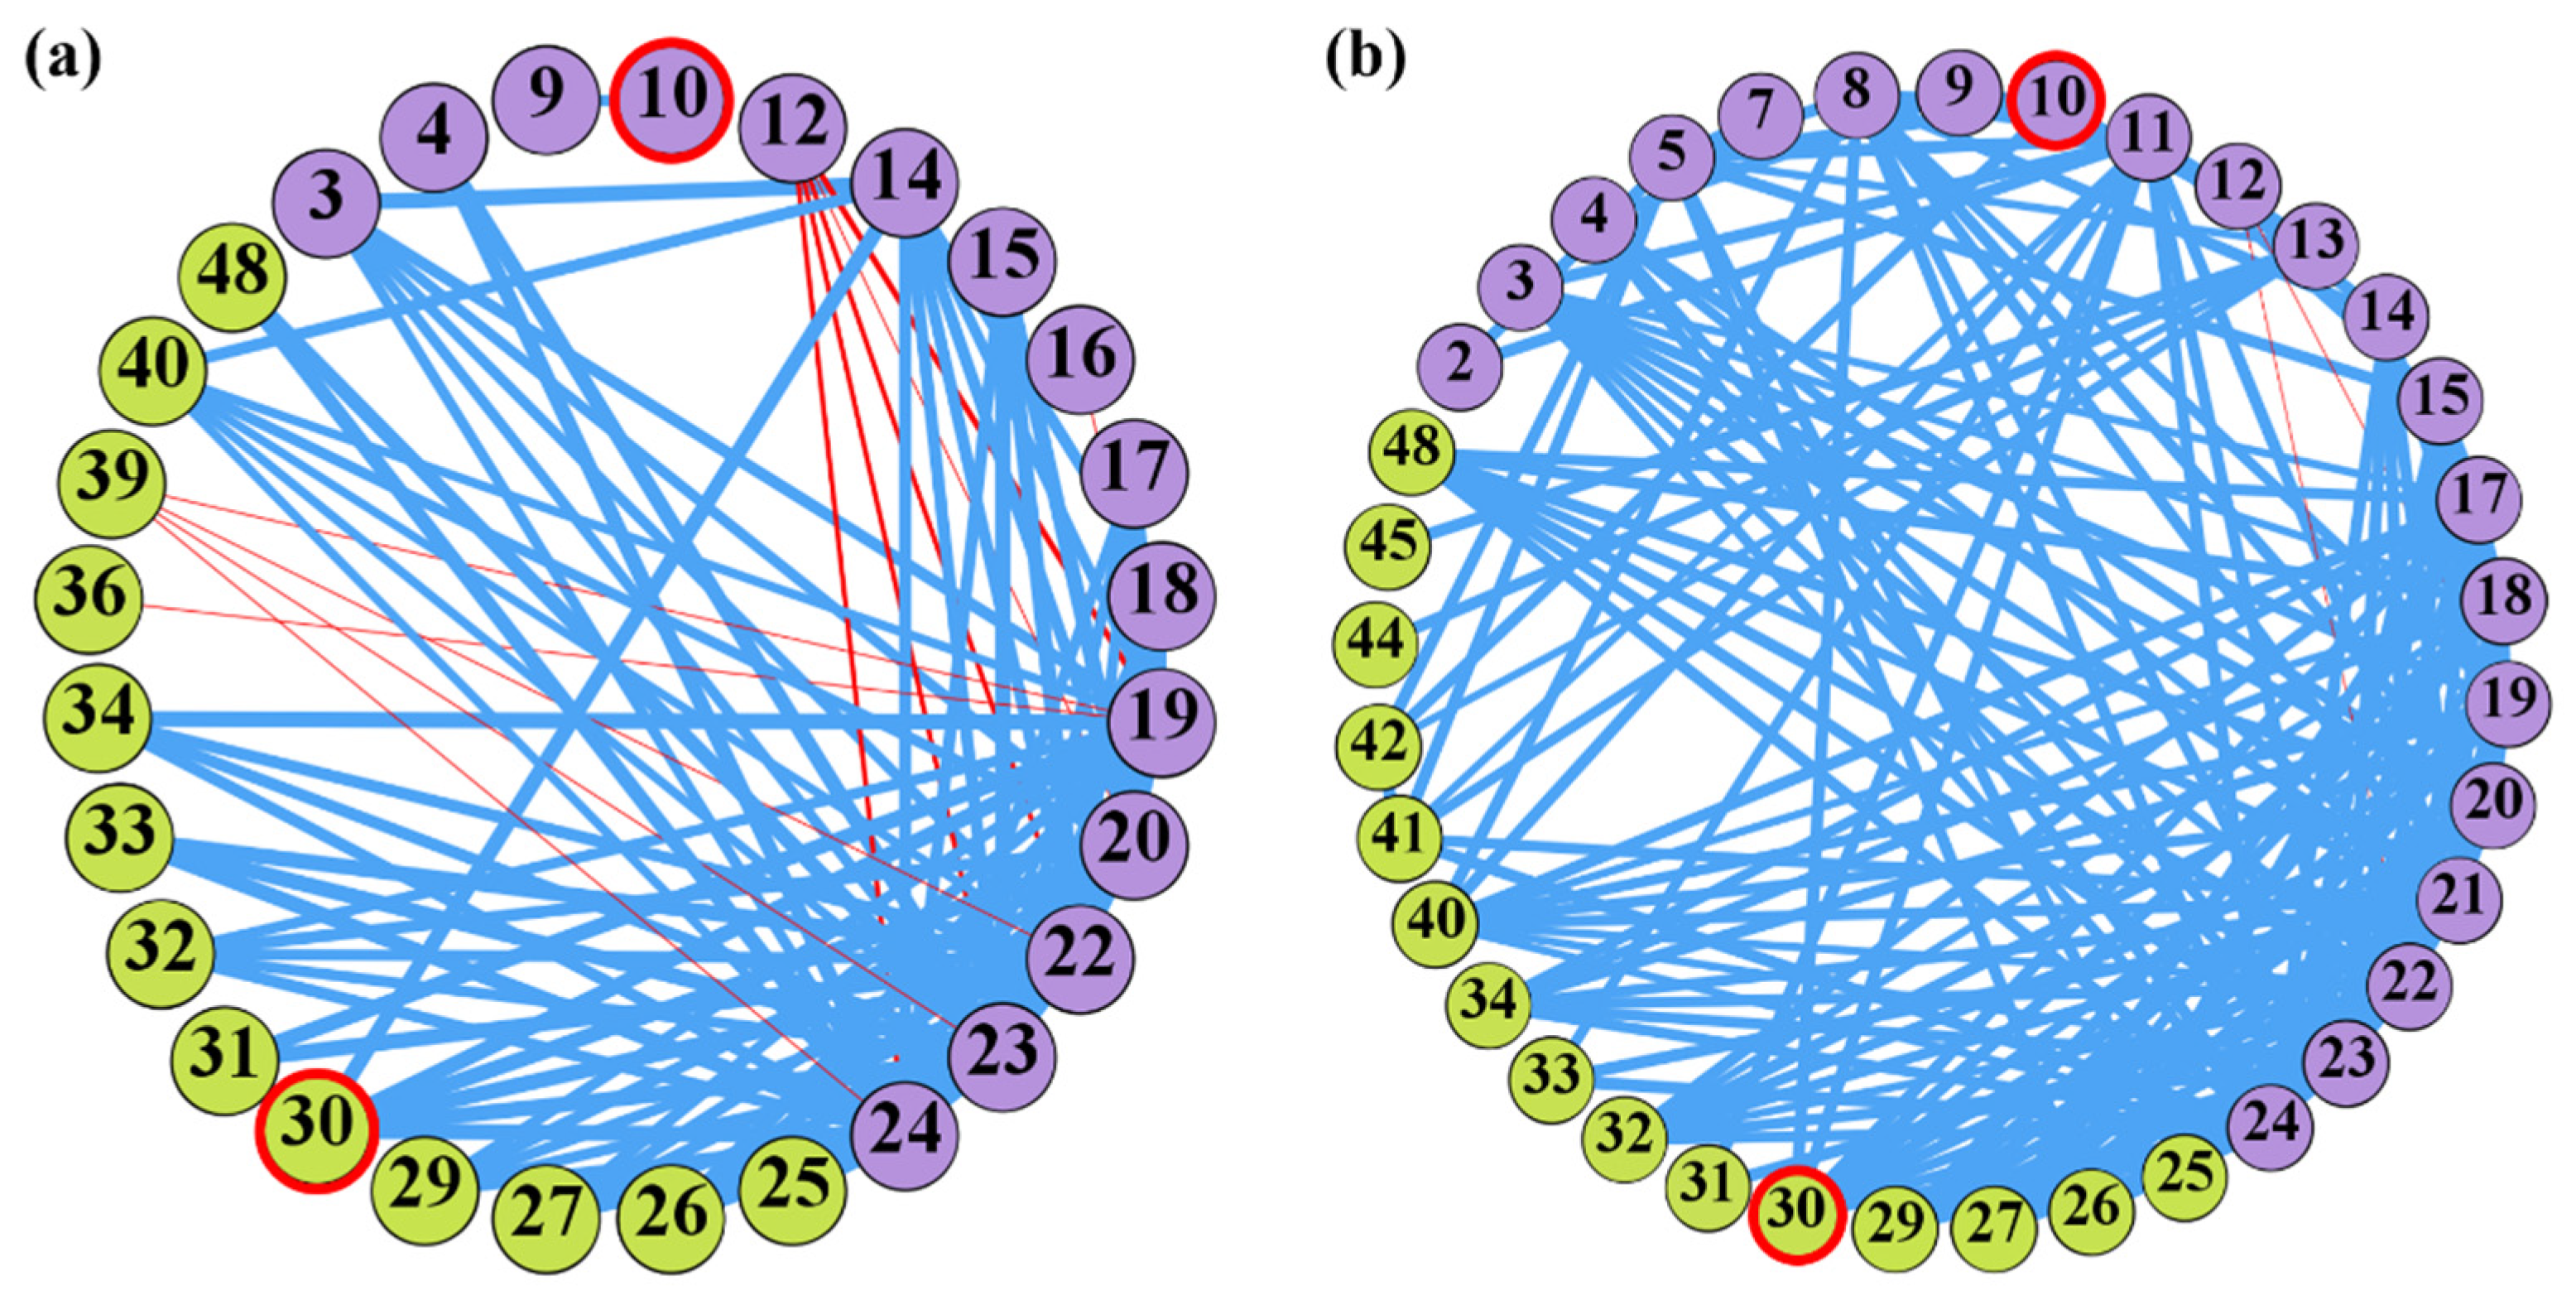
3.2. The Groundwater-Centered CB Network

Table 4 summarizes the attributes of the groundwater-centered CB networks constructed with (1) the group of all cities (GT), which include both non-coastal cities and coastal cities, (2) only coastal cities (GC), and (3) only non-coastal cities (GNC). The GT was composed of 28 nodes and 96 edges, while GC was composed of 36 nodes, and 160 edges and GNC was composed of 31 nodes and 61 edges. That is, the GC had the largest numbers of both nodes and edges, which implies that groundwater in coastal cities is affected by more factors than in the case of analyzing all cities and non-coastal cities. Furthermore, as evidenced by a low number of edges, there was a less complex association between nodes in the GNC. In other words, the factors in non-coastal cities tend to form simple links, which may allow tracking the inter-relationship or causal effect relatively easy. Thus, in this network, a chain of effects cascading through complex associations between nodes is less expected. According to our analysis, the GC had the highest node strength (<s> = 15.71), which means that the groundwater influencing factors are strongly connected to each other. The mean distance (d) of GC was 3.77, whereas it was 2.92 for the GT and 3.04 for the GNC. This implies that there are more indirectly linked factors that significantly can affect groundwater in coastal cities. Note that the GT and GNC are composed of two separated components (i.e., component 1: All nodes except #9 and #10, component 2: #9 and #10), which make some metric values unrealistic because a distance between nodes in separated components is assigned as infinite or zero. Thus, only the largest components for GT and GNC were used for calculating network metrics.
GT and GNC are visualized, as shown in Figure 6. Each node in the network represents an indicator of TPF (purple circle) or CBF (green circle), which were identified as having first or second-order linkage with groundwater scarcity (ID #10) or groundwater quality (ID #30). Blue-colored edges indicate a positive correlation between the nodes, while red-colored edges indicate a negative correlation. Moreover, the thickness of an edge is proportional to an edge weight or correlation coefficient. Because closeness and betweenness need positive values for calculation, the absolute weight values were used for these metrics.

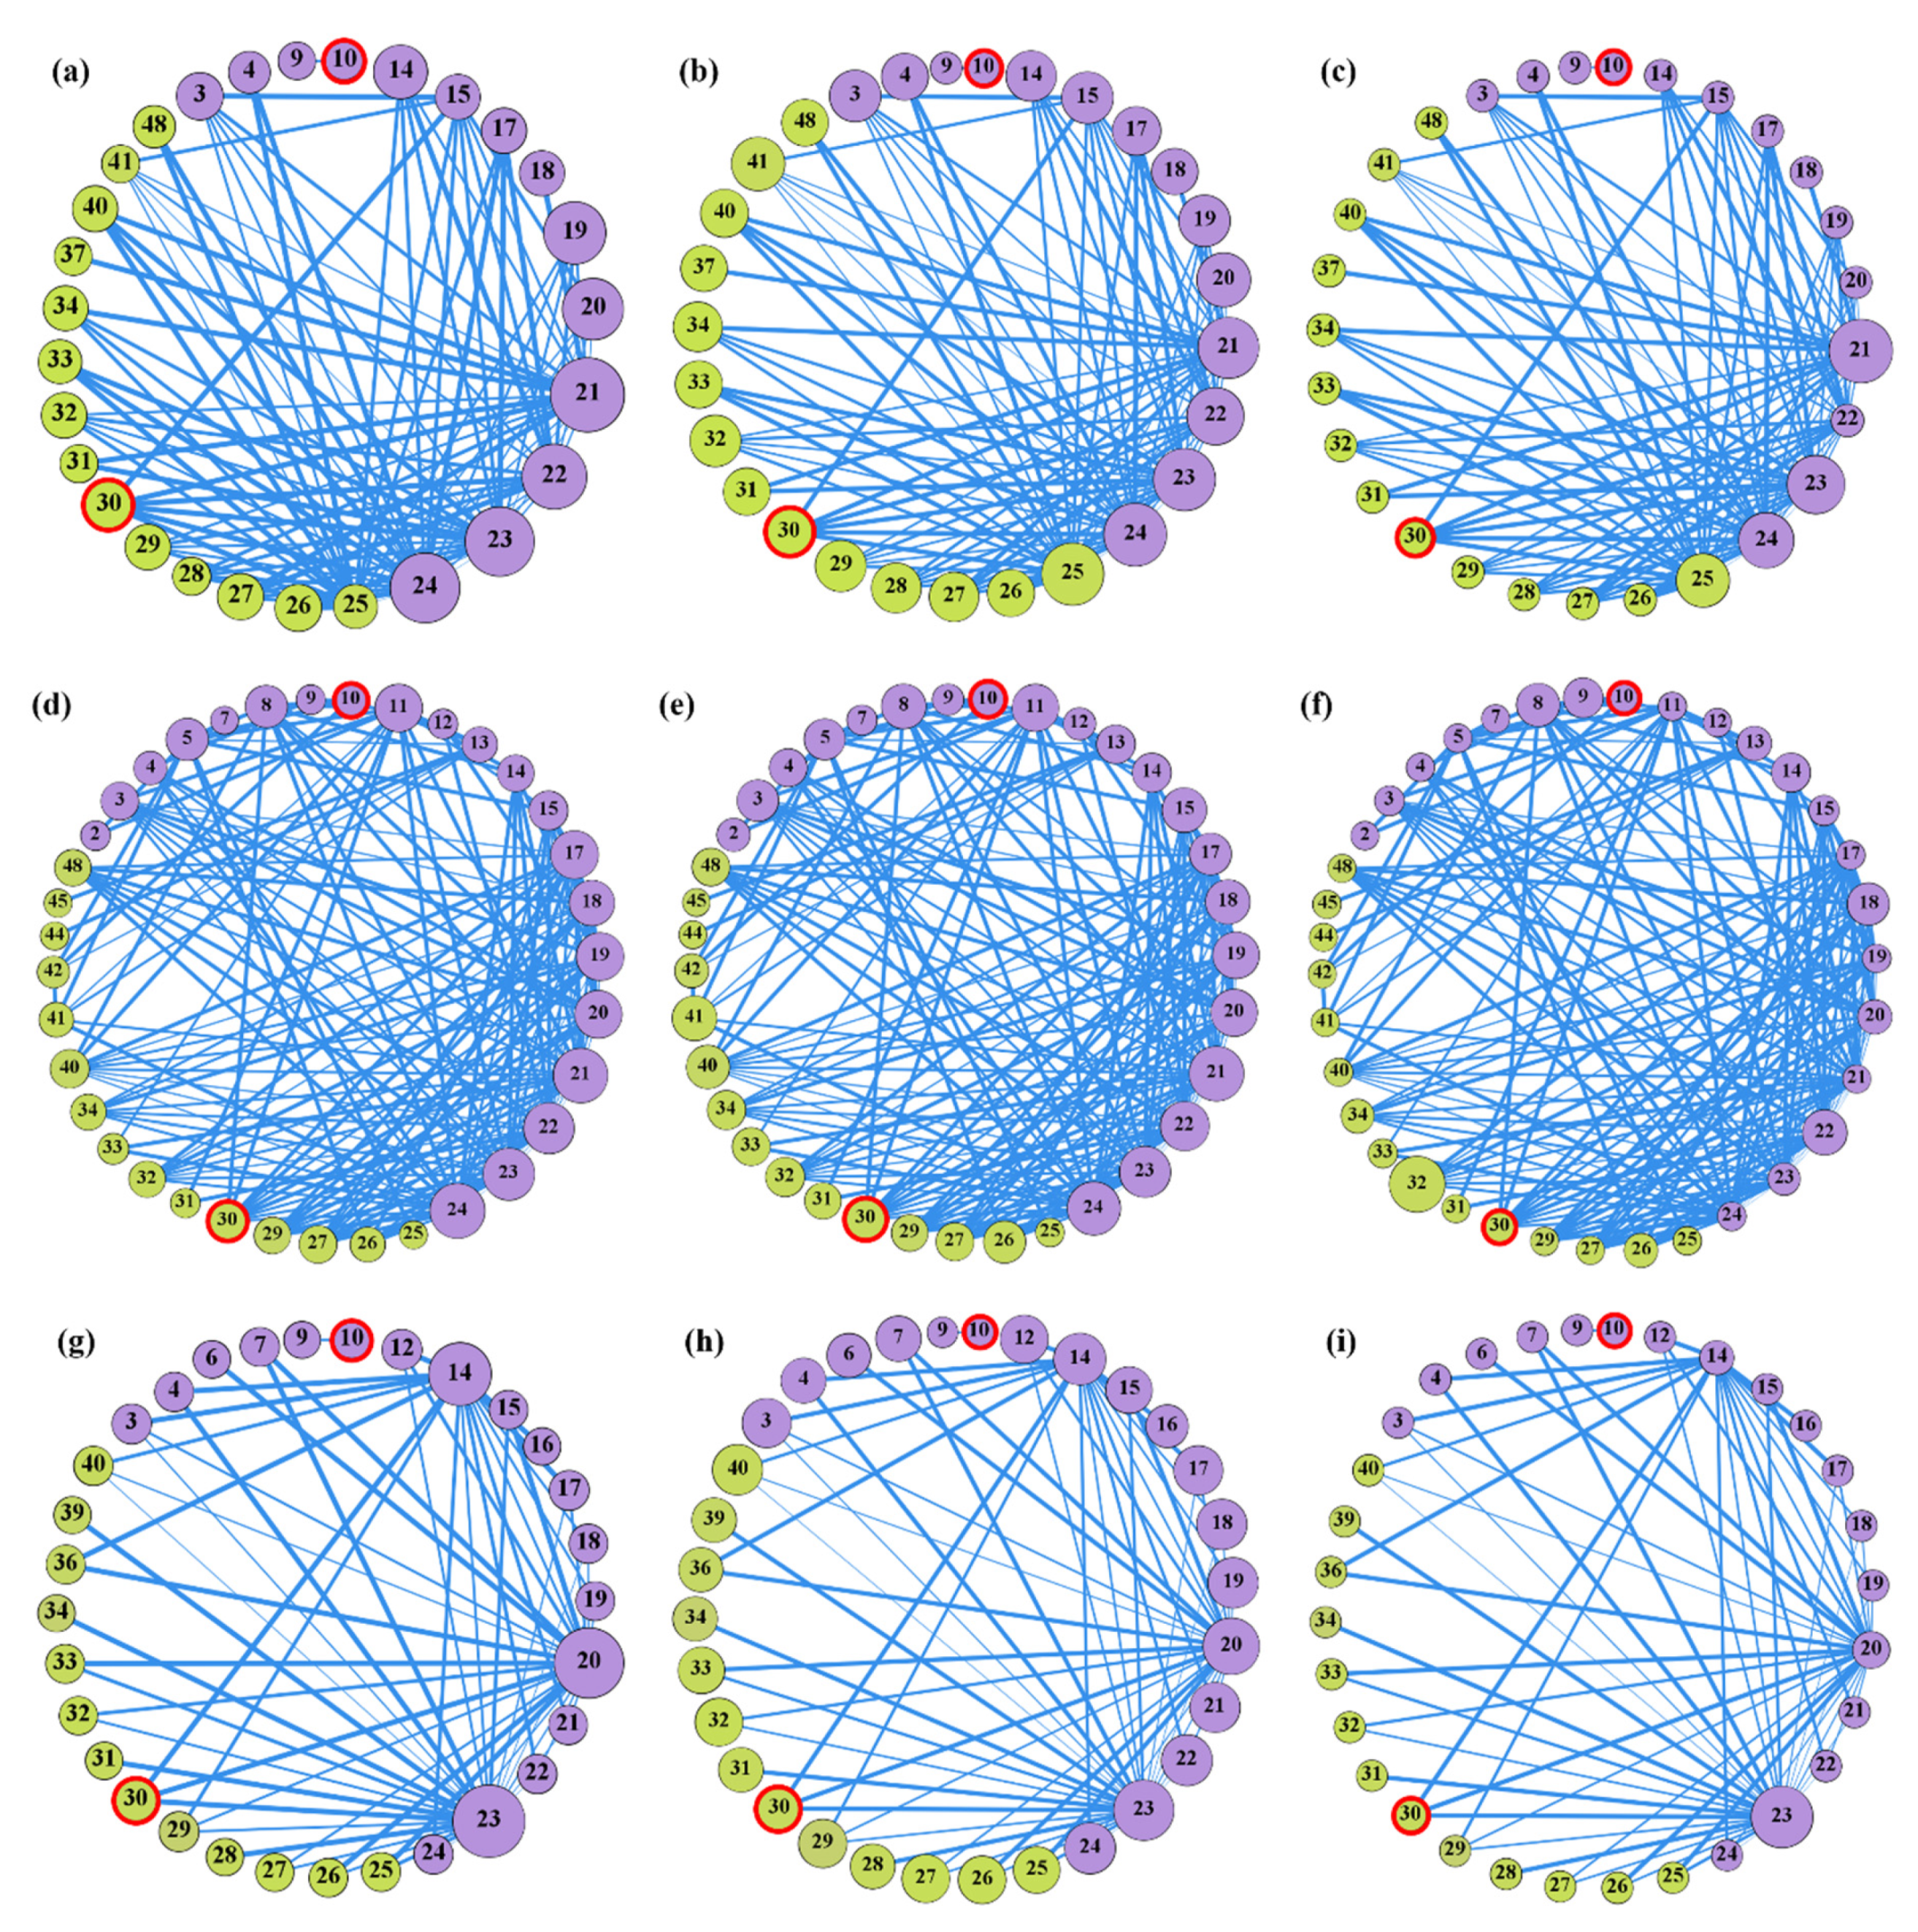
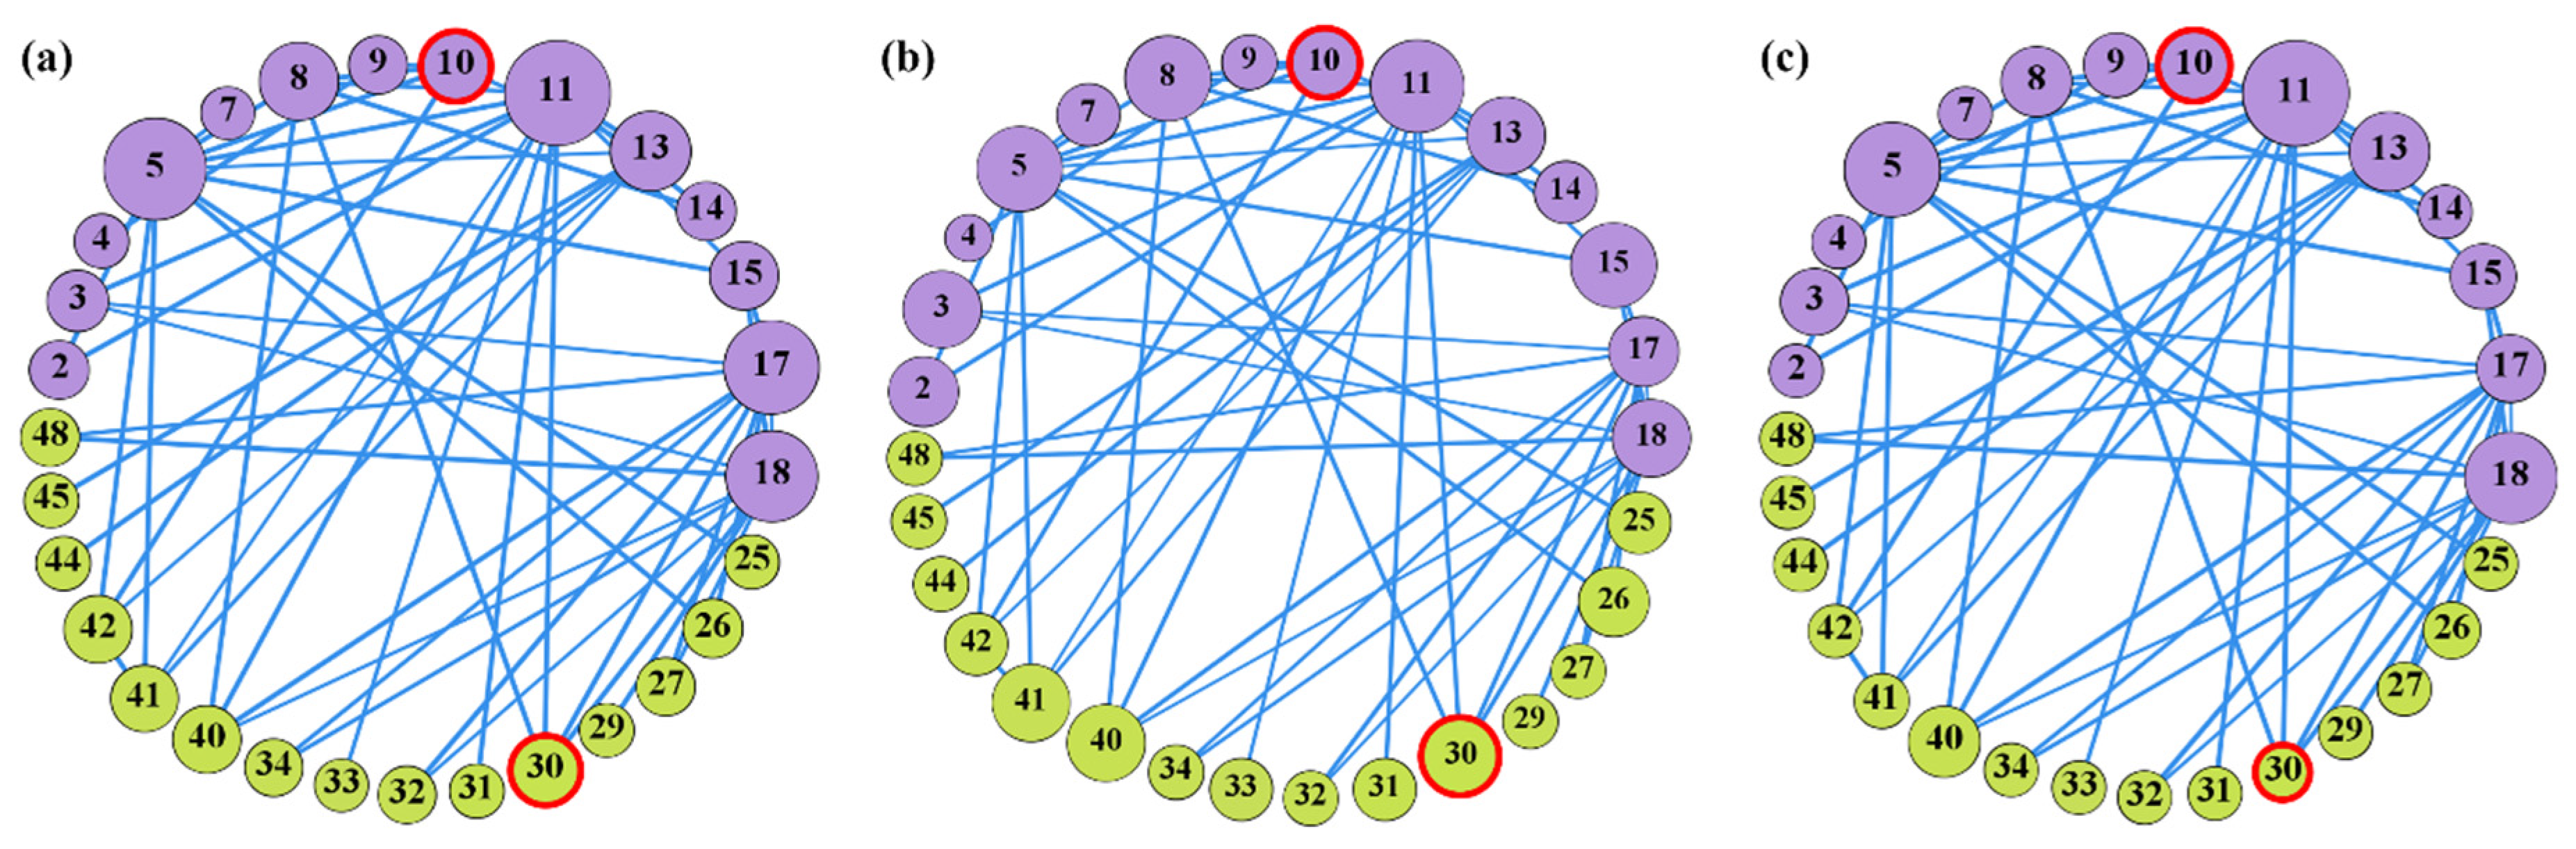
3.3. Results of CB Network Analysis

Figure 7 shows node centralities denoted on all three networks (GT, GC, and GNC): (a, d, and g) node strength, (b, e, and h) closeness centrality, and (c, f, and i) betweenness centrality. The size of a circle for a node was set to be proportional to centrality (e.g., a larger node has a larger value). Tables S4–S6 provide numerical values of these centralities for each network. We assigned the top 20% of nodes of each metric as indicators that have a major influence on groundwater. Among the results of GT (Figure 7a–c), governance-related indicators (node #19–24) showed high node strength, closeness, and betweenness (node #21–24). Excluding these indicators, assess to drinking water (node #25) was one of the indicators having the highest closeness and betweenness. Moreover, education rate (node #3) was another non-governance-related indicator that scored high on betweenness.
Similar to GT, the node strength and closeness of governance-related indicators were high in GC (Figure 7d–f). When excluding these indicators, the poverty rate (node #17) was the node with the highest node strength, and seawater intrusion (node #11) scored high on node strength, as well as closeness. In the case of betweenness, energy recovery (node #32), regulatory quality (node #22), land subsidence (node #8), investment freedom (node #18), freshwater scarcity (node #9), air quality (node #14), and heat risk (node #13) scored high on betweenness.
For GNC (Figure 7g–i), rule of law (node #23) and political stability (node #20) ranked first and second places in node strength, closeness, and betweenness. Moreover, regulatory quality (node #22) and control corruption (node #24) showed high closeness. Excluding these governance-related indicators, air quality (node #14), groundwater quality (node #30), biodiversity (node #12), and education rate (node #3) scored high on node strength. Furthermore, air quality (node #14) and investment freedom (node #18) were high closeness indicators, while air quality (node #14), education rate (node #3), female participation (node #4), and river peak discharge (node #6) were high betweenness indicators. Air quality (node #14) was the indicator that ranked highest in all three metrics when excluding governance-related indicators.
As mentioned above, governance-related indicators were identified as factors that strongly affect groundwater as these indicators are having the highest node strength and betweenness centrality in all three networks. This result indicates that governance-related indicators have an important role in groundwater management, and these must be taken into account when trying to improve groundwater sustainability [52]. However, given that effects from improving governance for groundwater management typically need a long period after implementing new standards, regulations, and practices because of the human factors involved, this study attempted to identify the factors that can be improved and that take effect relatively fast. Thus, we reanalyzed the CB network for coastal cities by excluding governance-related indicators (Figure 8).
This coastal CB network constructed without governance-related indicators (GC2) is composed of 29 nodes and 54 edges, while the original network that included governance-related indicators was composed of 36 nodes and 160 edges. Note that node #12 (biodiversity), which was originally within the network by the second-order connection with groundwater indicator, was removed because it was directly connected only with the governance-related indicator (node #19). As a result, nodes #11 (seawater intrusion), #5 (urban drainage flood), #17 (poverty rate), #18 (investment freedom), #13 (heat risk), and #8 (land subsidence) became the nodes with the highest node strengths. Moreover, nodes #11 (seawater intrusion), #5 (urban drainage flood), #15 (economic pressure), #8 (land subsidence), #40 (solid waste recycled), and #13 (heat risk) are ranked as nodes with the highest closeness. The nodes with the highest betweenness were nodes #11 (seawater intrusion), #5 (urban drainage flood), #18 (investment freedom), #13 (heat risk), #10 (groundwater scarcity), and #40 (solid waste recycled). Taken together, nodes #11 (seawater intrusion), #5 (urban drainage flood), and #13 (heat risk) were commonly identified as the top-ranking nodes in terms of all analyzed network centralities. That is, it is highly likely that if nodes #11, #5, and #13 vary, other influencing factors can also be affected in significant ways.
When looking at both GC and GC2, common indicators found in the top 20% nodes for each metric were node #17 (poverty rate) for node strength, node #11 (seawater intrusion) for closeness, and nodes #18 (investment freedom) and #13 (heat risk) for betweenness. These common indicators found in both networks can be interpreted as major influencing factors for coastal groundwater management regardless of the existence of governance factors.
Furthermore, we analyzed the correlation of indicator ranks between metrics. In GC, only node strength and closeness showed a high correlation (r = 0.92), while betweenness showed almost no correlation with the other two metrics (r = 0.16 with node strength and r = 0.17 with closeness). On the other hand, in GC2, the combination of all three metrics was strongly correlated (r = 0.78 between node strength and closeness, r = 0.73 between closeness and betweenness, and r = 0.90 between node strength and betweenness). Thus, if one tries to find management priority only with non-governance-related indicators for coastal groundwater, the use of GC2 will allow identifying major factors in all three aspects of node strength, closeness, and betweenness.

4. Discussion

In this study, we have constructed networks by compiling City Blueprint results of 122 cities to identify major factors influencing coastal groundwater. In this network, edge weights between factors (or nodes) were assigned with correlation coefficients. As a result, seawater intrusion was identified as one of the major influencing factors on coastal groundwater, which confirms what previous studies have shown (e.g., [7,8]). Moreover, governance-related indicators (voice and accountability, political stability, government effectiveness, regulatory quality, rule of law, and control of corruption), poverty rate, heat risk, investment freedom, and urban drainage flood were identified as the major influencing factors.
While factors such as seawater intrusion were highly expected, several factors that have not often been mentioned in the literature regarding coastal groundwater management (e.g., governance-related factors, green space, poverty rate, and economics) were also revealed as important ones through the approach taken in this study. Table 5 shows the list of indicators that were highly correlated with groundwater quality or quantity. Moreover, centrality metrics of which indicator was highly ranked in the networks were also denoted. By conducting a literature review, we also described the mechanisms that explain high correlations with our hypotheses when needed.
This result indicates that, when seeking sustainable groundwater management of coastal cities, these newly identified factors should also be considered. In previous studies on City Blueprint, sustainable water management as a broad theme was evaluated throughout CB scores. In addition to this, our study shows the possibility of identifying major factors by selecting a specific component of urban water management (e.g., groundwater) by adopting a network analysis technique and putting this component in the center of the network.
The results of the City Blueprint assessment of Busan and Incheon for the indicators that have been revealed as important factors by the CB network were as follows: TPF 19 to 24 (governance-related indicators) and TPF 8 (land subsidence) were at the level of ‘little concern’; TPF 13 (heat risk) in Busan was at the level of ‘medium concern’ while in Incheon was ‘little concern’; in both cities, TPF 5 (urban drainage flood) was at the level of ‘no concern’ while TPFs 11 (seawater intrusion) and 9 (freshwater scarcity) were ‘very concern’. Moreover, the CBF 8 (energy recovery) of both cities was around zero. It is obvious from this result that seawater intrusion, freshwater scarcity, and energy recovery should be placed as high management priorities. Although the current status of groundwater quality in both cities was evaluated to be good (e.g., CBA scores are above 9 points), this does not imply that the groundwater will perpetually remain of this quality. As revealed by network analysis, seawater intrusion not only directly affects groundwater scarcity and quality but, due to its high network centralities, can also disturb other various factors that have (in)direct effects on these groundwater indicators. In sum, our approach provides a way to prioritize the management actions not only on the factors already evaluated to be at risk but also on those that are apparently safe but have a high possibility of change in their status in the future by the connectivity with factors at risk. This allows the consideration of the long-term perspectives in groundwater management in addition to the snapshot of CBF results.
For managing seawater intrusion in Korea, various long-term prevention measures have been carried out. For example, seawater intrusion monitoring wells were installed in various places along the coast, the quantity of water intake standards for drinking water and domestic water were set, and the number of fields for artificially groundwater replenishment has been growing. Despite these efforts, the risk of seawater intrusion is escalating. For example, in 2017 in Incheon, three out of eight monitoring wells were at the level of ‘caution’, meaning that the groundwater can only be used for rice paddies. In 2019, however, six out of 11 monitoring wells were at the level of ‘serious’, which means that this groundwater cannot be used for agriculture. Moreover, three of the monitoring wells (2 ‘serious’ and 1 ‘caution’) were directly affected by seawater intrusion [86].
This implies that more aggressive and sophisticated measures will be required to cope with impending risks of seawater intrusion. For example, research and development programs for predicting the pathways of seawater intrusion and the effects of future climate change should be actively established. Although some of these studies have been conducted, the target area of most of those studies was limited to Jeju Island, where groundwater is the major source of freshwater resources. However, as shown by our analysis, coastal groundwater systems in the mainland are also at risk. Moreover, the recent enactment of the Water Management Act in 2019 in Korea requires diversification of water resources in a watershed, which suggests that there will be more development of groundwater for anthropogenic uses.
Another way to mitigate and adapt to this growing risk of seawater intrusion is to learn from and benchmark other cities or countries where aggressive measures are proactively implemented (e.g., marsh restoration and the installation of seawater intrusion barrier in the USA, and the installation of a subsurface dam in Japan). However, the efficacy of these strategies and measures should also be carefully evaluated before implementation because environmental, social, economic, geographical contexts, and conditions for seawater intrusion will vary by city or country. An exhaustive review of current and possible technologies and strategies [87,88], and their case studies in implementation and effectiveness, especially regarding the target areas, should follow.
Our approach was presented by using the two largest coastal cities in South Korea as case study areas. In fact, our approach aims to be applied to any other cities on the globe because it uses the CBN centered on a specific management factor (e.g., groundwater), which was built upon globally compiled CB indicator data. The two cities in South Korea were selected as case studies to show how the CBN and CB assessment results in combination can be used to assess a specific city. In other words, if one wants to assess a city regarding water management, he/she may select a target indicator (e.g., groundwater) among CB indicators and build a CBN centered on that targeted indicator using globally compiled data. Then, after conducting the CB assessment of the city, this result can be interpreted, by using CBN results, to reveal hidden indicators that may be important in managing the specific factor.

5. Conclusions

The objective of this study was to identify factors that are critical to the sustainable management of coastal groundwater. To this end, we propose a novel approach, which is called the City Blueprint network, to support establishing and prioritizing strategies among various options for coastal groundwater management. Specifically, we have constructed a groundwater-centered network based on City Blueprint scores from 122 cities and identified major influence indicators by analyzing the network. As a result, not only seawater intrusion but also governance indicators, economic pressure, poverty rate, urban drainage flood (impermeable area), and heat risk were identified as major indicators affecting coastal groundwater. Clearly, our approach can identify the factors that are often underestimated or regarded as irrelevant to coastal groundwater management.
According to our City Blueprint analysis, currently, the water in Incheon and Busan is relatively well managed given that there are several high external pressures existing. However, when combining this with the result of City Blueprint network analysis, it seems that Incheon and Busan are at high risk for seawater intrusion. Especially, the groundwater in Incheon has been already deteriorated by seawater intrusion. Since the City Blueprint Approach has already been applied to 122 cities and this number continues to increase, it will be possible to identify the leading coastal cities in which the groundwater is well managed against seawater intrusion. Moreover, by combining with the City Blueprint network approach, strategies for direct management of groundwater, as well as the factors that are seemingly weakly connected to but substantially affect groundwater, can also be identified. In this way, a city at risk may find a novel and more integrated engineering solution for adapting to and mitigating seawater intrusion. Since this requires a deeper understanding of a nation’s or city’s current and future plans, applied strategies and technologies, legislations, and governance, it will be another topic for our following study.
Our approach is important, especially because of challenges arising from climate change and thus sea-level rise that countries or cities, such as Busan and Incheon, have to cope with. Many coastal places at risk of seawater intrusion try to resolve these challenges by adopting direct measures that often involve the construction of hard infrastructure, which may not always work because of uncertainties. The best way to cope with uncertainties is diversifying strategies, and our approach may provide alternative or complementary measures that involve more societal, political, or indirect management actions.

Supplementary Materials

The following supporting information can be downloaded at: https://www.mdpi.com/article/10.3390/w14020262/s1, Table S1: The correlation heatmap entire cities; Table S2: The correlation heatmap coastal cities; Table S3: The correlation heatmap non-coastal cities; Table S4: The results of network metrics of all cities; Table S5: The results of network metrics of coastal cities; Table S6: The results of network metrics of non-coastal cities.

Author Contributions

Conceptualization, J.P. and K.L.; methodology, J.P. and K.L.; software, K.L.; validation, S.K., K.v.L. and S.C.; formal analysis, J.P. and K.L.; investigation, K.L.; resources, S.K. and K.v.L.; data curation, K.L.; writing—original draft preparation, K.L.; writing—review and editing, J.P., S.K. and S.C.; visualization, K.L.; supervision, J.P.; project administration, J.P.; funding acquisition, J.P. and S.C. All authors have read and agreed to the published version of the manuscript.

Funding

This research was supported by the National Research Foundation of Korea (NRF), and funded by the Korean government (Ministry of Science and ICT) (NRF-2020M3H5A1080775).

Data Availability Statement

Data available on request.

Conflicts of Interest

The authors declare no conflict of interest.

References

  1. Vörösmarty, C.J.; Green, P.; Salisbury, J.; Lammers, R.B. Global Water Resources: Vulnerability from Climate Change and Population Growth. Science 2000, 289, 284–288. [Google Scholar] [CrossRef] [Green Version]
  2. He, C.; Liu, Z.; Wu, J.; Pan, X.; Fang, Z.; Li, J.; Bryan, B.A. Future global urban water scarcity and potential solutions. Nat. Commun. 2021, 12, 4667. [Google Scholar] [CrossRef]
  3. McDonald, R.I.; Green, P.; Balk, D.; Fekete, B.M.; Revenga, C.; Todd, M.; Montgomery, M. Urban growth, climate change, and freshwater availability. Proc. Natl. Acad. Sci. USA 2011, 108, 6312–6317. [Google Scholar] [CrossRef] [PubMed] [Green Version]
  4. McDonald, R.I.; Weber, K.; Padowski, J.; Flörke, M.; Schneider, C.; Green, P.A.; Gleeson, T.; Eckman, S.; Lehner, B.; Balk, D.; et al. Water on an urban planet: Urbanization and the reach of urban water infrastructure. Glob. Environ. Chang. 2014, 27, 96–105. [Google Scholar] [CrossRef] [Green Version]
  5. Aeschbach-Hertig, W.; Gleeson, T. Regional strategies for the accelerating global problem of groundwater depletion. Nat. Geosci. 2012, 5, 853–861. [Google Scholar] [CrossRef]
  6. Li, P.; Karunanidhi, D.; Subramani, T.; Srinivasamoorthy, K. Sources and consequences of groundwater contamination. Arch. Environ. Contam Toxicol. 2021, 80, 1–10. [Google Scholar] [CrossRef] [PubMed]
  7. Michael, H.A.; Post, V.E.A.; Wilson, A.M.; Werner, A.D. Science, society, and the coastal groundwater squeeze. Water Resour. Res. 2017, 53, 2610–2617. [Google Scholar] [CrossRef]
  8. Chang, S.W.; Chung, I.M.; Kim, M.G.; Tolera, M.; Koh, G.W. Application of GALDIT in assessing the seawater intrusion vulnerability of Jeju Island, South Korea. Water Switz. 2019, 11, 1824. [Google Scholar] [CrossRef] [Green Version]
  9. Werner, A.D.; Bakker, M.; Post, V.E.A.; Vandenbohede, A.; Lu, C.; Ataie-Ashtiani, B.; Simmons, C.T.; Barry, D.A. Seawater intrusion processes, investigation and management: Recent advances and future challenges. Adv. Water Resour. 2013, 51, 3–26. [Google Scholar] [CrossRef]
  10. Gleeson, T.; Cuthbert, M.; Ferguson, G.; Perrone, D. Global Groundwater Sustainability, Resources, and Systems in the Anthropocene. Annu. Rev. Earth Planet. Sci. 2020, 48, 431–463. [Google Scholar] [CrossRef] [Green Version]
  11. Alley, W.M.; Reilly, T.E.; Franke, O.L. Sustainability of Ground-Water Resources; US Geological Survey; US Department of the Interior: Washington, DC, USA, 1999; Volume 1186, ISBN 0607930403.
  12. Hosseini, S.M.; Parizi, E.; Ataie-Ashtiani, B.; Simmons, C.T. Assessment of sustainable groundwater resources management using integrated environmental index: Case studies across Iran. Sci. Total Environ. 2019, 676, 792–810. [Google Scholar] [CrossRef]
  13. Aguirre-Muñoz, A.; Buddemeier, R.W.; Camacho-Ibar, V.; Carriquiry, J.D.; Ibarra-Obando, S.E.; Massey, B.W.; Smith, S.V.; Wulff, F. Sustainability of coastal resource use in San Quintin, Mexico. AMBIO J. Hum. Environ. 2001, 30, 142–149. [Google Scholar] [CrossRef] [PubMed]
  14. Pires, A.; Morato, J.; Peixoto, H.; Botero, V.; Zuluaga, L.; Figueroa, A. Sustainability Assessment of indicators for integrated water resources management. Sci. Total Environ. 2017, 578, 139–147. [Google Scholar] [CrossRef] [PubMed]
  15. Brown, C.M.; Lund, J.R.; Cai, X.; Reed, P.M.; Zagona, E.A.; Ostfeld, A.; Hall, J.; Characklis, G.W.; Yu, W.; Brekke, L. The future of water resources systems analysis: Toward a scientific framework for sustainable water management. Water Resour. Res. 2015, 51, 6110–6124. [Google Scholar] [CrossRef]
  16. Incheon Metropolitan City, Groundwater Management Plan of Incheon. 2017. Available online: https://www.gims.go.kr/natnMngSchd.do?tgu=B&sgu=47&Activeidx=0 (accessed on 18 December 2021).
  17. Busan Metropolitan City, Groundwater Management Plan of Busan. 2015. Available online: https://www.gims.go.kr/natnMngSchd.do?tgu=B&sgu=44&Activeidx=0 (accessed on 18 December 2021).
  18. Koop, S.H.A.; Van Leeuwen, C.J. Application of the Improved City Blueprint Framework in 45 Municipalities and Regions. Water Resour. Manag. 2015, 29, 4629–4647. [Google Scholar] [CrossRef] [Green Version]
  19. Koop, S.H.A.; Van Leeuwen, C.J. Assessment of the Sustainability of Water Resources Management: A Critical Review of the City Blueprint Approach. Water Resour. Manag. 2015, 29, 5649–5670. [Google Scholar] [CrossRef] [Green Version]
  20. Albert, R.; Jeong, H.; Barabási, A.-L. Error and attack tolerance of complex networks. Nature 2000, 406, 378–382. [Google Scholar] [CrossRef] [PubMed] [Green Version]
  21. Yazdani, A.; Jeffrey, P. Water distribution system vulnerability analysis using weighted and directed network models. Water Resour. Res. 2012, 48, 1–10. [Google Scholar] [CrossRef]
  22. Kim, D.H.; Eisenberg, D.A.; Chun, Y.H.; Park, J. Network topology and resilience analysis of South Korean power grid. Phys. A Stat. Mech. Its Appl. 2017, 465, 13–24. [Google Scholar] [CrossRef] [Green Version]
  23. Eisenberg, D.A.; Park, J.; Seager, T.P. Sociotechnical Network Analysis for Power Grid Resilience in South Korea. Complexity 2017, 2017, 1–14. [Google Scholar] [CrossRef] [Green Version]
  24. Jang, G.U.; Joo, J.C.; Park, J. Capturing the Signature of Topological Evolution from the Snapshots of Road Networks. Complexity 2020, 2020, 8054316. [Google Scholar] [CrossRef]
  25. Kim, B.; Park, J. Random ecological networks that depend on ephemeral wetland complexes. Ecol. Eng. 2020, 156, 105972. [Google Scholar] [CrossRef]
  26. Rhemtulla, M.; Fried, E.I.; Aggen, S.H.; Tuerlinckx, F.; Kendler, K.S.; Borsboom, D. Network analysis of substance abuse and dependence symptoms. Drug Alcohol Depend. 2016, 161, 230–237. [Google Scholar] [CrossRef] [PubMed] [Green Version]
  27. Van Borkulo, C.; Boschloo, L.; Borsboom, D.; Penninx, B.W.J.H.; Waldorp, L.J.; Schoevers, R.A. Association of symptom network structure with the course of depression. JAMA Psychiatry 2015, 72, 1219–1226. [Google Scholar] [CrossRef]
  28. Borsboom, D. A network theory of mental disorders. Ann. Med. Psychol. Paris 2021, 179, 86–94. [Google Scholar] [CrossRef]
  29. Lee, J.S.; Bainter, S.A.; Carrico, A.W.; Glynn, T.R.; Rogers, B.G.; Albright, C.; O’Cleirigh, C.; Mayer, K.H.; Safren, S.A. Connecting the dots: A comparison of network analysis and exploratory factor analysis to examine psychosocial syndemic indicators among HIV-negative sexual minority men. J. Behav. Med. 2020, 43, 1026–1040. [Google Scholar] [CrossRef] [PubMed]
  30. KOSIS. Population, Households and Housing Units. Available online: https://kosis.kr/statHtml/statHtml.do?orgId=101&tblId=DT_1IN1502&conn_path=I2&language=en (accessed on 18 December 2021).
  31. Chung, S.Y.; Venkatramanan, S.; Kim, T.H.; Kim, D.S.; Ramkumar, T. Influence of hydrogeochemical processes and assessment of suitability for groundwater uses in Busan City, Korea. Environ. Dev. Sustain. 2015, 17, 423–441. [Google Scholar] [CrossRef]
  32. Chung, S.Y.; Venkatramanan, S.; Park, N.; Rajesh, R.; Ramkumar, T.; Kim, B.W. An assessment of selected hydrochemical parameter trend of the Nakdong River water in South Korea, using time series analyses and PCA. Environ. Monit. Assess. 2015, 187, 4192. [Google Scholar] [CrossRef] [PubMed]
  33. Chung, S.Y.; Rajendran, R.; Senapathi, V.; Sekar, S.; Ranganathan, P.C.; Oh, Y.Y.; Elzain, H.E. Processes and characteristics of hydrogeochemical variations between unconfined and confined aquifer systems: A case study of the Nakdong River Basin in Busan City, Korea. Environ. Sci. Pollut. Res. 2020, 27, 10087–10102. [Google Scholar] [CrossRef]
  34. Park, Y.C.; Jo, Y.J.; Lee, J.Y. Trends of groundwater data from the Korean National Groundwater Monitoring Stations: Indication of any change? Geosci. J. 2011, 15, 105–114. [Google Scholar] [CrossRef]
  35. MAFRA. Annual Report on the Seawater Intrusion Monitoring Network in Korea; MAFRA: Sejong, Korea, 2021. [Google Scholar]
  36. Water Quality Standards. Available online: https://mrccc.org.au/wp-content/uploads/2013/10/Water-Quality-Salinity-Standards.pdf (accessed on 18 December 2021).
  37. Lee, S.; Choi, G.W. Governance in a River Restoration Project in South Korea: The Case of Incheon. Water Resour. Manag. 2012, 26, 1165–1182. [Google Scholar] [CrossRef]
  38. Van Leeuwen, C.J.; Frijns, J.; van Wezel, A.; van de Ven, F.H.M. City Blueprints: 24 Indicators to Assess the Sustainability of the Urban Water Cycle. Water Resour. Manag. 2012, 26, 2177–2197. [Google Scholar] [CrossRef]
  39. Essex, B.; Koop, S.H.A.; Van Leeuwen, C.J. Proposal for a National Blueprint Framework to Monitor Progress on Water-Related Sustainable Development Goals in Europe. Environ. Manag. 2020, 65, 1–18. [Google Scholar] [CrossRef] [PubMed] [Green Version]
  40. Van Leeuwen, C.J.; Chandy, P.C. The city blueprint: Experiences with the implementation of 24 indicators to assess the sustainability of the urban water cycle. Water Sci. Technol. Water Supply 2013, 13, 769–781. [Google Scholar] [CrossRef]
  41. Huyghe, W.; Hernández-Pacheco Algaba, M.; Van Leeuwen, K.; Koop, S.; Eisenreich, S. Assessment of the urban water cycle in Antwerp (BE): The City Blueprint Approach (CBA). Clean. Environ. Syst. 2021, 2, 100011. [Google Scholar] [CrossRef]
  42. Rahmasary, A.N.; Robert, S.; Chang, I.-S.; Jing, W.; Park, J.; Bluemling, B.; Koop, S.; Van Leeuwen, K. Overcoming the challenges of water, waste and climate change in Asian cities. Environ. Manag. 2019, 63, 520–535. [Google Scholar] [CrossRef] [Green Version]
  43. Feingold, D.; Koop, S.; Van Leeuwen, K. The City Blueprint Approach: Urban Water Management and Governance in Cities in the US. Environ. Manag. 2018, 61, 9–23. [Google Scholar] [CrossRef] [Green Version]
  44. Van Leeuwen, C.J.; Koop, S.; Sjerps, R.M.A. City Blueprints: Baseline assessments of water management and climate change in 45 cities. Environ. Dev. Sustain. 2016, 18, 1113–1128. [Google Scholar] [CrossRef] [Green Version]
  45. Bolboaca, S.-D.; Jäntschi, L. Pearson versus Spearman, Kendall’s tau correlation analysis on structure-activity relationships of biologic active compounds. Leonardo J. Sci. 2006, 5, 179–200. [Google Scholar]
  46. Scialabba, N. Integrated Coastal Area Management and Agriculture, Forestry and Fisheries; Food and Agriculture Organization: Rome, Italy, 1998; ISBN 9251041326. [Google Scholar]
  47. Opsahl, T.; Agneessens, F.; Skvoretz, J. Node centrality in weighted networks: Generalizing degree and shortest paths. Soc. Netw. 2010, 32, 245–251. [Google Scholar] [CrossRef]
  48. Latora, V.; Nicosia, V.; Russo, G. Complex Networks: Principles, Methods and Applications; Cambridge University Press: Cambridge, UK, 2017; ISBN 1108298680. [Google Scholar]
  49. Castro, D.; Ferreira, F.; de Castro, I.; Rodrigues, A.R.; Correia, M.; Ribeiro, J.; Ferreira, T.B. The Differential Role of Central and Bridge Symptoms in Deactivating Psychopathological Networks. Front. Psychol. 2019, 10, 2448. [Google Scholar] [CrossRef] [PubMed]
  50. Papachristou, N.; Barnaghi, P.; Cooper, B.; Kober, K.M.; Maguire, R.; Paul, S.M.; Hammer, M.; Wright, F.; Armes, J.; Furlong, E.P.; et al. Network Analysis of the Multidimensional Symptom Experience of Oncology. Sci. Rep. 2019, 9, 2258. [Google Scholar] [CrossRef] [PubMed] [Green Version]
  51. Food and Agriculture Organization (FAO). AQUASTAT Country Statistics. Available online: https://www.fao.org/aquastat/statistics/query/index.html?lang=en (accessed on 18 December 2021).
  52. Elshall, A.S.; Arik, A.D.; El-Kadi, A.I.; Pierce, S.; Ye, M.; Burnett, K.M.; Wada, C.A.; Bremer, L.L.; Chun, G. Groundwater sustainability: A review of the interactions between science and policy. Environ. Res. Lett. 2020, 15, 93004. [Google Scholar] [CrossRef]
  53. Weatherl, R.K.; Henao Salgado, M.J.; Ramgraber, M.; Moeck, C.; Schirmer, M. Estimating surface runoff and groundwater recharge in an urban catchment using a water balance approach. Hydrogeol. J. 2021, 29, 2411–2428. [Google Scholar] [CrossRef]
  54. Galloway, D.L.; Burbey, T.J. Review: Regional land subsidence accompanying groundwater extraction. Hydrogeol. J. 2011, 19, 1459–1486. [Google Scholar] [CrossRef]
  55. Sato, C.; Haga, M.; Nishino, J. Land subsidence and groundwater management in Tokyo. Int. Rev. Environ. Strateg. 2006, 6, 403–424. [Google Scholar]
  56. Kundzewicz, Z.W.; Döll, P. Will groundwater ease freshwater stress under climate change? Hydrol. Sci. J. 2009, 54, 665–675. [Google Scholar] [CrossRef] [Green Version]
  57. Nogueira, G.; Stigter, T.Y.; Zhou, Y.; Mussa, F.; Juizo, D. Understanding groundwater salinization mechanisms to secure freshwater resources in the water-scarce city of Maputo, Mozambique. Sci. Total Environ. 2019, 661, 723–736. [Google Scholar] [CrossRef] [PubMed]
  58. Rodell, M.; Velicogna, I.; Famiglietti, J.S. Satellite-based estimates of groundwater depletion in India. Nature 2009, 460, 999–1002. [Google Scholar] [CrossRef] [Green Version]
  59. Ferguson, G.; Gleeson, T. Vulnerability of coastal aquifers to groundwater use and climate change. Nat. Clim. Chang. 2012, 2, 342–345. [Google Scholar] [CrossRef]
  60. Mantoglou, A. Pumping management of coastal aquifers using analytical models of saltwater intrusion. Water Resour. Res. 2003, 39, 1–12. [Google Scholar] [CrossRef]
  61. Maharjan, M.; Aryal, A.; Man Shakya, B.; Talchabhadel, R.; Thapa, B.R.; Kumar, S. Evaluation of Urban Heat Island (UHI) Using Satellite Images in Densely Populated Cities of South Asia. Earth 2021, 2, 86–110. [Google Scholar] [CrossRef]
  62. Esmeray, E.; Gökcekli, C. Assessment of groundwater quality for drinking and irrigation purposes in Karabuk province, Turkey. Environ. Earth Sci. 2020, 79, 325. [Google Scholar] [CrossRef]
  63. Li, X.-D.; Masuda, H.; Kusakabe, M.; Yanagisawa, F.; Zeng, H.-A. Degradation of groundwater quality due to anthropogenic sulfur and nitrogen contamination in the Sichuan Basin, China. Geochem. J. 2006, 40, 309–332. [Google Scholar] [CrossRef] [Green Version]
  64. Ahmad, M.N.; Sultana, R.; Yoshida, M.; Salahuddin, M. Groundwater contamination issues in Chiniot area, Punjab, Pakistan. Int. J. Environ. Sci. Dev. 2020, 11, 123–127. [Google Scholar] [CrossRef] [Green Version]
  65. Wijekoon, P.; Koliyabandara, P.A.; Cooray, A.T.; Lam, S.S.; Athapattu, B.C.L.; Vithanage, M. Progress and prospects in mitigation of landfill leachate pollution: Risk, pollution potential, treatment and challenges. J. Hazard. Mater. 2022, 421, 126627. [Google Scholar] [CrossRef] [PubMed]
  66. Moench, M. Groundwater and Poverty: Exploring the Connections. In Intensive Use of Groundwater: Challenges and Opportunities; Balkema: Rotterdam, The Netherlands, 2003; pp. 441–456. ISBN 90 5809 390 5. [Google Scholar]
  67. Narayanamoorthy, A. Does groundwater irrigation reduce rural poverty? Evidence from Indian states. Irrig. Drain. 2007, 56, 349–362. [Google Scholar] [CrossRef]
  68. Sekhri, S. Wells, water, and welfare: The impact of access to groundwater on rural poverty and conflict. Am. Econ. J. Appl. Econ. 2014, 6, 76–102. [Google Scholar] [CrossRef] [Green Version]
  69. Zhang, L.; Wang, J.; Huang, J.; Rozelle, S. Development of Groundwater Markets in China: A Glimpse into Progress to Date. World Dev. 2008, 36, 706–726. [Google Scholar] [CrossRef]
  70. Henriksen, H.J.; Rasmussen, P.; Brandt, G.; von Bülow, D.; Jensen, F.V. Public participation modelling using Bayesian networks in management of groundwater contamination. Environ. Model. Softw. 2007, 22, 1101–1113. [Google Scholar] [CrossRef]
  71. Karjalainen, T.P.; Rossi, P.M.; Ala-Aho, P.; Eskelinen, R.; Reinikainen, K.; Kløve, B.; Pulido-Velazquez, M.; Yang, H. A decision analysis framework for stakeholder involvement and learning in groundwater management. Hydrol. Earth Syst. Sci. 2013, 17, 5141–5153. [Google Scholar] [CrossRef] [Green Version]
  72. Robins, N.S.; Fergusson, J. Groundwater scarcity and conflict-managing hotspots. Earth Perspect. 2014, 1, 6. [Google Scholar] [CrossRef]
  73. Doro-on, A. Risk Assessment for Water Infrastructure Safety and Security; CRC Press: Boca Raton, FL, USA, 2011; ISBN 1439853428. [Google Scholar]
  74. Jones, J.A.A. Threats to Global Water Security: Population Growth, Terrorism, Climate Change, or Commercialisation? In Threats to Global Water Security; Springer: Berlin/Heidelberg, Germany, 2009; pp. 3–13. [Google Scholar]
  75. Molle, F.; López-Gunn, E.; van Steenbergen, F. The local and national politics of groundwater overexploitation. Water Altern. 2018, 11, 445–457. [Google Scholar]
  76. Sekhri, S. Sustaining Groundwater: Role of Policy Reforms in Promoting Conservation in India. India Policy Forum 2013, 9, 149–187. [Google Scholar]
  77. Knapp, M.F. Diffuse pollution threats to groundwater: A UK water company perspective. Q. J. Eng. Geol. Hydrogeol. 2005, 38, 39–51. [Google Scholar] [CrossRef]
  78. Nieto, P.; Custodio, E.; Manzano, M. Baseline groundwater quality: A European approach. Environ. Sci. Policy 2005, 8, 399–409. [Google Scholar] [CrossRef]
  79. Seaton, K. Taking a Closer Look at Just Compensation: State Regulation of Groundwater Withdrawals as an Appropriate Use of Their Police Powers. J. Corp. Law 2016, 41, 1009. [Google Scholar]
  80. Haag, J.; Ryan, M. Integrity risks in professional borehole drilling. GeoDrilling Int. 2019, 15–16. Available online: https://skat.ch/wp-content/uploads/2019/07/GEO-Drilling-International-July-August-2019-p.15-16.pdf (accessed on 18 December 2021).
  81. UNICEF/Skat Foundation Professional Water Well Drilling: A UNICEF Guidance Note, Cost Effective Boreholes Partnership Rural Water Supply Network by UNICEF Skat Foundation; Skat Foundation: St. Gallen, Switzerland, 2016.
  82. Stålgren, P. Corruption in the water sector: Causes, Consequences and Potential Reform. In Swedish Water House Policy Brief; SIWI: Stockholm, Sweden, 2006. [Google Scholar]
  83. Gopalakrishnan, G.; Negri, M.C.; Wang, M.; Wu, M.; Snyder, S.W.; La Freniere, L. Biofuels, Land, and Water: A Systems Approach to Sustainability. Environ. Sci. Technol. 2009, 43, 6094–6100. [Google Scholar] [CrossRef] [PubMed] [Green Version]
  84. Moraes-Santos, E.C.; Dias, R.A.; Balestieri, J.A.P. Groundwater and the water-food-energy nexus: The grants for water resources use and its importance and necessity of integrated management. Land Use Policy 2021, 109, 105585. [Google Scholar] [CrossRef]
  85. Rapti-Caputo, D.; Vaccaro, C. Geochemical evidences of landfill leachate in groundwater. Eng. Geol. 2006, 85, 111–121. [Google Scholar] [CrossRef]
  86. Ministry of Agriculture, Food and Rural Affairs; Korea Rural Community Corporation. Annual Report on the Seawater Intrusion Monitoring Network in Korea; Ministry of Agriculture, Food and Rural Affairs: Sejong-si, Korea; Korea Rural Community Corporation: Naju-si, Korea, 2020.
  87. Hussain, M.S.; Abd-Elhamid, H.F.; Javadi, A.A.; Sherif, M.M. Management of Seawater Intrusion in Coastal Aquifers: A Review. Water 2019, 11, 2467. [Google Scholar] [CrossRef] [Green Version]
  88. Cao, T.; Han, D.; Song, X. Past, present, and future of global seawater intrusion research: A bibliometric analysis. J. Hydrol. 2021, 603, 126844. [Google Scholar] [CrossRef]
Figure 1. Map of the study areas, Incheon (orange) and Busan (blue).
Water 14 00262 g001
Figure 2. Overview of the City Blueprint Approach with three complementary assessment frameworks. TPF and CBF, which are used in this paper, are in the red box.
Water 14 00262 g002
Figure 3. First and second-level indicators of groundwater scarcity (a) and quality (b). First-level indicators are connected to groundwater, and second-level indicators are connected to first-level indicators.
Water 14 00262 g003
Figure 4. The result of TPF of Incheon (orange) and Busan (blue dot).
Water 14 00262 g004
Figure 5. The result of CBF of Incheon (orange) and Busan (blue dot).
Water 14 00262 g005
Figure 6. The example of CB networks for all cities (a) and coastal cities (b). TPF indicators are marked with a purple circle, while CBF indicators are marked with a green circle. Node #10 is the ‘groundwater scarcity’ indicator, and node #30 is the groundwater quality indicator (marked with a red circle). Blue-colored edges indicate positive weights while red indicates negative. The thickness of an edge is proportional to the absolute value of a weight.
Water 14 00262 g006
Figure 7. Node centralities of groundwater-centered CB networks. The results for entire cities (GT) (ac), coastal cities (GC) (df), and non-coastal cities (GNC) (gi). The first column is the results of node strength (a,d,g), the second column is closeness centrality (b,e,h), and the third column is betweenness centrality (c,f,i).
Water 14 00262 g007
Figure 8. Analysis result of the groundwater-centered CB network without governance-related indicators for coastal cities. Node strength (a), closeness centrality (b), and betweenness centrality (c).
Water 14 00262 g008
Table 1. Indicators and categories of TPF (left) and CBF (right).
Trends and Pressures FrameworkCity Blueprint Framework
Social1. Urbanisation rateI.
Basic water services
1. Access to drinking water
2. Burden of disease2. Access to sanitation
3. Education rate3. Drinking water quality
4. Female participationII.
Water quality
4. Secondary WWT
Environmental5. Urban drainage flooding5. Tertiary WWT
6. River peak discharge6. Groundwater quality
7. Sea level rise III. Wastewater treatment7. Nutrient recovery
8. Land subsidence 8. Energy recovery
9. Freshwater scarcity 9. Sewage sludge recycling
10. Groundwater scarcity10. WWT energy efficiency
11. Seawater intrusionIV.
Water infrastructure
11. Stormwater separation
12. Biodiversity12. Average age sewer
13. Heat islands13. Water system leakages
14. Air Quality14. Operation cost recovery
Financial15. Economic pressureV.
Solid waste
15. MSW collected
16. Unemployment rate16. MSW recycled
17. Poverty rate17. MSW energy recovered
18. Investment freedomVI.
Climate adaptation
18. Green space
Governance19. Voice and accountability19. Climate adaptation
20. Political stability20. Climate-robust buildings
21. Government effectivenessVII.
Plans and actions
21. Management and action plans
22. Regulatory quality22. Water efficiency measures
23. Rule of law23. Drinking water consumption
24. Control of corruption24. Attractiveness
Table 2. Node numbers (ID) assigned to indicators.
IDCity Blueprint IndicatorID City Blueprint Indicator
1TPF 1 Urbanization rate25CBF 1 Access to drinking water
2TPF 2 Burden of disease26CBF 2 Access to sanitation
3TPF 3 Education rate27CBF 3 Drinking water quality
4TPF 4 Female participation28CBF 4 Secondary WWT
5TPF 5 Urban drainage flood29CBF 5 Tertiary WWT
6TPF 6 River peak discharges30CBF 6 Groundwater quality
7TPF 7 Sea level rise31CBF 7 Nutrient recovery
8TPF 8 Land subsidence32CBF 8 Energy recovery
9TPF 9 Freshwater scarcity33CBF 9 Sewage sludge recycling
10TPF 10 Groundwater scarcity34CBF 10 WWT energy efficiency
11TPF 11 Seawater intrusion35CBF 11 Stormwater separation
12TPF 12 Biodiversity36CBF 12 Average age sewer
13TPF 13 Heat risk37CBF 13 Water system leakages
14TPF 14 Air quality38CBF 14 Operation cost recovery
15TPF 15 Economic pressure39CBF 15 Solid waste collected
16TPF 16 Unemployment rate40CBF 16 Solid waste recycled
17TPF 17 Poverty rate41CBF 17 Solid waste energy recovered
18TPF 18 Investment freedom42CBF 18 Green space
19TPF 19 Voice and accountability43CBF 19 Climate adaptation
20TPF 20 Political stability44CBF 20 Climate-robust buildings
21TPF 21 Government effectiveness45CBF 21 Management and action plans
22TPF 22 Regulatory quality46CBF 22 Water efficiency measures
23TPF 23 Rule of law47CBF 23 Drinking water consumption
24TPF 24 Control of corruption48CBF 24 Attractiveness
Table 3. The description of node strength, betweenness centrality, and closeness centrality.
Netowrk MetricsNode Strength
(s(i))
Closeness Centrality
( C C   w ( i ) )
Betweenness Centrality
( C B   w ( i ) )
Diagram Water 14 00262 i001 Water 14 00262 i002 Water 14 00262 i003
PrincipalAssigns an importance score based simply on the sum of edge weight of each nodes.Scores node based on their ‘closeness’ to all other nodes. The shortest paths between all nodes are calculated, then each node gets a score based on its sum of shortest paths.Measures the number of times a node lies on the shortest path between other nodes. It shows which nodes are ‘bridges’ between nodes in a network.
ApplicationFor finding highly connected indicators that may represent an overarching factor with the indicators that are linked.Finding indicators that are most interfering with the overall network. Improving these indicators most significantly impacts other indicators.For finding the indicators that act as key bridges between other clusters of indicators.
CalculationThe sum of edge weights connected to node i
s i = j N A i j w i j
The sum of the weighted shortest paths between node i and all other nodes in the network.
C C w ( i ) = [ i N d i j w ] 1
The weighted shortest path ( d i j w ) is calculated as the smallest sum of the weights of the edges throughout all possible paths from node i to j:
d i j w = min ( 1 w i h + + 1 w h j )
The number of the weighted shortest paths that pass through node i.
C B w ( i ) = j k g j k w ( i ) g j k w
Table 4. Attributes of the groundwater-centered CB networks.
Networksnm<s>d
Entire cities (GT)289611.222.92
Coastal cities (GC)3616015.713.77
Non-coastal cities (GNC)31616.353.04
Note: n and m are the numbers of nodes and edges, respectively, <s> is mean node strength, and d is mean distance. GT is the groundwater-centered network of indicator results from all cities, GC is from coastal cities, and GNC is from non-coastal cities.
Table 5. The descriptions of high correlations between indicators and groundwater.
Indicators (ID #)Centralities Assessed as HighDescriptions of How the Indicator is Correlated with GroundwaterRefs.
Urban drainage flood (5)s (GC2),
C C   w ( G C 2 ),
C B   w ( G C 2 )
  • Mostly caused by high impervious area, which prohibits or retards stormwater infiltration resulting in a reduced recharge of groundwater.
[53]
Land subsidence (8) C B   w ( G C 1 )
s (GC2),
C C   w ( G C 2 )
  • A decrease in the groundwater level by overexploiting groundwater can cause land subsidence.
[54,55]
Freshwater scarcity (9) C B   w ( G C 1 )
  • Reliable groundwater resources mitigate freshwater stress.
  • Both surface water scarcity and poor quality increases the pressure on groundwater.
[56,57,58]
Seawater intrusion (11) C C   w ( G C 1 )
s(GC2),
C C   w ( G C 2 ),
C B   w ( G C 2 )
  • Contraction of groundwater causes the landward intrusion of groundwater.
  • Seawater intrusion degrades freshwater into brackish or saltwater in an aquifer.
[59,60]
Heat risk (13) C B   w ( G C 1 )
s (GC2),
C C   w ( G C 2 ),
C B   w ( G C 2 )
  • Typically caused by the expansion of the impervious area, which reduces stormwater infiltration and groundwater recharge.
  • Hot temperature increases evapotranspiration and changes local climate.
[61]
Air quality (14) C B   w ( G C 1 )
  • Both wet and dry depositions of air pollutants (e.g., water-soluble metal components) can infiltrate into groundwater.
[62,63]
Economic pressure (15) C C   w ( G C 2 )
  • A better economy enables improved water efficiency and wastewater and solid waste management that reduce the impact on the quantity and quality of groundwater resources.
[64,65]
Poverty rate (17)s (GC1),
s (GC2)
  • Groundwater scarcity and poor quality can cause the depletion of agricultural water that increases the poverty rate.
  • Poor cities tend to lack high-quality water services, which leads to many private boreholes that deplete groundwater. They also pollute groundwater due to the lack of wastewater treatment services (e.g., through pit latrines).
  • Poorer cities cannot often afford proper treatment of solid wastes leading to uncollected and, if collected, poor landfilling with leachate containing hazardous substances to the groundwater.
[65,66,67,68]
Investment freedom (18) C B   w ( G C 1 ) ,
s (GC2),
C B   w ( G C 2 )
  • Government investment and bank programs promote groundwater markets.
[69]
Voice and accountability (19)s (GC1),
C C   w ( G C 1 )
  • Freedom of speech leads to better groundwater management by, for example, encouraging citizens to get interested in groundwater management and preservation.
  • Increasing public participation leads to the establishment of governance on groundwater management.
[70,71]
Political instability (20)s (GC1),
C C   w ( G C 1 )
  • Groundwater dependence on freshwater resources increases when politically instable.
  • Water scarcity acts as a catalyst for social unrest and regional conflicts.
[72,73,74]
Government effectiveness (21)s (GC1),
C C   w ( G C 1 )
  • Better quality of governance and policy lead to preservation of groundwater resources.
[75,76]
Regulatory quality (22)s (GC1),
C C   w ( G C 1 )
C B   w ( G C 1 )
  • Establishment of regulations on groundwater abstraction and effluent control of used water improves groundwater resources.
[77,78]
Rule of law (23)s (GC1),
C C   w ( G C 1 )
  • A strong government authority prevents illegal groundwater withdrawal and discharge of contaminants that potentially degrade groundwater quality.
[79]
Control of corruption (24)s (GC1),
C C   w ( G C 1 )
  • Corruption contributes to poor delivery of groundwater development projects and is a factor in which 14–30% of newly constructed wells fail within one year of construction.
[80,81,82]
Energy recovery (32) C B   w ( G C 1 )
  • Energy production (e.g., biofuel crops) requires a large amount of (ground)water resources by Water–Food–Energy nexus. Enhancement of energy recovery will reduce water requirements.
[83,84]
Solid waste recycled (40) C C   w ( G C 2 ),
C B   w ( G C 2 )
  • The more solid waste is recycled, the less of the waste is landfilled. Landfill leachate causes groundwater contamination.
[85]
Note: s is node strength, C C   w is closeness, and C B   w is betweenness, respectively. Further, GC1 is a coastal groundwater-centered network, and GC2 is a coastal groundwater-centered network without governance-related indicators.
Publisher’s Note: MDPI stays neutral with regard to jurisdictional claims in published maps and institutional affiliations.

