Article

Geographical Preference for Installation of Solar Still Water Desalination Technologies in Iran: An Analytical Hierarchy Process (AHP)-Based Answer

1
Lab of Optimization of Thermal Systems’ Installations, Energy Division, Faculty of Mechanical Engineering, K.N. Toosi University of Technology, No. 15-19, Pardis St., Mollasadra Ave., Vanak Sq., Tehran 19395-1999, Iran
2
Department of Computer Science, Kashmar Higher Education Institute, Kashmar 967198-9851, Iran
3
Department of Planning, Design, Technology of Architecture, Sapienza University of Rome, 00196 Rome, Italy
*
Author to whom correspondence should be addressed.
Water 2022, 14(2), 265; https://doi.org/10.3390/w14020265
Submission received: 16 December 2021 / Revised: 9 January 2022 / Accepted: 11 January 2022 / Published: 17 January 2022
(This article belongs to the Special Issue Renewable Energy Systems Flexibility for Water Desalination)

Abstract

:
Water shortage is one of the most crucial challenges worldwide, especially in the Middle Eastern countries, with high population and low freshwater resources. Considering this point and the increasing popularity of solar stills desalination systems, as the contribution, this study aims at finding the geographical preference for installation of those technologies in Iran, which is one of the biggest and most populated countries in the Middle East. For this purpose, from each climatic zone of Iran, one representative city is chosen, and analytical hierarchy process (AHP), as one of the most powerful tools for systematic decision-making, is applied. Annual fresh water production (AFWP) from the technical aspect, energy payback period (EPBP) from the energy perspective, and investment payback period from the economic point of view are selected as the decision criteria. Obtaining the three indicated indicators is done using artificial neural networks (ANNs) for yield and water temperature in the basin, which are developed by means of the recorded experimental data. The results indicate that hot arid cities with high received solar radiation, or the ones that have a higher water tariff compared to the others, are the preferred places for installation of solar stills. The example of the first category is Ahvaz, while Tehran is representative of the cities from the second category. AHP demonstrates that they are the first and second priorities for solar still installation, with scores of 26.9 and 22.7, respectively. Ahvaz has AWFP, EPBP, and IPP of 2706.5 L, 0.58 years, and 4.01 years; while the corresponding values for Tehran are 2115.3 L, 0.87 years, and 2.86 years. This study belongs to three classifications in the mathematical problems: 1. experimental work (code: 76–05), 2. Neural networks (code: 92B20), 3. and decision problems, (code: 20F10).

1. Introduction

The increasing freshwater shortage from one side and the growing concerns about the utilization of fossil fuel from another side, have led to developing renewable energy-based desalination technologies [1]. Among various alternatives, solar still desalination systems are taken into account as one of the most propitious items [2]. It is because solar still enjoys a number of advantages compared to the other rivals, including low operating [3] and capital costs [4]; space for installation [5]; and availability of application in both small and large scales [6], not having noise during operation [7]. Considering such a wide range of advantages, different investigations have been done to analyze solar stills from different points of view [8].
Attia et al. [9] assessed solar still usage potential in arid areas in Algeria by taking energy and exergy indicators into account. According to the results, the range of 2.2–3.5 kg.m−2 for the system during the operation in winter and summer was seen, respectively.
Parsa et al. [10] conducted experiments for analyzing the performance of a solar still enhanced by nanomaterials at higher altitudes of Tehran, which is the capital of Iran. According to the results of that study, since the rate of received ultra-violet is higher than the city, higher evaporation rate could be observed. The exergy efficiency of 9.27% and energy efficiency of 55.98% were reported as the highest values.
As a smart augmentation way to enhance the productivity, Attia et al. [11] examined phosphate bags for energy storage. The measurement was done under the climatic condition of El Oued, which is an Algerian city. The ranges of 4.87 to 5.27 kg for fresh water production, and 22.5 to 28.0% for overall efficiency were observed.
In another study, Hassan et al. [12] evaluated solar still performance under different saline water conditions based on energy, exergy, economic, and environmental criteria. Their recorded experimental results showed that the exergy and energy output levels had been increased up to two and three times more, respectively, when solar collectors from parabolic trough were used.
The research work carried out by Amiri et al. [13] was another study in which parabolic trough collector was suggested for performance enhancement of a solar still. A simulation framework was provided for thermal modeling, which had been validated using the experimental data. The verified model was utilized for performance assessment during winter and summers, which indicated that 55% more fresh water was produced in summer in comparison to the winter.
Mohanraj et al. [14] studied the performance of a water heating system by a heat pump, which was assisted by a solar still for energy storage. The study considered the energy, environmental, and economic sides, in which the range of 2.21–2.55 years for the coefficient of performance was found. The amount of CO2 production and payback period were also 26,800 kg and 21.46 months, respectively for 275 days of operation.
In addition to the mentioned studies, three investigations were performed recently by the research team on solar stills. Initially, in [15], an innovative design for solar stills, which utilized side mirrors and tracking strategies, was proposed. It had 36.0% better efficiency and 43.1% higher distillate. Then, the performance of the provided design in [15] was simulated using the artificial neural network (ANN), in which water temperature in the basin and distillate production were the outputs [16]. The third work was [17]. In [17], the use of electric heaters and concentrating solar collectors was studied by experimental data. Both technical and economic issues were taken into consideration. Different conditions for water height in the basin were examined, while Kerman, as a city from the arid-hot climate of Iran, was the city of experiments.
According to the literature reviewed here, in addition to the provided information in the review studies, such as the works of Panchal et al. [18], Kumar et al. [19], Singh et al. [20], and so on, the most focus in the research works in the field of solar stills have been on proposing the ways for system performance enhancement. In the conducted studies, usually, one city was selected for investigation, and even if more than one city was considered, it was not determined that:
  • When energy, economic, and technical indicators are considered at the same time, among a number of cities, with diverse meteorological and water tariffs, which one would be the best for installation of solar stills?
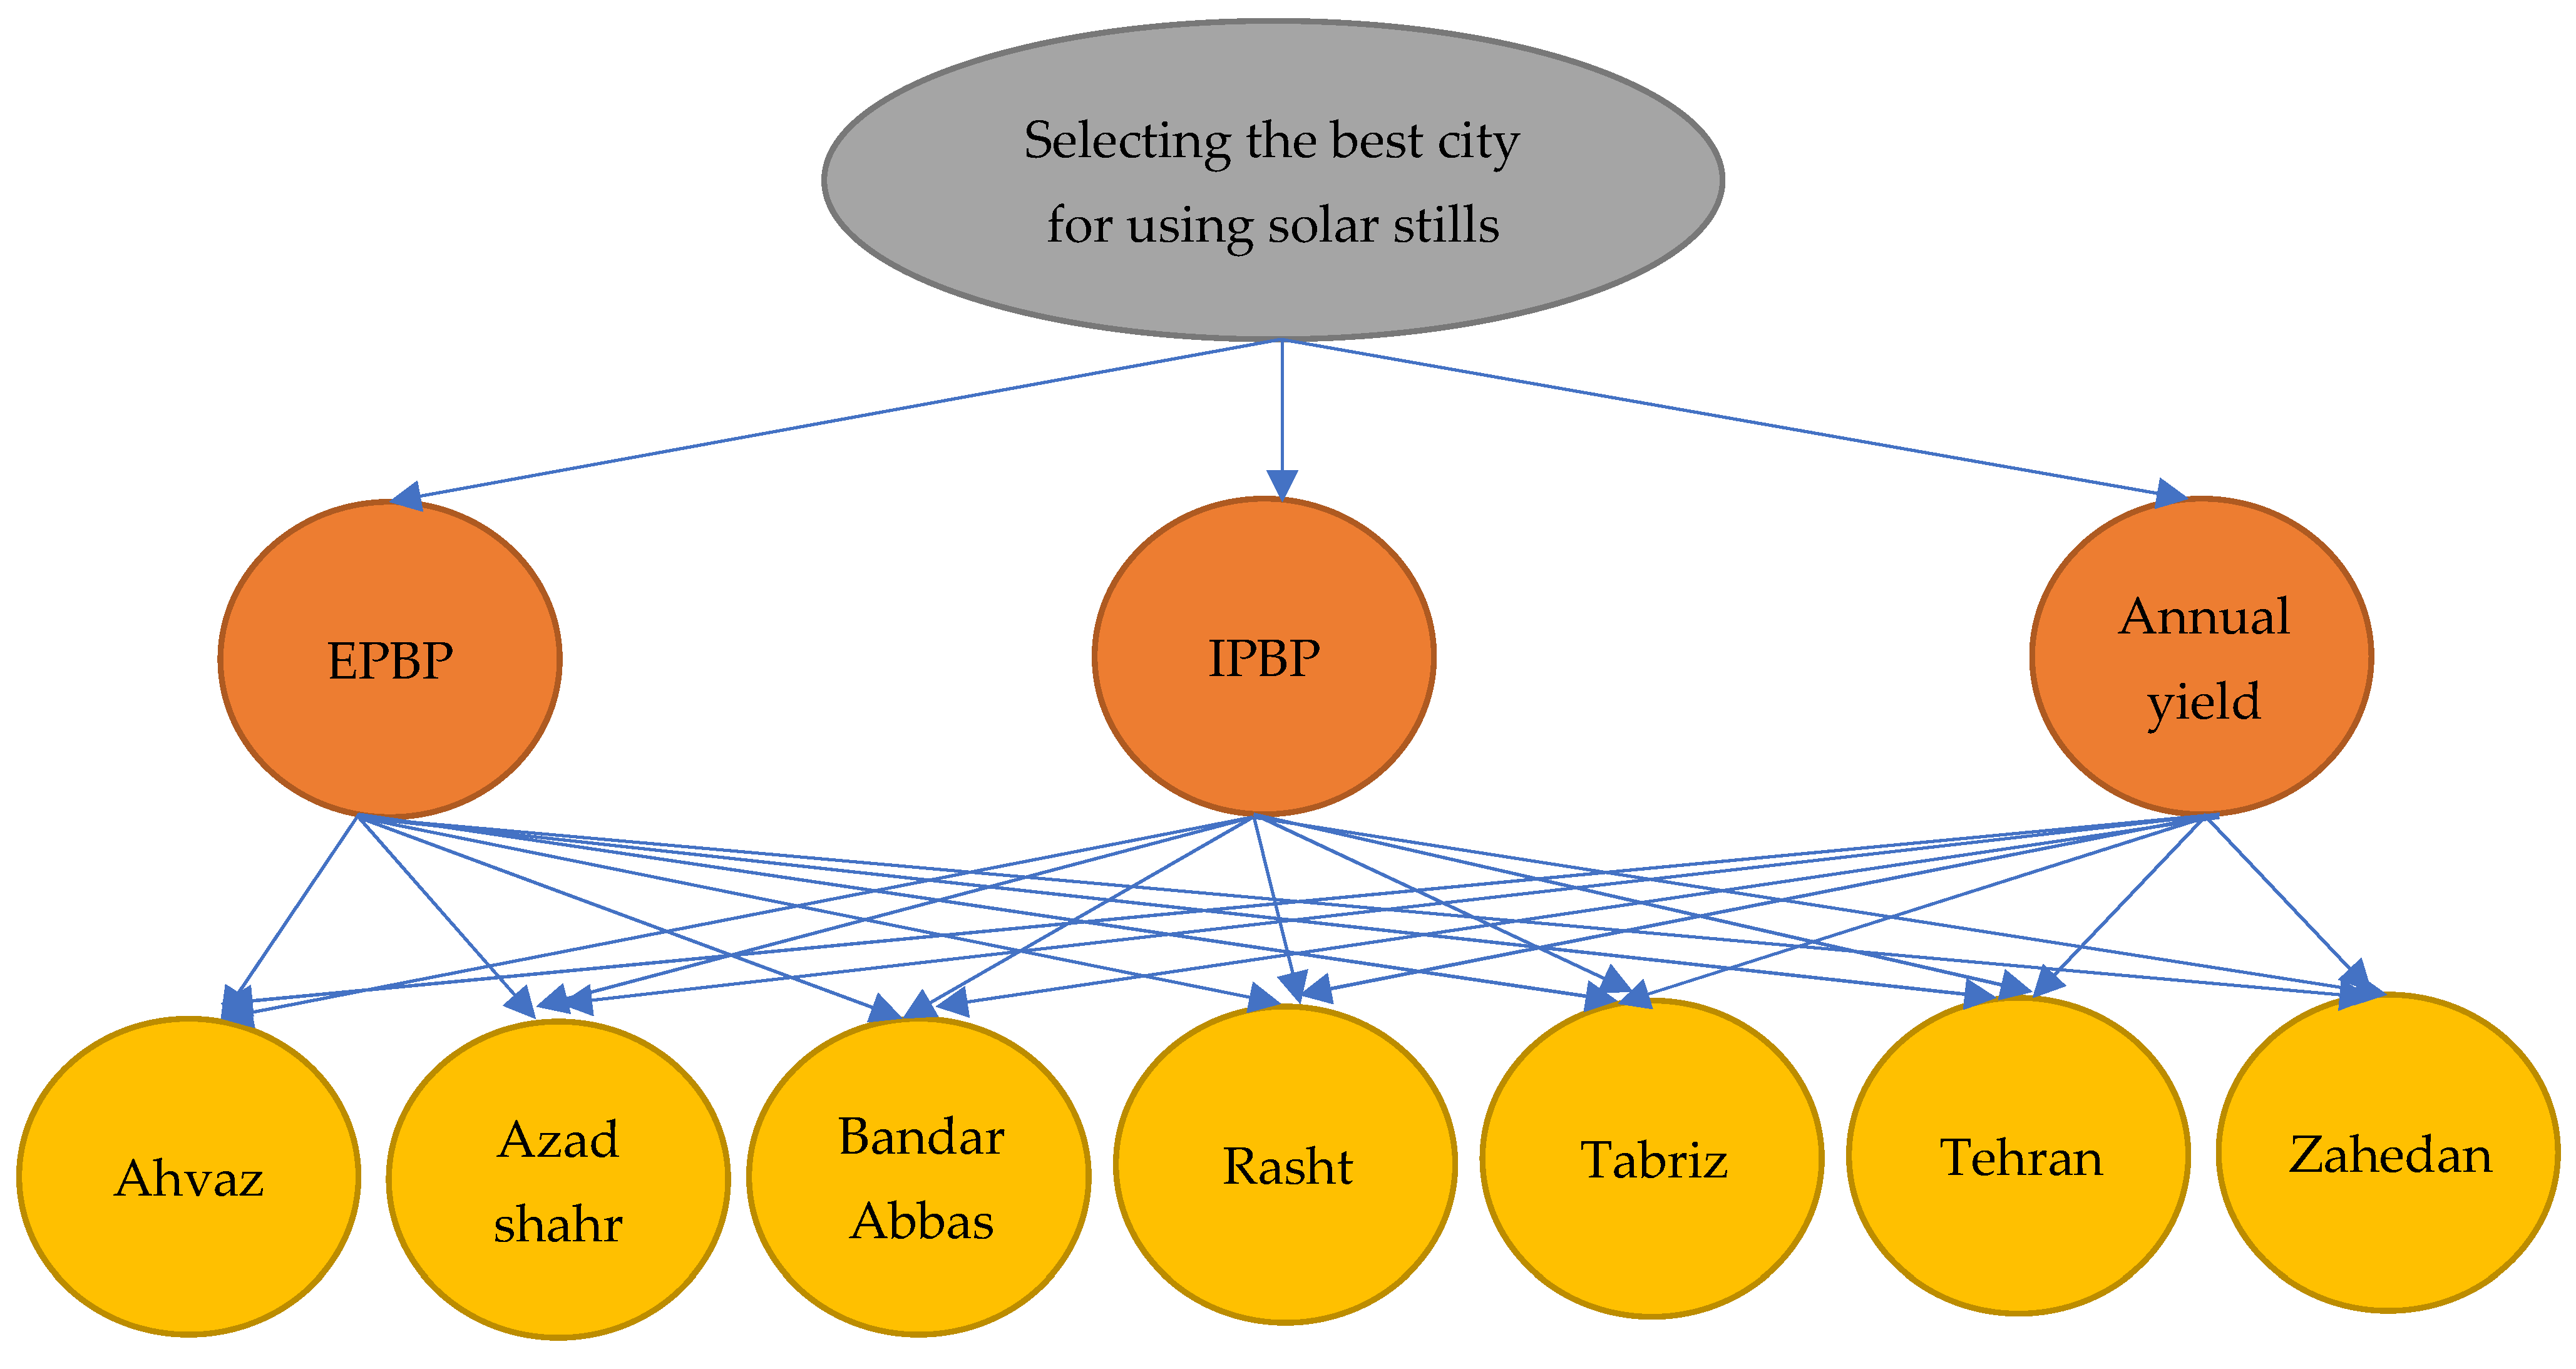
Considering the indicated gap and introduced the research question, this study is done. Iran, which is located in the Middle East region, Asia, is considered as the considered region, and from each climatic condition, a representative city is selected. Then, by considering annual fresh water production (AFWP), energy payback period (EBPT), and investment payback period (IPBP) as the technical, energy, and economic criteria, the priority to install solar stills is found. It is done using the analytical hierarchy process (AHP), as one of the most powerful tools for this purpose.

2. Materials and Methods

Here, first, the investigated system and considered cities are introduced. Then, it is described how the decision criteria are obtained. Finally, the working principle of the analytical hierarchy process, as the decision-making approach, is briefly explained.

2.1. The Investigated System

Schematic of the investigated solar still is illustrated in Figure 1. This design was originally provided in the previous studies of the research team [15], where both its technical and economic superiority compared to the conventional designs were proven. In this design, which is from single-slope type, side mirrors and sun-tracking are employed.

2.2. The Considered Cities

Based on the information provided in [21], there are seven major diverse climatic zones in Iran. From each zone, one representative city is chosen. Table 1 shares the information about those eight cities.

2.3. The Way to Obtain Decision Criteria

Modeling plays an important role in obtaining accurate results [22,23,24,25,26]. As indicated, the studied performance criteria of the system are the amount of freshwater production in a year, as well as energy and investment payback periods, which are indicated by AFWP, EPBP, and IPBP. In this part, the way to determine these three parameters is explained.

2.3.1. The Annual Freshwater Production (AFWP)

In order to calculate the amount of system yield, an artificial neural network (ANN) that has been provided by Sohani et al. [16] for this design is utilized. The provided ANN predicts the amount of freshwater production based on the effective parameters, including ambient relative humidity and temperature, wind speed, and the received solar radiation. In addition to the developed ANN of [16], long short-term memory (LSTM) and random forest (RF) models are also developed for being compared with ANN. Figure 2 presents the error between the experimental and predicted data throughout a year, for the city Tehran. As observed, the mean estimation error by ANN is 6.79%, whereas LSTM and RF are able to predict with average errors of 7.87 and 8.12%, respectively. It shows the higher accuracy of the employed ANN model for the calculation of freshwater production compared to the other models.
The reason for selecting ANN is that it was chosen as the best model for performance prediction of different energy systems among a variety of statistical and soft computing methods. The references [16,27,28] could be given as some previous studies of the research team, in which ANN has been found as the model with the best values of error-related criteria compared to the other alternatives.
The amount of freshwater production of solar still in a year is obtained through summation of obtained values by ANN model.

2.3.2. The Water Temperature in the Basin (TWAT,BAS)

In addition to the yield, another ANN was also presented in [16] for estimation of water temperature in the basin ( T W A T , B A S ). The effective input parameters of this ANN are the same as the yield, while it is also able to offer high prediction accuracy. According to Figure 3, the mean error value for this case is 3.74% for ANN, while the corresponding values for LSTM and RF are 4.80 and 5.17%, respectively. The average error values show that for this case, like the yield, using ANN leads to more accurate prediction compared to LSTM and RF.
More information about the employed ANN model was completely provided in [16]. Therefore, to not make the article too lengthy, it is introduced for further details. In addition, the experimental data to train ANN, LSTM, and RF models were obtained based on the experiments conducted in Tehran, Iran. The experimental data was recorded on an hourly basis, starting from January 2019 to the end of the same year. Components in addition to their cost are introduced in Table 2, while the information about the used devices to capture experimental data is provided in Table 3.

2.3.3. Energy Payback Period (EPBP)

The ratio of the consumed energy from the material extraction to the delivery of the solar still ( E S T , E X T O D E ), to the annual energy saving due to using the solar still ( E A N , S A V , S T ) is defined as EPBP [30,31,32,33,34]. Mathematically speaking [35]:
E P B P = E S T , E X T O D E E A N , S A V , S T
where E A N , S A V , S T is obtained using Equation (2):
E A N , S A V , S T = 1 η B O L j = 1 8760 m F W , H O × Δ h
m F W , H O is obtained from the employed ANN. Moreover, Δ h is the specific enthalpy for changing the water state from ambient condition to the saturated vapor at basin temperature. η B O L also indicates the boiler efficiency, which provides the heat of vaporization in the absence of solar still (using the conventional desalination system), which is considered as 0.80 here [36].

2.3.4. Investment Payback Period (IPBP)

As it has just been indicated, due to using solar still, a conventional MED unit is not used. Therefore, the money that is not paid for freshwater production by MED unit is the source of saving on the one hand. On the other hand, the initial cost ( C I N I ) that is paid for buying the solar still is the source of expenses. C I N I is completely paid at the beginning of a system’s life time. Therefore, the net outcome of the system in the year N from the system installation could be determined through Equation (3):
C N E T O = k = 1 N c F W , D O M × m F W , A N × ( 1 + i ) k 1 ( 1 + d ) k C I N I C
In which c F W , D O M is the cost of unit of produced fresh water provided by the domestic water supply system. The cost of supplied water in different regions of Iran is based on the information that is available for different regions of Iran [37]. i and d also represent inflation rate and discount rate, which are assumed as 0.05 and 0.09, respectively [38]. IPBP is the time, C N E T O turns from a negative to a positive value [39,40,41,42,43]. In other words, IPBP is number of years, N, in Equation (3), which makes C N E T O zero [44,45,46,47,48]. Therefore, IPBP is determined via Equation (4).
C N E T O = k = 1 I P B P c F W , M E D × m F W , A N × ( 1 + i ) k 1 ( 1 + d ) k C I N I C = 0
It is worth noting that Equation (4) is a non-linear equation, which could be solved using numerical solutions by software programs like MATLAB. The procedure to solve Equation (4) is presented in Appendix A, where the process flow chart of algorithm to determine IPBP is given in Figure A1.

2.4. Analytical Hierarchy Process

In the selection process of an item among a number of alternatives, the selection is done based on a number of indicators that are called decision criteria. Decision criteria in energy systems cover a variety of items from the key important aspects, including technical, energy, and economic perspectives [49,50,51,52,53]. If one alternative has the foremost values of all the decision criteria at the same time, it would be the best. However, in real cases, including this study, it is not so. Consequently, a decision-making method should be applied to find the best item among a number of selections. From the list of several available decision-making methods, AHP, as one of the most common approaches, is utilized here.
By following three steps, AHP chooses the foremost item among a variety of alternatives [54]:
  • At the beginning, the goal, the alternatives, and decision criteria are defined. In addition, if each criterion has some sub-criteria, they are determined, as well. It leads to achieving a tree process for the decision-making problem. The decision-making tree for the defined problem of this investigation is shown in Figure 4. As seen, it is composed of three decision-criteria and seven alternatives, while the sub-criteria for each criterion are not defined. The goal is also selecting the best city for using solar stills.
2.
The second stage is making pairwise comparisons. It is done based on the experts’ judgments and using the recommended scale of Saaty [55]. The scale suggests if the superiority of the alternative or criterion of ‘A’ compared to ‘B’ is equal and a bit more strong, demonstrated, and absolute, the values of 1, 3, 5, 7, and 9 are assigned. For the superiority between two indicated conditions, the even number between two corresponding odd values could be utilized. It is worth noting that pairwise comparisons are done for alternatives compared to each criterion and each criterion compared to the main goal.
3.
Pairwise comparisons of alternatives compared to each criterion, and each criterion with respect to the main goal leads to obtaining a matrix for each case. Having created the matrices, the matrix calculations are done using the procedure completely discussed in [55]. It results in determination of a number between 0 and 100 for each alternative. The greater score an item has, the higher preference it enjoys. As a result, the highest rank alternative is the foremost one.
Since doing matrix calculations manually might lead to mistakes, having a similar fashion as many other investigations with the same subject, i.e., selecting the best alternative among a number of items (including [54]), the pairwise comparison, as well as finding the final ranking is done by Expert Choice software program [56]. It is one of the most user-friendly and robust tools for this purpose.
The matrices of pairwise comparisons are reported in part 4 of the results, i.e., Section 3.4.

3. Results

In this part, first, the results of AFWP, EPBP, and IPBP for different cities are reported and discussed in Section 3.1, Section 3.2 and Section 3.3, respectively. Then, the matrices of pairwise comparisons are given, and finally, the final scores are presented, by which the geographical preference for installation of solar still is determined.

3.1. Annual Fresh Water Production

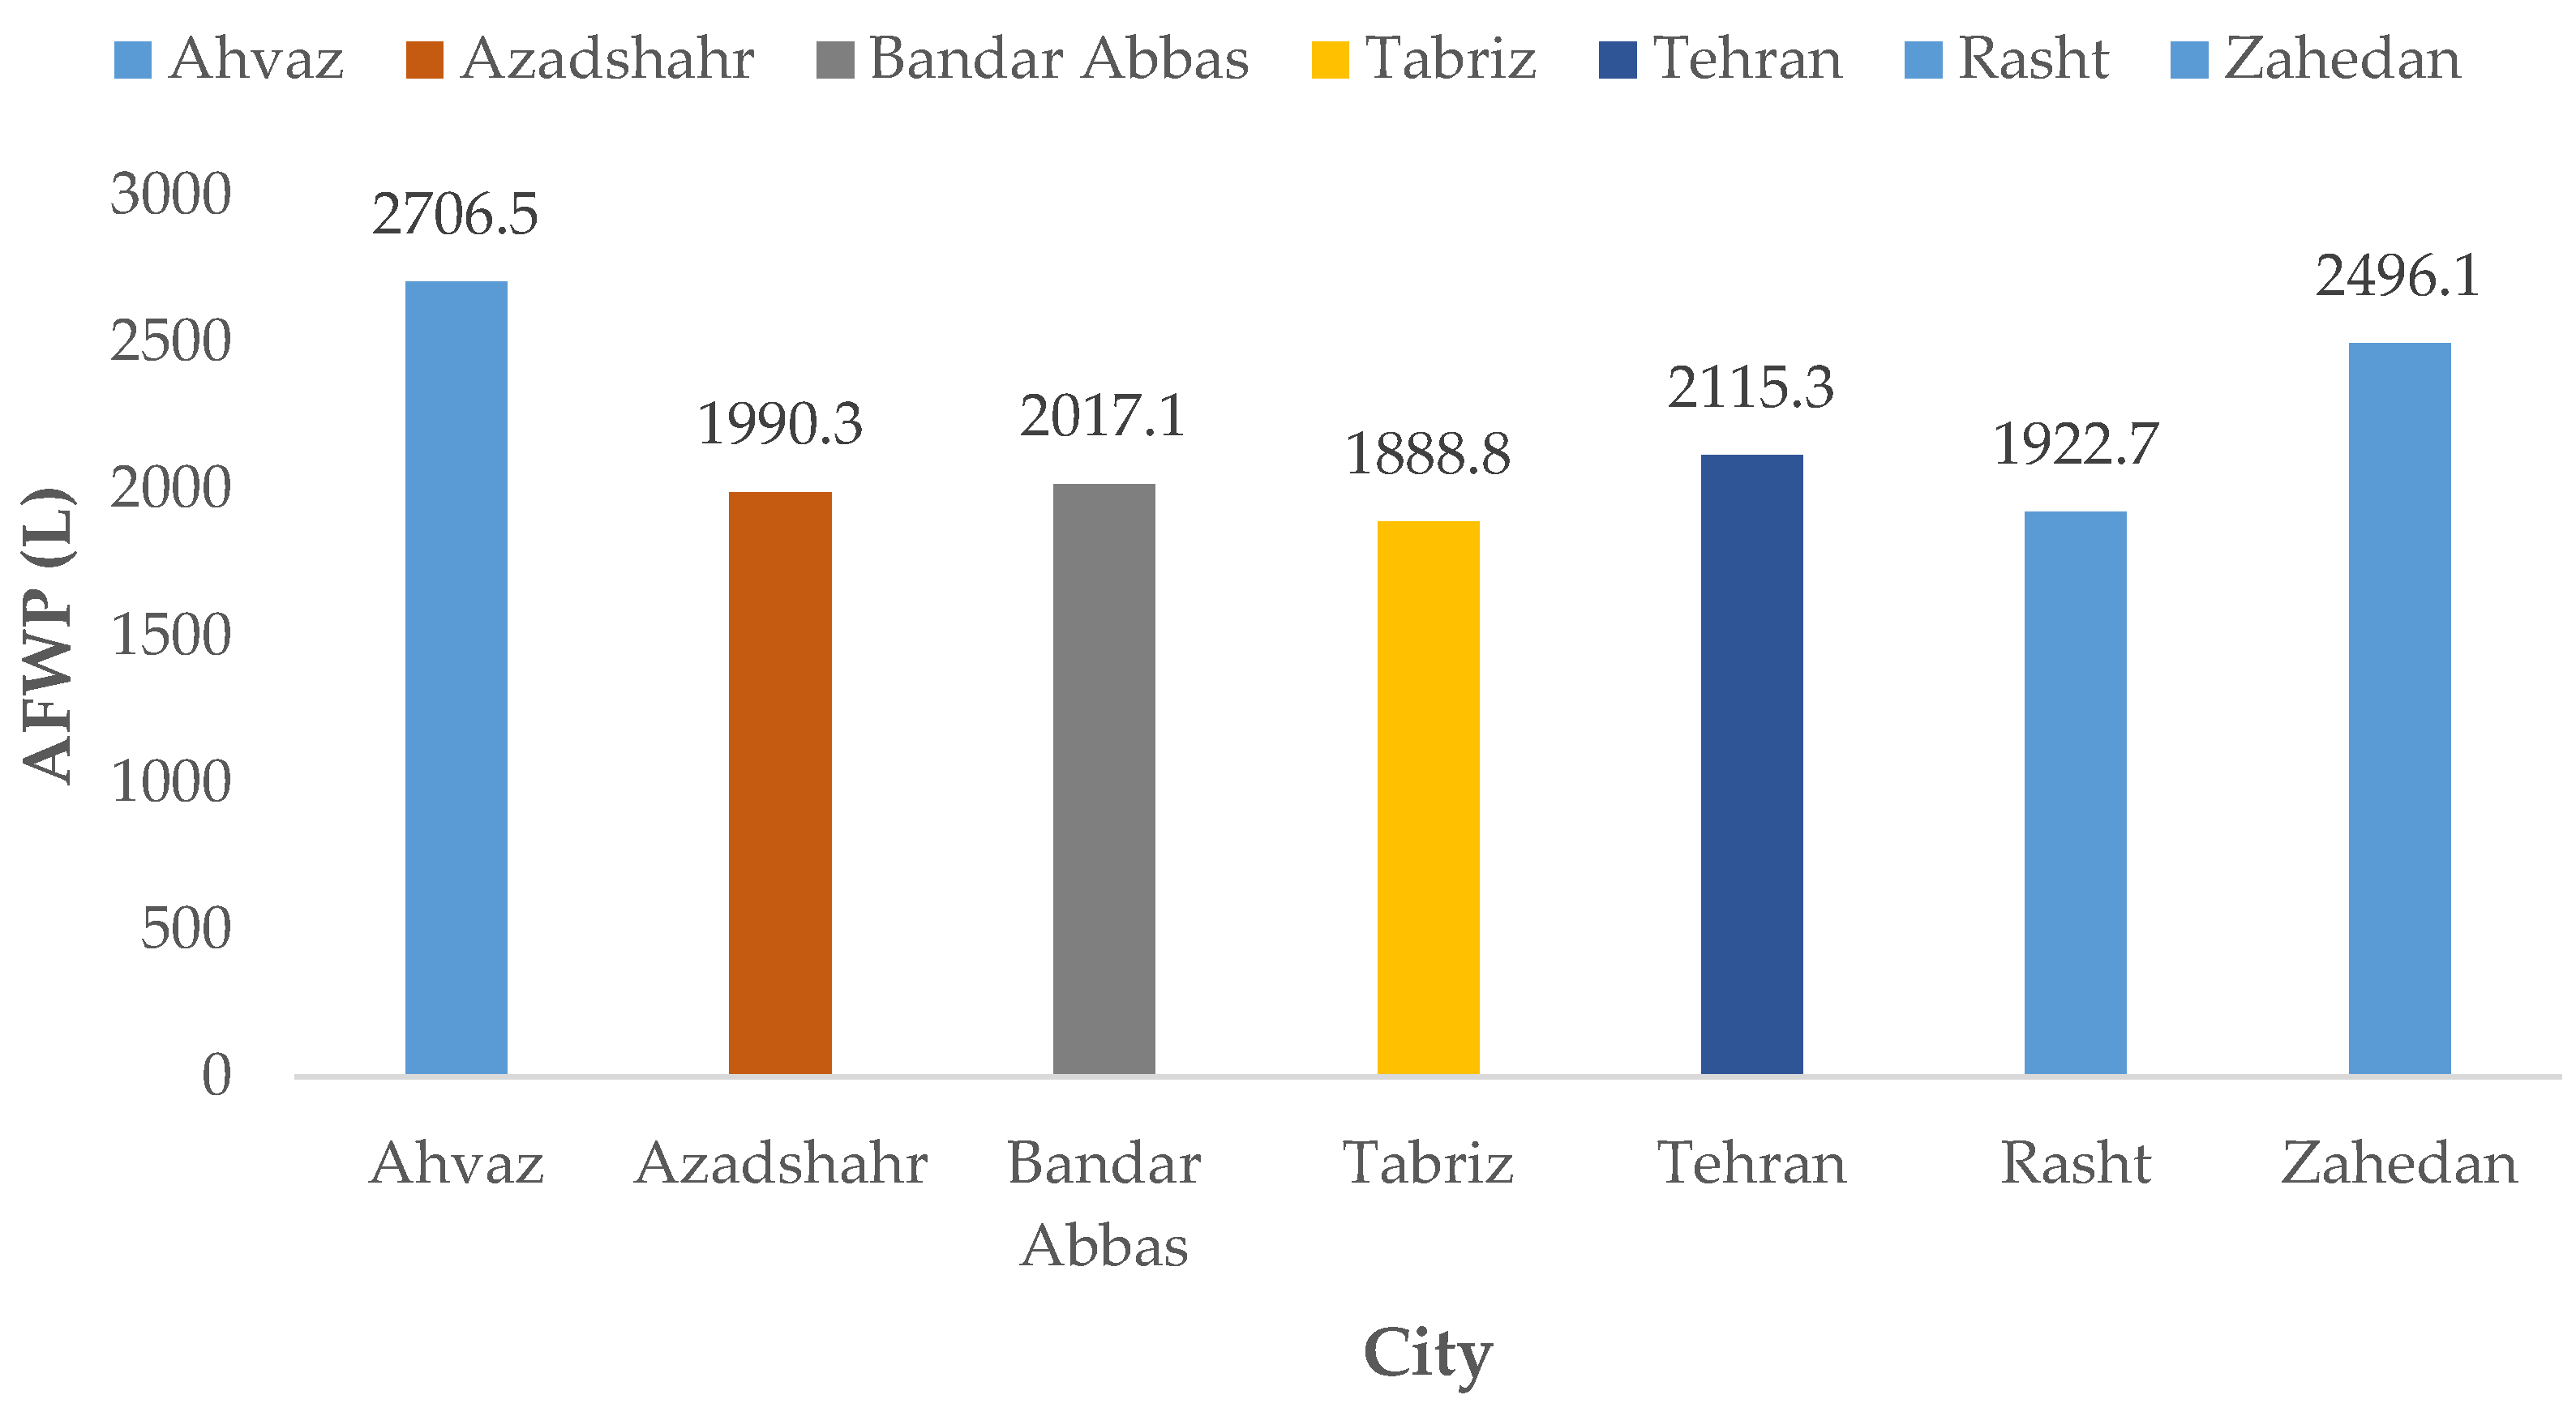
The values of AFWP for seven investigated cities are reported in Figure 5. As observed, the higher ambient temperature, wind speed, and received solar radiation a city has, the higher AFWP it enjoys. In addition, since increasing relative humidity leads to decreasing the heat transfer rate, at almost the same condition for other effective parameters, the city with lower relative humidity has a better AFWP. Nonetheless, the relative humidity impact on AFWP is not as strong as the two other indicated parameters.
Considering this point, Ahvaz, as the city with the highest received solar radiation and ambient temperature levels, has the highest AFWP, with a value of 27069.5 L. Zahedan and Tehran are in the second and third places with 2496.1 and 2115.3 L. AFWP for these two cities are 7.77 and 21.84% lower than Ahvaz, respectively.
The other four cities have relatively close AFWP values. The reason is the trade-off among the effective parameters for them. Bandar Abbas, Azadshahr, Rasht, and Tabriz are in the next ranks, which have 25.47, 26.46, 28.96, and 30.21% lower AFWP compared to Ahvaz, respectively.

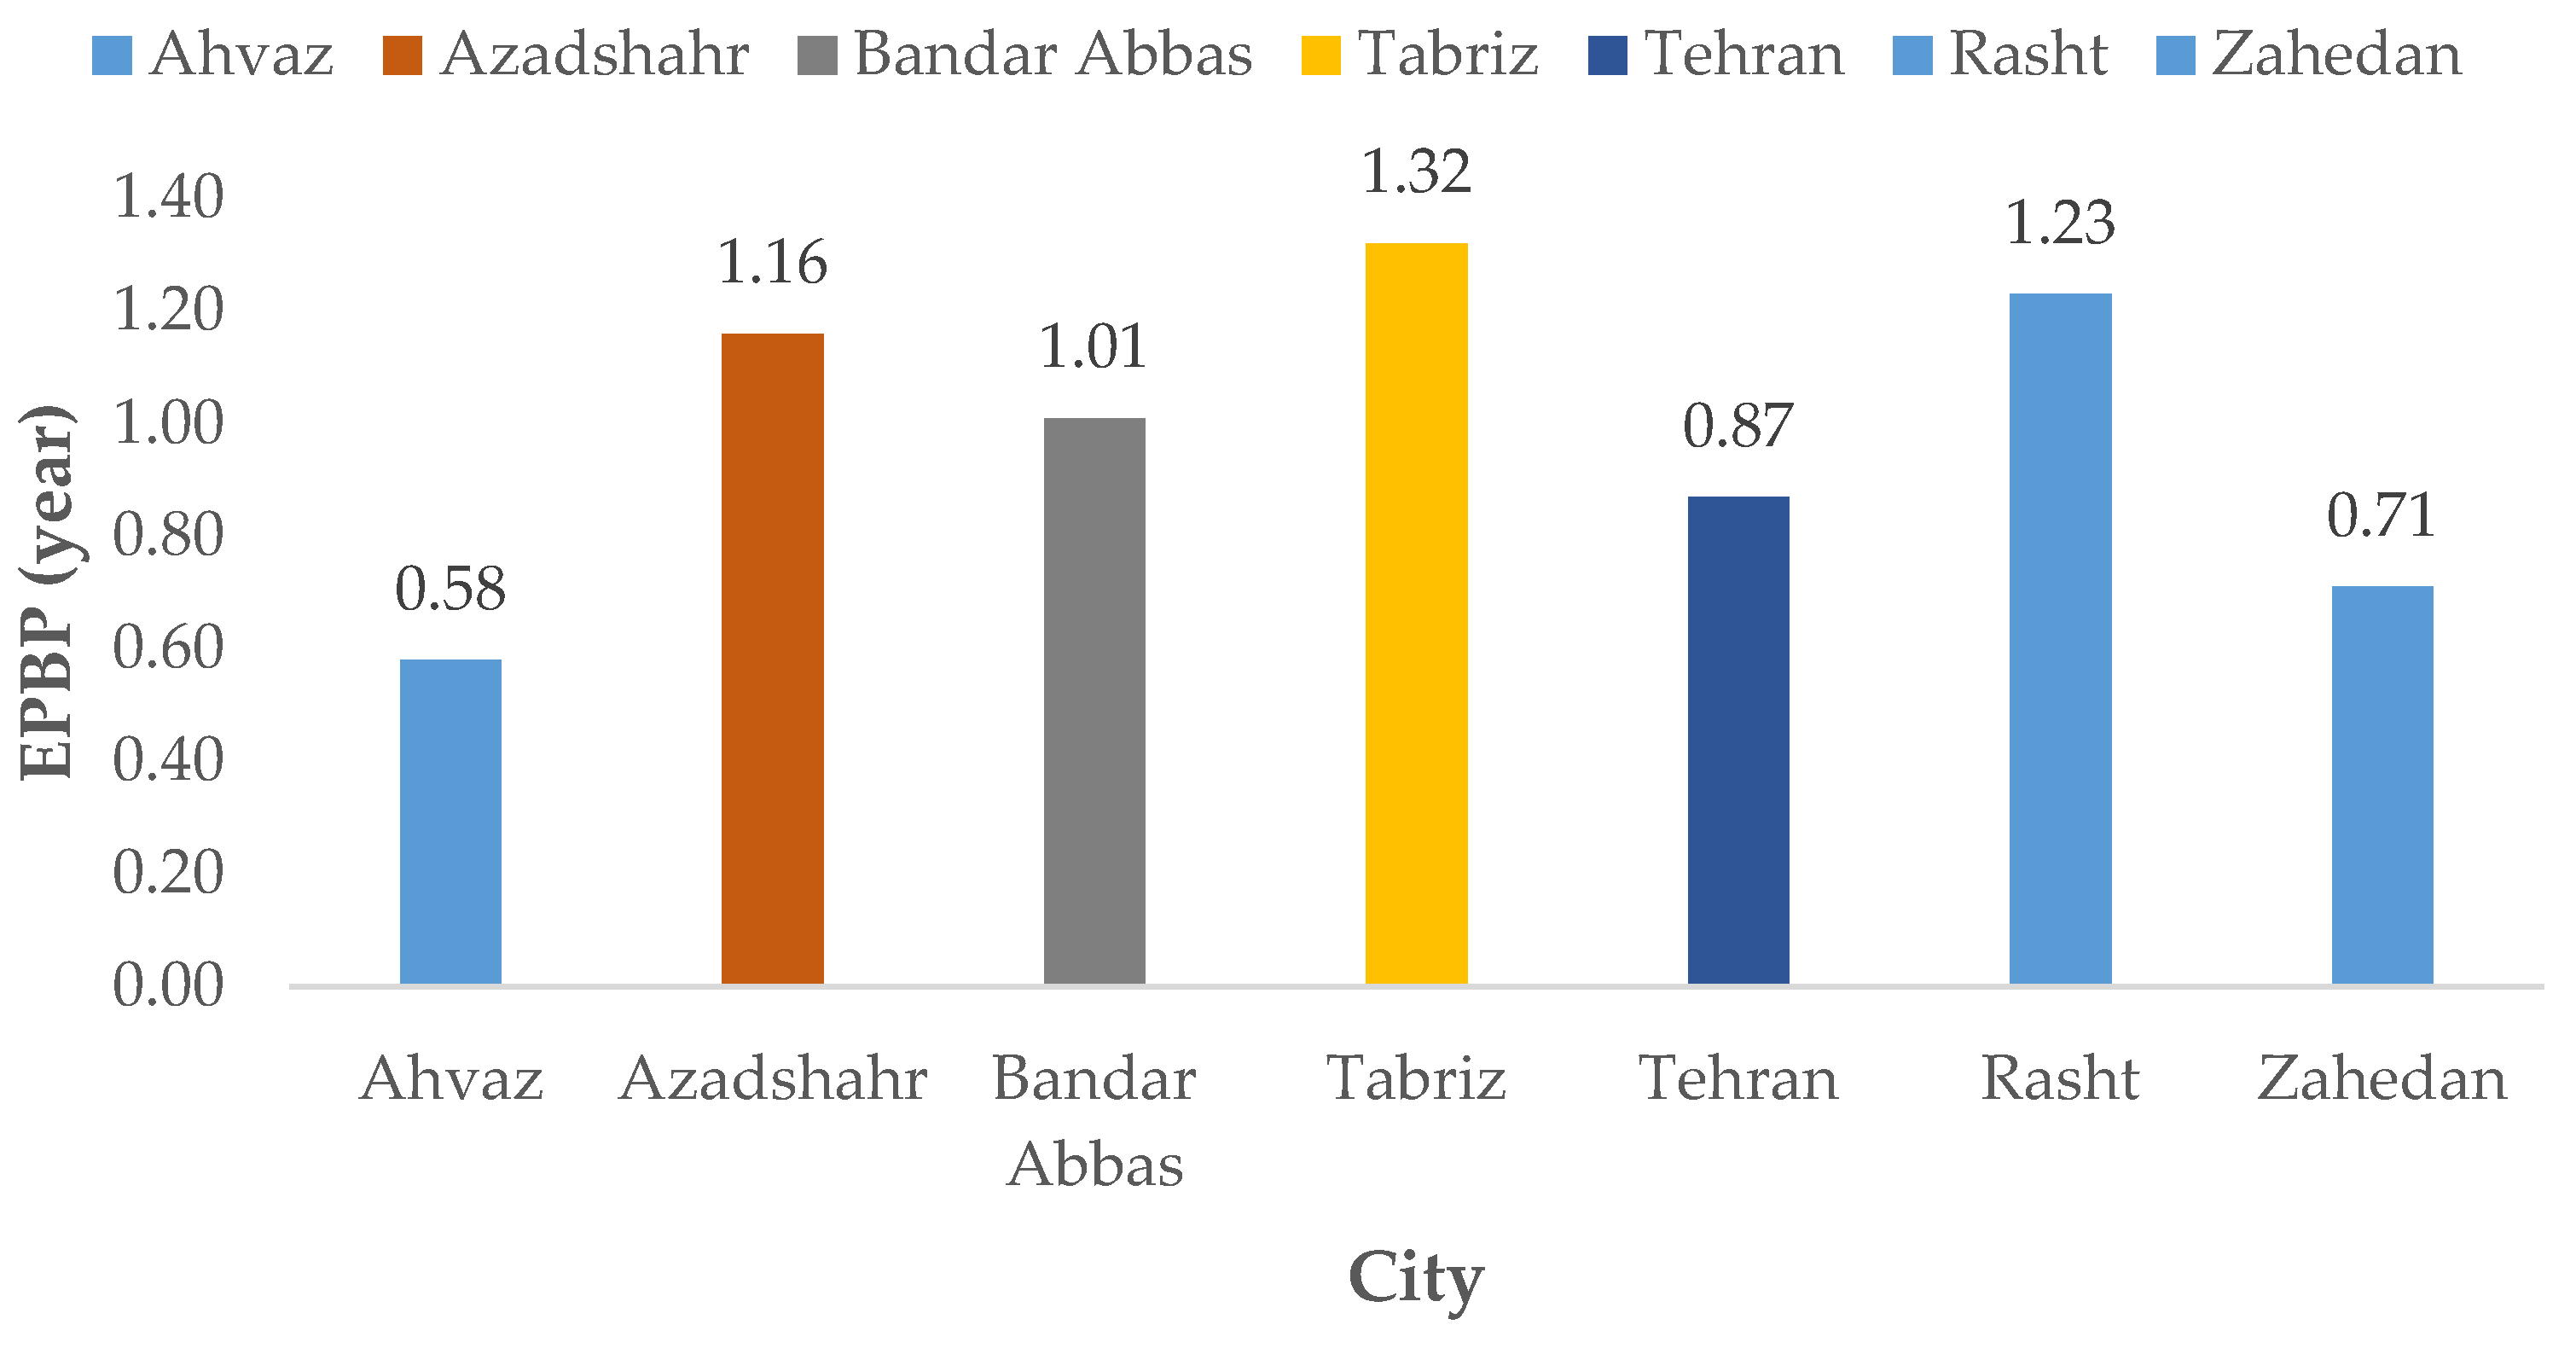
3.2. Energy Payback Period

Both freshwater production ( m F W , H O ) and the enthalpy difference ( Δ h ) are dependent on the ambient characteristics. The hotter or dryer a climate is, the more water temperature in the basin, and consequently, Δ h is seen. m F W , H O has a similar fashion. In addition, the impact of temperature is stronger than the relative humidity. As a result, Ahvaz, as the city with the highest ambient temperature level, enjoys the lowest EPBP among the cities, according to the presented results of Figure 6.
Figure 6 demonstrates that EPBP for Ahvaz is only around a half of a year, i.e., 0.58 years. Zahedan is in the second rank, which has EPBP of 0.71. There is an EPBP of 0.87 for Tehran, which is the third city in sorting. Bandar Abbas, Azadshahr, and Rasht are in the fourth, fifth, and sixth ranks. For these cities, returning energy needs are 1.01, 1.16, and 1.23 years, respectively.
With 1.32 years, the longest EPBP is observed for Tabriz, which is the coldest investigated climate. Nonetheless, EPBP for all the cities are below 1.5 years, which is a very satisfactory limit. Such a satisfactory limit comes from the low required energy for the manufacturing processes and delivery of the solar still. It highlights the fact that they are completely justifiable items from EPBP perspective in all the cities.

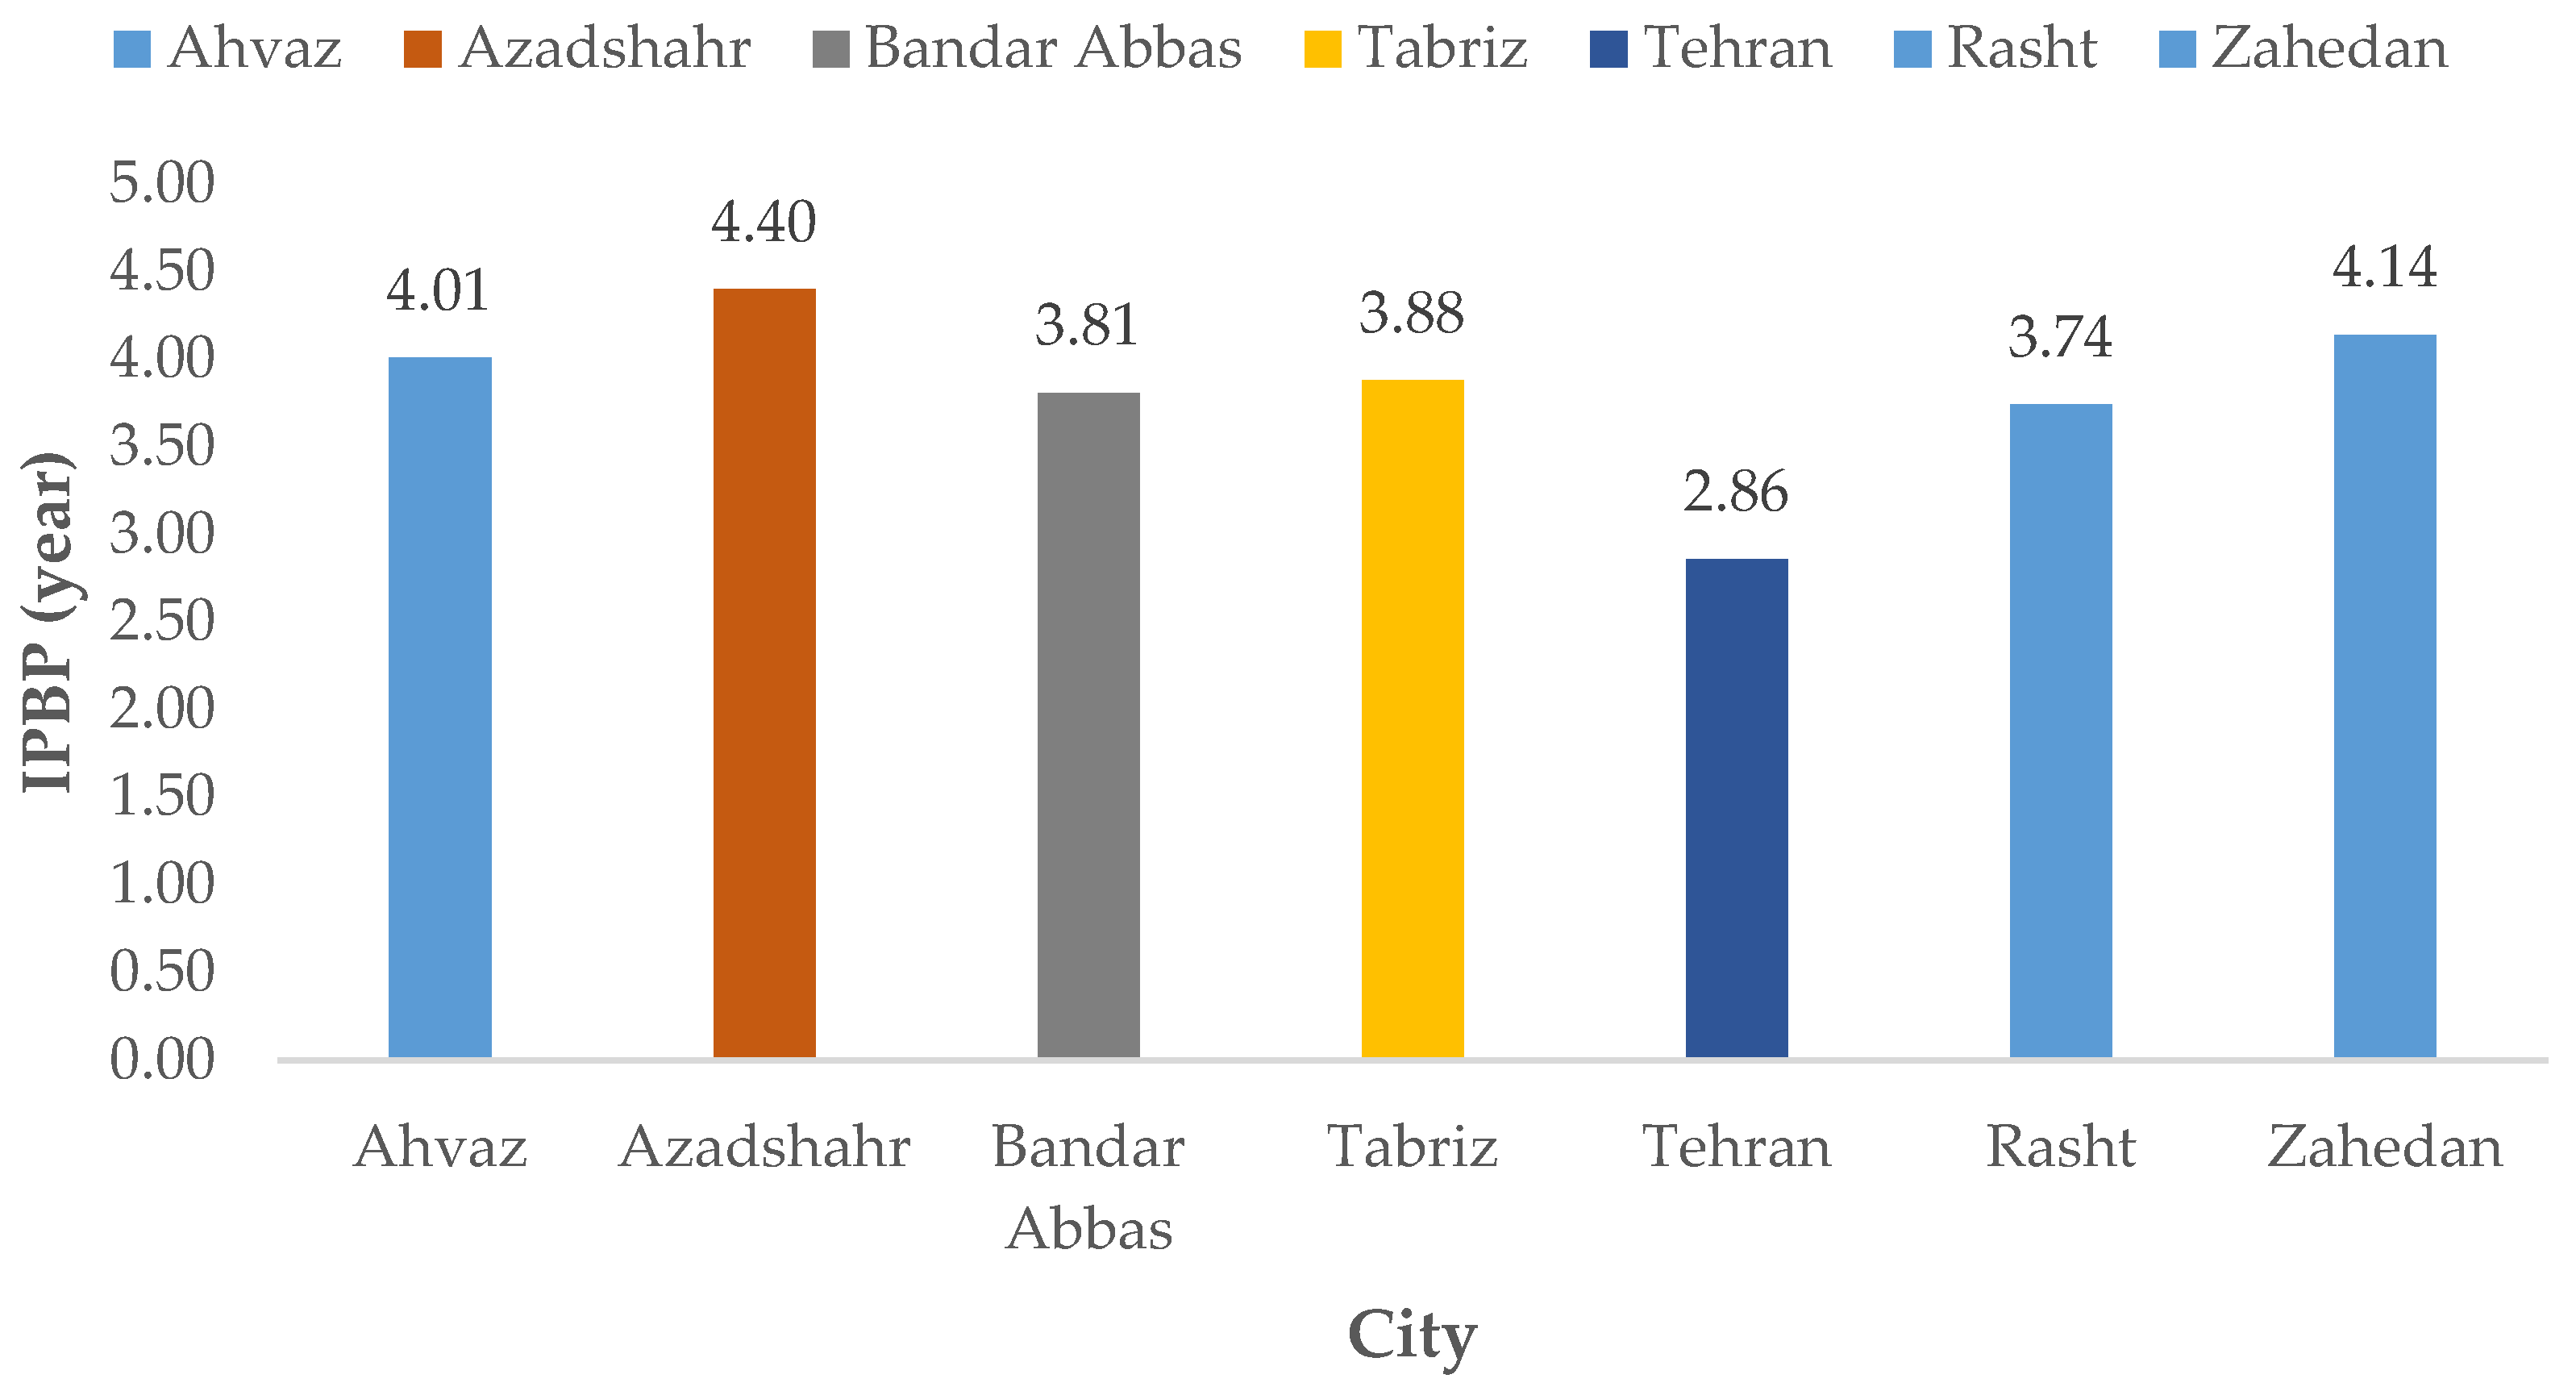
3.3. Investment Payback Period

Based on the governing equations, in addition to the freshwater production ( m F W , H O ), IPBP also depends on the amount of water tariff ( c F W , D O M ) in each city. For this case, the water tariff plays the most important role. For this reason, Tehran, as the capital of the country, which has a much higher water tariff compared to other cities, has the shortest IPBP. Figure 7 demonstrates that only 2.86 years is needed to return the investment on a solar still in this city.
Rasht is in the next place after Tehran, with 0.88 years longer IPBP. Tabriz and Bandar Abbas are the cities with the third and fourth shortest values of IPBP, which are equal to 3.81 and 3.88 years, respectively. For these cities, the water tariff is not as high as Tehran. Nonetheless, it is almost higher, and more than Ahvaz and Zahedan, which are in the last places from IPBP’s point of view.
Thanks to enjoying the most yield, Ahvaz has a lower IPBP compared to Zahedan. In Ahvaz, the value of 4.01 years is seen, while the value for Zahedan is 4.14 years.
Iran is a country in which subsidies are paid for water tariffs. Considering this point, the provided results for IPBP show a very acceptable range of IPBP for solar stills. Such great conditions from EPBP and IPBP aspects, in addition to a considerable AFWP for all the investigated cities, have demonstrated the significant potential of using solar still in diverse climatic conditions.

3.4. The Pairwise Comparisons

In order to conduct pairwise companions, people from academia, industry, and policy-making sectors are invited. From each side, two experts were involved, and during an online meeting, they determined the weights of pairwise comparison matrices. For each pairwise comparison, they discussed and reached a conclusion about each value. About the pairwise comparison of decision criteria, which is provided in Table 4, they believe that:
  • Considering the fact that Iran has a great amount of fossil and renewable energy resources, EPPB is the least important parameter among the decision criteria.
  • Iran has serious water scarcity issues. Therefore, AFWP is the most important decision criterion.
  • IPBP has an importance in between. However, since IPBP is an essential factor for each investment plan, it should have a close importance to AFWP.
Moreover, the pairwise matrices of comparison of alternatives with respect to AFWP, EPBP, and IPBP are reported in Table 5, Table 6, and Table 7, respectively.

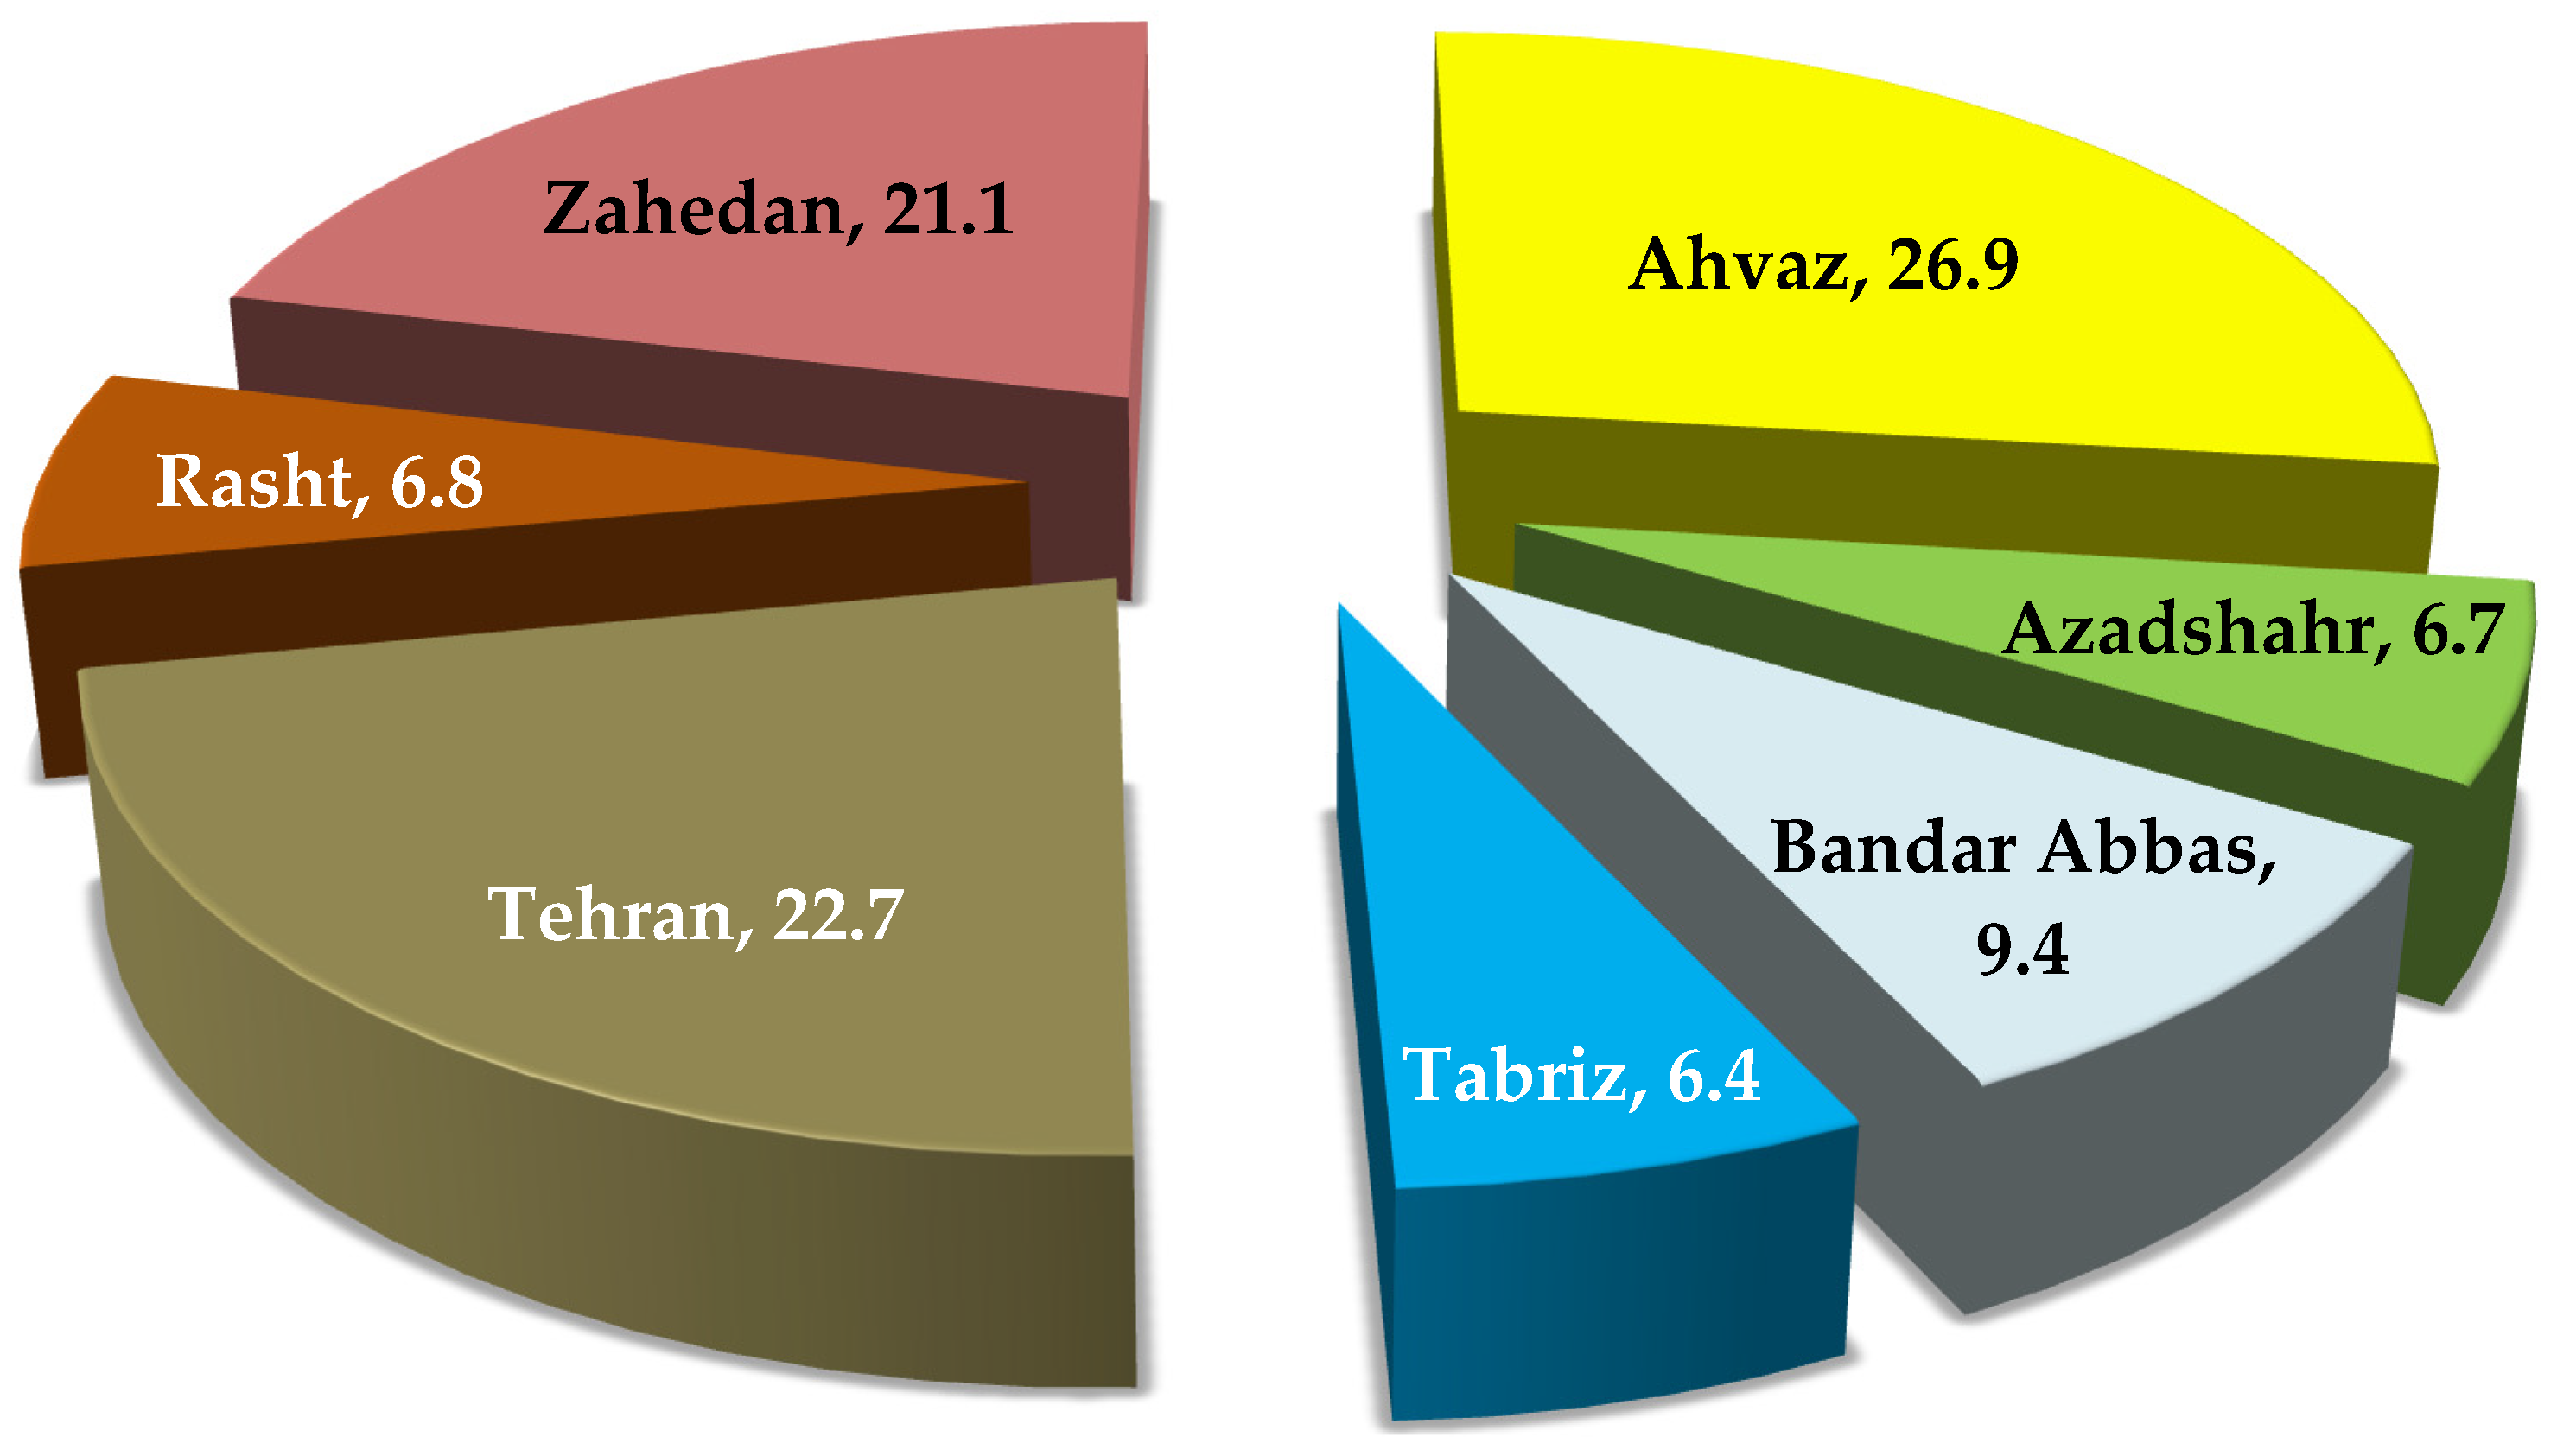
3.5. Final Scores of Alternatives

Using the made pairwise comparisons and Expert Choice software, the final scores of alternatives are determined. It is graphically presented in Figure 8.
Figure 8 demonstrates that among the cities, Ahvaz and Tehran have the highest preferences, with scores of 26.9 and 22.7 out of 100, respectively. Ahvaz has the most AFWP, while the highest water tariff belongs to Tehran. As discussed, AFWP has a direct relationship with ambient temperature and solar radiation, while it has a reverse impact with relative humidity and wind velocity. Therefore, the hot arid cities with high-received solar radiation and low wind-speed levels, or the ones that have almost high water tariffs are the best locations for installations of solar stills.
Moreover, based on Figure 8, Zahedan is the third priority, which has a score of 21.1 out of 100. The lower priority of Zahedan compared to two other indicated cities, i.e., Ahvaz and Zahedan, comes from the low water tariff there. Consequently, offering incentives or low interest loans for purchasing the solar stills could be taken into account as good strategies for better justifiability.
While Ahvaz and Tehran are taken into account as the cities with high priority and Zahedan is the one with relatively high priority, Bandar Abbas, Rasht, and Azadshahr could be considered as the locations with below moderate priority. They have scores of 9.4, 6.8, and 6.7, respectively, while they have one point in common: being wet. The lowest priority is also for Tabriz, which has a score of only 6.4 out of 100.

4. Conclusions

The conducted analysis showed that two areas could be introduced as the best locations for the installation of solar stills:
  • One is hot arid areas in which solar radiance is high and wind speed is low. Ahvaz is the representative of such locations in Iran.
  • Another is the places with high water tariff levels. Tehran is the city with such a condition among the ones investigated here.
In addition, it has been found that for the locations in which water tariff is low, while the meteorological characteristics are favorable, using incentives or low interest loans for purchasing the solar still could make the system application more justifiable. Zahedan is the sample of such locations here.
While the indicated places are introduced as the cities with the highest superiority for using solar stills, using them in remote areas could be suggested as a good solution for increasing the preference in other areas.

Author Contributions

Data curation, S.J. and S.H.; Investigation, S.J. and M.A.; Methodology, A.S.; Project administration, A.S.; Resources, S.H.; Software, S.J.; Supervision, A.S.; Validation, M.A.; Writing—original draft, A.S.; Writing—review & editing, S.H. All authors have read and agreed to the published version of the manuscript.

Funding

This research received no external funding.

Institutional Review Board Statement

Not applicable.

Informed Consent Statement

Not applicable.

Data Availability Statement

The data presented in this study are available on request from the corresponding author.

Conflicts of Interest

The authors declare no conflict of interest.

Nomenclature

SymbolsDescription (unit)
AFWPThe annual fresh water production (L)
CCost ($)
cTariff ($ per energy unit)
dDiscount rate
EEnergy (kJ)
EPBPEnergy payback period (years)
hEnthalpy (kJ·kg−1)
iInflation
IPBPInvestment payback period (years)
jCounter
kCounter
mThe produced water in an hour (mL)
TTemperature (K)
Greek SymbolsDescription (unit)
η Efficiency
ΔDifference
SubscriptsDescription
ANAnnual
BASBasin
BOLBoiler
DOMDomestic
EXTODEExtraction to the delivery
FWFresh water
HOHourly
INICInitial cost
NETONet outcome
SAVSaving
STSolar still
WATWater
AcronymsDescription
AFWPThe annual fresh water production
AHPAnalytical hierarchy process
ANNArtificial neural network
EPBPEnergy payback period
IPBPInvestment payback period

Appendix A

Equation (4) is a non-linear equation. It has one unknown variable, which is IBPB. There is no analytical solution for this equation and should be solved numerically. It could be done by following these steps:
1.
Initially, values of the parameters like water tariff and lifetime as well as inflation and discount rates are given as the inputs.
2.
Then, the step for changing IPBP is defined. It is shown by ΔIPBP here.
3.
Next, IPBP is set to zero.
4.
After that, CNETO is calculated. It is called CNETO,OLD
5.
Subsequently, IPBP is increased by ΔIPBP. The new and old values of IPBP are indicated by IPBPNEW and IPBPOLD, respectively.
6.
Afterwards, CNETO is computed for IPBPNEW, which is shown by CNETO,NEW.
7.
Three conditions are possible:
7.1.
If IPBPNEW ≤ lifetime
7.1.1.
If (CNETO,OLD × CNETO,NEW) ≤ 0
The algorithm terminates and the average of IPBPNEW and IPBPOLD is introduced as the answer:
IPBP = IPBP OLD + IPBP NEW 2
7.1.2.
If (CNETO,OLD × CNETO,NEW) > 0
IPBPOLD= IPBPNEW. Then, the process should be continued by going to stage 5.
7.2.
If IPBPNEW × lifetime
It is found that the investment will not be returned during the system’s lifetime. The algorithm terminates.
Figure A1. Flowchart of the way to determine IBPB from Equation (4).
Water 14 00265 g0a1

References

  1. Nomor, E.; Islam, R.; Alim, M.A.; Rahman, A. Production of Fresh Water by a Solar Still: An Experimental Case Study in Australia. Water 2021, 13, 3373. [Google Scholar] [CrossRef]
  2. Nwodo, J.C.; Overen, O.K.; Meyer, E.L. Decoupling the Monitoring of Solar Water Heaters and their Usage Profiles. Water 2021, 13, 3186. [Google Scholar] [CrossRef]
  3. Jathar, L.D.; Ganesan, S.; Shahapurkar, K.; Soudagar, M.E.M.; Mujtaba, M.A.; Anqi, A.E.; Farooq, M.; Khidmatgar, A.; Goodarzi, M.; Safaei, M.R. Effect of various factors and diverse approaches to enhance the performance of solar stills: A comprehensive review. J. Therm. Anal. Calorim. 2021, 1–32. [Google Scholar] [CrossRef]
  4. Shoeibi, S.; Kargarsharifabad, H.; Rahbar, N.; Ahmadi, G.; Safaei, M.R. Performance evaluation of a solar still using hybrid nanofluid glass cooling-CFD simulation and environmental analysis. Sustain. Energy Technol. Assess. 2022, 49, 101728. [Google Scholar] [CrossRef]
  5. Maleki, A.; Pourfayaz, F.; Ahmadi, M.H. Design of a cost-effective wind/photovoltaic/hydrogen energy system for supplying a desalination unit by a heuristic approach. Sol. Energy 2016, 139, 666–675. [Google Scholar] [CrossRef]
  6. Birben, N.C.; Lale, E.; Pelosato, R.; Uyguner Demirel, C.S.; Natali Sora, I.; Bekbolet, M. Photocatalytic Bactericidal Performance of LaFeO3 under Solar Light: Kinetics, Spectroscopic and Mechanistic Evaluation. Water 2021, 13, 1135. [Google Scholar] [CrossRef]
  7. Jamil, M.A.; Yaqoob, H.; Farooq, M.U.; Teoh, Y.H.; Xu, B.B.; Mahkamov, K.; Sultan, M.; Ng, K.C.; Shahzad, M.W. Experimental Investigations of a Solar Water Treatment System for Remote Desert Areas of Pakistan. Water 2021, 13, 1070. [Google Scholar] [CrossRef]
  8. Urán-Duque, L.; Saldarriaga-Molina, J.C.; Rubio-Clemente, A. Advanced Oxidation Processes Based on Sulfate Radicals for Wastewater Treatment: Research Trends. Water 2021, 13, 2445. [Google Scholar] [CrossRef]
  9. Attia, M.E.H.; Karthick, A.; Manokar, A.M.; Driss, Z.; Kabeel, A.E.; Sathyamurthy, R.; Sharifpur, M. Sustainable potable water production from conventional solar still during the winter season at Algerian dry areas: Energy and exergy analysis. J. Therm. Anal. Calorim. 2020, 145, 1215–1225. [Google Scholar] [CrossRef]
  10. Parsa, S.M.; Rahbar, A.; Koleini, M.H.; Davoud Javadi, Y.; Afrand, M.; Rostami, S.; Amidpour, M. First approach on nanofluid-based solar still in high altitude for water desalination and solar water disinfection (SODIS). Desalination 2020, 491, 114592. [Google Scholar] [CrossRef]
  11. Attia, M.E.H.; Driss, Z.; Kabeel, A.E.; Alagar, K.; Athikesavan, M.M.; Sathyamurthy, R. Phosphate bags as energy storage materials for enhancement of solar still performance. Environ. Sci. Pollut. Res. 2021, 28, 21540–21552. [Google Scholar] [CrossRef]
  12. Hassan, H.; Yousef, M.S.; Fathy, M.; Ahmed, M.S. Assessment of parabolic trough solar collector assisted solar still at various saline water mediums via energy, exergy, exergoeconomic, and enviroeconomic approaches. Renew. Energy 2020, 155, 604–616. [Google Scholar] [CrossRef]
  13. Amiri, H.; Aminy, M.; Lotfi, M.; Jafarbeglo, B. Energy and exergy analysis of a new solar still composed of parabolic trough collector with built-in solar still. Renew. Energy 2021, 163, 465–479. [Google Scholar] [CrossRef]
  14. Mohanraj, M.; Karthick, L.; Dhivagar, R. Performance and economic analysis of a heat pump water heater assisted regenerative solar still using latent heat storage. Appl. Therm. Eng. 2021, 196, 117263. [Google Scholar] [CrossRef]
  15. Sohani, A.; Hoseinzadeh, S.; Berenjkar, K. Experimental analysis of innovative designs for solar still desalination technologies; An in-depth technical and economic assessment. J. Energy Storage 2021, 33, 101862. [Google Scholar] [CrossRef]
  16. Sohani, A.; Hoseinzadeh, S.; Samiezadeh, S.; Verhaert, I. Machine learning prediction approach for dynamic performance modeling of an enhanced solar still desalination system. J. Therm. Anal. Calorim. 2021, 2021, 1–12. [Google Scholar] [CrossRef]
  17. Makkiabadi, M.; Hoseinzadeh, S.; Nezhad, M.M.; Sohani, A.; Groppi, D. Techno-Economic Study of a New Hybrid Solar Desalination System for Producing Fresh Water in a Hot–Arid Climate. Sustainability 2021, 13, 12676. [Google Scholar] [CrossRef]
  18. Panchal, H.; Mevada, D.; Sathyamurthy, R. The requirement of various methods to improve distillate output of solar still: A review. Int. J. Ambient. Energy 2018, 42, 597–603. [Google Scholar] [CrossRef]
  19. Kumar, H.A.; Venkateswaran, H.; Kabeel, A.E.; Chamkha, A.; Athikesavan, M.M.; Sathyamurthy, R.; Kasi, K. Recent advancements, technologies, and developments in inclined solar still—a comprehensive review. Environ. Sci. Pollut. Res. 2021, 28, 35346–35375. [Google Scholar] [CrossRef]
  20. Singh, A.K.; Singh, D.B.; Dwivedi, V.K.; Tiwari, G.N.; Gupta, A. Water purification using solar still with/without nano-fluid: A review. Mater. Today Proc. 2020, 21, 1700–1706. [Google Scholar] [CrossRef]
  21. Hasani Balyani, H.; Sohani, A.; Sayyaadi, H.; Karami, R. Acquiring the best cooling strategy based on thermal comfort and 3E analyses for small scale residential buildings at diverse climatic conditions. Int. J. Refrig. 2015, 57, 112–137. [Google Scholar] [CrossRef]
  22. Akbari, O.A.; Toghraie, D.; Karimipour, A.; Safaei, M.R.; Goodarzi, M.; Alipour, H.; Dahari, M. Investigation of rib’s height effect on heat transfer and flow parameters of laminar water–Al2O3 nanofluid in a rib-microchannel. Appl. Math. Comput. 2016, 290, 135–153. [Google Scholar] [CrossRef]
  23. Alirahmi, S.M.; Khoshnevisan, A.; Shirazi, P.; Ahmadi, P.; Kari, D. Soft computing based optimization of a novel solar heliostat integrated energy system using artificial neural networks. Sustain. Energy Technol. Assess. 2022, 50, 101850. [Google Scholar] [CrossRef]
  24. Shirmohammadi, R.; Gilani, N. Effectiveness enhancement and performance evaluation of indirect-direct evaporative cooling system for a wide variety of climates. Environ. Prog. Sustain. Energy 2019, 38, e13032. [Google Scholar] [CrossRef]
  25. Yağlı, H.; Koç, Y.; Köse, Ö.; Koç, A.; Yumrutaş, R. Optimisation of simple and regenerative organic Rankine cycles using jacket water of an internal combustion engine fuelled with biogas produced from agricultural waste. Process Saf. Environ. Prot. 2021, 155, 17–31. [Google Scholar] [CrossRef]
  26. Ekrataleshian, A.; Pourfayaz, F.; Ahmadi, M.H. Thermodynamic and thermoeconomic analyses and energetic and exergetic optimization of a turbojet engine. J. Therm. Anal. Calorim. 2020, 145, 909–923. [Google Scholar] [CrossRef]
  27. Sohani, A.; Sayyaadi, H.; Hasani Balyani, H.; Hoseinpoori, S. A novel approach using predictive models for performance analysis of desiccant enhanced evaporative cooling systems. Appl. Therm. Eng. 2016, 107, 227–252. [Google Scholar] [CrossRef]
  28. Moradi, M.H.; Sohani, A.; Zabihigivi, M.; Wirbser, H. A comprehensive approach to find the performance map of a heat pump using experiment and soft computing methods. Energy Convers. Manag. 2017, 153, 224–242. [Google Scholar] [CrossRef]
  29. Digi kala, Digi kala Digi Kala Shop. Available online: https://www.digikala.com/ (accessed on 8 January 2022).
  30. Yağlı, H.; Koç, Y.; Kalay, H. Optimisation and exergy analysis of an organic Rankine cycle (ORC) used as a bottoming cycle in a cogeneration system producing steam and power. Sustain. Energy Technol. Assess. 2021, 44, 100985. [Google Scholar] [CrossRef]
  31. Görgülü, A.; Yağlı, H.; Koç, Y.; Koç, A.; Öztürk, N.A.; Köse, Ö. Experimental study of butane adsorption on coconut based activated carbon for different gas concentrations, temperatures and relative humidities. Environ. Technol. 2019, 42, 2122–2131. [Google Scholar] [CrossRef] [PubMed]
  32. Shirmohammadi, R.; Aslani, A.; Ghasempour, R.; Romeo, L.M. CO2 Utilization via Integration of an Industrial Post-Combustion Capture Process with a Urea Plant: Process Modelling and Sensitivity Analysis. Processes 2020, 8, 1144. [Google Scholar] [CrossRef]
  33. Shirmohammadi, R.; Aslani, A.; Ghasempour, R.; Romeo, L.M.; Petrakopoulou, F. Process design and thermoeconomic evaluation of a CO2 liquefaction process driven by waste exhaust heat recovery for an industrial CO2 capture and utilization plant. J. Therm. Anal. Calorim. 2021, 145, 1585–1597. [Google Scholar] [CrossRef]
  34. Alirahmi, S.M.; Assareh, E.; Pourghassab, N.N.; Delpisheh, M.; Barelli, L.; Baldinelli, A. Green hydrogen & electricity production via geothermal-driven multi-generation system: Thermodynamic modeling and optimization. Fuel 2022, 308, 122049. [Google Scholar] [CrossRef]
  35. Yousef, M.S.; Hassan, H. Energy payback time, exergoeconomic and enviroeconomic analyses of using thermal energy storage system with a solar desalination system: An experimental study. J. Clean. Prod. 2020, 270, 122082. [Google Scholar] [CrossRef]
  36. Sohani, A.; Shahverdian, M.H.; Sayyaadi, H.; Samiezadeh, S.; Doranehgard, M.H.; Nizetic, S.; Karimi, N. Selecting the best nanofluid type for A photovoltaic thermal (PV/T) system based on reliability, efficiency, energy, economic, and environmental criteria. J. Taiwan Inst. Chem. Eng. 2021, 124, 351–358. [Google Scholar] [CrossRef]
  37. Iran Water Resources Management Company. The Information about Water Tariff in Iran. Available online: https://www.wrm.ir/?l=FA (accessed on 8 January 2022).
  38. Sohani, A.; Sayyaadi, H.; Azimi, M. Employing static and dynamic optimization approaches on a desiccant-enhanced indirect evaporative cooling system. Energy Convers. Manag. 2019, 199, 112017. [Google Scholar] [CrossRef]
  39. Alirahmi, S.M.; Mousavi, S.F.; Ahmadi, P.; Arabkoohsar, A. Soft computing analysis of a compressed air energy storage and SOFC system via different artificial neural network architecture and tri-objective grey wolf optimization. Energy 2021, 236, 121412. [Google Scholar] [CrossRef]
  40. Musharavati, F.; Khoshnevisan, A.; Alirahmi, S.M.; Ahmadi, P.; Khanmohammadi, S. Multi-objective optimization of a biomass gasification to generate electricity and desalinated water using Grey Wolf Optimizer and artificial neural network. Chemosphere 2022, 287, 131980. [Google Scholar] [CrossRef]
  41. Köse, Ö.; Koç, Y.; Yağlı, H. Energy, exergy, economy and environmental (4E) analysis and optimization of single, dual and triple configurations of the power systems: Rankine Cycle/Kalina Cycle, driven by a gas turbine. Energy Convers. Manag. 2021, 227, 113604. [Google Scholar] [CrossRef]
  42. Görgülü, A.; Yağlı, H.; Koç, Y.; Koç, A. Comprehensive analysis of the effect of water injection on performance and emission parameters of the hydrogen fuelled recuperative and non-recuperative gas turbine system. Int. J. Hydrogen Energy 2020, 45, 34254–34267. [Google Scholar] [CrossRef]
  43. Shirmohammadi, R.; Aslani, A.; Ghasempour, R. Challenges of carbon capture technologies deployment in developing countries. Sustain. Energy Technol. Assess. 2020, 42, 100837. [Google Scholar] [CrossRef]
  44. Beigzadeh, M.; Pourfayaz, F.; Ghazvini, M.; Ahmadi, M.H. Energy and exergy analyses of solid oxide fuel cell-gas turbine hybrid systems fed by different renewable biofuels: A comparative study. J. Clean. Prod. 2021, 280, 124383. [Google Scholar] [CrossRef]
  45. Forootan Fard, H.; Khodaverdi, M.; Pourfayaz, F.; Ahmadi, M.H. Application of N-doped carbon nanotube-supported Pt-Ru as electrocatalyst layer in passive direct methanol fuel cell. Int. J. Hydrogen Energy 2020, 45, 25307–25316. [Google Scholar] [CrossRef]
  46. Soudagar, M.E.M.; Mujtaba, M.A.; Safaei, M.R.; Afzal, A.; Dhana Raju, V.; Ahmed, W.; Banapurmath, N.R.; Hossain, N.; Bashir, S.; Badruddin, I.A.; et al. Effect of Sr@ZnO nanoparticles and Ricinus communis biodiesel-diesel fuel blends on modified CRDI diesel engine characteristics. Energy 2021, 215, 119094. [Google Scholar] [CrossRef]
  47. Shirmohammadi, R.; Aslani, A.; Ghasempour, R.; Romeo, L.M.; Petrakopoulou, F. Techno-economic assessment and optimization of a solar-assisted industrial post-combustion CO2 capture and utilization plant. Energy Rep. 2021, 7, 7390–7404. [Google Scholar] [CrossRef]
  48. Alirahmi, S.M.; Assareh, E.; Chitsaz, A.; Ghazanfari Holagh, S.; Jalilinasrabady, S. Electrolyzer-fuel cell combination for grid peak load management in a geothermal power plant: Power to hydrogen and hydrogen to power conversion. Int. J. Hydrogen Energy 2021, 46, 25650–25665. [Google Scholar] [CrossRef]
  49. Naderi, S.; Banifateme, M.; Pourali, O.; Behbahaninia, A.; MacGill, I.; Pignatta, G. Accurate capacity factor calculation of waste-to-energy power plants based on availability analysis and design/off-design performance. J. Clean. Prod. 2020, 275, 123167. [Google Scholar] [CrossRef]
  50. Sohani, A.; Dehnavi, A.; Sayyaadi, H.; Hoseinzadeh, S.; Goodarzi, E.; Garcia, D.A.; Groppi, D. The real-time dynamic multi-objective optimization of a building integrated photovoltaic thermal (BIPV/T) system enhanced by phase change materials. J. Energy Storage 2022, 46, 103777. [Google Scholar] [CrossRef]
  51. Naderi, S.; Heslop, S.; Chen, D.; MacGill, I.; Pignatta, G. Cost-Saving through Pre-Cooling: A Case Study of Sydney. Environ. Sci. Proc. 2021, 12, 2. [Google Scholar] [CrossRef]
  52. Delfani, F.; Rahbar, N.; Aghanajafi, C.; Heydari, A.; KhalesiDoost, A. Utilization of thermoelectric technology in converting waste heat into electrical power required by an impressed current cathodic protection system. Appl. Energy 2021, 302, 117561. [Google Scholar] [CrossRef]
  53. Behbahaninia, A.; Banifateme, M.; Azmayesh, M.H.; Naderi, S.; Pignatta, G. Markov and monte carlo simulation of waste-to-energy power plants considering variable fuel analysis and failure rates. J. Energy Resour. Technol. Trans. ASME 2022, 144, 062101. [Google Scholar] [CrossRef]
  54. Sohani, A.; Naderi, S.; Torabi, F. Comprehensive comparative evaluation of different possible optimization scenarios for a polymer electrolyte membrane fuel cell. Energy Convers. Manag. 2019, 191, 247–260. [Google Scholar] [CrossRef]
  55. Saaty, T.L. A scaling method for priorities in hierarchical structures. J. Math. Psychol. 1977, 15, 234–281. [Google Scholar] [CrossRef]
  56. Strategic Planning Software for Smarter Decisions. Available online: https://www.expertchoice.com/2021 (accessed on 4 December 2021).
Figure 1. The investigated innovative design for solar still.
Water 14 00265 g001
Figure 2. The annual estimation error profile of yield by ANN, LSTM, and RF models for city Tehran using the experimental data of [16].
Water 14 00265 g002
Figure 3. The annual estimation error profile of water temperature in the basin by ANN, LSTM, and RF models for the city of Tehran using the experimental data of [16].
Water 14 00265 g003
Figure 4. The defined decision-making tree of this investigation.
Water 14 00265 g004
Figure 5. Comparing AFWP for seven investigated cities.
Water 14 00265 g005
Figure 6. Comparing EPBP for seven investigated cities.
Water 14 00265 g006
Figure 7. Comparing IPBP for seven investigated cities.
Water 14 00265 g007
Figure 8. Final scores of alternatives.
Water 14 00265 g008
Table 1. The specifications of the seven representative cities of Iran selected here.
No.CityLongitude (Degrees E)Latitude (Degrees N)Elevation from Sea Levels (m)Climatic ConditionSummer Design Condition Dry-Bulb Temperature (Degrees C)Summer Design Condition Relative Humidity (%)Winter Design Condition Dry-Bulb Temperature (Degrees C)
1Ahvaz48.731.312Semi-arid hot46.430.07.2
2Azadshahr55.237.1129Humid temperature35.648.15.0
3Bandar Abbas56.427.210Wet hot40.654.312.1
4Rasht49.737.3−4Wet temperature31.961.31.9
5Tabriz46.237.81366Arid temperature33.923.8−5.7
6Tehran51.335.71189Semi-arid hot37.830.4−1.5
7Zahedan60.929.51350Arid hot37.59.9−0.5
Table 2. Components of the studied solar still in addition to their cost; all the values for cost are in US dollars [15].
No.ComponentCost
1Piping7.19
2Flat plate type of solar collector172.93
3Pump22.24
4Body that is made of polycarbonate75.38
5Glass8.42
6Channel19.86
7Rods and wheels7.46
8Insulation12.19
9Tank for water storage29.77
10Others19.22
Table 3. The information about the used devices to capture experimental data [29].
No.Recorded ParameterMeasuring DeviceMin. RangeMax. RangeUncertaintyUnit
1TemperatureK-type thermocouple27312730.6K
2IrradianceSolar power meter0200010W·m−2
3Wind speedAnemometer0100.2m·s−1
4YieldCylinder from graduated type020005mL
5Ambient relative humidity and temperatureAmbient thermometer2233730.1K
101001%
Table 4. Pairwise comparison matrix of decision criteria with respect to the goal.
AFWPEPBPIPBP
AFWP152
EPBP1/511/4
IPBP1/241
Table 5. Pairwise comparison matrix of alternatives with respect to AFWP.
AhvazAzadshahrBandar AbbasTabrizTehranRashtZahedan
Ahvaz1546362
Azadshahr1/51121/221/4
Bandar Abbas1/41121/221/4
Tabriz1/61/21/211/311/5
Tehran1/3223131/3
Rasht1/61/21/211/311/5
Zahedan1/2445351
Table 6. Pairwise comparison matrix of alternatives with respect to EPBP.
AhvazAzadshahrBandar AbbasTabrizTehranRashtZahedan
Ahvaz1334241
Azadshahr1/31111/211/4
Bandar Abbas1/3113121/3
Tabriz1/411/311/411/5
Tehran1/2214141
Rasht1/411/211/411/5
Zahedan1435151
Table 7. Pairwise comparison matrix of alternatives with respect to IPBP.
AhvazAzadshahrBandar AbbasTabrizTehranRashtZahedan
Ahvaz121/211/61/21
Azadshahr1/211/31/31/71/41/2
Bandar Abbas23111/512
Tabriz13111/512
Tehran6755157
Rasht24111/512
Zahedan121/21/21/71/21
Publisher’s Note: MDPI stays neutral with regard to jurisdictional claims in published maps and institutional affiliations.

