
Transcriptome Analysis of the Toxic Effects of Amisulbrom and Isoflucypram on Zebrafish (Danio rerio) Larvae


1
National and Local Joint Engineering Research Center of Ecological Treatment Technology for Urban Water Pollution of Life and Environmental Science, College of Life and Environmental Science, Wenzhou University, Wenzhou 325035, China
2
Engineering Research Center of Molecular Medicine of Ministry of Education, Key Laboratory of Fujian Molecular Medicine, Key Laboratory of Xiamen Marine and Gene Drugs, Key Laboratory of Precision Medicine and Molecular Diagnosis of Fujian Universities, School of Biomedical Sciences, Huaqiao University, Xiamen 361021, China
3
Wenzhou Key Laboratory of Sanitary Microbiology, Key Laboratory of Laboratory Medicine, Ministry of Education, School of Laboratory Medicine and Life Sciences, Wenzhou Medical University, Wenzhou 325035, China
*
Author to whom correspondence should be addressed.
Water 2022, 14(2), 272; https://doi.org/10.3390/w14020272
Submission received: 14 December 2021
/
Revised: 13 January 2022
/
Accepted: 14 January 2022
/
Published: 17 January 2022
(This article belongs to the Special Issue Contaminants and Microbes in Marine, Lake and River Ecosystems under a Climate Change Scenario)
Abstract
:Fungicides are frequently detected in the water bodies, however, the adverse effects of these fungicides on aquatic lives remain limited. To better understand the adverse effects of amisulbrom (AML) and isoflucypram (ISO) on embryogenesis, zebrafish embryos were exposed to two different fungicides, 0.75 μM amisulbrom (AML) and 2.5 μM isoflucypram (ISO), for 72 h. Transcriptome sequencing was employed to identify differentially expressed genes (DEGs) after AML and ISO exposure. A total of 571 and 3471 DEGs were detected between the libraries of the two fungicides-treated groups and the control, respectively. Kyoto Encyclopedia of Genes and Genomes (KEGG) enrichment analysis showed that PPAR signaling pathway, phototransduction, ribosome and p53 signaling pathway were significantly enriched in response to both AML and ISO stress. Moreover, a number of DEGs involved in tyrosine metabolism, phagosome pathway, cell cycle pathway, extracellular matrix (ECM) receptor interaction pathway, and arginine and proline metabolism were specially enriched after exposure to AML; a number of DEGs involved in notch signaling pathway, drug metabolism, alanine, aspartate and glutamate metabolism, amino-acyl−tRNA biosynthesis, and protein processing in endoplasmic reticulum were significantly enriched after exposure to ISO. These results provide novel insights into the toxicological mechanisms underlying fish’s responses to fungicides.
1. Introduction
Amisulbrom (AML), a sulfonamide fungicide, is registered for foliar applications on grape, potatoes and other crops [1,2]. Isoflucypram (ISO) is one of new succinate dehydrogenase inhibitor (SDHI) fungicides that are used for fungi and mould control [3]. The mode of action of AML and ISO are based on the blockage of cytochrome-bc1 complex and succinate dehydrogenase involved in the mitochondrial electron transport system, respectively, leading to an inhibition of cellular respiration [1,3,4]. Both AML and ISO are potential persistent in the environment. The half-lives of AML in aerobic soil and water-sediment system were 143 days and 100.1 days, respectively [5]. The half-lives of ISO in soil and water-sediment system were 318.5 and 1000 days, respectively [5]. Thus, the widespread use of AML and ISO fungicide may cause potential negative impacts on the environment.
Fungicides of AML and ISO have a low mammalian toxicity through the oral routes of exposure (AML: acute oral LD50 > 5000 mg/kg; ISO: LD50 oral > 2000 mg/kg) [1,5,6]. However, they pose a serious threat to aquatic species. Both AML and ISO are highly toxic to aquatic lives [5,6]. EFSA (2014) lists 96-h LC50 values of AML on rainbow trout (Oncorhynchus mykiss) and zebrafish (Danio rerio) were 0.0515 mg/L and 0.12 mg/L, respectively [6]. Meanwhile, the Pesticide Properties Database reported that 96-h LC50 and 48-h LC50 values of ISO on rainbow trout (Oncorhynchus mykiss) and Daphnia magna were 0.068 mg/L and 0.201 mg/L, respectively [5]. Our recent studies reported that both AML (0.0075 μM, 0.075 μM, and 0.75 μM) and ISO (0.025 μM, 0.25 μM, and 2.5 μM) induced significant cardiovascular toxicity in zebrafish larvae [7,8]. Taken together, these findings imply that AML and ISO are potentially persistent chemicals in the environment that could have long-term toxic effects aquatic species. However, our understanding about the effects and potential mechanisms of AML or ISO induced toxicity in aquatic organisms is still limited.
Transcriptome sequencing, a powerful tool to collect all mRNA transcribed by an individual or a population of cells [9], it has been widely applied to identify the differential expression genes and possible signal pathways in responses to different fungicides in zebrafish [10,11]. For example, transcriptomic data reported that exposure to triadimefon could activate the genes involved in cytochrome P450 enzymes and molecular metabolism [10]; Jiang et al. (2019) reported that treatment with strobilurins significantly affected the signaling pathways of cellular apoptosis, and genes involved in organelle membrane and mitochondrion [12]. Bixafen exposure downregulated the genes enriched in cell cycle processes [11]. Nowadays, zebrafish has been extensively used as an aquatic vertebrate model for ecological risk evaluation focused on the toxicity of fungicides [11,13,14,15]. Chen and Li (2021) and Ma and Li (2021) have showed that both AML and ISO exposure can alter gene expression patterns related to heart development and hemopoiesis in zebrafish embryos/larvae [7,8]. However, significant knowledge gaps remain over understanding the transcriptomic alterations associated with AML and ISO exposure. Our transcriptomic data could gain a comprehensive understanding of toxicity of AML and ISO to aquatic organisms, especially to fish. Therefore, the main goal of current study was to uncover the transcriptional responses in the zebrafish larvae after exposure to AML or ISO.
2. Materials and Methods
2.1. Zebrafish Husbandry
Zebrafish (Danio rerio, AB strain) were obtained from Institute of Hydrobiology, Chinese Academy of Sciences. Zebrafish were kept in a circulating filtration system (Haisheng, Shanghai, China) under 28.5 °C with a 14:10 light/dark cycle, according to the standard protocols [16]. Adult zebrafish were fed freshly hatched brine shrimp Artemia nauplii three times per day. Before spawning, adult zebrafish (female: male = 1:4) were kept separately in a spawning tank. There are at least three replicate tanks for each spawning. Embryos were collected and observed under a stereomicroscope (SZX16; Olympus, Tokyo, Japan), and the healthily fertilized embryos were used for subsequent exposure experiments. All works were carried out in accordance with the National Research Council’s Guide for the Care and Use of Laboratory Animals, and approved by the Attitude of the Animal Care and Welfare Committee of Huaqiao University.
2.2. Exposure Experiments
AML [C13H13BrFN5O4S2, (S)-a-cyano-3-phenoxybenzyl (1R, 3R)-3-(2,2-dibromovinyl)-2,2-dimethylcyclopropanecarboxylate, CAS NO. 348635-87-0, purity ≥ 99.62%, molecular weight 466.30, solvent: dimethyl sulfoxide (DMSO)] and ISO {C19H21ClF3N3O, N-[[5-Chloro-2-(1-methylethyl)phenyl]methyl]-N-cyclopropyl-3-(difluoromethyl)-5-fluoro-1-methyl-1H-Pyrazole-4-carboxamide, CAS NO.1255734-28-1, purity ≥ 98%, molecular weight 399.80, solvent: DMSO} were purchased from Dr. Ehrenstorfer GmbH (Augsburg, Germany) and Sigma-Aldrich (St. Louis, MO, USA), respectively. The stock solution of 1 g/L AML and 10 g/L ISO were prepared in DMSO (Biosharp, Hefei, China). The exposure concentrations of AML and ISO were 0.75 μM and 2.5 μM, respectively, which were set according to the previous studies [7,8], which indicated that 0.75 μM AML and 2.5 µM ISO caused deformity but was not fatal.
Fertilized embryos at the blastula stage (about 3 h post-fertilization, hpf) were randomly subjected to above fungicides in a 90 mm petri dish. Control group was exposed to DMSO (0.01%, v/v) only (no AML or ISO). There are four independent replicates for each exposure. During fungicides exposure, all the exposure solutions were renewed daily. After exposure, larvae at 72 hpf for transcriptome sequencing and quantitative real-time polymerase chain reaction (qRT-PCR) were euthanized in 0.03% tricaine methane sulfonate (MS-222, Bide Pharmatech Ltd., Shanghai, China) and then immediately frozen with liquid nitrogen.
2.3. RNA Isolation and Sequencing
Total RNA of 30 zebrafish larvae of all groups (n = 3 replicates) was extracted using the TRIzol method according to the manufacturer’s protocol (Invitrogen, Carlsbad, CA, USA). The quality and quantity of the total RNA was assessed using RNA Nano 6000 Assay Kit of the Bioanalyzer 2100 system (Agilent Technologies, Böblingen, Germany). RNA samples for sequencing were sent to Novogene (Beijing, China). A total of 2 µg RNA was used for library preparation. Sequencing libraries were constructed using NEBNext Ultra™ RNA Library Prep Kit for Illumina (NEB, Carlsbad, CA, USA) following manufacturer’s instructions. Illumina NovaSeq 6000 platform was used to generate paired-end reads with a length of 150 bp. All the raw data are available in the Sequencing Read Archive (SRA) of NCBI under the BioProject number PRJNA759766.
2.4. Bioinformatic Analyses
For the transcriptome analysis raw fastq files were quality trimming and adapter clipping using Trimmomatic (v0.40) under default parameters [17]. We used Hisat2 (v2.2.1) to align and map trimmed reads to the zebrafish genome (GRCz11, https://www.ensembl.org (accessed on 25 August 2021)) [18]. Read counts and normalized gene transcription levels expressed as fragments per kilobase of transcripts per million fragments mapped reads (FPKM) were generated by featureCounts (v1.5.0-p3) [19] and Stringtie (v1.3.3b) [20], respectively. For the Stringtie assemble analysis, the reference-based approach was used. Differentially expressed genes (DEGs) were identified using DESeq2 R package (v 1.32.0) [21], and genes with the Benjamini and Hochberg adjusted p < 0.05 and |fold change| ≥ 2 were considered DEGs. A principal component analysis (PCA) was performed in all expressed genes in all groups based on read counts using DESeq2 R package (v 1.32.0) [21]. The pair-wise Pearson correlations between all 9 samples were calculated based on FPKM values, and genes with the ΣFPKM < 1 in all samples were removed. Venn diagrams and volcano plot of DEGs were created using TBtools (v1.0986) [22]. The enrichment of Kyoto Encyclopedia of Genes and Genomes (KEGG) pathways of DEGs was performed by the clusterProfiler R package (v4.0.5) [23]. Gene ontology (GO) and KEGG pathways with corrected p-value less than 0.05 were considered significantly enriched by DEGs. Gene set enrichment analysis (GSEA) was performed by GSEA software (v4.1.0) [24]. GO, KEGG datasets were used for GSEA independently.
2.5. qRT-PCR Verification
The RNAs were isolated and reverse-transcribed from 30 larvae of control and both fungicide-treatment group (n = 3 replicates) using FastPure Cell/Tissue Total RNA Isolation Kit V2 (Vazyme, Nanjing, China) and HiScript III 1st strand cDNA synthesis kit (Vazyme, Nanjing, China) according to the manufacturer’s protocol, respectively. The qRT-PCR verifications were carried out using a ChamQ™ universal SYBR qRT-PCR master mix (Vazyme, Nanjing, China) following the manufacturer’s recommendations. The primers used for qRT-PCR are shown in Table S1.
2.6. Statistical Analyses
We performed a non-parametric Kruskal–Wallis one-way analysis of variance to identify differences between the experimental groups. All analyses were performed using R version 4.0.3 (http://www.r-project.org (accessed on 25 September 2021)). Significance was assigned at adjusted p < 0.05.
3. Results
3.1. Sequencing and Read Mapping
Illumina deep sequencing more than 40 M total clean reads from the >6 Gbps clean sequence bases for each biological replicate. Around 94% of the clean reads had quality scores over the Q30 value. Over 77% of the clean reads were uniquely mapped to the reference genome, with 91% of total mapping (Table S2). Exon-, intron- and intergenic-mapped reads accounted for 72.77–75.21%, 4.07−4.79% and 20.72–22.58% of all mapped reads among all samples respectively (Table S3). In total, 32,276 unigenes with 5947 novel genes were detected and quantified among all the three groups.
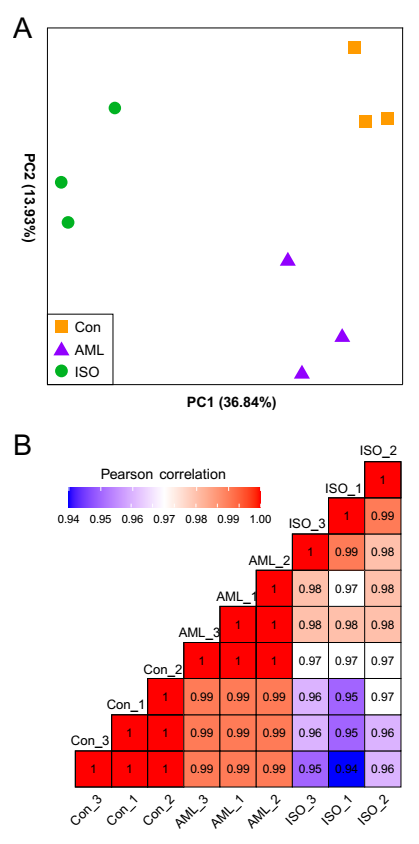
Principal component analysis (PCA) of the gene expression data clearly separated AML and ISO groups from the control group (Figure 1A). The first two principal components (PCs) explained more than 50% of the variability among the samples and all the three groups separated clearly. Pairwise correlation analysis also indicated that samples from the same group were more similar than those from different groups (Figure 1B). Those findings indicated a clear difference among the transcriptome profiles of three groups and the transcriptome data were of sufficient quality to permit robust statistical analysis and interpretation.
3.2. Identification of Differentially Expressed Genes (DEGs)
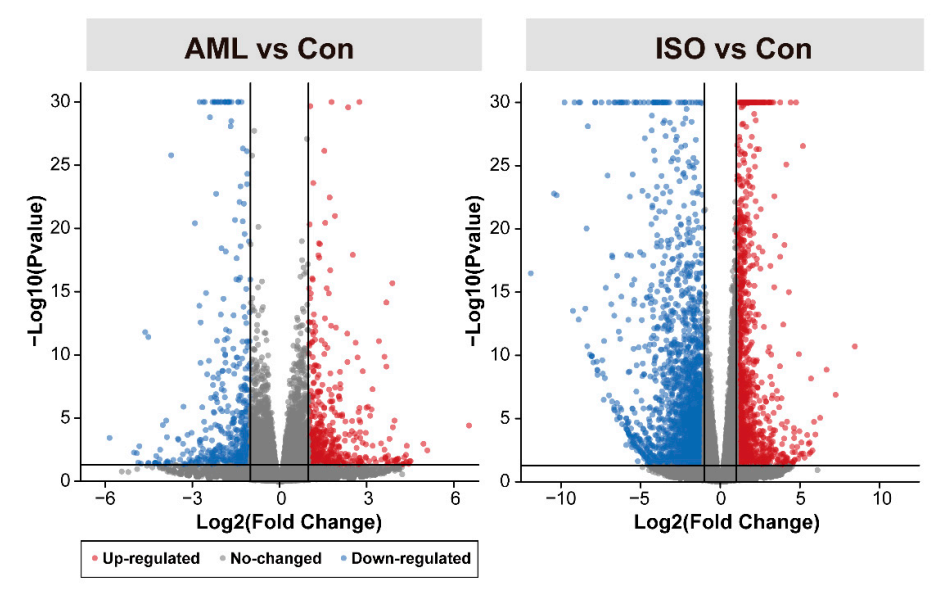
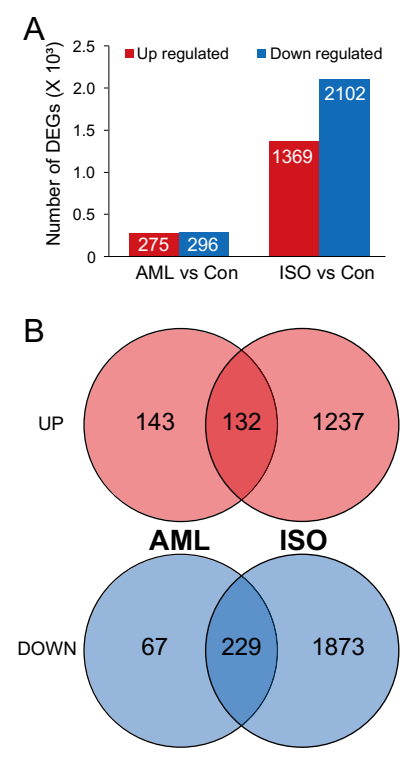
A total of 571 (296 downregulated, 51.84%) and 3471 (2102 downregulated, 60.56%) DEGs were identified by DESeq2 analysis for AML and ISO exposures respectively. (Figure 2, Tables S4 and S5). The number of downregulated DEGs was higher than that of upregulated DEGs in both treatments and there were more DEGs (with both up- and down-regulated) detected in ISO group than in AML group (Figure 3), while the degree of which a DEG is upregulated was higher than that of downregulated (Figure 2). Venn diagrams showed that there were more shared downregulated DEGs (76.69% and 10.80% in AML and ISO treatment, respectively) than upregulated DEGs (48.00% and 9.64% in AML and ISO treatment, respectively). These analyses revealed that exposure to ISO had a stronger effect than exposure to AML and that the number of DEGs increased dramatically under ISO exposure, indicating that the function of many genes may have been activated.
3.3. Enrichment Analysis
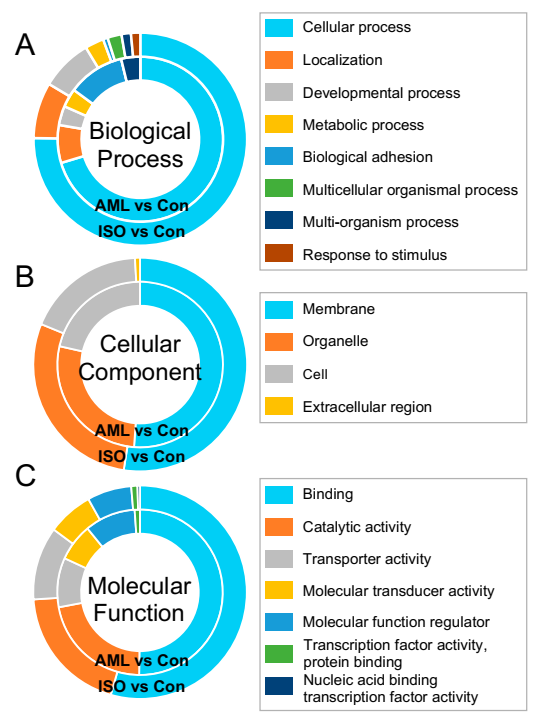
A total of 24,524 unigenes (including 2281 novel genes) were assigned to at least one GO term. These GO terms were categorized into 53 functional groups which were divided into three categories including biological process, cellular component and molecular function. The DEGs were mainly associated with biological processes under both AML and ISO treatments. The composition of GO terms of DEGs were similar from AML and ISO exposure. Cellular process, localization and developmental process of biological process, membrane, organelle and cell of cellular component, binding, catalytic activity and transporter activity of molecular function were the most identified GO terms of DEGs (Figure 4).
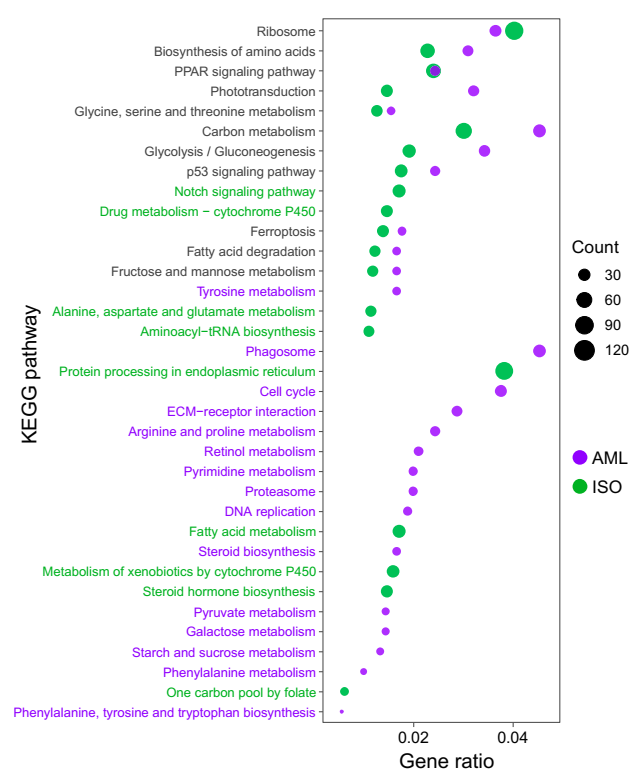
Unigenes (including 1359 novel genes) were assigned to 168 KEGG pathway. KEGG pathway enrichment analysis revealed that the genes whose expression was affected by AML were mainly significantly enriched in the following pathways: Phototransduction, steroid biosynthesis, glycolysis/gluconeogenesis, carbon metabolism, DNA replication and phagosome. DEGs associated with ribosome, PPAR signaling pathway, phototransduction, glycine/serine and threonine metabolism, metabolism of xenobiotics by cytochrome P450 and aminoacyl-tRNA biosynthesis were significantly enriched under ISO exposure (Figure 5). There were 11 KEGG pathways shared by DEGs enrichment analysis in both AML and ISO treatments, and in all pathways except ribosome the gene ratio of enriched DEGs in the AML exposure groups were higher than those in the ISO exposure groups.
Gene-set enrichment analysis (GSEA) analysis was performed to identify the important pathways. GSEA analysis revealed that most gene sets (100 out of 154 gene sets) were downregulated under AML exposure, in which 50 gene sets were significantly enriched at FDR Q-value < 0.25. Those genes were significantly associated with “metabolism of xenobiotics by cytochrome p450”, “retinol metabolism”, “drug metabolism—cytochrome p450”, “DNA replication”, “drug metabolism—other enzymes” and “mismatch repair” (FDR Q-value < 0.12 and Familywise-error rate p-value < 0.50). A total of 54 out of 154 gene sets were upregulated under AML exposure, while only 1 gene set (ubiquinone and other terpenoid-quinone biosynthesis) was significantly enriched by GSEA analysis. About the ISO treatment, GSEA analysis identified 104 out of 154 gene sets downregulated expressed, in which 62 gene sets were significantly enriched at FDR Q-value < 0.25. No significantly upregulated gene set was detected. The downregulated gene sets were significantly associated with “drug metabolism—other enzymes”, “retinol metabolism”, “phototransduction”, “metabolism of xenobiotics by cytochrome p450”, “drug metabolism-cytochrome p450”, “PPAR signaling pathway” and “peroxisome” (FDR Q-value < 0.12 and familywise-error rate p-value < 0.50) (Tables S6 and S7).
3.4. PCR Verification
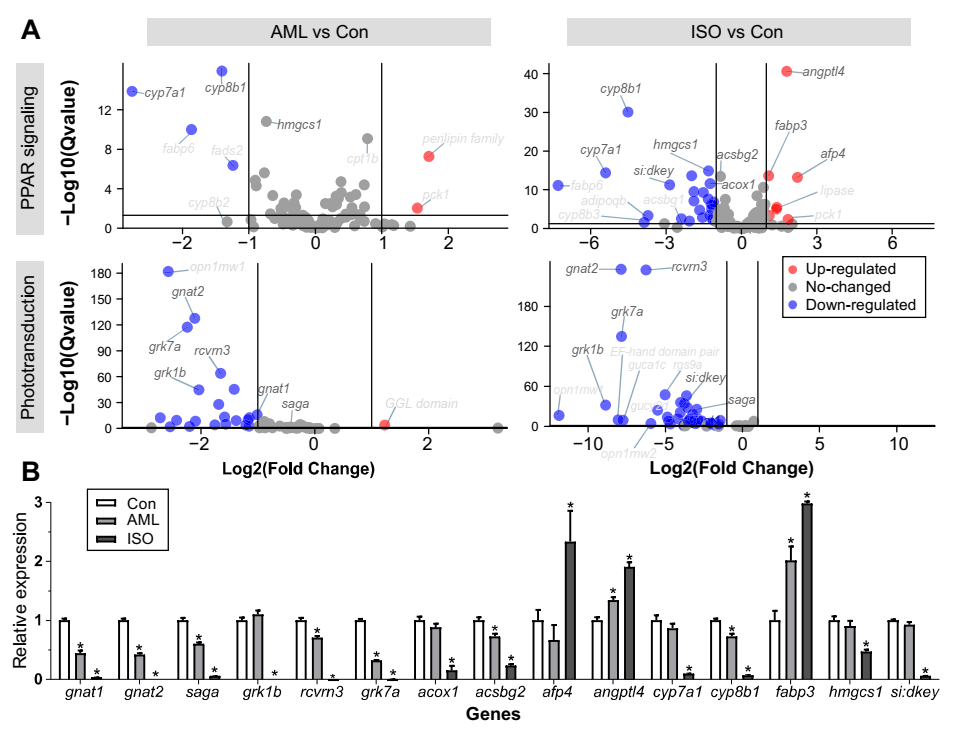
Among the DEGs involved in PPAR signaling pathway, 10 of 22 genes and 20 of 59 genes in the treatment with 0.75 μM AML and 2.5 μM ISO displayed higher FPKM values and lower FPKM values than those in the control groups, respectively. Meanwhile, among the DEGs involved in phototransduction process, 1 of 29 genes and 1 of 36 genes in the treatment with 0.75 μM AML and 2.5 μM ISO displayed higher FPKM values and lower FPKM values than those in the control groups, respectively (Figure 6A). To further verify the accuracy of the transcriptome sequencing, 14 genes related to PPAR signaling pathway and phototransduction process were quantified by qRT-PCR (Figure 6B). In Con vs. AML exposure groups, qRT-PCR results revealed that 7 genes (gnat1, gnat2, saga, rcvrn3, grk7a, acsbg2 and cyp8b1) were significantly downregulated in AML exposure groups, while two gene (angptl4 and fabp3) was significantly upregulated in AML exposure groups. In Con vs. ISO exposure groups, qRT-PCR results revealed that 12 genes (gnat1, gnat2, saga, grk1b, rcvrn3, grk7a, acox1, acsbg2, cyp7a1, cyp8b1, hmgcs1 and si:dkey-91i10.3) were significantly downregulated in ISO exposure groups, while 3 genes (afp4, angptl4 and fabp3) were significantly upregulated in ISO exposure groups (Figure 6B).
4. Discussion
Transcriptome sequencing, revealing almost all actively transcribed genes under particular conditions, is extensively used in environmental toxicological assessment [25,26,27]. The current analysis provides transcriptomic findings in relation to the toxicity associated with AML and ISO in zebrafish. The enrichment analyses imply that diverse cellular, metabolic or signaling pathways are affected in the zebrafish larvae after exposure to AML or ISO. Overall comparison of enrichment analyses indicates that both fungicides have the potential to activate or inactivate the transcriptional expression.
The DEGs analysis revealed that there was an obvious difference in the number of DEGs in the AML (0.75 μM) and ISO (2.5 μM) exposure groups, with a six-fold increase in genes transcript in the ISO exposure groups compared to the AML exposure groups (Figure 3). The low number of DEGs in the AML exposed groups indicated that larvae exposed to AML did not show as strong of a response compared to our ISO exposure. Although exposure to AML (0.75 μM) or ISO (2.5 μM) causes similar phenotypes (pericardial edema, blood-clot clustering and abnormal hemoglobin distributions) in zebrafish embryos/larvae [7,8], the numbers of DEGs in AML or ISO exposed groups is significantly different. Nevertheless, we cannot rule out the possibility that the increased DEGs in the ISO exposed group are caused by the higher drug concentration.
While the number of enriched KEGG pathways under AML exposure (26 pathways) were greater than that under ISO exposure (20 pathways). Many of the KEGG terms in both fungicide exposure groups related to ribosome and biosynthesis of amino acids, supporting the increased translational activity after exposure to AML or ISO (Figure 5). PPAR signaling pathway regulates several homeostatic functions and its disruption causes vascular pathologies [28]. The DEGs in PPAR signaling pathway were also significantly enriched under AML and ISO exposure (Figure 5). In a recent study, we found that exposure to AML or ISO caused cardiovascular defects in zebrafish, including erythropoiesis inhibition and disorders in the spatiotemporal expression patterns of genes associated with erythropoiesis [7,8]. Thus, the disorders of erythropoiesis after exposure to AML or ISO might be due to the misexpressions of genes involved in PPAR signaling pathway. However, this possibility needs further investigation.
Sulfa-based drugs can induce eye defects, including swelling of the ciliary body or the development of angle-closure glaucoma [29]. In an addition, previous studies reported that SDHI boscalid could induce ocular defects in zebrafish. The genes, opn1sw1, opn1mw1, opn4.1, and rho, involved in eye development or phototransduction were significantly downregulated following exposure to 3.49 µM boscalid for 8 days [30,31]. In this study, the phototransduction and retinol metabolism were also significantly enriched by KEGG pathway enrichment or GSEA analysis after exposure to AML or ISO (Figure 5, Tables S6 and S7). There are 29 and 59 DEGs involved in phototransduction pathway in AML and ISO exposure groups, respectively. Taken these together, the retina might be a specific target organ for toxicity of both AML and ISO, which can be used as a potential endpoint for ecological risk assessments of both AML and ISO.
Supplementary Materials
The following are available online at https://www.mdpi.com/article/10.3390/w14020272/s1, Table S1: the primers used for quantitative real-time PCR. Table S2: mapping results of Hisat2 alignment. Overview of total reads and percent of total and unique reads per sample. Table S3: read counts and gene annotations of transcripts identified among all groups. Table S4: differentially expressed genes (DEGs) under AML exposure. Table S5: differentially expressed genes (DEGs) under ISO exposure. Table S6: gene set enrichment analysis (GSEA) result for AML exposure. Table S7: gene set enrichment analysis (GSEA) result for ISO exposure.
Author Contributions
Validation, visualization, data curation, P.X. and W.L.; writing—original draft preparation, P.X.; writing—review and editing, W.L., J.L. and H.Z. All authors have read and agreed to the published version of the manuscript.
Funding
This research was funded by the Young Scientists Fund of the National Natural Science Foundation of China (Grant No. 31900093), and the Fundamental Research Funds for the Central Universities of Huaqiao University (Grant No. ZQN-923).
Institutional Review Board Statement
The study was conducted in accordance with the National Research Council’s Guide for the Care and Use of Laboratory Animals, and approved by the Attitude of the Animal Care and Welfare Committee of Huaqiao University.
Data Availability Statement
The data presented in this study are available in Supplementary Materials.
Acknowledgments
The research was also supported by the Wuhan Branch, Supercomputing Center, Chinese Academy of Sciences, China.
Conflicts of Interest
The authors declare no conflict of interest. The funders had no role in the design of the study; in the collection, analyses, or interpretation of data; in the writing of the manuscript, or in the decision to publish the results.
References
- USEPA. U.S. Pesticide Fact Sheet Number 016330: Amisulbrom; Office of Chemical Safety and Pollution Prevention, United States Environmental Protection Agency: Boston, MA, USA, 2011. [Google Scholar]
- Pedersen, M.; Wegner, C.; Phansak, P.; Sarath, G.; Gaussoin, R.; Schlegel, V. Monitoring wheat mitochondrial compositional and respiratory changes using Fourier transform mid-infrared spectroscopy in response to agrochemical treatments. Spectrochim. Acta Part A Mol. Biomol. Spectrosc. 2017, 173, 727–732. [Google Scholar] [CrossRef] [PubMed] [Green Version]
- Desbordes, P.; Essigmann, B.; Gary, S.; Gutbrod, O.; Maue, M.; Schwarz, H.G. Isoflucypram, the first representative of a new succinate dehydrogenase inhibitor fungicide subclass: Its chemical discovery and unusual binding mode. Pest Manag. Sci. 2020, 76, 3340–3347. [Google Scholar] [CrossRef] [PubMed]
- Fontaine, S.; Remuson, F.; Caddoux, L.; Barres, B. Investigation of the sensitivity of Plasmopara viticola to amisulbrom and ametoctradin in French vineyards using bioassays and molecular tools. Pest. Manag. Sci. 2019, 75, 2115–2123. [Google Scholar] [PubMed]
- Lewis, K.A.; Tzilivakis, J.; Warner, D.; Green, A. An international database for pesticide risk assessments and management. Hum. Ecol. Risk Assess. 2016, 22, 1050–1064. [Google Scholar] [CrossRef] [Green Version]
- EFSA. Conclusion on the peer review of the pesticide risk assessment of the active substance amisulbrom. EFSA J. 2014, 12, 3237. [Google Scholar]
- Chen, X.; Li, W. Isoflucypram cardiovascular toxicity in zebrafish (Danio rerio). Sci. Total Environ. 2021, 787, 147529. [Google Scholar] [CrossRef]
- Ma, X.; Li, W. Amisulbrom causes cardiovascular toxicity in zebrafish (Danio rerio). Chemosphere 2021, 283, 131236. [Google Scholar] [CrossRef]
- Hrdlickova, R.; Toloue, M.; Tian, B. RNA-Seq methods for transcriptome analysis. Wiley Interdiscip. Rev. RNA 2017, 8, e1364. [Google Scholar] [CrossRef] [Green Version]
- Hsu, L.S.; Chiou, B.H.; Hsu, T.W.; Wang, C.C.; Chen, S.C. The regulation of transcriptome responses in zebrafish embryo exposure to triadimefon. Environ. Toxicol. 2017, 32, 217–226. [Google Scholar] [CrossRef]
- Li, W.; Yuan, M.; Wu, Y.; Liu, X. Bixafen exposure induces developmental toxicity in zebrafish (Danio rerio) embryos. Environ. Res. 2020, 189, 109923. [Google Scholar] [CrossRef]
- Jiang, J.; Wu, S.; Lv, L.; Liu, X.; Chen, L.; Zhao, X.; Wang, Q. Mitochondrial dysfunction, apoptosis and transcriptomic alterations induced by four strobilurins in zebrafish (Danio rerio) early life stages. Environ. Pollut. 2019, 253, 722–730. [Google Scholar] [CrossRef]
- Valadas, J.; Mocelin, R.; Sachett, A.; Marcon, M.; Zanette, R.A.; Dallegrave, E.; Herrmann, A.P.; Piato, A. Propiconazole induces abnormal behavior and oxidative stress in zebrafish. Environ. Sci. Pollut. Res. Int. 2019, 26, 27808–27815. [Google Scholar] [CrossRef]
- Bevilaqua, F.; Sachett, A.; Chitolina, R.; Garbinato, C.; Gasparetto, H.; Marcon, M.; Mocelin, R.; Dallegrave, E.; Conterato, G.; Piato, A.; et al. A mixture of fipronil and fungicides induces alterations on behavioral and oxidative stress parameters in zebrafish. Ecotoxicology 2020, 29, 140–147. [Google Scholar] [CrossRef]
- Kumar, N.; Willis, A.; Satbhai, K.; Ramalingam, L.; Schmitt, C.; Moustaid-Moussa, N.; Crago, J. Developmental toxicity in embryo-larval zebrafish (Danio rerio) exposed to strobilurin fungicides (azoxystrobin and pyraclostrobin). Chemosphere 2020, 241, 124980. [Google Scholar] [CrossRef]
- Westerfield, M. The Zebrafish Book: A Guide for the Laboratory Use of Zebrafish (Danio rerio), 5th ed.; University of Oregon Press: Eugene, OR, USA, 2007. [Google Scholar]
- Bolger, A.M.; Lohse, M.; Usadel, B. Trimmomatic: A flexible trimmer for Illumina sequence data. Bioinformatics 2014, 30, 2114–2120. [Google Scholar] [CrossRef] [Green Version]
- Kim, D.; Paggi, J.M.; Park, C.; Bennett, C.; Salzberg, S.L. Graph-based genome alignment and genotyping with HISAT2 and HISAT-genotype. Nat. Biotechnol. 2019, 37, 907–915. [Google Scholar] [CrossRef]
- Liao, Y.; Smyth, G.K.; Shi, W. featureCounts: An efficient general purpose program for assigning sequence reads to genomic features. Bioinformatics 2014, 30, 923–930. [Google Scholar] [CrossRef] [Green Version]
- Kovaka, S.; Zimin, A.V.; Pertea, G.M.; Razaghi, R.; Salzberg, S.L.; Pertea, M. Transcriptome assembly from long-read RNA-seq alignments with StringTie2. Genome Biol. 2019, 20, 278. [Google Scholar] [CrossRef] [Green Version]
- Varet, H.; Brillet-Guéguen, L.; Coppée, J.Y.; Dillies, M.A. SARTools: A DESeq2- and EdgeR-Based R pipeline for comprehensive differential analysis of RNA-Seq data. PLoS ONE 2016, 11, e0157022. [Google Scholar] [CrossRef] [Green Version]
- Chen, C.; Chen, H.; Zhang, Y.; Thomas, H.R.; Frank, M.H.; He, Y.; Xia, R. TBtools: An integrative toolkit developed for interactive analyses of big biological data. Mol. Plant 2020, 13, 1194–1202. [Google Scholar] [CrossRef]
- Wu, T.; Hu, E.; Xu, S.; Chen, M.; Guo, P.; Dai, Z.; Feng, T.; Zhou, L.; Tang, W.; Zhan, L.; et al. clusterProfiler 4.0: A universal enrichment tool for interpreting omics data. Innovation 2021, 2, 100141. [Google Scholar] [CrossRef]
- Subramanian, A.; Tamayo, P.; Mootha, V.K.; Mukherjee, S.; Ebert, B.L.; Gillette, M.A.; Paulovich, A.; Pomeroy, S.L.; Golub, T.R.; Lander, E.S.; et al. Gene set enrichment analysis: A knowledge-based approach for interpreting genome-wide expression profiles. Proc. Natl. Acad. Sci. USA 2005, 102, 15545–15550. [Google Scholar] [CrossRef] [Green Version]
- Jung, J.H.; Moon, Y.S.; Kim, B.M.; Lee, Y.M.; Kim, M.; Rhee, J.S. Comparative analysis of distinctive transcriptome profiles with biochemical evidence in bisphenol S- and benzo[a]pyrene-exposed liver tissues of the olive flounder Paralichthys olivaceus. PLoS ONE 2018, 13, e0196425. [Google Scholar] [CrossRef]
- Sonnack, L.; Klawonn, T.; Kriehuber, R.; Hollert, H.; Schäfers, C.; Fenske, M. Comparative analysis of the transcriptome responses of zebrafish embryos after exposure to low concentrations of cadmium, cobalt and copper. Comp. Biochem. Physiol. Part D Genom. Proteom. 2018, 25, 99–108. [Google Scholar] [CrossRef]
- Christou, M.; Fraser, T.W.K.; Berg, V.; Ropstad, E.; Kamstra, J.H. Calcium signaling as a possible mechanism behind increased locomotor response in zebrafish larvae exposed to a human relevant persistent organic pollutant mixture or PFOS. Environ. Res. 2020, 187, 109702. [Google Scholar] [CrossRef]
- Kvandová, M.; Majzúnová, M.; Dovinová, I. The role of PPARgamma in cardiovascular diseases. Physiol. Res. 2016, 65, S343–S363. [Google Scholar] [CrossRef]
- Li, J.; Tripathi, R.C.; Tripathi, B.J. Drug-induced ocular disorders. Drug Saf. 2008, 31, 127–141. [Google Scholar] [CrossRef]
- Wang, H.; Meng, Z.; Liu, F.; Zhou, L.; Su, M.; Meng, Y.; Zhang, S.; Liao, X.; Cao, Z.; Lu, H. Characterization of boscalid-induced oxidative stress and neurodevelopmental toxicity in zebrafish embryos. Chemosphere 2020, 238, 124753. [Google Scholar] [CrossRef]
- Qian, L.; Qi, S.; Wang, Z.; Magnuson, J.T.; Volz, D.C.; Schlenk, D.; Jiang, J.; Wang, C. Environmentally relevant concentrations of boscalid exposure affects the neurobehavioral response of zebrafish by disrupting visual and nervous systems. J. Hazard. Mater. 2021, 404, 124083. [Google Scholar] [CrossRef]
Figure 1.
Transcriptome profile results. Principal component analysis (PCA) of transcriptome of all 9 RNAseq libraries (A) and sample-wise Pearson correlation of all transcriptome data (B). The percentages of the total variation that are accounted for by the first two principal components are 36.84% and 13.93% respectively. Symbols represent samples and are colored according to different exposure treatments: yellow box (Con: wide type control), purple triangle (AML exposure group), and green circle (isoflucypram exposure group).

Figure 2.
Volcano plots of all quantified genes in the transcriptome analysis of zebrafish embryos with AML (left) and ISO (right) exposure compared to the control. Each plotted point represents the association results for an individual gene. Significantly differentially expressed genes are defined as those with at least ±2-fold change (level of magnitude, vertical lines) and Benjamini and Hochberg adjusted p < 0.05 (level of statistical significance, horizontal line) and illustrated in red (increased expression) or blue (decreased expression). In order to make the figures more readable, adjusted p value which was <1 × 10⁻³⁰ was modified to 1 × 10⁻³⁰.

Figure 3.
Number of statistically significant transcripts (>2 fold and adjusted-p < 0.05) of genes in AML and ISO exposure groups (A) and the number of uniquely or commonly up- or down-regulated transcripts in zebrafish embryos exposed to AML or ISO (B).
Figure 3.
Number of statistically significant transcripts (>2 fold and adjusted-p < 0.05) of genes in AML and ISO exposure groups (A) and the number of uniquely or commonly up- or down-regulated transcripts in zebrafish embryos exposed to AML or ISO (B).

Figure 4.
Gene ontology (GO) functional classification of differentially expressed genes. Comparison of GO in terms of biological processes (A), cellular components (B), and molecular function (C) that were enriched in the AML- and ISO-exposed embryos of zebrafish. Composition of each GO term is represented as a percentage.

Figure 5.
KEGG enrichment analysis of the differentially expressed genes in AML- and ISO-exposure groups.
Figure 5.
KEGG enrichment analysis of the differentially expressed genes in AML- and ISO-exposure groups.

Figure 6.
Volcano plots of DEGs in PPAR signaling and phototransduction pathways (A) and validation of the transcriptome analysis of selected DEGs using RT-qPCR (B). About the volcano plots, each dot represents a gene. The red and green dots represent differentially expressed genes with p < 0.05 and |log2 fold change| > 1, respectively. The gene names or descriptions of DEGs with low p values or high |fold change| were labelled, and the names or descriptions of genes selected in RT-qPCR were marked dark black. In regard to the RT-qPCR plot, significant differences between control (Con) and AML- or ISO-exposure groups are indicated by asterisks, respectively. * p < 0.05.

Publisher’s Note: MDPI stays neutral with regard to jurisdictional claims in published maps and institutional affiliations. |
© 2022 by the authors. Licensee MDPI, Basel, Switzerland. This article is an open access article distributed under the terms and conditions of the Creative Commons Attribution (CC BY) license (https://creativecommons.org/licenses/by/4.0/).
Share and Cite
MDPI and ACS Style
Xiao, P.; Li, W.; Lu, J.; Zhang, H. Transcriptome Analysis of the Toxic Effects of Amisulbrom and Isoflucypram on Zebrafish (Danio rerio) Larvae. Water 2022, 14, 272. https://doi.org/10.3390/w14020272
AMA Style
Xiao P, Li W, Lu J, Zhang H. Transcriptome Analysis of the Toxic Effects of Amisulbrom and Isoflucypram on Zebrafish (Danio rerio) Larvae. Water. 2022; 14(2):272. https://doi.org/10.3390/w14020272
Chicago/Turabian StyleXiao, Peng, Wenhua Li, Jinfang Lu, and He Zhang. 2022. "Transcriptome Analysis of the Toxic Effects of Amisulbrom and Isoflucypram on Zebrafish (Danio rerio) Larvae" Water 14, no. 2: 272. https://doi.org/10.3390/w14020272
Note that from the first issue of 2016, this journal uses article numbers instead of page numbers. See further details here.