
Contribution of the Reconstruction of the Area of Seling Co Lake Using DEM Data and Analysis of Spatio-Temporal Variations
1
School of Surveying and Land Information Engineering, Henan Polytechnic University, Jiaozuo 454000, China
2
Geographic Information and Tourism College, Chuzhou University, Chuzhou 239000, China
*
Author to whom correspondence should be addressed.
Water 2022, 14(22), 3599; https://doi.org/10.3390/w14223599
Submission received: 18 October 2022
/
Revised: 5 November 2022
/
Accepted: 7 November 2022
/
Published: 8 November 2022
(This article belongs to the Section New Sensors, New Technologies and Machine Learning in Water Sciences)
Abstract
:Seling Co Lake, located on the Qinghai-Tibet Plateau, has been expanding rapidly since the 1980s and, in 2008, surpassed Namtso Lake to become the largest lake in Tibet. Additionally, this rapid expansion has significantly impacted the ecological environment, and human activities surround the lake. Thus, it is of great importance to reveal the expansion pattern of Seling Co Lake for a long time-series. Previous studies always contained errors when exploring this subject due to the limitations associated with the quality of remote sensing images. To overcome the existing deficiency, a method based on the SRTM1 DEM and a water frequency Landsat-series dataset is developed to reconstruct the complete inundation area of Seling Co Lake from 1987 to 2021 while taking full advantage of the relationship between the water frequency and terrain. The results show that the water frequency reconstruction model proposed in this study has a significant optimization effect on the restoration of the permanent and seasonal water areas of Seling Co Lake. In particular, the proposed method can effectively improve the underestimated water-frequency pixel values of the seasonal waters located on the southern and northern shores of Seling Co Lake. The water-inundation area of Seling Co Lake showed an overall increasing trend with a rate of 26.02 km2∙year−1 (p < 0.01), and this expansion trend was mainly concentrated in the southern and northern parts of the lake. This study cannot only provide an efficient and feasible remote sensing means of reconstructing the water-inundation area for lakes in complex terrain according to topographic conditions but also greatly refines our understanding of the annual variations in the water-inundation area of Lake Seling Co.
1. Introduction
Lakes are an important component of the terrestrial hydrosphere; though they account for only ~3.7% of Earth’s land surface, lakes play an essential role in the hydrospheric water cycle and in regional climate regulation [1,2,3]. In the context of the deterioration of the global environment and a warming climate, water area and storage variations have become popular topics in recent lake research [4,5,6]. Although the total area and number of lakes in China do not account for a large proportion on the global scale, China plays a dominant role in global lake research involving remote sensing [7]. The Tibetan Plateau lake aggregation area, which has the highest elevation, the largest quantities and the largest area of lakes in China, has become a hot spot for domestic lake research because it quantitatively accounts for more than 35% of the lakes in the country and not only maintains the largest total lake area but has also continued to experience an increased overall lake area in recent decades [8,9,10,11,12,13]. Lakes located on the Qinghai-Tibet Plateau are less affected by human activities due to the geographical context of the region, and most of these lakes are located in closed inflow regions and are thus important links for studying the interaction of spheres [14,15].
Seling Co Lake, the fifth-largest lake in China, is located on the Tibetan Plateau and has surpassed Namtso Lake to become the largest lake in Tibet [16]. Over the past four decades, the water area of Seling Co Lake has continued to grow by almost 40% (from approximately 1700 km2 in 1975 to approximately 2400 km2 in 2020) [11,17]. Similar to the areal change, the water storage of Seling Co Lake has also increased by 80% (from 309.4 × 10⁸ m3 to 558.4 × 10⁸ m3) [18,19]. With the development of remote sensing technology, high-spatial-resolution and high-temporal-resolution remote sensing images have emerged and helped predecessors monitor the areal change of Seling Co Lake and analyze its influencing factors. Some studies have indicated that the primary cause for the rapid augmentation of the area of Seling Co Lake was the increase in water storage generated from snow and ice melt [16,17,18]; the melting runoff of snow and glaciers into the lake from 1981 to 2012 and from 2003 to 2013 accounted for 11.5% and 22.8% of its increased area, respectively [19,20]. Dong et al. [21] used a Landsat-series dataset to extract the areal information of lakes in the Qinghai-Tibet Plateau, and the results showed that accelerating expansion occurred on Seling Co Lake over the past four decades and that the main driving factor of this expansion was precipitation. However, Dejiyangzong et al. [22] reported that the areal changes of Seling Co Lake over the last 40 years were related to temperature and precipitation, because the temperature and precipitation are atmospheric circulation-included phenomena [23,24,25]. It is probably the increasing evaporation caused by rising temperatures that offsets the hydrological effect of increasing precipitation [26]. Benefiting from multiple remote sensing observation missions, these studies have greatly contributed to promoting the understanding of the hydrological regime of Seling Co Lake.
Although predecessors have performed comprehensive research on the areal changes and Seling Co Lake and the related causes, it is still impossible to estimate the area of the lake accurately because of the low quality of remote sensing data, which is caused by the lake being located in the hinterlands of the Qinghai-Tibet Plateau, where cloud cover is greater than it is in the plain region [27,28,29]. Subsequently, high-quality digital elevation model (DEM) data appeared and were developed in studies of lakes [30]. In recent years, estimations of water levels and water storage and reconstructions of the evolution processes of lakes have been accomplished by applying technical theoretical methods such as geomorphological and lacustrine sedimentological methods [31,32,33,34]. For example, Nie et al. [35] employed 9 -m elevation data from the Shuttle Radar Topography Mission (SRTM) DEM to identify lakes at different elevations in the Himalayas and then combined the results with Landsat-series data and other remote sensing data to reconstruct the areas of lakes in the Himalayas from 1990 to 2015. Edward Park et al. [36] similarly used SRTM DEM data and a Landsat dataset to calculate the water levels of Lake Curuai and Tonle Sap Lake; the resulting errors were within ±50 cm. Zhu et al. [37] acquired the dynamic water level elevation information from Ice, Cloud and Land Elevation Satellite Geoscience Laser Altimeter System (ICEsat GLAS) data and then made water storage estimations; the average error of the results was 0.044 × 10⁸ m3. Thus, it is feasible to reconstruct lake water storage and water levels from DEM data.
Because optical remote sensing images are extremely susceptible to cloudy images, the number of effective observations of Seling Co Lake, which is located on the Qinghai-Tibet Plateau, is relatively small, and it is impossible to obtain accurate annual water frequencies from these data. However, these images can be combined with water level and terrain factors to calculate the annual effective water frequency of Seling Co Lake and then obtain the actual annual equivalent water area of Seling Co Lake. Therefore, the essential objectives of this study are conceived as follows: (1) to make full use of the correlation between the water frequency and terrain factors to develop a water frequency reconstruction model and then reconstruct the water frequency and calculate the equivalent area within a year using this model; (2) to extract the water-inundation range of Seling Co Lake from 1987 to 2021 based on a Landsat-series dataset with a 30 m spatial resolution; (3) to re-estimate the water area of Seling Co Lake with the help of the reconstruction model developed in this study; and (4) to analyze the spatial and temporal variations in the lake conditions. This study is expected to provide an efficient remote sensing-based means of reconstructing high-resolution lake water-inundation areas and to enhance our understanding of the hydrological regime of Seling Co Lake.
2. Materials and Methods
2.1. Study Region
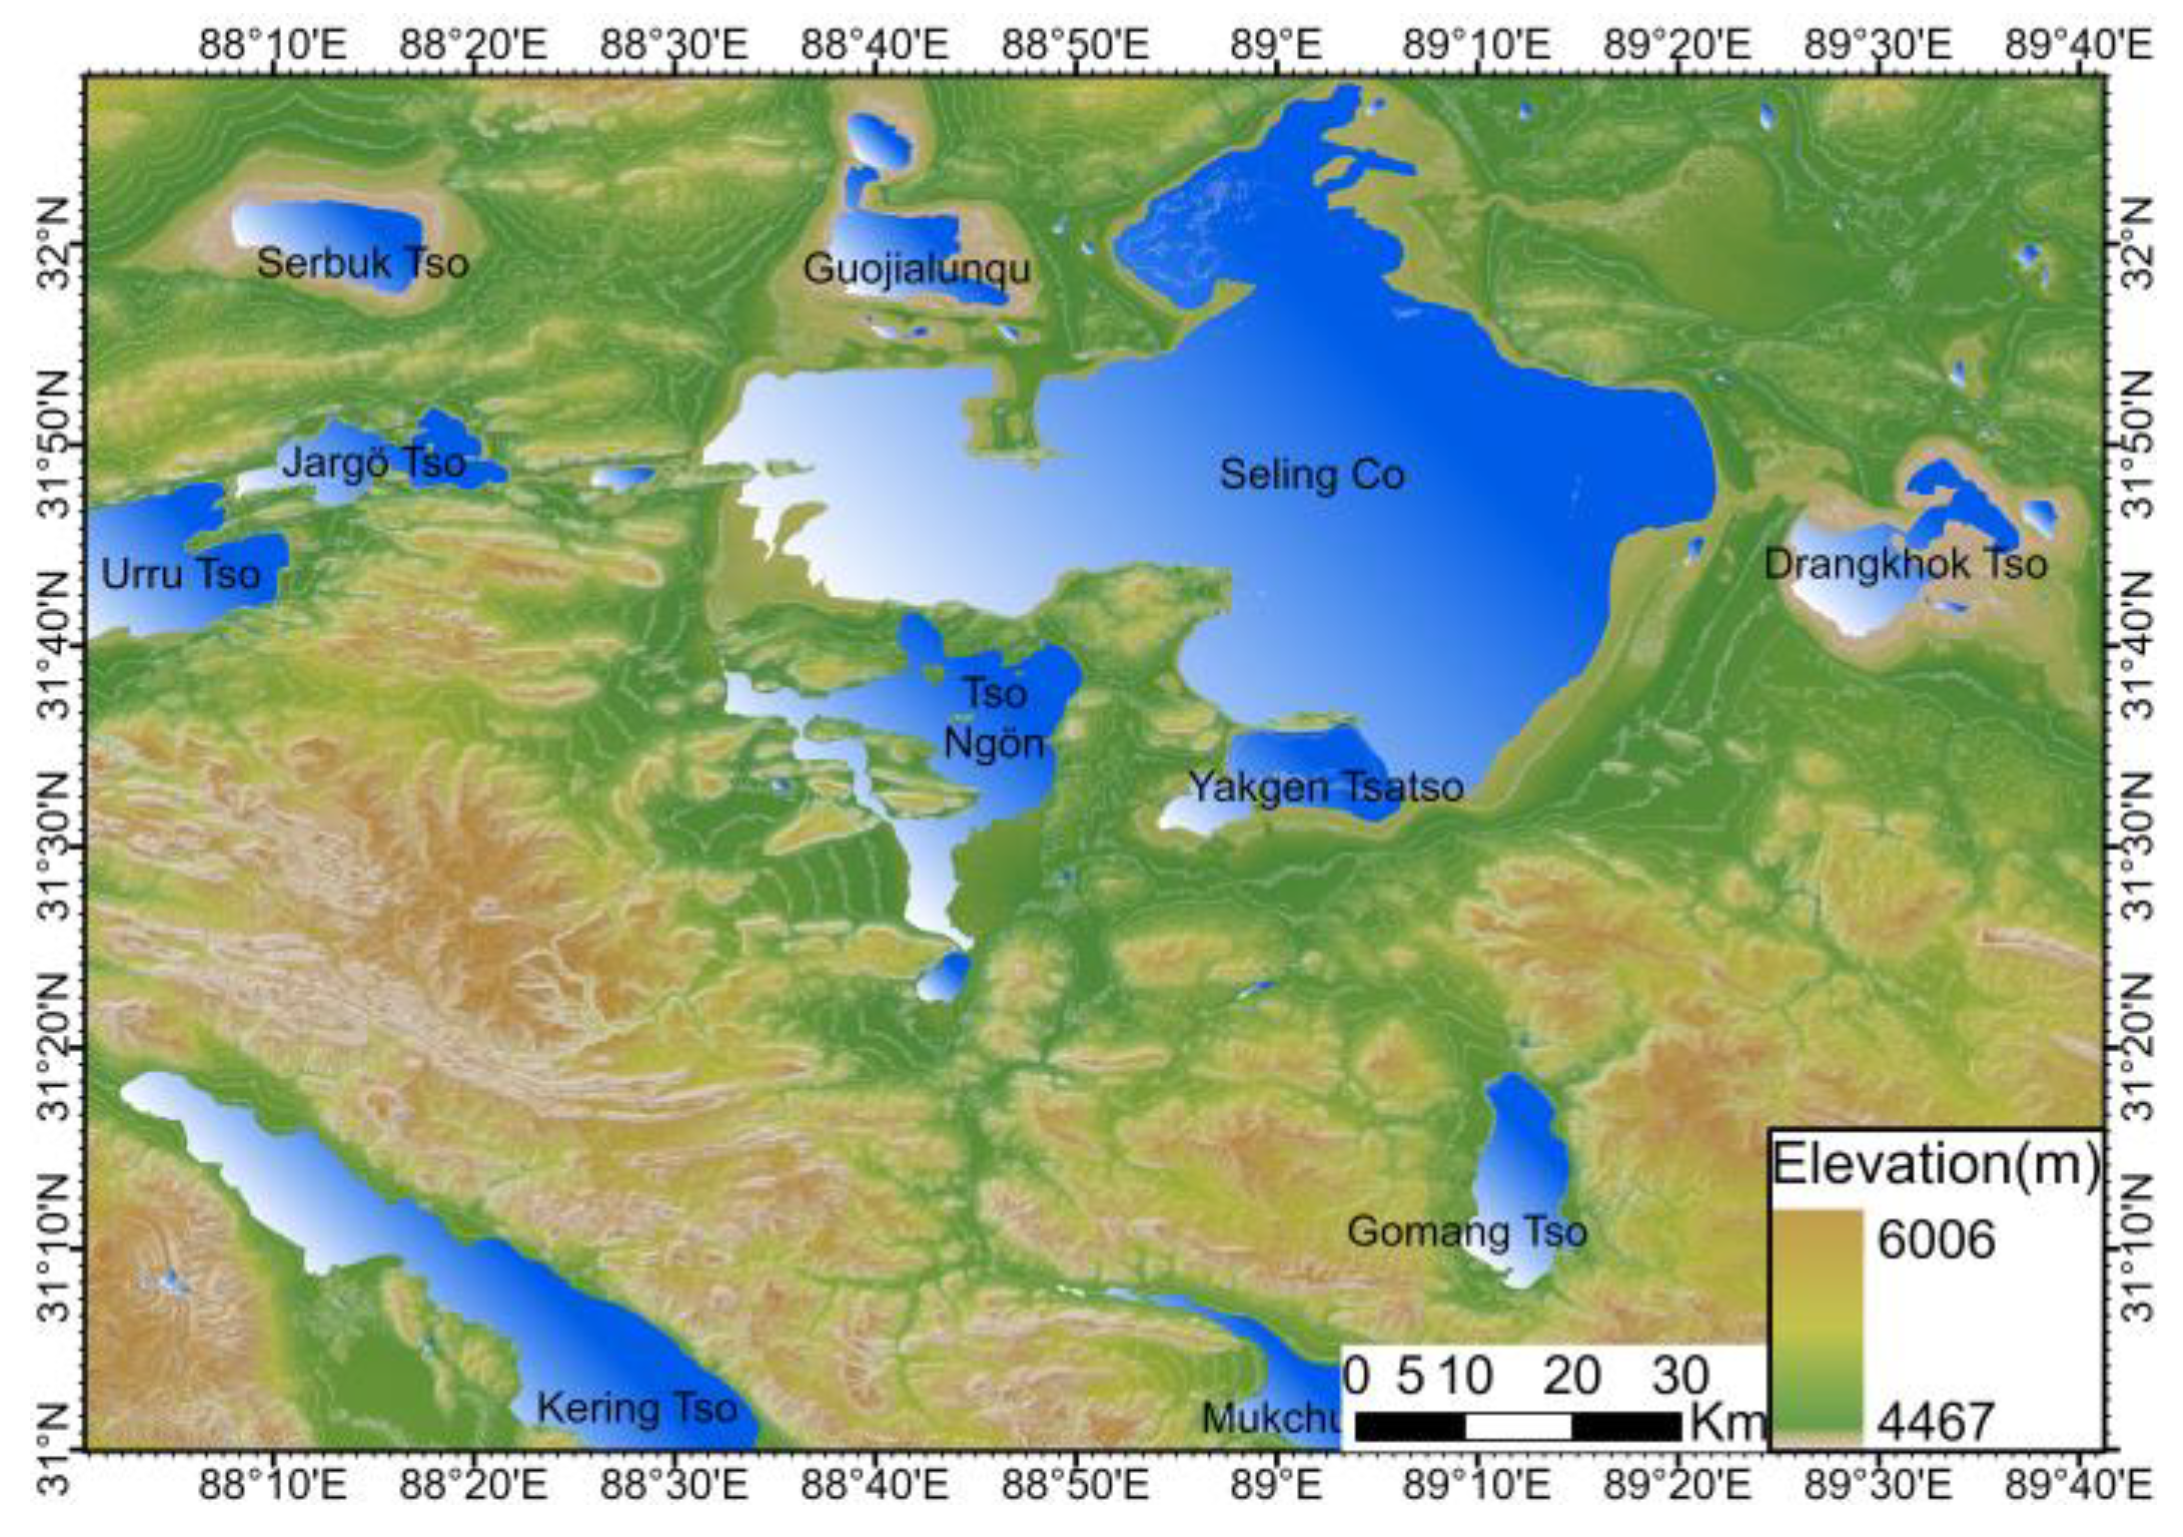
Seling Co Lake (31°34′–31°51′ N, 88°33′–89°21′ E), located at the northern foot of Gangdisi Mountain in the central part of the Tibetan Plateau and at the junction of Shenzha, Nyima and Bangor counties in the Tibet Autonomous Region, is the second-largest salt-water lake in China and a structural lake generated during the formation of the Qinghai-Tibet Plateau [38]; the lake has an average elevation of 4530 m, spans 77.7 km from east to west and 45.5 km from south to north and has a maximum water depth of over 33 m. The Seling Co Basin has an alpine and semiarid monsoon climate, with an average annual precipitation of 290~321 mm and an average annual low temperature of 0.8~1.0 °C [39]. The key rivers in the basin include Zagatzangpo, Ali Zangpo, Boqu Zangpo and Zangpo, and these four rivers provide the main water supply of Seling Co Lake. In addition to Seling Co Lake, the other main lakes in the region include Drangkhok Tso, Urru Tso, Yakgen Tsatso, Kering Tso and Gomang Tso (Figure 1), and the total area of the basin is approximately 45,530 km², making it the largest inflow lake system on the Qinghai-Tibet Plateau [21]. Since 1976, the area of Selin Co Lake has continued to expand, and the water level of the lake rose by 14 m between 1976 and 2017 [18]. In its southern region, Seling Co Lake was connected with Yakgen Tsatso from 2003 to 2005 due to the continuous rise in the water level [17]. The lush pastures around the lake shore have been flooded, and residents have been forced to evacuate as a result of the continuous growth of Seling Co Lake. If the area of the lake continues to grow, the normal traffic routes in the Tibetan region will be affected [40].
2.2. Data and Preprocessing
2.2.1. Landsat Imagery for Lake Water-Inundation Extraction
Since the 1970s, Landsat-series satellites have been launched and have begun to obtain data, and these data have been widely favored by scientific research workers because of their relatively high spatial and temporal resolutions. In this study, data were collected from the 5-, 7- and 8-series Landsat satellites to identify the water-inundation range of Seling Co Lake. Among them, we obtained data collected by the Landsat-5 Thermal Mapper (TM), Landsat-7 Enhanced Thermal Mapper Plus (ETM+) and Landsat-8 Operational Land Imager (OLI) at a spatial resolution of 30 m and a revisit period of 16 d. Google Earth Engine (GEE) integrates Landsat-series data from the United States Geological Survey (USGS) and the National Aeronautics and Space Administration (NASA) into its database, and these data can be called directly online for processing and analyses [41]. The IDs of the datasets used in this study in GEE are “LANDSAT/LT05/C02/T1_L2”, “LANDSAT/LE07/C02/T1_L2” and “LANDSAT/LC08/C02/T1_L2”; these datasets belong to the Landsat Collection-2 data and have all undergone atmospheric and terrain corrections; the pixel values in the images represent surface reflectance [41]. In this study, we collected a total of 983 Landsat images acquired from 1987 to 2021, including 278 Landsat-5 images, 448 Landsat-7 images and 257 Landsat-8 images. All images with cloud cover less than 20% were scaled and de-clouded in GEE; then, the water-inundation area of Seling Co Lake was extracted from each image.
2.2.2. Water Frequency Dataset and DEM Data of Seling Co Lake
Pickens, A.H. et al. [42] produced a global inland water dynamics dataset (Global surface water dynamics 1999–2020 (GLAD (umd.edu))) based on Landsat-5, Landsat-7 and Landsat-8 images acquired from 1999 to 2020 and then monitored the dynamic changes in global inland water bodies from 1999 to 2018, and the dataset is still updated continuously. Therefore, this study selected and verified the water frequency (WF) data of Seling Co Lake from 2000 to 2021 in this dataset, and appropriate data were filtered when constructing the model to ensure the accuracy of the model.
The elevation data of the Shuttle Radar Topography Mission (SRTM DEM), collected at a spatial resolution of 30 m, were used to calculate the slope of the Seling Co Lake region. The elevation and slope were considered independent variables when constructing the model.
2.3. Methods
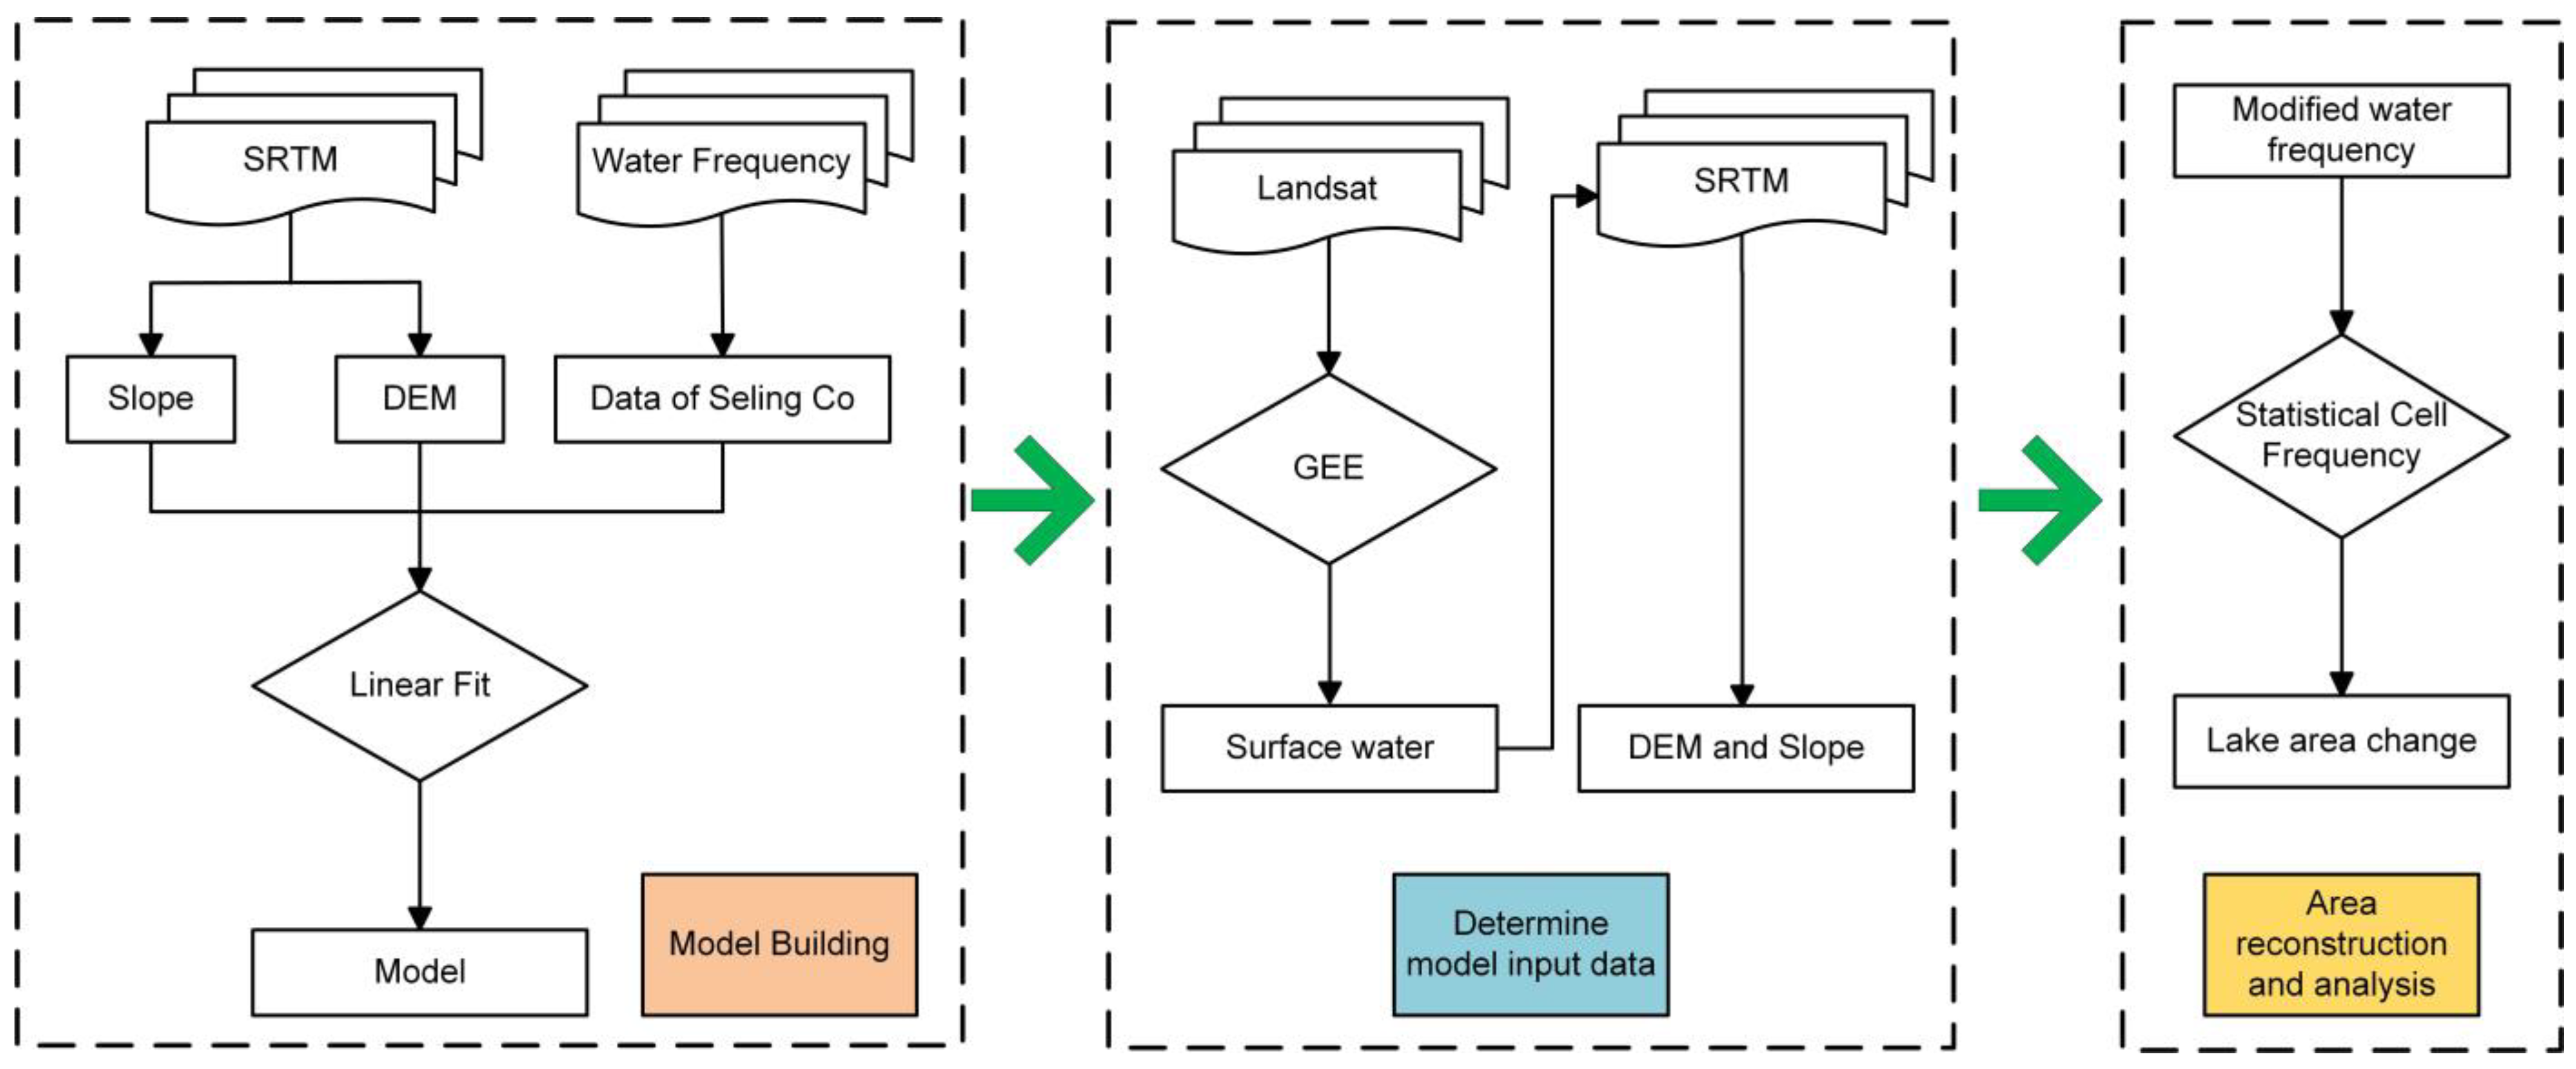
The method of this study includes three main parts (Figure 2). First, the original water frequency, slope and elevation data are employed to fit the model, which was then used to calculate the water frequency theoretically. Second, Landsat data were obtained and processed to extract the surface water-inundation range of Seling Co Lake from 1987 to 2021 in GEE; then, the elevation range of the inundation area of Seling Co Lake was obtained from the annual inundation area results. Finally, the constructed model and the obtained annual flooding range were used to modify the water frequency results, and the annual equivalent area was calculated each year to analyze the spatiotemporal variations.
2.3.1. Model Building
In general, remote sensing data are affected when large amounts of clouds, shadows and other noises are present when the data are processed, resulting in the poor accuracy of the obtained remote sensing data. Therefore, to find a model with a high fitting degree that can simulate the waterlogging frequency based on the slope and water level, the relationships among the water frequency data obtained from the remote sensing data, the slope and the water level should be analyzed.
The variations in the water body of the lake are related not only to changes in surface runoff but also to changes in topography due to Seling Co Lake being located on the Qinghai-Tibet Plateau, which has great topographic fluctuations. Consequently, on the premise that other influencing factors were ignored in this study, the variations in water bodies in a certain region could be considered to be caused only by changes in topography (elevation and slope), and the linear relationship among these three factors was assumed as shown in Equation (1):
where MWF represents the modified water frequency; E and S represent the elevation and slope, respectively; (x, y) represents the location of the pixel; a and b represent the weights of the elevation and slope terms in the equation; and c represents a constant term in the equation.
2.3.2. Model Accuracy Evaluation
In theory, the higher the water level and the steeper the slope are, the lower the water frequency is. In this study, we counted the water frequencies under different lake water levels and slope conditions to test the effects of the lake water level and slope on the water frequency and then constructed a model based on the findings. The theoretical water frequency distribution was obtained according to the model, and then the determination coefficient R2 (Equation (3)) and the absolute error indices (root-mean-square error (RMSE) and mean absolute error (MAE)) (Equations (4) and (5)) were calculated according to the theoretical and real values. Among them, R2 reflects how much of a change in the flooding frequency can be explained by changes in the lake water level and slope [43], RMSE reflects the error between the real and predicted values and MAE better reflects the real situation of the error in the predicted value [44].
where and represent the true value and predicted value, respectively; represents the average predicted value; and represents the number of true values.
2.3.3. Extracting the Water-Inundation Area of Seling Co Lake from 1987 to 2021
First, 983 Landsat-5 TM, 7 ETM+ and 8 OLI images with a cloud coverage of less than 20%, taken in the Seling Co Lake region from 1987 to 2021, were selected through the GEE platform. Next, the Quality Assessment Band of each image was employed to generate the cloud and shadow masks, and the images were masked to eliminate noisy pixels. Moreover, the zoom factor provided by GEE was used to scale the pixel values of the images and remove the extreme values at the image edges. After that, three spectral indexes (the modified normalized difference water index (MNDWI), normalized difference vegetation index (NDVI) and enhanced vegetation index (EVI)) were calculated using the processed images (Equations (6)–(8) below) and added to the image bands. Finally, a decision tree framework was constructed through multiple threshold segmentation, and the core algorithm of the framework was the Edge Otsu algorithm [45]. By combining the different spectral indexes, the optimal water-segmentation threshold of each image was determined by multiple calls of the Edge Otsu algorithm. The indices can be expressed as follows:
where RED, GREEN and BLUE represent the red, green and blue visible-light bands, respectively; NIR represents the near-infrared band; and SWIR1 represents the first shortwave-infrared band.
2.3.4. Reconstruction of the Water Area of Seling Co Lake
By processing Landsat images and extracting water bodies in the GEE cloud platform, images of the water-body coverage of Seling Co Lake from 1987 to 2021 were obtained. The inundation range to be reconstructed was then determined based on the effective water-coverage images representing each year. According to the model constructed as described above to correct the flooding frequency, the annual water frequency of Seling Co Lake could be calculated, and the water area of Seling Co Lake could be calculated based on the water frequency results; finally, the spatiotemporal characteristics of the results could be analyzed.
First, the maximum and minimum inundation ranges in each year were determined on the basis of the inundation range of Seling Co Lake obtained from GEE; then, the inundation ranges were used to mask SRTM1 DEM data to determine the maximum and minimum water surface elevations of the lake in each year, and the slope data of the model were calculated through the lake surface elevation range. Second, the annual water frequency data were obtained by using the modified water frequency model according to the lake elevation and slope data obtained in the first step. Third, a statistical analysis was performed on the water frequency data to count the occurrence frequency of each level of water frequency, and then the equivalent water area was calculated through Equation (9). The water area below the lowest water surface elevation was regarded as permanent water, and the water area between the lowest and the highest water surface elevations was regarded as seasonal water. The Sen slope estimation method (Theil–Sen Median) and the Mann–Kendall (MK) significance test were used to analyze the spatiotemporal changes. Both the Sen slope estimation method and the MK test are nonparametric statistical methods that are not sensitive to missing values or outliers. These methods are suitable for trend analyses and the significance testing of long-time-series data [46,47]; the calculation formula of the Sen slope estimation method is shown in Equation (10), and the statistical formula of the MK test is shown in Equations (11)–(14).
where represents the water frequency value at pixel position in the year, represents the occurrence frequency of the indicated water frequency value in the raster image in year i and indicates the spatial resolution of this raster image (in m).
where Median denotes the median value and and denote the datasets for year j and year i, respectively; if , it indicates that the water body has undergone an increasing trend; if , it indicates that there was no change in the water body; and if , it indicates that the water body has undergone a decreasing trend.
where is the symbolic function. The symbolic function is calculated as follows:
The test statistic Z that was used for the trend test is calculated as follows:
The calculation formula of Var is expressed as follows:
where n is the number of data points in the sequence.
The same bilateral trend test was used with a critical value of at a given significance level (), and , and . These values indicate that the significance test passed at the 90%, 95% and 99% confidence levels, respectively; the method for determining the significance of the trend results is shown in Table 1.
3. Results
3.1. Optimization of Water Frequency Data in Seling Co Lake
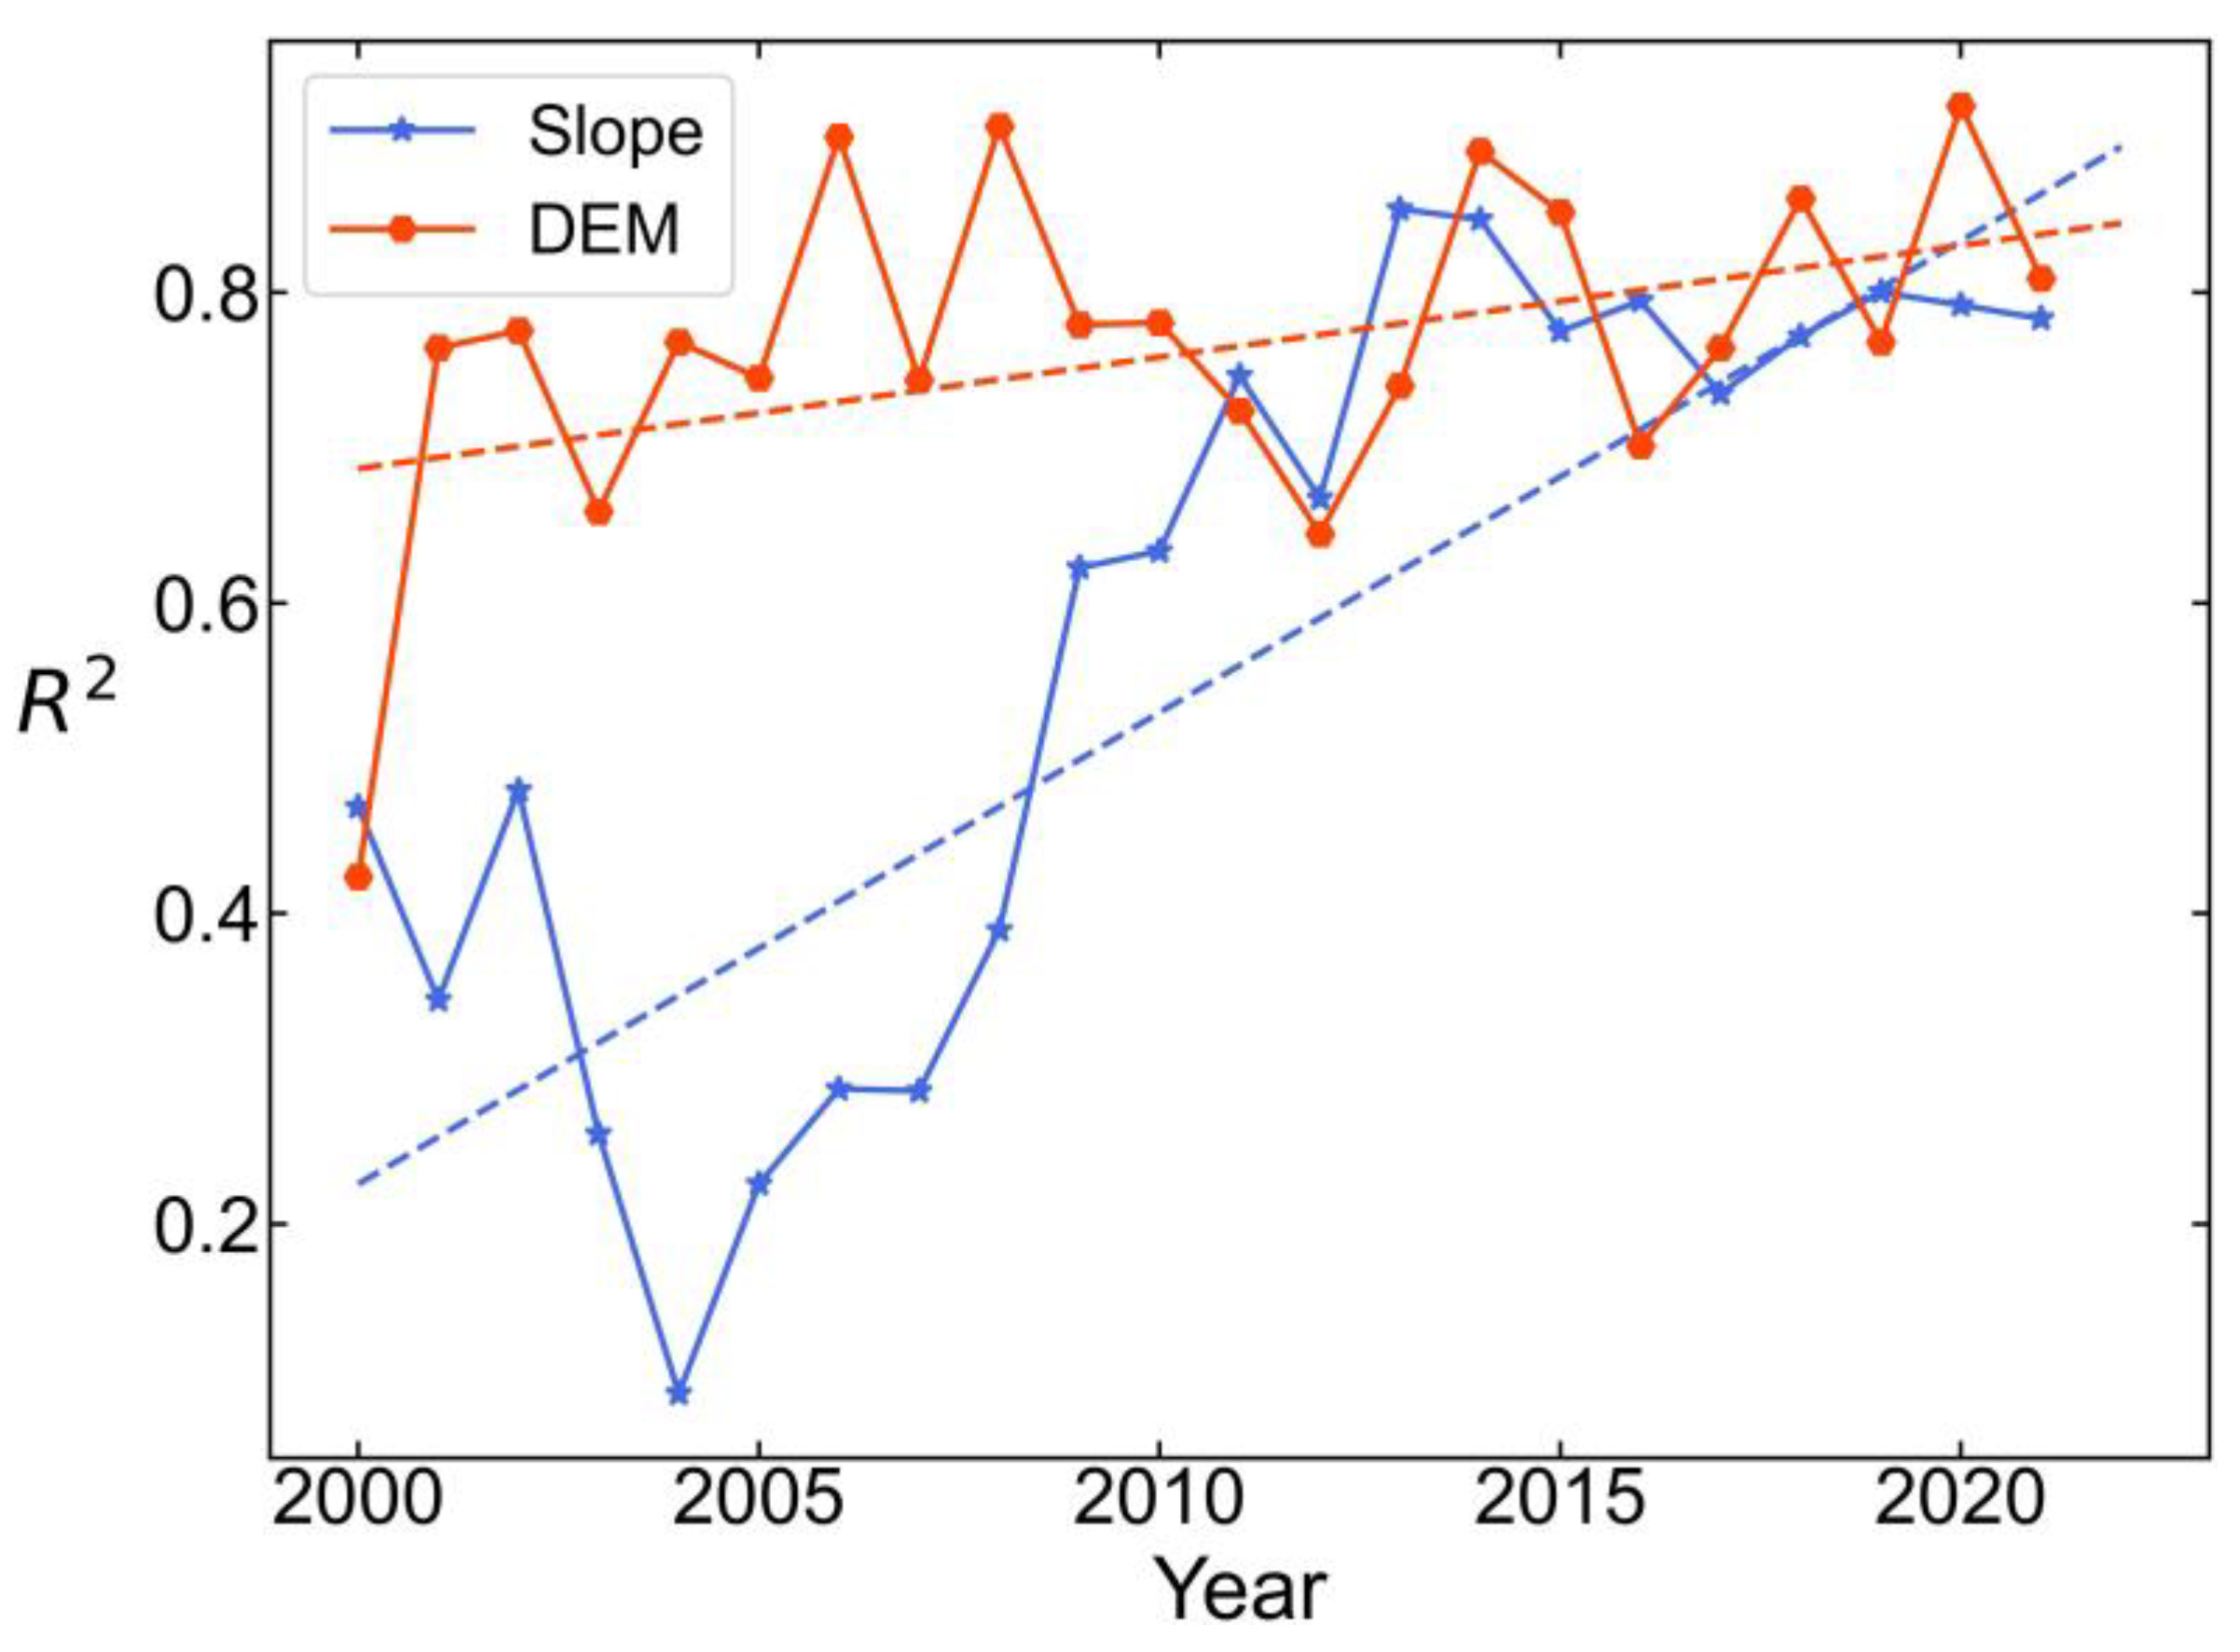
Water frequency data representing Seling Co Lake between 2000 and 2021 were collected in this study, and the inundation range of the lake was then determined according to the annual water frequency data. Subsequently, the lake water surface elevation of Seling Co Lake from 2000 to 2021 was extracted, and the slope distribution was calculated. It was necessary to use the water frequency, lake surface elevation and slope data to construct the model and perform the preliminary optimization of the data to ensure the accuracy of the model. The correlation coefficient (R2) was calculated by fitting and merging the DEM data extracted on the basis of the inundation range of the lake and the slope data, and the results are displayed in Figure 3. An increasing trend was found in the correlations between the water frequency and DEM and between the water frequency and slope data; however, the fitting level of the water frequency with the DEM was significantly higher than between the water frequency and the slope data. In addition, the fitting degree between the water frequency and the DEM data in 2000 was low (0.42), but it rose sharply to 0.76 in 2001 and did not fluctuate extensively from 2001 to 2021. In contrast, the fitting degree of the water frequency and slope data can be seen in Figure 3; it decreases from 2002 to the lowest point in 2004 (R2 = 0.09) and then begins to increase. Thus, the water frequency data of 2000 and 2004, the DEM data of 2000 and the slope data of 2004 were replaced by the data of adjacent years when training the model using this dataset.
3.2. Model Construction
Based on the screened data discussed in Section 3.1, we constructed the model, and it was validated using the validation data; the results are shown in the following figure (Figure 4), in which panels a, b and c show the validation results in 2020 and panels d, e and f show the validation results in 2021. Figure 4a,d show that the fitting effect of the model is favorable, and optimal results are achieved in the validation data of both 2020 and 2021, with R2 values between the predicted and real values reaching 0.9. From the other two absolute error indexes, the validation effect of 2021 is better than that of 2020, with RMSE = 9.32% and MAE = 7.71% in 2020 and RMSE = 7.63% and MAE = 6.27% in 2021. However, the model-fitting process altered approximately 50% of the water frequencies (Figure 4b,e), which was particularly evident in the data for 2020. Considering WF = 50% as the demarcation line, the model-fitting effect was poor before the demarcation line (R2 = 0.48, RMSE = 10.66% and MAE = 8.9%); however, after the demarcation line, the model fit better (R2 = 0.71, RMSE = 7.73% and MAE = 6.5%). Similarly, for the 2021 vintage data, while the R2 values obtained before and after model fitting were approximately equal (0.77 and 0.68), the remaining two error indicators showed one good and one bad situation, with RMSE = 7.12% and MAE = 5.9% before and RMSE = 8.12% and MAE = 6.66% after model fitting. Therefore, the data were reorganized and divided into two parts according to the dividing line to remodel and verify the modelling effect. After adjusting the model, the data from 2020 and 2021 were fit and verified again. The results are shown in Figure 4c, f; although there was not a great difference in the R2 value between the ensemble model and the block model, the block model performed significantly better than the ensemble model in terms of the two absolute error indexes. The RMSE and MAE of the ensemble model were 9.32% and 7.71% in 2020, while those of the block model were 5.12% and 4.21%, respectively; in 2021, the RMSE and MAE of the ensemble model were 7.63% and 6.27%, and those of the block model were 4.47% and 3.67%, respectively.
3.3. Water-Inundation Area Reconstruction of Seling Co Lake
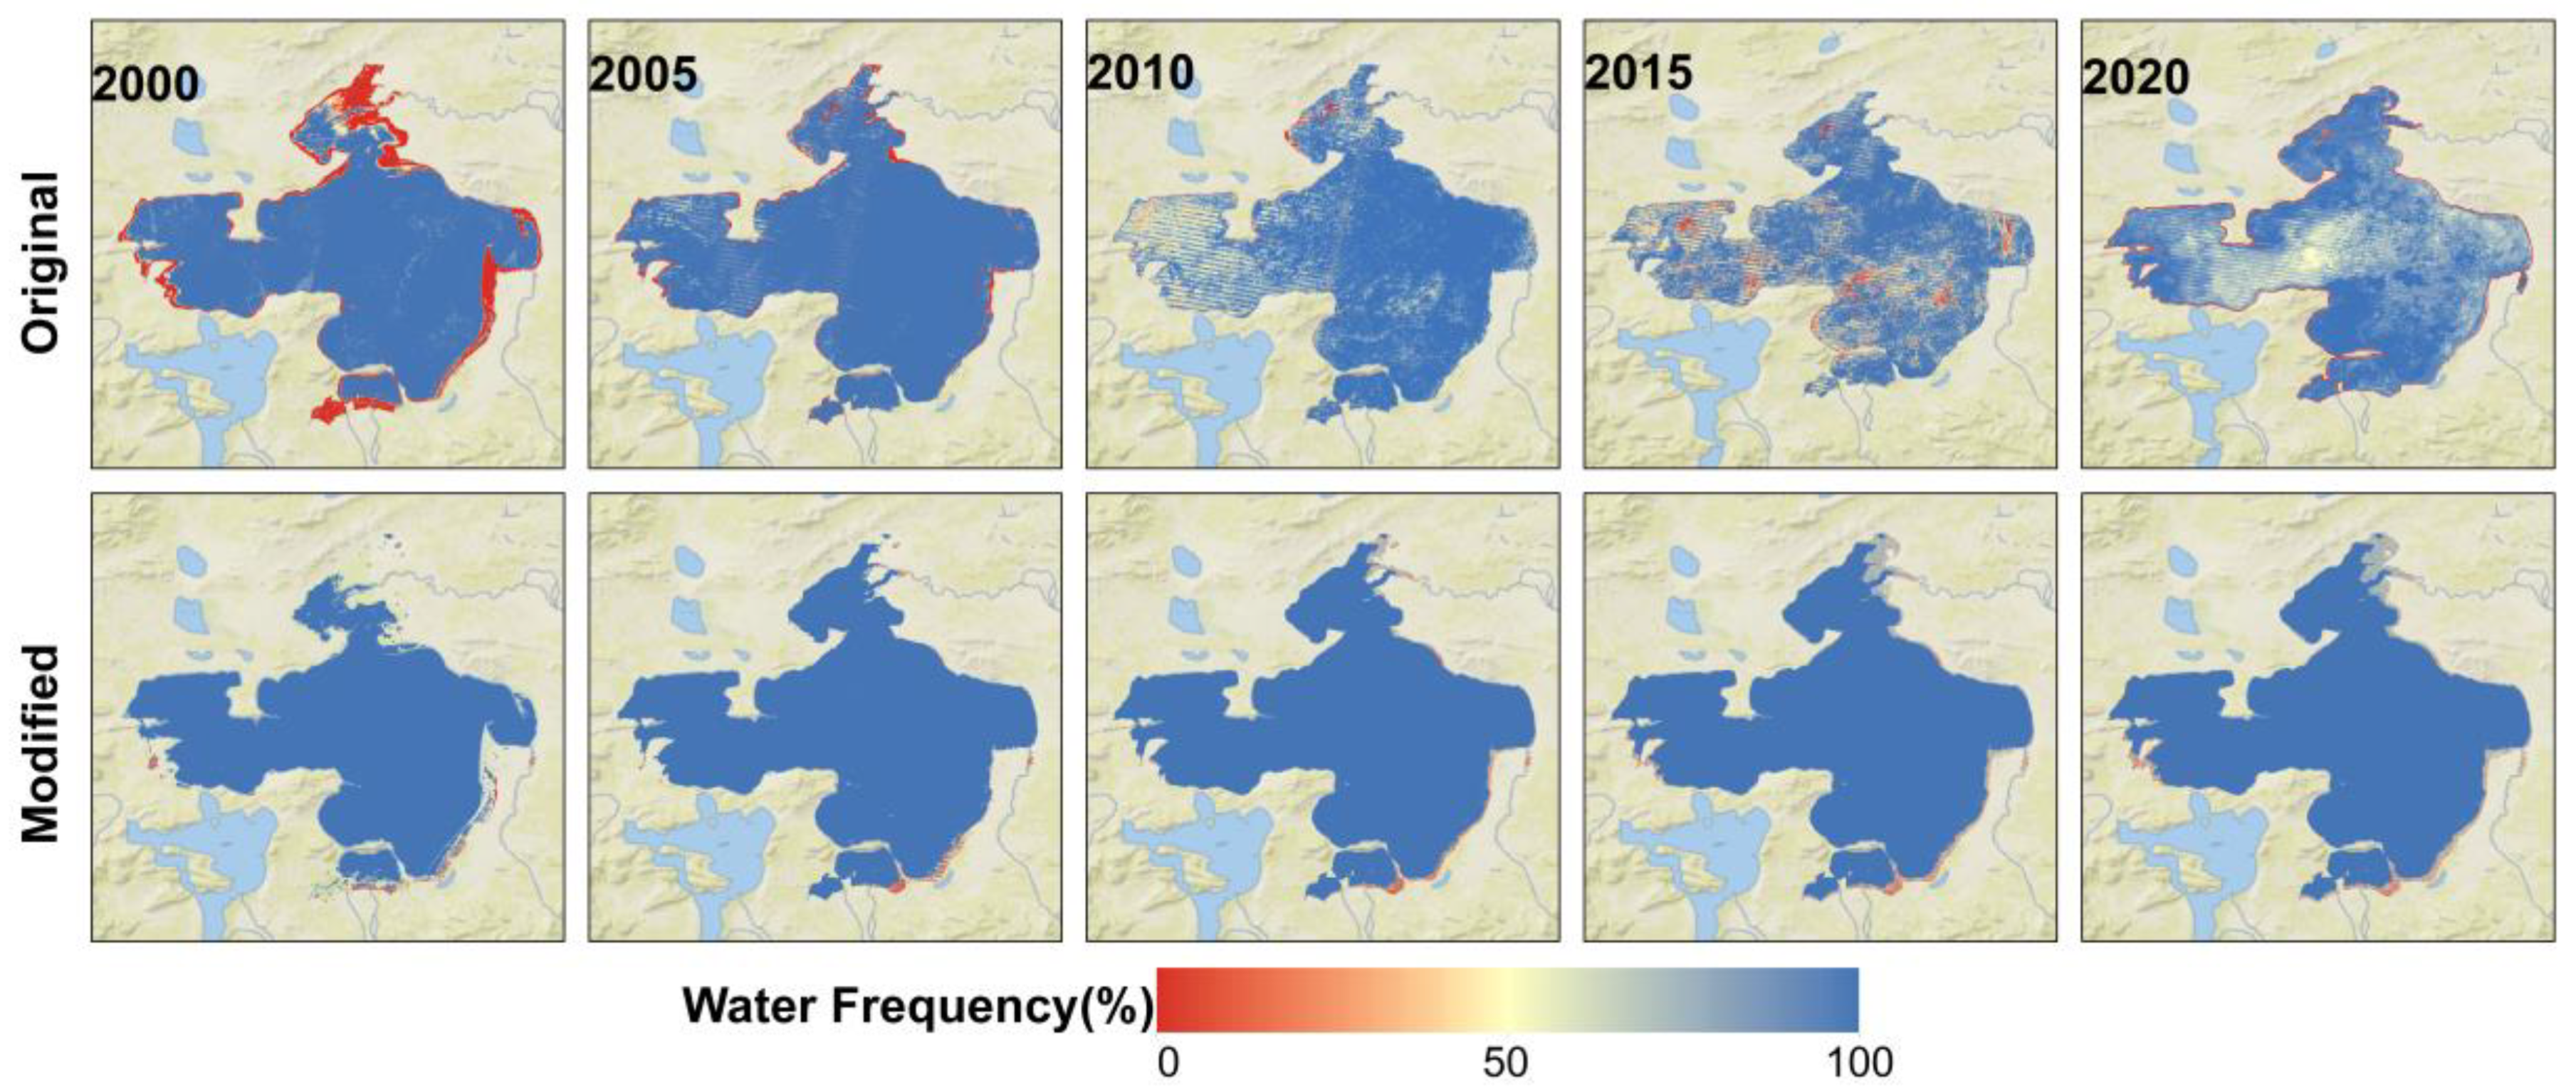
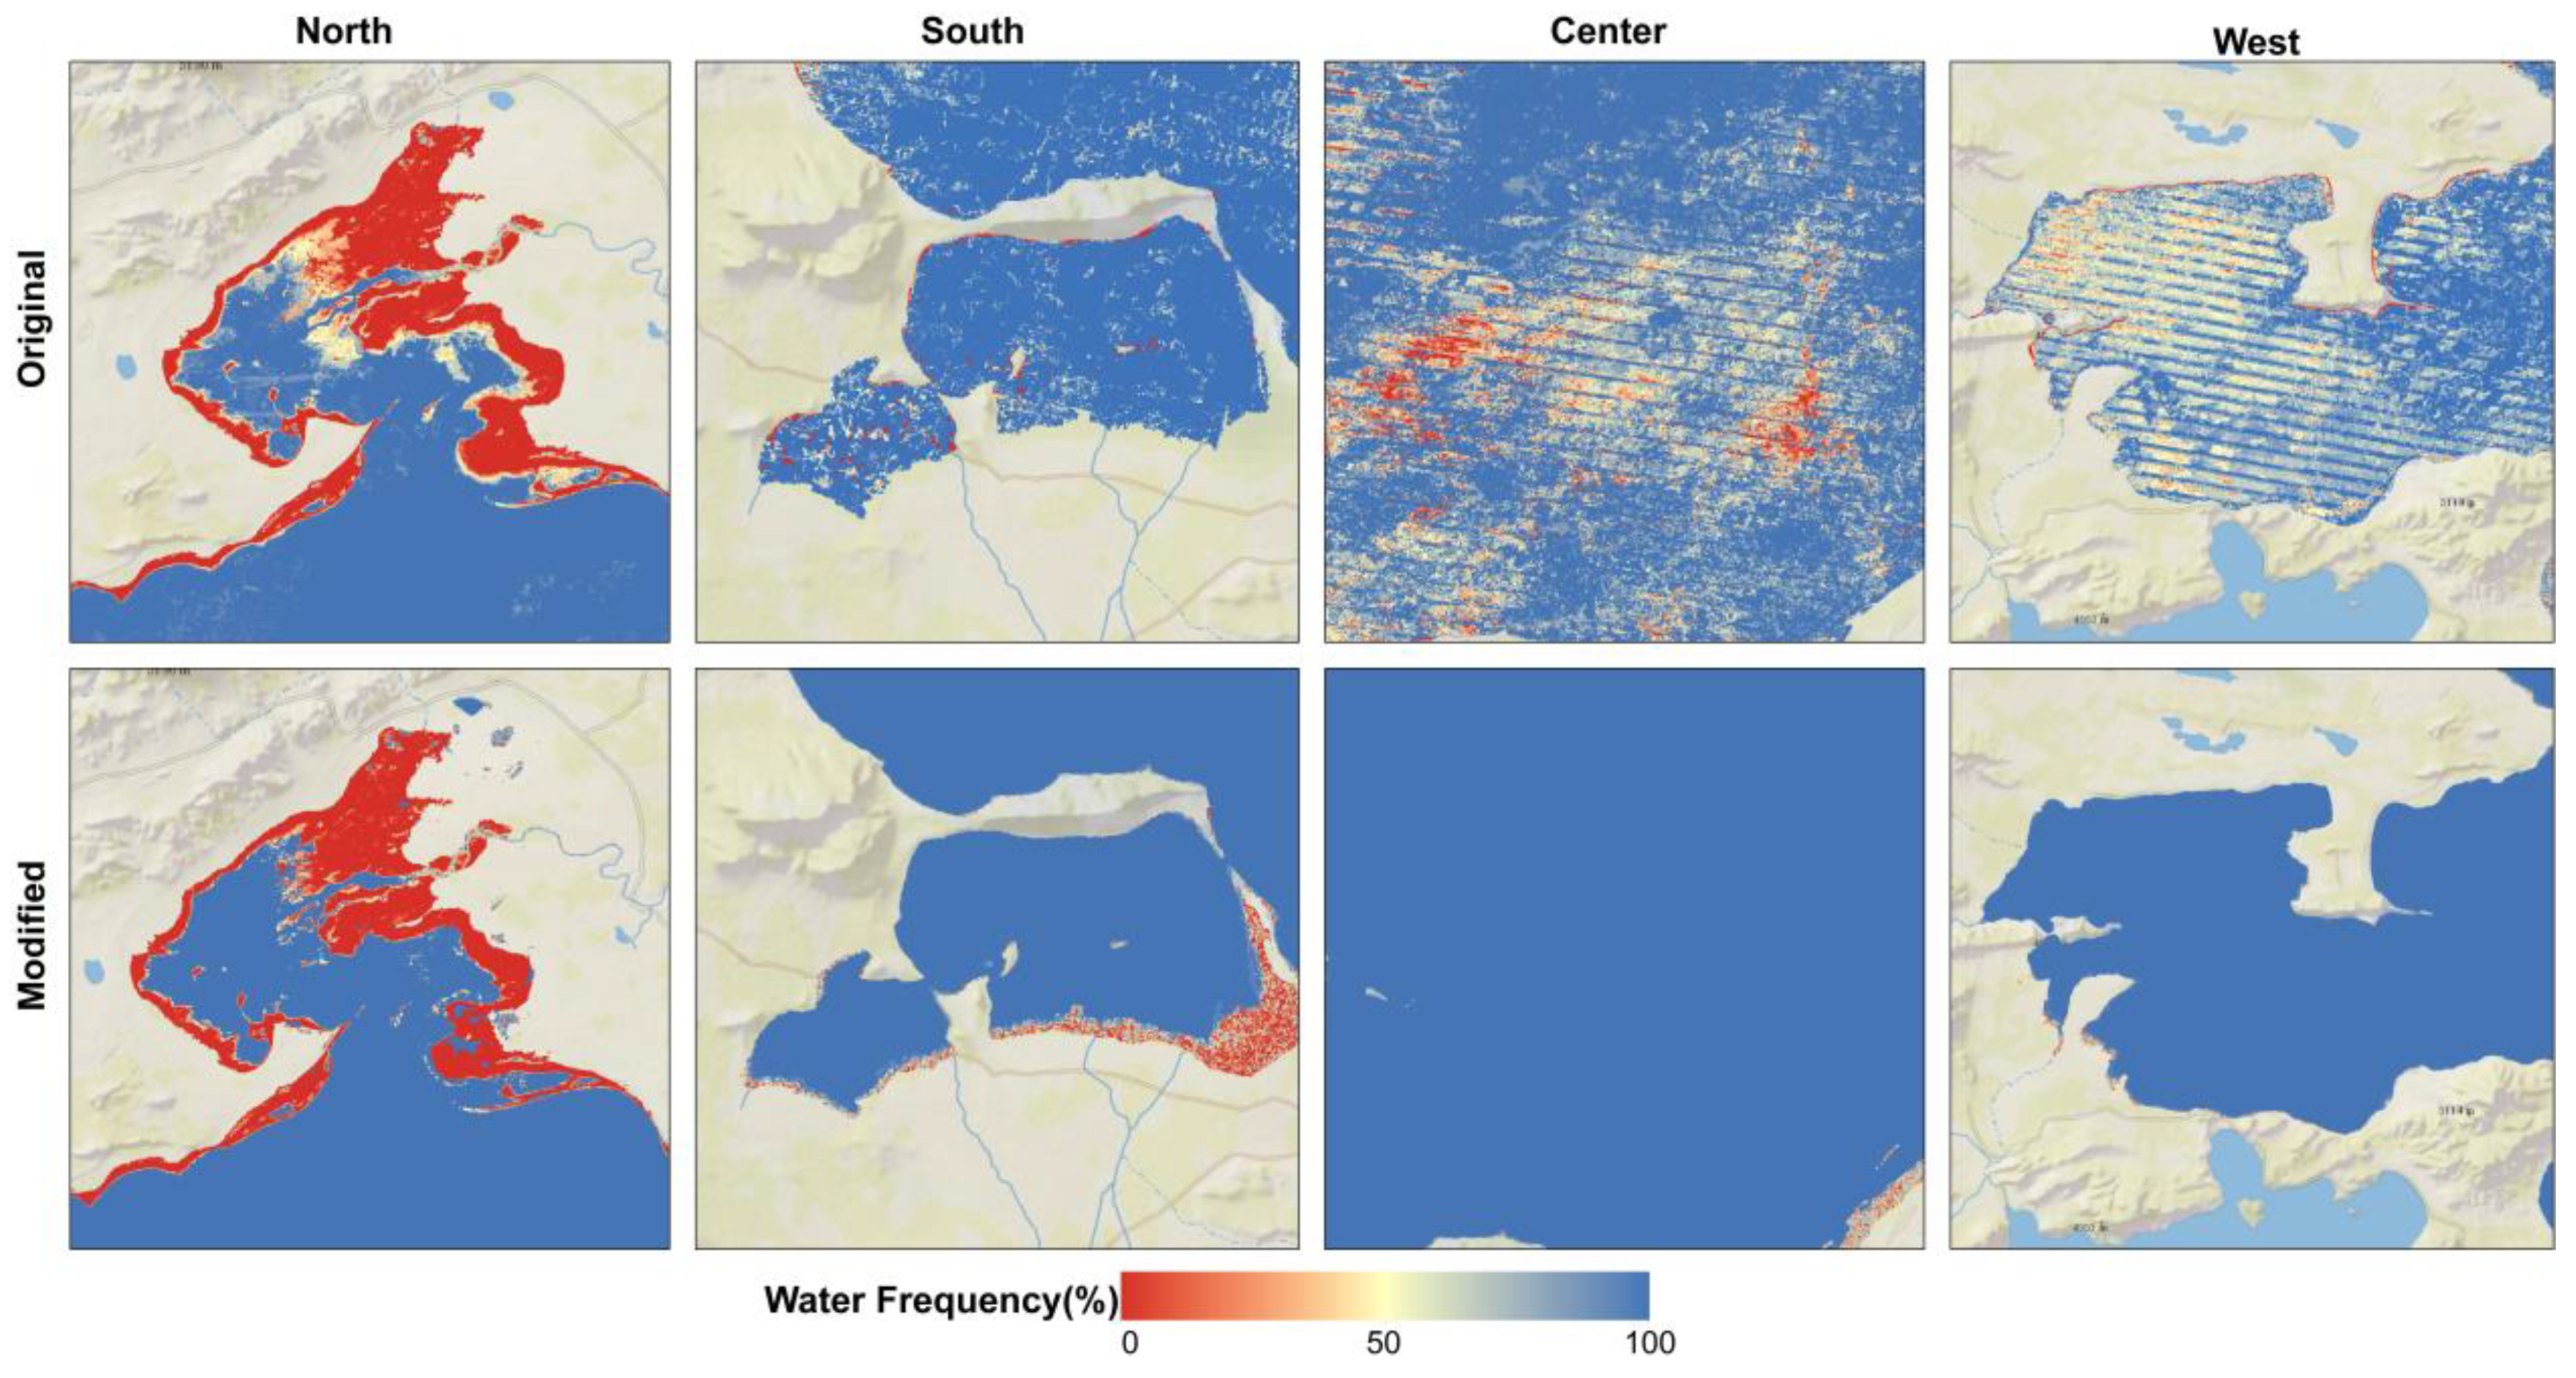
The water frequency reconstruction model and the DEM and slope data for each year were employed to reconstruct the water frequency from 1987 to 2021, and the results are shown in Figure 5. As a whole, the main task of the model constructed in this study was the re-estimation of the seasonal water area occurring in the south and north regions of Seling Co Lake and the permanent water area in the central and western regions of the lake. After the re-estimation of the water frequency, the water frequency data of the temporary water areas in the northern and southern regions of Seling Co Lake were significantly improved, and many underestimated pixel values in the north were recalculated; the improvement in the southern temporary area was more obvious than that in the northern region, the corrected water frequency range was significantly larger than the original data and the noisy data appearing in the original data were essentially corrected. Since the water level in the central and the western regions of the lake was lower than the lowest water level during the research period, we suppose that these regions were theoretically submerged by the water body throughout the year, and the water frequency in these areas could therefore be directly assigned as 100. However, to test the performance of the model, the direct assignment method is not adopted, but the model prediction method is used to calculate the water frequency. It is also clear from Figure 6 that the water frequency data in the central and western regions of the lake were significantly improved after reconstruction.
3.4. Temporal and Spatial Variations in the Seling Co Lake Area
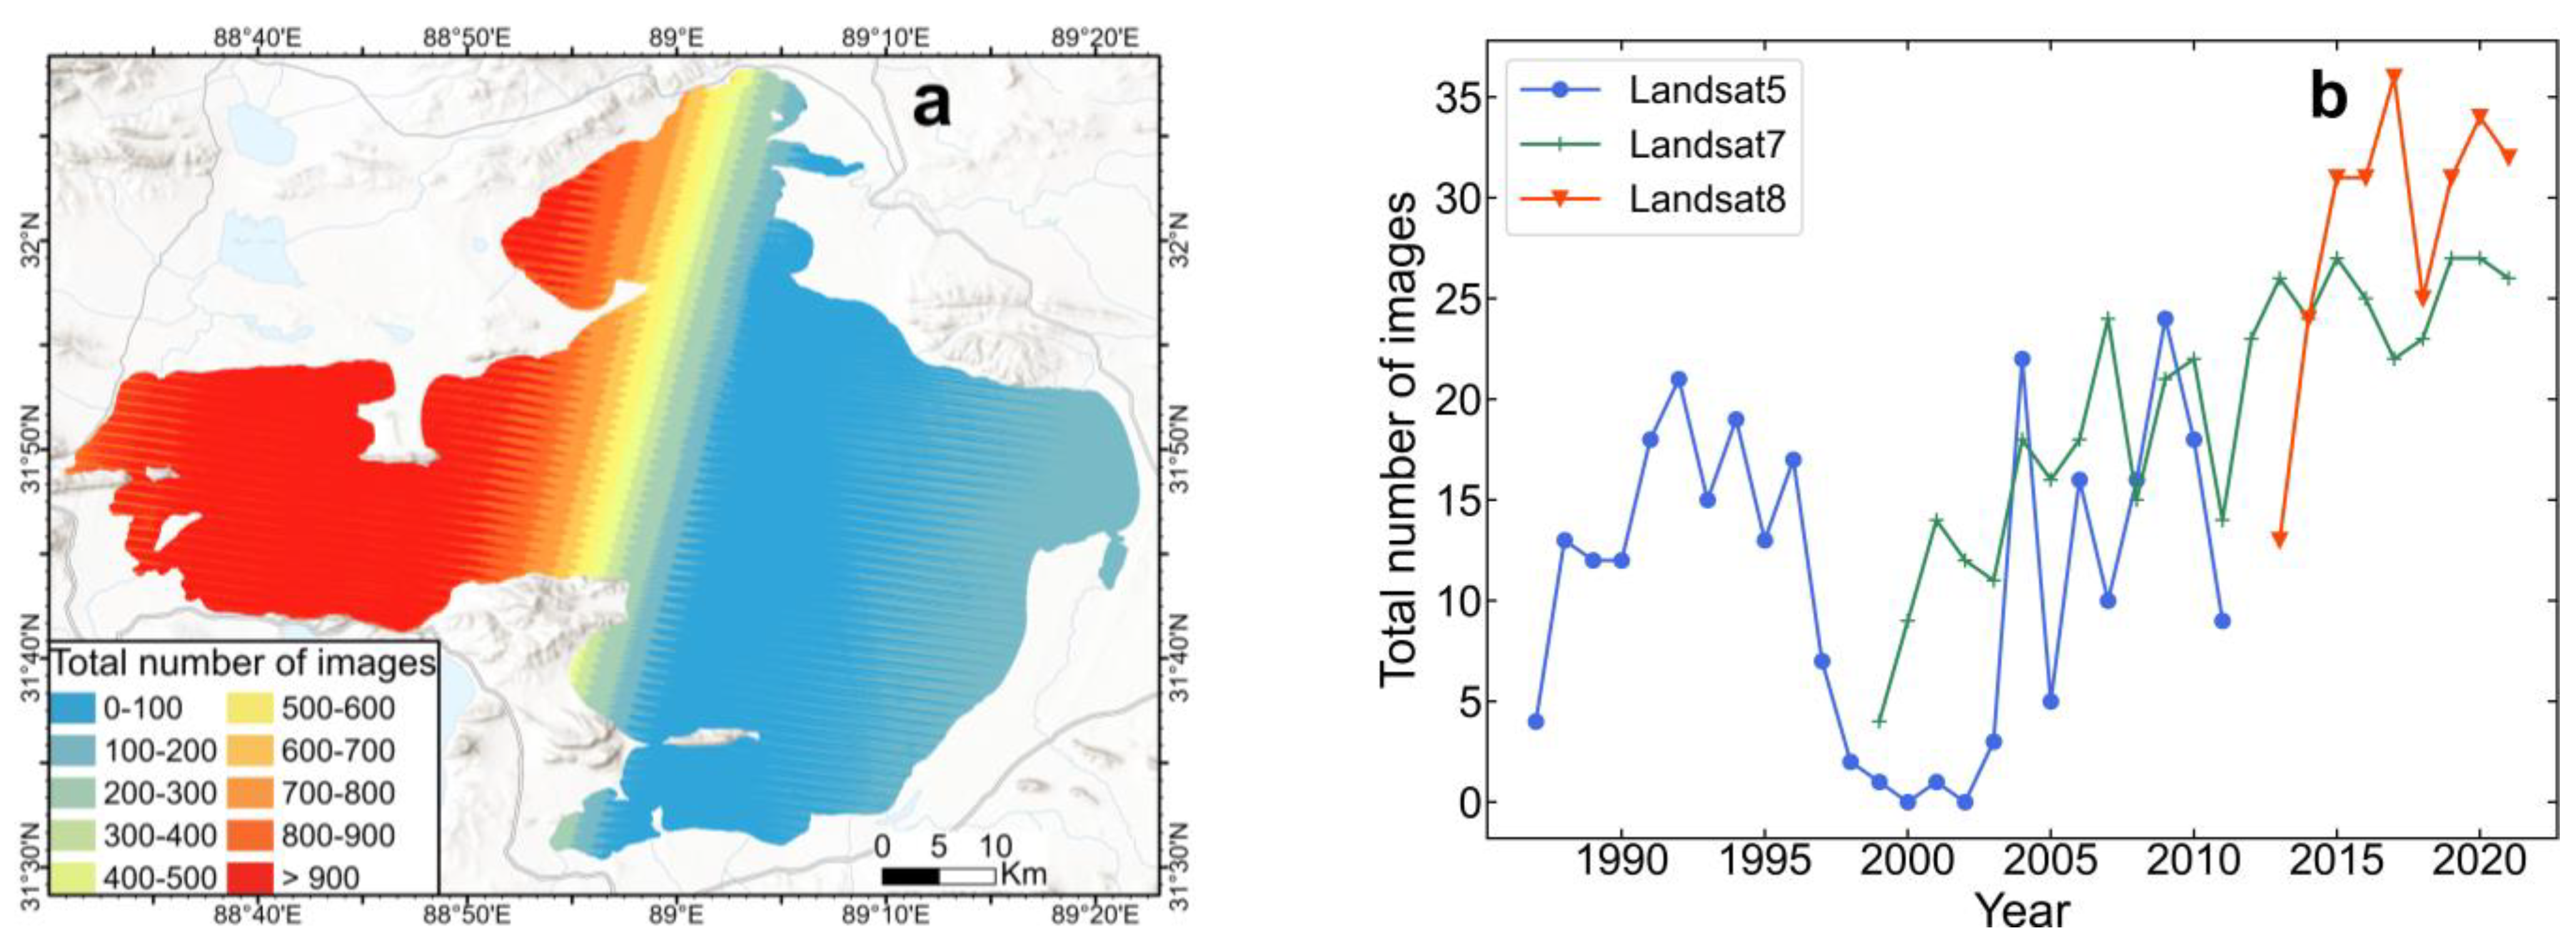
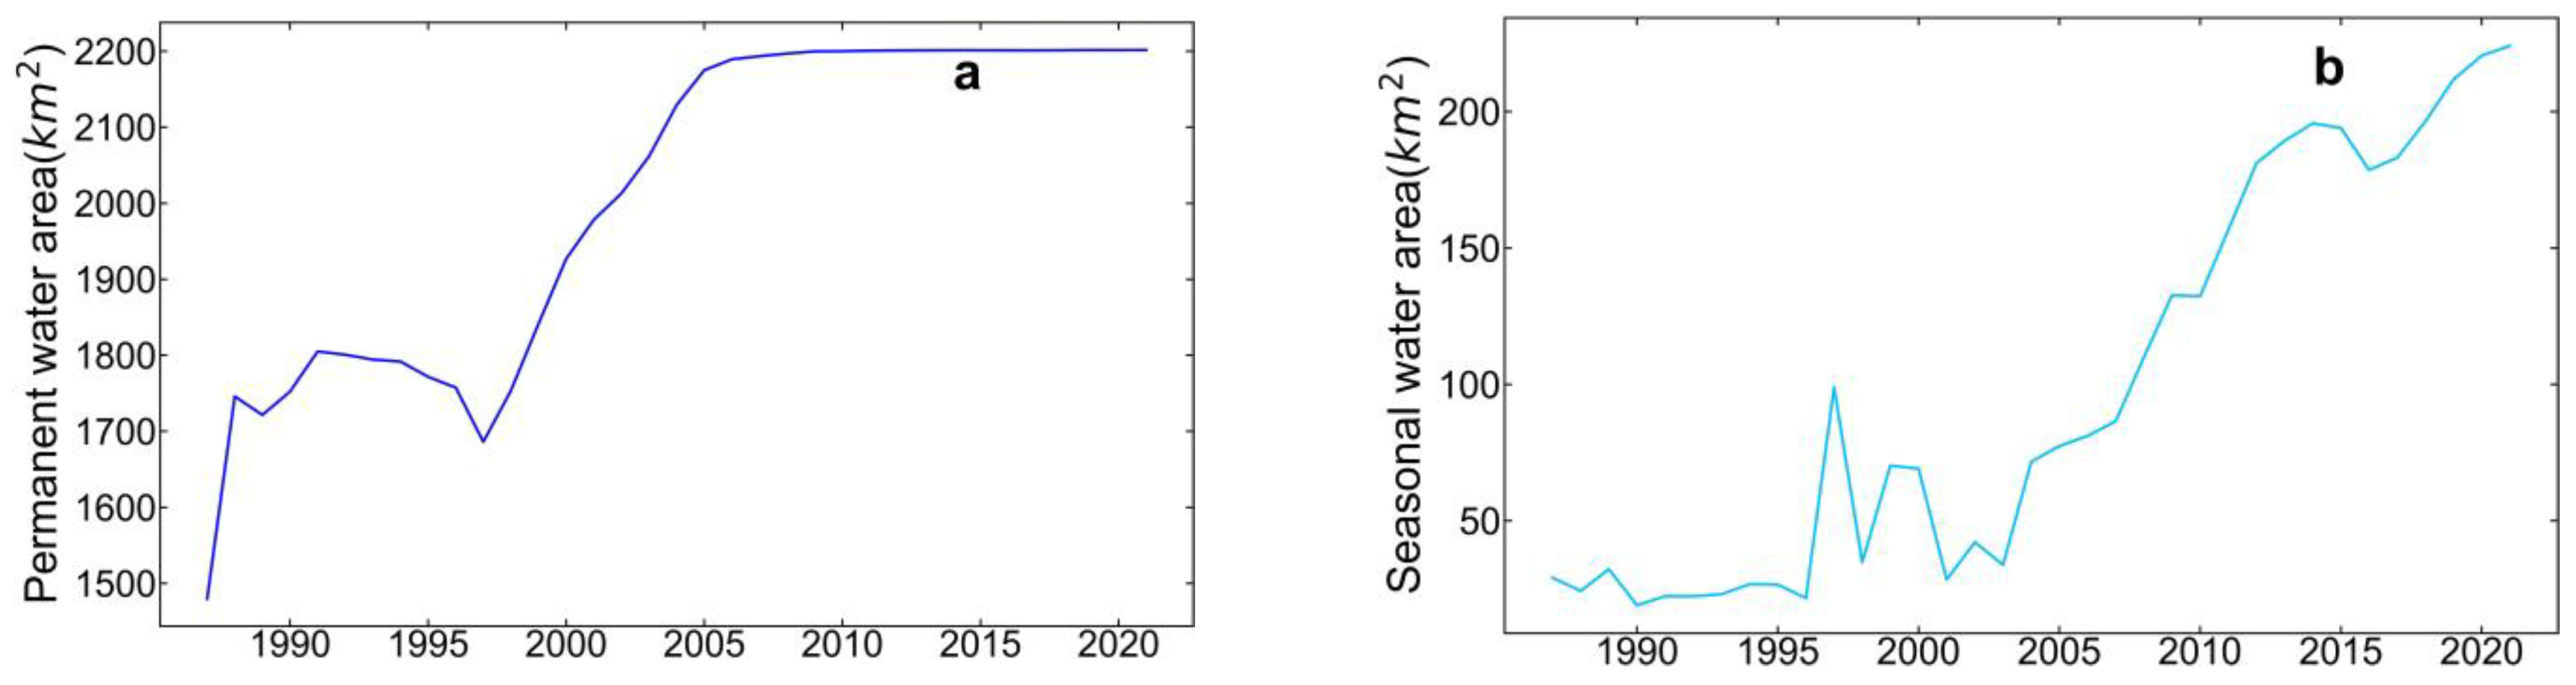
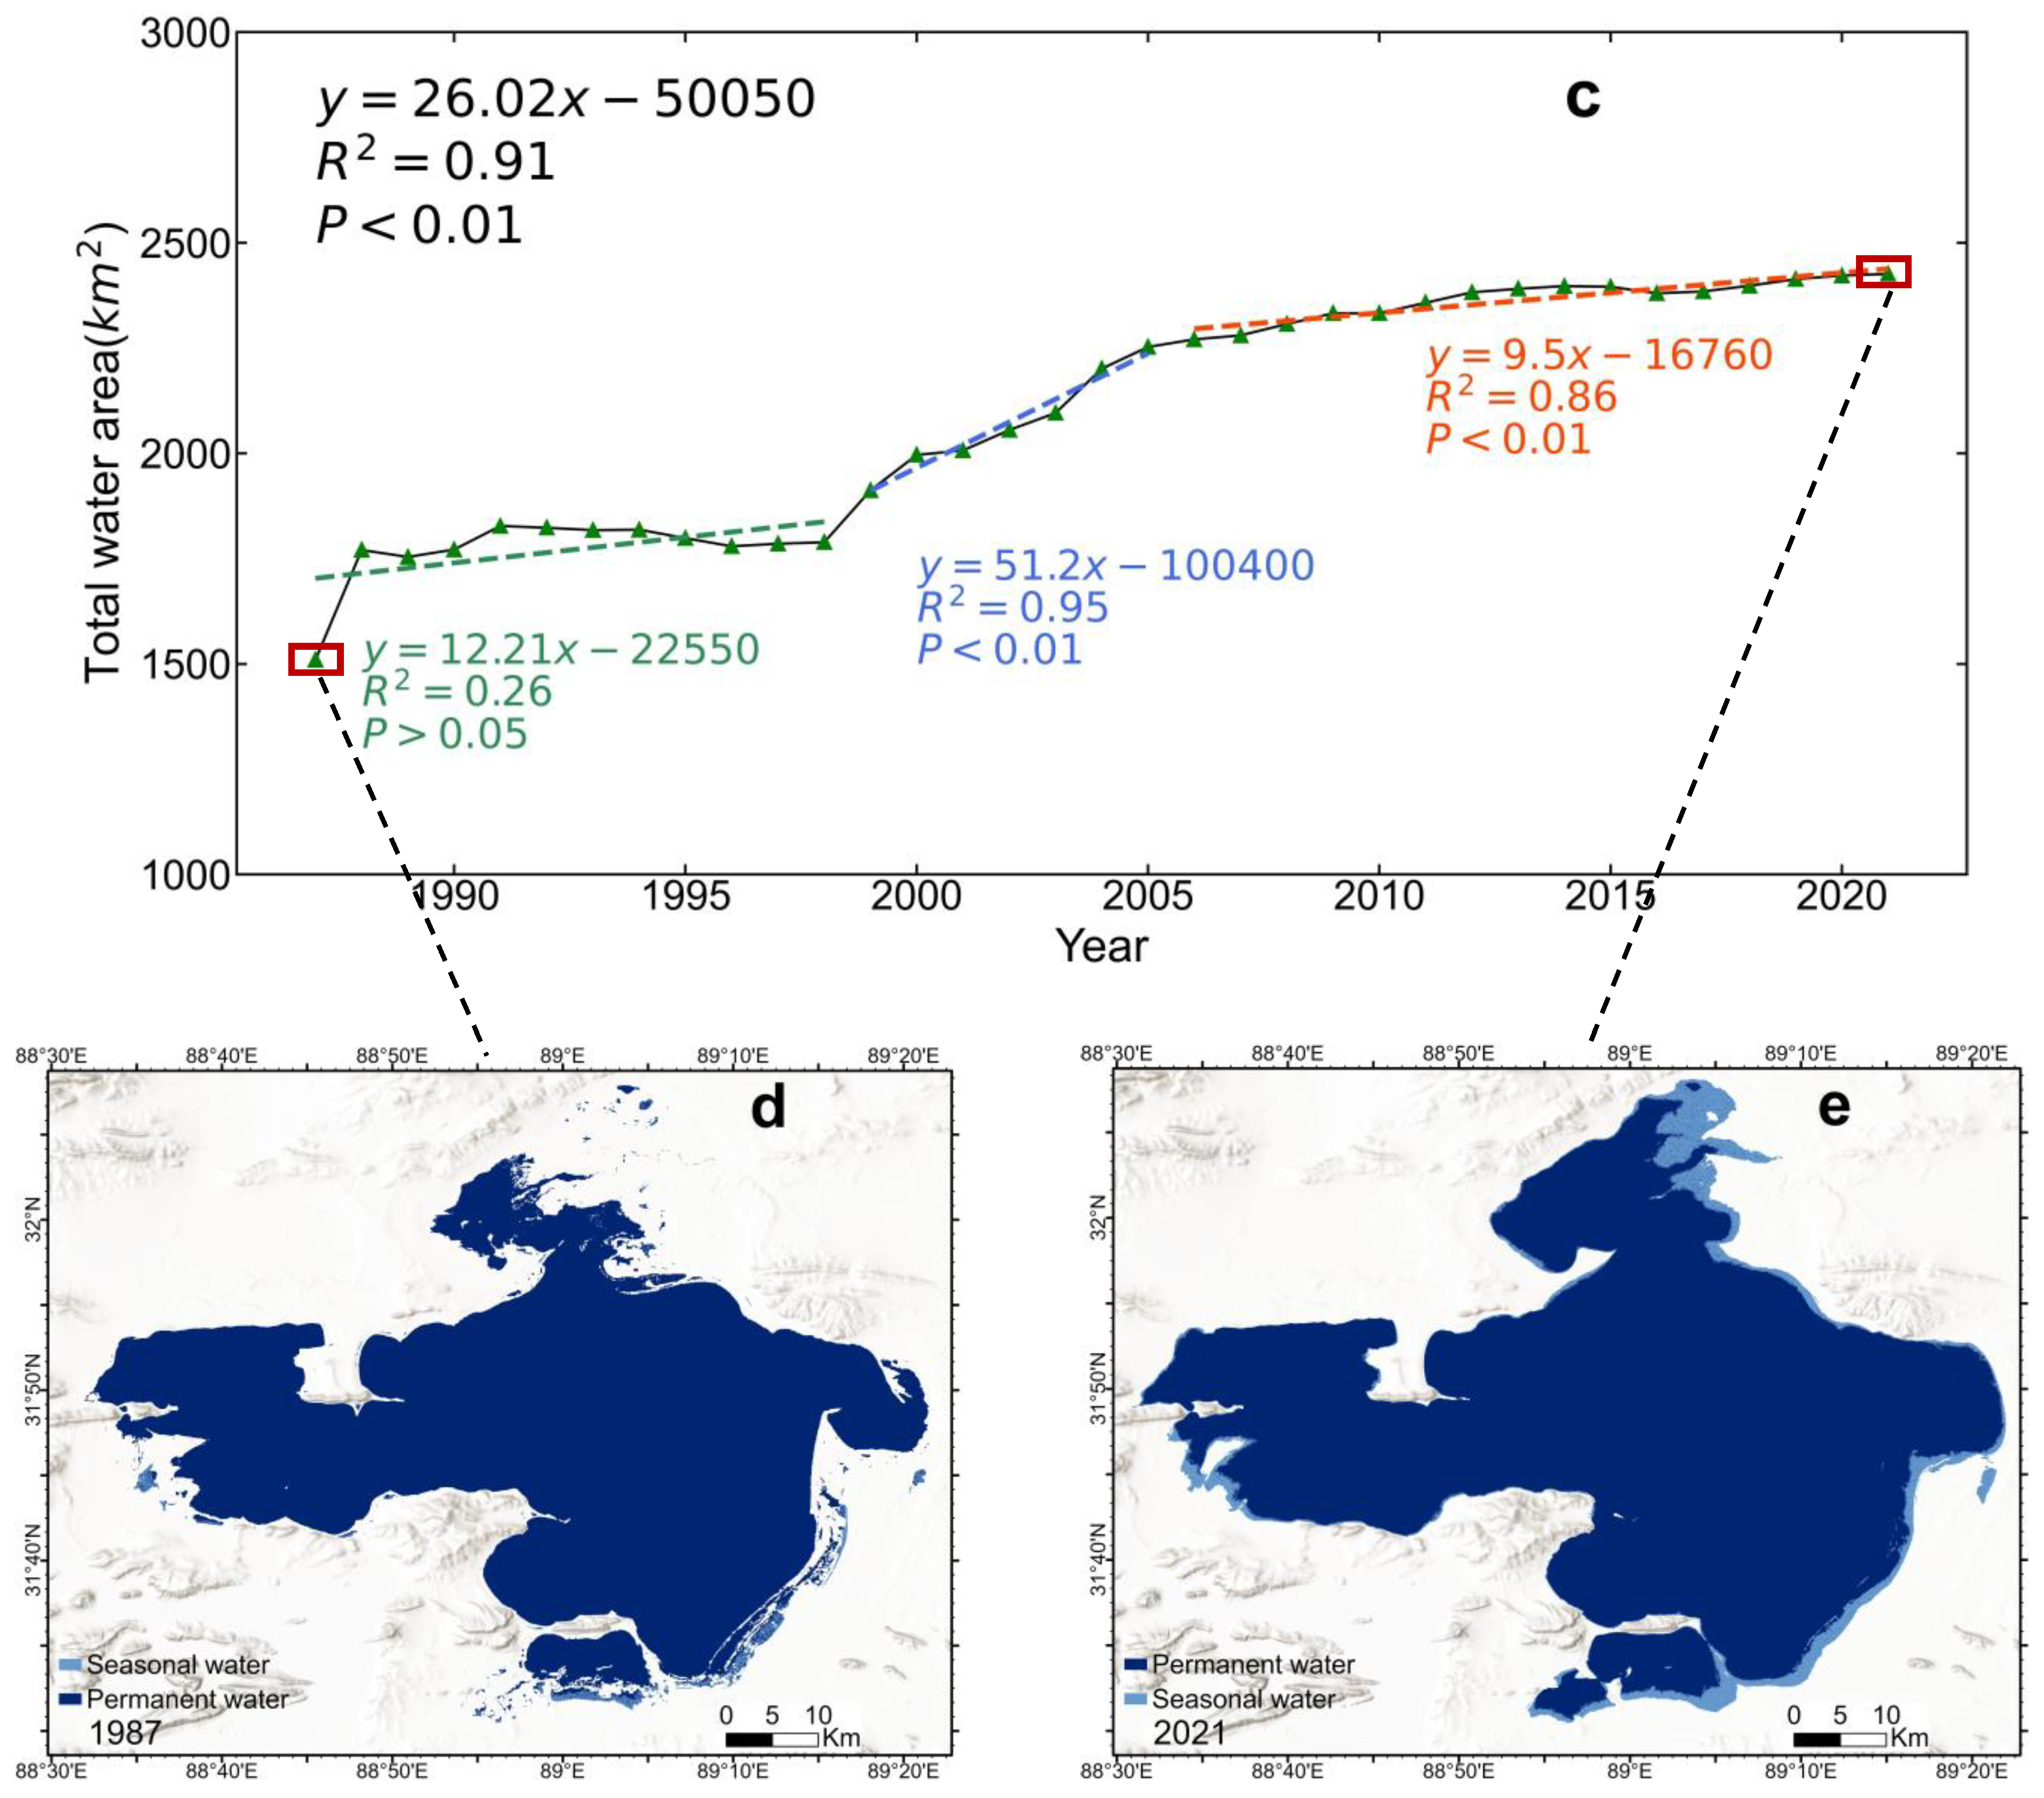
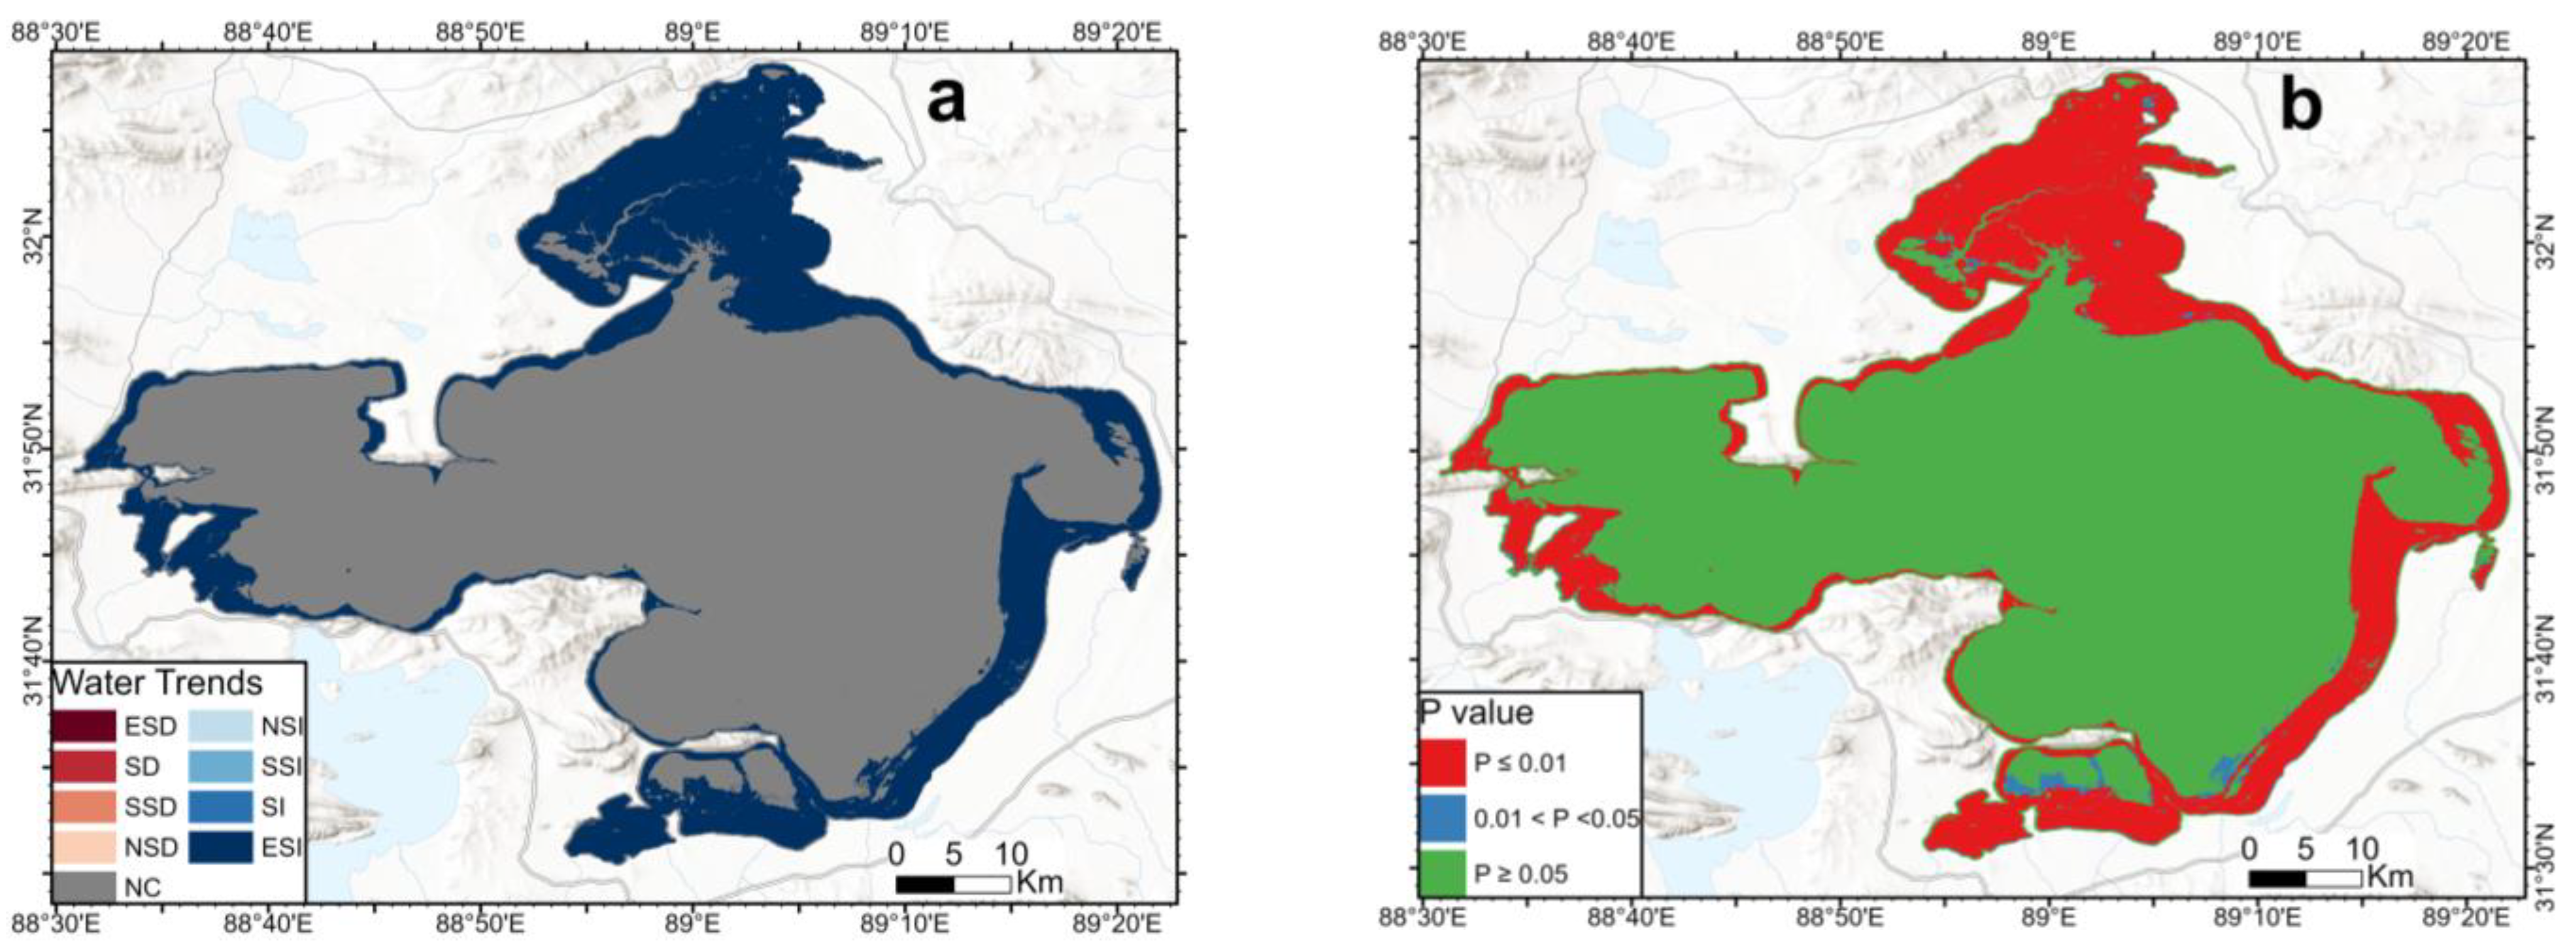
In this study, we collected a total of 983 Landsat images taken between 1987 and 2021, including 278 Landsat-5, 448 Landsat-7 and 257 Landsat-8 images, all of which had cloud cover of less than 20% and had undergone scaling and declouding processes in GEE. The spatial and temporal distributions of the images are shown in Figure 7. Subsequently, we extracted the water-inundation area of Seling Co Lake and finally used the modified water frequency model proposed in this study to reconstruct the water-inundation area from 1987 to 2021 and analyze the spatial and temporal changes. Figure 8 shows the temporal variation in the lake water area from 1987 to 2021. Figure 8c shows that the overall water area of Seling Co Lake showed a gentle growth trend from 1987 to 2021, with an average annual growth rate of 26.02 km2·year−1 (p < 0.01), and the maximum and minimum water areas were 2425.70 km2 in 2021 and 1508.91 km2 in 1987, respectively. In particular, the permanent and seasonal water-inundation areas showed different growth rates; the permanent and seasonal water-inundation areas were 1479.76 km2 and 29.15 km2, respectively, in 1987 and 2201.55 km2 and 224.15 km2, respectively, in 2021, exhibiting increases of 721.79 km2 (48.78%) and 195.00 km2 (668.95%), respectively (Figure 8a,b). Furthermore, the expansion of Seling Co Lake could be divided into three stages: 1987–1998, 1999–2005 and 2006–2021. The second stage (1999–2005) had the fastest growth rate of 51.2 km2·year−1 (p < 0.01); the water area increased from 1911.91 km2 (1999) to 2252.38 km2 (2005), for an increase of 17.81% (340.47 km2). The slowest growth rate was found in the third stage at 9.5 km2·year−1 (p < 0.01), rising from 2270.38 km2 (2006) to 2425.70 km2 (2021), an increase of 6.84% (155.32 km2). Figure 8d,e show that obvious expansion occurred in two directions, in the northern and southern regions of Seling Co Lake. Figure 9a shows that the water area of Seling Co Lake grew slowly or was unchanged overall without exhibiting any decreasing trend from 1987 to 2021 but expanded rapidly in the northern and southern directions; this finding also conforms to the change rule shown in Figure 8.
4. Discussion
4.1. Expansion of the Water-Inundation Area of Seling Co Lake
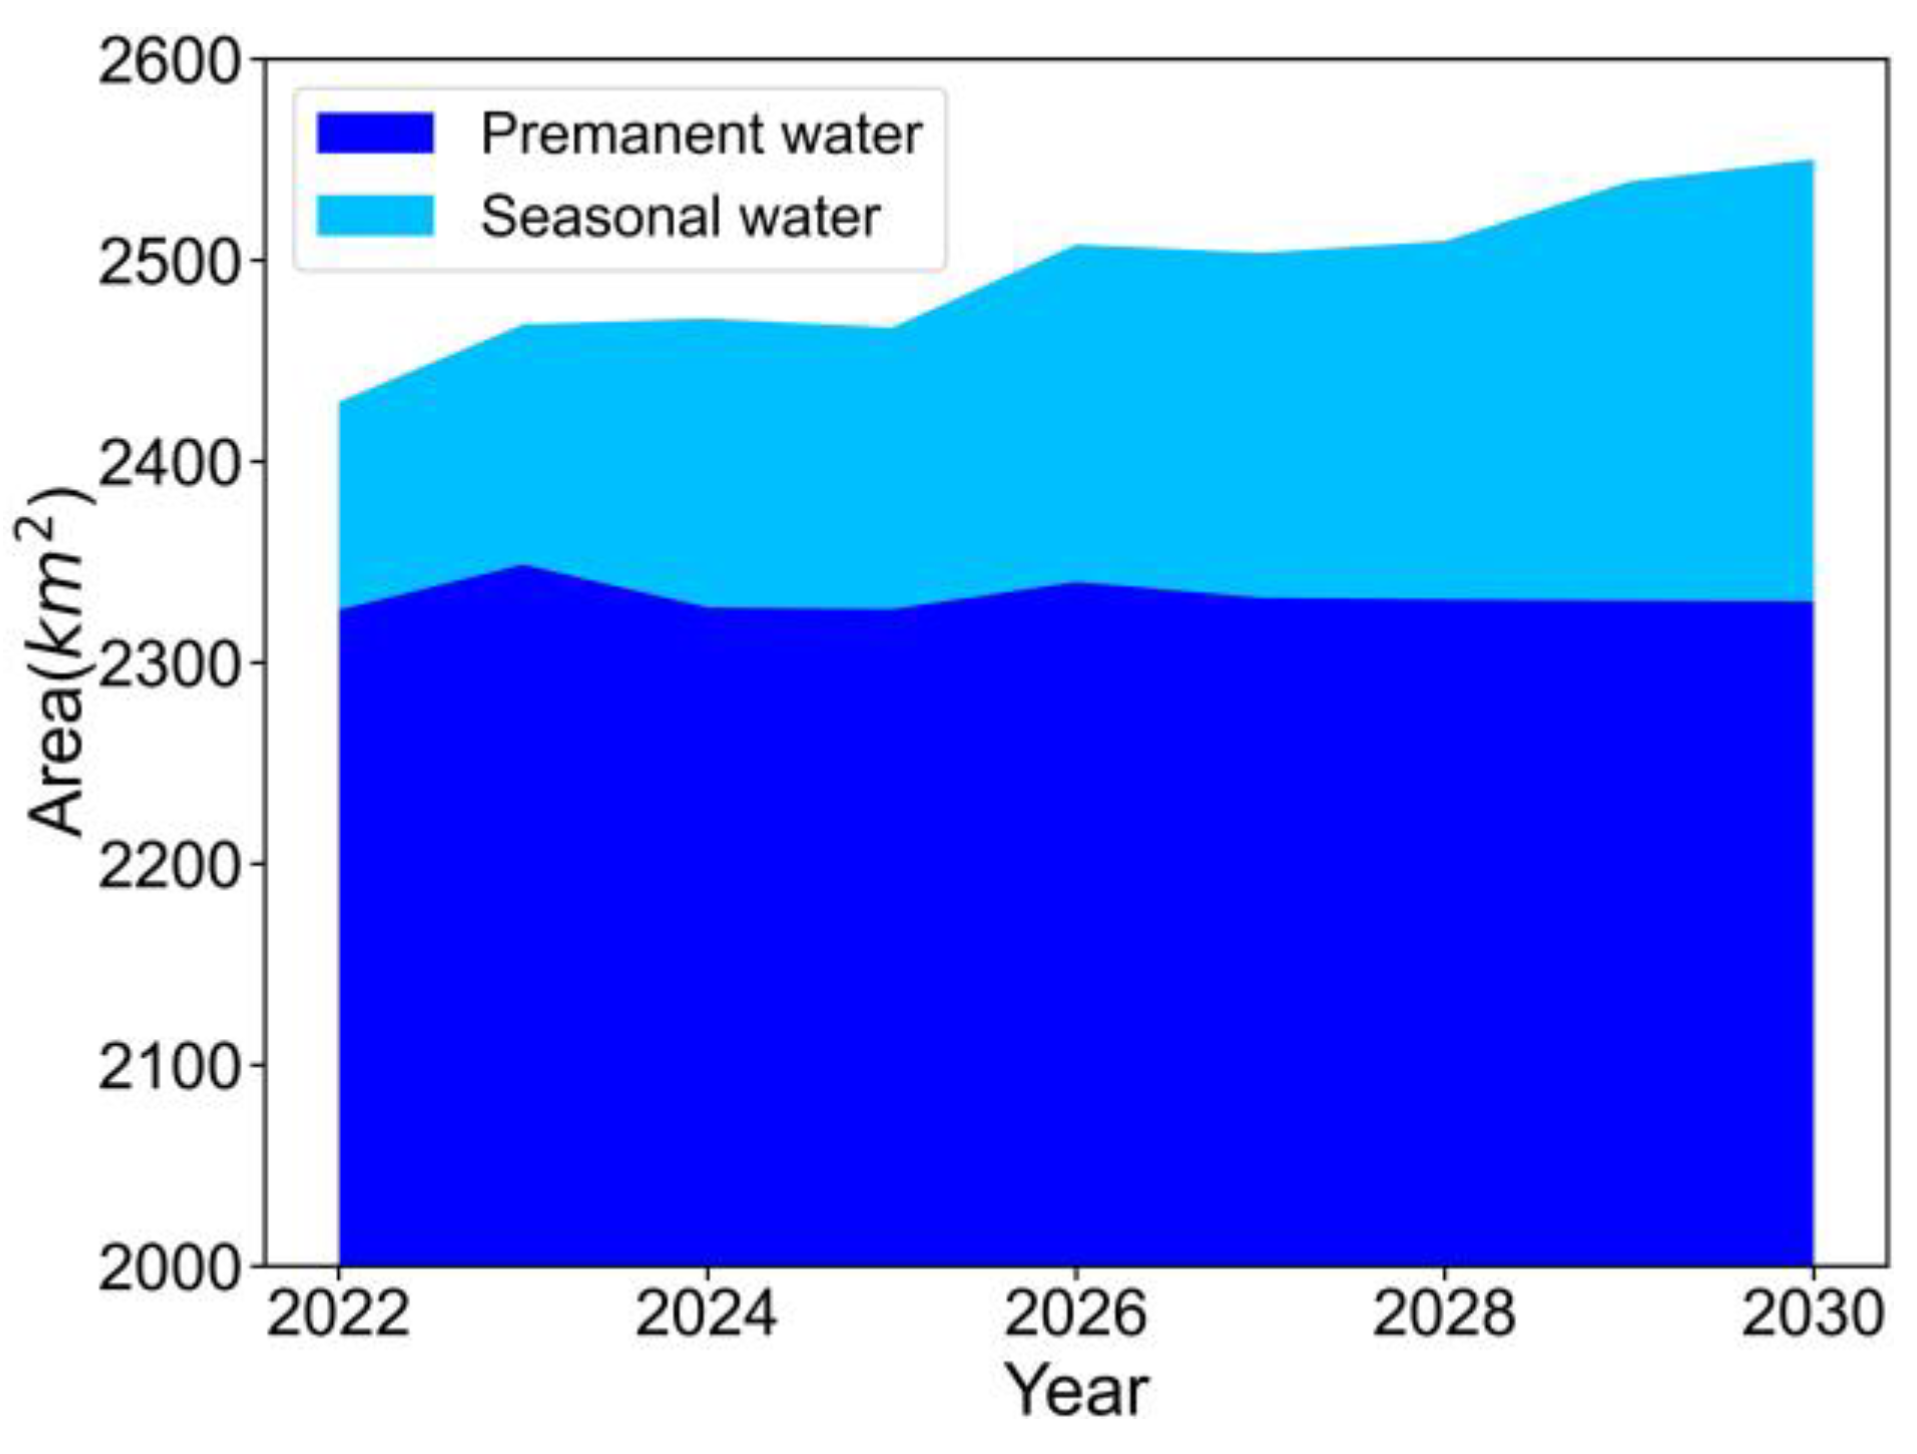
In this study, we obtained the lowest and highest lake water levels in each year for consecutive years from 1987 to 2021, simulated the lake level trend and then predicted the future lake area changes of Seling Co Lake between 2022 and 2030. Consequently, the lake water level data were used to predict the elevation change of the lake surface from 2022 to 2030, and the permanent and seasonal water-inundation areas were estimated using the reconstruction model described in Section 2.3.3. Figure 10 shows that the permanent water-inundation area of Seling Co Lake will basically be in a state of steady change, especially after 2026, and the permanent water-inundation area will remain basically unchanged. The seasonal water-inundation area is expected to maintain an upward trend during the same period. Therefore, combined with the findings obtained in Section 3.4, it can be concluded that the expansion trend of Seling Co Lake will gradually decline in the future, and these changes will mainly be focused on the seasonal water-inundation area, while the permanent water-inundation area is not expected to change extensively.
4.2. Comparison of the Areal Changes of Seling Co Lake with the Findings of Previous Studies
Many studies have carried out the area-change monitoring of Seling Co Lake based on different remote sensing data and different methods [23,38,48,49,50]. Laba et al. [49] used medium-resolution Earth-Observation System (EOS)/Moderate-resolution Imaging Spectroradiometer (MODIS) observation data to construct the time-series changes in the area of Seling Co Lake during the nonglacial period from 2002 to 2009. The lake area increased to 2197.46 km2 in 2009; during this period, Seling Co Lake expanded significantly southward, and, as of 2009, it was connected to the adjacent Yakgen Tsatso Lake to the south. Wenhui Liu et al. [48] analyzed the temporal and spatial changes in the area of Seling Co Lake and the small surrounding lakes from 1988 to 2017 based on high-spatial-resolution Landsat images. While the growth rate was slow from 1988 to 1997, from 1997 to 2005, the growth rate accelerated, and from 2005 to 2017, the growth rate became flat again; in these three periods, the lake area increased by 27.11 km2, 510.53 km2 and 148.16 km2, respectively. In terms of spatial changes, the main growth regions were concentrated in the northern and southern directions, and the largest expansion distance was 146.7 m, which appeared in the northern region of Seling Co Lake. Although Landsat data have a high spatial resolution (30 m), they are often affected by clouds, snow and shadows, resulting in missing data; MODIS images have a lower spatial resolution than that of Landsat sensors (250 m or 1 km), which may lead to poor results. Therefore, Hao Guibin et al. [38] used the Enhanced Spatial and Temporal Adaptive Reflectance Fusion Model (ESTARFM) based on MODIS remote sensing data to predict Landsat data after 2000 and combined the results with auxiliary data to analyze the temporal and spatial changes in the area of Seling Co Lake from 1976 to 2014. Over the past 40 years, the lake has been in a state of continuous expansion and has shown a relatively significant expansion trend, with an average annual growth rate of approximately 18.73 km2. The changes in the area of the lake occurred in three stages characterized by a stable-rapid-stable trend. The results obtained in this study with regard to the temporal and spatial variations in the area of Seling Co Lake are basically consistent with the above research results. For example, in this study, we also drew a steady-rapid-smooth growth-stage trend in the time-series changes in the area of Seling Co Lake; regarding the spatial changes, the growth was mainly concentrated to the northern and southern directions, and the most significant expansion occurred in the northern region of Seling Co Lake.
4.3. Model Deficiencies and Improvenments
First, in the process of selecting DEM data for use in this study, four kinds of data, including an Advanced Land-Observing Satellite (ALOS) DEM, SRTM DEM, Advanced Spaceborne Thermal Emission and Reflection Radiometer Global DEM (ASTER GDEM) V3 and NASA DEM, were selected as candidate data. The SRTM DEM and ASTER GDEM datasets cover the Qinghai-Tibet Plateau relatively comprehensively, and some studies have shown that the accuracy of these two digital elevation products in the Chinese region is better than the nominal data accuracy [51,52]. However, on the Tibetan Plateau, the accuracy of the SRTM DEM data is better than that of the ASTER GDEM data, and the SRTM images are less affected by topographic factors [53]. Therefore, the high-accuracy SRTM DEM data were selected as the basic data to construct the model in this study. In the process of data screening, abnormal data appeared in some years, so we used the data of adjacent years to replace these abnormal values; however, many uncertain factors still affected the image-generalization ability and accuracy of the model. Second, after the construction of the model, GEE was used to extract the water range of Seling Co Lake from 1987 to 2021 based on Landsat data. Because Seling Co Lake is located on the Qinghai-Tibet Plateau and the time series of this study was long, missing images arose during the image-screening process, so Landsat images could not cover the whole study area and were mainly concentrated within the scope of the Landsat-5 TM dataset. Finally, the decision tree framework was constructed via multiple threshold segmentation based on the Edge Otsu algorithm to extract the water body information; this framework and index were determined to be the optimal choices after many experiments, but the phenomenon of transition segmentation remained and affected the extraction of the water body range. Therefore, a variety of DEM data should be integrated in subsequent research to improve the topographic factor extraction accuracy. In addition, relatively high-accuracy Sentinel data were integrated when determining the inundation range of the lake, and the algorithm framework applied for the water body extraction was optimized to weaken the phenomenon of excessive segmentation during the inundation range extraction process.
5. Conclusions
In this study, we aimed to reconstruct the water range of Seling Co Lake and monitor the dynamic changes in the lake water level. Thus, we proposed a method in which terrain data were used to restore the water frequency data. The results show that the reconstruction model constructed in this study achieved excellent results with regard to the validation data representing 2020 and 2021, when the R2 value obtained between the predicted and real values reached 0.9 and 0.93, respectively. Moreover, in the subsequent verification of the block model, although the R2 value did not improve extensively, the RMSE and MAE error indices were significantly improved compared to those of the ensemble model. Subsequently, the water-frequency reconstruction model was used to repair the water frequency information, and the reconstruction effect was obvious. The pixels with values of 0 in the northern region of Seling Co Lake were re-estimated and removed, and the striping phenomenon observed in the western and central regions of the lake was repaired and reconstructed.
Based on long-term Landsat data, the water body range of Seling Co Lake from 1987 to 2021 was extracted on the GEE platform, and the lake water level over the years was extracted based on the extracted water body range. Then, the slope data within the flooded range were assessed for each year. Taking the lake water level and slope as input data, the water frequency reconstruction model was used to calculate the water frequency information over the years. Finally, the equivalent water area during each year was calculated according to the water frequency, and the temporal and spatial changes in the lake area were analyzed. The results showed that the overall water area of Seling Co Lake showed an increasing trend from 1987 to 2021, with an average annual growth rate of 26.02 km2·year−1 (p < 0.01); the maximum and minimum lake water areas were 2425.70 km2 in 2021 and 1508.91 km2 in 1987, respectively. In terms of spatial variations, the water body of Seling Co Lake mainly expanded to the northern and southern directions during the study period, and this growth was mainly concentrated northward.
This study proposes an effective method for reconstructing lake water information based on water-inundation frequency data and DEM data; the proposed method can reconstruct the lake water extent in the case of missing remote sensing data or under the condition of severely degraded external images and provides a reliable reference method for the water resource management of Seling Co Lake and the areal monitoring of other highland lakes. In subsequent research, we will focus on improving the accuracy of DEM data, expanding the scope of the study area and improving the generalization ability of the reconstructed model.
Author Contributions
P.L. led manuscript writing and contributed to data analysis, model design and research design. H.J. supervised this study, contributed to research design, manuscript writing and the discussion of the results and served as the corresponding author. D.Z. contributed to data analysis, model design and manuscript design. Q.L. and J.T. contributed to data analysis. W.L. contributed to funding acquisition. All authors have read and agreed to the published version of the manuscript.
Funding
This research was funded by the National Natural Science Foundation of China (Grant No. 42201328) and the Key Scientific Research Project of Henan higher education institutions (Grant No. 23A170016).
Data Availability Statement
Not applicable.
Conflicts of Interest
The authors declare no conflict of interest.
References
- Zhang, G.Q.; Wang, M.M.; Zhou, T. Progress in remote sensing monitoring of lake area, water level, and volume changes on the Tibetan Plateau. Natl. Remote Sens. Bull. 2022, 26, 115–125. [Google Scholar]
- Zhu, J.; Song, C.; Wang, J.; Ke, L. China’s Inland Water Dynamics: The Significance of Water Body Types. Proc. Natl. Acad. Sci. USA 2020, 117, 13876–13878. [Google Scholar] [CrossRef]
- Cooley, S.W.; Ryan, J.C.; Smith, L.C. Human Alteration of Global Surface Water Storage Variability. Nature 2021, 591, 78–81. [Google Scholar] [CrossRef]
- Woolway, R.I.; Jennings, E.; Shatwell, T.; Golub, M.; Pierson, D.C.; Maberly, S.C. Lake Heatwaves under Climate Change. Nature 2021, 589, 402–407. [Google Scholar] [CrossRef]
- Song, C.Q.; Zhan, P.F.; Ma, R.H. Progress in remote sensing study on lake hydrological. J. Lake Sci. 2020, 32, 1406–1420. [Google Scholar]
- Zhang, G.; Yao, T.; Chen, W.; Zheng, G.; Shum, C.K.; Yang, K.; Piao, S.; Sheng, Y.; Yi, S.; Li, J.; et al. Regional Differences of Lake Evolution across China during 1960s–2015 and Its Natural and Anthropogenic Causes. Remote Sens. Environ. 2019, 221, 386–404. [Google Scholar] [CrossRef]
- Duan, H.T.; Cao, Z.G.; Shen, M. Review of lake remote sensing research. Natl. Remote Sens. Bull. 2022, 26, 3–18. [Google Scholar]
- China’s lakes at present: Number, area and spatial distribution. Sci. China Earth Sci. 2011, 54, 283–289. [CrossRef]
- Zhang, G.; Luo, W.; Chen, W.; Zheng, G. A robust but variable lake expansion on the Tibetan Plateau. Sci. Bull. 2019, 64, 1306–1309. [Google Scholar] [CrossRef] [Green Version]
- Zhang, W.S.; Song, C.Q. Spatial distribution and dynamics of lakes in China: Progress in remote sensing monitoring at national scale and new inventory of the maximum lake extent and change trajectory. Natl. Remote Sens. Bull. 2022, 26, 92–103. [Google Scholar]
- Liu, C.; Zhu, L.; Li, J.; Wang, J.; Ju, J.; Qiao, B.; Ma, Q.; Wang, S. The Increasing Water Clarity of Tibetan Lakes over Last 20 Years According to MODIS Data. Remote Sens. Environ. 2021, 253, 112199. [Google Scholar] [CrossRef]
- Pi, X.; Feng, L.; Li, W.; Liu, J.; Kuang, X.; Shi, K.; Qi, W.; Chen, D.; Tang, J. Chlorophyll-a Concentrations in 82 Large Alpine Lakes on the Tibetan Plateau during 2003–2017: Temporal–Spatial Variations and Influencing Factors. Int. J. Digit. Earth 2021, 14, 714–735. [Google Scholar] [CrossRef]
- Yang, K.; Ye, B.; Zhou, D.; Wu, B.; Foken, T.; Qin, J.; Zhou, Z. Response of Hydrological Cycle to Recent Climate Changes in the Tibetan Plateau. Clim. Chang. 2011, 109, 517–534. [Google Scholar] [CrossRef]
- Yao, T.; Wu, F.; Ding, L.; Sun, J.; Zhu, L.; Piao, S.; Deng, T.; Ni, X.; Zheng, H.; Ouyang, H. Multispherical Interactions and Their Effects on the Tibetan Plateau’s Earth System: A Review of the Recent Researches. Natl. Sci. Rev. 2015, 2, 468–488. [Google Scholar] [CrossRef]
- Bian, D.; Bian, B.R.C.; La, B.; Wang, C.Y.; Chen, T. The Response of Water Level of Selin Co to Climate Change during 1975–2008. J. Geogr. Sci. 2010, 65, 313–319. [Google Scholar]
- Meng, K.; Shi, X.H.; Wang, E.Q.; Liu, F. High-altitude salt lake elevation changes and glacial ablation in Central Tibet, 2000–2010. Chin. Sci. Bull. 2012, 57, 668–676. [Google Scholar] [CrossRef] [Green Version]
- Hu, L.; Wang, J.; Ju, J.; Ma, N.; Zhang, Y.; Liu, C.; Han, B.; Liu, L.; Wang, M.; Ma, Q. Climatic and Lake Environmental Changes in the Serling Co Region of Tibet over a Variety of Timescales. Sci. Bull. 2019, 64, 422–424. [Google Scholar] [CrossRef] [Green Version]
- Zhang, G.; Ran, Y.; Wan, W.; Luo, W.; Chen, W.; Xu, F.; Li, X. 100 Years of Lake Evolution over the Qinghai–Tibet Plateau. Earth Syst. Sci. Data 2021, 13, 3951–3966. [Google Scholar] [CrossRef]
- Zhou, J.; Wang, L.; Zhang, Y.; Guo, Y.; Li, X.; Liu, W. Exploring the Water Storage Changes in the Largest Lake (Selin Co) over the Tibetan Plateau during 2003–2012 from a Basin-Wide Hydrological Modeling. Water Resour. Res. 2015, 51, 8060–8086. [Google Scholar] [CrossRef] [Green Version]
- Ding, J.; Zhang, Y.; Guo, Y.; Ma, N. Quantitative Comparison of River Inflows to a Rapidly Expanding Lake in Central Tibetan Plateau. Hydrol. Process. 2018, 32, 3241–3253. [Google Scholar] [CrossRef]
- Dong, S.Y.; Xue, X.; You, J.G.; Peng, F. Remote sensing monitoring of the lake area change in the Qinghai-Tibet Plateau in recent 40 years. J. Lake Sci. 2014, 26, 535–544. [Google Scholar]
- De, J.Y.Z.; Ni, M.J.; Qiang, B.O.Z.; Zeng, L.; Luo, S.Q.Z. Lake Area Variation of Selin Tso in 1975~2016 and Its Influential Factors. Plateau Mt. Meteorol. Res. 2018, 38, 35–41+96. [Google Scholar]
- Panagoulia, D.; Bárdossy, A.; Lourmas, G. Multivariate Stochastic Downscaling Models for Generating Precipitation and Temperature Scenarios of Climate Change Based on Atmospheric Circulation. Glob. Nest J. 2008, 10, 263–272. [Google Scholar]
- Li, L.; Yang, S.; Wang, Z.; Zhu, X.; Tang, H. Evidence of Warming and Wetting Climate over the Qinghai-Tibet Plateau. Arct. Antarct. Alp. Res. 2010, 42, 449–457. [Google Scholar] [CrossRef]
- Chen, S.; Liu, W.; Ye, T. Dataset of Trend-Preserving Bias-Corrected Daily Temperature, Precipitation and Wind from NEX-GDDP and CMIP5 over the Qinghai-Tibet Plateau. Data Brief 2020, 31, 105733. [Google Scholar] [CrossRef]
- Cao, J.; Qin, D.; Kang, E.; Li, Y. River Discharge Changes in the Qinghai-Tibet Plateau. Chin. Sci. Bull. 2006, 51, 594–600. [Google Scholar] [CrossRef]
- Bohn, V.Y.; Perillo, G.M.E.; Piccolo, M.C. Distribution and morphometry of shallow lakes in a temperate zone (Buenos Aires Province, Argentina). Limnética 2011, 30, 0089–0102. [Google Scholar] [CrossRef]
- Liu, X.-J.; Lai, Z.-P.; Zeng, F.-M.; Madsen, D.B.; E, C.-Y. Holocene Lake Level Variations on the Qinghai-Tibetan Plateau. Int. J. Earth Sci. 2013, 102, 2007–2016. [Google Scholar] [CrossRef]
- Fouache, E.; Desruelles, S.; Magny, M.; Bordon, A.; Oberweiler, C.; Coussot, C.; Touchais, G.; Lera, P.; Lézine, A.-M. DEM and GIS as a Tool for Holocene Palaeogeographical Reconstructions from Lake Maliq (Abania, Basin of Korçë). J. Archaeol. Sci. 2010, 37, 525–535. [Google Scholar] [CrossRef] [Green Version]
- Luo, Z.; Liu, K.; Zhang, C.K.; Deng, X.Y.; Ma, R.H.; Song, C.Q. Progress of the DEM Application for studing lake hydrology dynamics. J. Geo-Inf. Sci. 2020, 22, 1510–1521. [Google Scholar]
- Jiang, Q.; Ma, Q.; Zhou, T. Reconstruction of Ulungur Ancient Large Lake Based on DEM. In Proceedings of the 2nd International Conference on Information Science and Engineering, Hangzhou, China, 4–6 December 2010; pp. 6793–6795. [Google Scholar]
- Buckles, J.E.; Kashiwase, K.; Krantz, T. Reconstruction of Prehistoric Lake Cahuilla in the Salton Sea Basin Using GIS and GPS. Hydrobiologia 2002, 473, 55–57. [Google Scholar] [CrossRef]
- Le Coz, M.; Delclaux, F.; Genthon, P.; Favreau, G. Assessment of Digital Elevation Model (DEM) Aggregation Methods for Hydrological Modeling: Lake Chad Basin, Africa. Comput. Geosci. 2009, 35, 1661–1670. [Google Scholar] [CrossRef]
- Qiao, C.; Luo, J.C.; Sheng, Y.W.; Shen, Z.F.; Li, J.L.; Gao, L.J. Analysis on lake changes since ancient and modern ages using remote sensing in Dagze Co, Tibetanm Plateau. J. Lake Sci. 2010, 22, 98–102. [Google Scholar]
- Nie, Y.; Sheng, Y.; Liu, Q.; Liu, L.; Liu, S.; Zhang, Y.; Song, C. A Regional-Scale Assessment of Himalayan Glacial Lake Changes Using Satellite Observations from 1990 to 2015. Remote Sens. Environ. 2017, 189, 152–163. [Google Scholar] [CrossRef] [Green Version]
- Park, E.; Lewis, Q.W.; Sanwlani, N. Large Lake Gauging Using Fractional Imagery. J. Environ. Manag. 2019, 231, 687–693. [Google Scholar] [CrossRef]
- Zhu, C.M.; Zhang, X.; Lu, M.; Luo, J.C. Lake Storage Change Automatic Detection by Multi-source Remote Sensing without Under water Terrain Data. Acta Geod. Cartogr. Sin. 2015, 44, 309–315. [Google Scholar]
- Hao, G.B.; Wu, B.; Zhang, L.F.; Fu, D.J.; Li, Y. Temporal and spatial variation analysis of the area of Siling Co lake in Tibet based on ESTARFM. Journal of Geo-information. Science 2016, 18, 833–846. [Google Scholar]
- Tai, X.M.; Wang, N.L.; Wu, Y.W.; Zhang, Y.J. Lake ice phenology variations and influencing factors of Selin Co from 2000 to 2020. J. Lake Sci. 2022, 34, 334–348. [Google Scholar]
- Yang, R.H.; Yu, X.Z.; Li, Y.L. The Dynamic Analysis of Remote Sensing Information for Monitoring the Expansion of the Selincuo Lake in Tibet. Remote Sens. Land Resour. 2003, 15, 64–67. [Google Scholar]
- Gorelick, N.; Hancher, M.; Dixon, M.; Ilyushchenko, S.; Thau, D.; Moore, R. Google Earth Engine: Planetary-Scale Geospatial Analysis for Everyone. Remote Sens. Environ. 2017, 202, 18–27. [Google Scholar] [CrossRef]
- Pickens, A.H.; Hansen, M.C.; Hancher, M.; Stehman, S.V.; Tyukavina, A.; Potapov, P.; Marroquin, B.; Sherani, Z. Mapping and Sampling to Characterize Global Inland Water Dynamics from 1999 to 2018 with Full Landsat Time-Series. Remote Sens. Environ. 2020, 243, 111792. [Google Scholar] [CrossRef]
- Allen, G.H.; Yang, X.; Gardner, J.; Holliman, J.; David, C.H.; Ross, M. Timing of Landsat Overpasses Effectively Captures Flow Conditions of Large Rivers. Remote Sens. 2020, 12, 1510. [Google Scholar] [CrossRef]
- Yao, F.; Wang, C.; Dong, D.; Luo, J.; Shen, Z.; Yang, K. High-Resolution Mapping of Urban Surface Water Using ZY-3 Multi-Spectral Imagery. Remote Sens. 2015, 7, 12336–12355. [Google Scholar] [CrossRef] [Green Version]
- Donchyts, G.; Schellekens, J.; Winsemius, H.; Eisemann, E.; Van de Giesen, N. A 30 m Resolution Surface Water Mask Including Estimation of Positional and Thematic Differences Using Landsat 8, SRTM and OpenStreetMap: A Case Study in the Murray-Darling Basin, Australia. Remote Sens. 2016, 8, 386. [Google Scholar] [CrossRef]
- Liu, Z.; Wang, H.; Li, N.; Zhu, J.; Pan, Z.; Qin, F. Spatial and Temporal Characteristics and Driving Forces of Vegetation Changes in the Huaihe River Basin from 2003 to 2018. Sustainability 2020, 12, 2198. [Google Scholar] [CrossRef] [Green Version]
- Jiang, W.; Yuan, L.; Wang, W.; Cao, R.; Zhang, Y.; Shen, W. Spatio-Temporal Analysis of Vegetation Variation in the Yellow River Basin. Ecol. Indic. 2015, 51, 117–126. [Google Scholar] [CrossRef]
- Liu, W.; Liu, H.; Xie, C.; Liu, G.; Wang, W.; Zhang, Q.; Zhang, Q. Dynamic Changes in Lakes within the Selin Co Basin and Potential Drivers in Tibet; Research Square: Durham, NC, USA, 2021. [Google Scholar]
- La, B.; Chen, T.; La, B.Z.M.; Ci, Z. Area change of Selincuo Lake and its forming reasons based on MODIS data. J. Meteorol. Environ. 2011, 27, 69–72. [Google Scholar]
- Song, Y.Z.; De, J.Y.Z. Variation characteristics of lake area of Silingco and its response to climate change in recent 30 years. J. Nanjing Univ. Inf. Sci. Technol. (Nat. Sci. Ed.) 2022, 1–14. Available online: http://kns.cnki.net/kcms/detail/32.1801.N.20220426.1127.004.html (accessed on 17 October 2022).
- Hu, J.P.; Guan, X.R.; Liu, X.J. Spatial Distribution of SRTM DEM and ASTER GDEM Error in China. Natl. Remote Sens. Bull. 2017, 33, 28–33. [Google Scholar]
- Tang, X.M.; Li, S.J.; Li, T.; Gao, Y.D.; Zhang, S.H.; Chen, Q.F.; Zhang, X. Review on global digital elevation products. Natl. Remote Sens. Bull. 2021, 25, 167–181. [Google Scholar]
- Gao, Z.Y.; Xie, Y.L.; Wang, N.L.; Jiang, G.X.; Zhou, P. Response of Three Global DEM Dat Accuracy to Different Terrain Factors in Qinghai-Tibet Plateau. Bull. Soil Water Conserv. 2019, 39, 184–191. [Google Scholar] [CrossRef]
Figure 1.
Map of the study region.

Figure 2.
Workflow for reconstructing the area of Seling Co Lake.

Figure 3.
R2 distribution map of the water frequency versus slope and elevation.

Figure 4.
Results of model validation. Panel (a,d) show the predicted result of ensemble model in 2020 and 2021, respectively; panel (b,e) show the predicted effect before and after the demarcation line; panel (c,f) show the predicted result of block model.
Figure 4.
Results of model validation. Panel (a,d) show the predicted result of ensemble model in 2020 and 2021, respectively; panel (b,e) show the predicted effect before and after the demarcation line; panel (c,f) show the predicted result of block model.

Figure 5.
Results of the reconstruction of the water frequency data.

Figure 6.
Results of the detailed reconstructed data.

Figure 7.
Spatial (a) and temporal (b) distribution of the Landsat images used in this study.

Figure 8.
Time-series changes in the water area of Seling Co Lake. Panel (a) shows the temporal changes in the permanent water area from 1987 to 2021; panel (b) shows the seasonal water area changes; panel (c) shows the total water area of Selling Co Lake; and panels (d,e) show the spatial distributions of the permanent and seasonal water areas in 1987 and 2021, respectively.


Figure 9.
Spatial changes in the water area of Seling Co Lake. Panels (a,b) show the spatial changes in the area of the water body and the significance of these changes, respectively.
Figure 9.
Spatial changes in the water area of Seling Co Lake. Panels (a,b) show the spatial changes in the area of the water body and the significance of these changes, respectively.

Figure 10.
Predicted areal changes in the permanent and seasonal water levels of Seling Co Lake between 2022 and 2030.
Figure 10.
Predicted areal changes in the permanent and seasonal water levels of Seling Co Lake between 2022 and 2030.


Table 1.
MK test trend categories.
| Trend Type | Trend Feature | ||
|---|---|---|---|
| 4 | Extremely significant increase (ESI) | ||
| 3 | Significant increase (SI) | ||
| 2 | Slightly significant increase (SSI) | ||
| 1 | Non-significant increase (NSI) | ||
| 0 | No change (NC) | ||
| −1 | Non-significant decrease (NSD) | ||
| −2 | Slightly significant decrease (SSD) | ||
| −3 | Significant decrease (SD) | ||
| −4 | Extremely significant decrease (ESD) |
Publisher’s Note: MDPI stays neutral with regard to jurisdictional claims in published maps and institutional affiliations. |
© 2022 by the authors. Licensee MDPI, Basel, Switzerland. This article is an open access article distributed under the terms and conditions of the Creative Commons Attribution (CC BY) license (https://creativecommons.org/licenses/by/4.0/).
Share and Cite
MDPI and ACS Style
Liu, P.; Jing, H.; Zhang, D.; Tang, J.; Liu, Q.; Luan, W. Contribution of the Reconstruction of the Area of Seling Co Lake Using DEM Data and Analysis of Spatio-Temporal Variations. Water 2022, 14, 3599. https://doi.org/10.3390/w14223599
AMA Style
Liu P, Jing H, Zhang D, Tang J, Liu Q, Luan W. Contribution of the Reconstruction of the Area of Seling Co Lake Using DEM Data and Analysis of Spatio-Temporal Variations. Water. 2022; 14(22):3599. https://doi.org/10.3390/w14223599
Chicago/Turabian StyleLiu, Panpan, Haitao Jing, Dapeng Zhang, Jingying Tang, Qi Liu, and Wenfei Luan. 2022. "Contribution of the Reconstruction of the Area of Seling Co Lake Using DEM Data and Analysis of Spatio-Temporal Variations" Water 14, no. 22: 3599. https://doi.org/10.3390/w14223599
Note that from the first issue of 2016, this journal uses article numbers instead of page numbers. See further details here.