
Discharge and Water Quality of the River Moselle from 1990 to 2020 as Related to Climatic Changes and De-Industrialization

Department of Plant Ecology (320b), Institute of Landscape and Plant Ecology, University of Hohenheim, Ottilie-Zeller-Weg 2, 70599 Stuttgart, Germany
Water 2022, 14(22), 3600; https://doi.org/10.3390/w14223600
Submission received: 12 October 2022
/
Revised: 2 November 2022
/
Accepted: 3 November 2022
/
Published: 8 November 2022
(This article belongs to the Section Water Quality and Contamination)
Abstract
:Reductions in industrial pollutant loads and the introduction and modernization of wastewater treatment facilities have improved the quality of inland waters in Europe and elsewhere, but climatic change, changes in runoff and the legacy of mine wastes may increase pressures on many aquatic environments. In the present study, data obtained by monitoring the French–German river are collated to visualize long-term trends in the pollution, river discharges and temperatures of Moselle waters. While air temperatures and accumulated heat sums in the catchment area showed an upward trend, precipitation and discharge levels as well as river temperatures were less affected by the ongoing climatic change. At the same time, the electric conductivity, i.e., the total suspended solids, did not show the anticipated reductions, while oxygen levels and pH values have showed upward trends since the 1990s. Despite the improvements in classical water quality parameters, the flooding of abandoned mines, increased water abstraction for cooling and agriculture and untreated old and emerging pollutants may aggravate environmental problems in the future. Climatic change will probably modify the runoff of pollutant loads by increasing the severity of flash floods and by concentrating water pollutants in drought spells.
1. Introduction
The first natural history of the river was presented by the Roman teacher and poet Decimus Magnus Ausonius (AD 310–395), who in his poem “Mosella” mentioned 16 fish species native to the still oligotrophic river. Despite the presumably higher number of taxa (many neozoa) nowadays, the water quality has significantly decreased since Roman times, particularly worsening after the Industrial Revolution up to the late 1970s. Important polluters were the soda and heavy industries and coal mining in France, Luxembourg and Germany. At the same time, industrial vitality and wealth led to a steep increase in population numbers in the region after the 1850s, increasing the environmental pressure on the river and also constituted a bone of contention between France and Germany for a long time.
Over recent decades, the European SAAR-LOR-LUX (Saarland, Lorraine and Luxembourg) region has been experiencing serious deindustrialization and pronounced structural changes. In consequence, the Saarland and the Département Moselle were confronted with population loss in the 1990s, but recently population numbers have stabilized to about 1 million inhabitants in each of region. In contrast, the population of the Grand Duchy of Luxembourg steadily increased by 160,000 to 0.6 million between the years 2000 and 2015, which has put a high pressure on both the freshwater supplies and wastewater treatment facilities. While the water demand for industrial processes strongly declined in Luxembourg, household consumption has increased by 1.35% per year over the last 15 years [1].
Phasing out the extraction activities in the French–German coal mining basin (Saar-Lorraine) and the Luxembourgish–French Minette iron mining region affected the quantities of acid mine drainage (AMD) that were and are being released into the Moselle catchment. Abandoning the open cast iron mines in the early years led to vast discharges of sulfates into the Moselle. In the Saar region, the controlled flooding of coal mines has recently begun and will lead to the upward movement of salts, heavy metals (copper and zinc) and organic pollutants (e.g., PCBs) that have been disposed of underground. Raising the groundwater levels on the German side will, however, only reach 330 m below ground. In order to protect the drinking water reservoirs on both sides of the border, contaminated waters will have to be pumped into the tributaries of the river Saar, so that post-mining pollutants will inevitably end up in the Moselle at the junction of the city of Konz (south of Trier). Site-adapted models simulating how water quality will be affected after phasing out mining in the Lorraine region and data from the monitoring of mine waters in France have been presented previously [2,3].
An extensive historic and economic overview on the interactions between industrial activities and the Meurthe–Moselle River quality is presented by Garcier [4,5]. The underlying information on the geology and the geomorphology of the Moselle catchment area and an overview of the fluvial response to climatic and anthropogenic forcing of the low-energy fluvial system in the French region are given by Cordier et al. [6]. Reports on the biological and chemical qualities of the river Moselle are published on irregular basis by the International Commission for the protection of the rivers Moselle and Saar (IKSMS-CIPMS) [7,8].
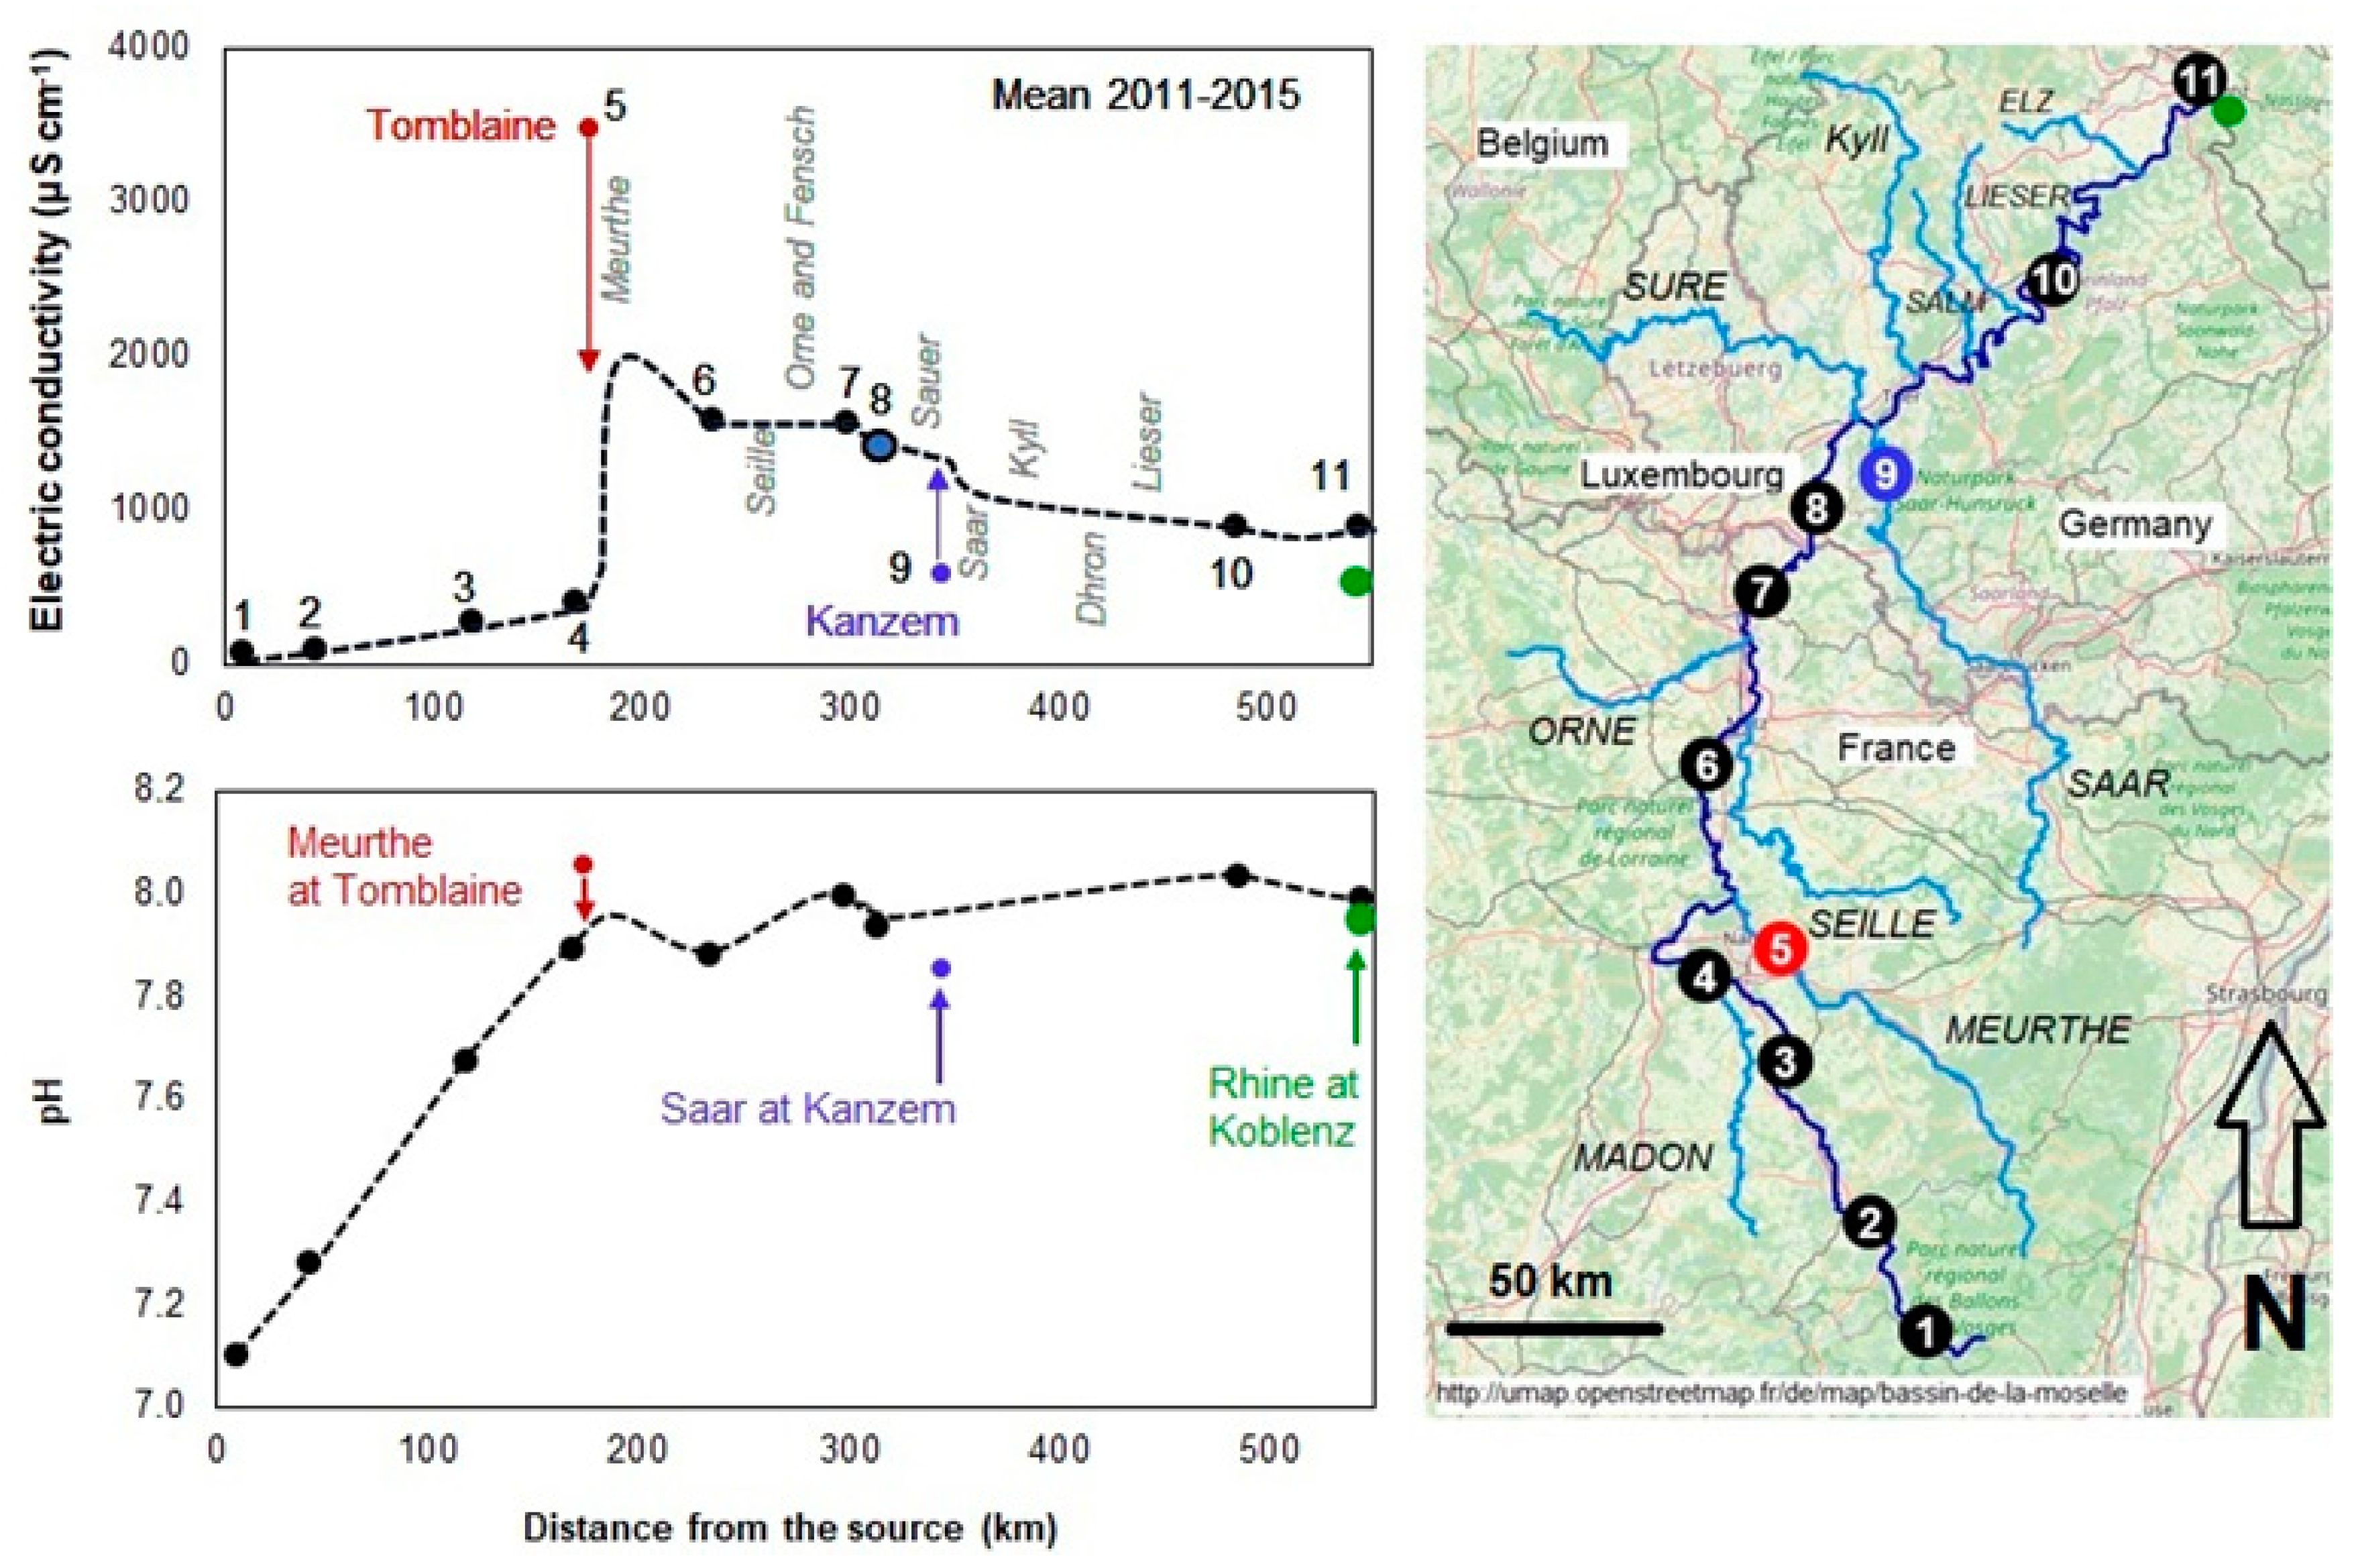
Discharges of chlorine from the Lorrainian soda industry into the Meurthe tributary continue to play an overwhelming role as the biggest pollutants of the Moselle ecosystem. In the year 2008, an admixture of water from the river Meurthe increased the electric conductivity of Moselle River water from 383 to 1578 μS cm−2 and the chloride concentration from 17.2 to 389.3 mg L−1 [9]. Since the brine from soda production is not being discharged constantly, strong seasonal differences in water quality may be expected downstream over time. In contrast to the third biggest tributary, Meurthe, the second and first biggest tributaries, respectively, the Sauer and Saar rivers, subsequently dilute the waters, leading to the quasi-amelioration of these effects downstream.
To introduce the reader to general differences in pollution levels along the flow direction of the river, Figure 1 gives an overview of the 5-year (2011 to 2015) averages of the electric conductivity determined at seven French and four German stations operated under the guidance of IKSMS-ICPMS. A comprehensive overview of the water quality of the Moselle (German side) from 1964 to 2000 is provided by Ehlscheid et al. [10], but in the more recent peer-reviewed literature, information on the hydrology and chemistry of the Moselle is generally lacking. A literature search in the Scopus® databank using the keywords “Moselle” and “water” for the title and the abstract yielded 120 hits dating back to the year 2000, but in none of the papers were data on the changes in water quality (time series) presented, despite intensive monitoring activities still being performed along the river. Comprehensive overviews of annual averages of chemical parameters are available from the databanks operated by the German Federal Institute of Hydrology (https://fgg-rhein.bafg.de/, accessed on 1 October 2022).
The objectives of the present study are thus to collate, present and analyze openly available data and to address changes in temperatures, discharge volumes and the chemical properties of the Moselle water over the past 30 years. Here, we focus on the French–German–Luxembourgish border region using daily climatological data from the catchment area and hydrological and water chemistry data from representative monitoring stations. Most of the data stem from the German river monitoring station Palzem, which is situated just 10 km downstream of the well-known Schengen, the outstanding symbol of European co-operation and integration.
2. Materials and Methods
The water quality data used in this paper were obtained from eleven stations (Table 1 and Figure 1). Data sets were retrieved from public European monitoring networks and were comprised of the following:
- River quality data (yearly averages) from seven water quality stations in Lorraine (2008 to 2016) from the SIERM Water Information System Rhine-Meuse operated by the Agence de l’eau Rhin-Meuse and EauFrance (http://rhin-meuse.eaufrance.fr/ accessed on 1 October 2022);
- River quality data from Kanzem, Fankel and Koblenz (2011 to 2015) and Palzem (fortnightly means from 1975 to 1989) from Landesamt für Umwelt Rheinland-Pfalz (LfU, https://lfu.rlp.de/de/wasserwirtschaft/ accessed on 1 October 2022);
- River quality data and water temperature data from Palzem (daily means from 1990 to present) from Landesamt für Umwelt Rheinland-Pfalz (LfU, https://lfu.rlp.de/de/wasserwirtschaft/ accessed on 1 October 2022);
- Discharge data from Perl (French–German border) as daily means from 1975 to present from Wasserstraßen und Schifffahrtsverwaltung des Bundes (WSV), made available from Bundesanstalt für Gewässerkunde (BfG, https://www.bafg.de/ accessed on 1 October 2022);
- Climate data (daily means) from the French military airport at Nancy-Ochey (WMO station 7181, daily means from 1975 to 2020) downloaded via the KNMI climate explorer (https://climexp.knmi.nl/getstations.cgi, accessed on 1 October 2022);
- Climate data (daily means) from Trier-Petrisberg (daily means from 1975 to 2021 from Deutscher Wetterdienst (DWD, http://www.dwd.de, accessed on 1 October 2022);
- Data on chloride emissions into the water from the largest soda factories at the Meurthe from the European Pollutant Release and Transfer Register (E-PRTR, http://prtr.ec.europa.eu/#/home, accessed on 15 July 2020) for 2001 to 2016.
The openly accessible information was reviewed and published by the mentioned authorities, but errors and inconsistencies cannot be completely ruled out. After collation and cross-filing, data were analyzed and graphically represented using the statistical package R (R Core Team) [11] and Microsoft® Excel®. The data of daily means are represented as time series, classified as heat maps or aggregated over years. In order to compare climatic, hydrological and chemical data, we used the calendar and not hydrological years.
3. Results and Discussion
3.1. Effects of Climate on Water Temperatures
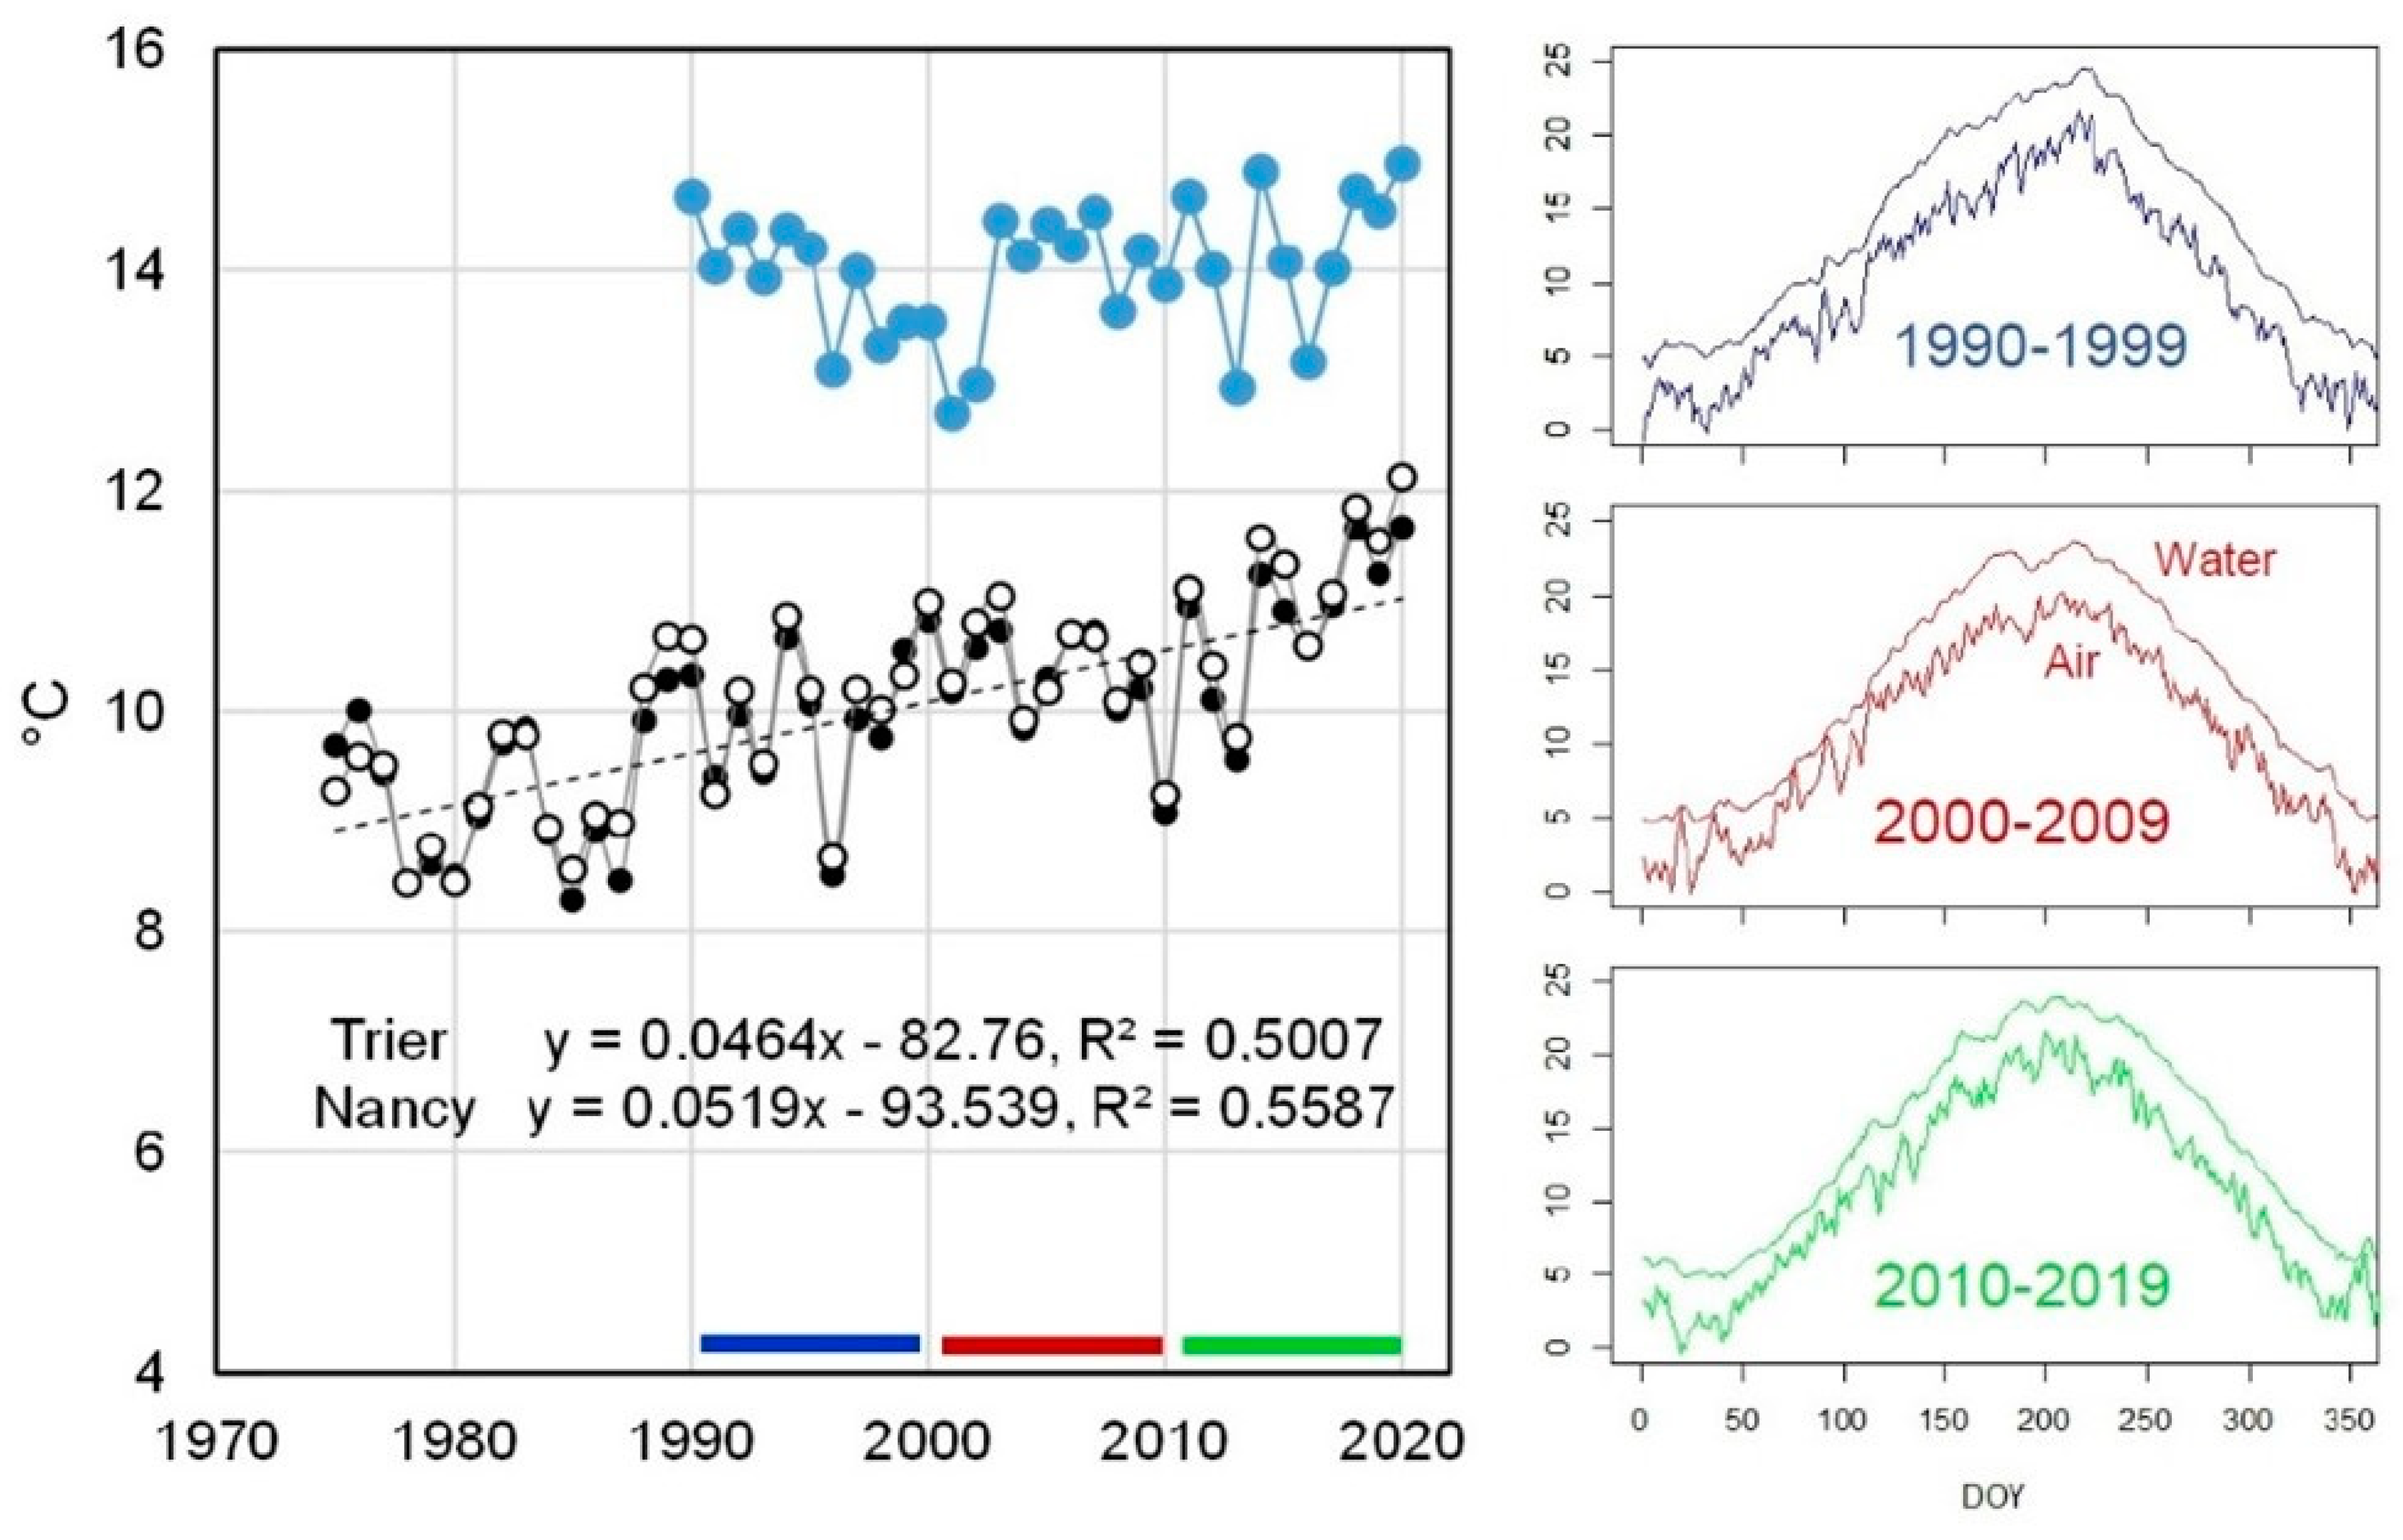
In order to first determine the potential effects of climate change in the catchment area, temperature and rainfall data of Nancy (upper Moselle) and Trier (central Moselle) were evaluated. Over the last four decades, the mean annual temperatures in Nancy and Trier increased by 0.46 °C (R2 0.5) and 0.52 °C (R2 0.56) per decade, respectively (Figure 2). Average air temperatures between 1975 and 2020 were 10.1 °C in Nancy and 9.97 °C in Trier, with a very high agreement between the time series (R2 0.88).
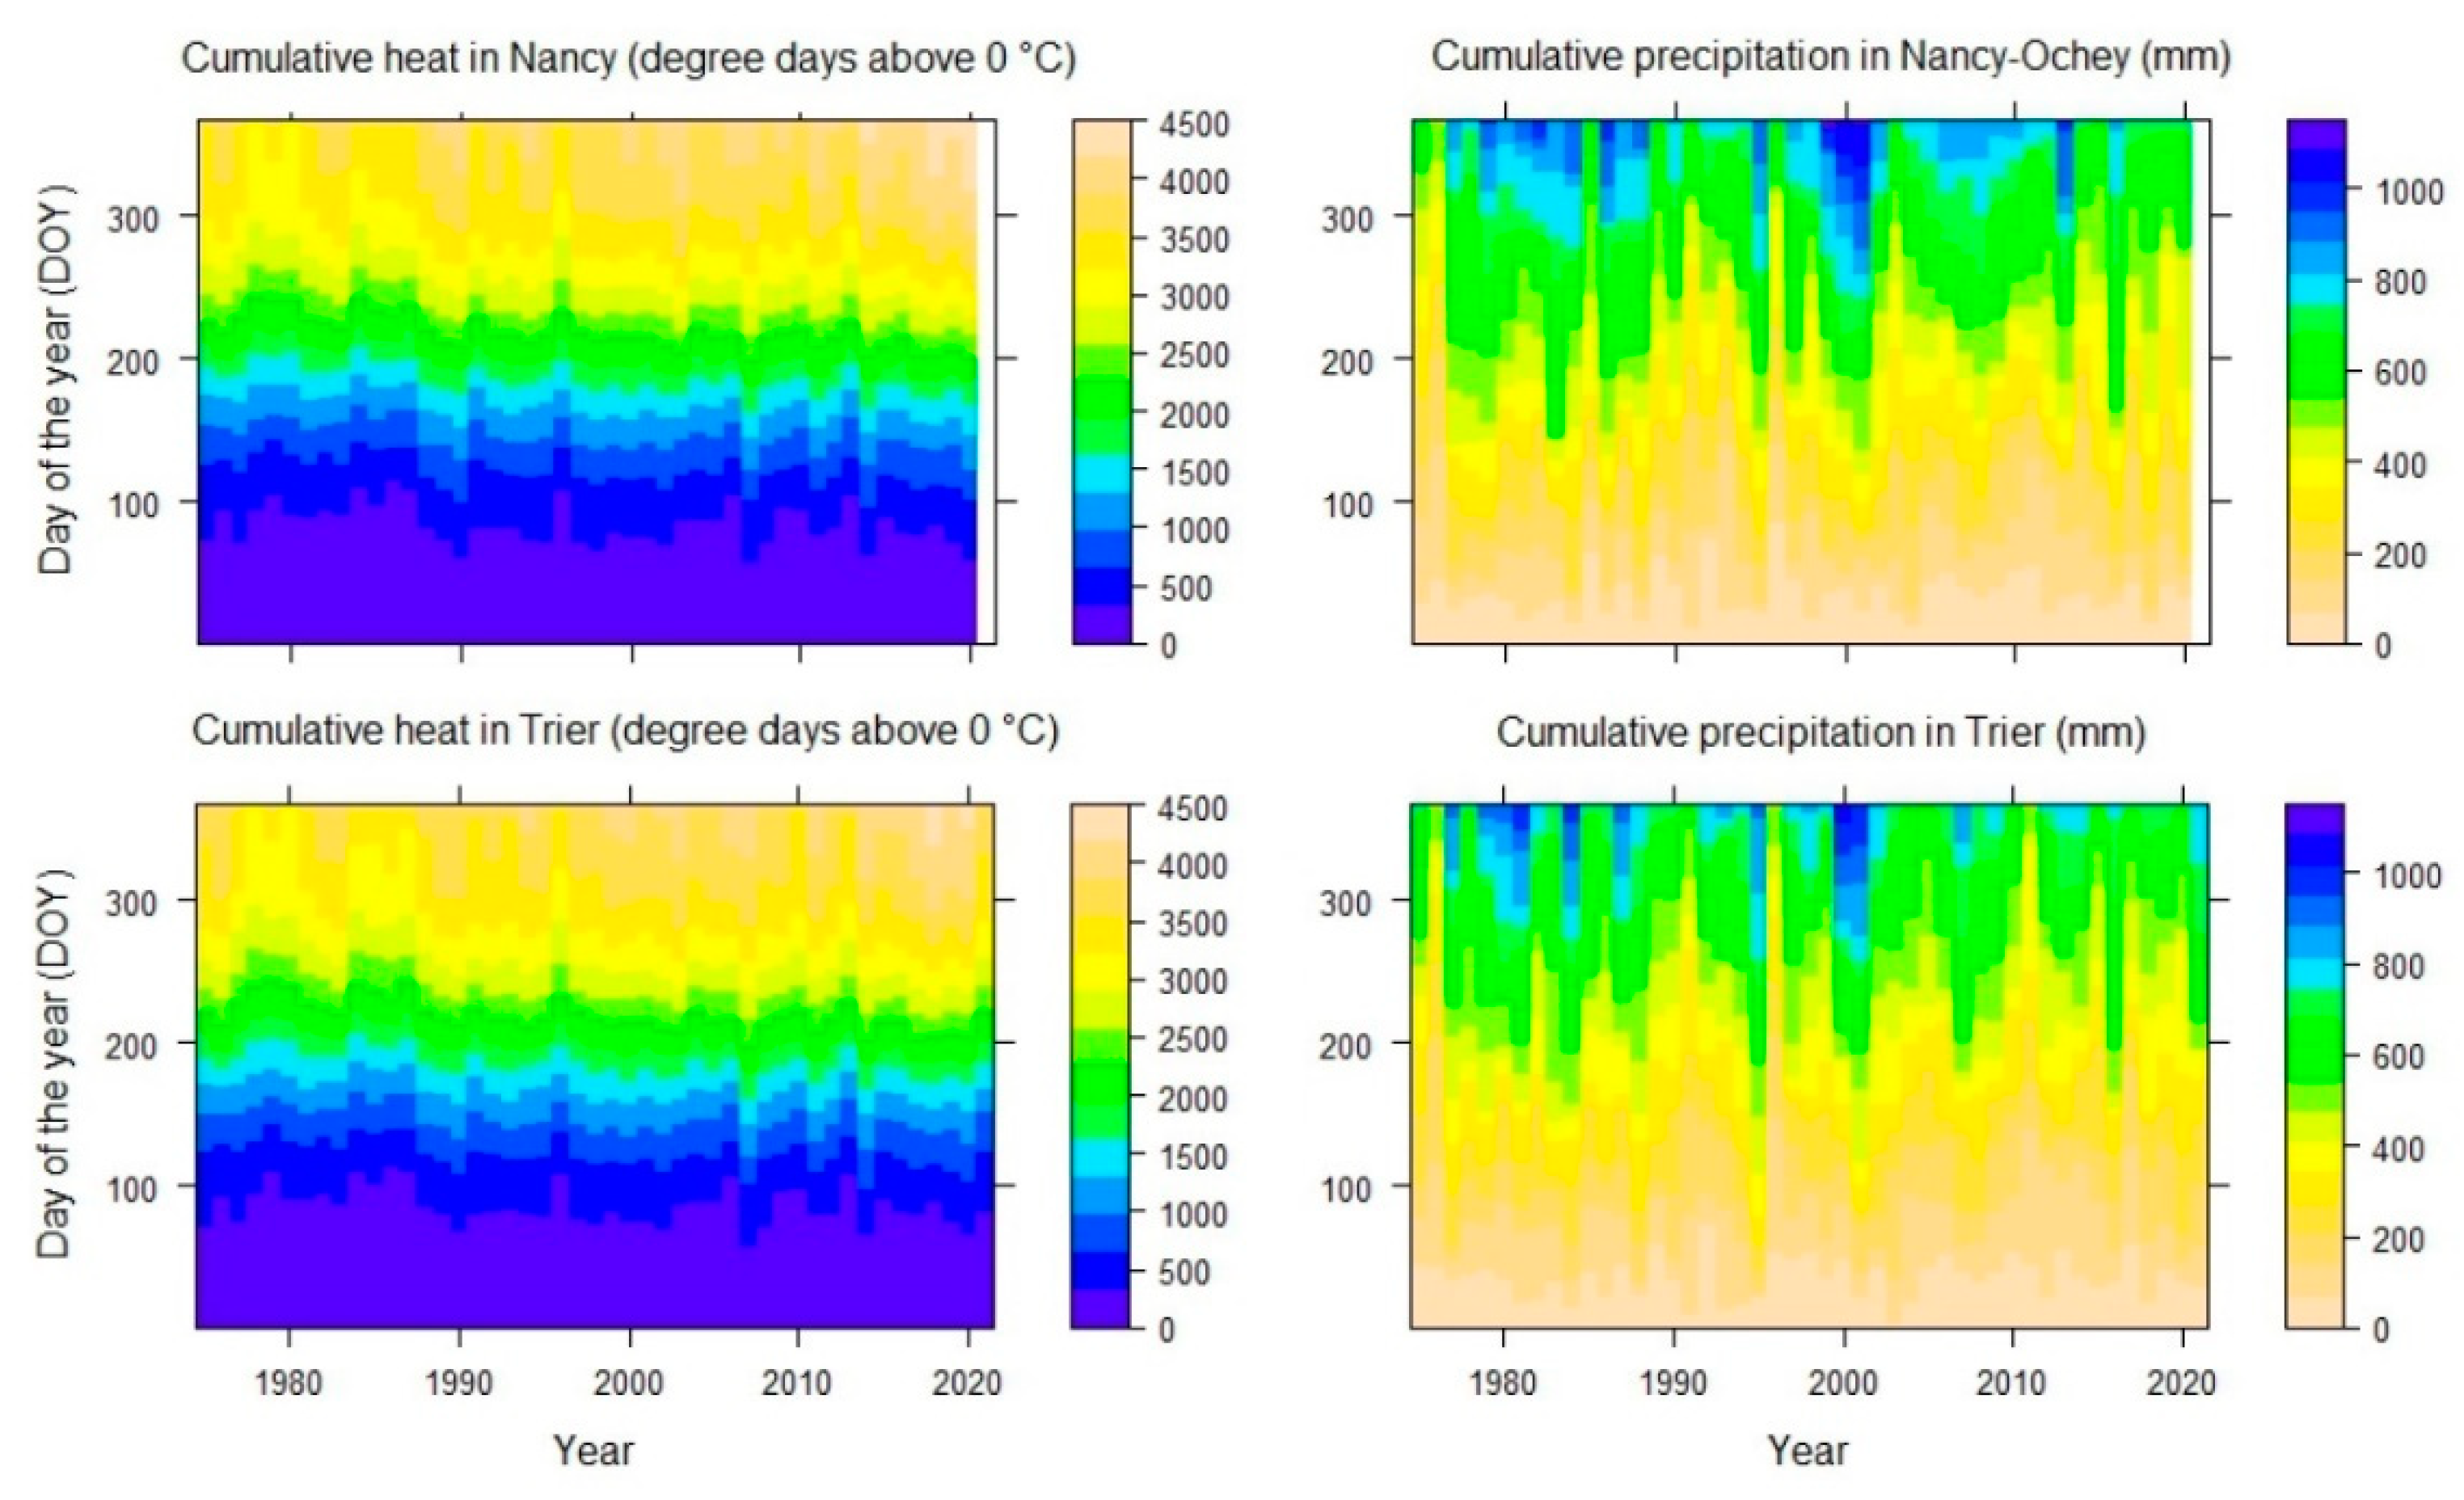
As can be seen in the heat maps in Figure 3, the accumulated heat sums above 0 °C increased in the Moselle catchment area from the 1980s by about 170 degree-days per decade. The increase was more pronounced and had a higher coefficient of determination in Nancy (R2 0.6) than in Trier (R2 0.54). It is unclear whether the surplus in heat energy increased evapotranspiration from the land surface in the catchment area and whether this affected runoff and discharge. The increase in heat units or the growing degree days (GDD) will also have extended the growing season into the autumn. In contrast, more frequent heat spells and drought may reduce plant growth and vegetation cover, so that water after strong precipitation events cannot effectively infiltrate into the soil. Nevertheless, the amount of precipitation as well as the frequency of heavy rain (data not shown) do not show a clear trend over the last 45 years, but precipitation sums are mirrored by the cumulative discharge (see Figure 4).
Mean annual water temperatures at Palzem were on average 4 °C higher than the air temperatures, showing only a weak correspondence to the air temperatures of either weather station (R2 0.28) and featuring only a slight upward trend over time (0.1 °C per decade). In contrast to the mean annual water temperatures, daily water temperatures showed a pronounced relationship to the daily air temperatures at Trier and Nancy (both R2 0.81). The daily values for water and air temperatures for Palzem and Trier, respectively, are shown for three decades in Figure 2 (right-hand side) in order to see whether there were changes in the annual cycles of heat transfer. In contrast, in the decade 1990 to 1999, the water was warmer by 4.06 °C than the air. This difference was reduced to 3.46 °C in the decade 2010 to 2019. However, the seasonal heat transfer did not change much during the time for which data were available.
While only a slight increase in water temperatures was found at Palzem, the mean temperatures of the river Rhine increased by 1.7 °C at the Upper Rhine and by 1.2 °C (0.36 °C per decade) in Koblenz (Middle Rhine) between 1978 and 2011 [12]. Similar trends of 0.3 °C per decade were observed for the Elbe and Danube [13] and for Northern and Eastern Germany [14]. In the UK [15], river warming was less pronounced (0.22 °C per decade), with April being the fastest-warming month (+0.63 °C per decade on average). A further warming of the Rhine of 1.9 °C for the period 2071–2100 as compared to the current situation was calculated by van Vliet et al. [16], while for the near future (2021–2050), lower rates of 0.4–0.6 °C have been suggested [17].
Since river temperatures have been shown to be mainly affected by air temperatures [13], a stronger heating of the Moselle and thus an increased input of atmospheric energy was also expected at Palzem. However, it is very likely that the time series of the water temperature measurements was not long enough to see the multidecadal trends. At the same time, water temperatures in the region are not only affected by the energy fluxes (short and long wave radiation) at the air–water interface. Another factor could be the recharging of cooling water from the pressurized water nuclear reactor at Cattenom that overlays the climatic signal. The first block of the power plant came into operation in late 1986 and the last block started in 1992. Thermal discharges from the four blocks amount to 220 MW [18] and are allowed to heat up the Moselle by 1.5 °C against the background with a maximum allowable temperature of 30 °C [19].
Palzem is situated about 30 km downstream from Cattenom, so that the thermal effects of cooling water discharges could indeed still be recognizable. A total of 8.8 m3 s−1 of water are withdrawn from the Moselle, 3 m3 s−1 are vaporized and 5.8 m3 s−1 are recharged into the river [18], which equals a loss of 10% of water under minimum discharge conditions. The lower mean cumulative discharge values at Perl after 1990 (see Figure 4 and Figure 6 upper right panel) parallel the higher extraction of cooling waters since the start of the operation of the power station. The mean flow times between Cattenom and Palzem are in the range of 5–10 h, depending on the discharge volumes [20]. For the Rhine, it has been calculated that river temperatures in Mainz have increased by 1.4 °C due to the thermal discharges upstream, but the decommissioning of four German nuclear power stations in 2011 significantly reduced the thermal pollution of the Rhine [12].
It must be noted that, besides Cattenom, until the year 2008, other (conventional) power stations (la Maxe/Metz, Blénod/Pont-á-Mousson and Richemond/Thionville) led to significant heat discharges of over 500 MW into the Moselle. However, these plants completely ceased production in 2015 [18]. Based on the data series from 1996 to 2017, water at Perl was 0.75 °C warmer on average than that at Cochem (data not shown). In recent years, however, Moselle water has been cooler in Perl more often than in Cochem and Palzem, which could reflect the mentioned decommissioning of conventional power stations in the Metz region, suggesting the turnover to naturally cooler conditions upstream. Interestingly, times with cooler water in Perl as compared to Cochem were often the spells with low discharge volumes. During such low-water conditions, Cattenom obviously did not extract water from the Moselle but relied on potentially cooler cooling waters from the nearby Mirgenbach lake and the Vieux Pré reservoir, which is located 100 km away in the Vosges mountains. However, as mentioned above and in Section 3.2, cumulative discharge at Perl decreased after 1990 in part due to the massive evaporation of cooling waters.
Many authors suggested that river warming has marked effects on aquatic biodiversity and will generally favor the thermophilous invasive alien species. While systematic investigations in Europe are generally lacking, species sensitivity distributions (SSDs) are available for how native and alien freshwater mussel species will respond to climatic change, a different water depth (water discharge) and different oxygen levels [21]. River warming will probably also create a higher toxicity of water pollutants [22] and favor waterborne diseases, which in turn may have an adverse impact on fish populations and biodiversity [15]. It must also be noted that higher river temperatures will increase the partial pressure of CO2 in the sediment and speed up chemical weathering and microbiological degradation so that the water chemistry will be changed by global warming and the admixture of atmospheric CO2 [23]. Unfortunately, data on CO2 levels in the water of the river Moselle were not available, but, e.g., in the river Ruhr, it has been shown that the increasing atmospheric CO2 concentration is paralleled by rising levels in freshwater ecosystems and that these lead to acidification [24].
From our analyses, we conclude that a general warming of the river Moselle in analogy to the atmospheric warming in the region cannot be observed, most likely due to the overwhelming effects of water abstraction and the use of the river water for industrial cooling.
3.2. River Discharge
As mentioned above, precipitation sums in the catchment area showed no clear trends between 1975 and 2020 (Figure 2). Mean annual sums were 769 mm in Trier and 825 mm in the slightly moister Nancy. The relationship between the two data series was not as strong (R2 0.49) as the one reported above for the temperatures. In the heat maps in Figure 3, one can observe that the conditions became a bit drier in spring and the early summer after the year 2001, as indicated by the accumulated precipitation sums between day 100 (10 April) and 200 (19 July). Based on 30-year moving averages from the 20th century, strong regional differences in precipitation changes were found in Germany [25]. In the Moselle region, a clear shift to drier summer and wetter winter conditions was observed, a finding that was also confirmed using the time series for 1951–2006 [26].
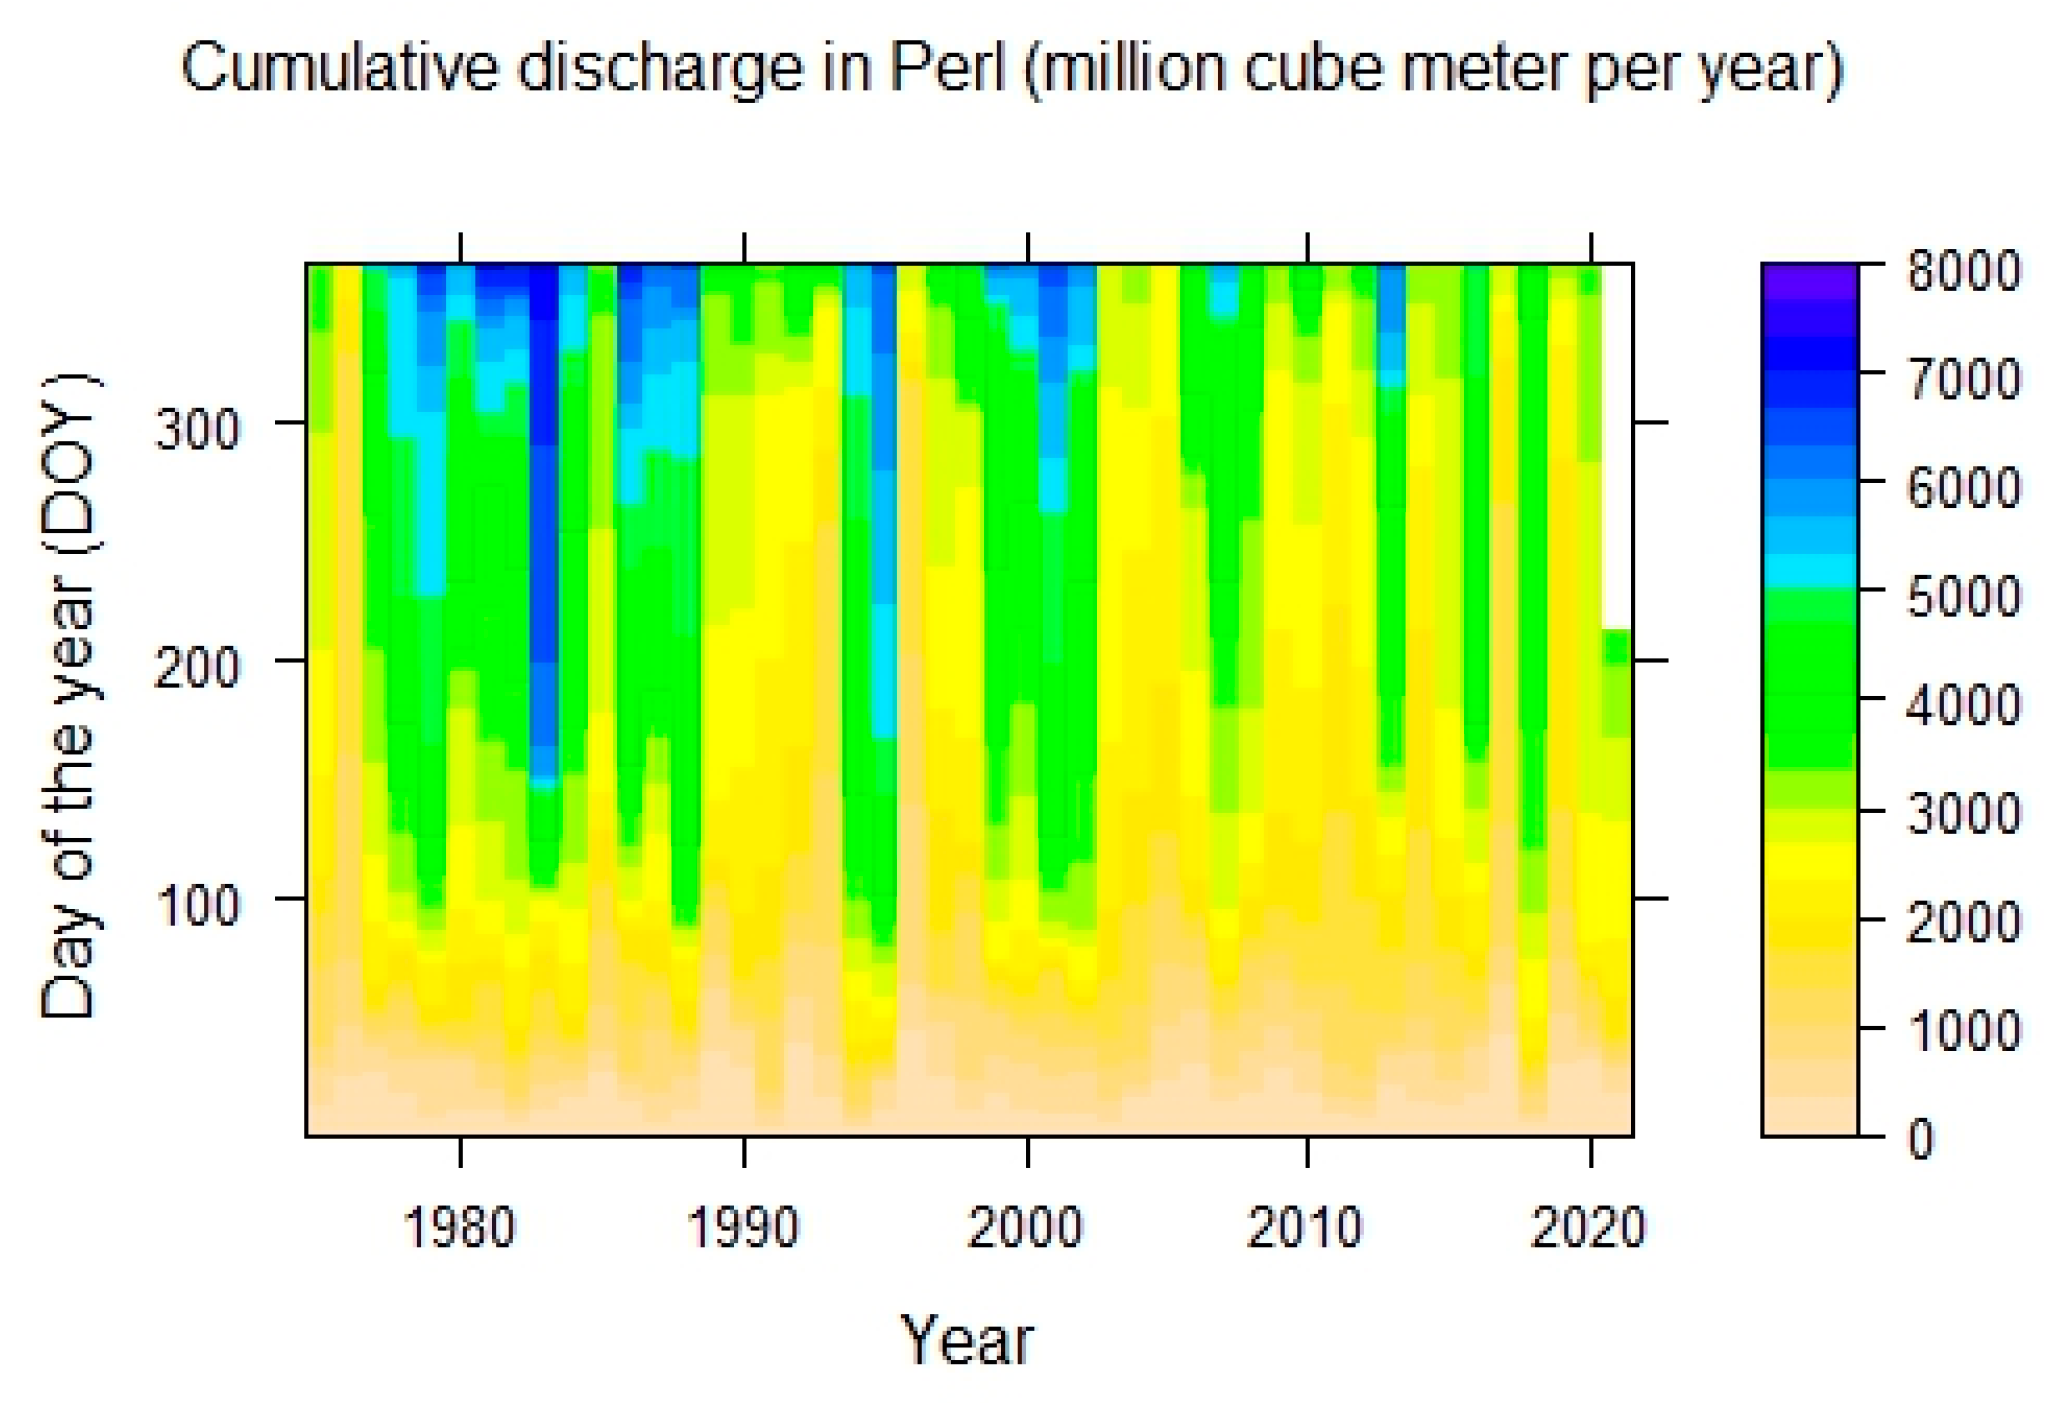
As mentioned above, discharge sums seemed to have some relationship with the precipitation sums upstream at Nancy (R2 0.64). Figure 4 suggests that cumulative water volumes received until a certain date have overall decreased in recent decades, whereas on a daily basis (Figure 5 upper left) this cannot be seen. Changes in daily and accumulated Q during the year specified after the four decades 1980 to 2019 are shown in Figure 6 (upper left and upper right), confirming that there have been marked changes, with around 25% less annual discharge nowadays compared to the 1980s. As mentioned above, the start of the operation of the power station Cattenom in the late 1980s coincided with and in part caused reduced discharges. Together with the increasing heat sum and thus a higher evapotranspiration from the land surface, the lower quantities of rainfall and discharges may be perceived as an indicator of climatic change in the Moselle catchment area. However, such evaluations should be based on more than one measuring station and, apart from climatic change, should consider changes in land cover and management [27].
In contrast to the Moselle, no relationship between precipitation sums and annual discharges of seven streams was found in the Baltimore region, but an increase in winter precipitation sums was confirmed [28]. Future changes in the seasonality, discharge regimes and flooding risks in the Rhine–Moselle catchment area can be studied using regional circulation and ecohydrological models under different climate change scenarios [29,30]. Still, it must be noted that such models will not be able to predict flooding events such as the Nancy flash flood 21/22 May 2012 [31] and, more recently, the catastrophic Ahr flooding of 14/15 July 2021. In order to evaluate the risks of both high and shallow waters, it may be useful to derive long time series and to include proxies and historical information, e.g., flooding marks on buildings [32]. A 150-year reconstruction of low flows for the Moselle River has been presented previously, confirming that the extreme low flows in the summers of 1976, 2003 and 2018 were unprecedented [33]. Nevertheless, the severity and frequency of floods will most likely intensify in the Moselle catchment in the near future (2021–2050), as has been modelled by Thirel et al. [30].
Comparing the annual discharge sums at Perl to those at Cochem shows that between 40 and 52% of the water arriving at the lower Moselle stems from the upper Moselle, with a slight decrease in recent years (data not shown). These findings may indicate that the potential effects of climatic and land use change are more pronounced in the French Vosges than in the German Rhenish (Hunsrück and Eifel) mountains. The somewhat stronger increase in temperature sums in Nancy than in Trier (Figure 2) points to the same conclusion. It must be noted that even a very protective land use strategy cannot fully mitigate the catastrophic effects of flash floods.
Long-term investigations with large field lysimeters have shown that groundwater recharge is higher under grassland than under deciduous and coniferous forests and that growing stands will turn more than half of the incoming precipitation into water vapor [34]. Besides the changes in land use and the transformation of vegetation (growth and damage of forests by air pollutants, storms, calamities, fires and drought), changes in radiation and greenhouse gases will also affect the energy balance and continental evaporation. While the ongoing CO2 fertilization effect will reduce the transpiration of vegetation and increase runoff at a global level [35], the “global brightening” over Europe may have led to higher evapotranspiration in recent decades. It is unclear how land-use changes, forestry and changes in the air quality and radiation budget have affected the evapotranspiration and run-off in the Moselle catchment area, but cumulative river discharge seems to have decreased in recent decades. Due to the expected decreases in precipitation and changes in evapotranspiration, it may be further decreased by 26% in the Eastern Vosges at the end of the 21st century, as has been calculated for the Strengbach catchment area [36].
We conclude that the observed reductions in the discharge of the river Moselle after the 1980s are related to climatic changes and increased water abstraction for cooling purposes. It is unclear, however, whether changes in land use and the indirect effects of climate change on the vegetation interacted with the regional water cycle.
3.3. Industrial Discharges and Water Quality
While from the 1970s to 1990s CaCl2-chlorine discharges from soda factories into the Meurthe often exceeded 200 kg s−1 [4], chlorine discharges have been limited to 31 kg s−1 and must not lead to the salinization of the Moselle waters downstream (Hauconcourt) (more than 400 mg L−1 chlorine) [9]. This regulation implies that, under unsuitable conditions, brines need to be stored in large basins on the premises of companies. Modulation basins can nowadays store up to 3.7 million m3 in an area of 50 ha (see southeast of Nancy in GoogleEarthTM), but it is unclear whether these would stand extreme flash floods.
According to data from the European Pollutant Release and Transfer Register (E-PRTR), the two largest soda factories in the years 2008 to 2015 emitted, on average, 788.000 t of chlorides into the water, ranging from 580,000 in the year 2011 to 1,014,000 tons in 2010. However, the data for the same eight years on EC, pH and chlorine contents in water from Tomblaine (Meurthe) showed only a slight relationship with the registered emissions (R2: 0.22, 0.21 and 0.18, respectively). Interestingly, emissions showed stronger positive relationships with the precipitation sum in Nancy (R2 0.37) and the annual discharges of the Moselle in Perl (R2 0.45), which suggests that the volume of diluting waters is considered to manage the releases of brine. Moreover, the data on Cl emissions in 2008 to 2015 show a strong negative relationship with the annual mean temperatures in Nancy (R2 0.78), probably suggesting that releases decrease with hot weather and high water temperatures. This also implies that large volumes of brine will have to be stored during longer drought spells as flash floods could cause much greater damage.
Groundwater quality in the Lorraine has significantly worsened in recent years and compromises the production of clean drinking water in many places. Increasing hydrological drought and lower discharge levels due to climate change will lead to a reduced dilution of point sources and by the year 2050 may seriously affect the production of clean waters from surface waters [37,38]. Nevertheless, there is a lack of detailed analyses of both the surface and groundwater chemistries. Only recently have geochemistry maps on European scales for pH and calcium in groundwaters become available [39]. No information was available in the literature on the future discharge policies and management of Moselle waters, but in Luxembourg there are plans currently to use more bank filtrate for the preparation of drinking water. In France, there are discussions to recover the CaCl2 brines near Nancy by reverse osmosis or to lead effluents via a pipeline to the Rhine north of Strasbourg. The latter project (Calcoduc) has been abandoned because it would seriously affect the water quality of the river Rhine. After the closure of the last Alsatian potassium mines in 2004, the Cl- concentrations have been declining significantly (<20 mg L−1).
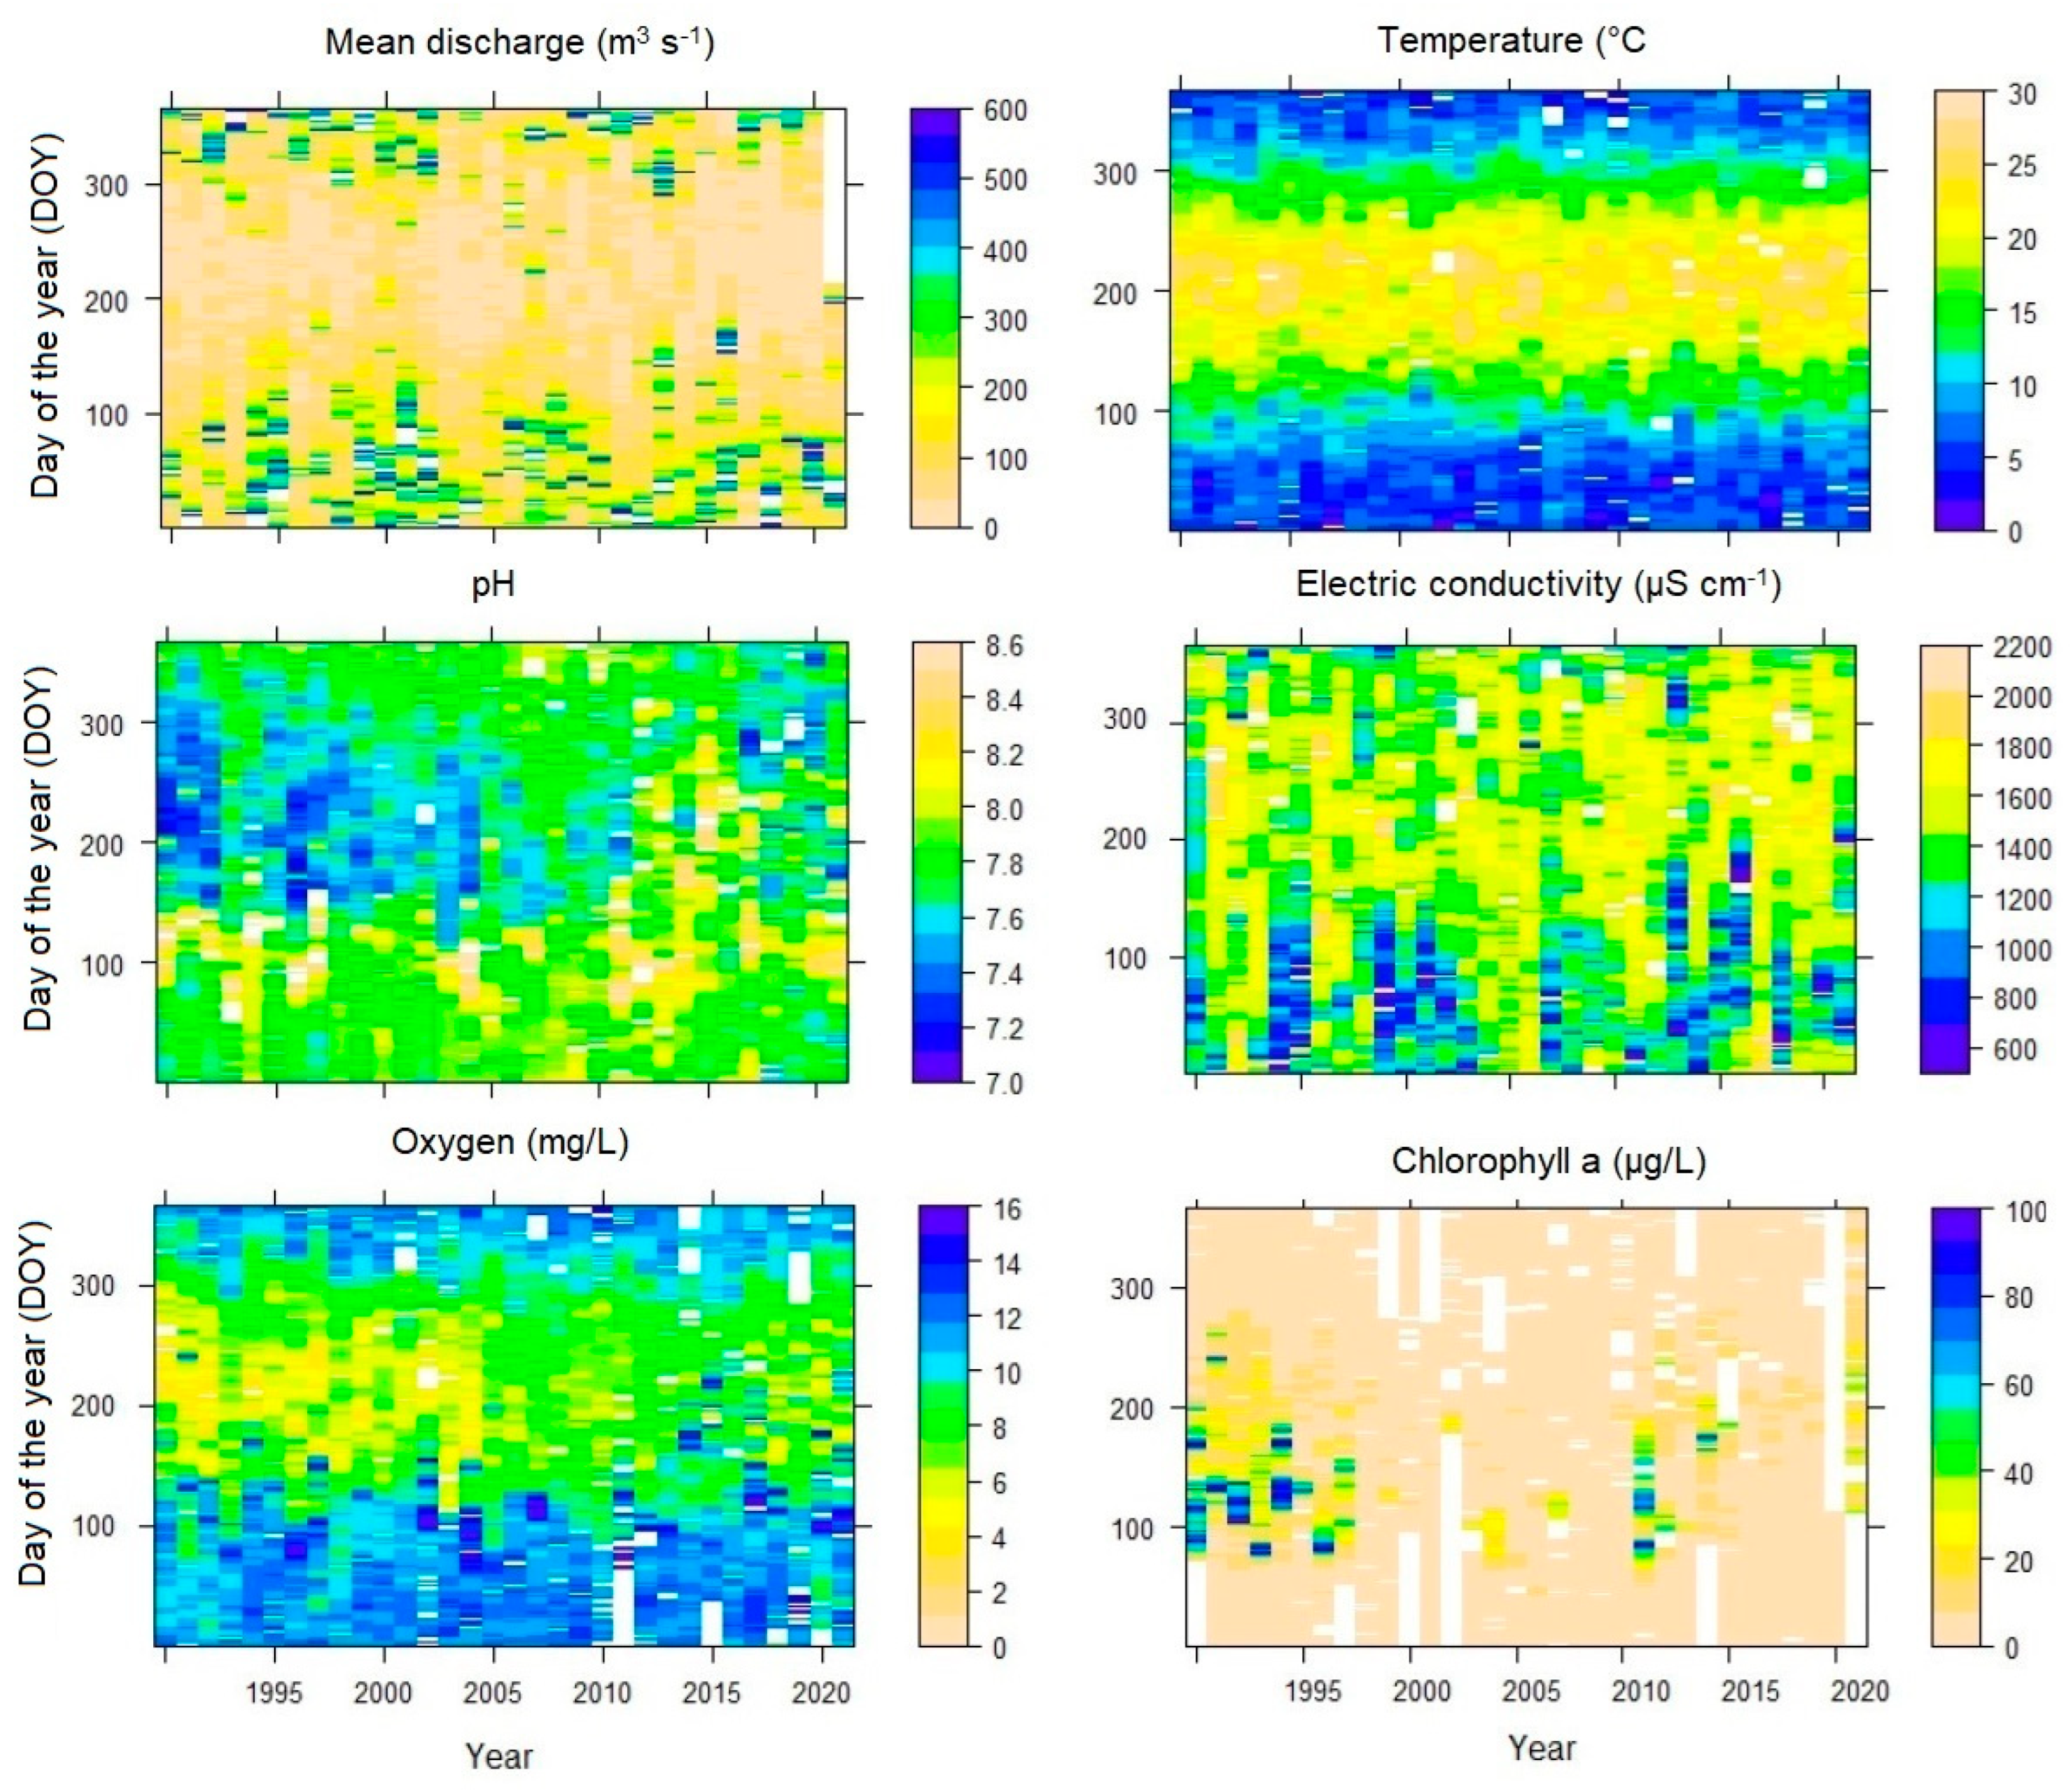
Based on the daily averages between 1990 and 2020, changes over time were found in the river Moselle for the quality parameters electric conductivity, chlorophyll contents, oxygen and, the most pronounced, pH. Figure 5 gives a full account of the data and suggests that four of the mentioned indicators for water quality improved over recent decades. At the same time, the annual dynamics in water quality showed changes over time, which are primarily related to the timing, quantity and chemistry of industrial discharges. In order to visualize these changes, the annual courses of the biochemical indicators were compared for the decades 1990–1999, 2000–2009 and 2010–2019 (Figure 6).
As can be seen, EC levels did not change much over time, but a slight change in seasonality was observed. The reduced EC during the summer in the decade 2000 to 2009 may indicate that brine discharge times were adapted by the soda industry. Nevertheless, the 2011–2015 five-year average still reached 1413 µS cm−1, which, using a standard conversion factor of 0.5, is equal to an average concentration of 0.7 g L−1 total dissolved solids (TDS) in the water at Palzem. Considering the five-year average discharge at Perl of 126 m3 s−1, 2.8 million t of solids are moved along this stretch by the Moselle every year. It can be assumed that chlorides make up a quarter of the dissolved ions, since the five-year mean of chloride discharges upstream amounts to 730,000 tons per year (calculation from E-PRTR data). Figure 6 shows that, during the decade 2010–2019, EC increased again somewhat during the summer. We hypothesize that this slight increase is probably due to the lower discharge levels, i.e., a concentration effect. In unpolluted rivers, the relationships between EC and Q are very clear, so that determining EC can be used as a proxy for Q [40]. Additionally, the present data confirm this relationship with a Pearson Product Moment Correlation Coefficient between the two of −0.8.
In contrast to EC, the situation much improved for chlorophyll a and pH, and overall their spring peaks have flattened in recent years. pH and oxygen levels increased from the first to the last decade. The spring peak in chlorophyll a, the indicator for phytoplankton mass, was paralleled by a higher pH in the decade 1990 to 1999, a relationship that has also been reported for the Lower Rhine [41]. Phytoplankton growth begins when the days get warmer and the involved photosynthesis will reduce the concentration of dissolved carbon dioxide, which then causes the pH to rise. The data indicate that, in the summer, chlorophyll a concentrations in the decade 2010 to 2019 went up again, probably due to the lower discharge in recent years.
The general rise in pH in the waters of the Moselle is probably not only due to the reduced discharges of acidic mine drainage and the relatively greater importance of alkaline effluents from the soda industry, but may also reflect the reduced deposition of acid-forming atmospheric pollutants (SO2 and NOx) in Central Europe after the successful implementation of the UN-ECE Gothenburg Protocol in the 1990s. As has been shown for the precipitation chemistry in the neighboring Black Forest and Hunsrück region [42], SO4− and NO3− loads decreased dramatically and pH values increased from less than 4.5 in the early 1980s to 5.5 after the year 2018 (refer to data from the stations Schauinsland and Deuselbach). The same will be true for the Vosges and the Moselle catchment area and the lower input of acid-forming air pollutants was paralleled by the deindustrialization in the Lorraine region. Another factor to consider is the rise in CO2 levels that has large implications for biogeochemical cycles. The increased air-to-water flux of atmospheric CO2 has been shown to constantly lower the pH of ocean waters and it could be demonstrated that CO2-driven acidification is also taking place in freshwaters [24].
While the iron and sulfate concentrations in the Moselle, its tributaries and in the drinking waters increased dramatically after the controlled flooding of iron mines, the levels have decreased over recent years [43]. Although mining and mine flooding have been and will soon be terminated, steelmaking continues in the region and the elevated levels of sulfates and dissolved metals are being measured in the Fensch river [44,45]. It must also be noted that the industrial history in the former Lorrainian iron mining district is and will be preserved in the high metal concentrations of suspended matter that can be found in the Moselle behind the Fensch and the Orne mouth [46]. In standard laboratory tests, river sediments from seven sites between Metz and the German border showed the highest toxicity at Manom north of Thionville, but large differences were observed between the sites, the different tests and endpoints applied [47].
While classical inorganic pollutants have been declining over time, organic micropollutants and their metabolites are not routinely monitored since they have a complex chemistry and make, e.g., sample preparation and analytical methods difficult. Within the German environmental specimen bank program, the concentration trends of some xenobiotics in bream in the large rivers are continuously monitored. Eight organic chemicals are being addressed that are listed as priority pollutants in the Water Framework Directive (WFD). The highest and increasing concentrations of the persistent and carcinogenic polybrominated diphenyl ethers (PBDEs) were found in fish from the Saar at Rehlingen showing a fivefold increase after the year 2000 [48]. Upstream, the concentrations of the flame retardant were only a tenth of those at Rehlingen, so it can be assumed that pollution stems from production discharges from chemical complexes into the river Rosselle or from the use and disposal of flame retardants used in the nearby steelworks.
In the bassin houiller lorrain, the controlled flooding of ancient coal mines had already commenced after 2006, whereas in the mining in German Saarland was only given up six years later. Pit waters are pumped and discharged into the pre-flooders of the river Saar to avoid contact with drinking water extraction areas. Currently, 21 million m3 per year of pit water are being pumped from former French and German coal mines into the Saar pre-flooders, 18 million m3 from the mainly right-hand sided German mines and 3 million m3 from the left-hand French side. An analysis of suspended matter and pure water showed that PCB levels and heavy metals (zinc) often exceeded the reference values [49,50]. Pit water has high levels of barium, boron, sulfate, chloride and ammonium, but the levels of heavy metals and organic pollutants will gradually decrease in the long term in the river Saar.
High loads of heavy metals and certain polycyclic aromatic hydrocarbons (PAH) have also been found in suspended matter of the Moselle (Perl), which often surpass the French and German reference values [8]. The copper loads in particular are highly elevated downstream at Palzem mainly in the summer months. Since the year 1994, the concentrations have tripled in suspended matter and reach over 160 µg kg−1 [51]. While the increasing copper pollution was ascribed to the abrasion from the brass heat exchangers employed at the Cattenom nuclear power station, elevated levels of highly condensed PAH such as B(a)P in Moselle and Saar could originate from the runoff from the multitude of brownfields in the formerly heavily industrialized region. Both, copper and PAH have considerable ecotoxicity, which may affect the organisms in the Moselle watershed. It has been suggested that waters of Cattenom’s Mirgenbach lake receive 30 t of copper annually from the corrosion of cooling systems [52] and strong increases in copper concentrations in the water and the sediments have been shown [53]. Due to the toxic effects of the metal, the phytoplankton biomass between 1986 and 2006 was reduced so that, as a consequence, the fish biomass decreased too due to the missing food supply.
In formerly industrialized regions, large amounts of pollutants may be discharged by stormwaters [54], and with the increasing frequency and severity of flash floods the remobilization of inorganic and organic pollutants from unvegetated stockpiles may play a greater role in the future. Furthermore, the input of ecotoxic copper, e.g., from corrosion in power plants and from spraying in viniculture, need to be addressed in the future. Nevertheless, it will be difficult to monitor all the chemical substances and their metabolites and to differentiate geogenic from anthropogenic sources [55], but the list of priority substances (currently 45 according to Directive 2008/105/EC) and the environmental quality standards will provide scientific support for the evaluation of the chemical status of European rivers such as the Moselle. Another topic will be the increased brownification of surface waters that has also been observed in recent years in Central Europe. As has been suggested by researchers [56], this phenomenon is due to the stronger release of dissolved organic compounds (DOC) and associated pollutants, e.g., heavy metals in forest regions that are prone to drought and calamities.
4. Conclusions and Outlook
We conclude that warming, changes in water discharge and acidity, and the direct pollutant emissions from ongoing industrial and energetic processes will continue to exert environmental pressures on the Moselle. Largely ignored problems are the pollutant inputs via the runoff from historic aboveground brownfields and mine waste deposits, the discharges of untreated mine waters into river systems as well as the inability of wastewater treatment facilities to capture and degrade, e.g., microplastics, flame retardants, pharmaceuticals and personal care products.
With the ongoing climate change and the expected rise in the frequency of droughts and low waters, as in 2018 and 2022, there will be greater pressures on rivers and their economic, ecological and environmental functions as coolants, transport routes and reservoirs of clean waters and fish. The example of pollution in the Oder River and the massive dying off of fish in August 2022 also shows that international cooperation needs to be intensified and laboratory facilities must be maintained to quickly understand and to respond to such incidents. Apart from studying chemical quality, more efforts must be made in the future to monitor the associated biological changes, e.g., the occurrence of blooms of toxic algae (e.g., Prymnesium parvum), cyanobacteria (Microcystis spec.) and invasion of potentially aggressive neobiota.
The present study gives an overview of the changes in the water quality and the discharge of the river Moselle and discusses some of the underlying climatic and economic factors driving the environmental impacts. However, it was limited to basic water quality criteria and data from a selected monitoring station with a long time series. It is recommended to perform further analyses of multi-decadal changes in the water chemistry and discharge of other European rivers and catchment areas to get a deeper insight into the environmental and climatic pressures on the water cycle. The results from the long-term monitoring of classical parameters, emerging pollutants and biota in the light of the ongoing climatic change will eventually be helpful to readjust European water policies.
Funding
This research received no external funding.
Institutional Review Board Statement
Not applicable.
Informed Consent Statement
Not applicable.
Data Availability Statement
Data used for the preparation of the manuscript stem from the public databases referred to in Table 1.
Acknowledgments
Michael Engel and colleagues from the Landesamt für Umwelt Rheinland-Pfalz (Mainz) are thanked for providing data from the water monitoring station Palzem.
Conflicts of Interest
The author declares no conflict of interest.
References
- EEA. Freshwater—State and impacts (Luxembourg). SOER Common Environmental Theme from Luxembourg–Freshwater. European Environment Agency. 2015. Available online: https://www.eea.europa.eu/soer/countries/lu/freshwater-state-and-impacts-luxembourg (accessed on 15 July 2020).
- Collon, P.; Fabriol, R.; Buès, M. Modelling the evolution of water quality in abandoned mines of the Lorraine Iron Basin. J. Hydrol. 2006, 328, 620–634. [Google Scholar] [CrossRef]
- Corbel, S.; Kaiser, J.; Vicentin, S. Coal Mine Flooding in the Lorraine-Saar Basin: Experience from the French Mines. In Proceedings of the International Mine Water Association (IMWA) 13th International Mine Water Association Congress–Mine Water & Circular Economy, Lappeenranta, Finland, 25–30 June 2017; pp. 161–166. Available online: http://www.imwa.info/docs/imwa_2017/IMWA_2017_Volume_1.pdf (accessed on 1 October 2022).
- Garcier, R. La Pollution Industrielle de la Moselle Française: Naissance, Devéloppement et Gestiojn d´un Problème Environnemental 1850–2000. Thèse Université Lumière Lyon2. 2005, p. 487. Available online: https://tel.archives-ouvertes.fr/tel-00119367 (accessed on 1 October 2022).
- Garcier, R.J. Rivers we can’t bring ourselves to clean-historical insights into the pollution of the Moselle River (France), 1850–2000. Hydrol. Earth Syst. Sci. 2007, 11, 1731–1745. [Google Scholar] [CrossRef] [Green Version]
- Cordier, S.; Lauer, T.; Harmand, D.; Frechen, M.; Brkojewitch, G. Fluvial response to climatic and anthropogenic forcing in the Moselle drainage basin (NE France) during historical periods: Evidence from OSL dating. Earth Surf. Process. Landforms 2012, 37, 1167–1175. [Google Scholar] [CrossRef]
- IKSMS. Entwicklung der Wasserbeschaffenheit von Mosel und Saar 1990–2010. Arbeitsgruppe A: Bewertung der Oberflächengewässer. Internationale Kommissionen zum Schutze der Mosel und der Saar, Trier, 76 S. 2012. Available online: http://www.iksms-cipms.org/ (accessed on 15 July 2022).
- IKSMS. Entwicklung der Wasserbeschaffenheit von Mosel und Saar 2000–2015. Internationale Kommissionen zum Schutze der Mosel und der Saar, Konz, 100 S. 2018. Available online: http://www.iksms-cipms.org/ (accessed on 15 July 2020).
- Beisel, J.N.; Peltre, M.-C.; Usseglio-Polatera, P. Einfluss der Salzbelastung auf die Aquatische Biozönose der Mosel. Abschlussbericht im Auftrag der Internationalen Kommission zum Schutz der Mosel und der Saar (IKSMS); Laboratoire Interactions Ecotoxicologie, Biodiversité et Ècosystèmes, Université de Metz: Metz, France, 2011; p. 63. [Google Scholar]
- Ehlscheid, T.; Meid, M.; Thrun, I. Gewässergüte der Mosel in Rheinland-Pfalz 1964–2000. Landesamt für Wasserwirtschaft. LFW-BERICHT NR. 202/02. 2002, p. 124. Available online: https://lfu.rlp.de/fileadmin/lfu/Standorte/Moselbericht_2000_Endversion_05.06.02_V2.pdf (accessed on 15 July 2020).
- R Core Team. R: A Language and Environment for Statistical Computing. R Foundation for Statistical Computing: Vienna, Austria. Available online: http://www.R-project.org/.2013 (accessed on 3 December 2021).
- ICPR. Development of Rhine Water Temperatures Based on Validated Temperature Measurements between 1978 and 2011. International Commission for the Protection of the Rhine (ICPR) Koblenz, Report 209. 2013, p. 29. Available online: https://www.iksr.org/fileadmin/user_upload/DKDM/Dokumente/Fachberichte/EN/rp_En_0209.pdf (accessed on 15 July 2020).
- Markovic, D.; Scharfenberger, U.; Schmutz, S.; Pletterbauer, F.; Wolter, C. Variability and alterations of water temperatures across the Elbe and Danube River Basins. Clim. Change 2013, 119, 375–389. [Google Scholar] [CrossRef]
- Arora, R.; Tockner, K.; Venohr, M. Changing river temperatures in northern Germany: Trends and drivers of change. Hydrol. Process. 2016, 30, 3084–3096. [Google Scholar] [CrossRef]
- Jonkers, A.R.T.; Sharkey, K.J. The Differential Warming Response of Britain’s Rivers (1982–2011). PLoS ONE 2016, 11, e0166247. [Google Scholar] [CrossRef] [PubMed] [Green Version]
- van Vliet, M.T.; Franssen, W.H.; Yearsley, J.R.; Ludwig, F.; Haddeland, I.; Lettenmaier, D.P.; Kabat, P. Global river discharge and water temperature under climate change. Glob. Environ. Change 2013, 23, 450–464. [Google Scholar] [CrossRef]
- Hardenbicker, P.; Viergutz, C.; Becker, A.; Kirchesch, V.; Nilson, E.; Fischer, H. Water temperature increases in the river Rhine in response to climate change. Reg. Environ. Change 2016, 17, 299–308. [Google Scholar] [CrossRef]
- BUND. BUND-Studie Abwärmelast Rhein. Bund für Umwelt und Naturschutz Deutschland (BUND) Landesverbände Baden-Württemberg, Bayern, Hessen, Nordrhein-Westfalen und Rheinland-Pfalz, 72 S. 2009. Available online: http://www.bund-rlp.de/uploads/media/bund_waerme_lang_bild.pdf (accessed on 15 July 2020).
- EDF. Jahresbericht zur Information der Öffentlichkeit über die Kerntechnischen Anlagen in Cattenom, 56 S. 2016. Available online: https://www.edf.fr/sites/default/files/contrib/groupe-edf/producteur-industriel/carte-des-implantations/centrale-cattenom/surete-et-environnement/Rapport%20TSN/Allemand/edf_rapports_nucleaires_cattenom_allemand_exe_v3bd.pdf (accessed on 15 July 2020).
- Krause, W.J.; Jost, W.; Lüllwitz, T. Determination of flow times, flow velocities, and longitudinal dispersion in the River Mosel using 3HHO as a tracer. Hydrol. Wasserbewirtsch. 2009, 53, 360–379. Available online: http://www.kliwas.de/SharedDocs/Publikationen/G/krause_hywa_2009_06.pdf?__blob=publicationFile (accessed on 15 July 2020).
- Collas, F.P.L.; Buijse, A.D.; Hendriks, A.J.; van der Velde, G.; Leuven, R.S.E.W. Sensitivity of native and alien freshwater bivalve species in Europe to climate-related environmental factors. Ecosphere 2018, 9, e02184. [Google Scholar] [CrossRef]
- Patra, R.W.; Chapman, J.C.; Lim, R.P.; Gehrke, P.C.; Sunderam, R.M. Interactions between water temperature and contaminant toxicity to freshwater fish. Environ. Toxicol. Chem. 2015, 34, 1809–1817. [Google Scholar] [CrossRef] [PubMed]
- Zobrist, J.; Schoenenberger, U.; Figura, S.; Hug, S.J. Long-term trends in Swiss rivers sampled continuously over 39 years reflect changes in geochemical processes and pollution. Environ. Sci. Pollut. Res. 2018, 25, 16788–16809. [Google Scholar] [CrossRef] [PubMed]
- Weiss, L.C.; Pötter, L.; Steiger, A.; Kruppert, S.; Frost, U.; Tollrian, R. Rising pCO2 in Freshwater Ecosystems Has the Potential to Negatively Affect Predator-Induced Defenses in Daphnia. Curr. Biol. 2018, 28, 327–332.e3. [Google Scholar] [CrossRef] [Green Version]
- Brienen, S.; Kapala, A.; Mächel, H.; Simmer, C. Regional centennial precipitation variability over Germany from extended observation records. Int. J. Clim. 2012, 33, 2167–2184. [Google Scholar] [CrossRef]
- Murawski, A.; Zimmer, J.; Merz, B. High spatial and temporal organization of changes in precipitation over Germany for 1951–2006. Int. J. Clim. 2015, 36, 2582–2597. [Google Scholar] [CrossRef] [Green Version]
- Fenicia, F.; Savenije, H.H.G.; Avdeeva, Y. Anomaly in the rainfall-runoff behaviour of the Meuse catchment. Climate, land-use, or land-use management? Hydrol. Earth Syst. Sci. 2009, 13, 1727–1737. [Google Scholar] [CrossRef] [Green Version]
- Reisinger, A.J.; Woytowitz, E.; Majcher, E.; Rosi, E.; Belt, K.T.; Duncan, J.M.; Kaushal, S.S.; Groffman, P.M. Changes in long-term water quality of Baltimore streams are associated with both gray and green infrastructure. Limnol. Oceanogr. 2018, 64, S60–S76. [Google Scholar] [CrossRef] [Green Version]
- Thirel, G.; Gerlinger, K.; Perrin, C.; Drogue, G.; Renard, B.; Wagner, J.-P. Evolutions des débits futurs sur le bassin du Rhin en contexte de changement climatique.Une évaluation actualisée avec les simulations climatiques du 5e rapport du GIEC. 2018. Available online: https://webgr.irstea.fr/wp-content/uploads/2018/04/Rapport_final_MOSARH21_v2_1.pdf (accessed on 3 September 2022).
- Thirel, G.; Gerlinger, K.; Perrin, C.; Drogue, G.; Renard, B.; Wagner, J.-P. Quels futurs possibles pour les débits des affluents français du Rhin (Moselle, Sarre, Ill)? La Houille Blanche 2019, 105, 140–149. [Google Scholar] [CrossRef]
- Gaume, E.; Payrastre, O. Enseignements des inondations exceptionnelles des 21 et 22 mai 2012 à Nancy. Houille Blanche 2020, 106, 17–24. [Google Scholar] [CrossRef]
- Sartor, J.; Zimmer, K.-H.; Busch, N. Historical Flooding Events in the German Mosel. Wasser Abfall 2010, 12, 46–51. Available online: https://www.researchgate.net/publication/297797564_Historical_flooding_events_in_the_German_Mosel (accessed on 15 July 2020). [CrossRef]
- François, D.; Delus, C.; Drogue, G.; Lebaut, S.; Gille, E. Reconstitution des Étiages de la Moselle Depuis 1871. La Houille Blanche 2020, 106, 13–21. [Google Scholar] [CrossRef]
- Harsch, N.; Brandenburg, M.; Klemm, O. Large-scale lysimeter site St. Arnold, Germany: Analysis of 40 years of precipitation, leachate and evapotranspiration. Hydrol. Earth Syst. Sci. 2009, 13, 305–317. [Google Scholar] [CrossRef] [Green Version]
- Gedney, N.; Cox, P.M.; Betts, R.A.; Boucher, O.; Huntingford, C.; Stott, P.A. Detection of a direct carbon dioxide effect in continental river runoff records. Nature 2006, 439, 835–838. [Google Scholar] [CrossRef] [PubMed]
- Beaulieu, E.; Lucas, Y.; Viville, D.; Chabaux, F.; Ackerer, P.; Goddéris, Y.; Pierret, M.-C. Hydrological and vegetation response to climate change in a forested mountainous catchment. Model. Earth Syst. Environ. 2016, 2, 1–15. [Google Scholar] [CrossRef] [Green Version]
- Sjerps, R.M.A.; ter Laak, T.L.; Zwolsman, G.J.J.G. Projected impact of climate change and chemical emissions on the water quality of the European rivers Rhine and Meuse: A drinking water perspective. Sci. Total Environ. 2017, 601–602, 1682–1694. [Google Scholar] [CrossRef] [PubMed]
- Wolff, E.; van Vliet, M.T. Impact of the 2018 drought on pharmaceutical concentrations and general water quality of the Rhine and Meuse rivers. Sci. Total Environ. 2021, 778, 146182. [Google Scholar] [CrossRef]
- Hájek, M.; Jiménez-Alfaro, B.; Hájek, O.; Brancaleoni, L.; Cantonati, M.; Carbognani, M.; Dedić, A.; Dítě, D.; Gerdol, R.; Hájková, P.; et al. A European map of groundwater pH and calcium. Earth Syst. Sci. Data 2021, 13, 1089–1105. [Google Scholar] [CrossRef]
- Cano-Paoli, K.; Chiogna, G.; Bellin, A. Convenient use of electrical conductivity measurements to investigate hydrological processes in Alpine headwaters. Sci. Total Environ. 2019, 685, 37–49. [Google Scholar] [CrossRef]
- Friedrich, G.; Pohlmann, M. Long-term plankton studies at the lower Rhine/Germany. Limnologica 2009, 39, 14–39. [Google Scholar] [CrossRef] [Green Version]
- Umweltbundesamt. Entwicklung des pH-Wertes im Niederschlag an den Messstationen des UBA-Luftmessnetzes. 2022. Available online: https://www.umweltbundesamt.de/sites/default/files/medien/384/bilder/dateien/2_abb_entw-ph-wert_2020-06-29.pdf (accessed on 3 September 2022).
- Wolkersdorfer, C.; Bowell, R. Contemporary Reviews of Mine Water Studies in Europe, Part 2. Mine Water Environ. 2005, 23, 162–182. [Google Scholar] [CrossRef]
- Montarges-Pelletier, E.; Duriez, C.; Ghanbaja, J.; Jeanneau, L.; Falkenberg, G.; Michot, L.J. Microscale investigations of the fate of heavy metals associated to iron-bearing particles in a highly polluted stream. Environ. Sci. Pollut. Res. 2013, 21, 2744–2760. [Google Scholar] [CrossRef] [PubMed]
- Assaad, A.; Pontvianne, S.; Pons, M.-N. Assessment of organic pollution of an industrial river by synchronous fluorescence and UV–vis spectroscopy: The Fensch River (NE France). Environ. Monit. Assess. 2017, 189, 229. [Google Scholar] [CrossRef] [PubMed]
- Le Meur, M.; Montargès-Pelletier, E.; Bauer, A.; Gley, R.; Migot, S.; Barres, O.; Delus, C.; Villiéras, F. Characterization of suspended particulate matter in the Moselle River (Lorraine, France): Evolution along the course of the river and in different hydrologic regimes. J. Soils Sediments 2015, 16, 1625–1642. [Google Scholar] [CrossRef]
- Férard, J.F.; Pérez, K.F.B.; Blaise, C.; Péry, A.; Sutthivaiyakit, P.; Gagné, F. Microscale Ecotoxicity Testing of Moselle River Watershed (Lorraine Province, France) Sediments. J. Xenobiotics 2015, 5, 5125. [Google Scholar] [CrossRef] [Green Version]
- Fliedner, A.; Lohmann, N.; Rüdel, H.; Teubner, D.; Wellmitz, J.; Koschorreck, J. Current levels and trends of selected EU Water Framework Directive priority substances in freshwater fish from the German environmental specimen bank. Environ. Pollut. 2016, 216, 866–876. [Google Scholar] [CrossRef]
- LUA Saar. Ergebnisse der Chemischen und Ökotoxikologischen Analytik von Grubenwässern und von Grubenwasser Beaufschlagten Kleineren Bächen Rechts der Saar. Landesamt für Umwelt und Arbeitsschutz des Saarlands. 2018. Available online: https://www.saarland.de/dokumente/res_umwelt/LUA_2018_PCB-2018-01_V3.pdf (accessed on 15 July 2020).
- LUA Saar. Hintergrundpapier Bergbau. zum 2. Bewirtschaftungsplan 2016–2021 zur Umsetzung der EG-Wasserrahmenrichtlinie (2000/60/EG) im Saarland, Landesamt für Umwelt und Arbeitsschutz des Saarlands, 58 S. 2018. Available online: https://www.saarland.de/dokumente/res_umwelt/Hintergrundpapier_Bergbau_201805.pdf (accessed on 3 September 2022).
- Engel, M. Schwebstoffe 2014. Vergleich der Untersuchungen an Schwebstoffen an den Probenahmestellen Mainz/Rhein, Palzem/Mosel, Kanzem/Saar, Grolsheim/Nahe, Lahnstein/Lahn und Ingelheim/Selz Sowie den Probenahmestellen Sayn/Saynbach und Scheuern/Mühlbach im Jahr 2014. 2016. Available online: https://lfu.rlp.de/fileadmin/lfu/Downloads/Wasserwirtschaft/Schwebstoffe2014_29032016.pdf (accessed on 15 July 2020).
- Vinot, I.; Pihan, J. Circulation of copper in the biotic compartments of a freshwater dammed reservoir. Environ. Pollut. 2005, 133, 169–182. [Google Scholar] [CrossRef]
- Masson, G.; Dembski, S.; Staffolani, F.; Wagner, P.; Valente, E.; Maazouzi, C.; Banas, D.; Poinsaint, J.-F.; Pihan, J.-C. Les populations de poissons dans le réservoir du Mirgenbach (1986–2006, CNPE Cattenom, France): Un modèle pour l’étude des effets d’un changement thermique global? Hydroécologie Appliqué 2008, 16, 135–167. [Google Scholar] [CrossRef] [Green Version]
- Popick, H.; Brinkmann, M.; McPhedran, K. Assessment of stormwater discharge contamination and toxicity for a cold-climate urban landscape. Environ. Sci. Eur. 2022, 34, 43. [Google Scholar] [CrossRef]
- Louis, P.; Messaoudene, A.; Jrad, H.; Abdoul-Hamid, B.A.; Vignati, D.A.; Pons, M.-N. Understanding Rare Earth Elements concentrations, anomalies and fluxes at the river basin scale: The Moselle River (France) as a case study. Sci. Total Environ. 2020, 742, 140619. [Google Scholar] [CrossRef]
- Kaal, J.; Pérez-Rodríguez, M.; Biester, H. Molecular Probing of DOM Indicates a Key Role of Spruce-Derived Lignin in the DOM and Metal Cycles of a Headwater Catchment: Can Spruce Forest Dieback Exacerbate Future Trends in the Browning of Central European Surface Waters? Environ. Sci. Technol. 2022, 56, 2747–2759. [Google Scholar] [CrossRef]
Figure 1.
Five-year average (2011–2015) of electric conductivity (EC), representing the quantity of total dissolved solids (TDS), at different points downstream of the river Moselle (upper left) and the representative pH values (lower left). A map of the Moselle catchment area and its tributaries (light blue) is shown at the (right). Red dots and arrows represent higher EC and pH of the water of the Meurthe river southeast of Nancy before it enters the Moselle. Blue points and arrows indicate the relatively lower EC and pH of waters from the river Saar, which leads to the dilution of the Moselle water. Green points and arrow indicate the mean values for EC and pH determined in the Rhine before water enters the Moselle. According to the BfAG FGG database, the average EC (450 µS m−3) is much lower in the Rhine, while pH is almost the same as in the Moselle. The names of major rivers entering the Moselle downstream from the left (northern) and right (southern) sides are indicated in gray. Numbers refer to different stations (see Table 1 and map above). Only the data from Palzem (station nr. 8) are presented in greater detail in the rest of the paper. http://umap.openstreetmap.fr/de/map/bassin-de-la-moselle (accessed on 2 November 2022).

Figure 2.
Mean annual air temperatures in Nancy–Ochey (○, 1975–2020), Trier−Petrisberg (●, 1975–2020) and water temperatures in Palzem (blue dots, 1990–2020). Right-hand side panels refer to air and water temperatures recorded in Trier and Palzem, respectively. Values are given as daily means for three decades. “DOY” refers to day of the year: DOY 1 is 1 January.

Figure 3.
Accumulated heat sums (daily temperature means above 0 °C) between 1975 and 2020 (x-axis) in Nancy (top) and Trier (bottom) and the accumulated annual precipitation at those stations (right). The values are summed up from 1 January (DOY 1) to 31 December (y-axis).
Figure 3.
Accumulated heat sums (daily temperature means above 0 °C) between 1975 and 2020 (x-axis) in Nancy (top) and Trier (bottom) and the accumulated annual precipitation at those stations (right). The values are summed up from 1 January (DOY 1) to 31 December (y-axis).

Figure 4.
Cumulative yearly discharge in Perl plotted against the days (DOY, y-axis) of the respective year (x-axis). Data refer to the 1975 to July 2021 data series.
Figure 4.
Cumulative yearly discharge in Perl plotted against the days (DOY, y-axis) of the respective year (x-axis). Data refer to the 1975 to July 2021 data series.

Figure 5.
Changes in discharge, temperatures and the water quality parameters pH, EC, oxygen and chlorophyll a between 1990 and 2021 (x-axis) plotted against the day of the year (y-axis). Data represent daily averages from the stations Palzem (chemical parameters) and Perl (discharge and temperatures).

Figure 6.
Annual cycles of discharge (daily and accumulated) in Perl and the four water quality parameters electric conductivity, chlorophyll a contents, oxygen and pH determined at Palzem. Data are calculated separately for the three decades 1990–1999 (blue lines), 2000–2009 (red lines) and 2010–2019 (green lines). For discharge, data for the decade 1980 to 1989 (black lines) are available as well.


Table 1.
List of water monitoring sites addressed in the paper. Locations are indicated in the map above (Figure 1).
Table 1.
List of water monitoring sites addressed in the paper. Locations are indicated in the map above (Figure 1).
| Nr. | Country | km | Name of Station | Data Source |
|---|---|---|---|---|
| 1 | F | 9 | Moselle-Ramonchamp | SIERM Water Information System |
| 2 | F | 44 | Moselle-Archette | SIERM Water Information System |
| 3 | F | 119 | Moselle-Tonnoy | SIERM Water Information System |
| 4 | F | 169 | Moselle-Liverdun | SIERM Water Information System |
| 5 | F | 174 * | Meurthe-Tomblaine | SIERM Water Information System |
| 6 | F | 234 | Moselle-Vandieres | SIERM Water Information System |
| 7 | F | 298 | Moselle-Sierck | SIERM Water Information System |
| 8 | D | 314 | Moselle-Palzem | LfU Gewässerschutz, Rheinland-Pfalz |
| 9 | D | 343 * | Saar-Kanzem | LfU Gewässerschutz, Rheinland-Pfalz |
| 10 | D | 485 | Moselle-Fankel | LfU Gewässerschutz, Rheinland-Pfalz |
| 11 | D | 544 | Moselle-Koblenz | LfU Gewässerschutz, Rheinland-Pfalz |
* refers to stations at the Moselle tributaries Meurthe and Saar.
Publisher’s Note: MDPI stays neutral with regard to jurisdictional claims in published maps and institutional affiliations. |
© 2022 by the author. Licensee MDPI, Basel, Switzerland. This article is an open access article distributed under the terms and conditions of the Creative Commons Attribution (CC BY) license (https://creativecommons.org/licenses/by/4.0/).
Share and Cite
MDPI and ACS Style
Franzaring, J. Discharge and Water Quality of the River Moselle from 1990 to 2020 as Related to Climatic Changes and De-Industrialization. Water 2022, 14, 3600. https://doi.org/10.3390/w14223600
AMA Style
Franzaring J. Discharge and Water Quality of the River Moselle from 1990 to 2020 as Related to Climatic Changes and De-Industrialization. Water. 2022; 14(22):3600. https://doi.org/10.3390/w14223600
Chicago/Turabian StyleFranzaring, Jürgen. 2022. "Discharge and Water Quality of the River Moselle from 1990 to 2020 as Related to Climatic Changes and De-Industrialization" Water 14, no. 22: 3600. https://doi.org/10.3390/w14223600
Note that from the first issue of 2016, this journal uses article numbers instead of page numbers. See further details here.