Article

Effective Removal of Reactive and Direct Dyes from Colored Wastewater Using Low-Cost Novel Bentonite Nanocomposites

1
Nano and Biomaterials Lab, Department of Chemistry, University of Agriculture, Faisalabad 38040, Pakistan
2
Institute of Nanoscience and Nanotechnology (ION2), Universiti Putra Malaysia, Serdang 43400, Selangor, Malaysia
3
Department of Physics, University of Agriculture, Faisalabad 38040, Pakistan
4
Chemistry Department, College of Science, King Saud University, Riyadh 1145, Saudi Arabia
5
Department of Applied Biosciences, Kyungpook National University, Daegu 41566, Korea
*
Author to whom correspondence should be addressed.
Water 2022, 14(22), 3604; https://doi.org/10.3390/w14223604
Submission received: 7 October 2022 / Revised: 4 November 2022 / Accepted: 4 November 2022 / Published: 8 November 2022

Abstract

:
The present study was aimed to remove direct violet-51, reactive green-5, reactive red, and acid red dyes by novel bentonite clay nanocomposites prepared using sodium metasilicate and potassium ferricyanide. The effect of temperature, pH, adsorbent amount, contact time, and initial concentration were studied to optimize the removal process. Various adsorption isotherms (Temkin, Freundlich isotherm, Langmuir isotherm, Harkin Jura, and Dubinin Radushkevich models) and kinetic models (pseudo-first order and pseudo-second order) were applied to adsorption data to find out the best fit model, i.e., Freundlich isotherm and pseudo-second order model. The prepared samples of bentonite nanocomposites were characterized using scanning electron microscopy (SEM) and Fourier transform infrared spectroscopy (FTIR). Bentonite treated with sodium metasilicate and potassium ferricyanide removed 96.6% of direct violet-51 dye, bentonite treated with sodium metasilicate removed 95%, bentonite treated with potassium ferricyanide removed 94%, and pure bentonite removed 80% of the dye from the solution.

1. Introduction

In developing countries, industrial wastewater management is one of the major issues under discussion. Untreated textile effluents are discharged in the drain which deteriorate the water bodies [1]. Almost 10 to 25% of the textile dyes are lost during the processing as effluents. Wastewater effluents are mostly organic in nature with dissolved oils and coloring agents. Moreover, fabric soaked with grease and oil adds to solid wastes that are hazardous and toxic to environment [2]. The release of toxic wastewater from industries is becoming a constant threat to the well-being of natural water resources and populations. Because of poor wastewater management policies of developing countries, 20% to 40% waterborne diseases are caused by industrial wastewater [3,4]. Seventy thousand tons of dyestuff is manufactured on annual basis, and the majority of these synthetic dyes are water soluble. These dyes have very complex structures, which make them less biodegradable that is why effective treatment methods are of interest currently [5,6,7].
A wide range of conventional methods have been investigated for dye removal extensively, but they have their own limitations, and these are not profitable at economical level. Principally, adsorption can be employed at large scale for the purification of wastewater at relatively large flow rates. Moreover, this method produces high-quality effluent that does not form harmful substances such as free radicals and ozone which are produced in photodegradation process via Ultraviolet (UV) radiation. The process of adsorption is fast, universal, and inexpensive. Various nano conventional sorbents are employed for removing chemical pollutants like chitin, peat, sulfonated coal, wheat straw, organomon t-morillonite, apple pomace, fly ash, dyestuff, and coir pith [8]. There are specific interactions that occurs between the adsorbed contaminants and adsorbent materials. These interactions may be due to the simple mass transfer from liquid to solid phase. Three components are used in these complicated interactions i.e., adsorbate, adsorbent, and wastewater. Wastewater comprises synthetic solution and effluents. Typically, in a ternary system such as this, main interaction forces are the affinity between the adsorbate and adsorbent that control adsorption [9].
In modern-day technology, clay nanocomposites are considered more economical and effective adsorbent for textile wastewater treatment. Because of the economic benefits and easy availability, natural clay minerals are used intensively. However, unfortunately, they have limited potential for micro-pollutant removal, less surface area, and lack standard protocol for recovery and regeneration in aqueous system. Nanocomposite adsorbents provide an appropriate substitute to expensive and less efficient adsorbent material. Clay polymer nanocomposites are gaining researchers’ attention day by day due to their remarkable characteristics regarding water decontamination [10]. Despite many other known nanocomposite adsorbents, bentonite is recognized as one of the most effective clays for the adsorption of dyes. Aluminum silicate minerals are the main component of bentonite clay, which are responsible for uniform pores, wide interlayers spacing, and non-swelling activities. Bentonite is an inert and ecofriendly material that has good thermal stability, which is why it is used extensively for catalysis. To increase its catalytic and adsorption performance, bentonite is modified by mixing with different metals and metal oxides. It is reported that Na+ is present in the interlayers of bentonite, which increases the surface area and basal spacing [11].
Bentonite has been used in its original form by various researchers for the removal of dyes from colored wastewater. Previously, bentonite was used to remove commercial dye, Basic Red 2 (BR2), effectively from wastewater as it was found to have cation exchange capacity [12]. In another study by Khelifi and Ayari, [13], congo red dye was removed effectively using bentonite in batch experiments. Regeneration studies were also conducted successfully. Tahir and Rauf [14] utilized bentonite for malachite green removal from aqueous solutions under various conditions including adsorbate concentrations, temperature, pH, and shaking time were optimized during study. The dye removal process was found to be physical adsorption. Adsorption is a physical process that usually comes with several disadvantages, including the low surface area, high cost of adsorbent, and hard separation of the adsorbent from dye.
In this investigational study, economical and novel bentonite nanocomposites were employed to deteriorate dyestuff, which includes direct voilet-51, reactive green 5, reactive red, and acid red. The dye removal process was used to optimize contact time, initial concentration of dye, and effect of temperature. This study is the first report to check and compare kinetic and adsorption isotherms of natural and modified bentonite nanocomposites.

2. Materials and Methods

2.1. Dyes and Bentonite Nanocomposites

Reactive Green-5, Reactive Red, Direct violet-51, and Acid Red Dyes used in this research work were purchased from the local dye textile market of Faisalabad. For the determination of lambda max for four dyes, namely Reactive Green-5, Reactive Red, Direct violet-51, and Acid Red, 50 ppm solution was prepared by dissolving 5 mg of dyes into 100 mL of distilled water. All the dye solutions were then run through the 721 D UV-visible spectrophotometer (Wincom Company Ltd., Changsha, China). Each dye was scanned in the wavelength ranging from 380 nm to 1000 nm [15].
Bentonite clay was also purchased from a local market. Bentonite was ground into fine particles with the help of pestle and mortar and then passed though the sieve to get uniform size powder. This fine bentonite powder was then used to prepare bentonite nanocomposites [16]. A simple procedure was used to prepare nanocomposites of bentonite. Five grams of Bentonite clay was mixed with each of potassium ferricyanide solution, sodium meta silicate solution, and with the mixture of both potassium ferricyanide and sodium meta silicate solution in a separate beaker to make a paste. The paste was allowed to stand for 24 h at room temperature and then washed thoroughly with distilled water until clear filtrate was obtained. All the solid residue was collected carefully from the filter paper. The paste-like material obtained after filtration were subjected to drying in the WHL-25A oven (Hino Teck, Tianjin, China) at 150 °C for one hour. Once the paste dried, it was ground into fine powder, and it was ready to use as adsorbent in the form of bentonite nanocomposites.

2.2. Adsorption Studies

The adsorption studies were performed in 15 mL capacity Falcon tubes containing 10 mL of dye solution (50 ppm) and 0.01 g of bentonite or bentonite nanocomposites using PA250/25H orbital shaker (NANBEI Instrument limited, Zhengzhou, China) at the speed of 300 rpm for 2 h [17]. Microfilters (Membrane Filter Products System, Malaysia) (0.45 μm) were used to filter the dye solution using a disposable plastic syringe. The absorbance of each solution was read before and after adsorption process using a UV-visible spectrophotometer (Wincom Company Ltd., Changsha, China) [18]. The concentration of dye solutions was determined using standard curves. The formula used for calculating the standard factor was:
S t a n d a r d   F a c t o r = C o n c e n t r a t i o n A b s o r b a n c e
The following formula was used to calculate the %age removal of dyes [19]:
% a g e   r e m o v a l = C o C e C o × 100
where Co is the blank concentration, and Ce is the sample concentration.
To study the effect of initial dye concentration, the dye solutions of 5 ppm, 10 ppm, 15 ppm, 25 ppm, and 50 ppm were prepared from 100 ppm stock solution. The effect of various doses (i.e., 0.05 g, 0.1 g, 0.2 g, 0.3 g, and 0.4 g) of pure bentonite, bentonite treated with sodium metasilicate, bentonite treated with potassium ferricyanide, and bentonite treated with both sodium metasilicate and potassium ferricyanide was accessed at 50 ppm initial dye concentration. To check the effect of pH on the adsorption of dye (50 ppm) on adsorbent surface, the experiment was performed by varying the pH from 5 to 10 of dye solutions by using 0.1 N NaOH and 0.1 N HCl prior to adding adsorbents. At 50 ppm of dye solution concentration and 0.05 g of adsorbent dose optimization of time and temperature was done. Removal of dyes using different adsorbents at varying times of 15, 30, 60, 120, and 240 min was observed. The influence of temperature on adsorption was monitored at 30, 40, 50, 60, and 70 °C. The solutions were shaken in an orbital shaker for 2 h at 300 rpm shaking speed. While optimizing a parameter, all other experimental factors were kept constant.

2.2.1. Adsorption Isotherm and Kinetic Studies

Adsorption capacity (qe, mg g−1) and adsorbate concentration (Ce, mg L−1) were linked during the adsorption equilibrium studies in liquid state. These adsorption isotherms indicate the critical dosage required for optimization of adsorbent concentration and how adsorbent interacts with adsorbate [20]. To understand the complex nature of adsorption system, various adsorption isotherms modeling was applied including Freundlich isotherm, Langmuir isotherm, Temkin isotherm, Dubinin Radushkevich isotherm, and Harkin–Jura isotherm.
Freundlich model gives information about heterogeneous, non-ideal and reversible adsorption. Linear form of Freundlich adsorption isotherm model is as follows:
l n q e = ( 1 n ) l n C + l n K f  
Langmuir adsorption model show single layer adsorption and the amount of adsorbent adsorbed is maximum for single layer. Linear form of Langmuir adsorption isotherm model is as follows:
C e Q e = 1 Q o K t + C e Q o
To calculate Gaussian energy distributed on the heterogeneous surface during adsorption process Dubinin isotherm was used. Linear form of this model is as follows:
ln qe = ln qoβε2
where β (mol2/J2) is the activity coefficient and ε is the Polanyi potential and can be calculated from the following equation.
ε = RT Ln ( 1 + 1 C e )
where R is the general gas constant and T is the absolute temperature in kelvin. Moreover, β value can be used to calculate mean free energy of adsorption from given equation:
E = 1 / 2 β
Another adsorption model called Temkin model was applied for non-distinguishable dispersal of binding energy on the surface of adsorbent. Linear form of this model is given as:
qe = BlnAt + BlnCe
where At is the equilibrium constant and Ce is the concentration of adsorbent at equilibrium in mg/L.
Multilayer adsorption on the heterogenous porous surface of the adsorbent can be demonstrated by Harkin-Jura isotherm [17]. Its linear form is given as:
1 q e 2 = B A ( 1 A ) l o g C e
where A and B are the Harkin-Jura constants.

2.2.2. Adsorption Kinetics

Kinetic modeling for pseudo 1st- and pseudo 2nd-order reaction was performing after obtaining the experimental data through subsequent equations. Pseudo 1st-order reaction alternatively known as the Lagergren kinetic equation, which is extensively used to test the adsorption reactions’ kinetic behavior.
log ( q e q t ) = [ log q e { k   1 , a d s t 2.303 } ]
where qt and qe are the dye’s amounts adsorbed at equilibrium, and t is the time and k1,ads is the rate constant for pseudo 1st order reaction having units min−1.
The pseudo 2nd-order reaction gives the information about rate limiting step that can be chemisorption and it involves the complete transfer or sharing of valance electron between adsorbate and adsorbent [21]. It is expressed as:
t q = 1 k 2 , a d s q e 2 + t q t    
where, k2, ads are the pseudo 2nd order equilibrium rate constant having units g mol−1 min−1.

3. Results and Discussion

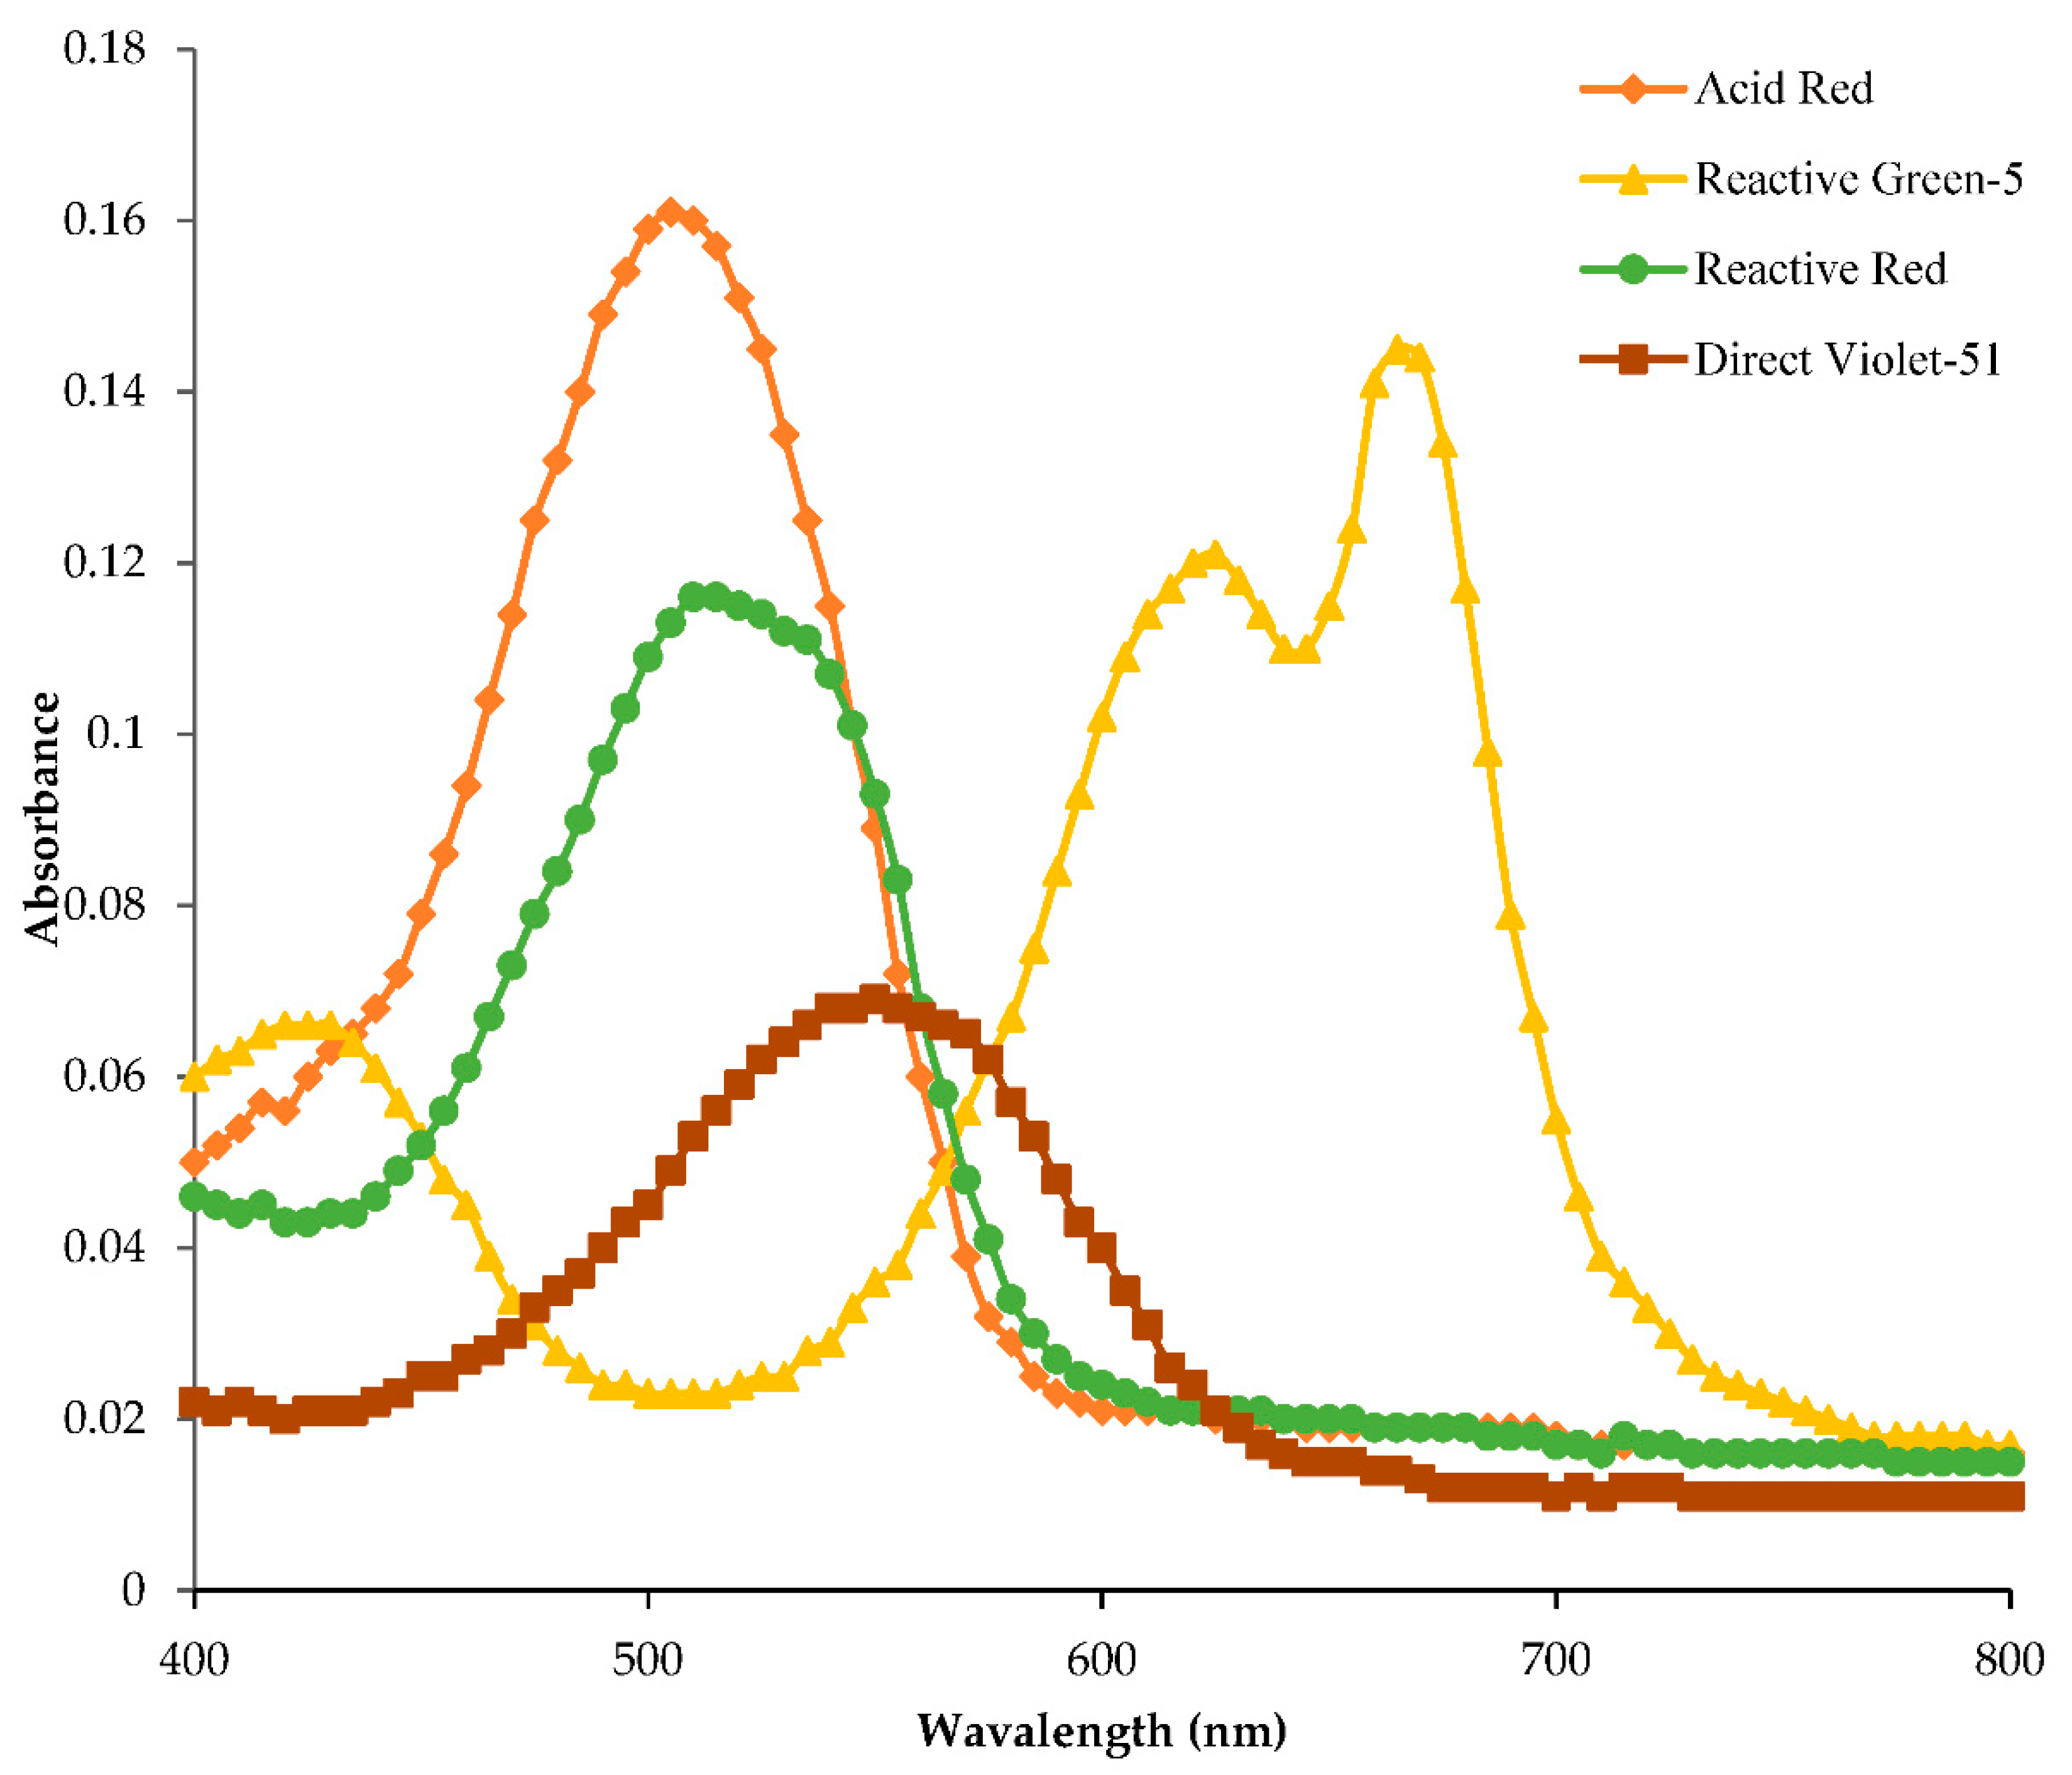
3.1. Spectrophotometric Analysis

Spectrophotometric analysis was performed with UV-visible spectrophotometer to calculate the maximum absorption wavelengths for four dyes under study. The solution (100 ppm) of each dye was prepared, and absorbance was recorded from 335 nm to 1000 nm using appropriate blank solution. The maximum absorption wavelengths were as follows: 668 nm for Reactive Green-5 dye, 549 nm for Direct violet-51 dye, 515 nm for Reactive Red dye, and 507 nm for Acid Red dye (Figure 1).

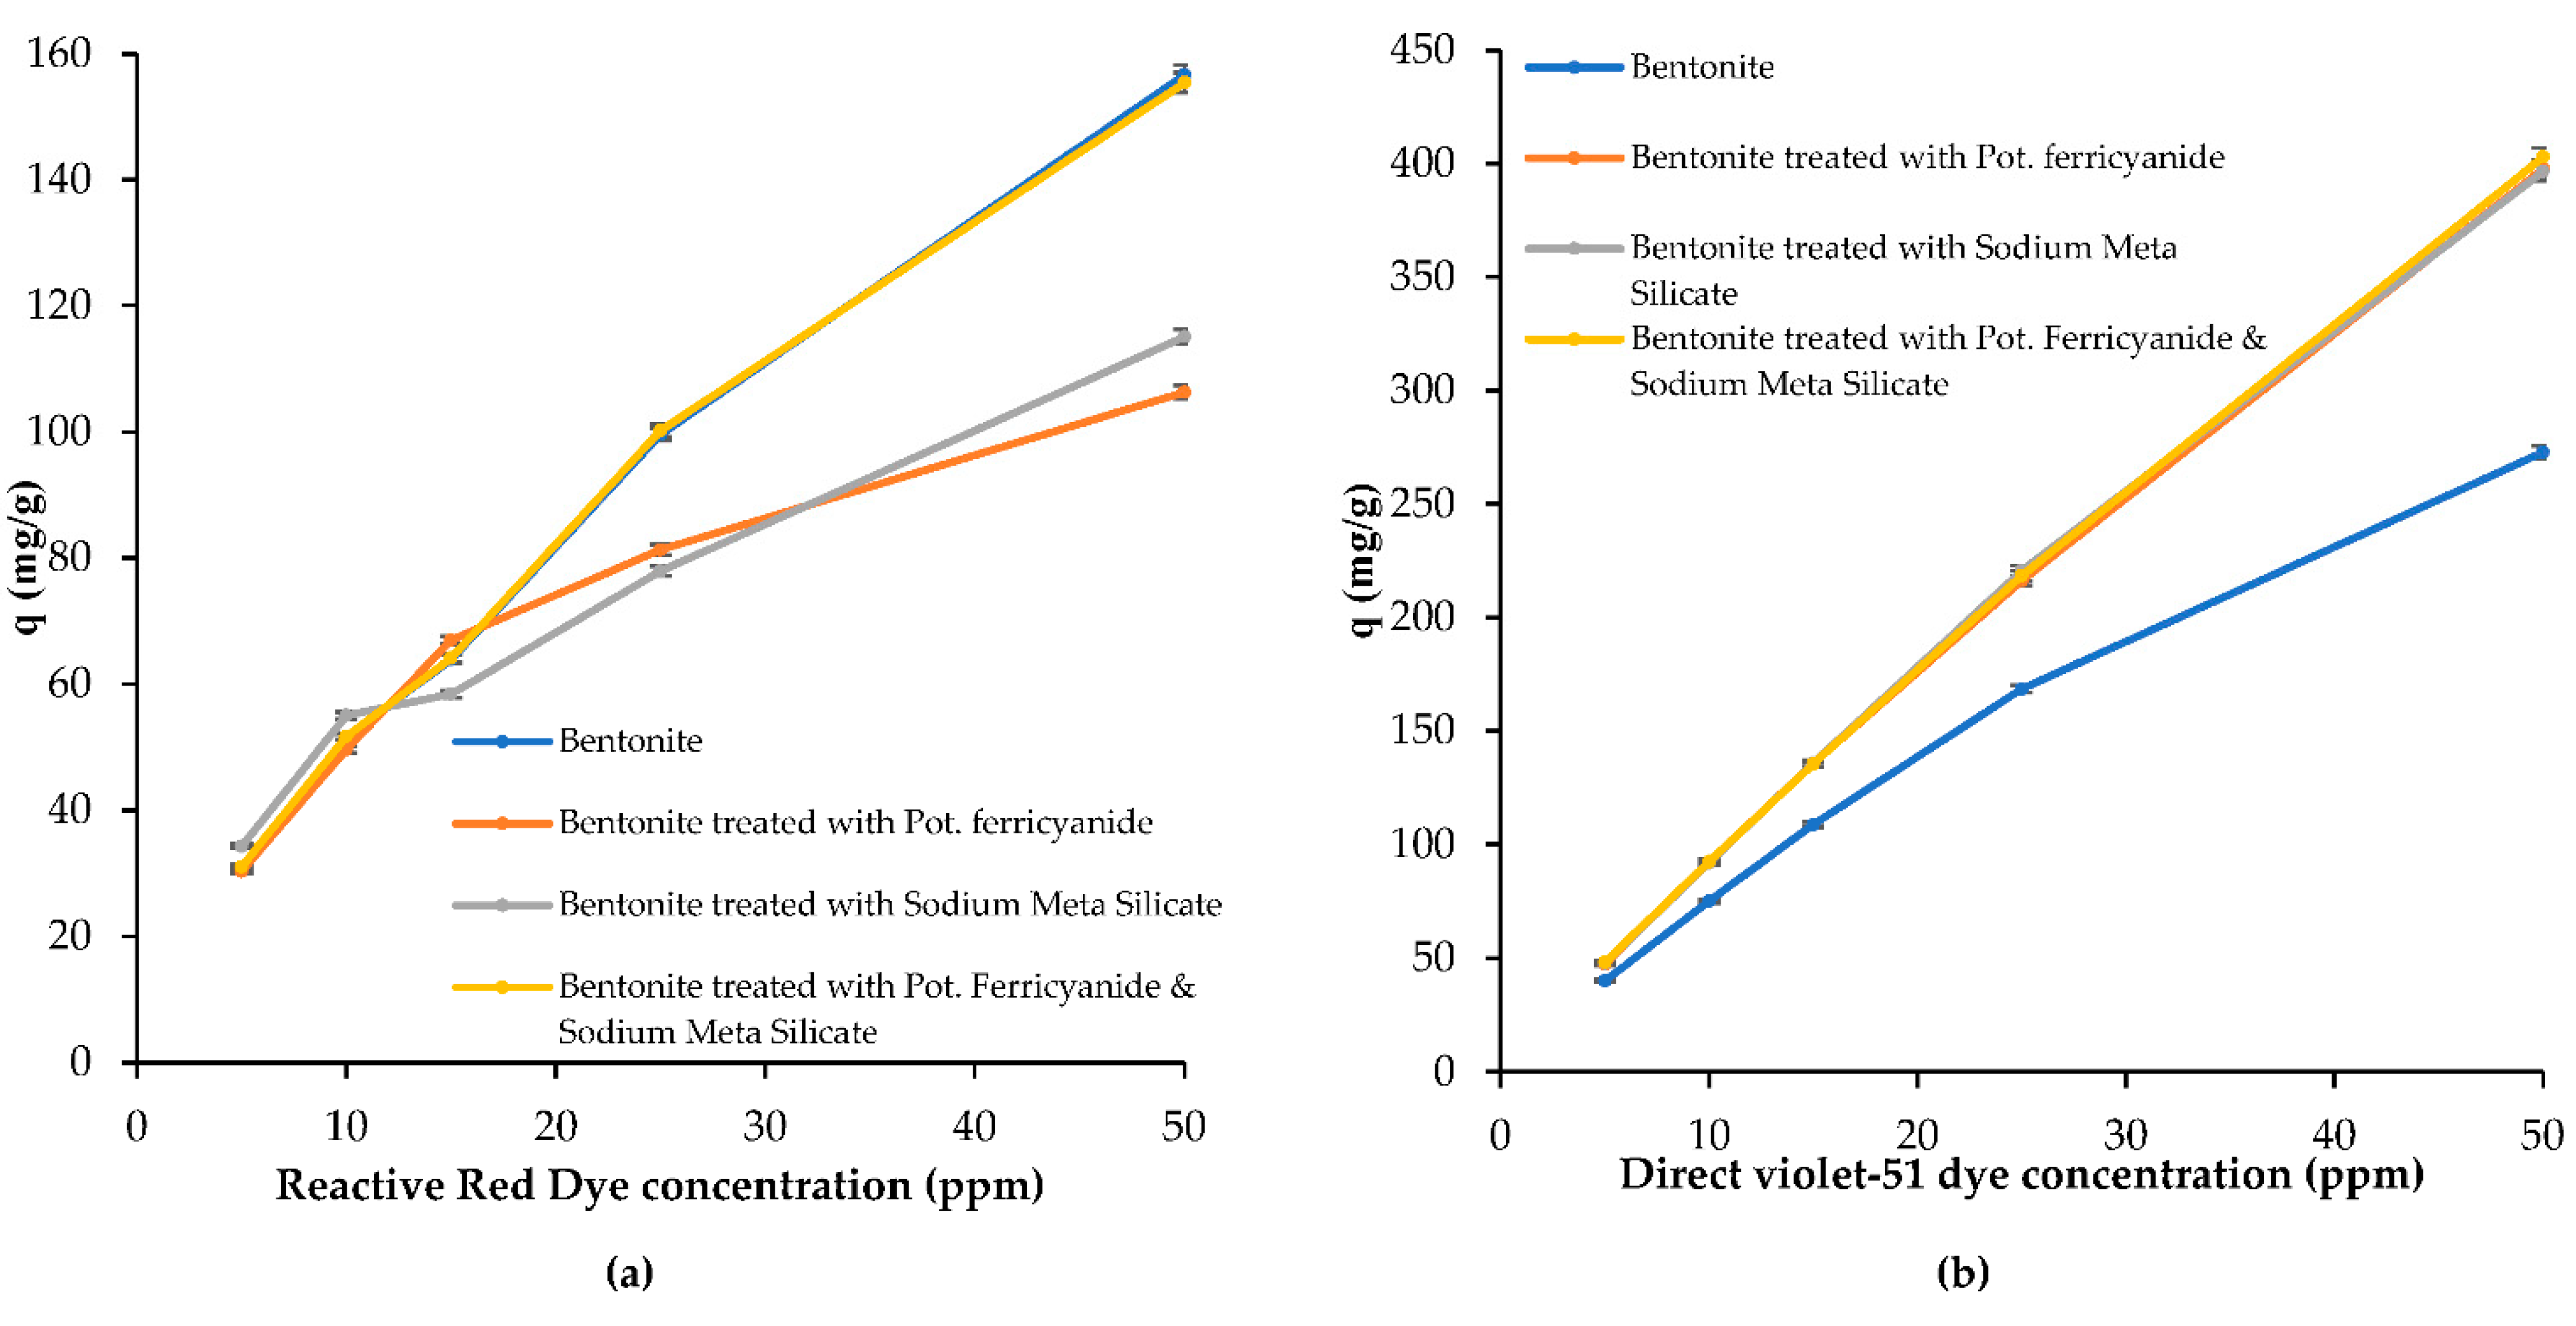
3.2. Effect of Initial Dye Concentration

Initial dye concentration is responsible for the mass transfer between aqueous and solid phases because it provides the driving force. Increase in initial dye concentration may increase or decrease the percentage dye removal depending on the nature of dye (i.e., cationic or anionic). The amount of dye (mg/g) removed increases with increases in initial dye concentration [22]. Different concentration solutions (5, 10, 15, 25, and 50 ppm), of all four dyes (Reactive red, Direct violet-51, Reactive green-5, and Acid red dye) were prepared and analyzed after the shaking with different combinations of modified bentonite adsorbent (sodium metasilicate and potassium ferricyanide) (Figure 2). The results obtained from spectrophotometer were utilized to make adsorption capacity graph for different adsorbents [23]. Bentonite treated with sodium metasilicate removed 68% of reactive red dye, bentonite treated with sodium metasilicate and potassium ferricyanide removed 62% of reactive red dye, and both pure bentonite and bentonite treated with potassium ferricyanide removed 60% of reactive red dye from the solution.
Bentonite treated with sodium metasilicate and potassium ferricyanide removed 96.6% of direct violet-51 dye, bentonite treated with sodium metasilicate removed 95%, bentonite treated with potassium ferricyanide removed 94%, and pure bentonite removed 80% of the dye from the solution. Bentonite treated with potassium ferricyanide removed 92%, bentonite treated with sodium metasilicate removed 45.7%, bentonite treated with sodium metasilicate and potassium ferricyanide removed 60.6%, and pure bentonite removed 91% of acid red dye from the solution. Bentonite treated with potassium ferricyanide removed 69%, bentonite treated with sodium metasilicate removed 60%, bentonite treated with sodium metasilicate and potassium ferricyanide removed 50% and pure bentonite removed 45% of reactive green-5 dye solution.

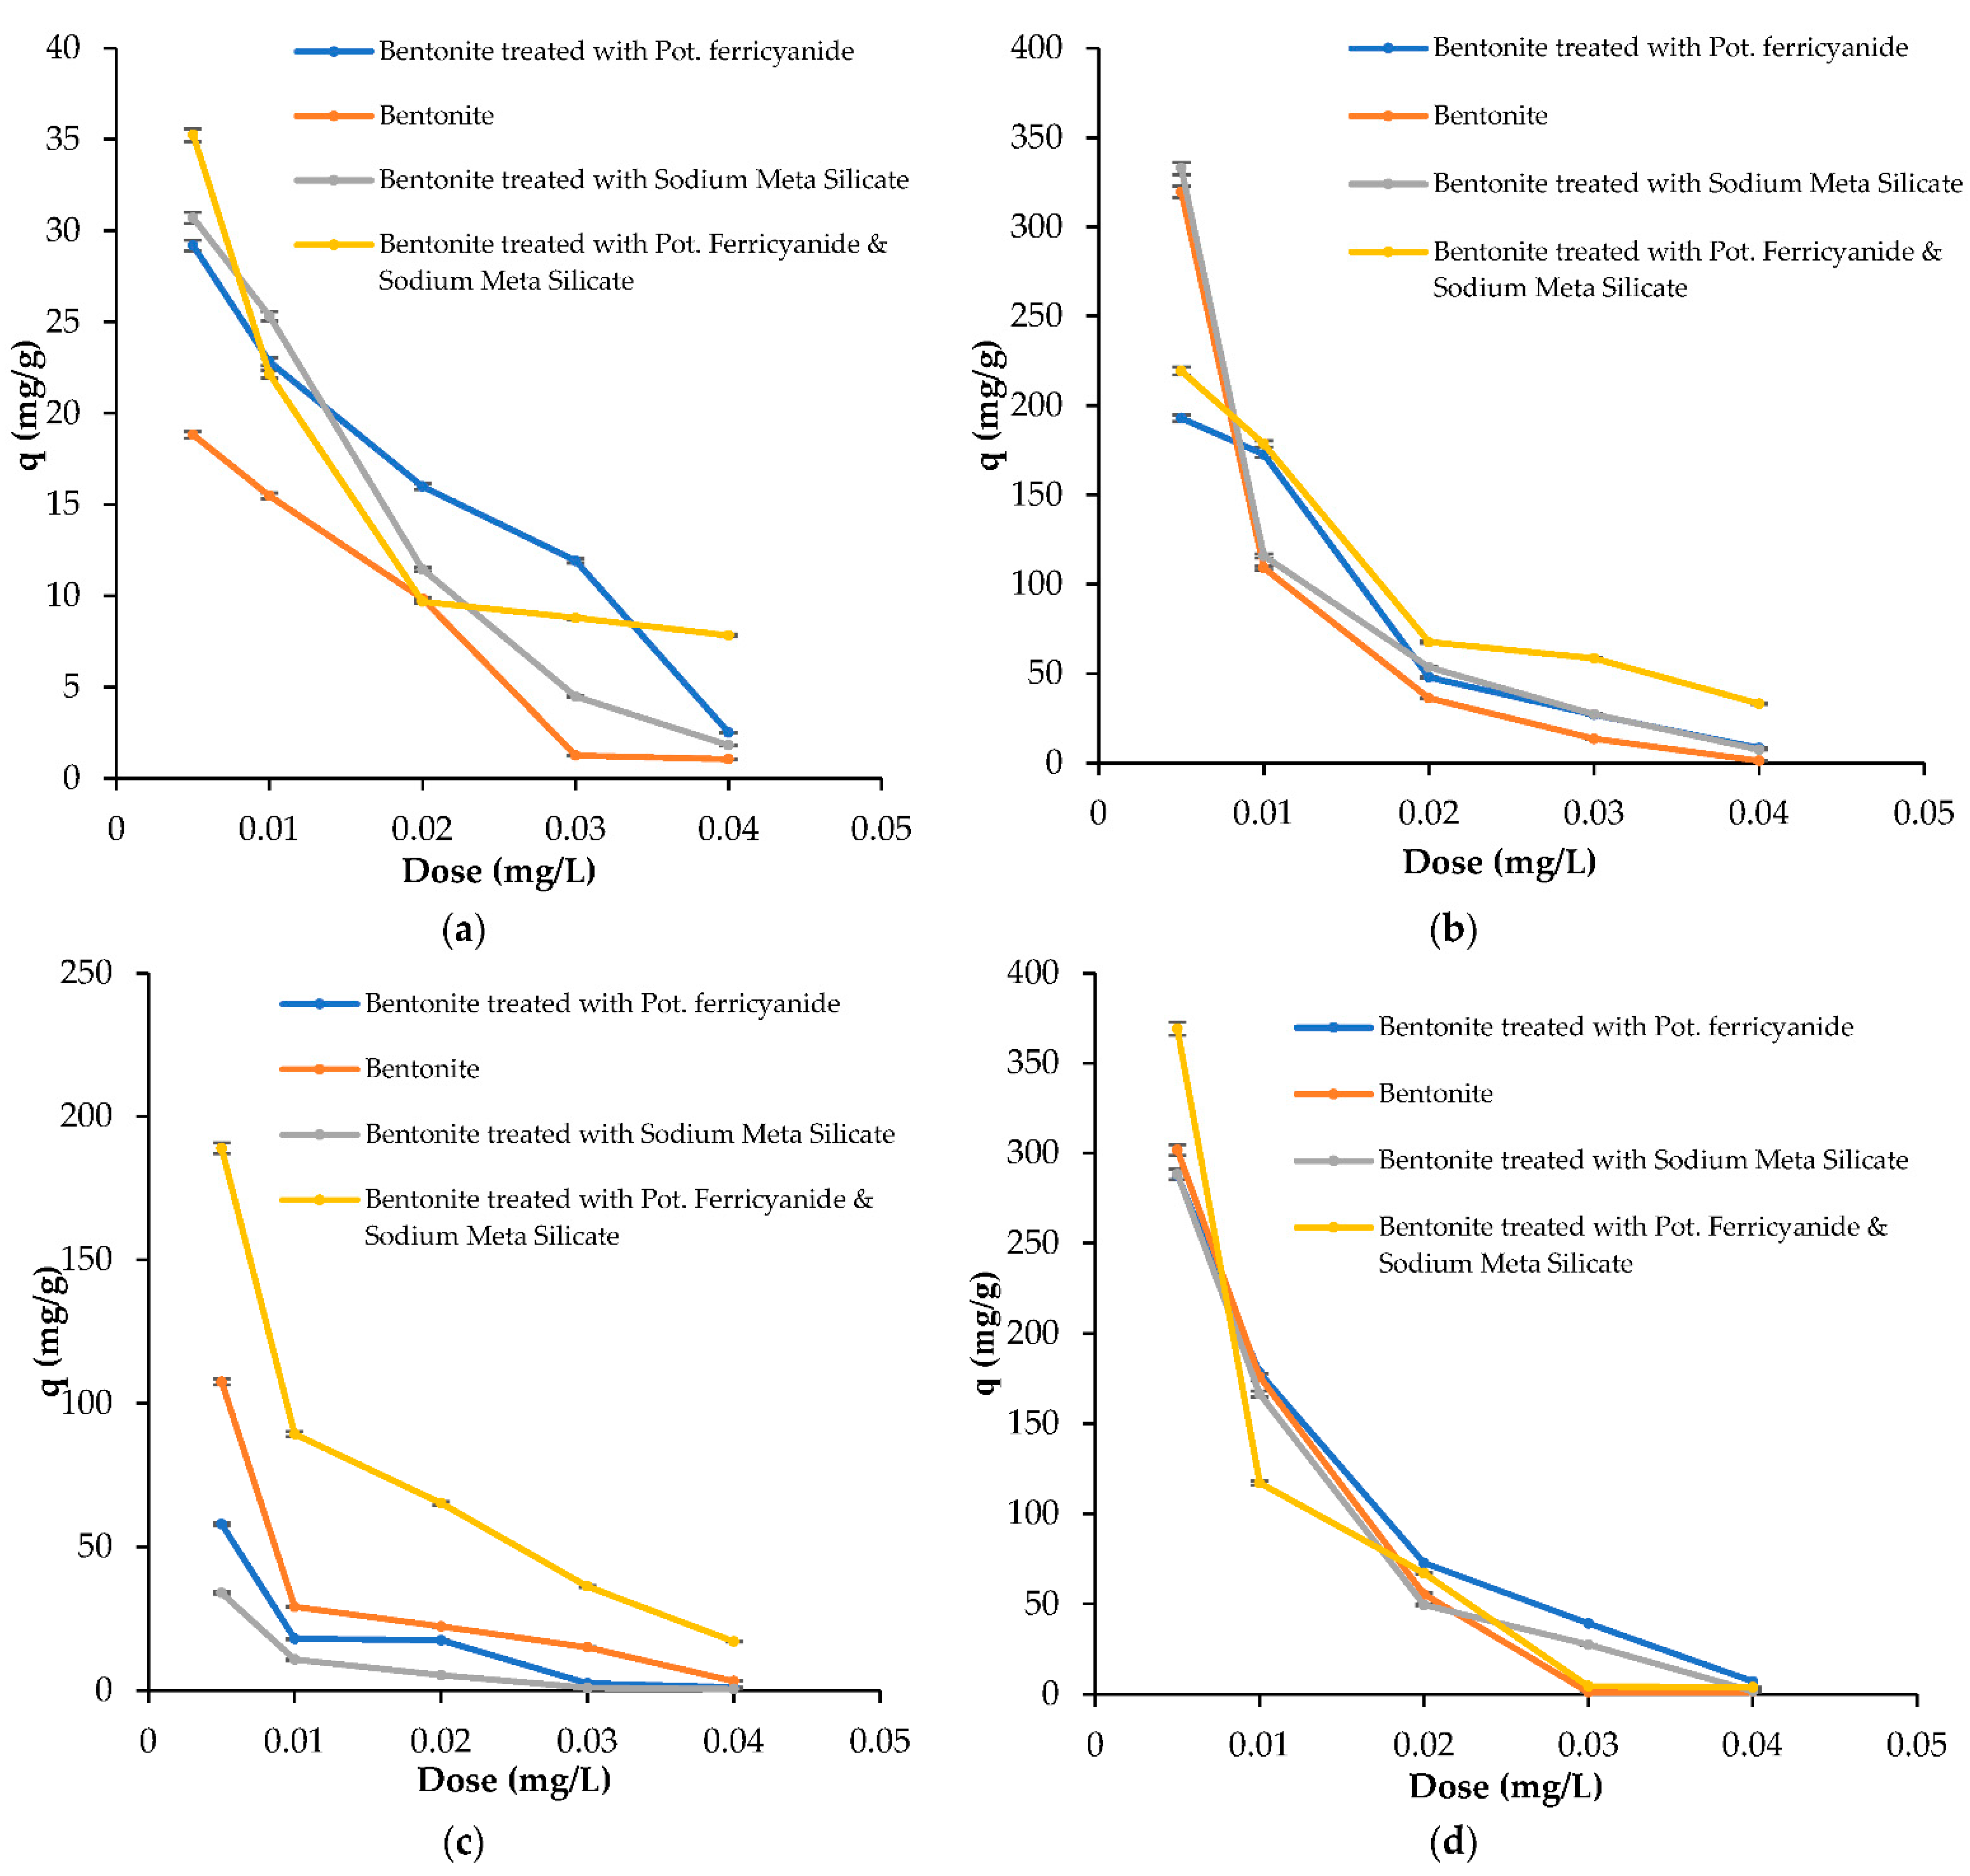
3.3. Effect of Adsorbent Dosage

The determination of the effect of adsorbent dose is very important because it estimates the capacity of adsorbent to remove the amount of dye. Initially the amount of dye adsorption increases because of empty active sites on the adsorbent surface [20]. Once the equilibrium was attained, desorption started as it is clearly evident from the graphs in Figure 3. This was because of the overlapping of active sites of adsorbent with their own molecules. The removal of all four dyes from 50 ppm dye solution with four different adsorbents (bentonite treated with sodium metasilicate, bentonite treated with potassium ferricyanide, bentonite treated with sodium metasilicate and potassium ferricyanide, and pure bentonite) at varying doses 0.05, 0.1, 0.2, 0.3, and 0.4 g while keeping all other parameters constant was observed. Figure 3a shows the effect of dose on reactive red dye, while Figure 3b–d are showing the effect of dose on Direct violet-51, Acid red, and Reactive green-5 dyes at different adsorbent dosage.

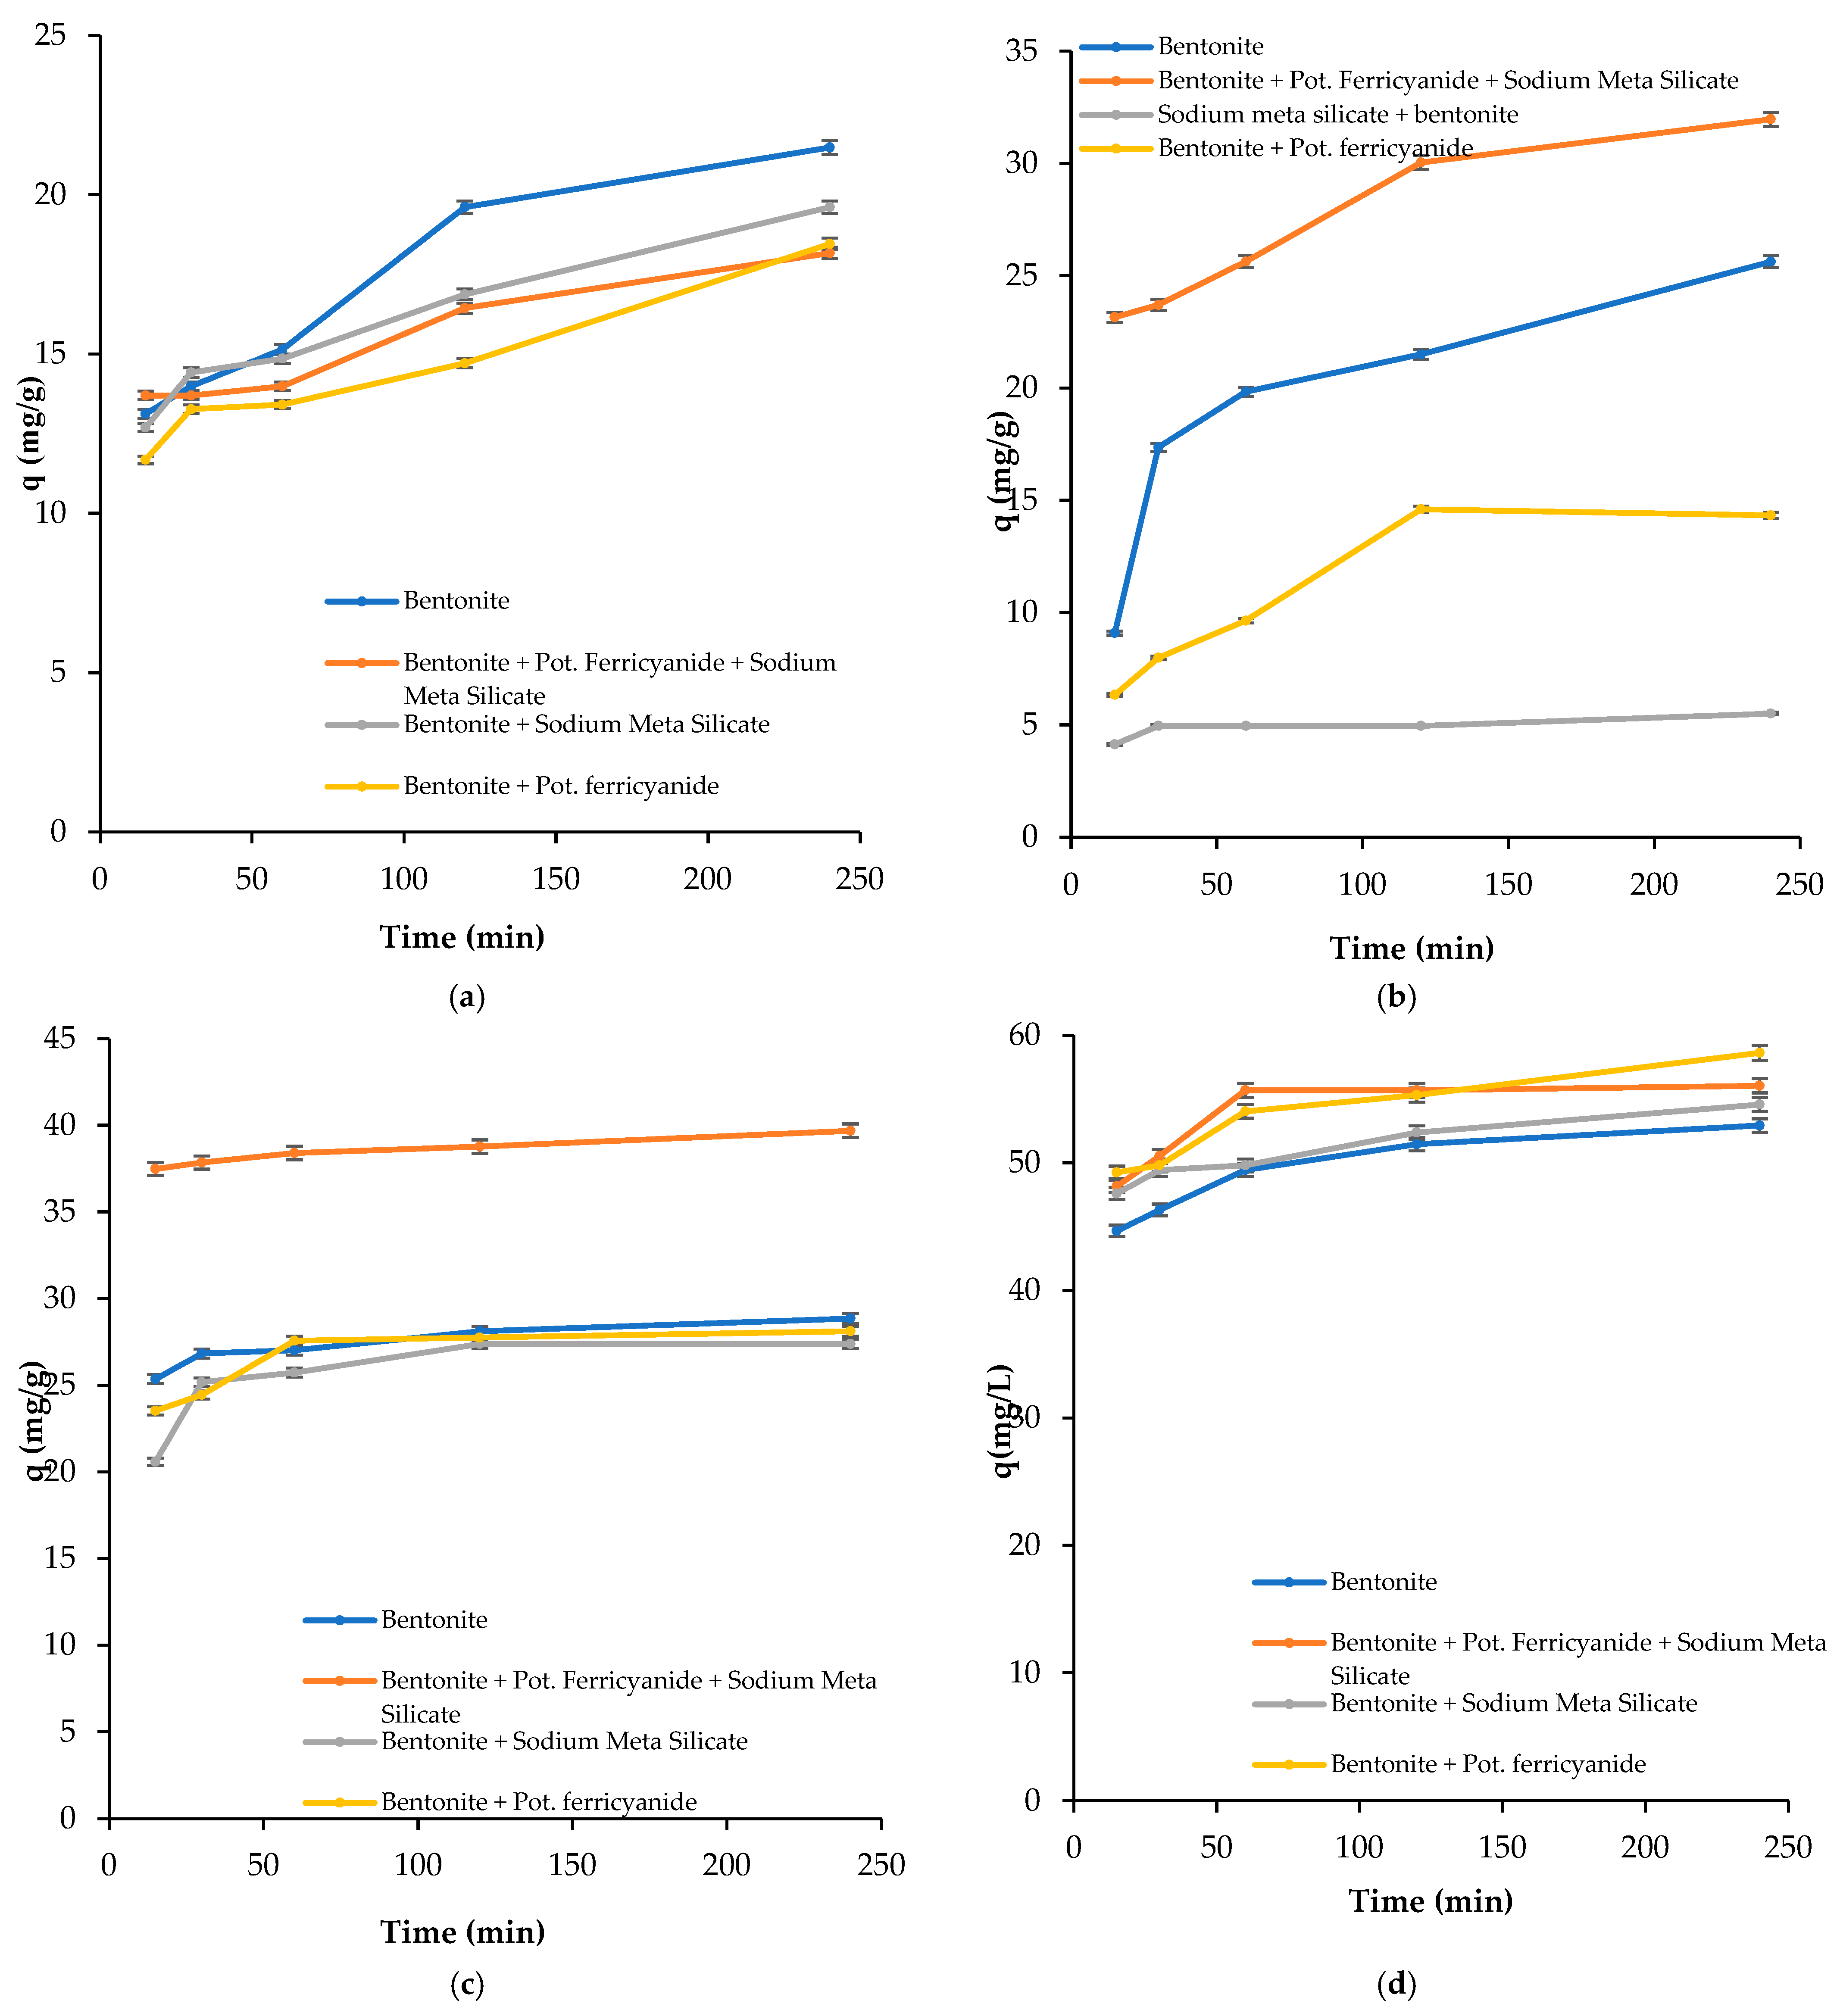
3.4. Effect of Contact Time

The effect of contact time was observed at a variety of temperatures for each solution using 0.05 mg dose of adsorbents at 30, 40, 50, 60, and 70 °C at varying times: 15, 30, 60, 120, 240 min while keeping all other parameters constant. The amount of dye removed (mg/g) increased with increase in contact time. After gaining equilibrium at certain times, it became constant because all the active sites were occupied. Different temperatures were used to disturb the equilibrium and its re-establishment.
It is evident from Figure 4a that pure bentonite showed maximum efficiency at 70 °C in case of acid red dye, but bentonite treated with mixture of sodium metasilicate and potassium ferricyanide showed more efficient results in the presence of direct violet-51 dye, Figure 4b. Furthermore, bentonite treated with potassium ferricyanide and sodium metasilicate showed maximum absorption at 70 °C for reactive red dye solution, Figure 4c while bentonite treated with potassium ferricyanide and mixture of sodium metasilicate and potassium ferricyanide showed almost same absorption pattern, Figure 4d for reactive green-5 dye. All of them established equilibrium after 240 min.

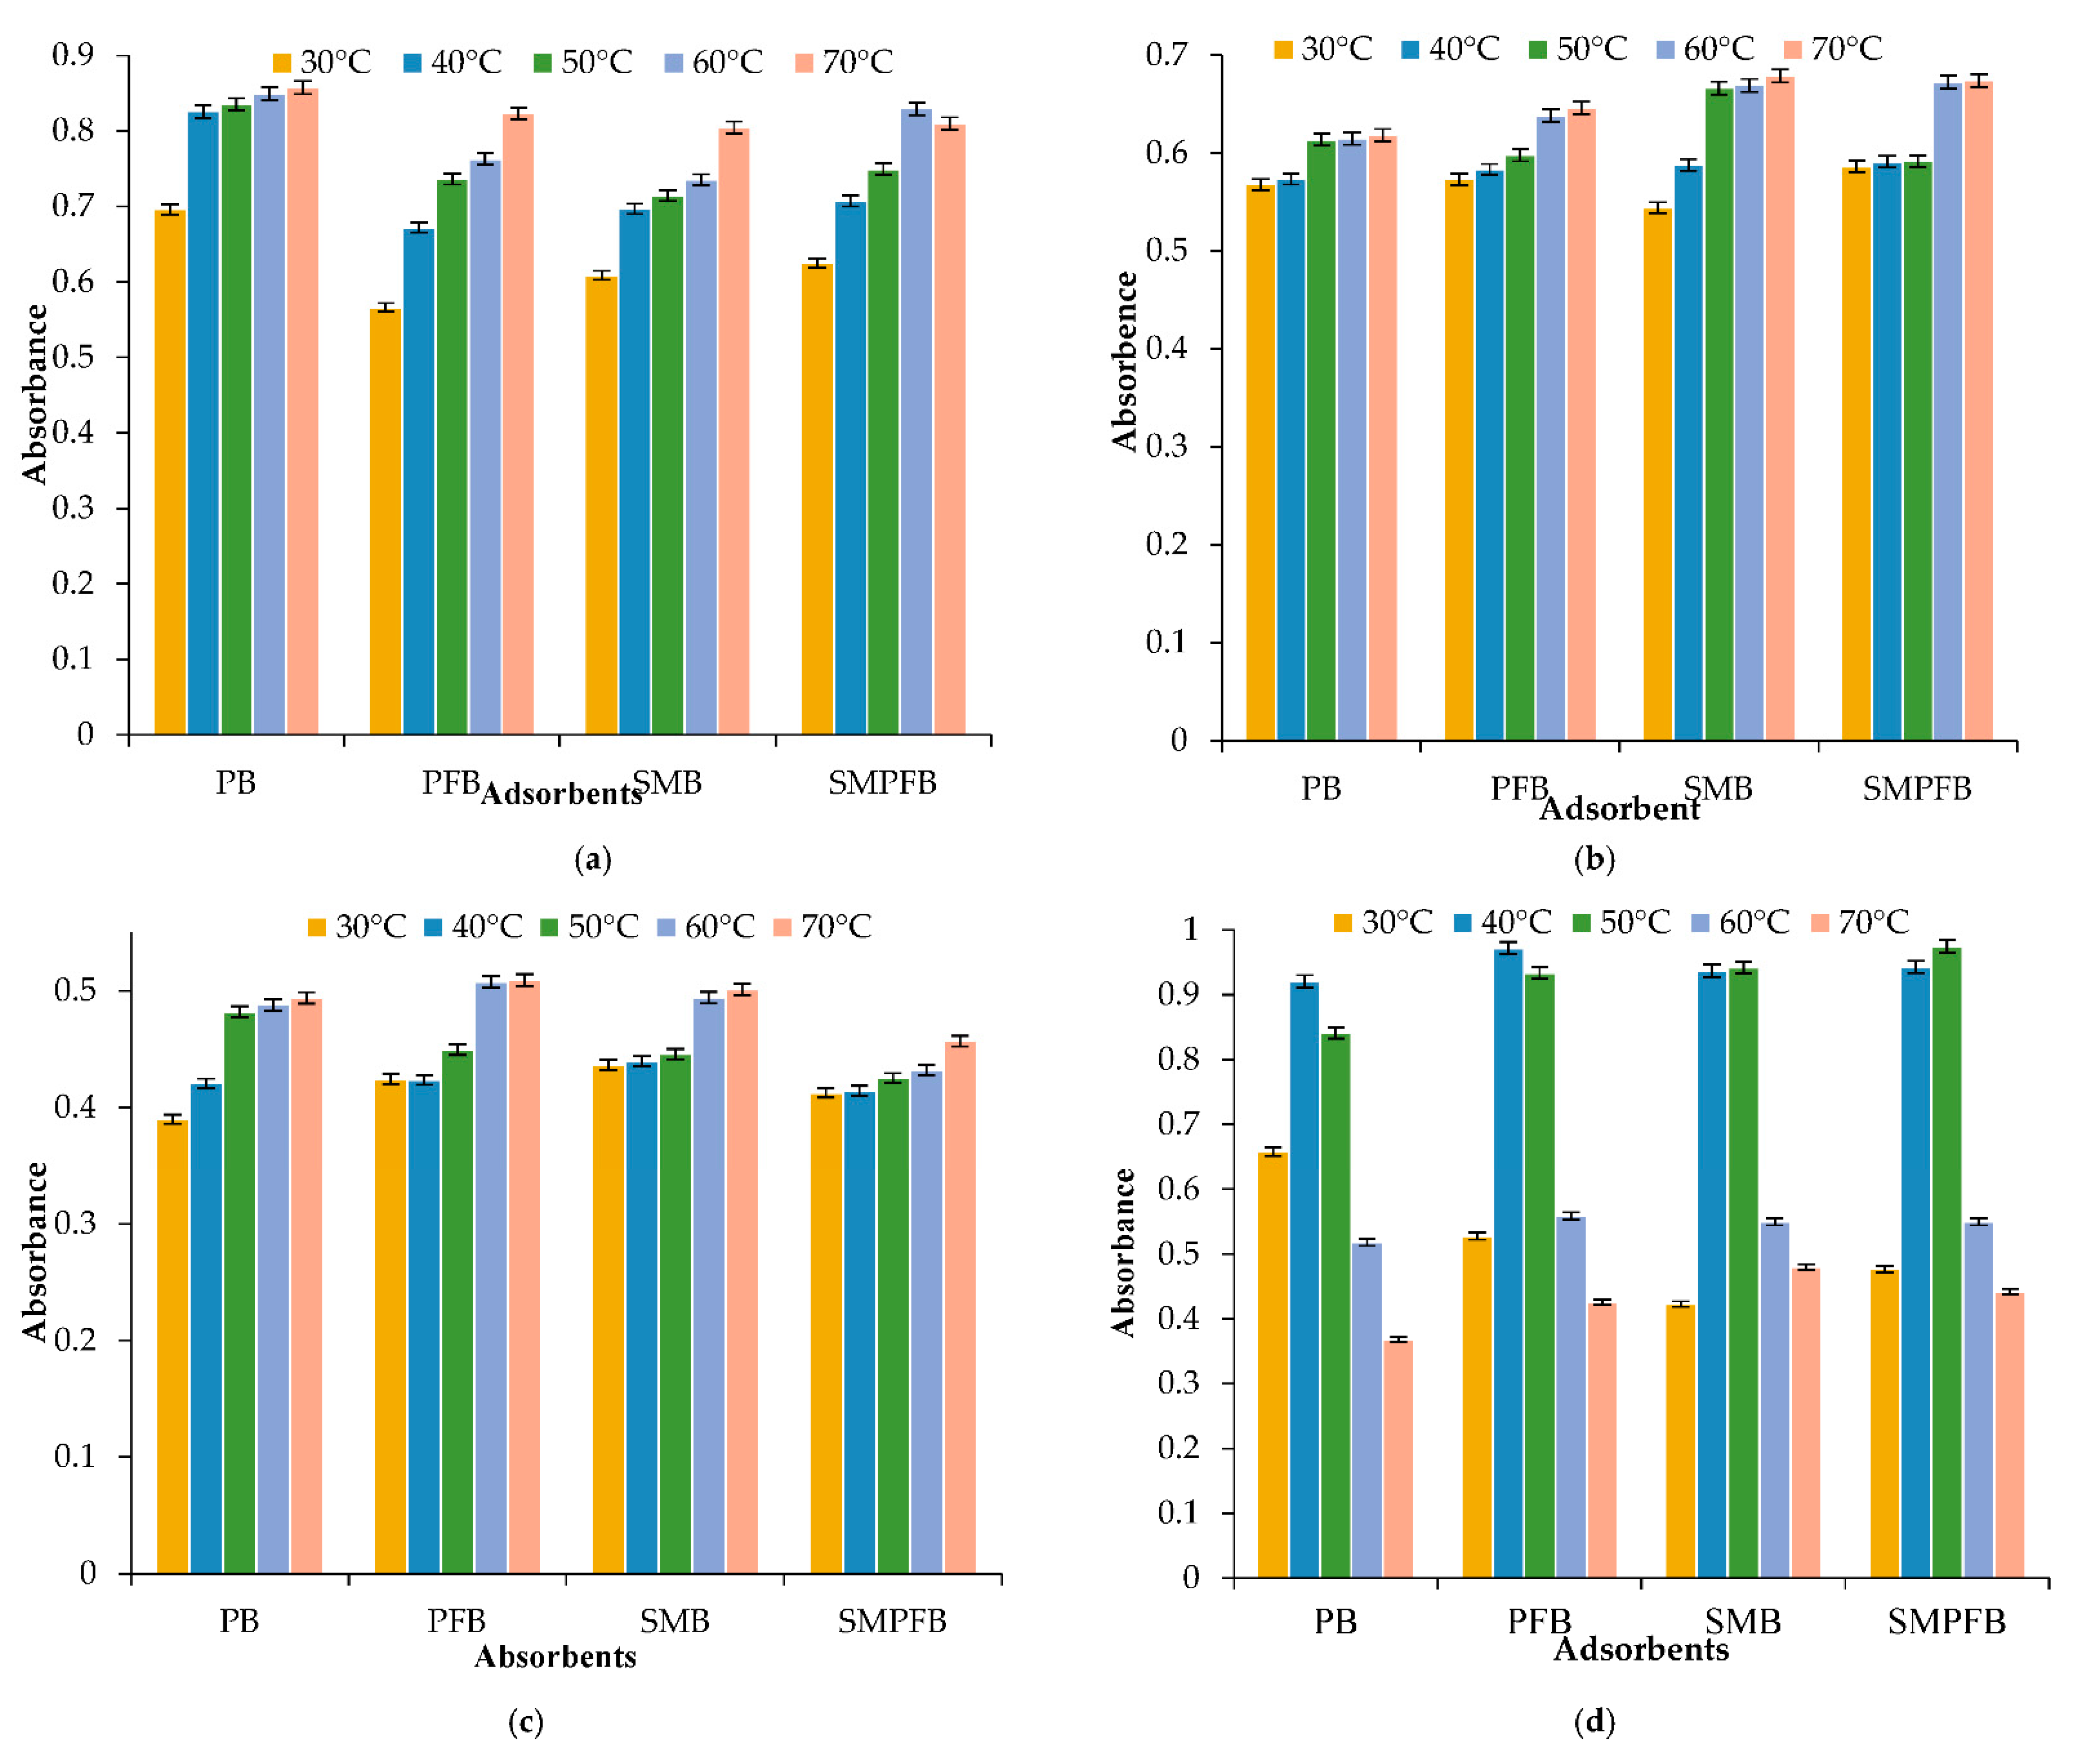
3.5. Effect of Temperature
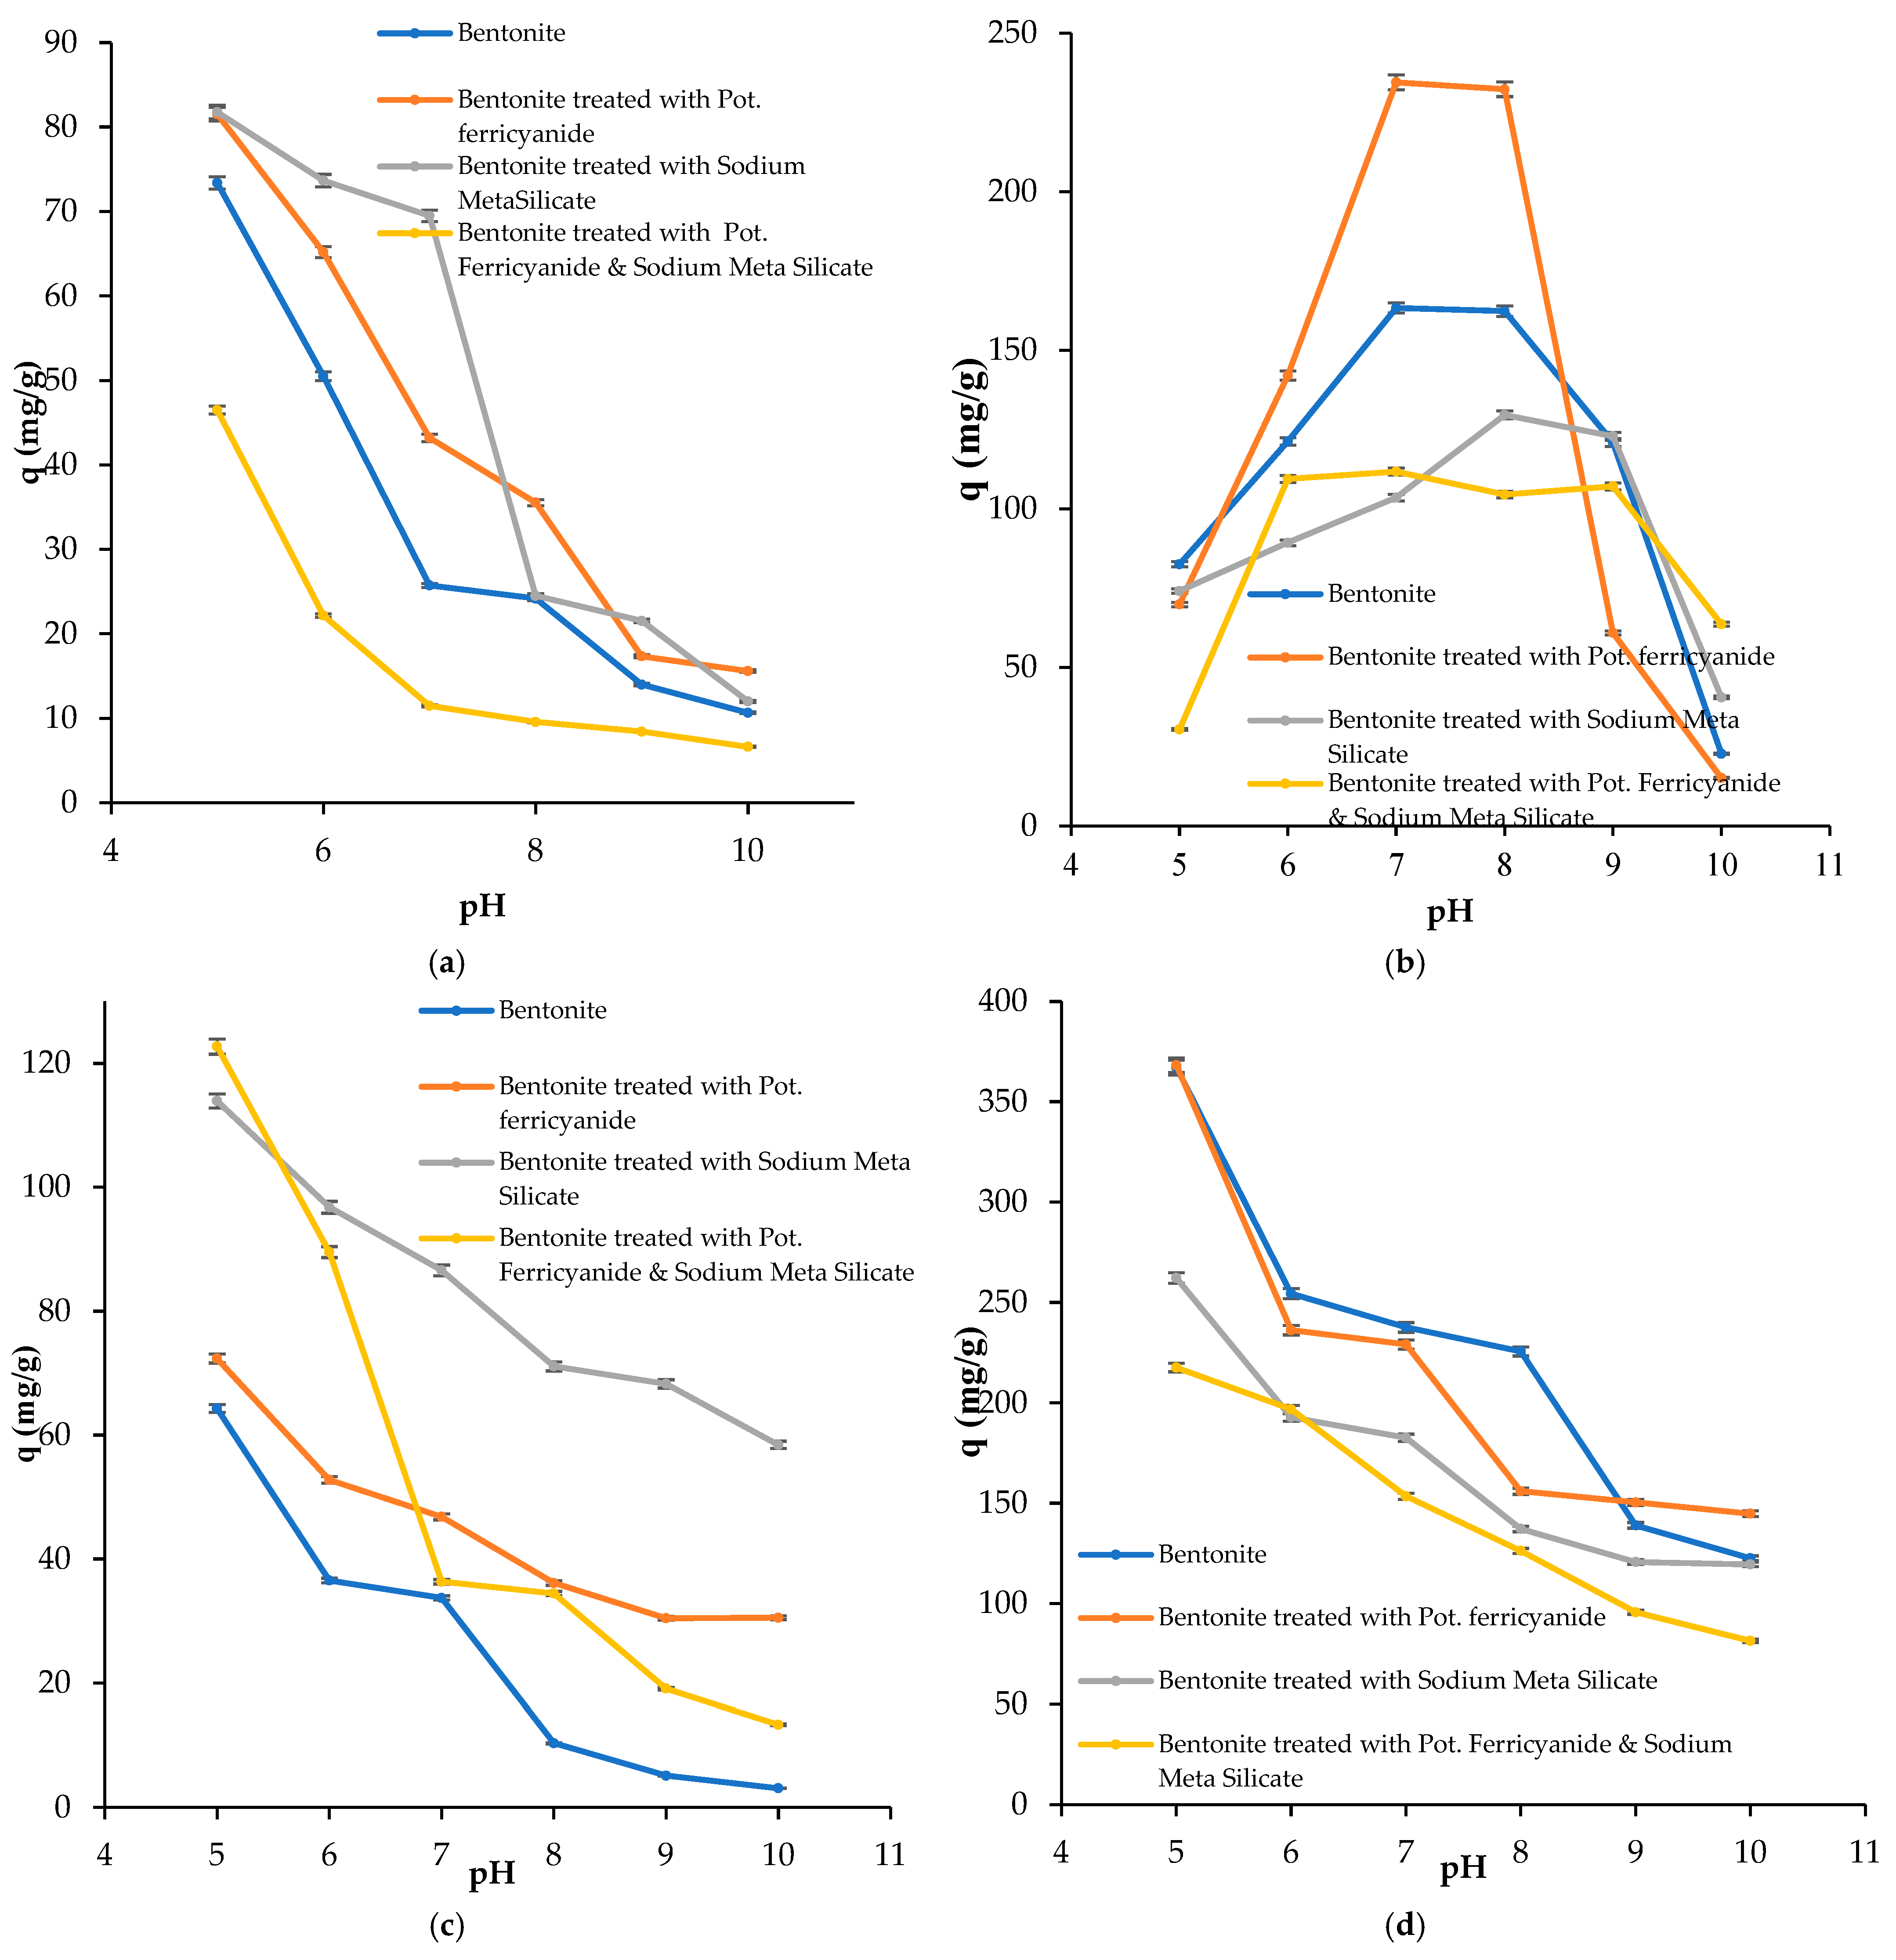
Temperature is one of the important variables in natural water system. Change in temperature affect the adsorption process in two ways; either before attaining the equilibrium or after attaining the equilibrium. Adsorption of dyes can be endothermic or exothermic process [24]. The effect of temperature at 30, 40, 50, 60, and 70 °C.
Figure 5a–d shows the adsorption of dyes using various adsorbents by fixing other parameters. Figure 5a shows the maximum adsorption of reactive red dye at 70 °C with modifier sodium metasilicate and potassium ferricyanide and Figure 5b,c shows adsorption capacities of acid red, and reactive green-5 at 60 and 70 °C, respectively. In case of direct violet-51 dye, bentonite treated with sodium metasilicate absorbed higher amount of dye from the solution at 40 and 50 °C as shown in Figure 5d. Above this temperature the composite active sites denatured hence the process of desorption starts. It indicates that direct violet-51 dye adsorption using composite materials was a highly exothermic reaction.

3.6. Effect of pH

The process of adsorption is also affected by the change in pH because it changes the chemical structure of both the adsorbent and the adsorbate. Anionic dye adsorption is generally favored by the negatively charged adsorbent’s surfaces at low pH values or in acidic media. On the other hand, cationic dyes show more adsorption at high pH values. Bentonite as a whole is neutral but when was treated with sodium metasilicate, the surface become anionic due to which anionic dyes showed more adsorption at low pH values.
In case of acidic red and reactive red dye they show more adsorption with sodium metasilicate at lower pH values than other adsorbents as shown in graph as presented in Figure 6a,c. This is because of the anionic nature of the acid red and reactive red dye, while the rest of dyes i.e., reactive green-5 and direct violet-51 are cationic in nature, which is why they showed less adsorption at lower pH as indicated in Figure 6b,d.

3.7. Isothermal Adsorption Models

To understand the mechanism of adsorption reactions, adsorption data or equilibrium data is very important. Five different isothermal models including Freundlich isotherm, Langmuir isotherm, Harkin-Jura, Temkin, and Dubinin Radushkevich isotherms were applied to the data (Table 1). The best fit model was Freundlich isotherm model for all the dyes under study. Freundlich isotherm model possessed the highest regression coefficient values i.e., 1 > R2 > 0.96. The difference between experimental and estimated qe (mg/g) values was also smaller for this model. These results signify that the adsorption process showed by the Acid red dye, Direct violet-51, Reactive red, and Reactive green-5 dye was a multilayered process [25].
Pure bentonite showed the highest regression coefficient when treated with reactive green-5 as evident from the Table 1. In the case of reactive red dye, the composite mixture having bentonite, sodium metasilicate, and potassium ferricyanide showed the highest regression coefficient, while direct violet-51 and acid red dye showed highest regression coefficient for bentonite treated with potassium ferricyanide and bentonite treated with sodium metasilicate as indicated in Table 1.

3.8. Kinetic Adsorption Models

3.8.1. Pseudo 1st-Order Model

The values of qe and k1 were calculate (ed from intercept and slop of the plotted graph between time (t) and log (qe − qt). The difference obtained between the experimental and calculated q and R2 showed that these dyes were not following pseudo 1st-order kinetics (Table 2).

3.8.2. Pseudo 2nd Order Model

The values of qe and k1 were calculated from intercept and slop of the plotted graph between time (t) and t/qt. Pseudo 2nd-order kinetics follow the assumption that the rate limiting step could be chemisorption which indicate the involvement of valance electron among the adsorbate and adsorbent through sharing or exchange of electrons. Adsorption capacities (qe) calculated from the data were maximum during this case. Moreover, R2 were also between 1 and 0.99 i.e., (1 ≥ R2 > 0.99). This indicated that all the dyes were obeying the pseudo 2nd order kinetics (Table 2).
Table 2a showed the values of adsorption kinetics for reactive green-5 dye and at maximum temperature of 70 °C showed the highest adsorption capacities for bentonites treated with sodium metasilicate and potassium ferricyanide (BSMPF) composite and bentonite treated with potassium ferricyanide (BPF) composite. Table 2b shows the results for reactive red dye for all the modified composites. Table 2c,d showed the adsorption capacities for acid red and direct violet-51 dyes and highest adsorption capacities for BSM and BSMPF, respectively [26].

3.9. Characterization of Bentonite

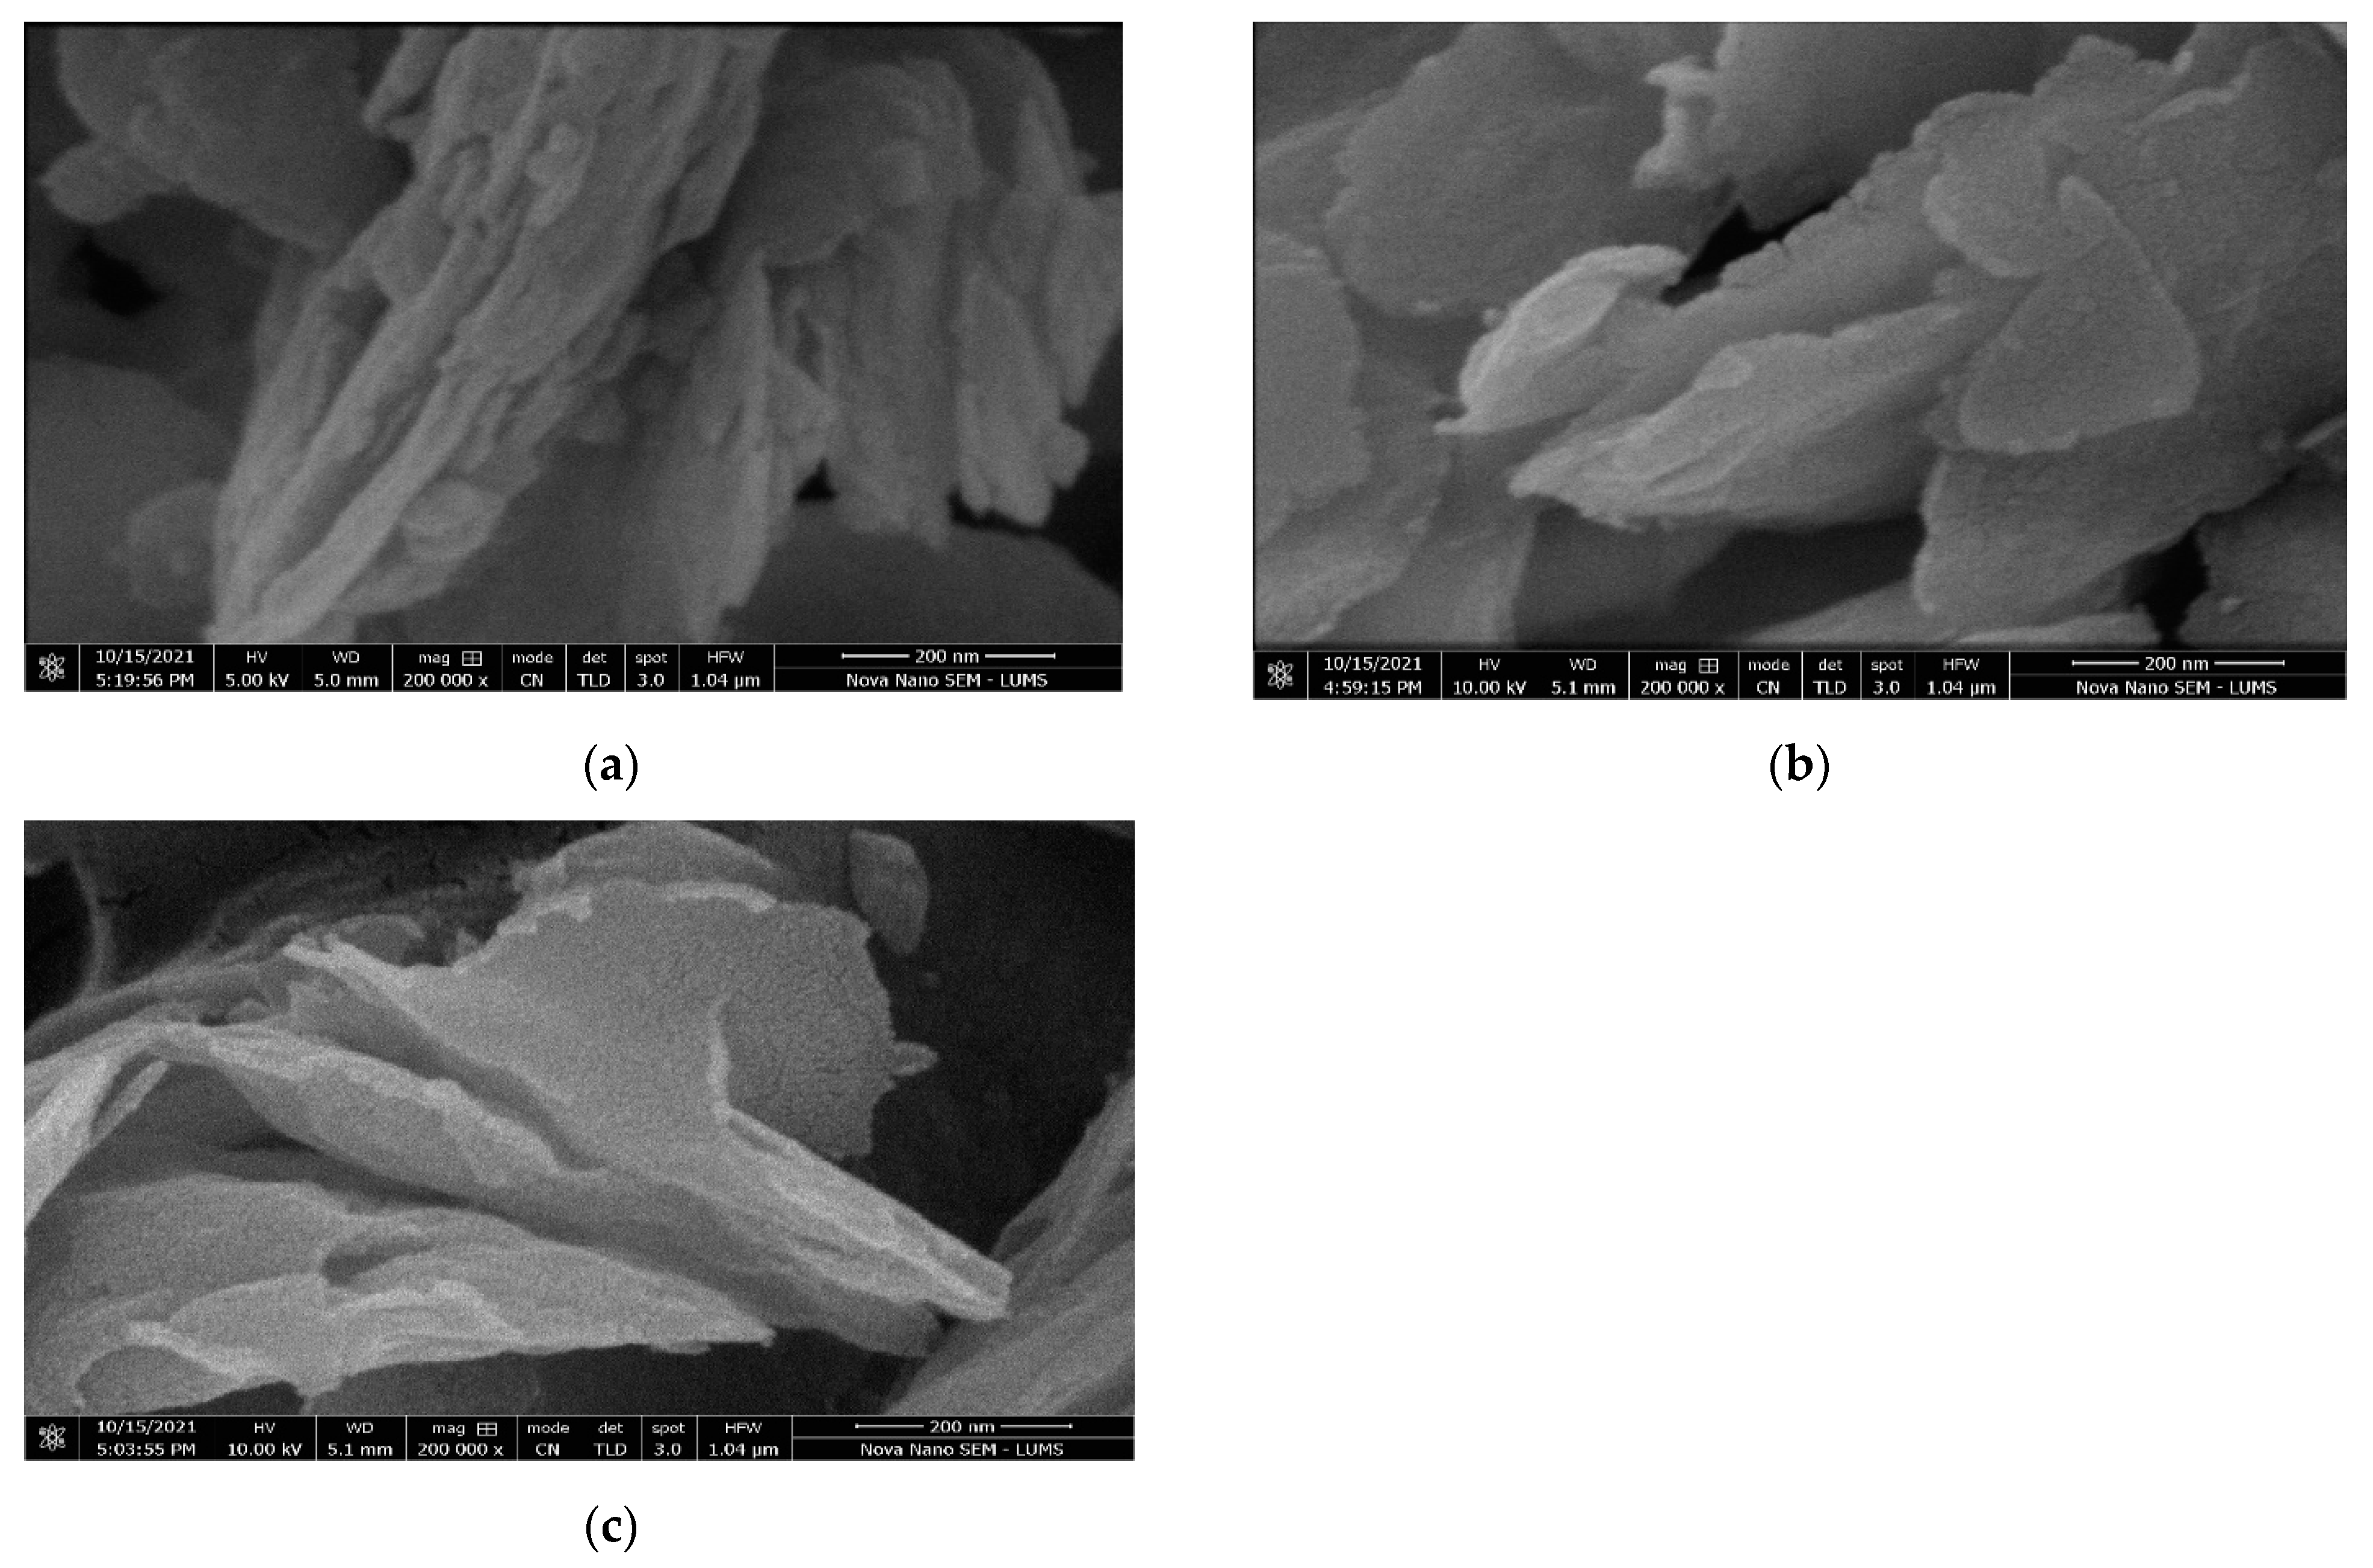
3.9.1. Scanning Electron Microscopy (SEM) Analysis

SEM has been used to see structure and surface topology of pure and modified bentonite nanocomposites. It explained much about the morphological modifications that potassium ferricyanides and sodium metasilicate brought. Raw or pure bentonite had closely packed flakes due to which it appeared smooth in SEM image at 200 nm in Figure 7a [27].
While bentonite treated with sodium metasilicate, and bentonite treated with potassium ferricyanide and sodium metasilicate mixture had loosely bounded structure and allowing more binding sites for adsorption in Figure 7b,c, respectively. Bentonite treated with sodium metasilicate composite contained spherical particles and mixture composite of bentonite treated with potassium ferricyanide and sodium metasilicate showed spike like particles with heterogenous surface [28].

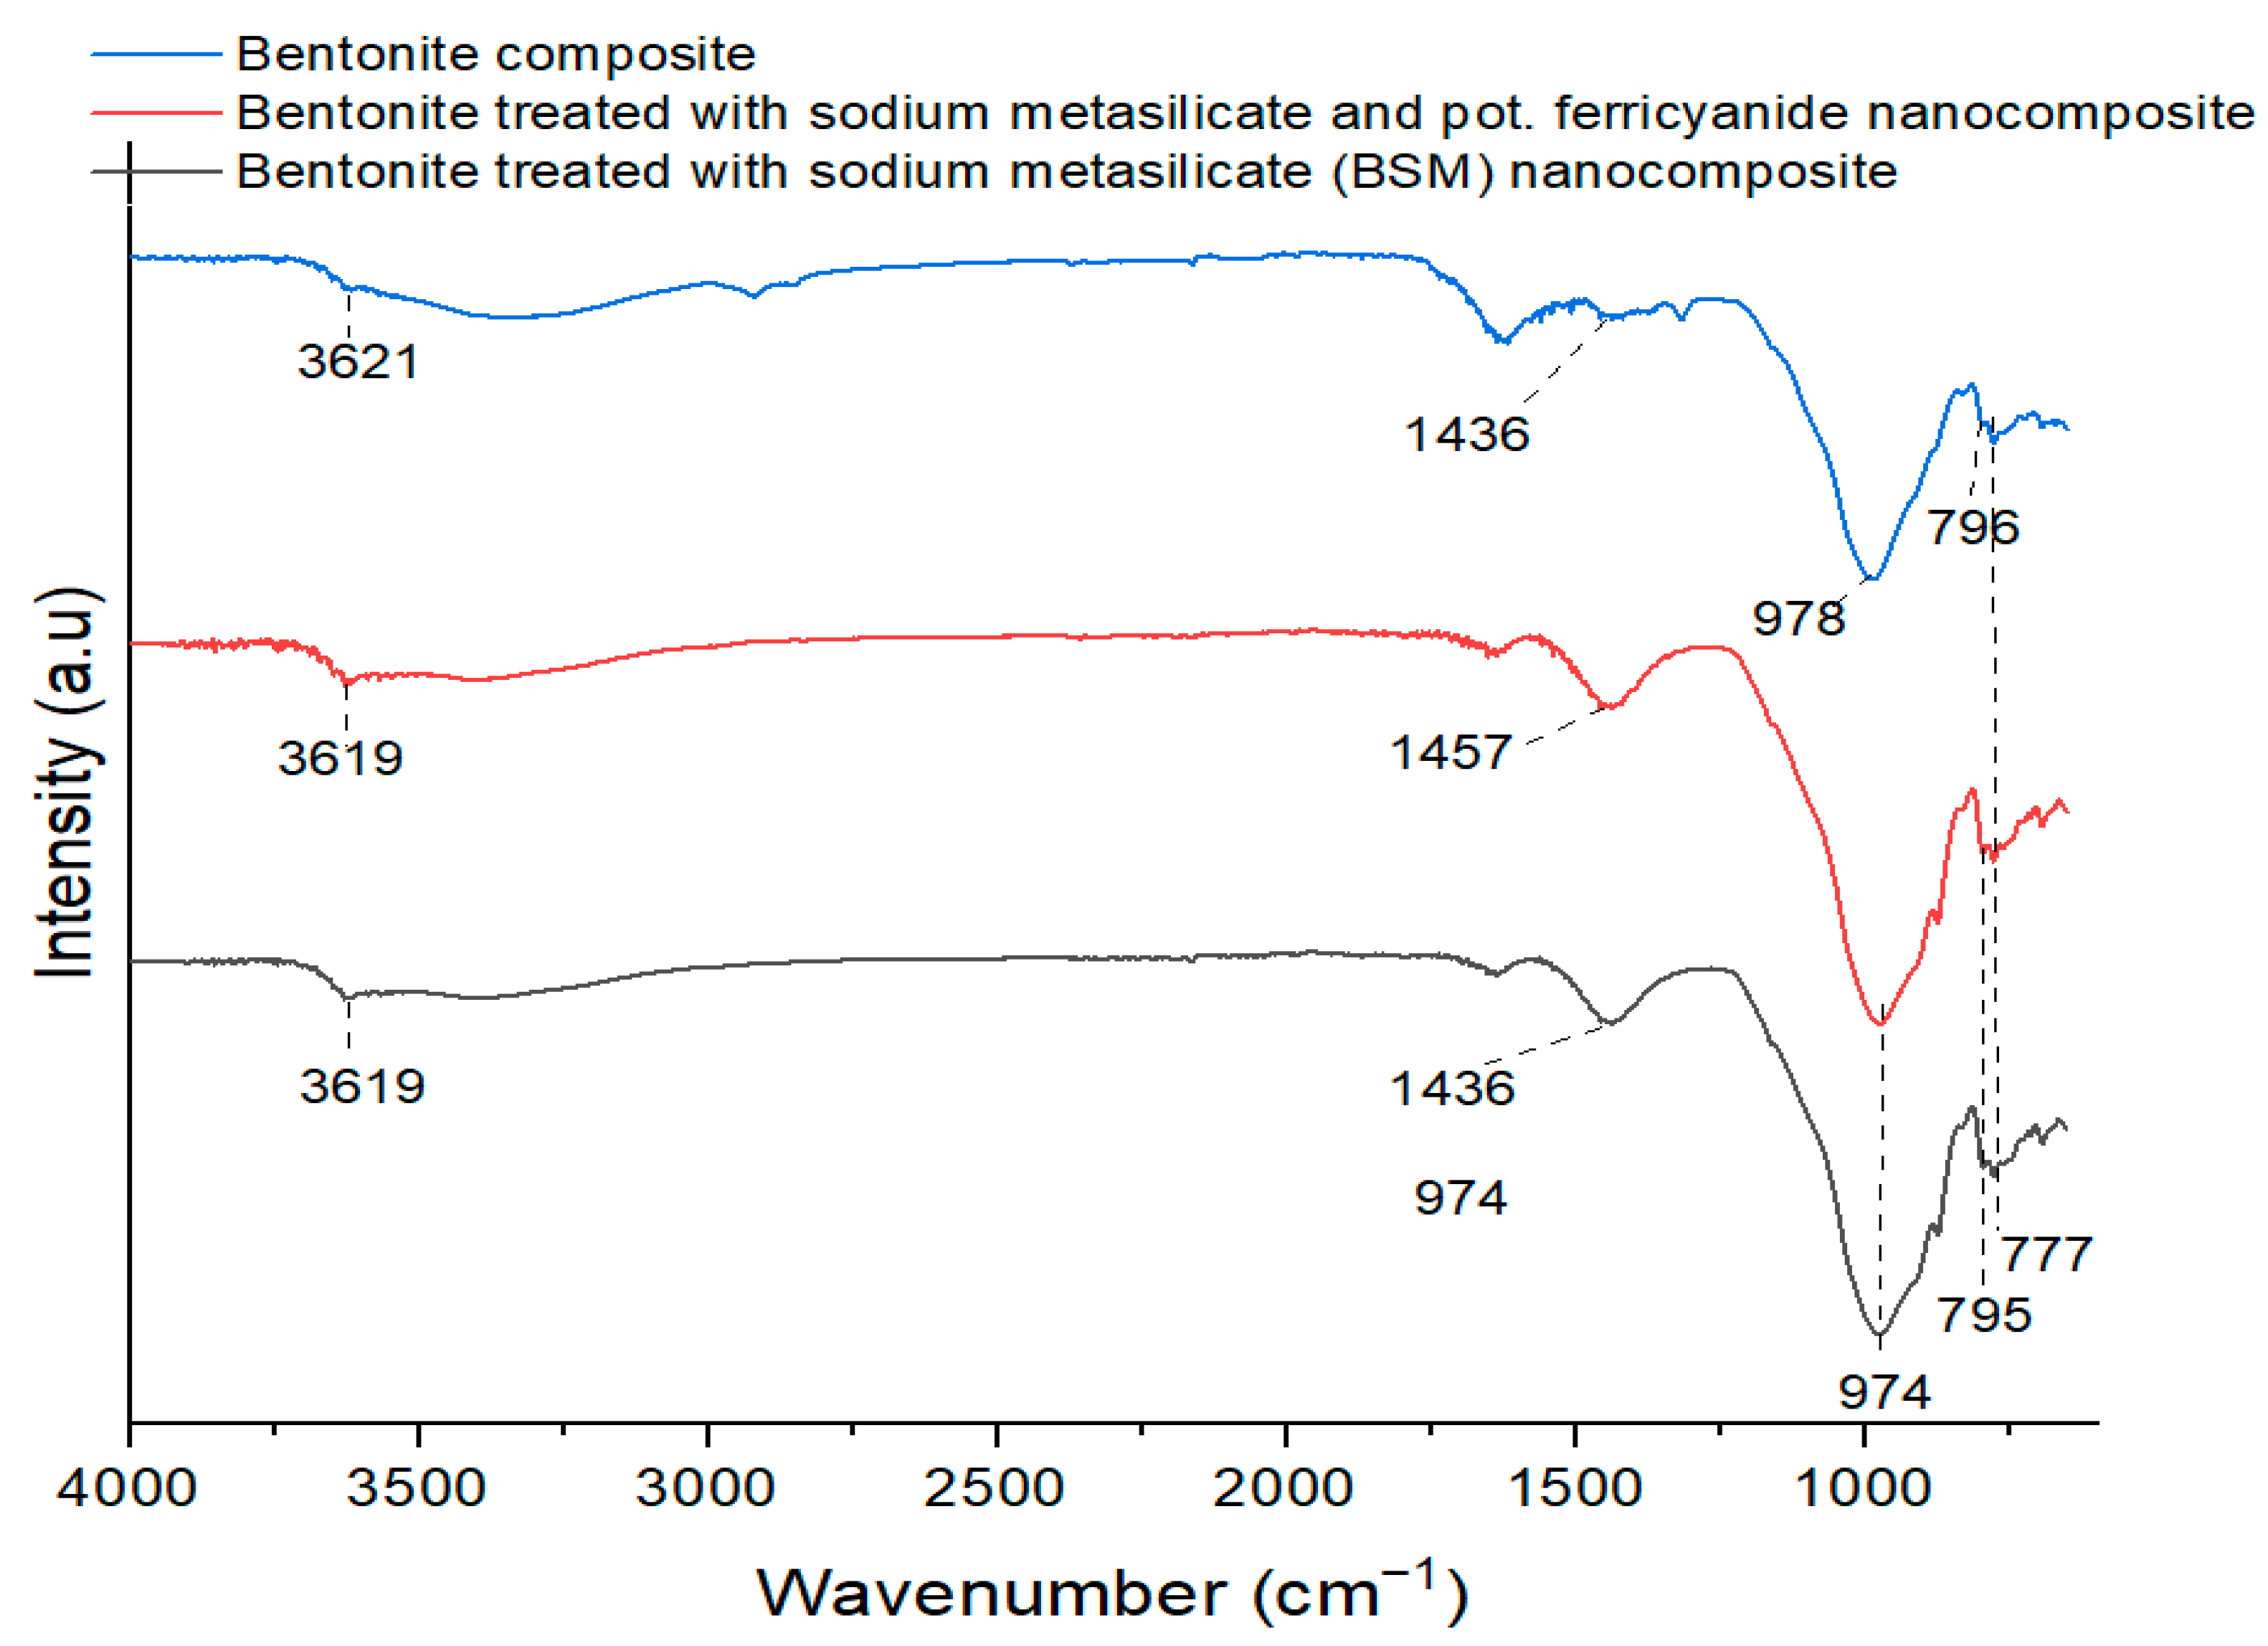
3.9.2. Fourier Transform Infrared (FTIR) Analysis

The Fourier transforms infrared spectrum of pure bentonite nanocomposite is presented in Figure 8. The adsorption spectrum of pure bentonite showed by the upper line indicated the adsorption at 3621 cm−1, which indicate presence of OH group. This region is typical for montmorillonite to OH stretching vibrations that have Al and Mg coordination groups with octahedral layer. This characteristic band show interlayer hydrogen bonding in clay. Adsorption spectrum at 1436 cm−1, and 978 cm−1 represent the CO2 and Al-OH stretching respectively. The spectral band obtained at 796 cm−1 indicated the presence of low crystalline silica (SiO42− tetrahedra) and cristobalite.
The FTIR spectrum of modified bentonite containing bentonite treated with sodium metasilicate (BSM) is presented in the Figure 8 lower spectral line. Adsorption bands were obtained at 3619, 1436, 974, 795, and 777 cm−1, which indicated the stretching vibrations of OH groups, CO2, Al-OH stretching, amorphous silica, and C-H deformation [29]. Figure 8 middle spectrum line shows the adsorption spectrum for bentonite treated with sodium metasilicate and potassium ferricyanide at 3619, 1457, 974, 795, and 777 cm−1, this combination shifts the methylene C-H bond bending [30].

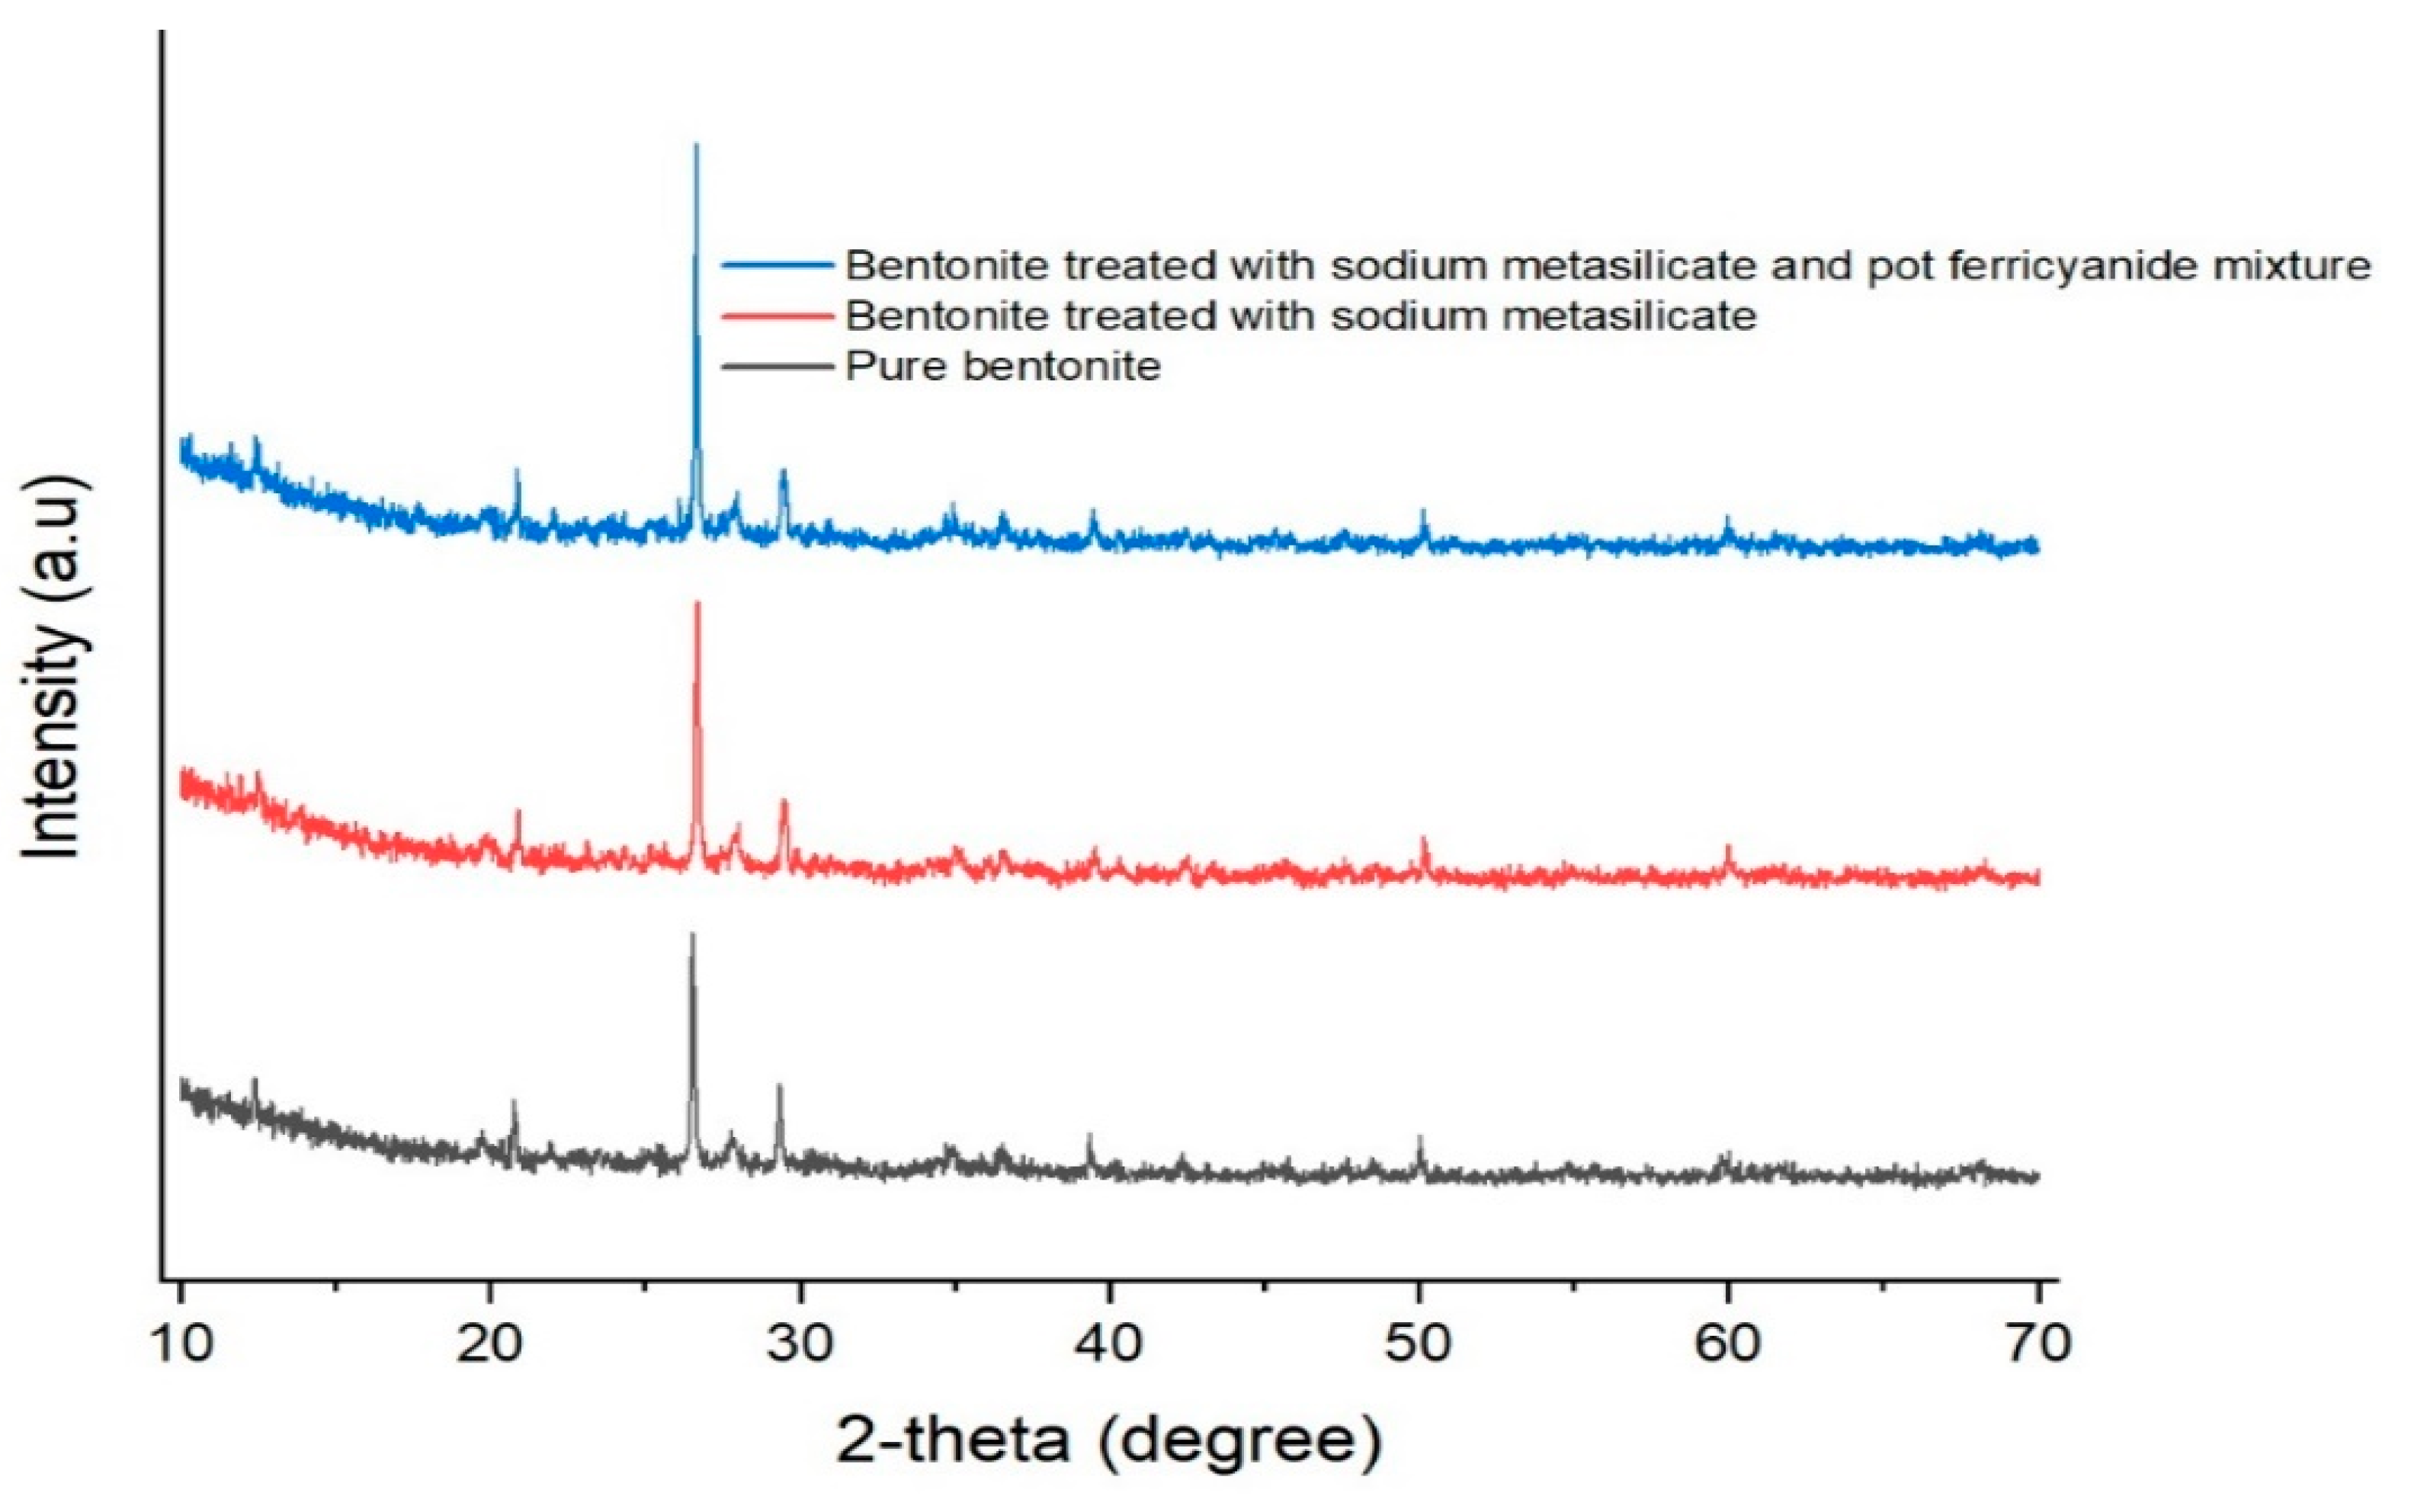
3.9.3. X-ray Diffraction (XRD) Analysis
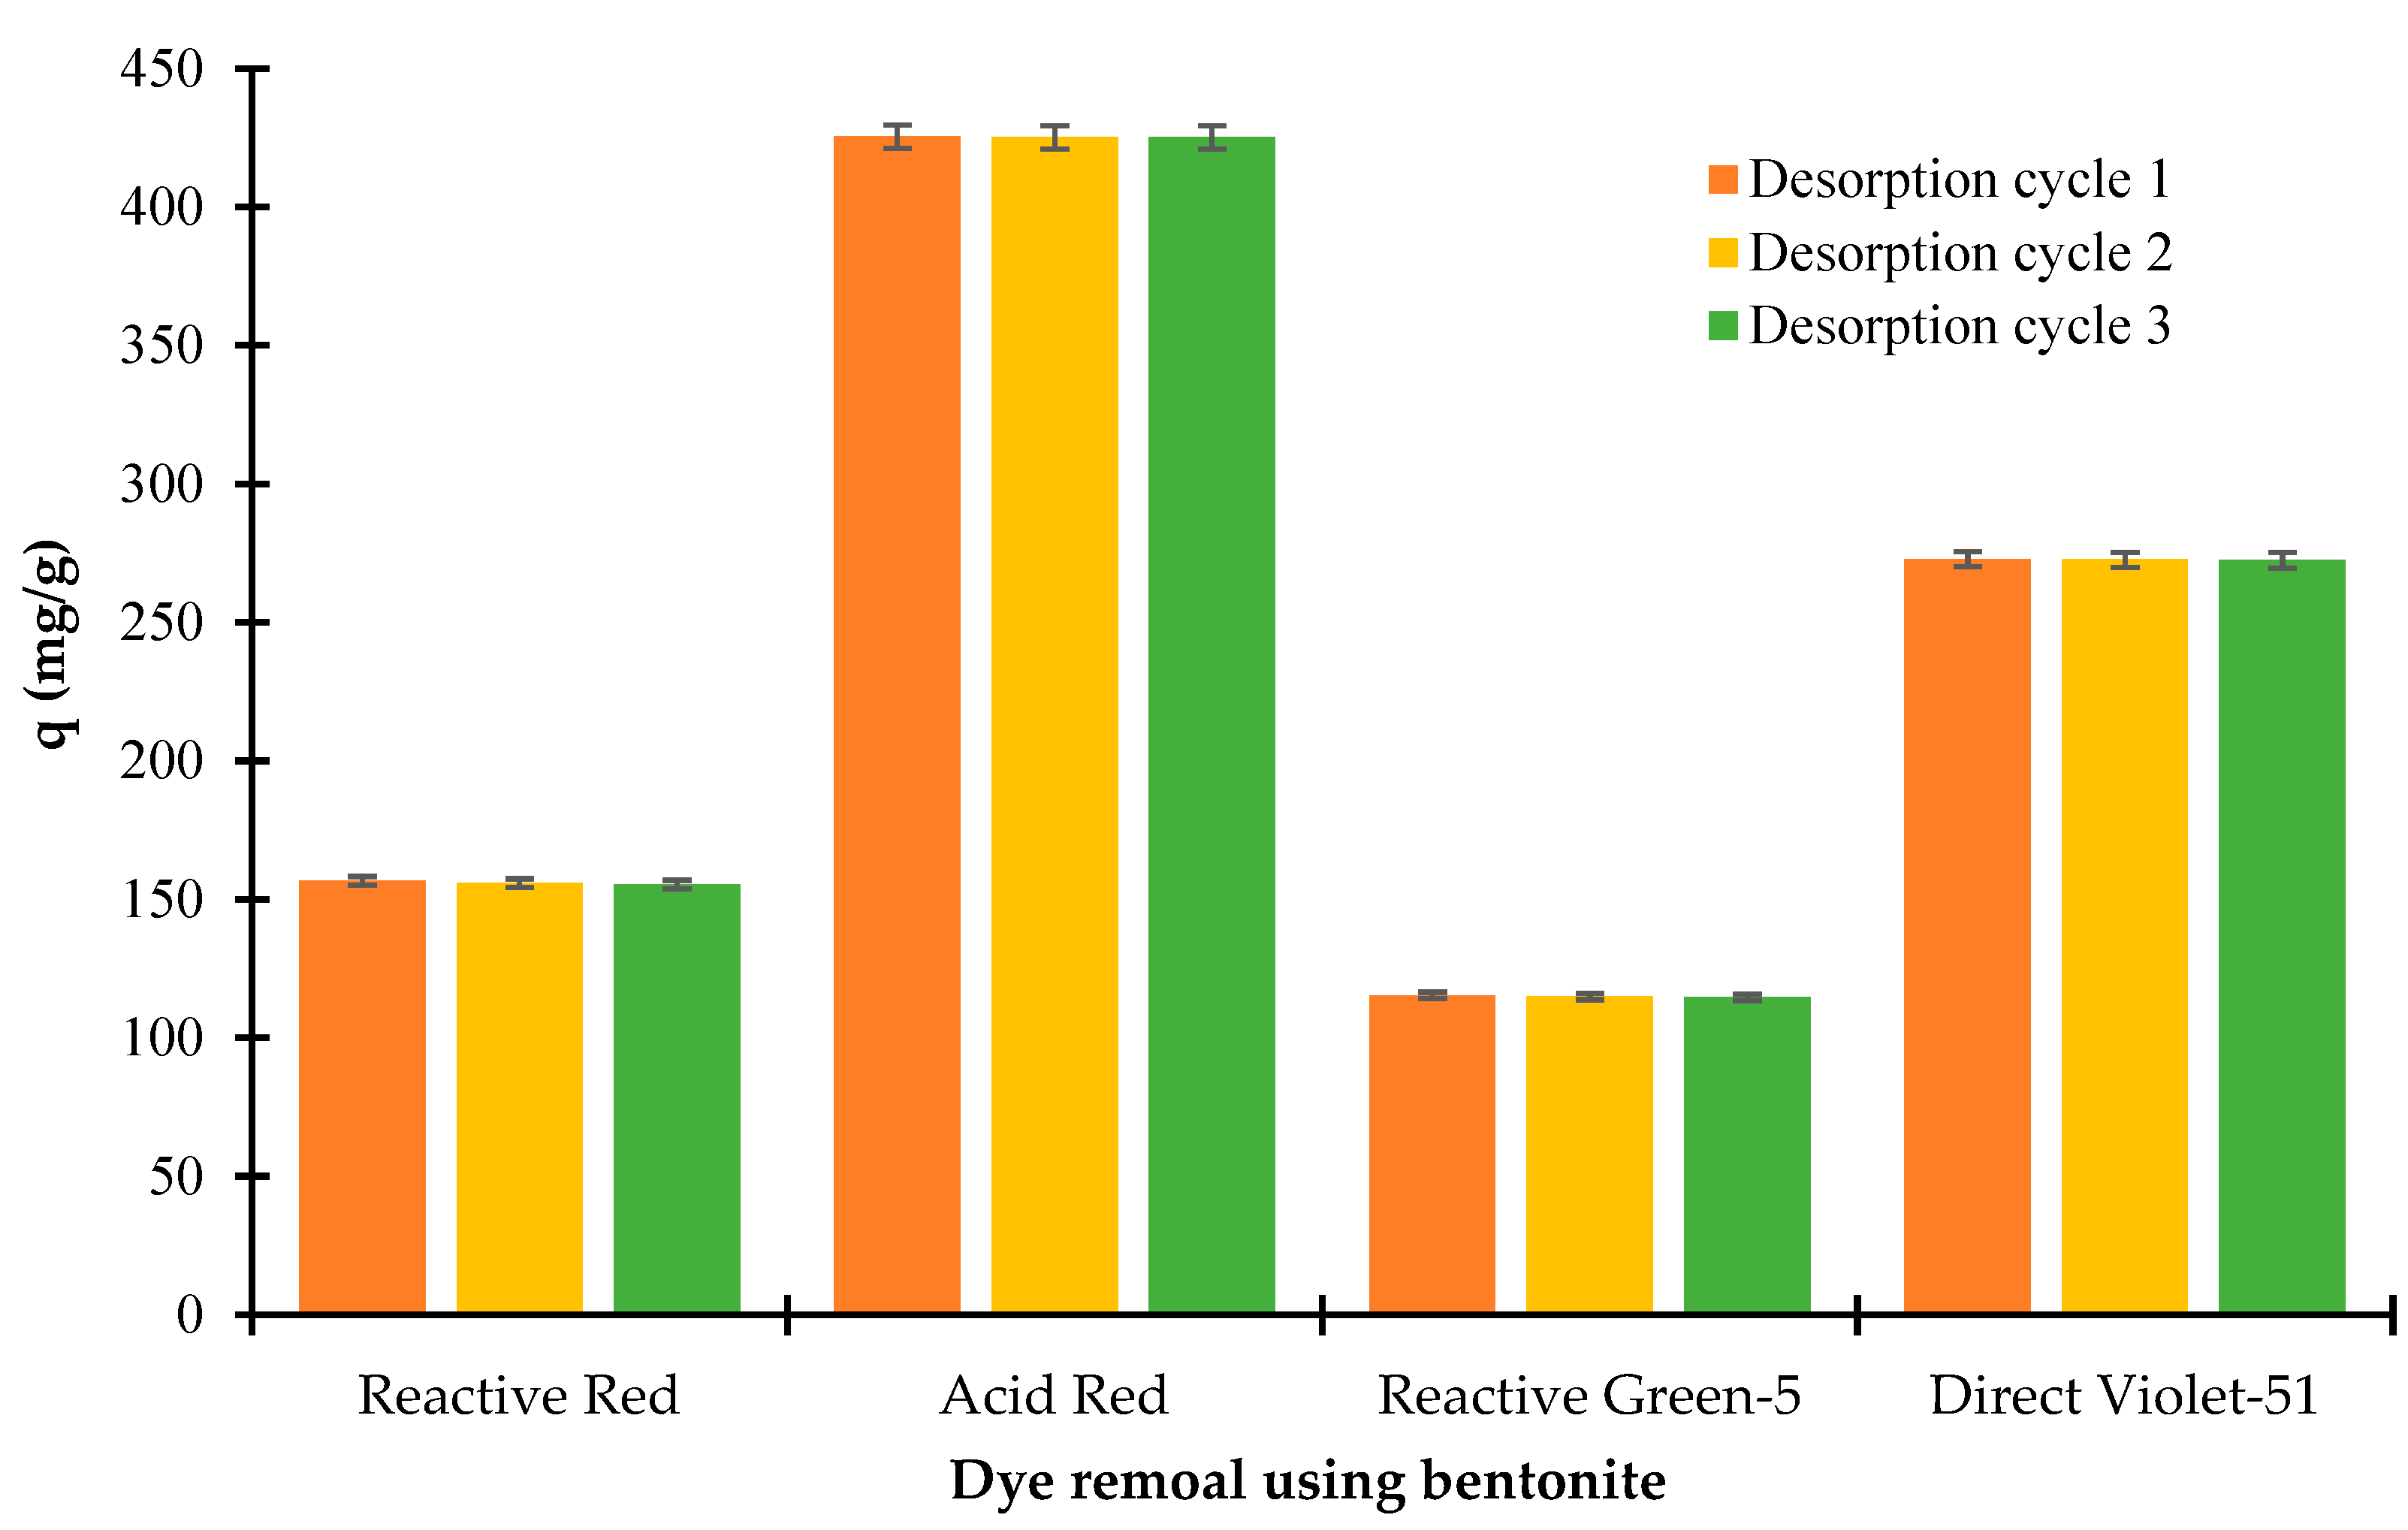
Constructive interference was produced by the interaction of incident rays with the sample, and these diffracted rays are continually recorded by the detectors. Cu-kα radiations were used over 2θ rages from 20 to 60 degrees at a speed of 2 deg min−1 for the characterization of modified bentonite. This XRD analysis of pure bentonite showed the monmorrilonit, kaolinite, and cristobalite composition as presented in Figure 9.

3.9.4. Desorption

It is a physical process in which a previously adsorbed substance is removed from the surface of the adsorbent. Desorption studies were conducted for adsorbents used in the present study. No significant loss in the adsorption capacity was observed after three cycles as presented in Figure 10.

4. Conclusions

Our environment is severely affected by contaminated wastewater released from textile industries. Bentonite clay is nature friendly, abundant, and cost-effective and its modification showed improvements in adsorption results. Removal efficiency was tremendously increased by increasing initial dye concentration, lowering the amount of adsorbent, lowering pH, varying time, and temperature. Moreover, the modification of bentonite with potassium ferricyanide and sodium metasilicate was a cheap process and could be used easily to replace expensive adsorbents like zeolite and activated carbon. It was found that Freundlich isotherm shown best fit model to the adsorption data, which signify that dye adsorption was multilayered. The best correlation for the obtained experimental data was shown by the pseudo second order kinetic model.

Author Contributions

Conceptualization, U.R. and M.A.H.; methodology, Y.C.; I.A.B.; U.R. and M.A.H.; software, U.R. and F.A.A.; validation, U.R., M.A.H., F.A.A., E.A.K. and Y.J.; formal analysis, Y.C., U.R., M.A.H., Y.J. and I.A.B.; investigation, U.R., M.A.H., Y.C., H.A. and F.A.A.; resources, U.R. and F.A.A.; data curation, U.R., Y.C., Y.J. and M.A.H.; writing—original draft preparation, Y.C., H.A. and M.A.H.; writing—review and editing, U.R., Y.J., F.A.A., I.A.B., E.A.K. and M.A.H.; visualization, M.A.H. and U.R.; supervision, M.A.H.; project administration, U.R., M.A.H. and F.A.A.; funding acquisition, U.R. and F.A.A. All authors have read and agreed to the published version of the manuscript.

Funding

The authors extend their thanks to Researchers Supporting Project (RSP-2021/160), King Saud University, Riyadh, Saudi Arabia.

Data Availability Statement

Not applicable.

Conflicts of Interest

The authors declare no conflict of interest.

References

  1. Khan, S.; Malik, A. Environmental and health effects of textile industry wastewater. In Environmental Deterioration and Human Health; Springer: Berlin/Heidelberg, Germany, 2014; pp. 55–71. [Google Scholar]
  2. Sivaram, N.; Gopal, P.; Barik, D. Toxic waste from textile industries. In Energy from Toxic Organic Waste for Heat and Power Generation; Elsevier: Amsterdam, The Netherlands, 2019; pp. 43–54. [Google Scholar]
  3. Azizullah, A.; Khattak, M.N.K.; Richter, P.; Häder, D.-P. Water pollution in Pakistan and its impact on public health—A review. Environ. Int. 2011, 37, 479–497. [Google Scholar] [CrossRef] [PubMed]
  4. Halder, J.N.; Islam, M.N. Water pollution and its impact on the human health. J. Environ. Hum. 2015, 2, 36–46. [Google Scholar] [CrossRef]
  5. Shi, B.; Li, G.; Wang, D.; Feng, C.; Tang, H. Removal of direct dyes by coagulation: The performance of preformed polymeric aluminum species. J. Hazard. Mater. 2007, 143, 567–574. [Google Scholar] [CrossRef] [PubMed]
  6. Kumar, P.S.; Saravanan, A. Sustainable wastewater treatments in textile sector. In Sustainable Fibres and Textiles; Elsevier: Amsterdam, The Netherlands, 2017; pp. 323–346. [Google Scholar]
  7. Beulah, S.S.; Muthukumaran, K. Methodologies of removal of dyes from wastewater: A review. Int. Res. J. Pure Appl. Chem. 2020, 50, 68–78. [Google Scholar] [CrossRef]
  8. Gupta, V.; Ali, I.; Saini, V.; Gerven, T.V.; der Bruggen, B.V.; Vandecasteele, C. Removal of dyes from wastewater using bottom ash. Ind. Eng. Chem. Res. 2005, 44, 3655–3664. [Google Scholar] [CrossRef]
  9. Crini, G.; Lichtfouse, E.; Wilson, L.D.; Morin-Crini, N. Conventional and non-conventional adsorbents for wastewater treatment. Environ. Chem. Lett. 2019, 17, 195–213. [Google Scholar] [CrossRef]
  10. Mukhopadhyay, R.; Bhaduri, D.; Sarkar, B.; Rusmin, R.; Hou, D.; Khanam, R.; Sarkar, S.; Biswas, J.K.; Vithanage, M.; Bhatnagar, A. Clay–polymer nanocomposites: Progress and challenges for use in sustainable water treatment. J. Hazard. Mater. 2020, 383, 121125. [Google Scholar] [CrossRef]
  11. Apriandanu, D.O.B.; Yulizar, Y. CuO-bentonite-gold nanocomposites: Facile green preparation and their characterization. Mater. Lett. 2021, 284, 128911. [Google Scholar] [CrossRef]
  12. Hu, Q.H.; Qiao, S.Z.; Haghseresht, F.; Wilson, M.A.; Lu, G.Q. Adsorption study for removal of basic red dye using bentonite. Ind. Eng. Chem. Res. 2006, 45, 733–738. [Google Scholar] [CrossRef]
  13. Khelifi, S.; Ayari, F. Modified bentonite for anionic dye removal from aqueous solutions. Adsorbent regeneration by the photo-Fenton process. Comptes. Rendus. Chim. 2019, 22, 154–160. [Google Scholar] [CrossRef]
  14. Tahir, S.S.; Rauf, N. Removal of a cationic dye from aqueous solutions by adsorption onto bentonite clay. Chemosphere 2006, 63, 1842–1848. [Google Scholar] [CrossRef] [PubMed]
  15. Peng, Y.; Lu, R. An LCTF-based multispectral imaging system for estimation of apple fruit firmness: Part II. Selection of optimal wavelengths and development of prediction models. Trans. ASABE 2006, 49, 269–275. [Google Scholar] [CrossRef]
  16. Gong, Z.; Liao, L.; Lv, G.; Wang, X. A simple method for physical purification of bentonite. Appl. Clay Sci. 2016, 119, 294–300. [Google Scholar] [CrossRef]
  17. Mokhtar, A.; Abdelkrim, S.; Sardi, A.; Benyoub, A.; Besnaci, H.; Cherrak, R.; Hadjel, M.; Boukoussa, B. Preparation and characterization of anionic composite hydrogel for dyes adsorption and filtration: Non-linear isotherm and kinetics modeling. J. Polym. Environ. 2020, 28, 1710–1723. [Google Scholar] [CrossRef]
  18. Davies, A.; Vadodaria, B.; Hopwood, B.; Dexter, T.; Conn, D. Efficacy of microfiltration in decreasing propofol-induced pain. Anaesthesia 2002, 57, 557–561. [Google Scholar] [CrossRef]
  19. Khalil, M.; Hanif, M.A.; Rashid, U.; Ahmad, J.; Alsalme, A.; Tsubota, T. Low-cost novel nano-constructed granite composites for removal of hazardous Terasil dye from wastewater. Environ. Sci. Pollut. Res. 2022. [Google Scholar] [CrossRef] [PubMed]
  20. Ehrampoush, M.; Ghanizadeh, G.; Ghaneian, M. Equilibrium and kinetics study of reactive red 123 dye removal from aqueous solution by adsorption on eggshell. J. Environ. Health Sci. Eng. 2011, 8, 101–106. [Google Scholar]
  21. Dada, A.; Olalekan, A.; Olatunya, A.; Dada, O. Langmuir, Freundlich, Temkin and Dubinin–Radushkevich isotherms studies of equilibrium sorption of Zn2+ unto phosphoric acid modified rice husk. IOSR J. Appl. Chem. 2012, 3, 38–45. [Google Scholar]
  22. Bazrafshan, E.; Mostafapour, F.K.; Hosseini, A.R.; Khorshid, A.R.; Mahvi, A.H. Decolorisation of reactive red 120 dye by using single-walled carbon nanotubes in aqueous solutions. J. Chem. 2013, 2013, 938374. [Google Scholar] [CrossRef] [Green Version]
  23. Jawad, A.H.; Mohammed, I.A.; Abdulhameed, A.S. Tuning of fly ash loading into chitosan-ethylene glycol diglycidyl ether composite for enhanced removal of reactive red 120 dye: Optimization using the Box–Behnken design. J. Polym. Environ. 2020, 28, 2720–2733. [Google Scholar] [CrossRef]
  24. Khanam, A.; Nadeem, F.; Praveena, S.M.; Rashid, U. Removal of dyes using alginated, calcinized and hybrid materials–A comprehensive review. Int. J. Chem. Biochem. Sci. 2017, 12, 130–140. [Google Scholar]
  25. Noreen, S.; Bhatti, H.N.; Zuber, M.; Zahid, M.; Asgher, M. Removal of actacid orange-RL dye using biocomposites: Modeling studies. Pol. J. Environ. Stud. 2017, 26, 2125–2134. [Google Scholar] [CrossRef]
  26. Amin, N.K. Removal of direct blue-106 dye from aqueous solution using new activated carbons developed from pomegranate peel: Adsorption equilibrium and kinetics. J. Hazard. Mater. 2009, 165, 52–62. [Google Scholar] [CrossRef] [PubMed]
  27. Toor, M.; Jin, B. Adsorption characteristics, isotherm, kinetics, and diffusion of modified natural bentonite for removing diazo dye. Chem. Eng. J. 2012, 187, 79–88. [Google Scholar] [CrossRef]
  28. El-Nagar, D.A.; Sary, D.H. Synthesis and characterization of nano bentonite and its effect on some properties of sandy soils. Soil Tillage Res. 2021, 208, 104872. [Google Scholar] [CrossRef]
  29. Zaitan, H.; Bianchi, D.; Achak, O.; Chafik, T. A comparative study of the adsorption and desorption of o-xylene onto bentonite clay and alumina. J. Hazard. Mater. 2008, 153, 852–859. [Google Scholar] [CrossRef]
  30. Saeed, A.; Hanif, M.A.; Nawaz, H.; Qadri, R.W.K. The production of biodiesel from plum waste oil using nano-structured catalyst loaded into supports. Sci. Rep. 2021, 11, 24120. [Google Scholar] [CrossRef]
Figure 1. The determination of maximum absorption wavelengths for dyes.
Water 14 03604 g001
Figure 2. Adsorption capacities of adsorbents for (a) Reactive red, (b) Direct violet-51, (c) Acid red, and (d) Reactive green-5 dyes at different concentrations.
Water 14 03604 g002aWater 14 03604 g002b
Figure 3. Adsorption capacities of adsorbents for (a) Reactive red, (b) Direct violet-51, (c) Acid red, and (d) Reactive green-5 dyes at different adsorbent dosage.
Water 14 03604 g003
Figure 4. Adsorption capacities of adsorbents for (a) Acid red dye, (b) Direct violet-51, (c) Reactive red, and (d) Reactive green-5 dyes at varying contact times keeping the temperature 70 °C.
Water 14 03604 g004
Figure 5. Removal of dyes at different temperatures. (a) Reactive Red, (b) Acid Red, (c) Reactive Green-5, (d) Direct Violet-51.
Water 14 03604 g005
Figure 6. Adsorption capacities of adsorbents for (a) Acid red, (b) Direct violet-51, (c) Reactive red, and (d) Reactive green-5 dyes at varied pH.
Water 14 03604 g006
Figure 7. SEM images at 200 nm (a) pure bentonite (b) bentonite treated with sodium metasilicate (c) bentonite treated with sodium metasilicate and potassium ferricyanide.
Water 14 03604 g007
Figure 8. FTIR analysis of bentonite nanocomposite Bentonite treated with sodium metasilicate (BSM) nanocomposite bentonite treated with sodium metasilicate and potassim ferricyanide nanocomposite.
Water 14 03604 g008
Figure 9. XRD analysis of bentonite nanocomposite, bentonite treated with sodium meta-silicate (BSM) nanocomposite, bentonite treated with sodium metasilicate and pot. ferricyanide nanocomposite.
Water 14 03604 g009
Figure 10. Adsorption capacity (mg/g) of adsorbent after desorption cycle.
Water 14 03604 g010
Table 1. Experimental data of adsorption isotherms for all dyes.
Adsorption Isotherms
DyesLangmuir
Isotherm
Freundlich
Isotherm
Dubinin Radushkevich IsothermTemkin
Isotherm
Harkin–Jura
Isotherm
Reactive Green-5 DyeAdsorbentsQexp (mg/g)R2QcalKLR2QcalKfnR2QcalβER2AtBR2AB
Bentonite115.70.950181.80.0420.999112.512.11.60.71072.32 × 10−65000.9370.5335.040.8206251.4
BPF178.10.979227.30.0980.992185.230.11.90.771116.68 × 10−710000.7290.0374.640.67719.11.7
BSM171.00.895243.90.0580.983164.321.31.70.7421041 × 10−67070.5670.0437.420.86510.51.7
BSMPF126.90.971185.20.0550.992131.015.41.60.76483.292 × 10−65000.960.6437.260.769833.31.4
Reactive Red DyeBentonite156.70.928227.30.0060.99154.520.51.80.68595.211 × 10−67070.920.7643.470.3266.871.6
BPF106.30.995123.50.0110.97311424.72.40.81380.171 × 10−67070.9941.6325.420.7660.721.7
BSM115.10.947131.60.4260.969108.929.31.70.67577.86 × 10−79130.9062.123.620.87120001.6
BSMPF155.40.929222.20.0930.992152.921.21.80.67494.61 × 10−67070.9190.7942.560.86425.38-1
Acid Red DyeBentonite425.20.978909.10.1180.992460.393.41.30.807252.32 × 10−715810.9350.0619.40.68925000.5
BPF424.30.888833.30.140.968472.71001.30.781253.92 × 10−715810.4890.213.730.3359.91.8
BSM130.60.962212.80.0400.997131.812.41.50.76282.12 × 10−65000.1820.227.470.761666.71.4
BSMPF147.60.899212.80.0570.98814019.91.80.63987.51 × 10−67070.1180.85135.60.027666.752
Direct Violet-51 DyeBentonite272.80.991384.60.100.99129.3742.61.60.757165.25 × 10−710000.9611.2875.60.722250013
BPF397.80.961526.30.290.99811.751061.70.771227.31 × 10−722360.9244.894.80.704204.11.9
BSM396.70.969526.30.270.99611.091101.70.727218.79 × 10−823570.9194.5892.40.74850001
BSMPF402.90.927526.30.3020.99538.591161.90.688210.77 × 10−826730.8715.7285.80.80350001
Table 2. (a) Adsorption kinetics data for Reactive green-5 dye. (b) Adsorption kinetics data for Reactive red dye. (c) Adsorption kinetics data for Acid red dye. (d) Adsorption kinetics data for Violet-51 dye.
(a)
Reactive Green-5 DyeAdsorption Kinetics
AdsorbentsPseudo 1st Order KineticsPseudo 2nd Order Kinetics
30 °C
QexpQ°K1R2QexpQ°K2R2
Bentonite275.770.370.0160.864275.7277.80.00050.997
BPF257.143.360.0190.754257.1263.20.00080.999
BSM261.532.200.0150.926261.5263.20.00131
BSMPF311.21030.0180.952311.2322.60.00040.999
40 °C
Bentonite292.1148.150.0160.958292.1294.120.00080.999
BPF352.152.770.0190.869352.1357.140.00030.994
BSM223.2120.10.0180.933223.2232.560.00030.996
BSMPF373.290.800.0170.889373.2370.40.00050.998
50 °C
Bentonite759.195.740.0180.940759.1769.20.00050.999
BPF832.2217.50.0220.986832.2833.30.00020.999
BSM744.319.940.0120.932744.3769.20.00070.999
BSMPF760.196.720.0180.947760.1769.20.00050.999
60 °C
Bentonite73891.470.0180.949738769.20.00050.999
BPF746.142.280.0150.987746.1769.20.00101
BSM728.966.620.0170.969728.9714.30.00070.999
BSMPF746.141.230.0170.899746.1769.20.00091
70 °C
Bentonite669.823.560.0150.811669.8666.70.00171
BPF685.427.40.0150.96685.4714.30.00151
BSM671.969.150.0160.907671.9666.70.00060.999
BSMPF690.523.630.0150.852690.5666.70.00191
(b)
Reactive Red DyeAdsorption Kinetics
AdsorbentsPseudo 1st Order KineticsPseudo 2nd Order Kinetics
30 °C
QexpQ°K1R2QexpQ°K2R2
Bentonite204.562.820.01840.912204.5212.770.00040.998
BPF117.892.00.0170.863117.8123.460.00030.960
BSM154.552.520.01470.853154.5156.250.00070.993
BSMPF199.421.200.01470.644199.4204.10.00100.999
40 °C
Bentonite138.634.940.0130.886138.6140.80.00100.996
BPF142.519.840.0150.796142.5144.90.00170.999
BSM173.225.590.0170.654173.2175.40.00130.999
BSMPF155.454.450.0150.909155.4158.70.00070.996
50 °C
Bentonite169.226.790.0140.999169.2172.40.00140.999
BPF149.633.880.0150.977149.6151.50.00110.999
BSM147.334.590.0140.93147.3149.30.00110.999
BSMPF16425.720.0140.977164166.70.00150.999
60 °C
Bentonite375.936.740.01400.924375.9384.60.00110.999
BPF30919.480.01310.903309312.50.0021
BSM390.5120.220.01870.944390.5416.70.00040.999
BSMPF406.557.580.01750.987406.54000.00081
70 °C
Bentonite141.116.890.0110.933141.1142.860.00210.999
BPF163.388.690.01770.965163.3169.490.00040.997
BSM185122.70.01930.987185196.080.00030.999
BSMPF234.98117.50.01890.968234.98243.90.00030.998
(c)
Acid Red DyeAdsorption Kinetics
AdsorbentsPseudo 1st Order KineticsPseudo 2nd Order Kinetics
30 °C
QeQ°K1R2QeQ°K2R2
Bentonite149.146.680.0160.997149.1153.90.00080.999
BPF133.131.250.0140.973133.1135.10.00110.999
BSM146.434.980.0140.929146.4149.30.00100.998
BSMPF154.8700.0160.912154.8158.70.00050.994
40 °C
Bentonite317.7162.90.0230.932317.7344.80.00020.997
BPF270.3153.20.0200.954270.3285.70.00030.996
BSM250.3310.0150.921250.3256.40.00131
BSMPF180410.0190.751180185.20.00080.999
50 °C
Bentonite198.273.810.0180.982198.2204.10.00050.999
BPF243.684.760.0170.938243.62500.00040.998
BSM181.365.40.0180.988181.3188.70.00060.999
BSMPF137.912.70.0100.970137.9138.90.00270.999
60 °C
Bentonite274.438.10.0140.934274.4277.80.00100.999
BPF363.6102.40.0190.952363.6370.30.00040.999
BSM323.174.50.0160.867323.1322.60.00050.998
BSMPF284.150.40.0170.956284.1285.70.00080.999
70 °C
Bentonite189.656.90.0200.773189.6196.10.00060.997
BPF163.780.70.0170.890163.7169.50.00040.991
BSM181.664.40.0170.971181.6185.20.00060.999
BSMPF162.852.60.0150.939162.8166.70.00070.997
(d)
Direct Violet-51 DyeAdsorption Kinetics
AdsorbentsPseudo 1st Order KineticsPseudo 2nd Order Kinetics
30 °C
QeQ°K1R2QeQ°K2R2
Bentonite186.589.00.0170.895186.5192.30.00040.993
BPF162.785.30.0180.990162.7147.00.00040.996
BSM172.674.40.0170.952172.6178.50.00050.998
BSMPF136.8150.10.0200.965136.8181.80.00020.998
40 °C
Bentonite104.964.660.0190.871104.9129.90.00020.987
BPF132.224.80.0150.842132.2135.10.00120.999
BSM153.617.520.0150.601153.6158.70.00120.999
BSMPF107.3132.10.0200.980107.3138.90.00010.979
50 °C
Bentonite178.721.980.01380.907178.7188.70.00440.998
BPF141.499.400.01770.941141.4149.20.00030.992
BSM100.532.120.01720.720100.5105.20.00080.998
BSMPF172.325.060.01610.693172.3178.50.00060.999
60 °C
Bentonite163.9122.80.0200.994163.9187.80.00020.998
BPF180.986.470.0170.933180.9188.70.00040.996
BSM213.2191.90.0200.908213.2243.90.00010.969
BSMPF174.783.980.0180.930174.7185.10.00040.997
70 °C
Bentonite20336.380.0190.639203212.80.00050.996
BPF141.1133.20.0200.989141.1161.30.00020.991
BSM60.59.790.0120.68460.562.110.00300.999
BSMPF239.225.790.0120.893239.2238.10.00150.999
Publisher’s Note: MDPI stays neutral with regard to jurisdictional claims in published maps and institutional affiliations.

