
Visual Language Translation Analysis and Scenic Beauty Estimation of Mountain Stream Facilities

1
Department of Spatial Design, Chienkuo Technology University, Changhua City 50020, Taiwan
2
Department of Soil and Water Conservation, National Chung Hsing University, Taichung 40227, Taiwan
3
Innovation and Development Center of Sustainable Agriculture, National Chung Hsing University, Taichung 40227, Taiwan
*
Author to whom correspondence should be addressed.
Water 2022, 14(22), 3605; https://doi.org/10.3390/w14223605
Submission received: 7 October 2022
/
Revised: 4 November 2022
/
Accepted: 7 November 2022
/
Published: 9 November 2022
(This article belongs to the Special Issue Natural Disasters Occurrence, Reduction, and Restoration in Mountain Regions)
Abstract
:The aesthetic design of mountain stream facilities has not received much attention in Taiwan. In recent years, in addition to safety concerns, the focus has increasingly been on landscape assessment or the sense of integration with the environment. This research is the first attempt to use visual language translation in qualitative research analysis for the landscape assessment of mountain stream facilities. This method is different from a traditional qualitative narrative analysis. It also addresses the shortcomings of previous quantitative analysis methods, in which the topic discussions are too limited. First, mountain stream engineering projects are selected as the research objects. This study uses questionnaire analysis and on-site surveys to summarize the elements, representations, and perceptions of the mountain stream facilities of the subjects concerned to examine their preferences for the visual system. Furthermore, we also employ the scenic beauty estimation (SBE) method for a comparison between the qualitative and quantitative analyses. This study proposes a new method using visual language translation and SBE that combines the features of qualitative research and quantitative analysis. However, the potential limitations include an inability to have a large sample number and the biases caused by the cultural, regional, or personal characteristics of the subjects.
1. Introduction
Taiwan is rich in topography and landscape features. Therefore, in recent years, engineering projects, such as check dams and groundsills, have viewed landscape assessments and integration with the environment as being important, in addition to safety concerns. In mountainous areas, stream erosion control facilities should be considered to reduce the environmental impact, as well as related eco-friendly designs, to increase the harmony of the landscape and environmental sustainability.
Aimed at the design concept of check dam aesthetics, a previous study [1] proposed that the three independent factors of form, color, and texture, as well as sense factors such as harmony, rhythm, and simplicity, could be used for the aesthetic assessment. Subsequently, a fuzzy logic system for landscape assessment was established using the analytic hierarchy process (AHP), and these principles were used to analyze the relationship of the various factors [2].
Furthermore, one study [3] used visual preference and four cognitive factors—naturalness, harmony, vividness, and closeness—to discuss the visual indicators, visual aesthetic experiences, and applications of the empirical relationship. Another study [4] adopted a preference-based psychophysical landscape assessment method (scenic beauty estimation (SBE) method) to explore the aesthetic preferences and differences in various artificial structures in a catchment. The SBE method is a psychophysiological experimental method for assessing the beauty of forest landscapes. The concept derives from the stimulus and response models of behavioral psychology, and is based on the signal-detection method and the Thurstone measurement model, improved for assessing the beauty of landscapes [5,6,7,8,9].
Participant-generated image methods, often used in social science research, present a long application history in social science [10]. Research on participant-generated images (PGIs) in social science can be traced back to 1970. Volunteer participants were offered cameras to take pictures representing specific topics, which might be related to their specific life experiences or places visited. Several qualitative research analysis methods were then used to analyze the pictures taken by the subjects, who became the “participants” in the research.
As type of visual language translation method, the caption evaluation method (CEM), proposed by Koga et al. [11], is a typical PGI method. Using this method, citizens in Minato, Tokyo, Japan, were requested to freely stroll in Minato and take various environmental pictures with a positive or negative impression. Meanwhile, they were invited to write down their feelings about each facility. The participants were further asked to record their reasons for being satisfied with or adverse to each facility.
Many Japanese scholars then began applying the CEM to evaluate various historical monuments, tourist attractions, and urban open spaces [12,13,14,15,16,17]. For instance, Naoi et al. [18] applied the CEM to evaluate visitors who selected historical areas as tourism destinations. A total of 30 Japanese college students and 27 Japanese adults interested in architecture and urban planning visited facilities in Japan’s historical and cultural areas and stated their perceptions of the selected facilities. The results revealed the relationship between the elements in the areas and the participants’ perceptions and desires. Furthermore, it also implied the participants’ positive assessment of old buildings and adverse perception of modern architecture.
Chen et al. [19] collected comments regarding two hydropower dams in Canada from social media platforms such as Instagram. Each picture, and the title for each topic, was coded as a topic category for statistics. Each comment (e.g., dam construction would affect the perceived aesthetics and sense of home, or dam removal would cause lifestyle changes) might affect the relevant value and activity to predict the group items. For instance, the construction of a dam might affect the local citizens’ perceived aesthetics and sense of home, or the deconstruction of a dam might result in lifestyle changes. This type of research could be an extended research method of the CEM.
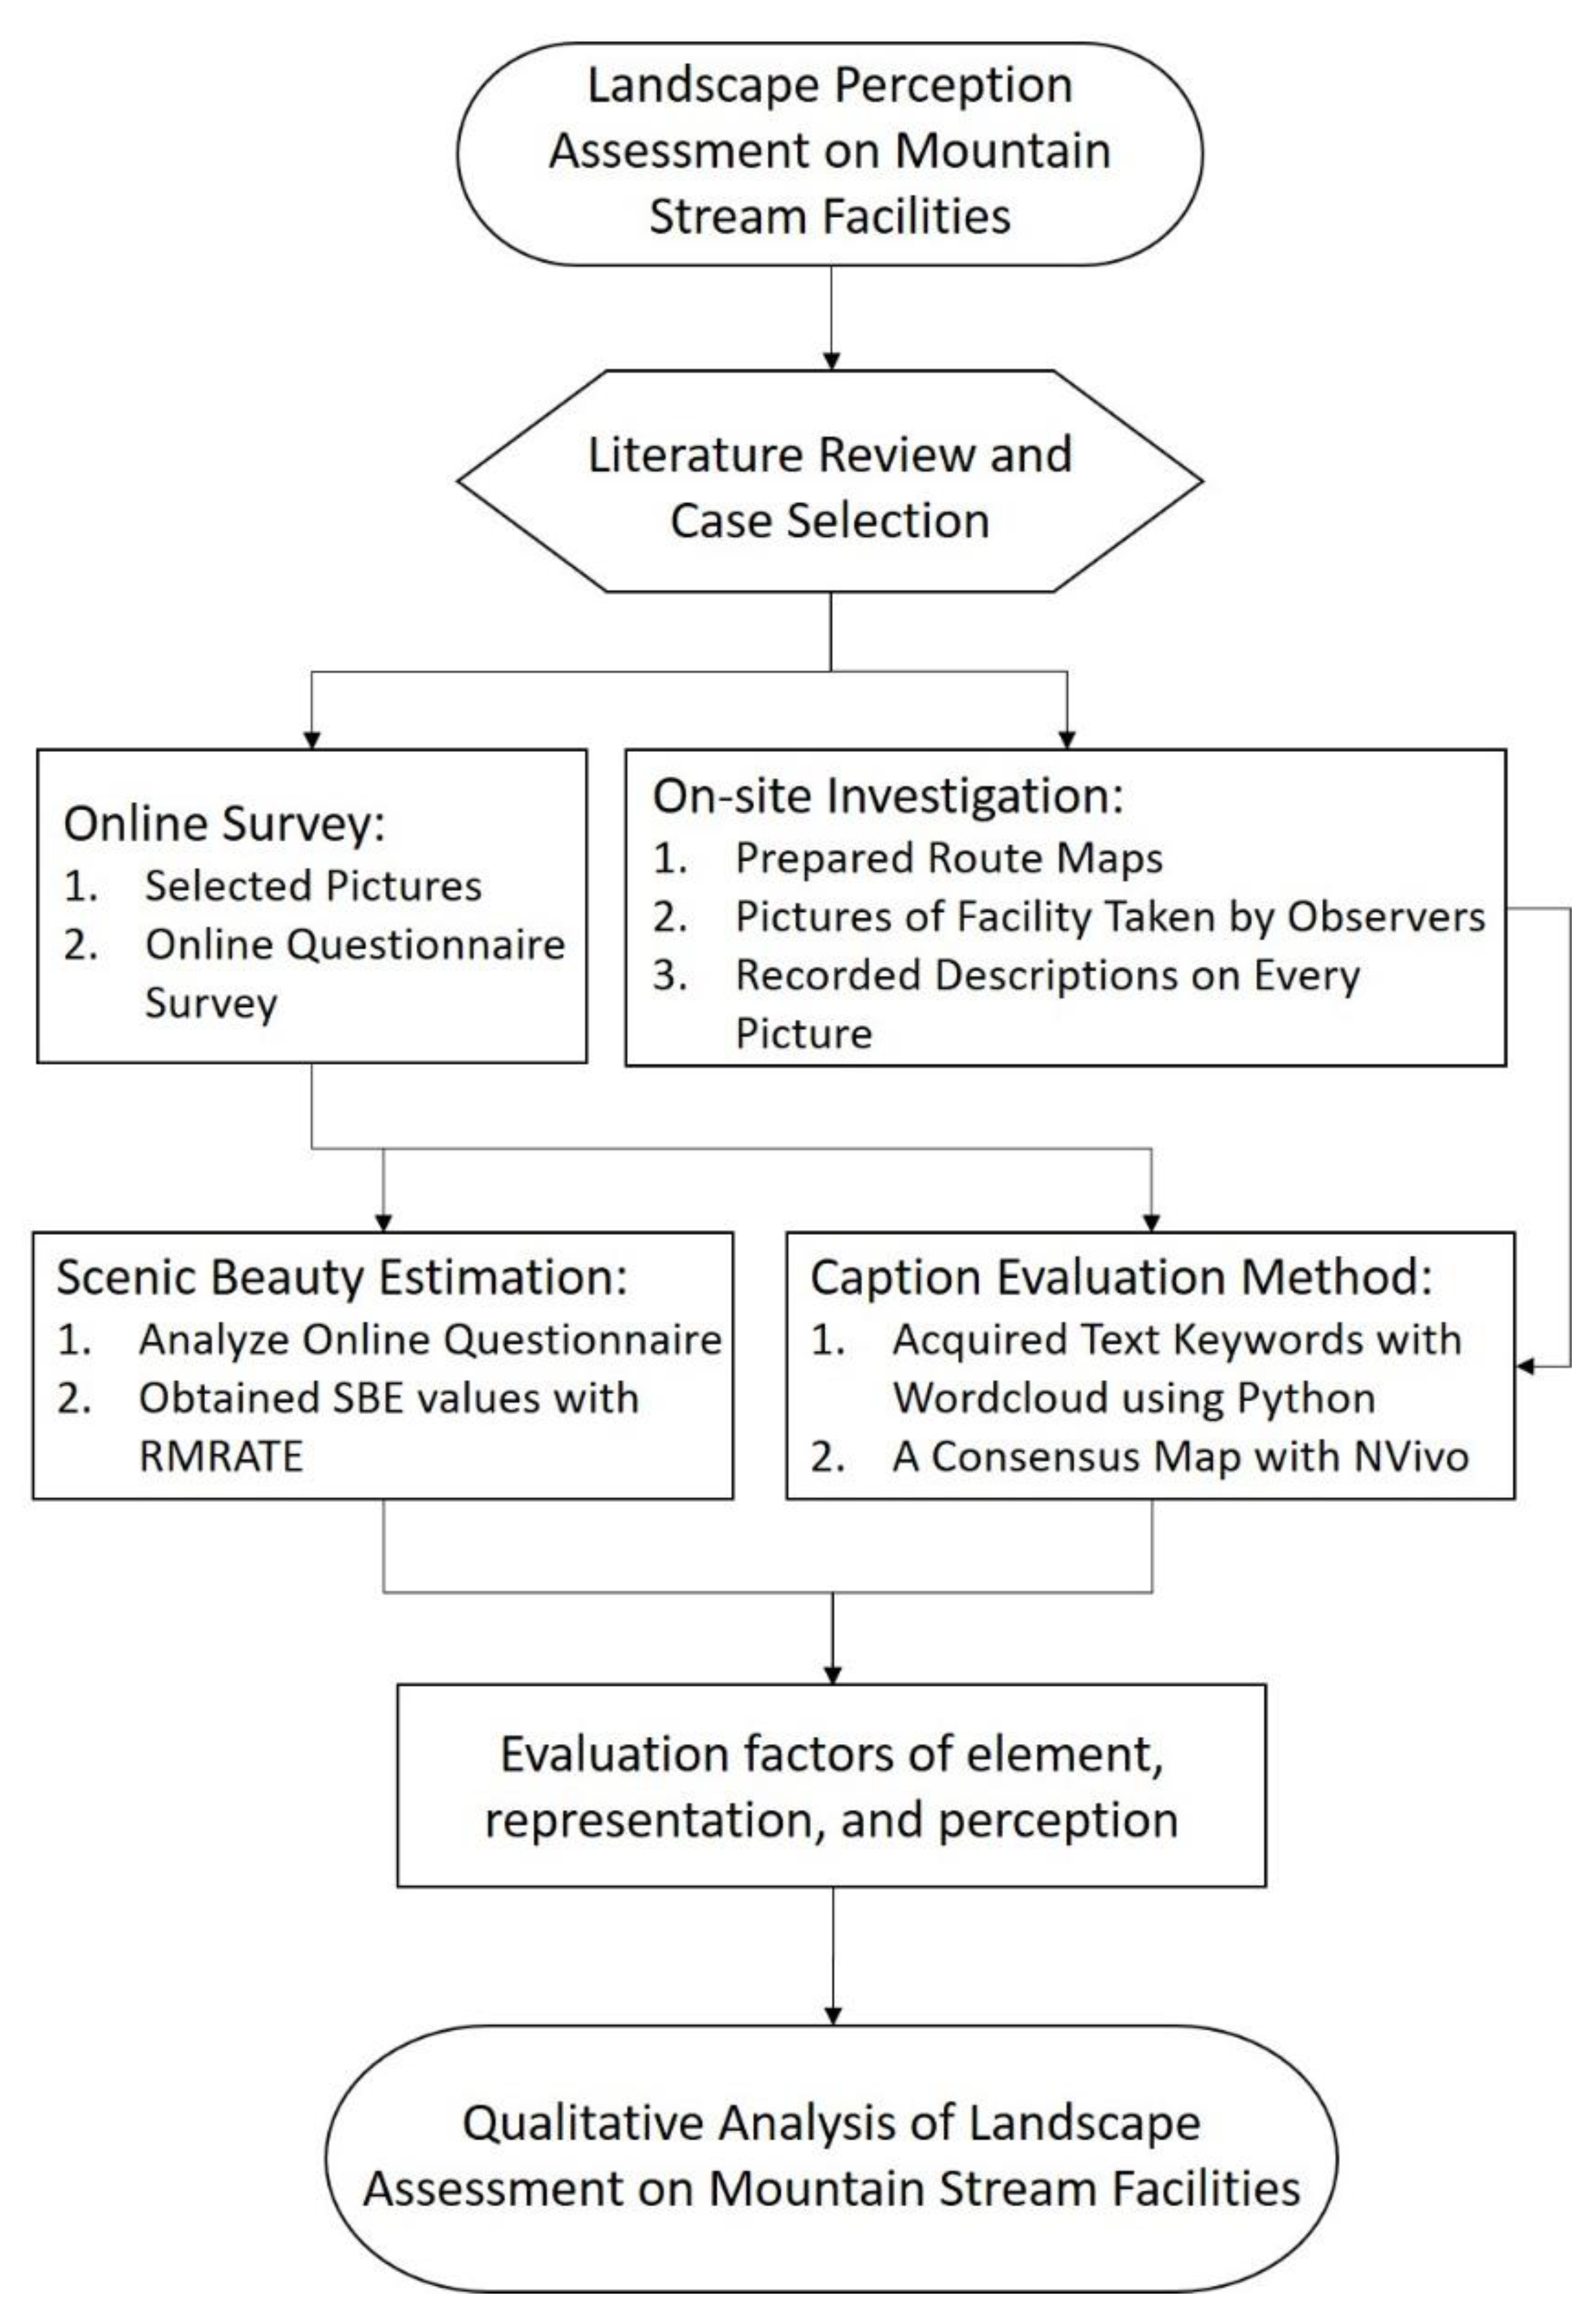
There are limited studies using visual language translation or the CEM in Taiwan; however, hydraulic engineers need a reference for aesthetic design to meet the landscape requirements. This study uses the CEM as a qualitative research analysis tool for the landscape evaluation of mountain stream facilities. Selecting award-winning projects as the research objects, case studies are conducted to evaluate their design styles and compare them with other types of mountain stream facilities. Meanwhile, the quantitative analysis, using methods such as SBE, is compared with the qualitative results. Finally, qualitative analysis is used to explore the correlations among the characterization factors, perception factors, and preferences. The research goal is to establish a foundation for subsequent aesthetic engineering design in the future. The entire research process is shown in Figure 1.
2. Materials and Methods
2.1. Caption Evaluation Method (CEM)
This study applies the caption evaluation method (CEM) to evaluate the landscape assessment of mountain stream engineering facilities in Taiwan. The CEM, first developed from architectural psychology and proposed and practiced by Koga et al. [11], is a participatory qualitative research method. The method attempts to investigate the reasons why the subjects take pictures at target locations, and the subjects are asked to state their opinions about the images. With such a method, the pictures of the targets taken by the participants are regarded as the trigger factors in their evaluation of the locations, and the acquired pictures are considered clues to their reactions.
In the CEM, three points to caption the pictures are proposed:
- To which elements do the subjects pay attention?
- What are the features of such elements noticed by the subjects?
- How do the subjects treat the noticed features?
Among the three questions, the first and the second questions are designed to gain an understanding of the features of the elements in the environment. The third question is aimed at inducing the subjects’ thoughts regarding the features of such elements. For instance, one subject provided the caption, “It was cool because there were few cars. It would be better when there was no height difference between sidewalks and traffic lanes” [18]. In the example, “elements”, such as “cars”, “features” of the elements, such as “few”, and “perceptions” of the subject, such as “cool”, are mentioned. Such data could be used for various positive or negative qualitative analyses.
The CEM presents some advantages: (1) such a method could help the subjects focus on various facilities and elements, and state their opinions; (2) the pictures taken by the subjects could reveal the relationship between such elements and the observers’ perceptions, and the elements might be used to manage the destinations to satisfy the interviewers’ demands and provide ample opinions; and (3) the subjects can evaluate the facilities they experience.
On the other hand, the CEM also contains some disadvantages: (1) previous research has revealed that the sample size for such a method is relatively small, possibly because it takes a long time to complete taking pictures and recording, and it would be challenging to gather photographers at the same location for a long period; (2) in addition to the small sample size, the subjects’ attributes may need to be excluded from the investigation, such as demographic and psychological features, as they would affect the coverage of the results; and (3) in comparison with an in-depth individual interview, the CEM results may lack depth with regard to the topic [18]. However, compared with the traditional questionnaire survey, more perspectives from different users’ experiences could be investigated through the CEM, allowing us to think about problems from various perspectives.
2.2. Analysis of Qualitative Data
Qualitative analysis, a modern method used in academic research, is more complicated, with multiple layers and distinct data analyses, than traditional questionnaires or data quantitative research. This method does not simply respond to a questionnaire or discuss the difference, correlations, or predictions among variables. Since the mid-1980s, the development of computer-assisted qualitative data analysis software (CAQDAS) has allowed researchers to properly record intuition, ideas, searches, and analyses to simplify qualitative analyses [20]. The captions acquired through the CEM further preceded qualitative data analysis. Faced with former CEM survey results, many unstructured texts were generated that could not be quickly processed or perceived by humans or computers. For the next step, effective technology and algorithms are needed to mine and extract the most meaningful information [21,22].
The captions obtained by the CEM need to be processed through natural language processing (NLP) before advanced analyses are performed. Natural language processing (NLP) is one of the essential applications of machine learning, for example, text-to-speech and sentence-to-sentence clauses, etc. With advancements in computing speed, the accuracy of natural language processing is gradually being accepted. Segmenting the sentences into a file is the first task in research on text analysis using a computer. “Words” are then used for analyzing and organizing the results; therefore, “word segmentation” can be regarded as the most basic word analysis task.
The present study uses the Jieba module as a Chinese word-segmentation tool. The Chinese meaning of “Jieba” is “stutter,” and the default word break principle of the Jieba module is simplified Chinese. Therefore, when using it in Taiwan, the traditional Chinese thesaurus was required to be downloaded in this study [23]. After the word-segmentation process, there was still too much text information; furthermore, more important phrases needed to be chosen.
Among the distinct computer-assisted qualitative data analysis software, NVivo is currently the most popular qualitative research software with complete functions. Data sources of text records, relevant literature, records, videos, and social networking sites after interviews are often used in qualitative research. NVivo helps users systematically organize such information with context and in a mutual relationship. Such collected “Sources” are integrated contextually, and the contents are coded and defined for transformation into “Nodes.” When the “attribute value” is added into the coding process, it becomes “Cases.” In other words, “Cases” can be regarded as “Nodes with attribute data.” Set “Cases” with the same attribute value can be gathered together with the coding function in NVivo queries [24]. The most meaningful and representative labels are obtained through cluster analysis. These labels are then used for encoding CAQDAS to establish the so-called “Case” and “Node” to clarify the research topic’s organizational and secondary levels. Through topic coding and classification, as well as comparison and analyses, an organizational hierarchy and sub-hierarchy were established to clarify the research structure and provide a reference for successive research.
2.3. Scenic Beauty Estimation (SBE)
Scenic beauty, an abstract concept, was previously studied using qualitative methods. Prior to the psychophysical paradigm phase, Daniel et al. [25,26,27] developed scenic beauty estimation (SBE) to quantitatively analyze scenic beauty. The SBE method, a psychophysiological experiment to evaluate the scenic beauty of forests, originated from the stimulus and respondence model in psychology and was improved according to the signal detections method and the Thurston scaling model. In addition, the viewers’ preference for landscape or beauty was represented by the perceived scenic beauty distribution of the evaluators.
For the experimental procedure, the subjects viewed representative color slides (stimulus) and gave responses according to the preference scale of 1 to 5, revealing low-quality to high-quality scenic beauty. Statistics was used to standardize the evaluators’ values using distinct evaluation criteria to solve the possible differences caused by different evaluation scale baselines. This was expected to accurately measure the public perceived preference for various landscapes. When the sample size was large enough, the randomly sampled perception value would become a normal distribution.
In summary, the SBE method presents the following advantages [26]: (1) It can include the intangible value of resources into the quantitative evaluation, and combine psychology and statistics to exclude individual subjective judgments of managers and planning designers, but adopt the public “perception preference” for different landscapes to respond to the viewers’ perceived preference for landscapes. (2) In terms of the validity test, the SBE method provides similar results for the randomly shot slides or photos of the subjects being evaluated by the on-site evaluation. It could therefore save human resources and time. (3) Regarding the reliability test, the SBE method proves the consistency of photos taken at the same site but at different times, excluding special event factors. Therefore, the method shows high reliability. (4) In addition to forest landscape assessments, the SBE method can be applied to various landscapes. The results prove that it is a beauty-estimation method with high reliability and validity. (5) The SBE method eliminates evaluation errors caused by differences in individual aesthetic concepts. (6) The SBE index can be applied to managing large-area landscapes. (7) With regard to evaluation, the listed landscape factors appear to have positive and negative effects on recreation users that could be a reference for future management decision-making.
Nonetheless, the SBE method also presents the following disadvantages [26]: (1) It is arguable whether the selection of landscape samples could represent general landscape groups. (2) Regarding framing, a photographer’s techniques and angles affect the evaluation results. (3) It is not easy to view the exact evaluated areas and special regions from photos. (4) The SBE method cannot distinguish whether a viewer’s evaluation preference is landscape perception or cognition. (5) The calculated coefficients in the analysis lack definite explanations, would change with different people, and are comparatively subjective.
3. Results
3.1. Study Areas
This study collected relevant cases that have obtained gold awards for water conservancy over the years, selecting two cases according to the completeness of the data (planar layout, disasters experienced, photos before and after remediation, etc.) as the site surveys for analysis.
- (1)
- Upstream Renovation Project of Toubiankeng Stream in Zhongpu
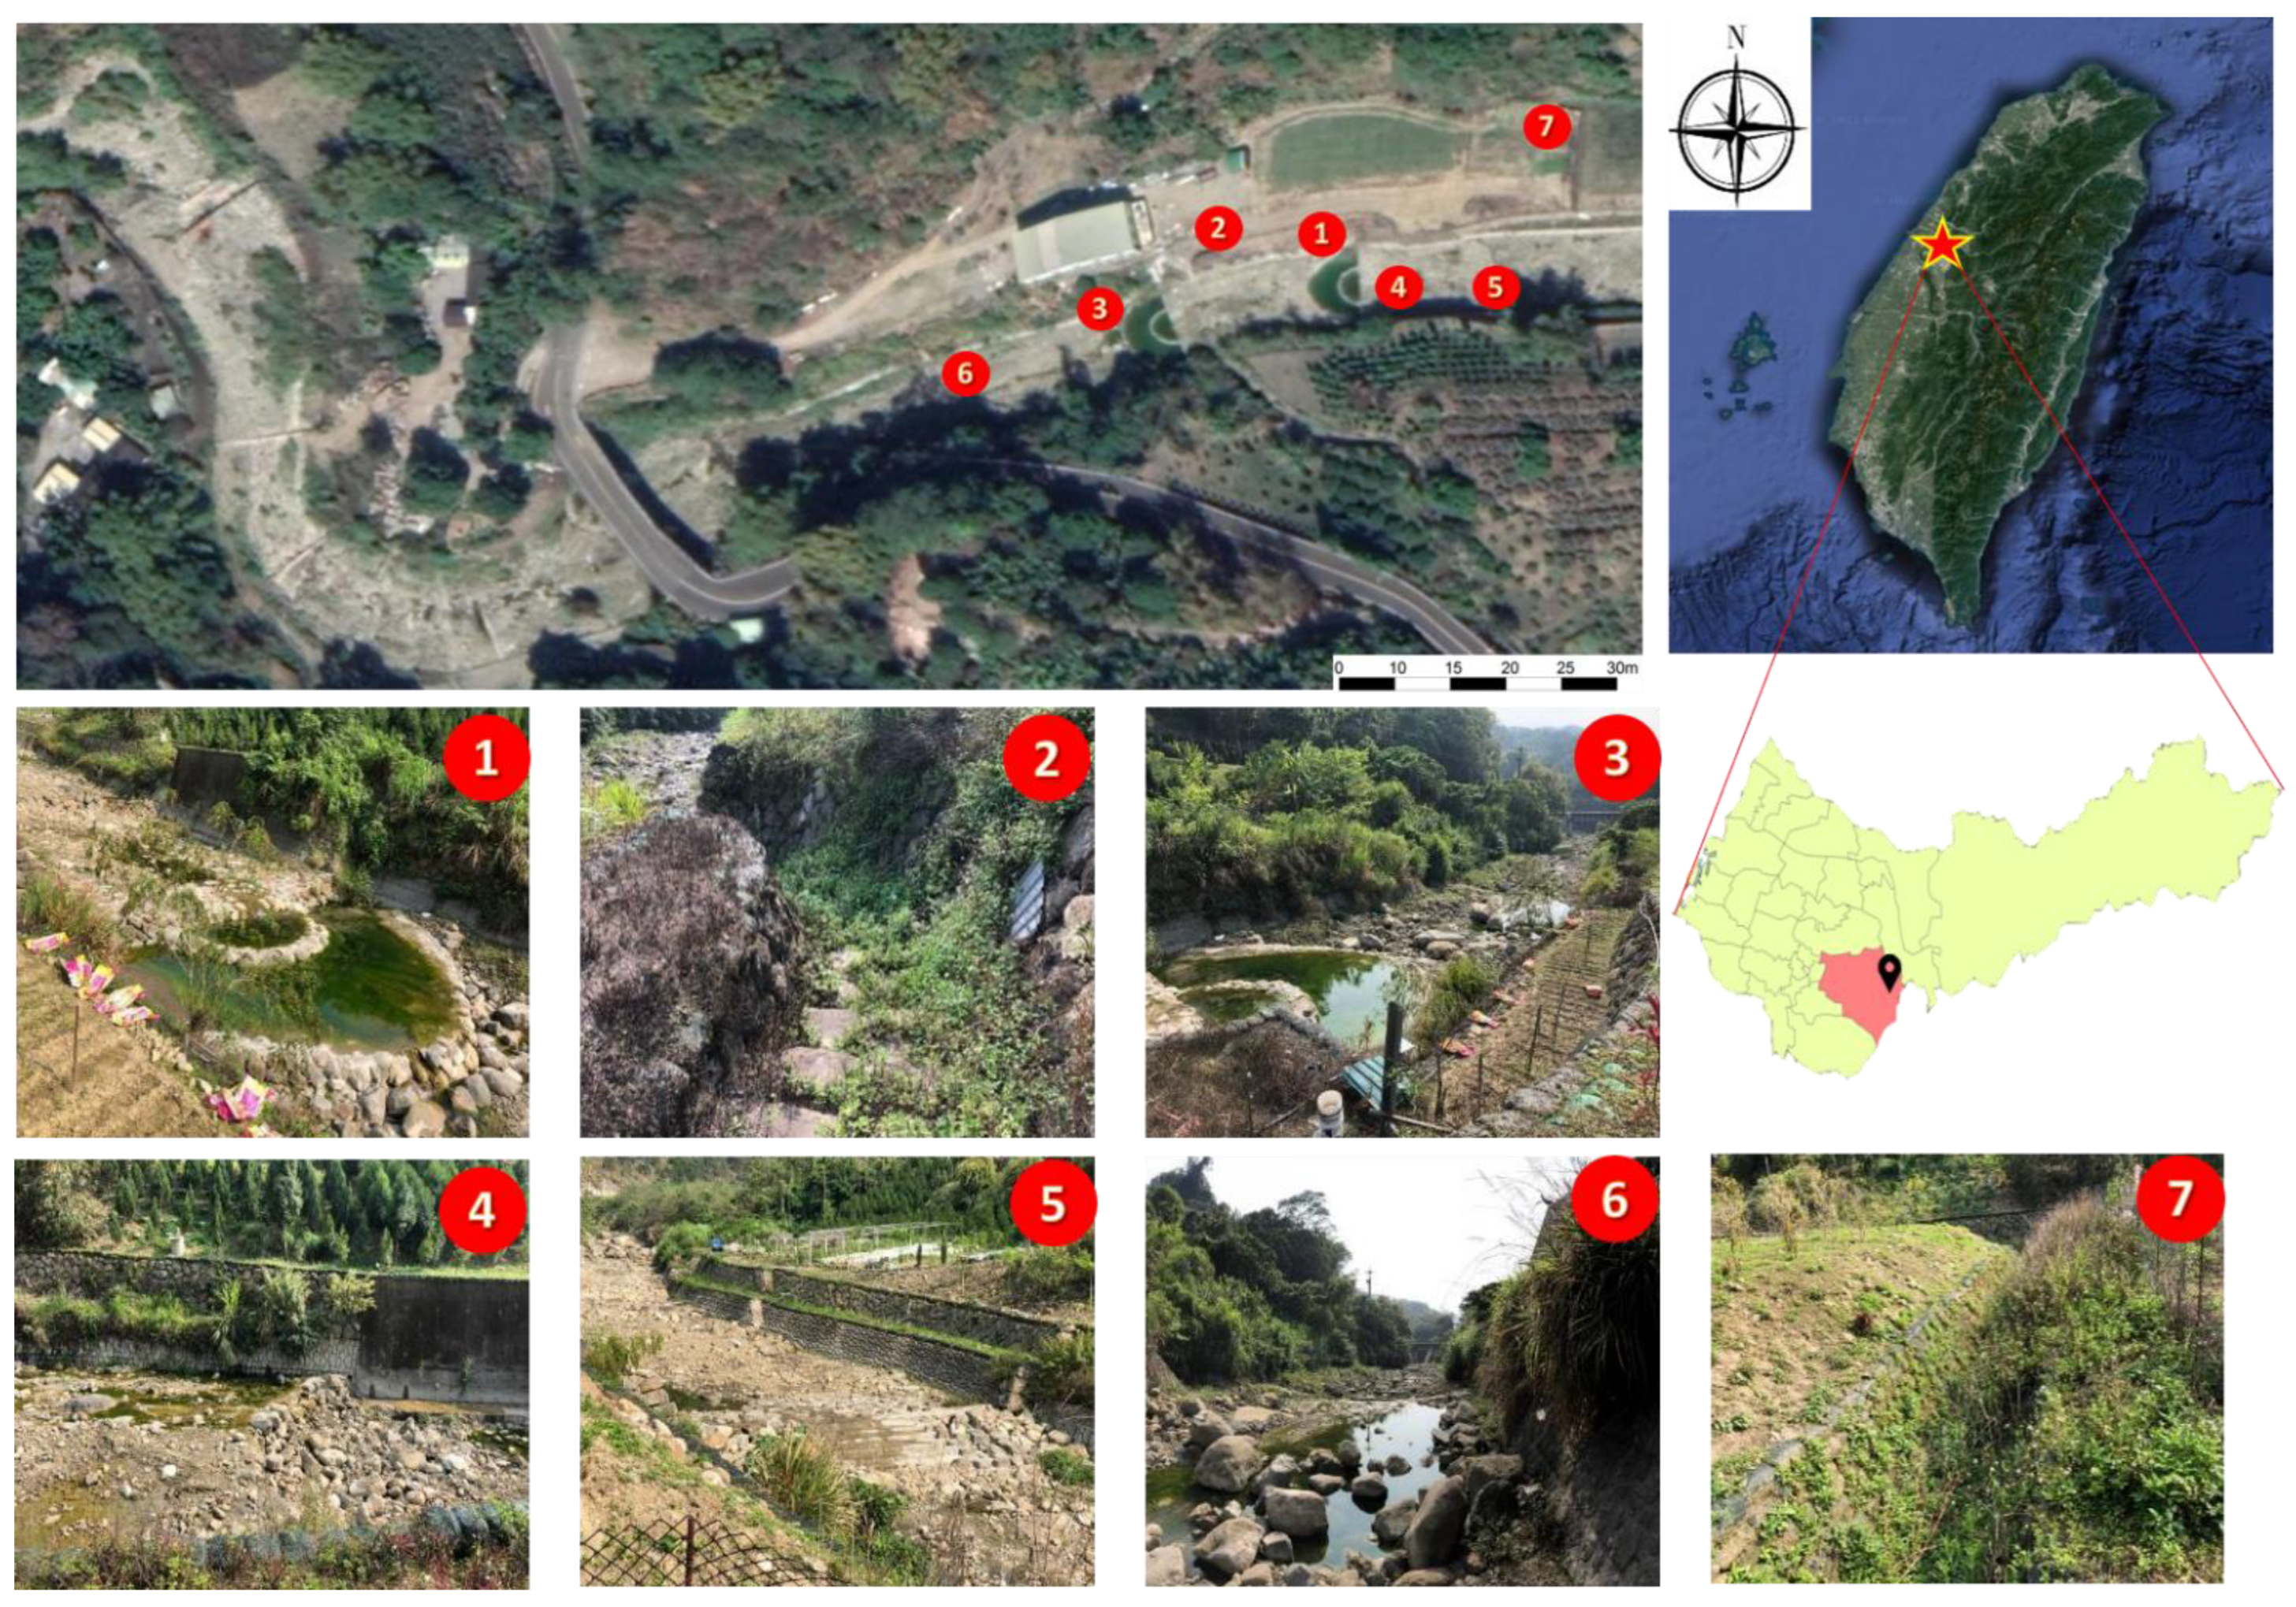
Located in Dongbian Village, Taiping District, Taichung City, Toubiankeng Stream is a tributary of the upstream Dali River. A major flood on 2 July 2004 resulted in debris flow blocking the stream and washing out the surrounding farmland. A large amount of sediment deposited on both sides of the stream at bridge No. 10 of Zhongpu affected the safety of city highway No. 136 and the surrounding houses. “Semi-circle groundsill work” and “arched hollow groundsill work” are the characteristics of this engineering project, with boulders reserved on site to avoid canalization and to direct low-water revetment flow and for the groundsill design of the high riverbank training (Figure 2).
- (2)
- Renovation Project of Sijiaolin Stream in Dongshi Forest Garden
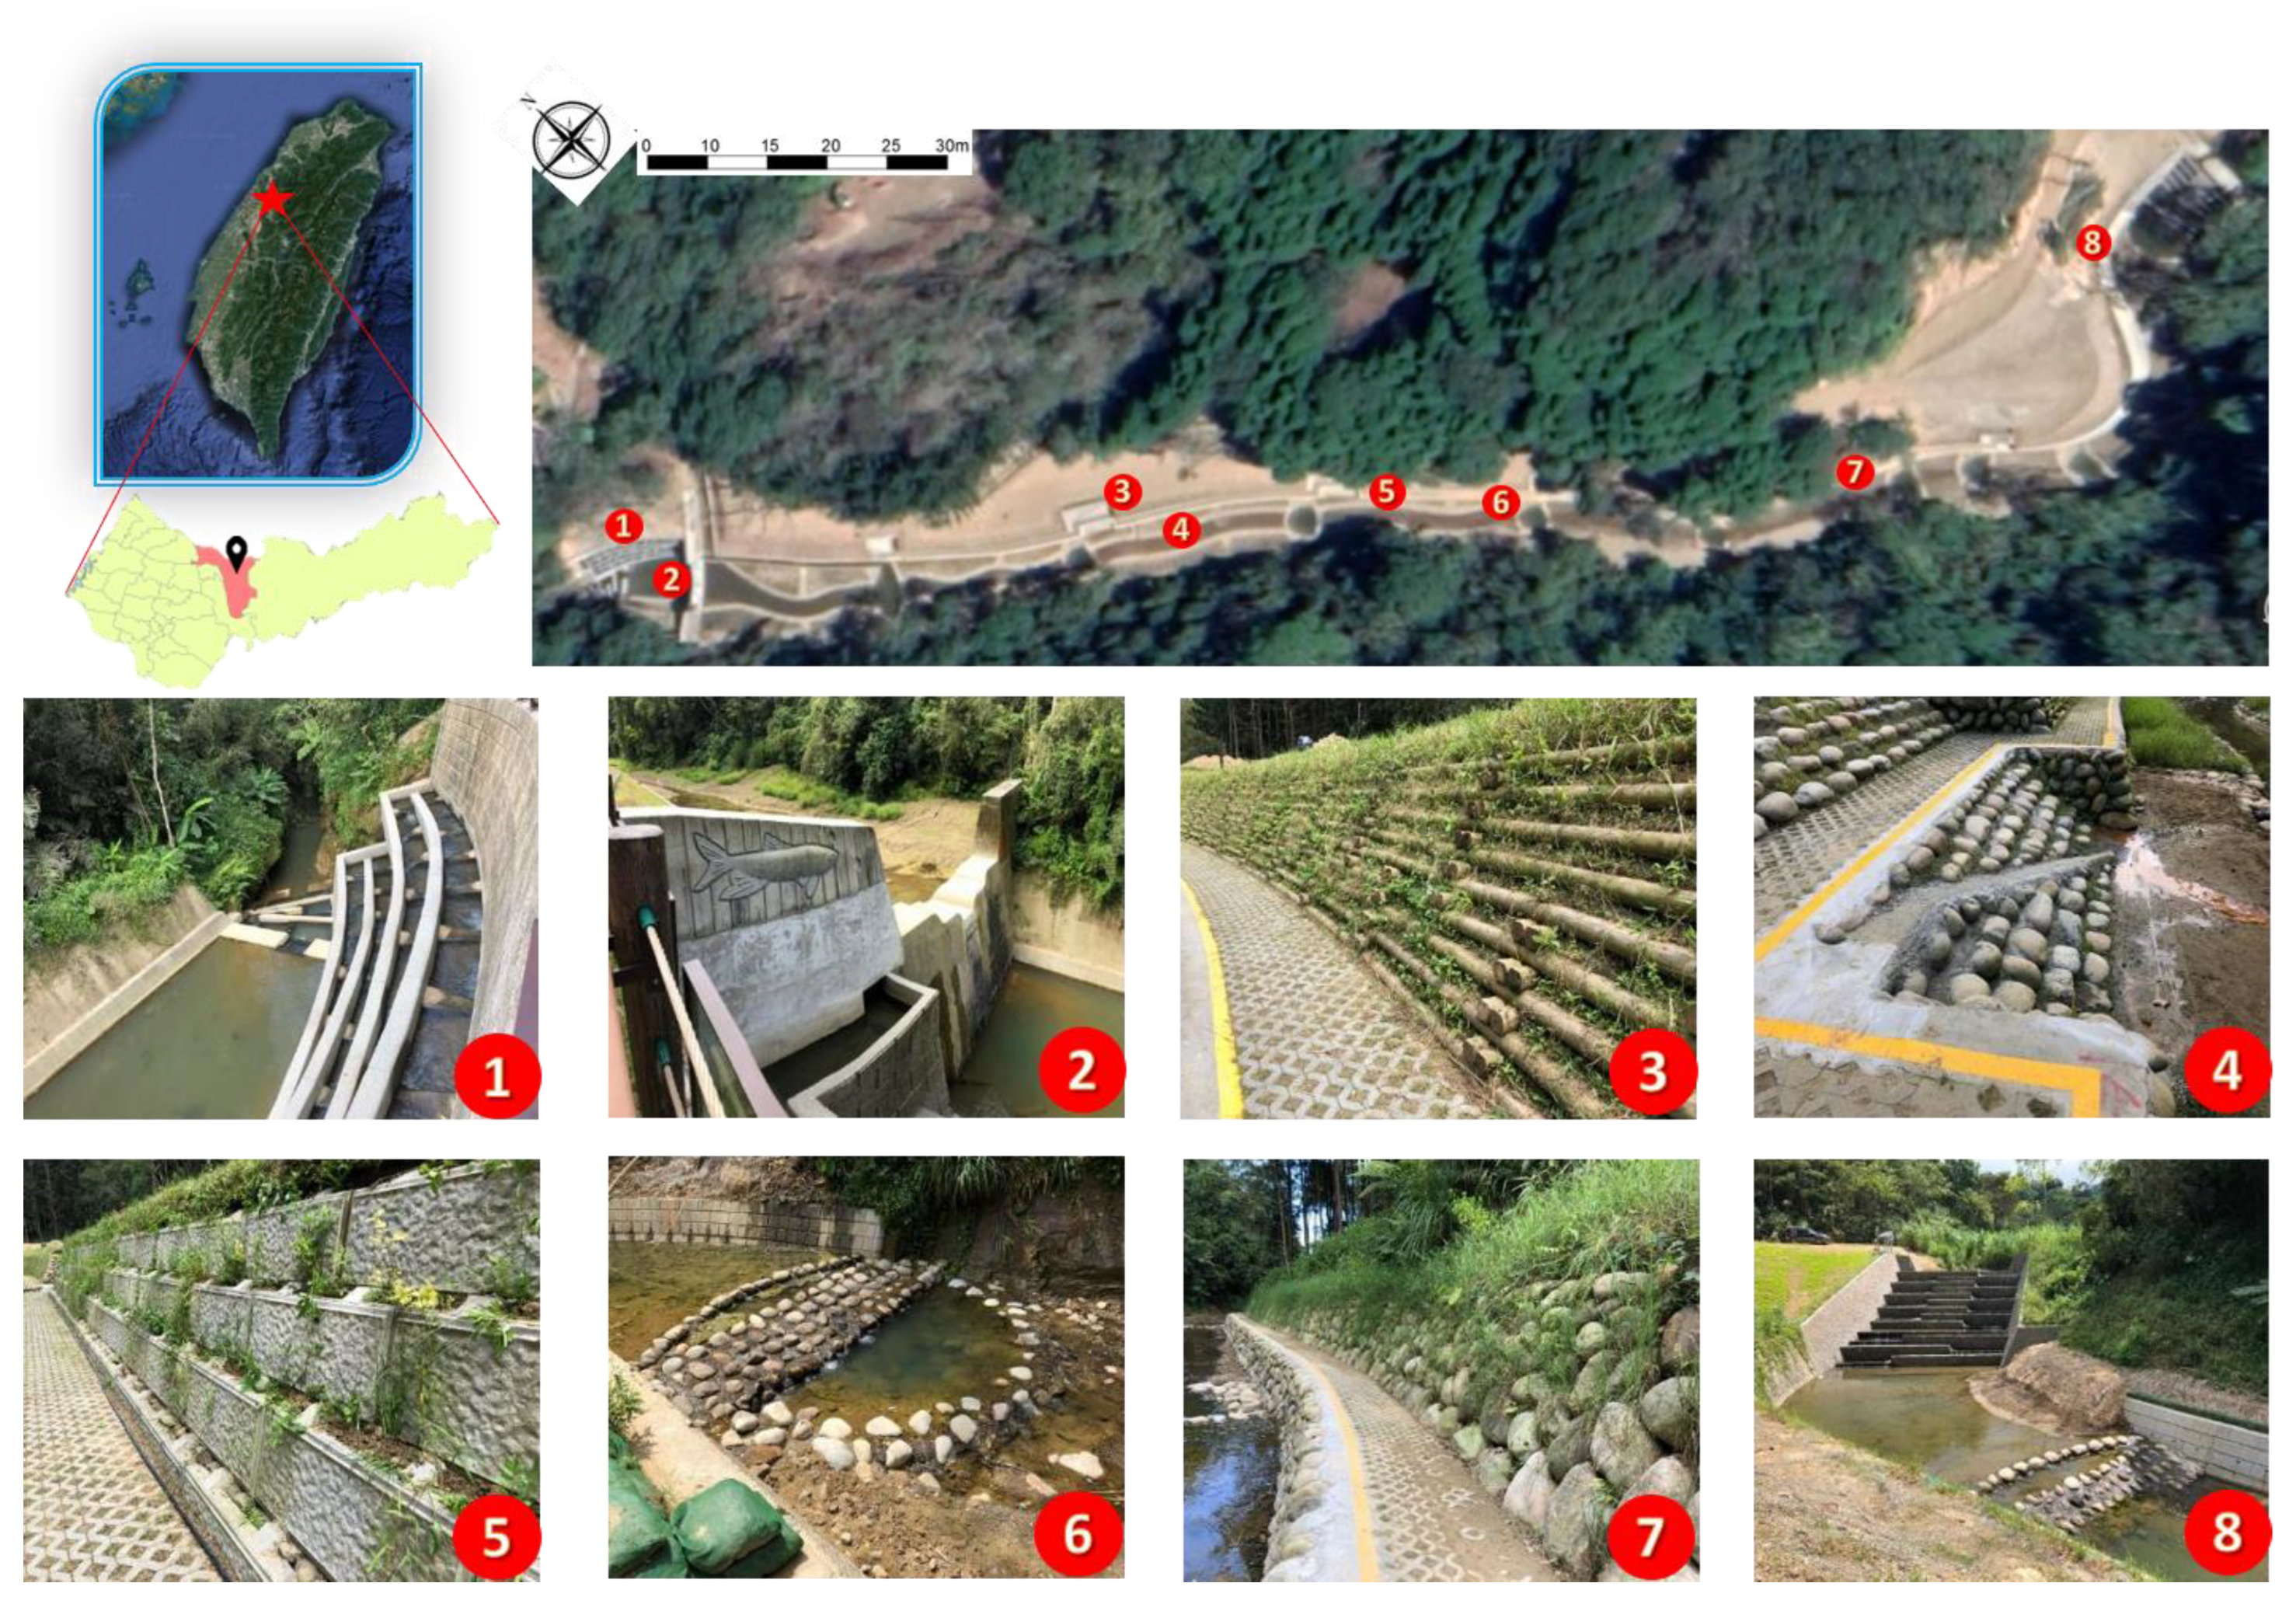
Located in Dongshi District, Taichung City, the Dongshi Forest Garden presents potentially unstable earth next to Dongxin Village and the Da-an River. The existing upstream/downstream check dams appear seriously hollowed out and are almost disabled. A large check dam water body reduction resulted in an ecological barrier, and the serious bank scour caused sediment loss. The original upstream check dam was converted into “water storage type energy dissipation ladders,” which has the added function of being a fishway. In the downstream check dam, a “circuitous fishway” was added. Furthermore, a “water and land ecological corridor” using five different types of embankment connecting the slope and stairway channels is a characteristic of this engineering project (Figure 3).
The selection process considered the influence of weather factors in the photos taken on site. It was a requirement that they were taken and recorded on the same day. The driving distances and the on-site walking paths of the two sample areas are appropriate. Moreover, the second case is located in the Dongshi Forest Garden with good walking paths. The anonymous subjects can learn about different mountain stream facilities with diversified construction methods.
3.2. Analysis Results of the CEM
Regarding the use of pictures, another way could be to have the researcher prepare the images as research materials. However, the images selected by the researcher might not completely capture the subjects’ opinions about the target destination. In this case, as in Garrod [28], although the subjects complete the picture evaluation, the picture selection is not controlled. Such a method, therefore, may not accurately interpret the subject’s evaluation of the elements. Both methods, including an online survey and an on-site questionnaire survey, are used in this study. As a result, the subjects still take pictures on site for the analyses.
3.2.1. Online Survey Results
The online questionnaire survey period was from 1 May to 30 May 2020. The researchers presented the selected digital photos to the test subjects through a slide presentation so that the test subjects could understand the function of photo structures and evaluate them by filling in an online questionnaire. The subjects were mainly undergraduate students and a small number of graduate students, totaling 212 students.
Aimed at two sample areas, to analyze and explain the effect on the overall perception, this study lists the top three factors from the analysis of the questionnaire results. From the factors acquired in the CEM results of the “Upstream Renovation Project of Toubiankeng Stream in Zhongpu” in Table 1, it is understood, due to year differences, that vegetation densely covers the site. This dense distribution of vegetation affects the overall preference score, with significant differences. For instance, in pictures 2 and 3 of Table 1, the embankments show the score dropping from 4.01 to 3.64; the biological channels in pictures 6 and 7 also drop the score from 3.9 to 3.04; and the average preference for the sample areas is 3.64. This reveals that the images of the sample areas show differences due to year differences, but the form and overall visual perception are compatible with the skyline, presenting high public acceptance. The “Renovation Project of Sijiaolin Stream” in Table 2, shot in the closing year, increases the preference to 3.77 after using the CEM, with multiple factors matching the form and arrangement of multiple embankments and multiple biological channels on site.
The overall analysis results reveal that the subjects primarily pay attention to the factors of water and plants. Natural texture factors confer the feeling of being close to nature, so the subjects find it relaxing and stress relieving. When a body of water is reduced, the subjects’ feeling of being close to nature is diminished, and they feel nervous and uneasy. Regarding structural factors, the subjects first pay attention to form and color. Arc forms and meandering stairs enhance the subjects’ preference for artificial structures. Using wood and stone for the structure, and reducing concrete, could minimize the visual impact.
3.2.2. On-Site Investigation Results
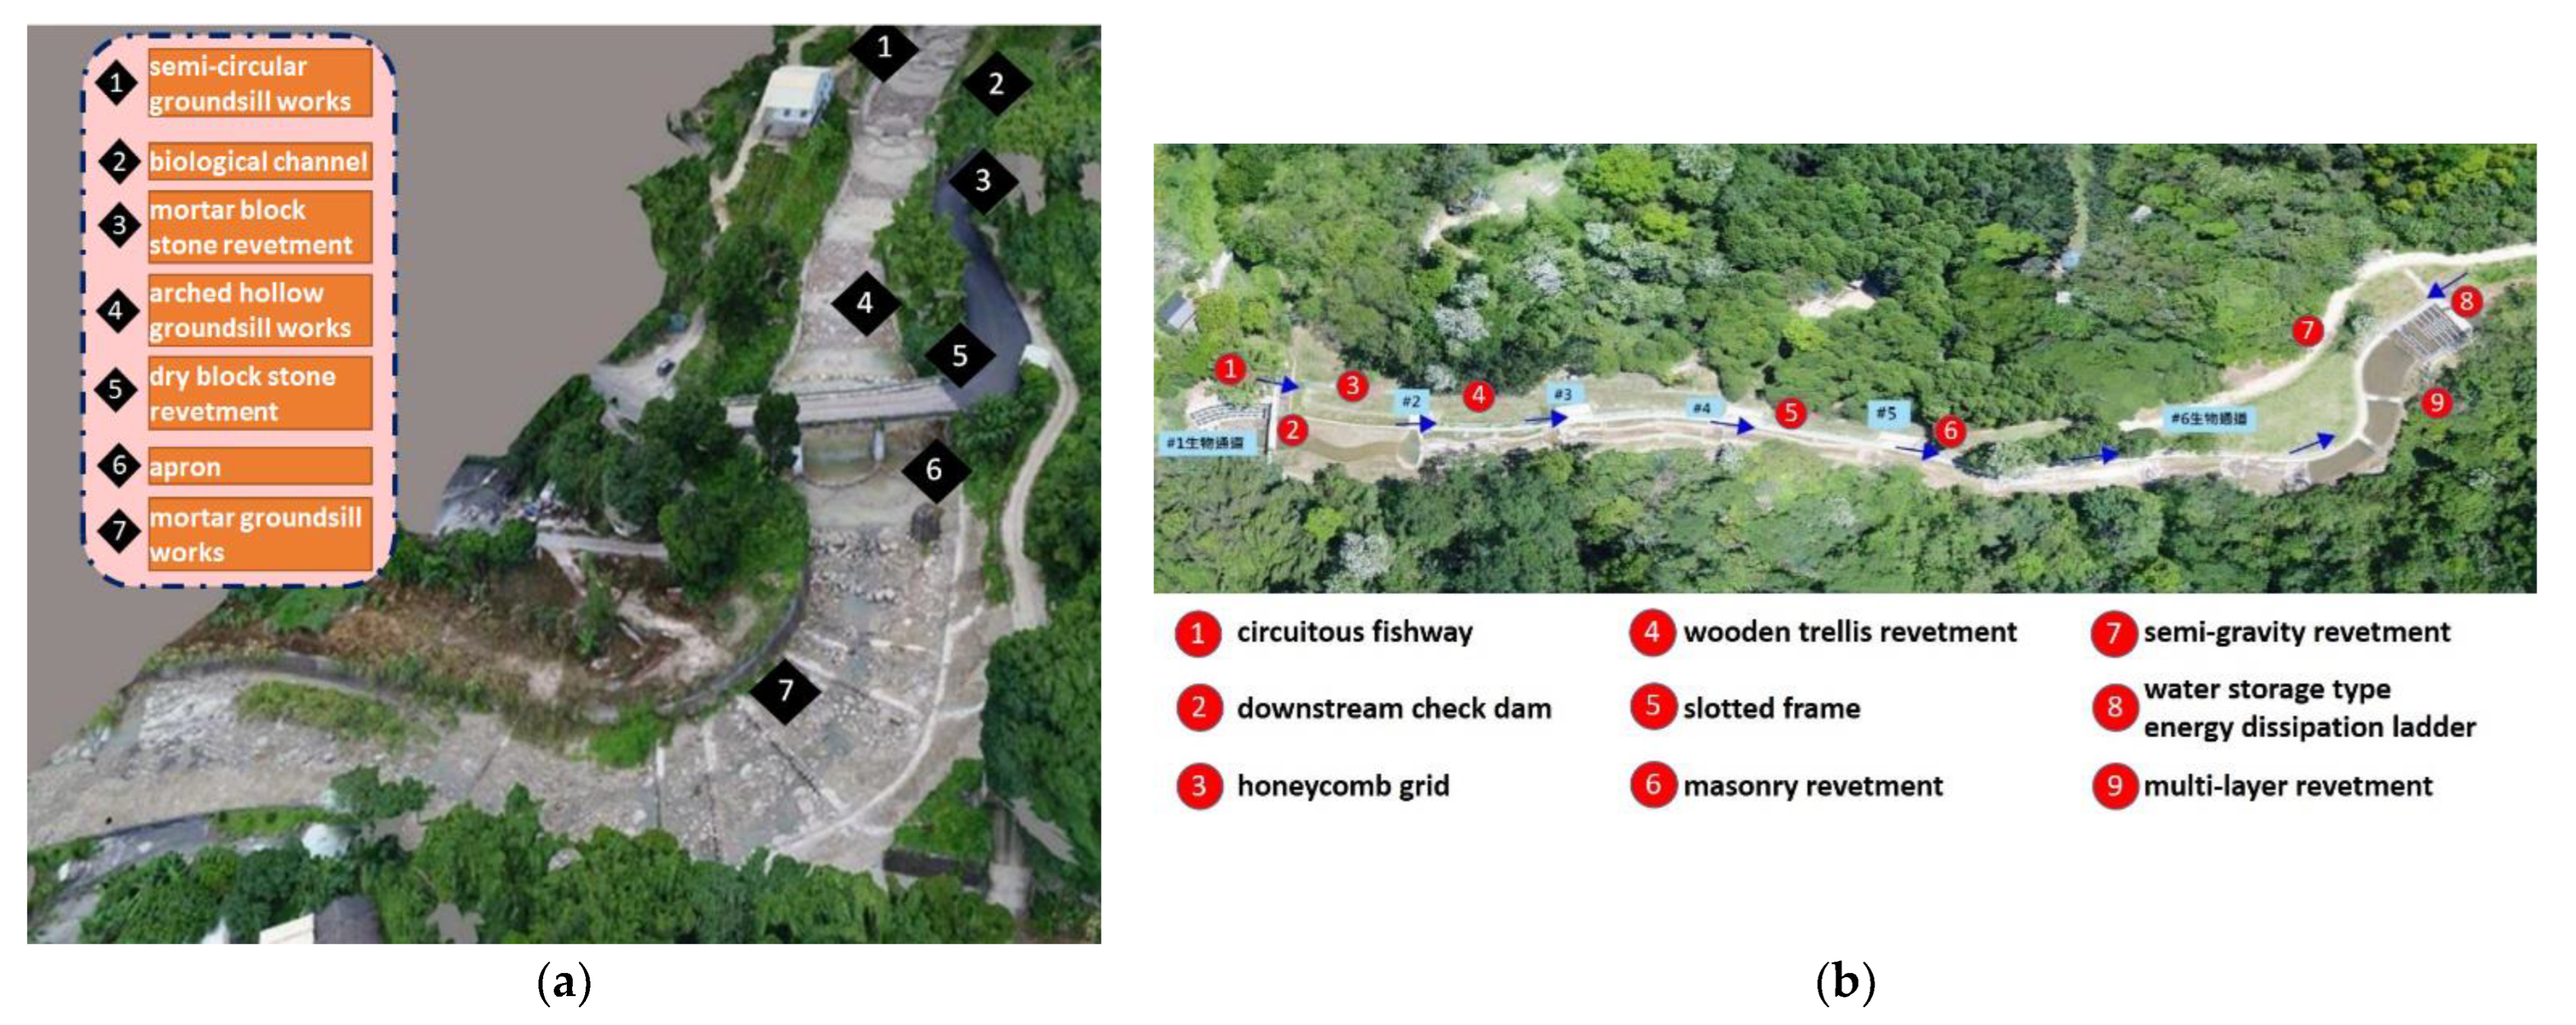
Before the on-site investigation, the subjects were offered a map with designated routes or coverage. The subjects were requested to walk for approximately an hour taking 10–20 pictures of the facility, with either negative or positive meanings. Meanwhile, the location of each facility was marked on the map (Figure 4), and software such as JotForm was utilized for taking and recording their opinions about each facility. These descriptions included three captions: attention element, characteristics of the element, and perception of the noticed feature. From these captions, the related analysis and discussion were carried out.
This study conducted the first on-site investigation on 19 July, the second on 23 September, and the third on 17 October 2020 to establish a more credibly comprehensive evaluation result. A total of 24 volunteer participants visited these two study areas for investigation, taking 231 photographs and recording descriptions of these photos.
Table 3 and Table 4 demonstrate part of the text descriptions from the on-site investigation. After acquiring each interviewee’s information, Python was used for word-segmentation processing to present the acquired text keywords as a word cloud, including the online questionnaires and on-site investigations (Table 5 and Table 6). After coding with NVivo, it was discovered that the online questionnaire representation, as the major direction, merely aims at descriptions of form, color, and arrangement, as the researcher selects the pictures for which the respondents’ opinions are limited. The factors acquired in the on-site investigation questionnaire might be more accurate, as the subjects determine the images to better induce the opinions expressed, e.g., descriptions aimed at the stone size and arc form. In addition to static descriptions, dynamic descriptions are covered in the on-site investigation, e.g., water flow, to present the immersive perception, which cannot be realized from images.
Taking the “Renovation Project of Sijiaolin Stream” as an example to explain the application of the CEM, multiple engineering forms and textures were used in the sample area. The word cloud reveals different online questionnaire representations from it in the other sample area; the factors are multiple and dispersed, but factors of form, arrangement, and color could still be acquired. After the on-site investigation, the word cloud clearly shows the subjects’ descriptions of on-site water, stone, biological channels, and stairs. Using NVivo for coding, the multiple textures of the embankment and the layered stairs form were acquired, and actions and sounds were added. For instance, the subjects see flying dragonflies and butterflies and hear bugs chirping and birds singing during the on-site investigation. The on-site flow conditions would not appear visually different due to the picture-taking skills. The overall perception is positive. Moreover, the completion of the sample area is close, environmental education is taken into account in the planning stage, and the Dongshi Forest Garden is well maintained so the perception is positive.
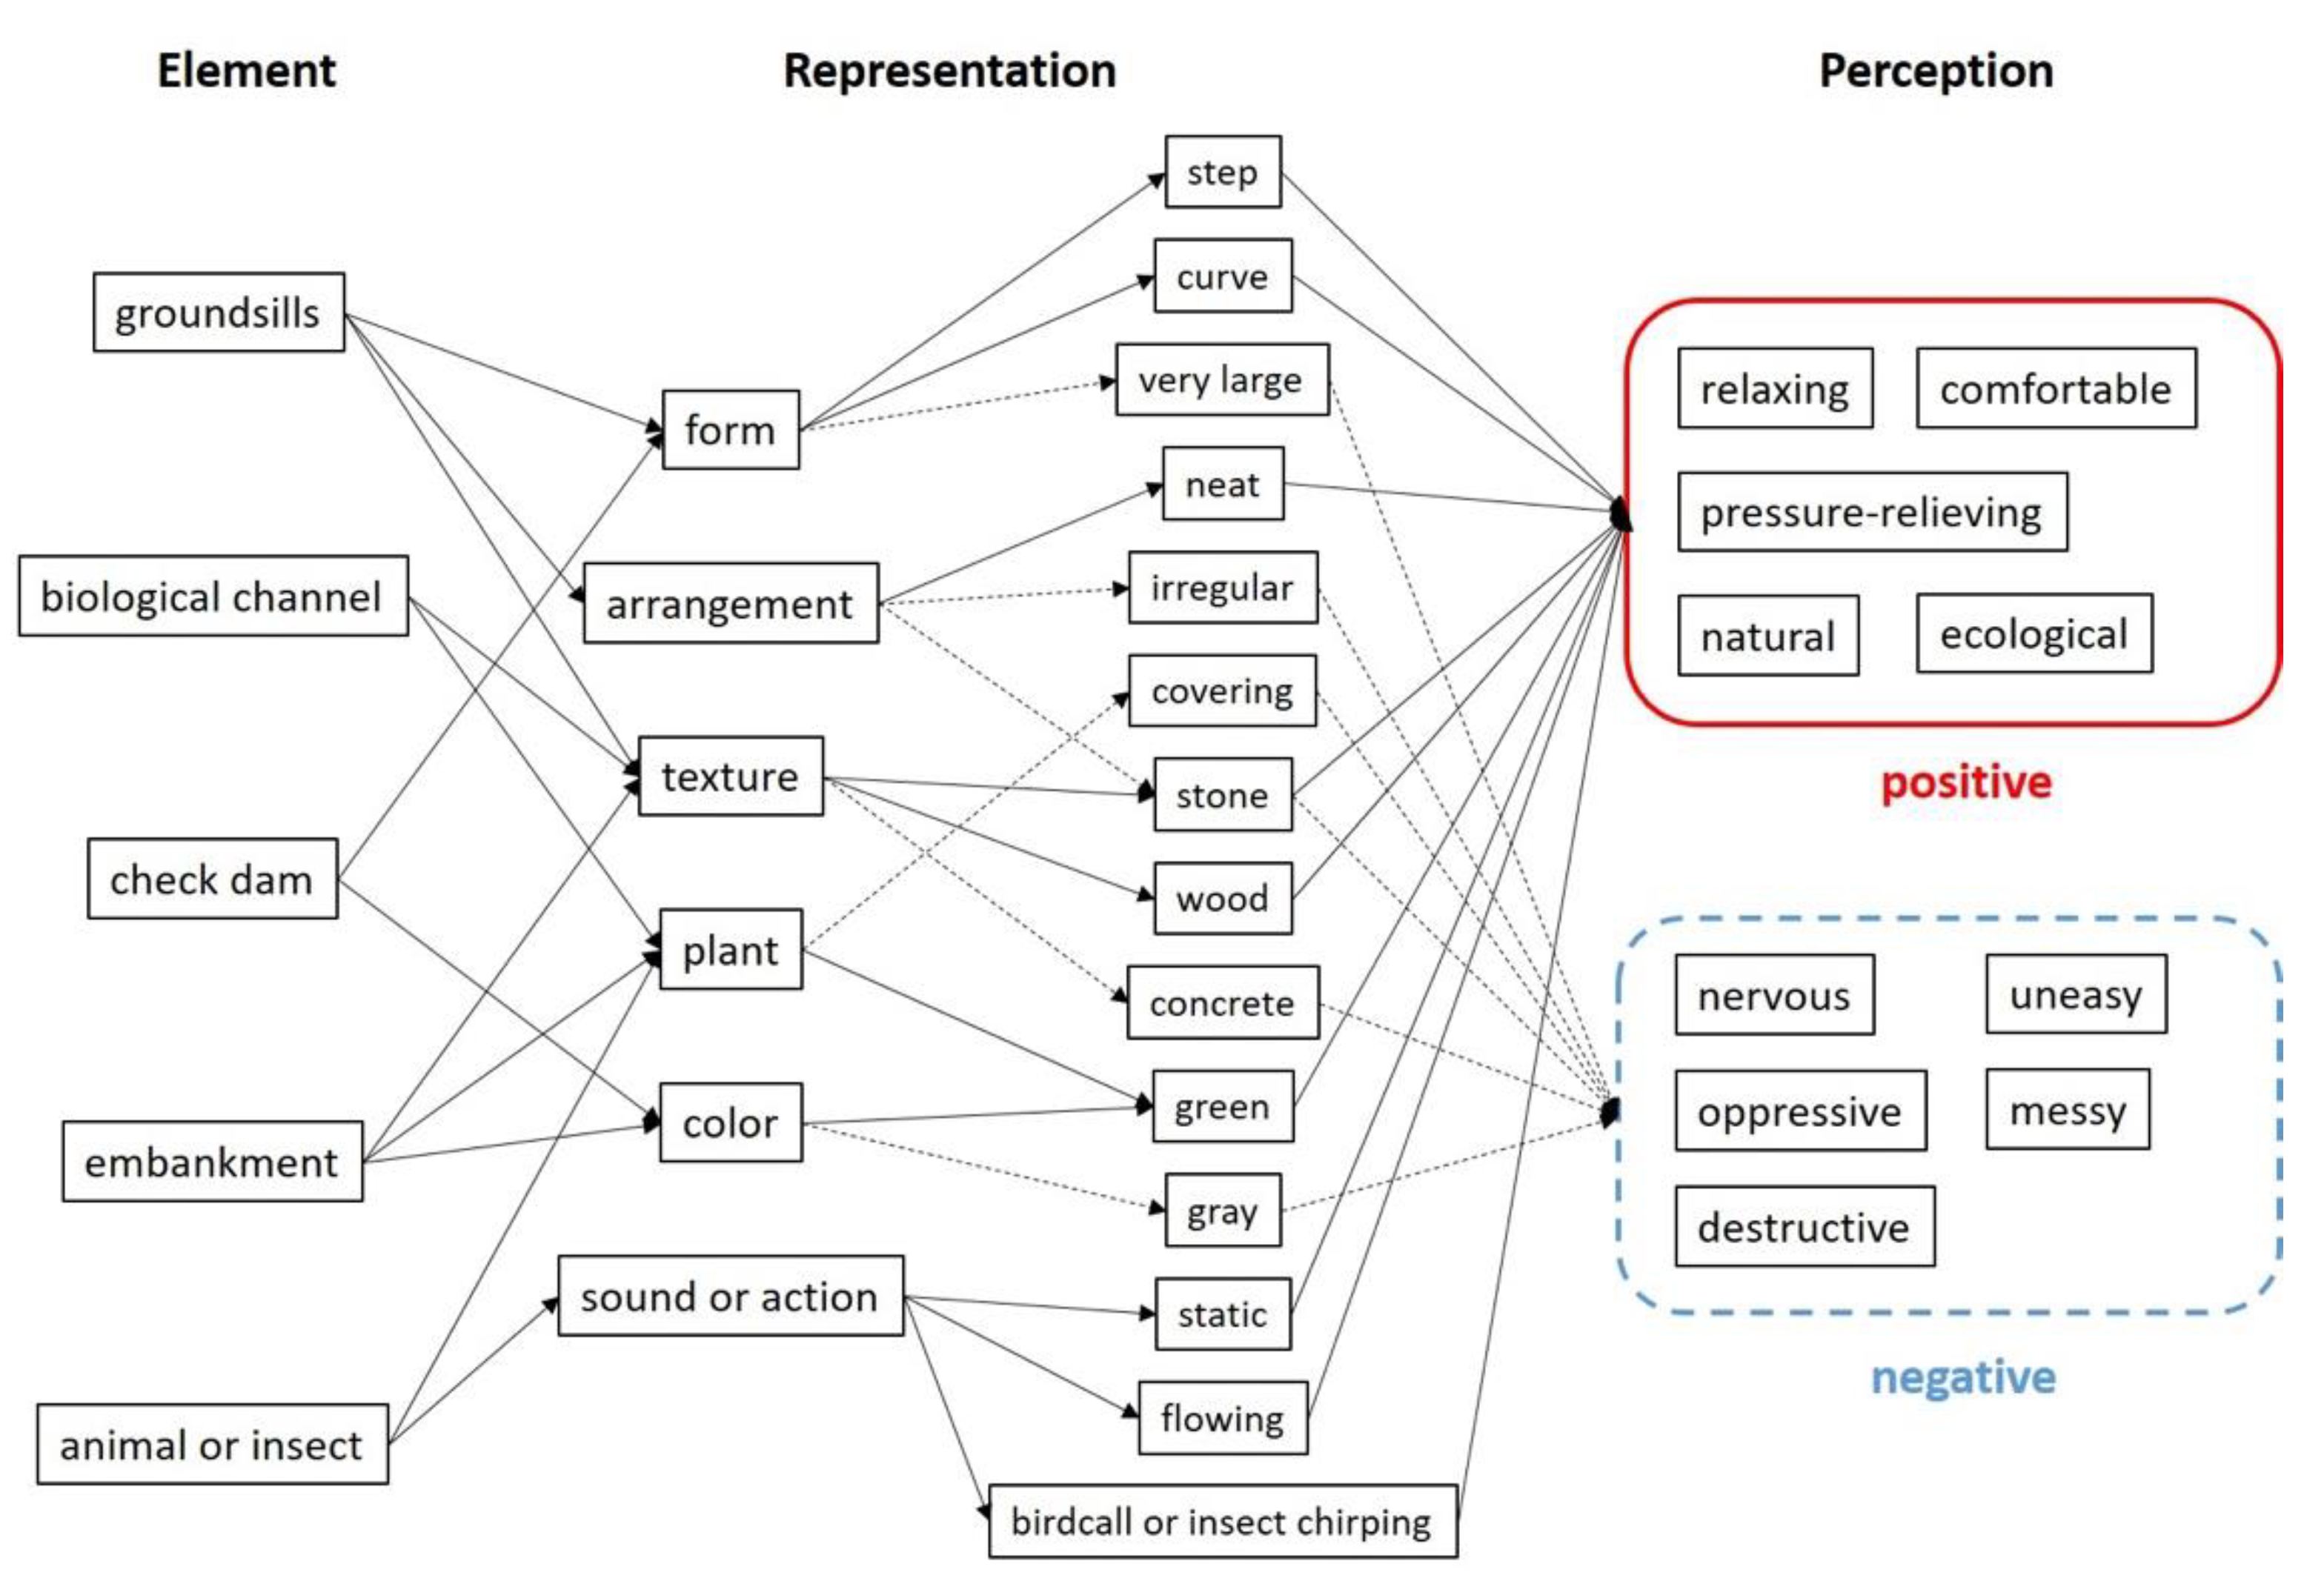
The subjects’ feedback information, especially the self-selected shooting pictures, provides rich information and multiple materials. For example, subjects with different backgrounds observe from different perspectives. The ones with an engineering background are accustomed to observing engineering structures, so they describe the form and functions. The students without an engineering background more easily observe from the perspective of life, noticing things such as insects and vegetation in the surrounding environment along with the sound of flowing water, bugs chirping, and birds singing in the background, in their perception of the environment. Referring to the concept of the Zaltman metaphor elicitation technique (ZMET) [29,30,31], using the text keywords extracted by this study and NVivo, a consensus map of the respondents is produced, as shown in Figure 5. Furthermore, the factors are organized from the above analyses, as shown in Table 7.
3.3. Online Questionnaire SBE Analysis Result
The scenic beauty estimation (SBE) method, proposed by Daniel and Boster [26], was applied in this study to analyze the online questionnaire. The subjects evaluated the pictures with their preferences. The online questionnaire was collected via Google for one month (1–20 May 2020); a total of 212 valid copies were acquired. The preference evaluation data were processed using RMRATE [7,9], provided by the United States Department of Agriculture (USDA). The mean of 11 pictures was regarded as the baseline for both sample areas, and the baseline-adjusted Z score, which is similar to the normal distribution, of each image was converted into scenic beauty estimates (SBEs). The results are shown in Table 8 and Table 9.
3.3.1. CEM and SBE Comparison of the “Upstream Renovation Project of Toubiankeng Stream in Zhongpu”
In the conversion of preferences in the online questionnaire into SBE (Table 8), three images, each with the highest and the lowest scores, were extracted. The top three images are as follows: No. 5, the semi-circle groundsill work; No. 11, the arched hollow-out groundsill work; and No. 3, the embankment with ecological engineering. The former two pictures represent the common point of a rich waterscape, with the on-site stones used in the structure, showing a sense of harmony with the environment. They conform to the aesthetic principle of integrating structures into the environment [1]. Regarding the water conservation facilities in No. 5 and No. 11, the dam body presents a similar shape, with higher immersion into the embankment on both sides, and the natural river shoreline or skyline enhances the harmony and visual preference [3]. The CEM reveals that the subjects with a high-level evaluation show a higher perception of the arrangement of stone as the structure (Table 10). The visual harmony of the layered stone stacks contributes to increasing the subjects’ preference [32].
No. 6, No. 8, and No. 1 appear to have the lowest evaluation on the SBE. The former two structures are covered by vegetation, and No. 1 shows incoordination due to a large amount of irregular rocks. The green visual ratio in the image is enhanced to increase the sense of nature. However, the increasing sense of nature diminishes when the green visual ratio is higher than 40%, but the closure property appears to be an increasing trend. The increase in closure property decreases the visual preference [3]. The CEM reveals that the top three subjects show a comparatively oppressive and uneasy perception of the vegetation in the structures with the lowest scores.
3.3.2. CEM and SBE Comparison of the “Renovation Project of Sijiaolin Stream”
The SBE evaluation in Table 9 shows the three images with the highest and lowest scores. The top three images are as follows: No. 8, a roundabout biological channel; No. 11, stone masonry groundsill work; and No. 9, a compound biological channel. The former two images represent the common point of a rich waterscape. The water body in the image with water conservation facilities enhances the vitality, softens the water conservation facilities, reduces the oppressive sense of sand control facilities, and reduces the closure property. When the water visual ratio is lower than 30%, the visual preference of the image is proportional to harmony; the higher harmony, the greater the visual preference [3]. The CEM reveals that the subjects with a higher evaluation appear to prefer curve or stair forms over traditional straight-line designs (Table 11).
Furthermore, No. 3, No. 10, and No. 2 appear to have the lowest scores on the SBE, and the common point is the absence of a water body. The sample area is a torrent with significant water difference in the dry season—the increasing closure property decreases the visual preference. The qualitative analysis reveals that the top three subjects have nervous and uneasy perceptions regarding the lack of water.
The above findings show that the top three structures in the SBE evaluation are mainly ecological engineering and groundsill structures with a rich waterscape; vegetation is the typical landscape in mountainous areas, and distinct vegetation in forests appears with different landscape aesthetics. Nevertheless, vegetation differences are reduced when there is both a structure and waterscape. The CEM results reveal the significant effects of the structure’s form and texture, in addition to the waterscape and vegetation, on the entire landscape, followed by the vegetation and the structure’s volume and form.
This study has potential limitations. There are few studies on the landscape assessment of mountain stream facilities using qualitative analysis. Some documents [33,34] have described a detailed narrative analysis of the cultural heritage of facilities in river basins or their relationship with human social development. The use of visual language translation is a new concept, but this method may affect the sample number size and choice because of the complex process. A qualitative study with a large sample size would not be possible in this study. At the same time, it was also limited by time constraints and the impact of the COVID-19 pandemic. Moreover, this study can only be evaluated for case-by-case projects, and there may be biases caused by the cultural or personal characteristics of the subjects. However, the aim of this study is to provide a new evaluation method, and subjects’ deeper meanings may be revealed through this method. Future endeavors will be expanded to more projects and subjects, including experts and the general public.
4. Conclusions
Traditional landscape qualitative research is usually based on narrative analysis methods that are too subjective, although discussed in depth. However, the commonly used quantitative analysis method often fails to deeply explore the reasons behind the data. Therefore, this study proposes a new method, namely, visual language translation, or the CEM, which combines the features of qualitative research and quantitative analysis. This has also rarely been mentioned in previous studies, and this is considered a new attempt.
Different from the traditional research method, visual language translation, or the CEM used in this study, clearly understands the subjects’ perception of the images and sample areas. Factors are accurately acquired through the subjects’ descriptions, and such factors, through qualitative analysis, are coded with NVivo to find the best ones. However, too much open information can easily result in information dispersion and difficulties with induction and analysis. For this reason, both the CEM and SBE are selected to acquire complete information for analysis and comparison. In this study, these methods were established and performed well with good results.
Using SBE, we can acquire the subjects’ preferences for images and sample areas, which, corresponding with the CEM, accurately comprehends the subjects’ factor weights. In this way, in addition to obtaining a quantitative landscape preference, it is also possible to further understand the possible reasons for the preference. For instance, wooden lattice-framed embankment-matching stairs reduce the visual impact on the entire environment and enhance the subjects’ preference. A stone embankment could reduce the sense of artificiality to make the subjects feel safe and stable. Different from individual analysis in the past, two methods are utilized in this study, and an on-site investigation is integrated to understand the sample areas more deeply and to accurately acquire factors for subsequent research and design.
However, this study has limitations. It is mainly based on case studies, of which we still need more varied research objects and a wider survey sample. It is suggested that the CEM could be continuously used for discussing the correlations among representation, perception, and preference. Furthermore, experts’ interviews and questionnaires could be combined to build a list of the possible factors in landscape evaluation and to facilitate discussion of the basic concept of aesthetic design in mountain stream engineering.
Author Contributions
Conceptualization, S.-C.C. and S.-H.P.; methodology, C.-Y.H.; software, S.-H.P.; validation, C.-Y.H. and S.-H.P.; formal analysis, S.-C.C.; investigation, C.-Y.H.; writing—original draft preparation, S.-H.P.; writing—review and editing, S.-C.C. All authors have read and agreed to the published version of the manuscript.
Funding
This research was funded by the Soil and Water Conservation Bureau, Council of Agriculture, Taiwan, grant number 109-11.1-01-06-001(8).
Data Availability Statement
The datasets generated during and/or analysed during the current study are available from the corresponding author on reasonable request.
Acknowledgments
The authors thank the anonymous volunteers who participated in this study.
Conflicts of Interest
The authors declare no conflict of interest.
References
- Chen, S.-C.; Lin, H.-C. Visual aesthetic design principles of check dams. J. Chin. Soil Water Conserv. 2010, 41, 34–49. (In Chinese) [Google Scholar]
- Peng, S.-H.; Tang, C. Blending the analytic hierarchy process and fuzzy logical systems in scenic beauty assessment of check dams in streams. Water 2015, 7, 6983–6998. [Google Scholar] [CrossRef] [Green Version]
- Chen, J.-C.; Cheng, C.-Y.; Huang, C.-L.; Chen, S.-C. Assessment of the visual quality of sediment control structures in mountain streams. Water 2020, 12, 3116. [Google Scholar] [CrossRef]
- Peng, S.-H.; Han, K.-T. Assessment of aesthetic quality on soil and water conservation engineering using the scenic beauty estimation method. Water 2018, 10, 407. [Google Scholar] [CrossRef] [Green Version]
- Brown, T.C.; Daniel, T.C. Modeling Forest Scenic Beauty: Concepts and Application to Ponderosa Pine; US Department of Agriculture, Forest Service, Rocky Mountain Forest and Range Experiment Station: Washington, DC, USA, 1984.
- Brown, T.C.; Daniel, T.C. Predicting scenic beauty of timber stands. For. Sci. 1986, 32, 471–487. [Google Scholar]
- Brown, T.C.; Daniel, T.C. Scaling of Ratings: Concepts and Methods; USDA Forest Service, Rocky Mountain Forest and Range Experiment Station: Fort Collins, CO, USA, 1990; Volume 293.
- Brown, T.C.; Daniel, T.C. Landscape aesthetics of riparian environments: Relationship of flow quantity to scenic quality along a wild and scenic river. Water Resour. Res. 1991, 27, 1787–1795. [Google Scholar] [CrossRef]
- Brown, T.C.; Daniel, T.C.; Schroeder, H.W.; Brink, G.E. Analysis of Ratings: A Guide to RMRATE; US Department of Agriculture, Forest Service, Rocky Mountain Forest and Range Experiment Station: Washington, DC, USA, 1990.
- Balomenou, N.; Garrod, B. A review of participant-generated image methods in the social sciences. J. Mix. Methods Res. 2016, 10, 335–351. [Google Scholar] [CrossRef] [Green Version]
- Koga, T.; Taka, A.; Munakata, J.; Kojima, T.; Hirate, K.; Yasuoka, M. Participatory research of townscape, using “Caption Evaluation Method”-Studies of the cognition and the evaluation of townscape, part 1. J. Archit. Plan. Environ. Eng. 1999, 517, 79–84. [Google Scholar]
- Koga, T.; Sumeragi, T.; Kojima, T.; Munakata, J.; Hirate, K. User’s evaluation of living environment in welfare facility for the elderly with caption evaluation method: User’s evaluation of living environment in welfare facility for the elderly part 1. J. Archit. Plan. (Trans. AIJ) 2006, 71, 33–39. [Google Scholar] [CrossRef] [Green Version]
- Kojima, T.; Koga, T.; Munakata, J.; Hirate, K. Multivariate analysis on verbal data of ‘Caption Evaluation Method’. Studies of the cognition and the evaluation of townscape. Part 2. J. Archit. Plan. Environ. Eng. 2002, 67, 51–58. [Google Scholar] [CrossRef] [Green Version]
- Naoi, T.; Airey, D.; Iijima, S.; Niininen, O. Visitors’ evaluation of an historical district: Repertory Grid Analysis and Laddering Analysis with photographs. Tour. Manag. 2006, 27, 420–436. [Google Scholar] [CrossRef] [Green Version]
- Naoi, T.; Iijima, S. Applying the caption evaluation method to research historical districts as tourism destinations. In Proceedings of the CAUTHE 2008: Tourism and Hospitality Research, Training and Practice, Surfers Paradise, Australia, 11–14 February 2008; Volume 122. [Google Scholar]
- Oi, N.; Okita, T.; Hiraoka, Y.; Takahashi, H. Attributes of participants and their evaluation tendencies in a research of townscape, using “Caption Evaluation Method”. J. Environ. Eng. (Trans. AIJ) 2008, 73, 393–399. [Google Scholar] [CrossRef] [Green Version]
- Ueda, M.; Kawamura, Y.; Oi, N.; Takahashi, H. A Study on cognition of landscape elements in station plazas using Caption Evaluation Method: Landscape survey in station plazas in and around Fukuoka city. AIJ J. Technol. Des. 2016, 22, 147–151. [Google Scholar] [CrossRef]
- Naoi, T.; Yamada, T.; Iijima, S.; Kumazawa, T. Applying the caption evaluation method to studies of visitors’ evaluation of historical districts. Tour. Manag. 2011, 32, 1061–1074. [Google Scholar] [CrossRef]
- Chen, Y.; Parkins, J.R.; Sherren, K. Leveraging social media to understand younger people’s perceptions and use of hydroelectric energy landscapes. Soc. Nat. Resour. 2019, 32, 1114–1122. [Google Scholar] [CrossRef]
- Gibbs, G.R. The nature of qualitative analysis. In Analyzing Qualitative Data; SAGE: New York, NY, USA, 2007; pp. 1–9. [Google Scholar]
- Allahyari, M.; Pouriyeh, S.; Assefi, M.; Safaei, S.; Trippe, E.D.; Gutierrez, J.B.; Kochut, K. A brief survey of text mining: Classification, clustering and extraction techniques. arXiv 2017, arXiv:1707.02919. [Google Scholar] [CrossRef]
- Hashimi, H.; Hafez, A.; Mathkour, H. Selection criteria for text mining approaches. Comput. Hum. Behav. 2015, 51, 729–733. [Google Scholar] [CrossRef]
- Deng, W.-Y. Python Machine Learning and Deep Learning Special Training Course: Introduction and Application; GOTOP Information Inc.: Taipei, Taiwan, 2019. (In Chinese) [Google Scholar]
- Bazeley, P.; Jackson, K. Qualitative Data Analysis with NVivo; Sage Publications Limited: New York, NY, USA, 2013. [Google Scholar]
- Anderson, L.M.; Schroeder, H.W. Application of wildland scenic assessment methods to the urban landscape. Landsc. Plan. 1983, 10, 219–237. [Google Scholar] [CrossRef]
- Daniel, T.C.; Boster, R.S. Measuring Landscape Esthetics: The Scenic Beauty Estimation Method; Rocky Mountain Forest and Range Experiment Station: Fort Collins, CO, USA, 1976.
- Schroeder, H.W.; Daniel, T.C. Predicting the scenic quality of forest road corridors. Environ. Behav. 1980, 12, 349–366. [Google Scholar] [CrossRef]
- Garrod, B. A snapshot into the past: The utility of volunteer-employed photography in planning and managing heritage tourism. J. Herit. Tour. 2007, 2, 14–35. [Google Scholar] [CrossRef]
- Zaltman, G.; Coulter, R.H. Seeing the voice of the customer: Metaphor-based advertising research. J. Advert. Res. 1995, 35, 35–51. [Google Scholar]
- Ramjaun, T.A. Experimenting with ZMET: Issues and adaptions. Qual. Rep. 2021, 26, 1633–1641. [Google Scholar] [CrossRef]
- da Rosa, C.; Baggio, D.K.; Araujo, C.F. Eating: It’s the best way to grow: A study on the food consumption of children using an adapted ZMET. REMark 2022, 21, 577. [Google Scholar] [CrossRef]
- Chen, J.-C.; Huang, C.-L.; Chen, S.-C.; Tfwala, S.S. Visual harmony of engineering structures in a mountain stream. Water 2021, 13, 3324. [Google Scholar] [CrossRef]
- Fajer, M. Watermills—A Forgotten River Valley Heritage—Selected examples from the Silesian voivodeship, Poland. Environ. Socio-Econ. Stud. 2015, 2, 1–9. [Google Scholar] [CrossRef] [Green Version]
- Szkurłat, E. Human-river relations at various stages of development of water front factory settlements in Łódź. Environ. Socio-Econ. Stud. 2016, 3, 47–56. [Google Scholar] [CrossRef]
Figure 1.
Research flow chart.

Figure 2.
On-site survey picture of the “Upstream Renovation Project of Toubiankeng Stream in Zhongpu” for the 17th Honorable Mention of the Public Construction Golden Quality Award for water conservancy (25 March 2020).
Figure 2.
On-site survey picture of the “Upstream Renovation Project of Toubiankeng Stream in Zhongpu” for the 17th Honorable Mention of the Public Construction Golden Quality Award for water conservancy (25 March 2020).

Figure 3.
An on-site survey picture of the “Renovation Project of Sijiaolin Stream” for the 19th Excellent Award of the Public Construction Golden Quality Award for water conservancy (20 September 2019).
Figure 3.
An on-site survey picture of the “Renovation Project of Sijiaolin Stream” for the 19th Excellent Award of the Public Construction Golden Quality Award for water conservancy (20 September 2019).

Figure 4.
On-site investigation map: (a) Upstream Renovation Project of Toubiankeng Stream in Zhongpu; and (b) Renovation Project of Sijiaolin Stream (source: Soil and Water Conservation Bureau, Taiwan).
Figure 4.
On-site investigation map: (a) Upstream Renovation Project of Toubiankeng Stream in Zhongpu; and (b) Renovation Project of Sijiaolin Stream (source: Soil and Water Conservation Bureau, Taiwan).

Figure 5.
Interviewee consensus map (solid lines represent positive; dashed lines represent negative).
Figure 5.
Interviewee consensus map (solid lines represent positive; dashed lines represent negative).


Table 1.
CEM results of the “Upstream Renovation Project of Toubiankeng Stream in Zhongpu”.
| No. | Picture | Description of Top 3 Appearance | Preference (Full Score 5) | ||
|---|---|---|---|---|---|
| Element | Representation | Perception | |||
| 1 |  | check dam | form | relaxing | 3.15 |
| groundsill | arrangement | oppressive | |||
| embankment | stone | uneasy | |||
| 2 |  | embankment | form | relaxing | 3.64 |
| ecology | arrangement | pressure-relieving | |||
| groundsill | green | comfortable | |||
| 3 |  | embankment | stone | relaxing | 4.01 |
| ecology | form | pressure-relieving | |||
| stone | arrangement | comfortable | |||
| 4 |  | check dam | form | relaxing | 3.58 |
| groundsill | arrangement | pressure-relieving | |||
| stone | stone | oppressive | |||
| 5 |  | ecology | form | relaxing | 4.14 |
| embankment | arrangement | pressure-relieving | |||
| channel | color | comfortable | |||
| 6 |  | ecology | green | relaxing | 3.04 |
| channel | color | Oppressive | |||
| embankment | form | Uneasy | |||
| 7 |  | ecology | arrangement | relaxing | 3.90 |
| channel | form | pressure-relieving | |||
| embankment | color | comfortable | |||
| 8 |  | embankment | form | uneasy | 3.07 |
| ecology | arrangement | oppressive | |||
| channel | color | nervous | |||
| 9 |  | ecology | arrangement | relaxing | 3.76 |
| channel | form | pressure-relieving | |||
| embankment | color | comfortable | |||
| 10 |  | embankment | form | relaxing | 3.71 |
| stone | arrangement | pressure-relieving | |||
| ecology | color | comfortable | |||
| 11 |  | ecology | form | relaxing | 4.10 |
| groundsill | arrangement | pressure-relieving | |||
| channel | stone | comfortable | |||
Table 2.
CEM results of the “Renovation Project of Sijiaolin Stream.”.
| No. | Picture | Description of Top 3 Appearance | Preference (Full Score 5) | ||
|---|---|---|---|---|---|
| Element | Representation | Perception | |||
| 1 |  | ecological channel | form | relaxing | 3.59 |
| check dam | arrangement | pressure-relieving | |||
| embankment | stairs | comfortable | |||
| 2 |  | check dam | form | pressure-relieving | 3.08 |
| ecological channel | arrangement | oppressive | |||
| embankment | green | relaxing | |||
| 3 |  | check dam | form | relaxing | 3.77 |
| embankment | color | uneasy | |||
| groundsill | arrangement | nervous | |||
| 4 |  | groundsill | form | relaxing | 3.93 |
| ecological channel | arrangement | pressure-relieving | |||
| stone | stone | Pleasant | |||
| 5 |  | embankment | form | relaxing | 3.93 |
| ecological channel | arrangement | pressure-relieving | |||
| groundsill | tidy | pleasant | |||
| 6 |  | embankment | form | relaxing | 3.87 |
| groundsill | arrangement | pressure-relieving | |||
| ecological channel | wood | comfortable | |||
| 7 |  | embankment | arrangement | relaxing | 3.86 |
| ecological channel | form | pressure-relieving | |||
| stone | stone | pleasant | |||
| 8 |  | ecological channel | form | pressure-relieving | 4.10 |
| check dam | arrangement | relaxing | |||
| embankment | tidy | pleasant | |||
| 9 |  | embankment | form | relaxing | 3.92 |
| ecological channel | arrangement | pressure-relieving | |||
| stone | stone | pleasant | |||
| 10 |  | ecological channel | form | pleasant | 3.38 |
| embankment | green | relaxing | |||
| channel | color | uneasy | |||
| 11 |  | ecological channel | form | relaxing | 4.03 |
| groundsill | arrangement | pressure-relieving | |||
| embankment | stone | pleasant | |||
Table 3.
On-site investigation of the “Upstream Renovation Project of Toubiankeng Stream in Zhongpu”.
Table 3.
On-site investigation of the “Upstream Renovation Project of Toubiankeng Stream in Zhongpu”.
| Picture | On-Site Investigation Text |
|---|---|
 | This seems to be a semi-circle channel. The planning of guard rails is excellent and beautiful, and it would not be dangerous for fish and animals to drink water here. It feels good to extend the ecology. Look! Egrets are flying around. |
 | The river bed engineering also pays attention to safety. It seems to slow down the water velocity without special beautification. It would be prettier to tidy the stones on both sides. |
 | There is a boulder to prevent low water from washing aimlessly and to control the area. Their existence also alerts people that more such boulders could fly down without erosion control. Furthermore, there is no extra money or construction required for the design. So I think that it is a good design. |
 | The arrangement of stones seems to be a little messy, making it visually uncomfortable. In addition, the color is rather dull, without anything special; so I don’t like it very much. |
Table 4.
On-site investigation of the “Renovation Project of Sijiaolin Stream”.
| Picture | On-Site Investigation Text |
|---|---|
 | The feeling of flow is like getting into an original forest, and the stone stacking is original. There does not seem to be embankment burst or fish swimming. |
 | Here are water storage-type energy dissipation ladders. The design is good with the sense of design but not too much. The dark color selected is a bit like a leopard print. It is pretty good. |
 | Here is a multi-layer embankment. It does not look pretty, but it shows the convenience. It is designed for Reeves’s muntjac and for small animals to drink water. Although it is full of weeds, it is integrated with the background so that small animals, when drinking water, cannot be discovered by predators or humans. |
 | There is the chirping of cicadas among the trees in Dongshi. The green feeling is like a forest. There are not many visitors in the area to threaten the ecology or the environment. It is pretty comfortable to take a walk here listening to the cicadas chirping. The landscape is also suitable for holidays. |
Table 5.
Word cloud analysis of the “Upstream Renovation Project of Toubiankeng Stream in Zhongpu”.
| Word cloud of the Online Questionnaire—Representation | Word cloud of the Online Questionnaire—Perception |
 |  |
 |  |
| Word cloud of the On-Site Investigation—Representation | Word cloud of the On-Site Investigation—Perception |
 |  |
 |  |
Table 6.
Word cloud analysis of the “Renovation Project of Sijiaolin Stream”.
| Word cloud of the Online Questionnaire—Representation | Word cloud of Online Questionnaire—Perception |
 |  |
 |  |
| Word cloud of the On-Site Investigation—Representation | Word cloud of the On-Site Investigation—Perception |
 |  |
 |  |
Table 7.
Evaluation factors of element, representation, and perception.
| Evaluation Factor | Classification | Specific Description |
|---|---|---|
| element | natural facility | stream, river, animal, insect, plant |
| artificial facility | check dam, groundsill, embankment, biological channel | |
| representation | form | arc, concave, curve, meandering, size, rectangle |
| texture | stone, wood, plant, concrete | |
| arrangement | layer-by-layer as stairs, irregular, tidy, cross | |
| sound and action | flowing, still, flying around, birdcall, insect chirping | |
| perception | positive | cozy, comfortable, pretty, natural, friendly, practical, graceful, integrative, attractive, safe |
| negative | messy, destructive |
Table 8.
SBE results of the “Upstream Renovation Project of Toubiankeng Stream in Zhongpu.”.
| No. | Picture | SBE Value | Rank |
|---|---|---|---|
| 1 |  | −131.21 | 9 |
| 2 |  | −3.79 | 7 |
| 3 |  | 99.19 | 3 |
| 4 |  | −20.59 | 8 |
| 5 |  | 118.73 | 1 |
| 6 |  | −149.75 | 11 |
| 7 |  | 61.73 | 4 |
| 8 |  | −135.34 | 10 |
| 9 |  | 34.41 | 5 |
| 10 |  | 15.06 | 6 |
| 11 |  | 111.57 | 2 |
Table 9.
SBE results of the “Renovation Project of Sijiaolin Stream.”.
| No. | Picture | SBE Value | Rank |
|---|---|---|---|
| 1 |  | 45.39 | 5 |
| 2 |  | −51.15 | 9 |
| 3 |  | −219.1 | 11 |
| 4 |  | −5.63 | 8 |
| 5 |  | 51.29 | 4 |
| 6 |  | 23 | 7 |
| 7 |  | 29.61 | 6 |
| 8 |  | 113.93 | 1 |
| 9 |  | 66.85 | 3 |
| 10 |  | −137.39 | 10 |
| 11 |  | 83.2 | 2 |
Table 10.
CEM comparison of the highest and lowest SBE value images of the “Upstream Renovation Project of Toubiankeng Stream”.
Table 10.
CEM comparison of the highest and lowest SBE value images of the “Upstream Renovation Project of Toubiankeng Stream”.
| No. | Picture | Subject Response Text |
|---|---|---|
| 5 |  | The overall staircase shape and the integration with nature are relaxing. |
| The idea of the water drop structure is excellent, but more stacks would be fantastic. | ||
| 6 |  | Messy weeds in a biological channel is not beautiful. |
| Spreading vegetation is messy. |
Table 11.
CEM comparison of the highest and lowest SBE value images of the “Renovation Project of Sijiaolin Stream”.
Table 11.
CEM comparison of the highest and lowest SBE value images of the “Renovation Project of Sijiaolin Stream”.
| No. | Picture | Subject Response Text |
|---|---|---|
| 8 |  | This is a great design to slow down water power and velocity, and the aesthetics are excellent. |
| The light gray color looks comfortable, and the simple form is also comfortable. | ||
| 3 |  | The river is almost dry, which is worrying. It looks like it lacks vitality without water. |
| Lots of sediment deposits seem to be desolate, and there is no water or fish. |
Publisher’s Note: MDPI stays neutral with regard to jurisdictional claims in published maps and institutional affiliations. |
© 2022 by the authors. Licensee MDPI, Basel, Switzerland. This article is an open access article distributed under the terms and conditions of the Creative Commons Attribution (CC BY) license (https://creativecommons.org/licenses/by/4.0/).
Share and Cite
MDPI and ACS Style
Peng, S.-H.; Huang, C.-Y.; Chen, S.-C. Visual Language Translation Analysis and Scenic Beauty Estimation of Mountain Stream Facilities. Water 2022, 14, 3605. https://doi.org/10.3390/w14223605
AMA Style
Peng S-H, Huang C-Y, Chen S-C. Visual Language Translation Analysis and Scenic Beauty Estimation of Mountain Stream Facilities. Water. 2022; 14(22):3605. https://doi.org/10.3390/w14223605
Chicago/Turabian StylePeng, Szu-Hsien, Chun-Yu Huang, and Su-Chin Chen. 2022. "Visual Language Translation Analysis and Scenic Beauty Estimation of Mountain Stream Facilities" Water 14, no. 22: 3605. https://doi.org/10.3390/w14223605
Note that from the first issue of 2016, this journal uses article numbers instead of page numbers. See further details here.