
Degradation of Emerging Pollutants by Photocatalysis: Radiation Modeling and Kinetics in Packed-Bed Reactors


Instituto de Desarrollo Tecnológico para la Industria Química (Universidad Nacional del Litoral and Consejo Nacional de Investigaciones Científicas y Técnicas), Ruta Nacional 168, Predio CCT CONICET-Santa Fe, Santa Fe 3000, Argentina
*
Author to whom correspondence should be addressed.
Water 2022, 14(22), 3608; https://doi.org/10.3390/w14223608
Submission received: 1 October 2022
/
Revised: 4 November 2022
/
Accepted: 6 November 2022
/
Published: 9 November 2022
(This article belongs to the Special Issue Advanced Oxidation Processes for Emerging Contaminant Removal)
Abstract
:Radiation modeling and kinetics in two different packed-bed reactors filled with TiO2-coated glass rings are presented. The first reactor was cylindrical, irradiated from one end by a 150 W mercury lamp. It was employed to obtain the values of the intrinsic kinetic parameters of the degradation of the emerging contaminant clofibric acid (CA). The expression to represent the kinetics of the pollutant was derived from a proposed reaction scheme, and it includes explicitly the effect of photon absorption rate on the reaction rate. The second reactor was annular, irradiated internally and externally by 40 UV-LED lamps. The kinetic parameters calculated in the first reactor were directly employed to simulate the performance of the second one, without using any adjustable parameter. The Monte Carlo method was applied to solve the radiation models in both reactors. Good agreement was obtained between simulation results and experimental data under different operating conditions, with a percentage root-mean-square error of 4.6%. The kinetic parameters proved to be independent of the irradiation source, reactor geometry, and catalyst film thickness, and can be readily applied to design real scale devices.
Keywords:
photocatalysis; emerging contaminant; intrinsic kinetics; packed bed; UV-LEDs; Monte Carlo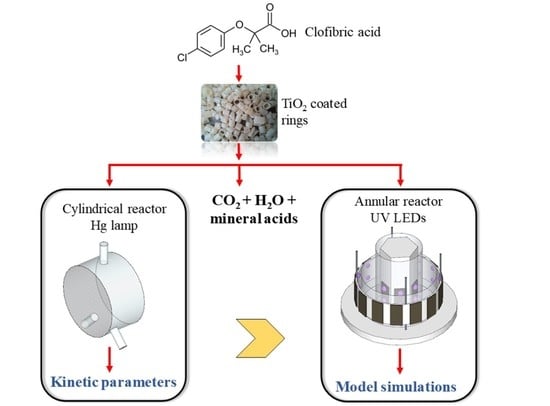
1. Introduction
Contaminants of emerging concern (CECs) are increasingly being detected at low levels in surface water, and there is widespread concern that these compounds may have a negative impact on aquatic life and human health. Generally, CECs are resistant to conventional biological treatment and current research is focused on the development of efficient methods to remove them from the environment. Heterogeneous photocatalysis has proven to be a useful technology to degrade this type of pollutant, including pharmaceuticals and personal care products [1,2,3]. The photocatalytic process starts when a semiconductor, usually titanium dioxide (TiO2), is irradiated with photons with adequate energy to excite electrons to the conduction band, creating the electron/hole pairs. These charge carriers can initiate oxidation/reduction reactions that degrade adsorbed contaminants and often convert them into harmless products such as carbon dioxide, water and inorganic acids.
Despite the large number of papers available in the literature about the fundamentals and phenomenological aspects of photocatalysis, real applications are still scarce. A possible explanation is the lack of systematic approach for reactor design and scaling-up. Most contributions in this area are based on empirical methodologies that involve the gradual increase in the photoreactor size, it being a time-consuming and expensive practice [4]. A more rational approach consists of the use of rigorous mathematical modeling, including the derivation of kinetic expressions, evaluation of the rate of photon absorption in the reactors, assessment of the effect of radiation absorption on the reaction rate, and resolution of mass balances of the chemical species involved. By following this approach, intrinsic kinetic parameters, i.e., independent of the experimental conditions, can be obtained [5,6,7]. This modeling methodology has been reported and verified for scaling-up slurry reactors [8,9], and reactors with the catalyst immobilized over the windows [10]. The use of suspended TiO2 is not recommended for large-scale reactors because it requires a catalyst recovery stage at the end of the treatment. Thus, the use of the catalyst immobilized onto a support represents a good choice in order to avoid the post-filtration step. Recently, Grcic et al. [11] determined intrinsic kinetic parameters for the photocatalytic oxidation of oxalic and formic acid in a slurry reactor. Then, these parameters were used to model the degradation of the carboxylic acids in a reactor with TiO2-chitosan films immobilized on glass plates. The six-flux absorption scattering model was used to model the radiation field in both reactors. Results showed that the kinetic parameters can be used to represent the photocatalytic degradation of both compounds using either suspended or immobilized photocatalyst. Although local values of photon absorption were calculated in the reactors, the reaction rate expressions include the average value (across the reactor volume in the slurry reactor, and over the photocatalyst surface in the immobilized reactor). Additionally, to simulate the pollutants degradation in the immobilized reactor, an additional parameter, the apparent film absorption coefficient, was adjusted.
It is worth mentioning that the selection and location of the radiation source are important features to design large-scale photocatalytic reactors [12]. UV light emitting diodes (LEDs) have received great attention in recent years, especially due to its eco-friendliness, long life time, energy efficiency, low cost and flexibility for integration within a photocatalytic reactor [13].
In this work, the modeling of the photocatalytic oxidation of a CEC in two packed-bed reactors filled with TiO2-coated glass rings is presented. Clofibric acid (CA), the active metabolite of many pharmaceuticals employed as blood lipid regulators, was the emerging pollutant chosen to validate the proposed methodology. The reactors have different geometry, size, configuration, and irradiation sources. A kinetic model that incorporates the effect of radiation absorption by the photocatalyst on the reaction rate was established. Kinetic parameters of the degradation of CA were first estimated in a simple, cylindrical reactor irradiated from one end by a mercury lamp. A 1-D radiation model was employed to calculate the photon absorption distribution. Then, the intrinsic nature of these parameters was verified by simulating the performance of an annular reactor with a more complex configuration and illuminated by UV LEDs. In this case, a 3-D radiation model was developed. The Monte Carlo method was applied to solve the radiation models in both reactors.
2. Employed Strategy
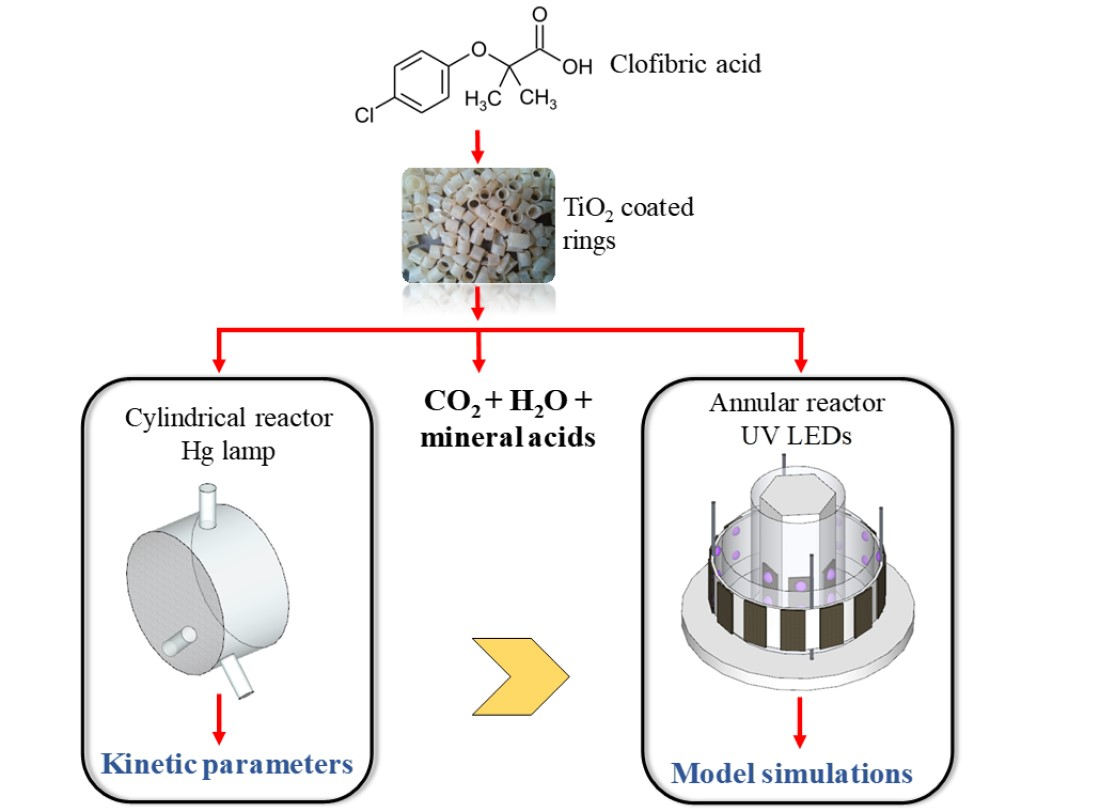
The aim of this work was to validate the use of intrinsic kinetic parameters and radiation models to predict the performance of packed-bed photocatalytic reactors. The employed strategy involved two stages, as summarized in Figure 1.
- 1-
- Intrinsic kinetic parameters were first obtained in a simple, cylindrical reactor (CR) irradiated from one end by a mercury lamp. To accomplish this, a kinetic model to represent the photocatalytic degradation of the pollutant CA was developed. The expression of the CA degradation rate includes the value of the local surface rate of photon absorption (LSRPA or ). Therefore, a 1-D radiation model was solved to obtain the LSRPA distribution inside the reactor. Then, the mass balance of CA was set in order to predict the evolution of the pollutant in the system. Finally, the values of the intrinsic kinetic parameters were obtained by applying an optimization algorithm to adjust model simulations to experimental data.
- 2-
- The second stage involved the use of the kinetic parameters found in the first reactor to predict the performance of the second one: an annular reactor (AR) illuminated by UV-LEDs. This task involved the resolution of the mass balance for CA, using the kinetic expression obtained in the CR, and the calculation of the LSRPA. Due to its particular configuration and illumination arrangement, a 3-D radiation model was developed to calculate the LSRPA in the AR. Finally, simulation results were compared with experimental data in order to validate the modeling procedure.
3. Experimental Devices
The packed-bed reactors employed in this study, which operate in batch recycling mode, were very different in shape, configuration and irradiation conditions (source type and distribution of the lamps). A description of the experimental devices is detailed below.
3.1. Reactors and Irradiation Sources
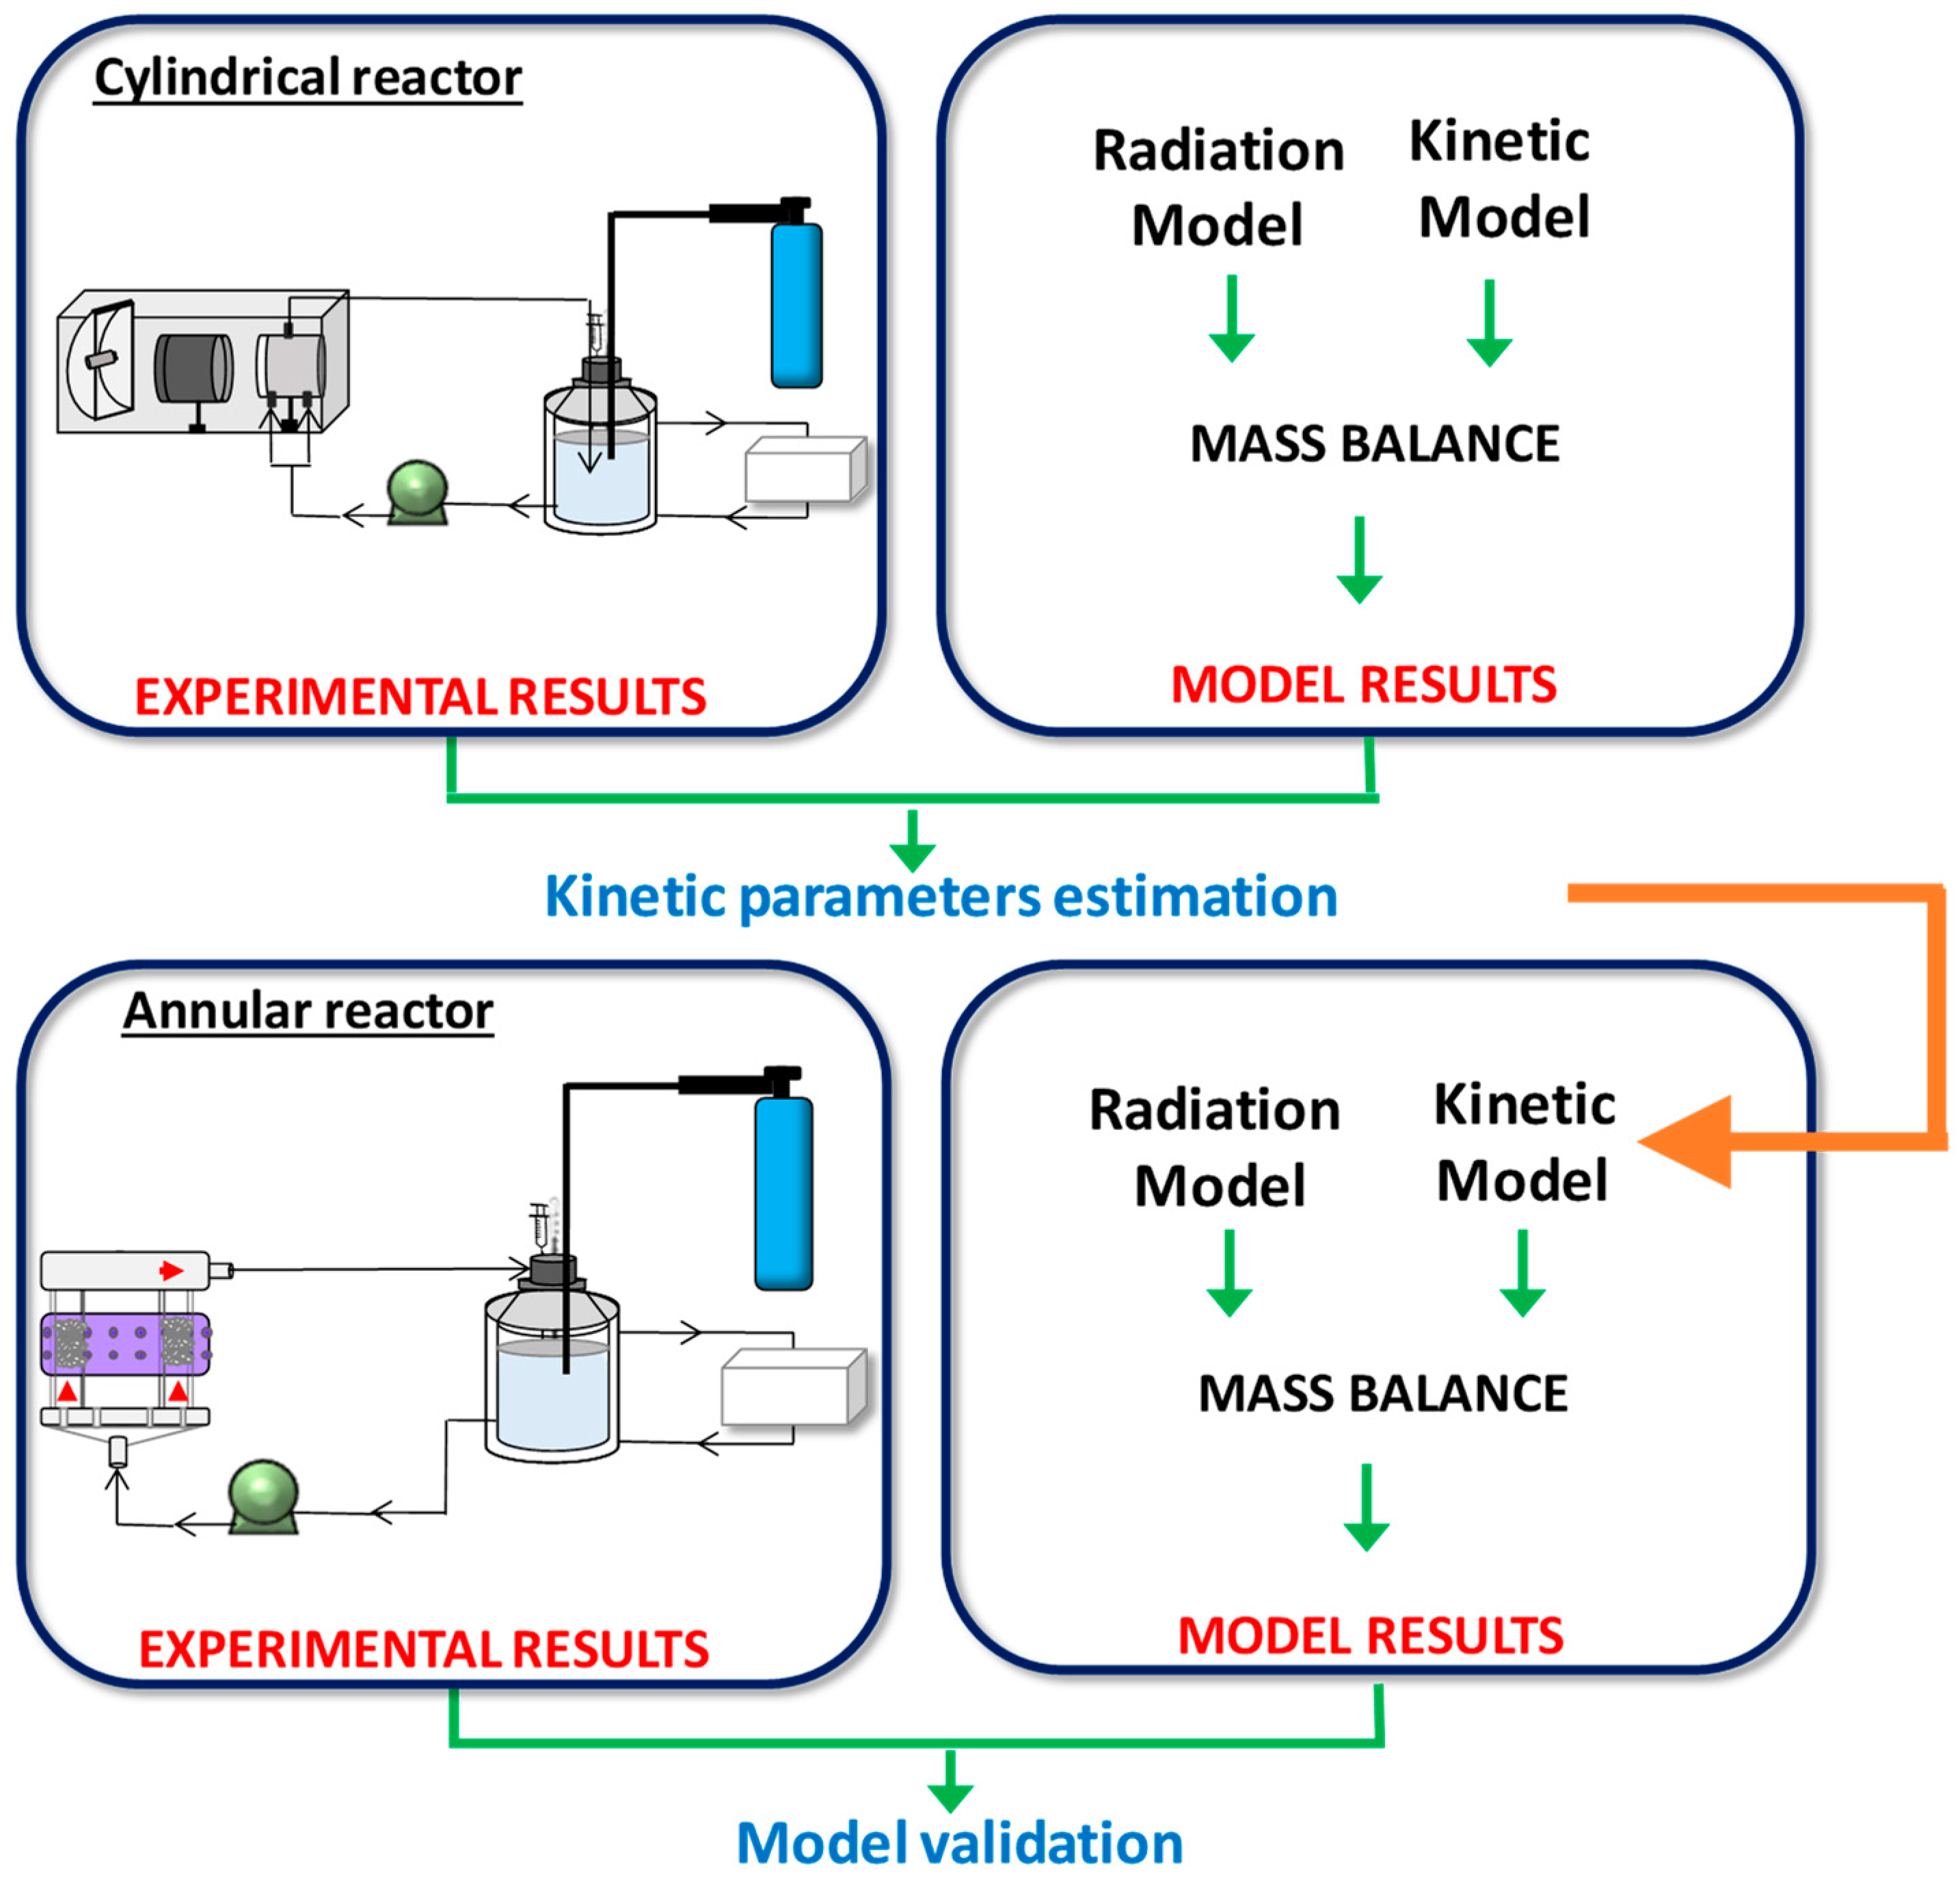
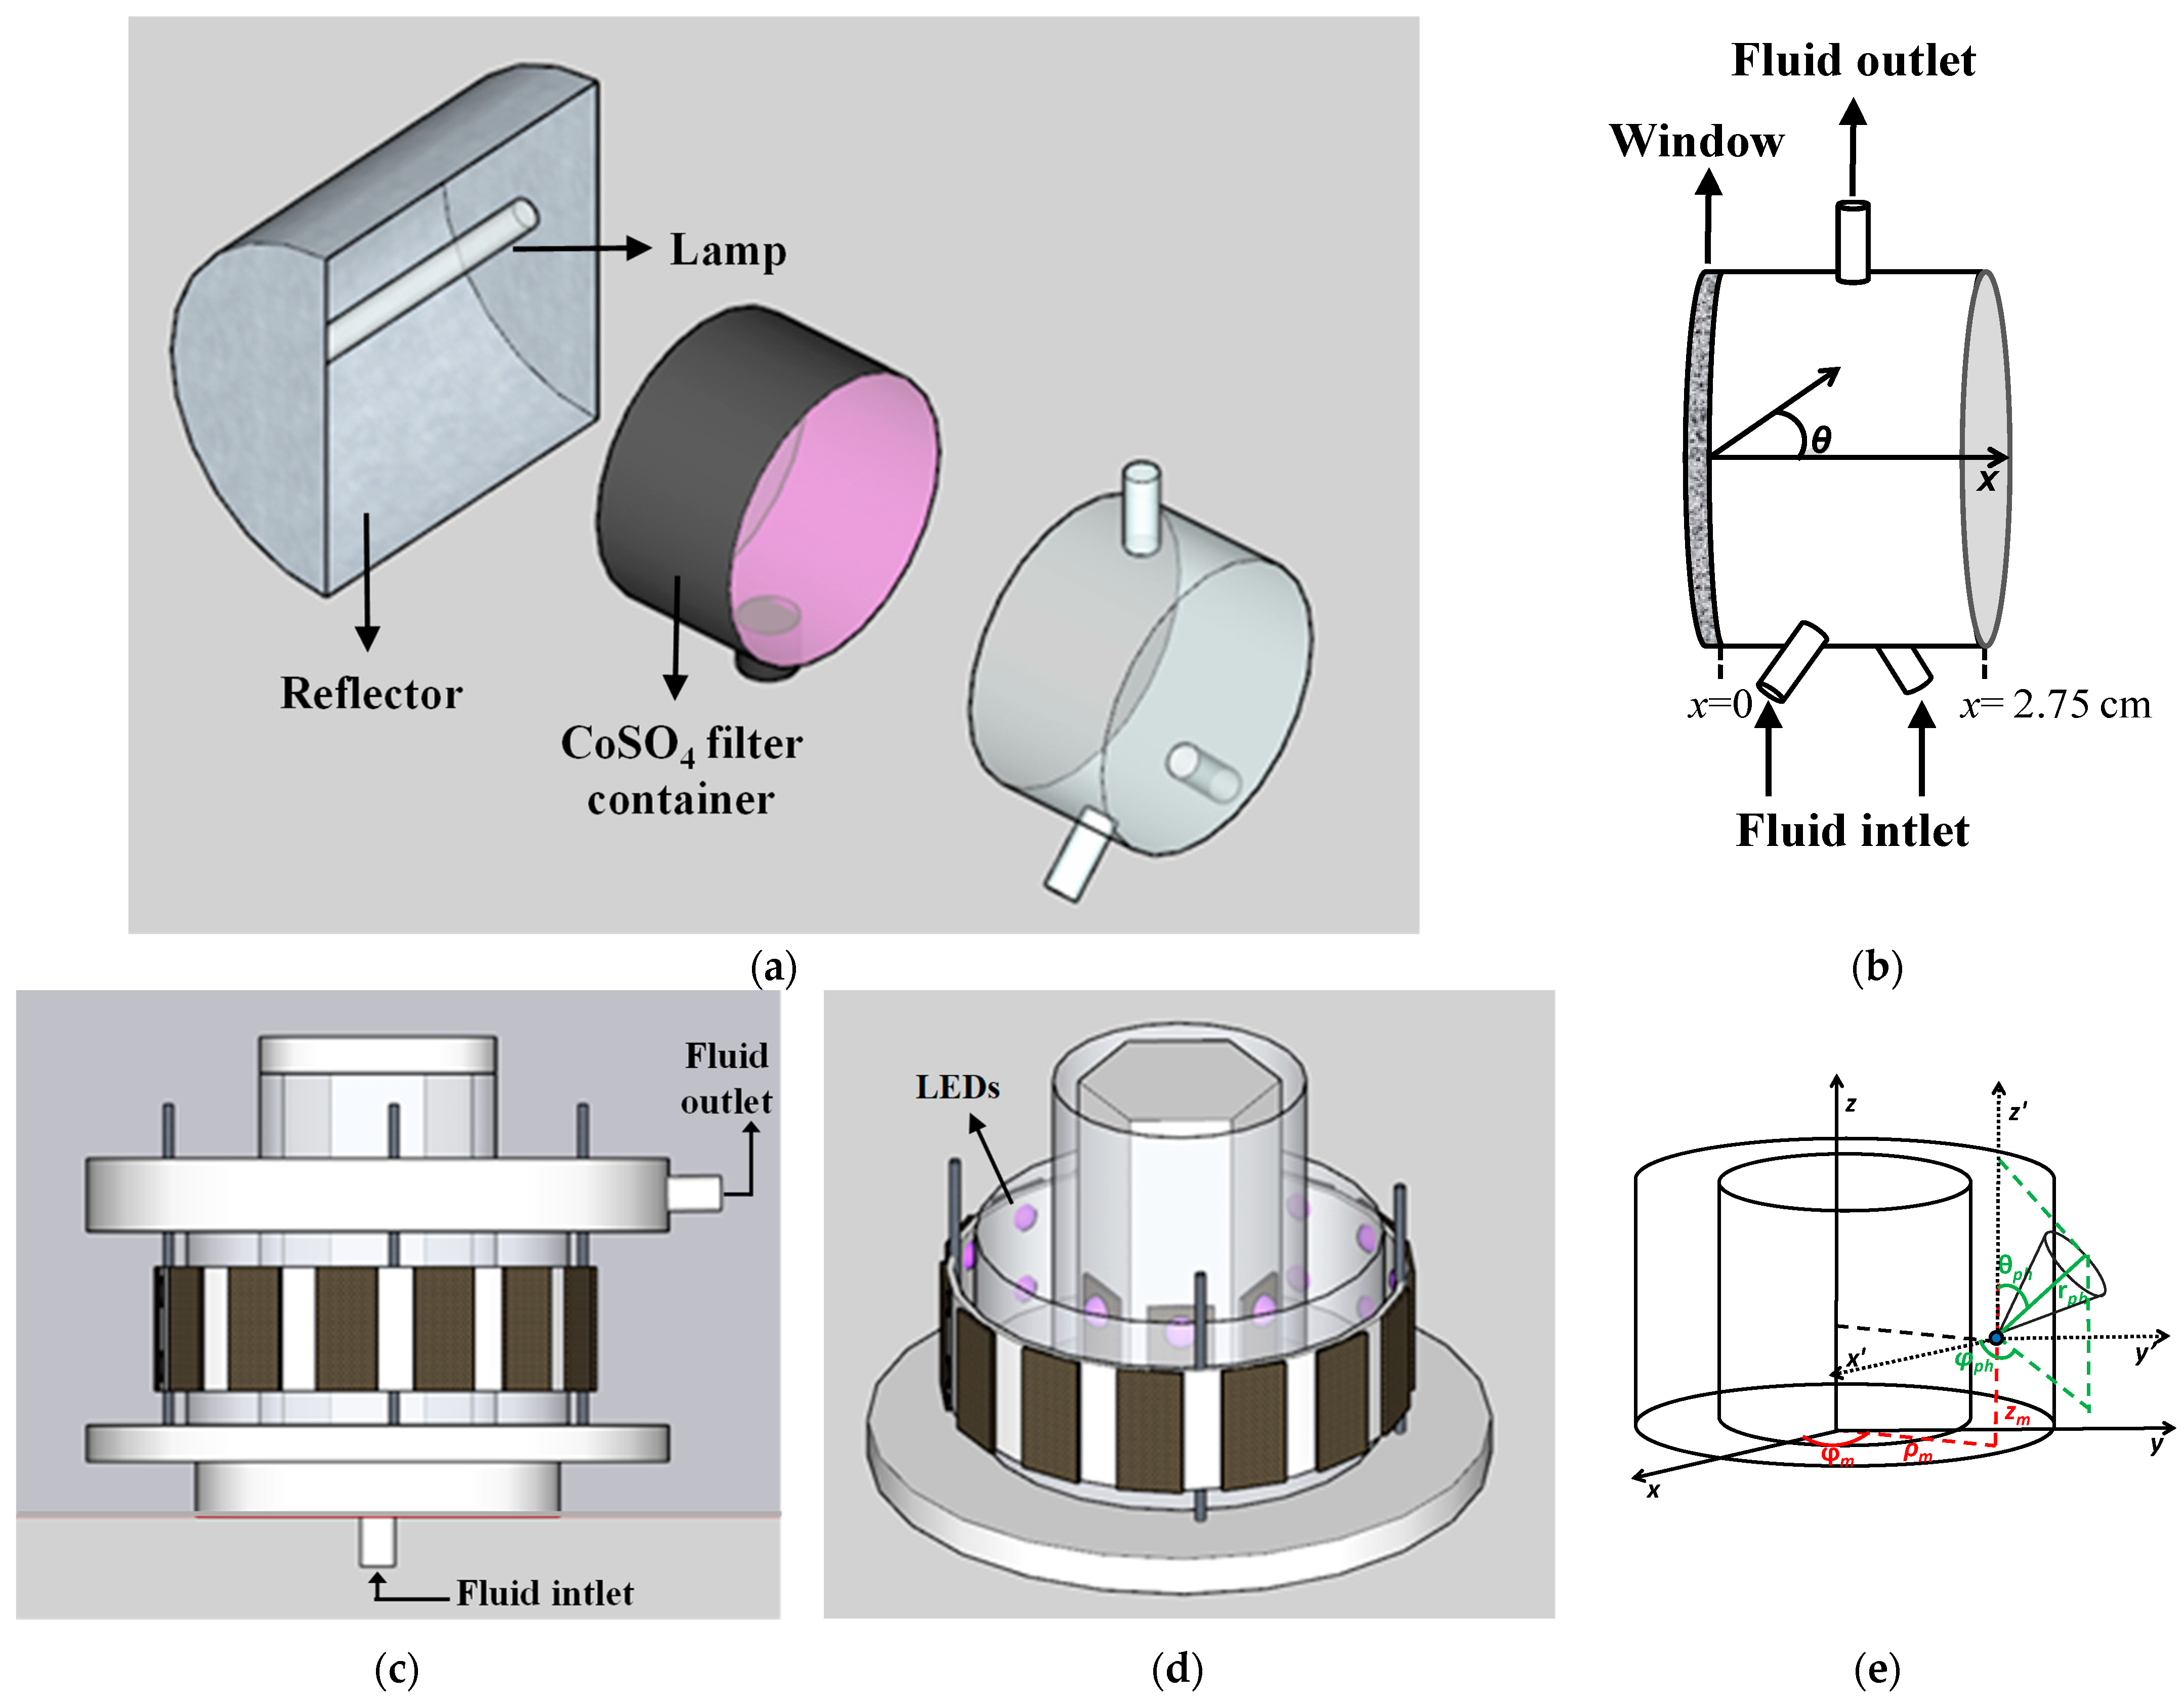
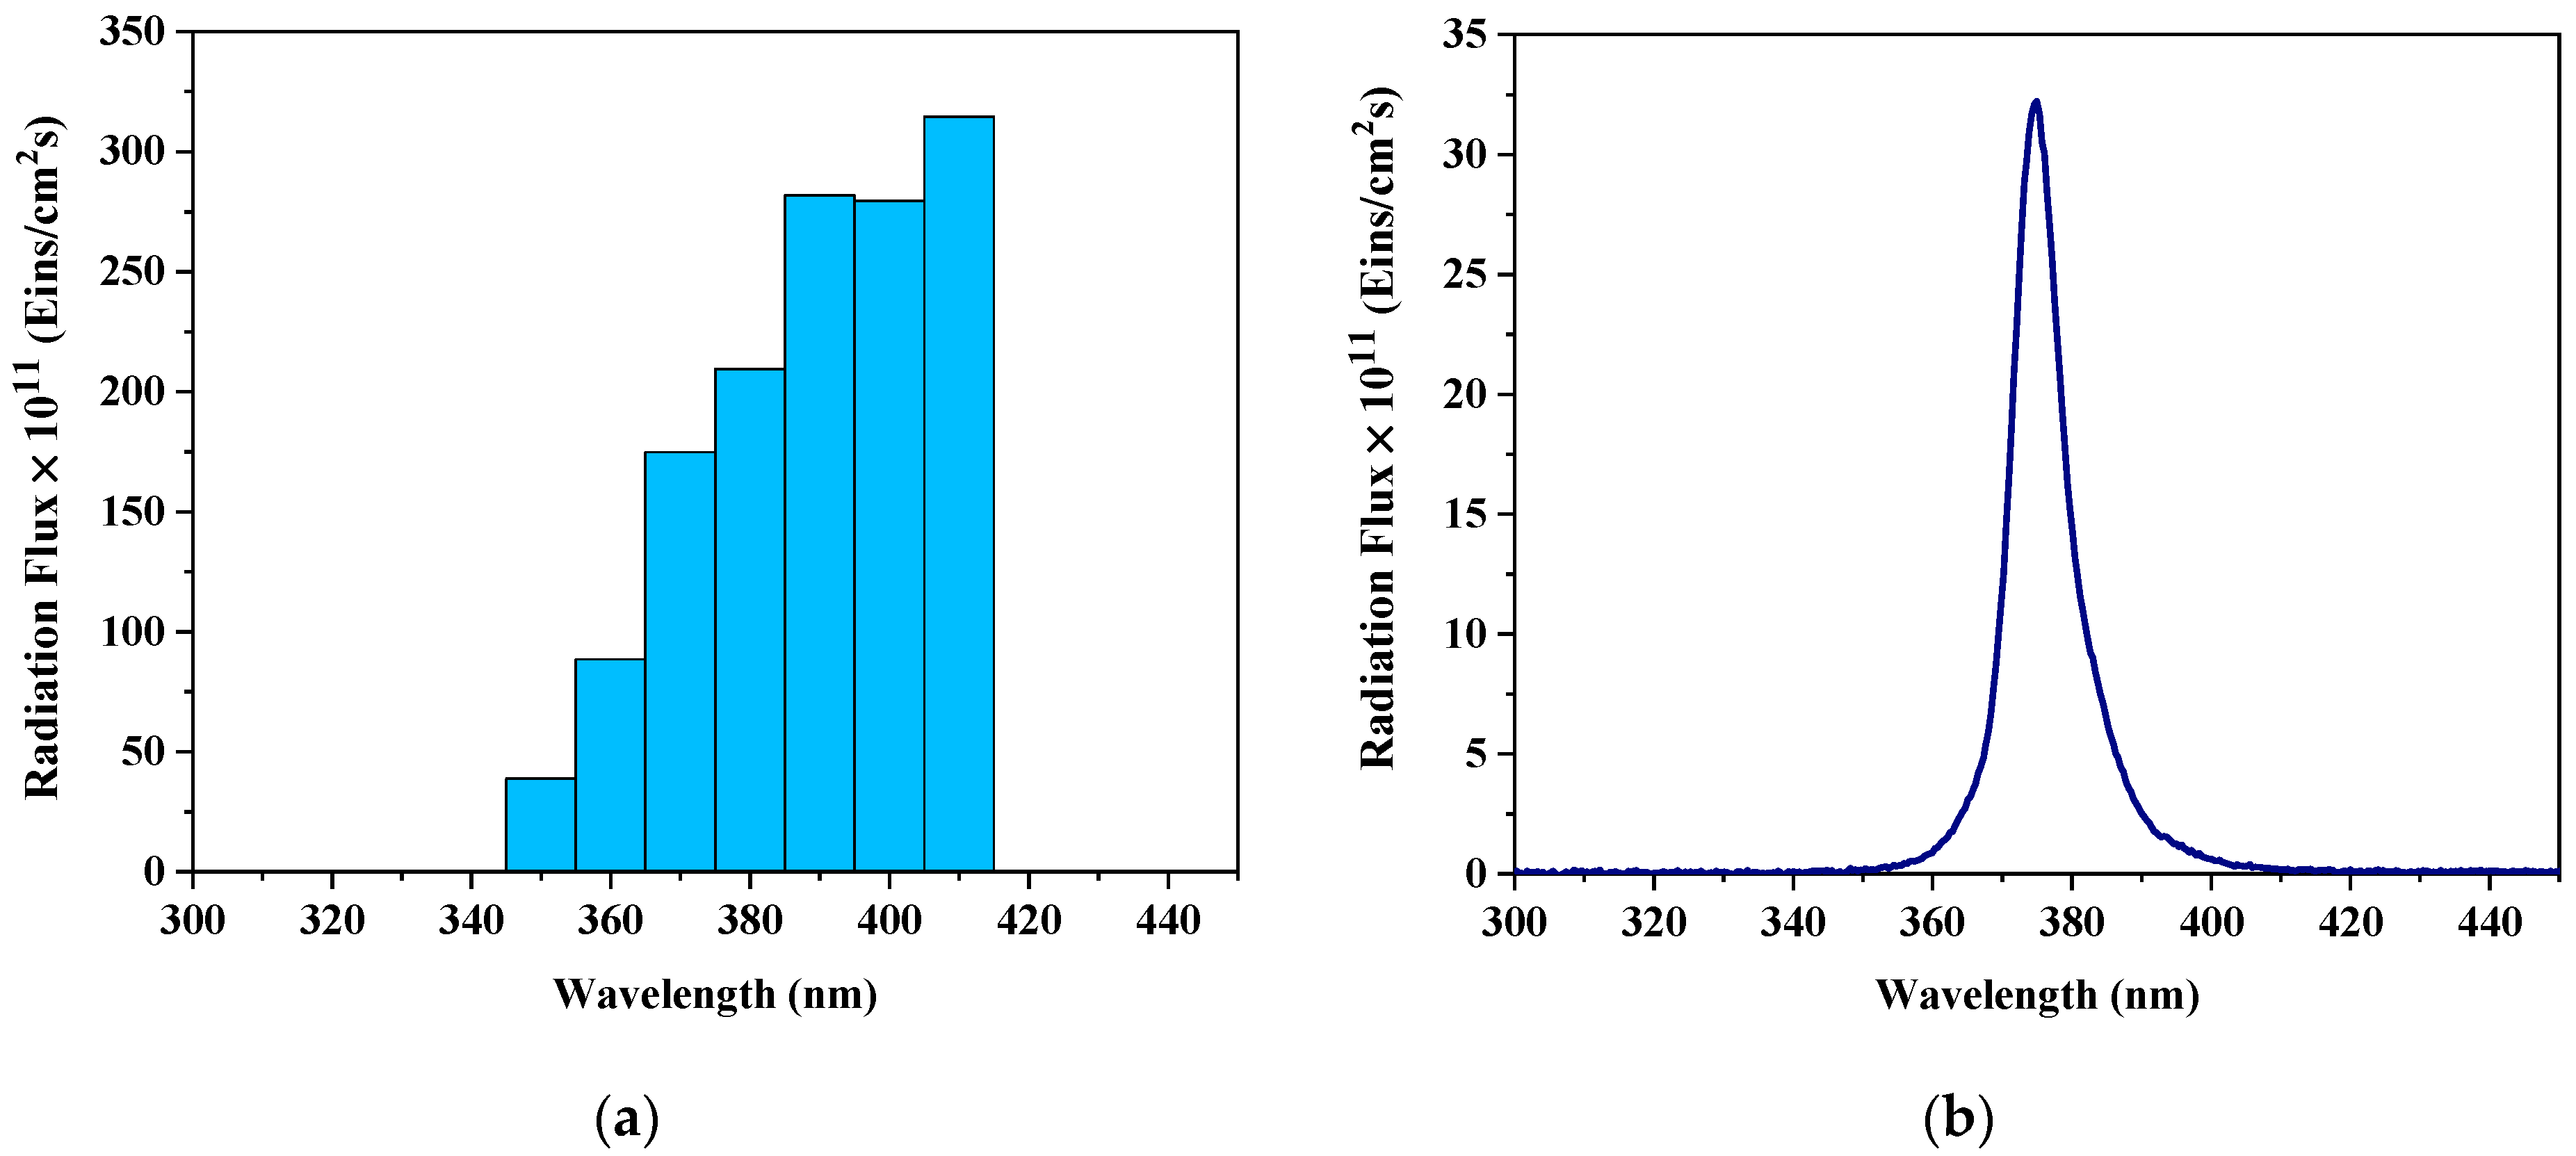
Cylindrical reactor: It consists of a glass tube, held horizontally, with two circular flat windows. It was irradiated from one side by one halogenated mercury lamp (Powerstar HQI-TS 150 W/NDL from OSRAM), placed at the focal axis of a parabolic reflector (Figure 2a). The illuminated window was made of Pyrex ground glass. The wavelength emission range of the lamp was 350–780 nm. To avoid visible radiation, a Pyrex glass container with a CoSO4 solution of 20 g/L was interposed between the lamp and the reactor window. The wavelengths of the resulting radiation that arrived at the reactor window were between 350 nm and 410 nm, as shown in Figure 3a. This reactor was filled with 310 Pyrex glass rings of 0.5 cm (diameter) × 0.5 cm (height), in random disposition, coated with TiO2. The liquid entered the reactor through two bottom ports and exited from a single port situated on top. The inlet ports were placed obliquely, creating a swirl-flow of the liquid inside the reactor that ensured well-mixing conditions.
Annular reactor: This reactor was made in Pyrex glass with two concentric tubes of different diameters, held vertically. It was irradiated with 40 UV-LEDs (Roithner XSL-375-TF-R2) located as two parallel strips around the external and the internal walls of the reactor. Each inner strip had 6 LEDs, and each external strip had 14 LEDs, as presented in Figure 2c,d. The maximum emission of the LED lamps was 365 nm (Figure 3b). The AR was filled with 900 Pyrex glass rings coated with TiO2, with the same dimensions and disposition as reported for the CR. The reactor inlet contains a perforated plate that acts as a distributor to ensure uniform distribution of the fluid in the packed bed.
The main characteristics of both reactors are summarized in Table 1.
3.2. Recycling Setup
Each reactor was part of a recycling system consisting of a peristaltic pump and a storage tank. Each tank was fitted with a sampling port and a gas inlet through which oxygen was constantly bubbled. Isothermal conditions (25 °C) were achieved by the incorporation of a water-circulating jacket to the storage tank. A recirculation flow rate of 1.5 L/min was used in both systems.
3.3. Catalyst Immobilization
Bare Pyrex glass rings were dipped into a suspension of 150 g/L of TiO2 Aeroxide P25 and extracted with a withdrawal velocity of 3 cm/min [16]. Then, they were dried at 110 °C for 24 h and calcined at 500 °C for 2 h with a heating rate of 5 °C/min. This procedure was repeated to obtain rings with different thicknesses of the TiO2 film. The thickness of the resulting films () was estimated from SEM images with a scanning electron microscope (JEOL, JSM-35C). The phase composition of the photocatalyst after calcination was evaluated by X-ray diffraction with a Shimadzu XD-D1 diffractometer with Cu-Kα radiation. The results showed that the catalyst contains 82% anatase and 18% rutile.
4. Experimental Assays
Experiments of CA degradation in the photocatalytic reactors were carried out at different values of initial pollutant concentration, TiO2 film thickness, and irradiation level, as reported in Table 2.
In the CR, different levels of incident radiation were obtained by locating optical neutral filters at the external side of the reactor window. These filters attenuated the incident radiation without altering the spectral distribution of the lamp (100%: no filter; 62%: low optical density filter; 30%: high optical density filter). In the AR, different irradiation levels were obtained by switching on the external lamps only, the internal lamps only, and both (total illumination condition). The incident photon flux at the reactor windows () under each condition, in both reactors, was determined by ferrioxalate actinometry [17].
All the experiments were carried out following the same procedure. CA solutions were prepared by dissolving the required mass of CA in ultrapure water. The initial pH of the solutions was 5. Prior to each run, the reactor was filled up with the coated rings, and the CA solution was placed in the storage tank and circulated in the system for 30 min under dark conditions. During this time, the solution was saturated with pure oxygen. In the case of the CR, the Hg lamp was warmed up 30 min before the beginning of the experiment. Samples were collected from the tank at time intervals of 1 h during 6 h. Then, they were filtered through syringe filters (Anotop 25) and CA was quantified by HPLC with UV detection [18]. The analyses were carried out in a Waters chromatograph with a RP C-18 column (XTerra®). The mobile phase was a binary mixture of acidified water (with 0.1 % v/v phosphoric acid) and acetonitrile (50:50). The flow rate was 1.0 mL/min and the injection volume was 20 μL. Absorbance detection was made at 227 nm.
5. Reactor Modeling
5.1. Mass Balance
The theoretical evolution of the concentration of the pollutant CA in a batch system with recycle can be obtained by solving the mass balance of the referred chemical compound. Assuming that the conversion per pass in the reactor is differential; the system is well-mixed; mass transfer limitations are negligible; direct photolysis is insignificant; and chemical reactions occur only at the solid–liquid interface among adsorbed molecules, the mass balance expression for CA and the initial condition in the reacting system can be written as
where is the molar concentration of CA (mol/cm3), t refers to the reaction time (s), VT is the total volume of the solution in the system (cm3), x represents the position vector, and represents the surface degradation rate of CA averaged over the catalytic area, (cm2).
The assumptions mentioned above and the resulting mass balance expression are valid for both systems. Calculations supporting the assumption of negligible mass transfer limitations are presented as Supplementary Material.
5.2. Kinetic Model
The expression of the reaction rate was mechanistically derived from a kinetic scheme summarized in Table 3. It involves the activation of TiO2 upon UV irradiation with the formation of electron/hole pairs, electron and hole trapping, and the attack of CA molecules by hydroxyl radicals [19,20]. This mechanism leads to the formation of organic intermediates species which, in turn, can be mineralized by further oxidation.
The kinetic model also assumes that photocatalytic reactions occur at the surface of the catalyst particles among adsorbed molecules [21]; dynamic equilibrium is achieved between the bulk and the adsorbed concentrations of H2O, O2, inorganic species and organic compounds [22,23]; molecular oxygen and organic compounds are adsorbed on different sites of the catalyst [24,25]; there is a competitive adsorption mechanism between CA and its main reaction intermediates; O2 concentration is constant and in excess with respect to the stoichiometric demand; and the concentration of water molecules, hydroxyl ions, and total adsorption sites for CA on the catalytic surface remains constant [26]. The resulting local reaction rate expression for CA degradation is
where and are intrinsic kinetic parameters, and is the local surface rate of photon absorption (LSRPA), that is, the amount of photons absorbed per unit time and per unit area of TiO2-coated surface. As irradiation is constant throughout the experiments, and we assume that the optical properties of the TiO2 films do not vary during the reaction time, is considered to be independent of time. A detailed derivation of Equation (2) can be found in [27].
Finally, by introducing the reaction rate expression into Equation (1), the mass balance for CA can be written as follows:
From the resolution of Equation (3), the evolution of CA concentration under different experimental conditions can be predicted.
It is important to highlight that the LSRPA is explicitly included in the reaction rate expression. The dependence of the reaction rate on the photon absorption rate can take two limiting forms: linear, at high levels of irradiation, and square root, at low levels of irradiation. In many cases, the radiation field in photocatalytic reactors present high non-uniformities. These situations originate different dependence orders to co-exist in the same reactor, making it inadequate to employ an averaged value of LSRPA with a single exponent in the mass balance. In such cases, the complete radiation expression should be employed [28].
5.3. Local Surface Rate of Photon Absorption (LSRPA)
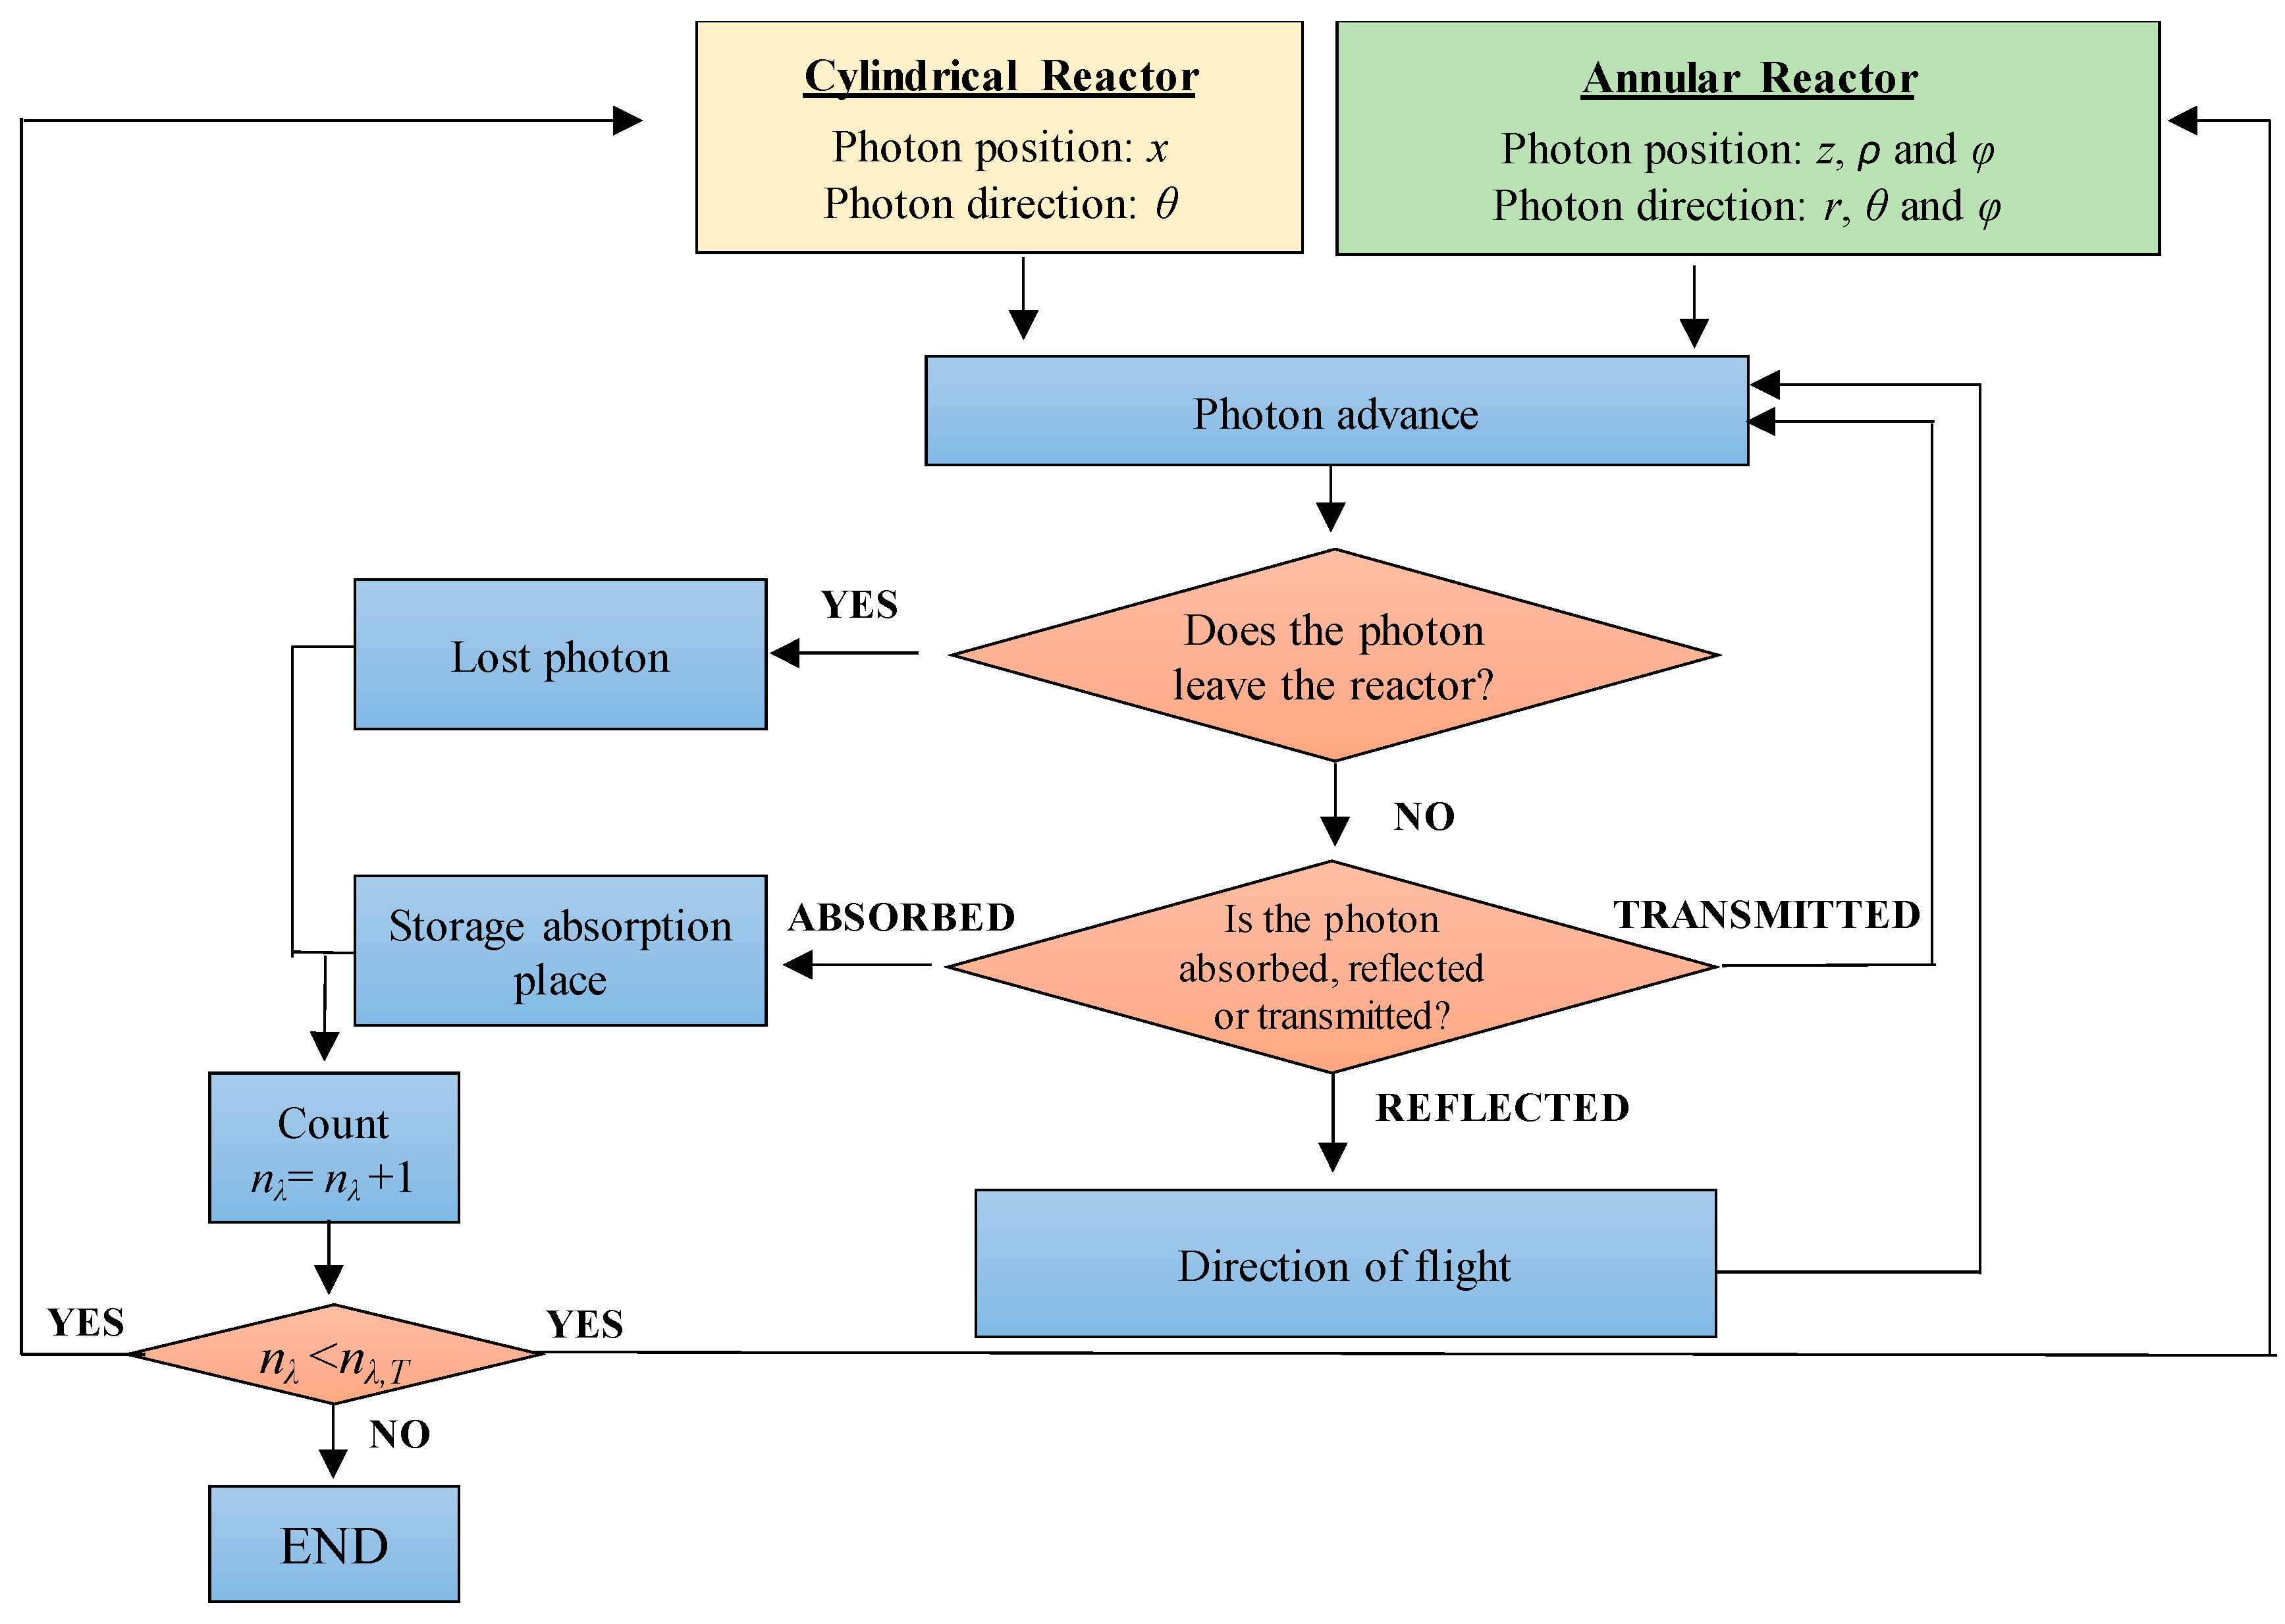
The evaluation of the CA reaction rate requires the estimation of the absorbed photons distribution inside the reactors. In the present study, the Monte Carlo method was applied to obtain the LSRPA. This method consists of tracking a significant amount of photons emitted by the light source, which interact with the elements of the packed-bed and the reactor walls or windows, until they are absorbed or scattered out. The reactor bed volume is discretized into spatial cells, and when photons are absorbed, the location of this event is recorded. Then, it is possible to establish the distribution of the LSRPA inside the reactor. The direction, length of the trajectory, and fate of the photons are determined by random numbers between 0 and 1. Briefly, the proposed model assumes that emitted photons travel along rectilinear trajectory until they reach the reactor walls or a TiO2-coated ring. The photons that reach a ring can be absorbed, transmitted or reflected. If they are absorbed in the TiO2 film, its position is stored in the corresponding spatial cell, the trajectory ends, and the tracking of a new photon starts. If the photons are reflected, the new direction is determined by considering specular reflection. If the photons are transmitted, they may interact with other rings until they are absorbed or they reach the reactor walls. Finally, the LSRPA in each cell of the reactor was calculated according to:
where is the radiation flux of wavelength λ incident at the reactor window, represents the irradiated area of the reactor windows, represents the number of photons of wavelength λ absorbed in a cell of position x, is the total number of the photons considered in the simulation for each wavelength interval (107 photons), and is the volume of the cell. This procedure, schematized in Figure 4, was followed in both reactors to obtain the LSRPA. However, due to the particular configuration and radiation source of each reactor, different coordinate systems and dimensions were considered to develop each model, as summarized in Table 4.
In the CR, due to the configuration of the reactor and lamp (reflector and lamp arrangement, reactor ground window, and reactor dimensions), the radiation extinction inside the photocatalytic bed occurs mainly along the longitudinal axis of the reactor, and the incoming radiation can be considered diffuse with azimuthal symmetry. Therefore, a one-dimensional radiation model with the Cartesian coordinate x was employed to assess the location of photons inside the reactor, and the polar coordinate θ was used to determine the direction of the photons (Figure 2b). In the AR, due to the particular arrangement of the LED lamps and the reactor shape, a three-dimensional radiation model was required to evaluate the LSRPA. A cylindrical coordinate system (, and ) was used to define the position of the emitting LED and the location of photons with respect to the reactor, and a spherical coordinate system (, and ) was employed to indicate the direction of propagation of a given photon (Figure 2e).
6. Results and Discussion
6.1. LSRPA Distribution
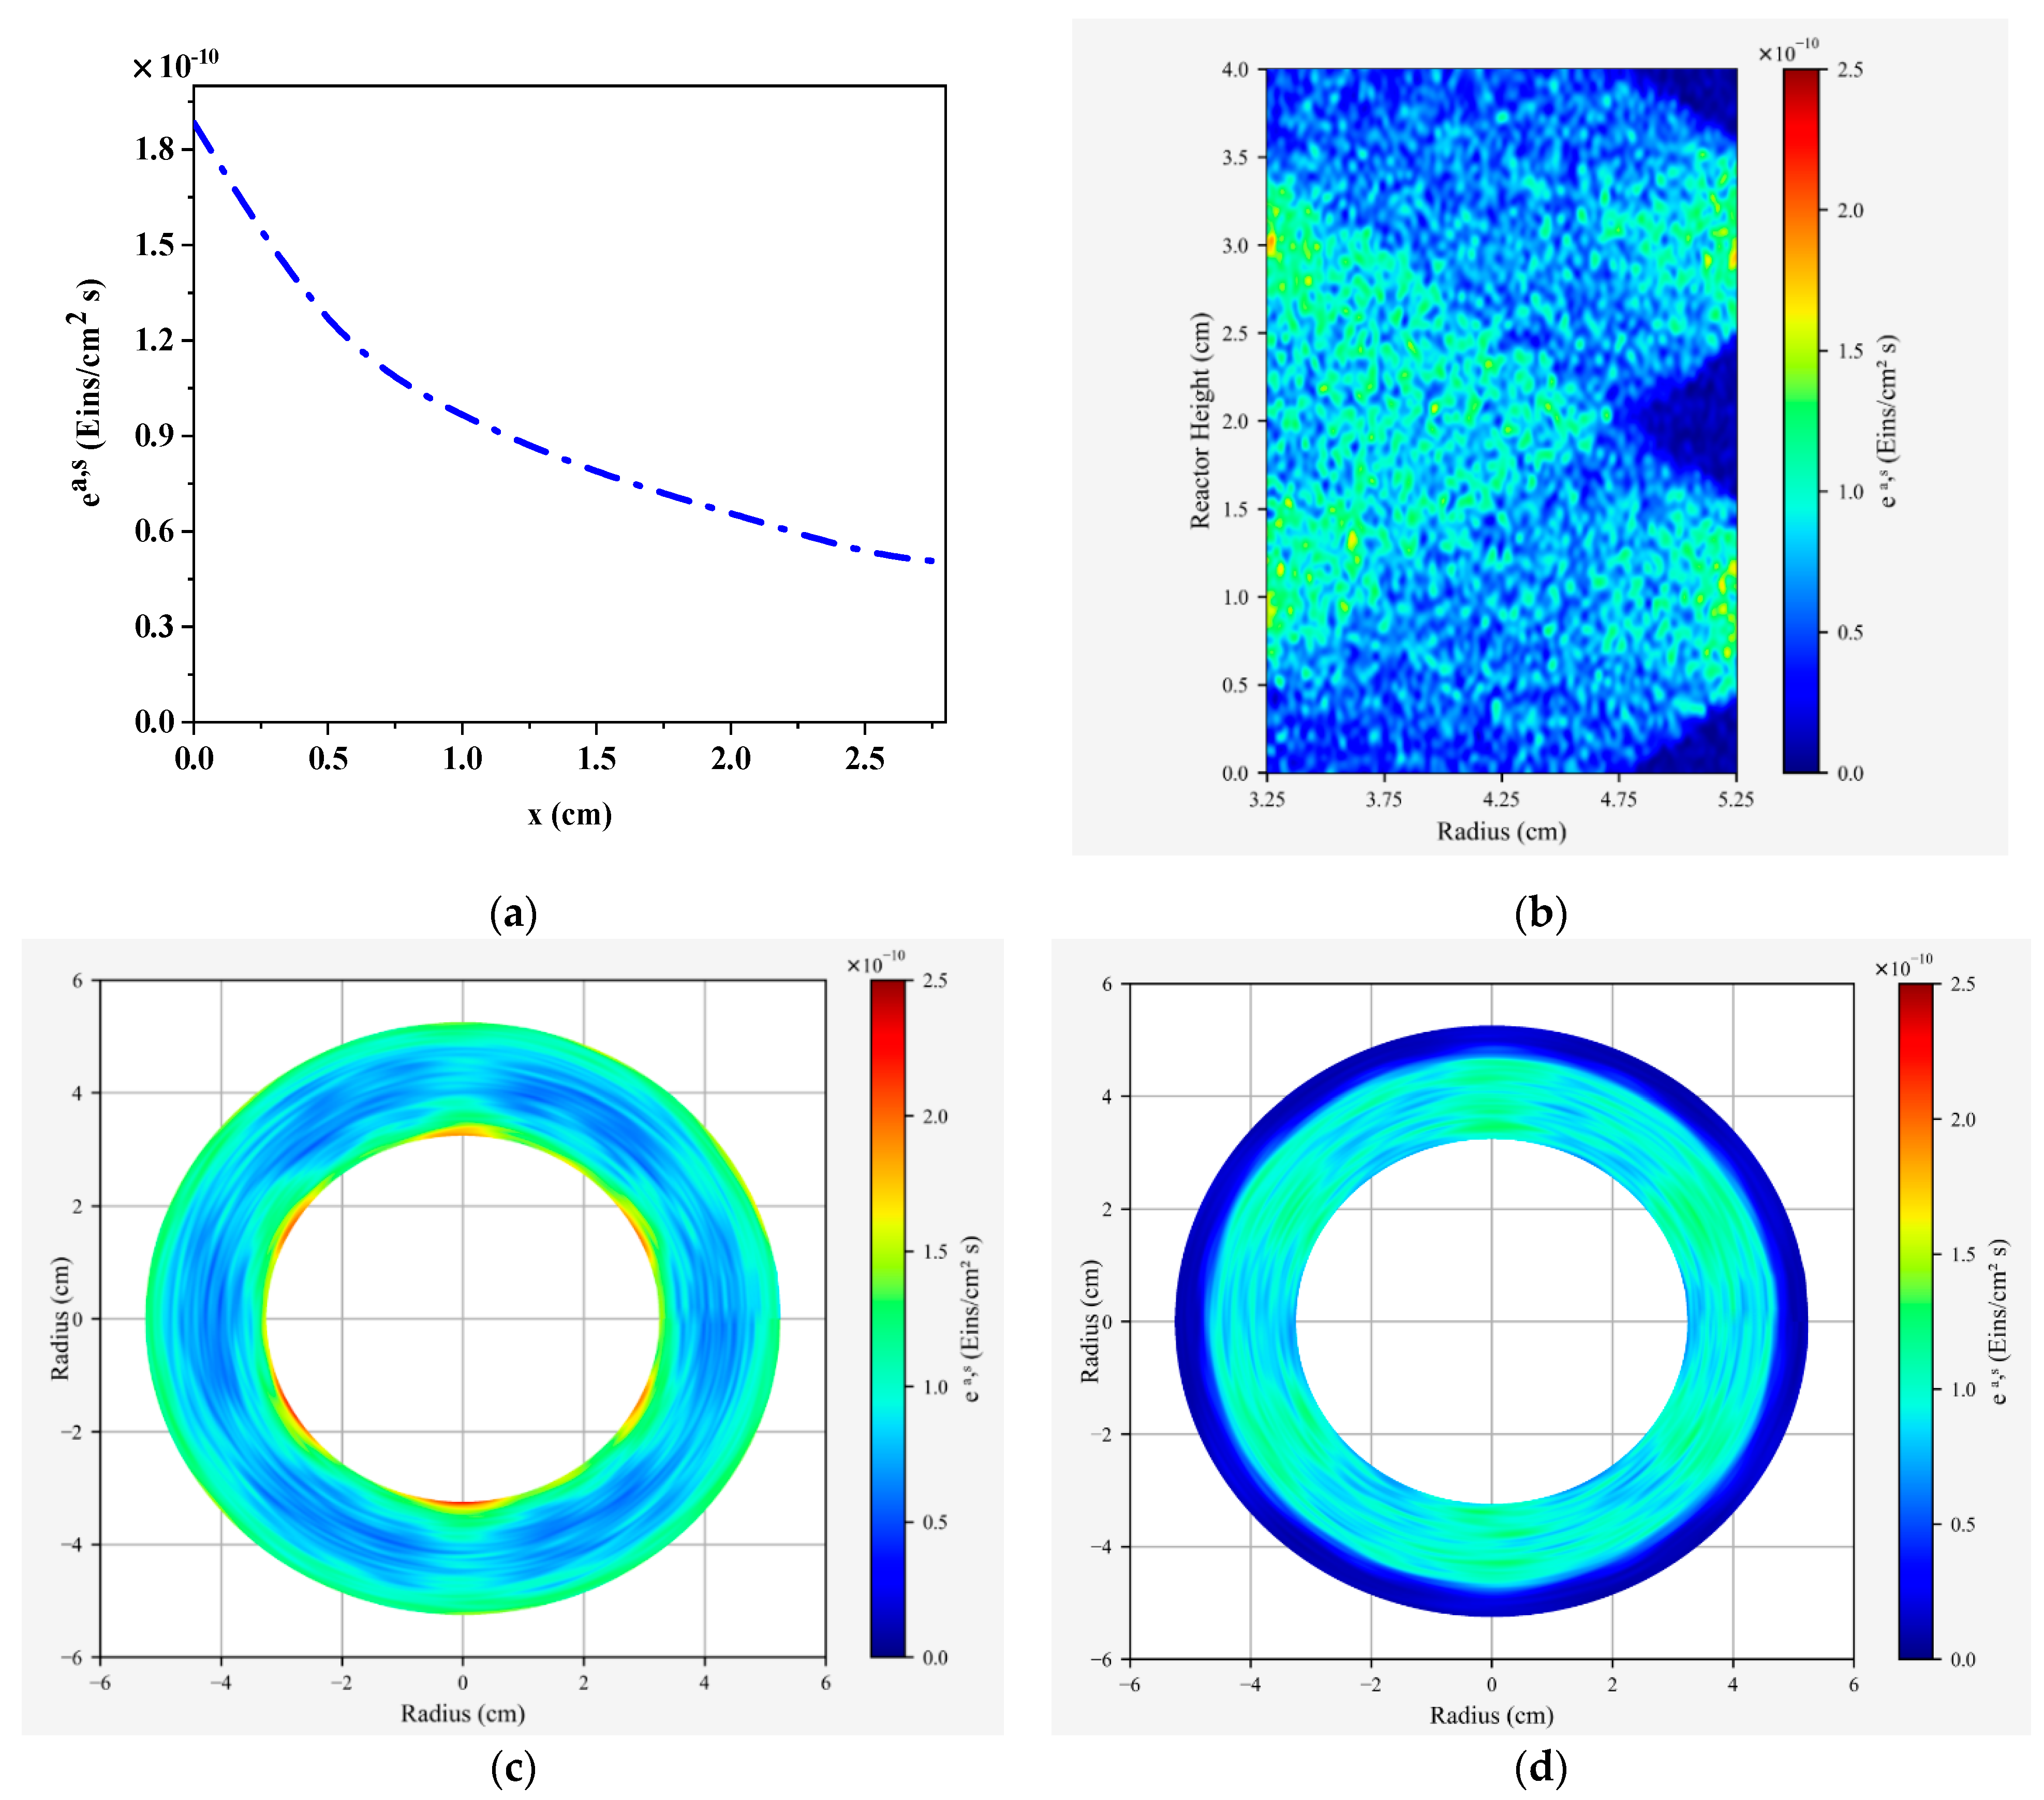
The most critical aspect in the proposed methodology is the evaluation of the absorbed radiation inside the reactors. Figure 5 shows the distribution of the LSRPA inside the packed beds of the CR and AR.
Figure 5a depicts the LSRPA in the CR under 100% irradiation (no filter) and = 0.27 µm. Maximum values are achieved near the irradiated window, and radiation absorption decreases along the longitudinal axis of the reactor. Nevertheless, the decrease is smooth and radiation absorption at the opposite side of the illuminated window is still significant (1/3 of the maximum value). Figure 5b–d present the distribution of the absorbed radiation in the AR under total illumination and = 0.27 µm. Figure 5b shows the LSRPA profile at the reactor vertical cross section corresponding to the azimuthal angle = 0°. LED strips were located at the reactor height z = 1 cm and z = 3 cm, as verified by the high values of LSRPA near these regions. The simulation also reveals that there are dark zones near the external window, at z = 2 cm, and at the bottom and top of the reactor (z = 0 cm and z = 4 cm). They are “blind” regions that are not illuminated by the external LEDs, and radiation from internal LEDs has already been extinguished. This is a usual problem when using LED lamps as an irradiation source because their viewing angle is generally narrow and it can cause high non-uniformities in the radiation distribution inside photoreactors. This effect is less evident at the internal window because external LEDs are more numerous (14 per external strip vs. 6 per internal strip) and the area of the internal window is smaller. Therefore, radiation from external LEDs sum up and reach the opposite side. Figure 5c depicts the LSRPA profile at the horizontal cross section of the reactor corresponding to z = 1 cm, where maximum values of LSRPA are reached near the irradiated windows. The positions of the LEDs are clearly individualized, mainly in the case of internal LEDs because they are located at 0.3 cm from the reactor internal window whereas external LEDs are located farther away from the external window, at 0.6 cm. In Figure 5d, photon absorption distribution at the horizontal cross section corresponding to z = 2 cm (reactor height between the LEDs strips) is presented. The blind zone mentioned above, close to the external window, is evidenced.
6.2. Kinetic Simulations
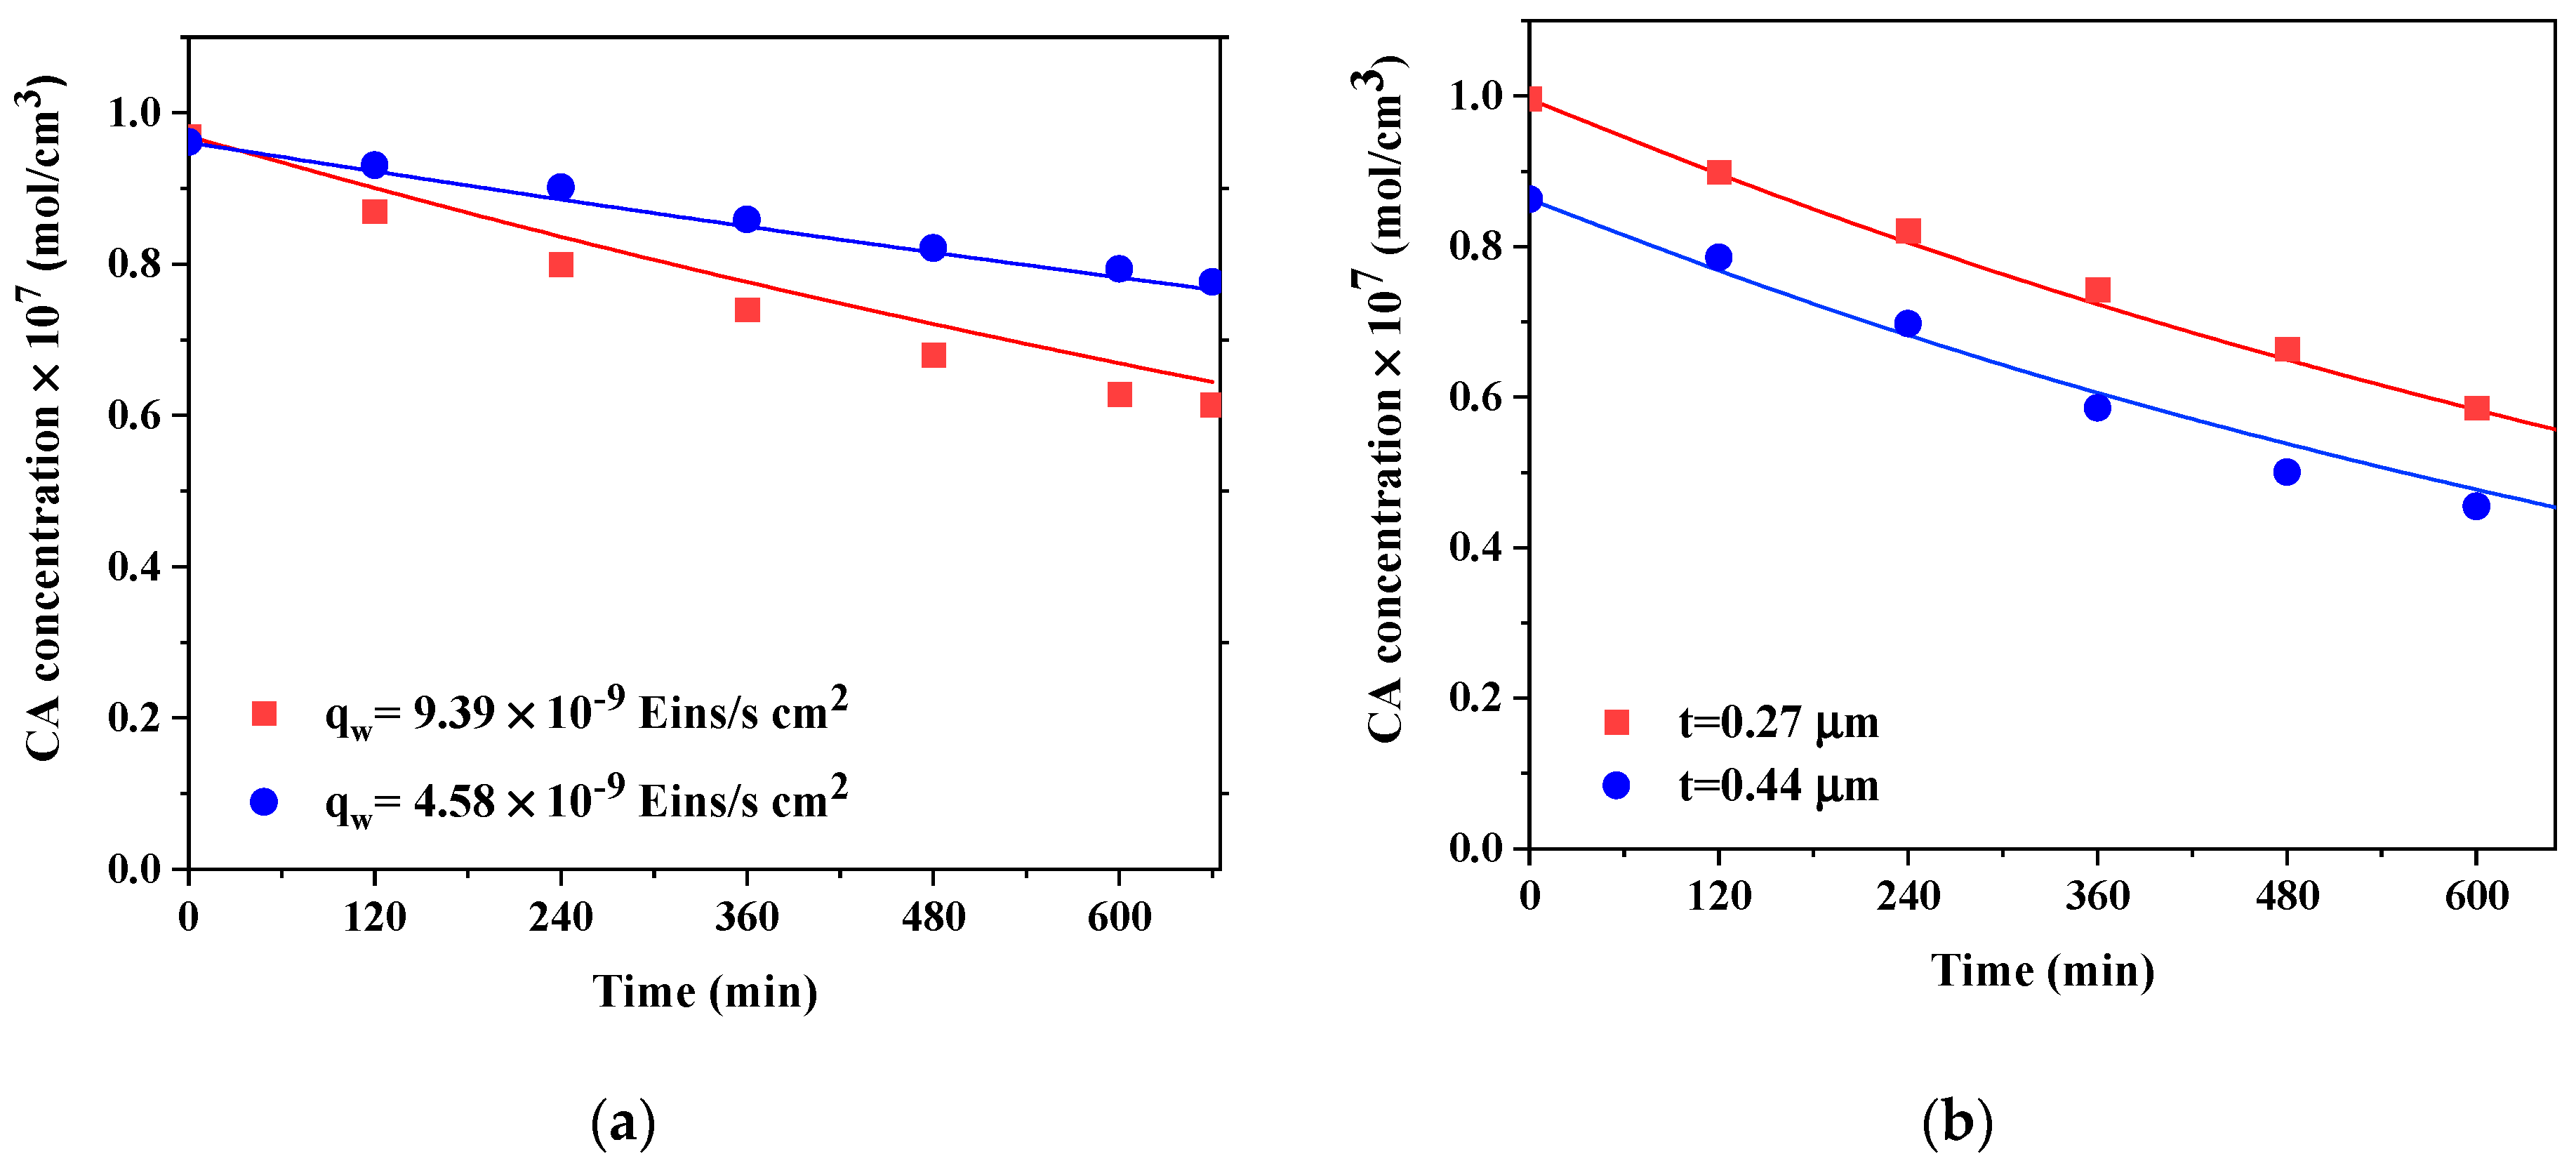
The estimation of the kinetic parameters involved in Equation (3) was carried out employing CA concentration information from degradation experiments in the CR and the corresponding LSRPA values. A Levenverg–Marquardt optimization method was applied, which minimizes the differences between the estimated values of CA concentration and experimental data. The differential mass balance equation was solved employing a fourth-order Runge–Kutta method. The values of the kinetic parameters obtained, with the corresponding 95% confidence intervals, were: α1 = (2.95 ± 0.31) × 1010 cm2 s/Einstein, and α2 = (3.24 ± 0.11) × 10−5 cm/s. As shown in Figure 6, these parameters were able to simulate with good accuracy the evolution of CA concentration under different irradiation conditions and film thicknesses in the CR.
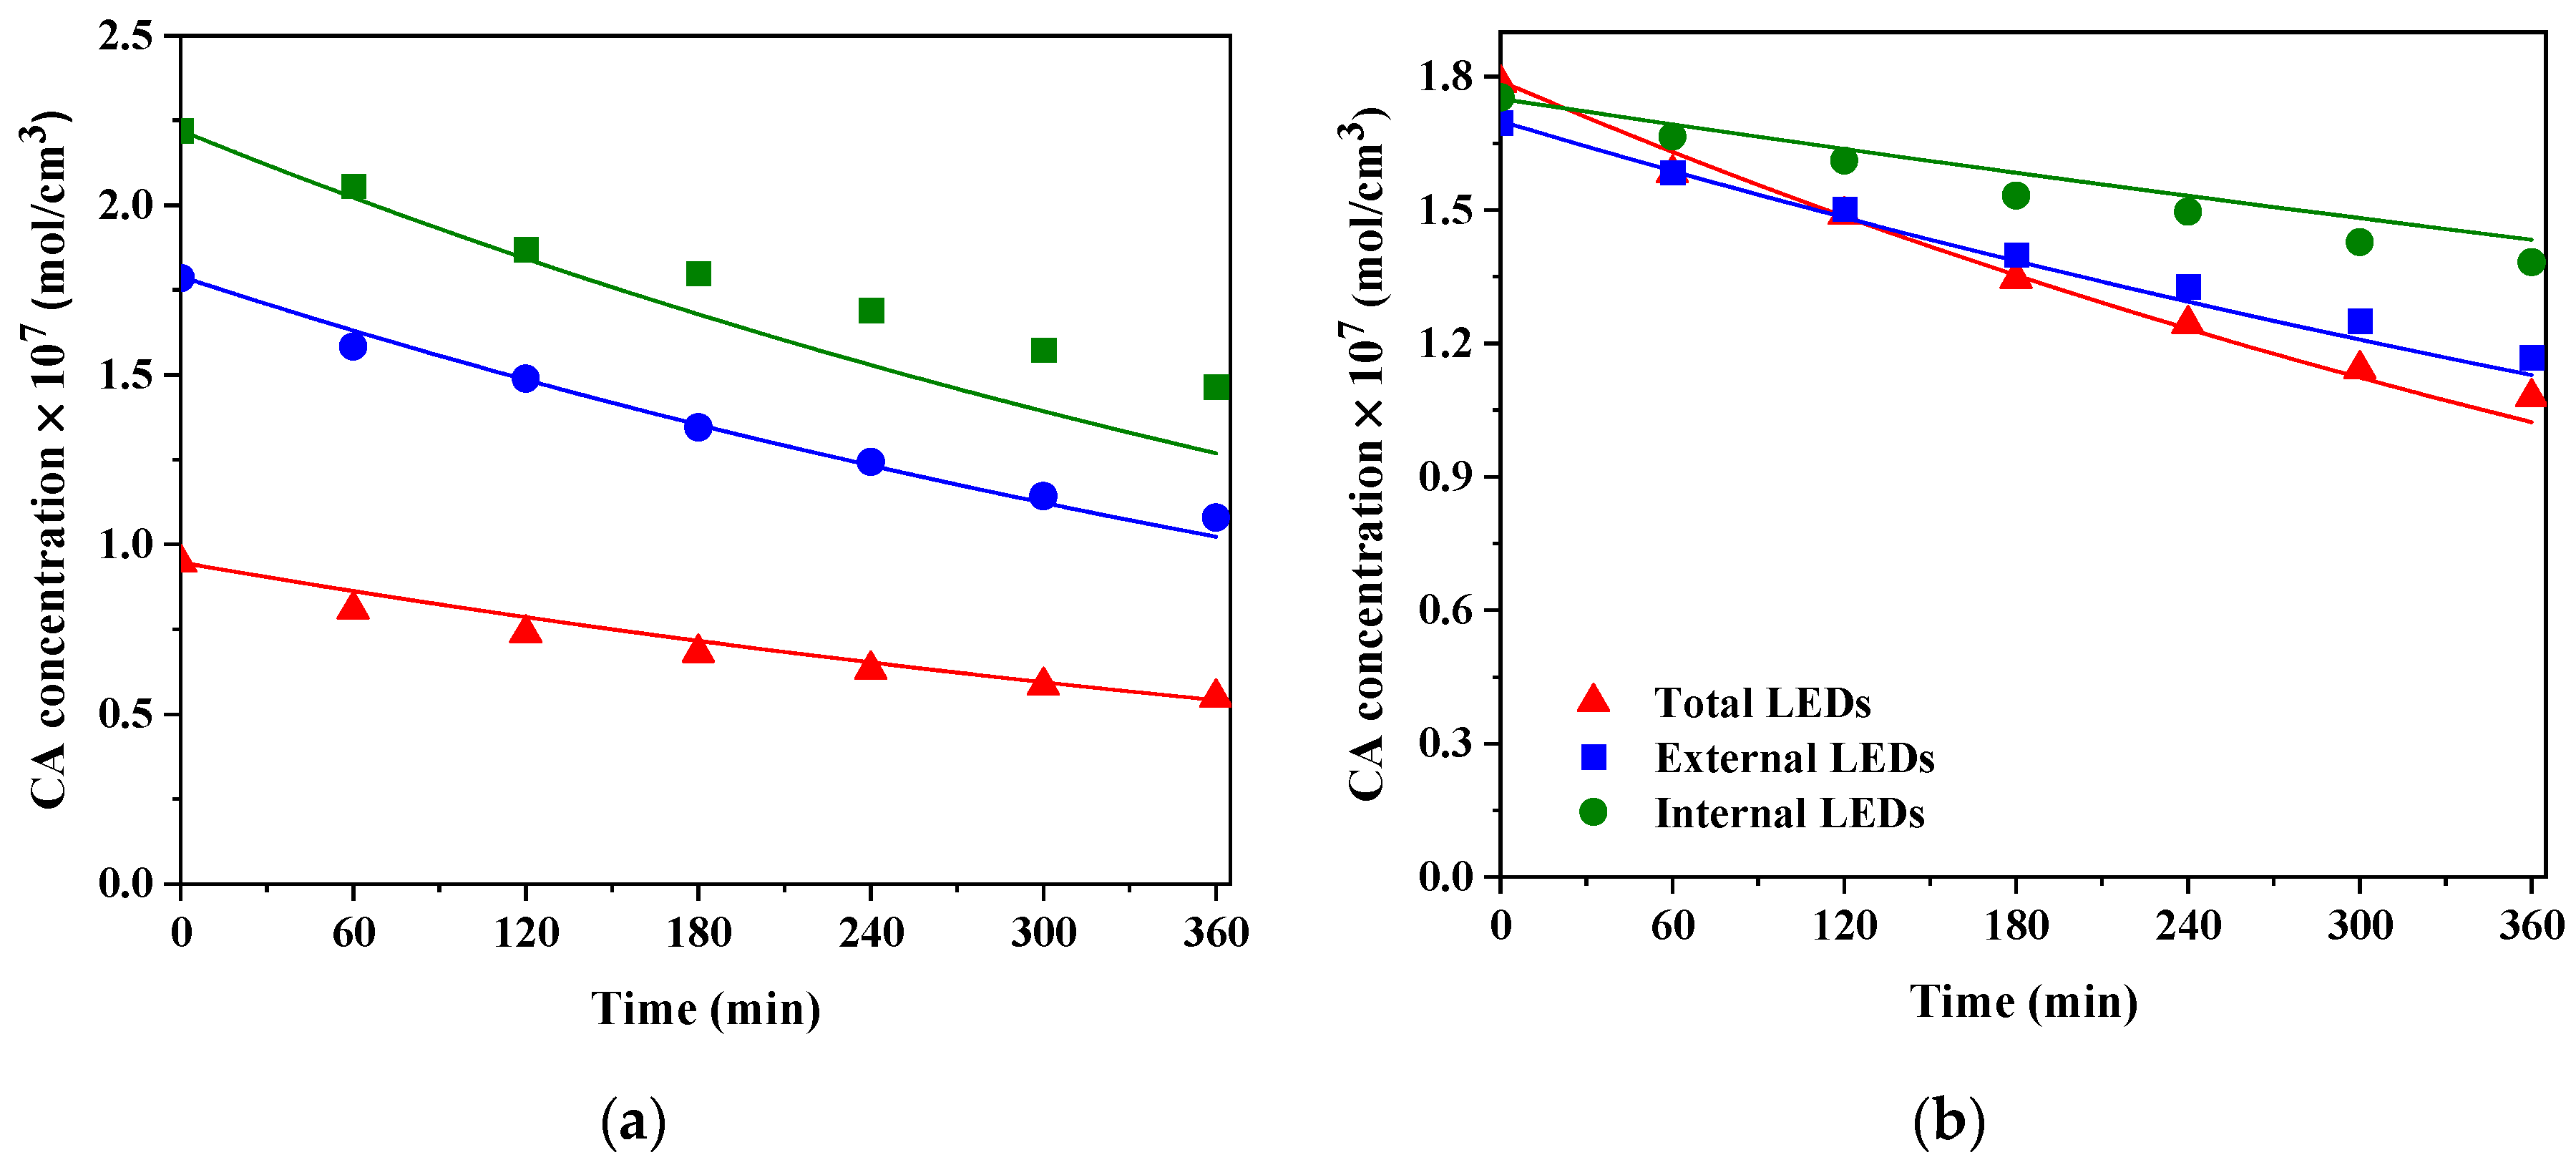
Then, to validate the proposed strategy, the performance of the AR under different experimental conditions was simulated. The evolution of CA concentration in the LED reactor was calculated by solving Equation (3) with the two parameters previously estimated, and the corresponding values of LSRPA obtained from the 3D radiation model. It is important to remark that no adjustable parameters were employed in the simulations. Predicted and experimental CA concentrations in the AR under different conditions, for = 0.27 µm, are shown in Figure 7.
As can be observed, very good agreement was obtained between model predictions and experimental results. The percentage root mean square error of the estimations was calculated according to the following expression:
where is the experimental concentration of CA in a defined time and experimental condition, and is the corresponding predicted concentration by the model. N represents the total number of experimental points. The RMSE% for the experiments presented in Figure 7 is 4.6%.
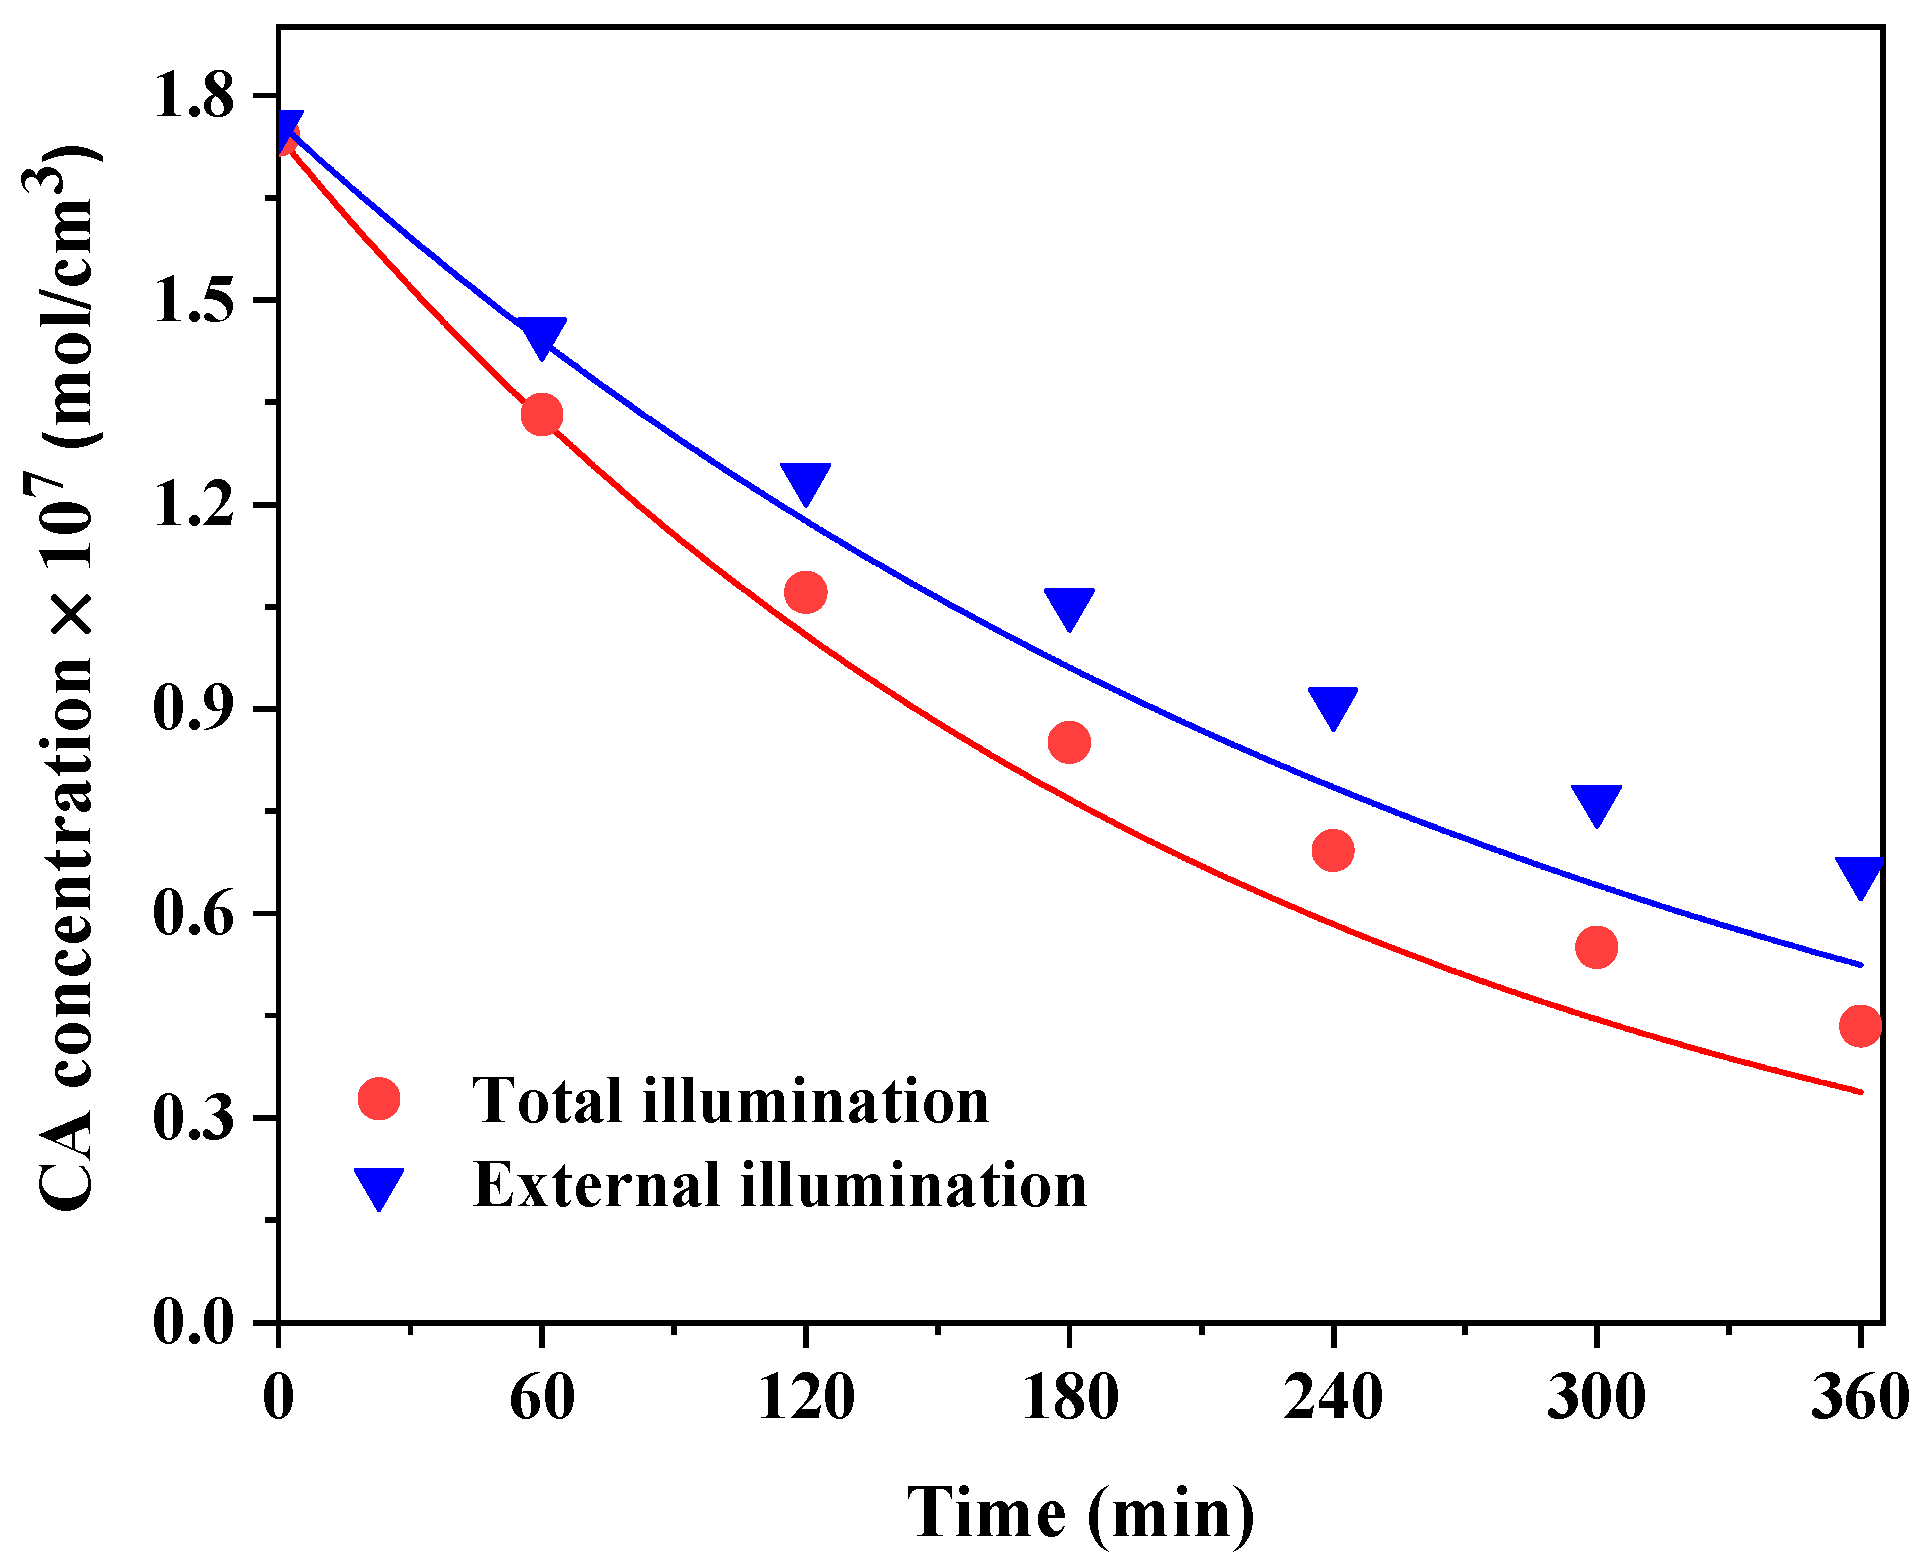
Intrinsic kinetic parameters can be very useful to find the experimental conditions needed to achieve a defined goal. For example, if we want to obtain 80% CA conversion in 6 h under total illumination in the AR, the model indicates that a TiO2 film thickness of 3.2 µm must be used. This prediction was experimentally verified, as presented in Figure 8. Under similar conditions but with external illumination only, 70% CA conversion was achieved after 6 h of irradiation. The corresponding experimental and simulation results under this condition are also depicted in Figure 8. The RMSE% of the estimations employing = 3.2 µm was 12.6%. Although it was higher than the error obtained from simulations in Figure 7, the TiO2 film thickness in the last cases was one order of magnitude higher than the employed in the CR for the estimation of the kinetic parameters (0.27 µm and 0.44 µm). Despite this issue, reasonable predictions were obtained.
7. Conclusions
In this work, a strategy to obtain intrinsic kinetic parameters in a simple, cylindrical packed-bed photocatalytic reactor is presented. This information was used to simulate the performance of a more complex, annular packed-bed reactor, with different dimensions, types of lamp, and illumination arrangements. With only two kinetic parameters, and no adjustable factors, the proposed methodology can predict with good accuracy the behavior of the pollutant clofibric acid in the annular reactor. Because photocatalytic-reaction-rate expressions depend on the effect of radiation absorption, the key factor is to accurately model the photon absorption distribution inside the reactors. The presented results demonstrate that kinetic parameters calculated with this methodology are independent of the reactor geometry, reactor size and irradiation conditions, and that they can be employed to design, optimize and scale-up photocatalytic reactors. The rational design of photocatalytic reactors, employing intrinsic parameters and radiation models, constitutes an efficient strategy for bridging the gap between laboratory experiments and real applications.
Supplementary Materials
The following supporting information can be downloaded at: https://www.mdpi.com/article/10.3390/w14223608/s1, Evaluation of internal and external mass transfer limitations in the photocatalytic reactors. References [29,30,31,32] are cited in the supplementary materials.
Author Contributions
A.M.: Investigation, formal analysis, software, and writing—original draft preparation. O.M.A.: Overall review, editing, and fund acquisition. M.L.S.: Visualization, supervision, and writing—review and editing, and fund acquisition. All authors have read and agreed to the published version of the manuscript.
Funding
This research was funded by Universidad Nacional del Litoral, grant number CAI+D 2020 50620190100040LI from, Consejo Nacional de Investigaciones Científicas y Técnicas, grant number PIP 2021 11220200101324CO, and Agencia Nacional de Promoción de la Investigación, el Desarrollo Tecnológico y la Innovación, grant number PICT 2018-0926.
Data Availability Statement
The data presented in this study are available on request from the corresponding author.
Acknowledgments
The authors gratefully acknowledge Ing. Javier Borda Bossana for his technical assistance in the representation of simulation results.
Conflicts of Interest
The authors declare no conflict of interest.
References
- Lee, B.C.Y.; Lim, F.Y.; Loh, W.H.; Ong, S.L.; Hu, J. Emerging Contaminants: An Overview of Recent Trends for Their Treatment and Management Using Light-Driven Processes. Water 2021, 13, 2340. [Google Scholar] [CrossRef]
- Saravanan, A.; Senthil Kumar, P.; Jeevanantham, S.; Anubha, M.; Jayashree, S. Degradation of toxic agrochemicals and pharmaceutical pollutants: Effective and alternative approaches toward photocatalysis. Environ. Pollut. 2022, 1, 118844. [Google Scholar] [CrossRef]
- Ahmed, S.; Saleem, F.; Khan, F.S.A.; Mubarak, N.M.; Khalid, M.; Tan, Y.; Mazari, S.A.; Karri, R.R.; Abdullah, E.C. Emerging pollutants and their removal using visible-light responsive photocatalysis—A comprehensive review. J. Environ. Chem. Eng. 2021, 6, 106643. [Google Scholar] [CrossRef]
- Alfano, O.M.; Cassano, A.E. Scaling-Up of Photoreactors: Applications to Advanced Oxidation Processes. In Advances in Chemical Engineering, 1st ed.; De Lasa, H.I., Rosales, B.S., Eds.; Academic Press: Burlington, MA, USA, 2009; pp. 229–287. [Google Scholar]
- Toepfer, B.; Gora, A.; Li Puma, G. Photocatalytic oxidation of multicomponent solutions of herbicides: Reaction kinetics analysis with explicit photon absorption effects. App. Catal. B 2006, 68, 171–180. [Google Scholar] [CrossRef]
- Moreira, R.P.M.; Li Puma, G. Multiphysics Computational Fluid-Dynamics (CFD) Modeling of Annular Photocatalytic Reactors by the Discrete Ordinates Method (DOM) and the Six-Flux Model (SFM) and Evaluation of the Contaminant Intrinsic Kinetics Constants. Catal. Today 2021, 361, 77–84. [Google Scholar] [CrossRef]
- Bayarri, B.; Giménez, J.; Curcó, D.; Esplugas, S. Absorbed radiation and kinetic model in photocatalysis by TiO2. Int. J. Chem. React. Eng. 2022, 20, 3–15. [Google Scholar] [CrossRef]
- Satuf, M.L.; Brandi, R.J.; Cassano, A.E.; Alfano, O.M. Scaling-up of slurry reactors for the photocataytic degradation of 4-chlorophenol. Catal. Today 2007, 129, 110–117. [Google Scholar] [CrossRef]
- Casado, C.; Marugán, J.; Timmers, R.; Muñoz, M.; van Grieken, R. Comprehensive multiphysics modeling of photocatalytic processes by computational fluid dynamics based on intrinsic kinetic parameters determined in a differential photoreactor. Chem. Eng. J. 2017, 310, 368–380. [Google Scholar] [CrossRef] [Green Version]
- Imoberdorf, G.E.; Irazoqui, H.A.; Alfano, O.M.; Cassano, A.E. Scaling-up from first principles of a photocatalytic reactor for air pollution remediation. Chem. Eng. Sci. 2007, 62, 793–804. [Google Scholar] [CrossRef]
- Grcic, I.; Koprivanac, N.; Li Puma, G. Modeling the photocatalytic oxidation of carboxylic acids on aqueous TiO2 suspensions and on immobilized TiO2-chitosan thin films in different reactor geometries irradiated by UVA or UVC light sources. Chem. Eng. J. 2021, 422, 130104. [Google Scholar] [CrossRef]
- Martín-Sómer, M.; Pablos, C.; van Grieken, R.; Marugán, J. Influence of light distribution on the performance of photocatalytic reactors: LED vs mercury lamps. Appl. Catal. B 2017, 215, 1–7. [Google Scholar] [CrossRef]
- Wang, Q.; Xiao, M.; Peng, Z.; Zhang, C.; Du, X.; Wang, Z.; Wang, W. Visible LED photocatalysis combined with ultrafiltration driven by metal-free oxygen-doped graphitic carbon nitride for sulfamethazine degradation. J. Hazard. Mat. 2022, 439, 129632. [Google Scholar] [CrossRef] [PubMed]
- Manassero, A.; Satuf, M.L.; Alfano, O.M. Photocatalytic degradation of an emerging pollutant by TiO2-coated glass rings: A kinetic study. Environ. Sci. Pollut. Res. 2017, 24, 6031–6039. [Google Scholar] [CrossRef]
- Manassero, A.; Alfano, O.M.; Satuf, M.L. Radiation modeling and performance evaluation of a UV-LED photocatalytic reactor for water treatment. J. Photochem. Photobiol. A 2022, 436, 114367. [Google Scholar] [CrossRef]
- van Grieken, R.; Marugán, J.; Sordo, C.; Pablos, C. Comparison of the photocatalytic disinfection of E. coli suspensions in slurry, wall and fixed-bed reactors. Catal. Today 2009, 144, 48–54. [Google Scholar] [CrossRef]
- Murov, S.L.; Carmichael, I.; Hug, G.L. Handbook of Photochemistry, 2nd ed.; Marcel Dekker: New York, NY, USA, 1993. [Google Scholar]
- Dordio, A.; Estêvão Candeias, A.; Pinto, A.; Teixeira da Costa, C.; Palace Carvalho, A. Preliminary media screening for application in the removal of clofibric acid, carbamazepine and ibuprofen by SSF-constructed wetlands. Ecol. Eng. 2009, 35, 290–302. [Google Scholar] [CrossRef]
- Mills, A.; Davies, R. Photomineralisation of 4-chlorophenol sensitised by titanium dioxide: A study of the intermediates. J. Photochem. Photobiol. A 1993, 70, 183–191. [Google Scholar] [CrossRef]
- Theurich, J.; Lindner, M.; Bahnemann, D.W. Photocatalytic degradation of 4-chlorophenol in aerated aqueous titanium dioxide suspensions: A kinetic and mechanistic study. Langmuir 1996, 12, 6368–6376. [Google Scholar] [CrossRef]
- Pelizzetti, E.; Minero, C. Mechanism of the photo-oxidative degradation of organic pollutants over TiO2 particles. Electrochim. Acta 1993, 38, 47–55. [Google Scholar] [CrossRef]
- Almquist, C.B.; Biswas, P. A mechanistic approach to modeling the effect of dissolved oxygen in photo-oxidation reactions on titanium dioxide in aqueous systems. Chem. Eng. Sci. 2001, 56, 3421–3430. [Google Scholar] [CrossRef]
- Dijkstra, M.F.J.; Panneman, H.J.; Winkelman, J.G.M. Modeling the photocatalytic degradation of formic acid in a reactor with immobilized catalyst. Chem. Eng. Sci. 2022, 57, 4895–4907. [Google Scholar] [CrossRef] [Green Version]
- Turchi, C.S.; Ollis, D.F. Photocatalytic degradation of organic water contaminants: Mechanisms involving hydroxyl radical attack. J. Catal. 1990, 122, 178–190. [Google Scholar] [CrossRef]
- Terzian, R.; Serpone, N.; Minero, C.; Pelizzetti, E.; Hidaka, H. Kinetic studies in heterogeneous photocatalysis 4. The ph tomineralization of a hydroquinone and a catechol. Photochem. Photobiol. A 1990, 55, 243–249. [Google Scholar] [CrossRef]
- Satuf, M.L.; Brandi, R.J.; Cassano, A.E.; Alfano, O.M. Quantum efficiencies of 4-chlorophenol photocatalytic degradation and mineralization in a well-mixed slurry reactor. Ind. Eng. Chem. Res. 2007, 46, 43–51. [Google Scholar] [CrossRef]
- Manassero, A.; Satuf, M.L.; Alfano, O.M. Kinetic modeling of the photocatalytic degradation of clofibric acid in a slurry reactor. Environ. Sci. Pollut. Res. 2015, 22, 926–937. [Google Scholar] [CrossRef] [PubMed]
- Alfano, O.M.; Cabrera, M.I.; Cassano, A.E. Photocatalytic reactions involving hydroxyl radical attack. J. Catal. 1997, 172, 370–379. [Google Scholar] [CrossRef]
- Chen, D.; Li, F.; Ray, A.K. External and internal mass transfer effect on photocatalytic degradation. Catal. Today 2001, 66, 475–485. [Google Scholar] [CrossRef]
- Ould-Mame, S.M.; Zahraa, O.; Bouchy, M. Photocatalytic degradation of salicylic acid on fixed TiO2 -Kinetic studies. Int. J. Photoenergy 2000, 2, 59–66. [Google Scholar] [CrossRef] [Green Version]
- Cloteaux, A.; Gérardin, F.; Thomas, D.; Midoux, N.; André, J.C. Fixed bed photocatalytic reactor for formaldehyde degradation: Experimental and modeling study. Chem. Eng. J. 2014, 249, 121–129. [Google Scholar] [CrossRef]
- Onda, K.; Sada, E.; Murase, Y. Liquid-side mass transfer coefficients in packed towers. AIChE J. 1959, 5, 235–239. [Google Scholar] [CrossRef]
Figure 1.
Schematic representation of employed methodology.

Figure 2.
Schemes of the photoreactors and illumination sources: (a) Cylindrical reactor; (b) Coordinate system in the CR; (c) Lateral view of the annular reactor; (d) Top view of the annular reactor without the lid; (e) Coordinate systems in the AR.
Figure 2.
Schemes of the photoreactors and illumination sources: (a) Cylindrical reactor; (b) Coordinate system in the CR; (c) Lateral view of the annular reactor; (d) Top view of the annular reactor without the lid; (e) Coordinate systems in the AR.

Figure 3.
Radiation flux at the reactor window: (a) Hg lamp; (b) UV LED.

Figure 4.
Flowchart of MC algorithm inside the reactors.

Figure 5.
LSRPA distribution in the reactors under maximum irradiation and = 0.27 µm. (a) 1-D plot in the CR. (b) 2-D plot, vertical cross section in the AR at = 0°. (c) 2-D plot, horizontal cross section in the AR at z = 1 cm. (d) 2-D plot, horizontal cross section in the AR at z = 2 cm is a figure.

Figure 6.
Experimental results and model predictions for CA in the CR: (a) Different irradiation levels ( µm); (b) Different ( = 15.2 × 10⁻⁹ Eins/s cm2). Symbols: experimental data. Solid lines: model results.
Figure 6.
Experimental results and model predictions for CA in the CR: (a) Different irradiation levels ( µm); (b) Different ( = 15.2 × 10⁻⁹ Eins/s cm2). Symbols: experimental data. Solid lines: model results.

Figure 7.
Experimental results and model predictions for CA in the AR: (a) Different initial CA concentrations (total irradiation, µm); (b) Different irradiation conditions (CCA,0 = 1.8 × 10⁻⁷ mol/cm3, µm). Symbols: experimental data. Solid lines: model results.
Figure 7.
Experimental results and model predictions for CA in the AR: (a) Different initial CA concentrations (total irradiation, µm); (b) Different irradiation conditions (CCA,0 = 1.8 × 10⁻⁷ mol/cm3, µm). Symbols: experimental data. Solid lines: model results.

Figure 8.
Experimental results and model predictions for CA in the AR under different irradiation conditions ( µm). Symbols: experimental data. Solid lines: Model results.
Figure 8.
Experimental results and model predictions for CA in the AR under different irradiation conditions ( µm). Symbols: experimental data. Solid lines: Model results.


Table 1.
Main characteristics of the reactors.
| Photoreactor | ||
|---|---|---|
| Characteristics | Cylindrical | Annular |
| Main dimensions | Length = 2.75 cm Diameter = 5.0 cm | Length = 4.0 cm Inner diameter = 6.5 cm Outer diameter = 10.5 cm |
| Reactor volume | 54 mL | 214 mL |
| Total system volume | 1000 mL | 600 mL |
| Irradiation source | One mercury lamp | 40 UV-LED lamps |
| Lamp emission range | 350–410 nm | 360–390 nm |
| Number of rings | 310 | 900 |
| Catalytic area | 487 cm2 | 1414 cm2 |
| Irradiation | From one side | Internal and external |
| Distance between lamps and irradiated windows | 33 cm | Internal LEDs = 0.3 cm External LEDs = 0.6 cm |
| Irradiated window area | 19.6 cm2 | Inner = 81.6 cm2 Outer = 131.8 cm2 |
Table 2.
Experimental conditions.
| Photoreactor | ||
|---|---|---|
| Variable | Cylindrical | Annular |
| Initial CA concentration, CCA,0 [mol/cm3] | 0.93 × 10⁻⁷ | (0.93, 1.87, 2.34) × 10−7 |
| Incident radiation fluxes, [Eins/(s cm2)] | (15.2, 9.39, 4.58) × 10−9 | (2.29, 2.94, 3.34) × 10−9 |
| Thickness of TiO2 film, [µm] | 0.27, 0.44 | 0.27, 3.24 |
Table 3.
Reaction scheme for the photocatalytic degradation of CA.
| Step | Reaction | Reaction Rate |
|---|---|---|
| Activation | rgs | |
| Recombination | ||
| Electron trapping | ||
| Hole trapping | ||
| Hydroxyl radical attack |
Table 4.
Main differences of the radiation models in each reactor.
| Characteristics | Cylindrical Reactor | Annular Reactor |
|---|---|---|
| Spatial dimension | 1D | 3D |
| Number of spatial cells | 103 | 106 |
| Coordinate system for photon location | Cartesian: x | Cylindrical:,, |
| Coordinate system for photon direction | Polar: θ | Spherical:,, |
Publisher’s Note: MDPI stays neutral with regard to jurisdictional claims in published maps and institutional affiliations. |
© 2022 by the authors. Licensee MDPI, Basel, Switzerland. This article is an open access article distributed under the terms and conditions of the Creative Commons Attribution (CC BY) license (https://creativecommons.org/licenses/by/4.0/).
Share and Cite
MDPI and ACS Style
Manassero, A.; Alfano, O.M.; Satuf, M.L. Degradation of Emerging Pollutants by Photocatalysis: Radiation Modeling and Kinetics in Packed-Bed Reactors. Water 2022, 14, 3608. https://doi.org/10.3390/w14223608
AMA Style
Manassero A, Alfano OM, Satuf ML. Degradation of Emerging Pollutants by Photocatalysis: Radiation Modeling and Kinetics in Packed-Bed Reactors. Water. 2022; 14(22):3608. https://doi.org/10.3390/w14223608
Chicago/Turabian StyleManassero, Agustina, Orlando Mario Alfano, and María Lucila Satuf. 2022. "Degradation of Emerging Pollutants by Photocatalysis: Radiation Modeling and Kinetics in Packed-Bed Reactors" Water 14, no. 22: 3608. https://doi.org/10.3390/w14223608
Note that from the first issue of 2016, this journal uses article numbers instead of page numbers. See further details here.