
Separation Method of Main and Foreign Water for the Measuring Weirs of Danjiangkou Earth-Rock Dam

1
Nanjing Research Institute of Hydrology and Water Conservation Automation, Ministry of Water Resources, Nanjing 210012, China
2
Hanjiang Group Corporation Ltd., Wuhan 430048, China
3
Danjiangkou Hydroelectric Power Plant, Hanjiang Group Corporation Ltd., Danjiangkou 442700, China
4
Department of Engineering Mechanics, Hohai University, Nanjing 211100, China
*
Author to whom correspondence should be addressed.
Water 2022, 14(22), 3620; https://doi.org/10.3390/w14223620
Submission received: 25 October 2022
/
Revised: 5 November 2022
/
Accepted: 6 November 2022
/
Published: 10 November 2022
(This article belongs to the Special Issue Safety Monitoring and Management of Reservoir and Dams)
Abstract
:Reservoir water and rainfall are the two main factors affecting the seepage of earth-rock dams, but the seepage measurement includes the seepage discharge caused by the reservoir water and rainfall. Only by obtaining the seepage discharge caused by the reservoir water can we evaluate the seepage safety state. In this paper, a statistical model for seepage monitoring of earth-rock dams is established. Normal distribution function and Rayleigh distribution function are used as the lag functions of reservoir water and rainfall, respectively. The grey wolf algorithm is used to solve the lag days, and the partial least square method is adopted to solve the regression coefficient of the statistical model. Then, the reservoir water (main water) and rainfall infiltration (foreign water) parts of the measuring weir are separated with the statistical model. The developed method is used to separate the main and foreign water parts of the three measuring weirs of the Danjiangkou earth-rock dam. The results show that the overall accuracy of the models is high (the multi-correlation coefficients are about 0.95), and the separated main and foreign water seepage discharge conforms to the seepage law of earth-rock dam, which verifies the effectiveness of the method.
1. Introduction
Seepage is one of the main factors leading to earth-rock dam failure [1,2,3], so seepage monitoring is the main content of earth-rock dam safety monitoring. Through monitoring the seepage flow, the seepage safety behavior of the earth-rock dam can be evaluated quantitatively [4]. However, the measured seepage discharge of the earth-rock dam contains the main water (reservoir water) and the foreign water (rainfall infiltration), which makes it difficult to analyze the seepage measurement. In order to reveal the seepage development trend and evaluate the seepage safety state, it is necessary to study the separation method of main water and foreign water for the seepage measurement of earth-rock dams.
Both the numerical simulation and the statistical model can be used to separate the main water and the foreign water in the leakage measurement of the earth-rock dam. The seepage discharge of main and foreign water can be obtained by simulating the upstream water seepage and rainfall infiltration. Some scholars have studied the slope rainfall infiltration problem by using numerical methods [5,6,7,8,9,10]. The calculation results have a great relationship with the adopted models and parameters, and the calculation time is long. Using the statistical regression analysis method based on the existing monitoring data, the statistical relationship between the monitoring effect quantity (dependent variable) and the environmental variable (independent variable) can be established with the statistical model [11]. The statistical model is widely used in the analysis of safety monitoring data [12,13,14] because its implementation is simple and its accuracy can meet engineering requirements.
The influence of reservoir water level and rainfall on dam seepage has a hysteresis effect [15]. At present, the methods to reflect the lag effect of reservoir water level mainly include the average method [16,17,18] and the equivalent reservoir water level method [19]. Although the accuracy of the model has been improved to a certain extent, the dynamic change of the seepage lag effect has not been considered, and it is difficult to accurately describe the lag effect of seepage. Some scholars use the lag effect function to describe the lag effect of seepage but usually use the same lag effect function to describe the lag effect of reservoir water level and rainfall [15,20,21], such as the normal distribution function [21]. Huang and Chen [22] established a more rational dam seepage monitoring model with a new expression of equivalent reservoir water level by introducing reservoir water level dynamic effect weight. Shi et al. [23] developed a safety monitoring model for concrete face rockfill dam seepage with cracks considering the lagging effect, and the normal distribution curve is used to simulate the lagging effect of water pressure and rainfall on dam seepage. Zhao et al. [24] proposed an RS-LSTM model for predicting seepage pressure by combining rough set theory (RS) and the long- and short-term memory network model (LSTM). Wang et al. [25] established monitoring models for the base flow effect and daily variation of dam seepage elements to predict and evaluate the long-term trend and short-term fluctuation of the dam seepage behavior. Wang and Bao [26] proposed a daily variation monitoring model for seepage elements using the previous equivalent incremental value of reservoir water level. Shi et al. [27] proposed an analysis method for seepage lag based on the mutual information principle of information science theory, in which the upstream water level is considered an information source and water level of the seepage pressure is considered an information function point. Recently, machine learning methods have been widely used to analyze dam seepage. Sharghi et al. [28] established a monitoring model of piezometric heads in a earthfill dam with neural network, support vector machine and adaptive neural fuzzy inference system, respectively, and integrated the three methods to enhance the prediction accuracy. Wang et al. [29] predicted the time sequence of seepage pressure using the grey self-memory model, which avoids the collection and treatment of data about the different factors. Chen et al. [30] investigated the dam leakage by developing a kernel extreme learning machine. Salazar et al. [31] analyzed the leakage of the La Baells Dam with the boosted regression trees.
Although some scholars have studied the seepage monitoring model of earth-rock dams, there is no literature on the separation of main and foreign water in the seepage measurement of earth-rock dams. Based on the regression method, this paper studies the separation of main and foreign water in the water measuring weirs of Danjiangkou earth-rock dam. According to the monitoring data of the Xianfenggou, the left bank junction and the right bank junction of Danjiangkou earth-rock dam from January 2020 to April 2022, a seepage monitoring statistical model considering the lag effect of water level, rainfall and time effect factors is built. The partial least square regression method is used to solve the regression coefficient of the model, and the grey wolf optimization algorithm is used to solve the optimal lag effect parameters of reservoir water level and rainfall. Based on the established seepage statistical model, the main and foreign seepage discharge parts of the measuring weir of Danjiangkou earth-rock dam are separated.
2. Methodology
2.1. Statistical Model for Seepage Monitoring Considering Hysteresis Effect
The seepage of earth-rock dams is mainly affected by reservoir water level, rainfall and sedimentation in front of the dam and the time-varying process of the impervious core. The reservoir water level and rainfall are the main factors affecting the dam seepage, and there is an obvious lag effect. The propagation of water pressure, the filling and discharging of piezometric pipe, the filling of unsaturated soil and the dissipation of water in saturated soil takes time, so the water level of piezometric pipe always lags behind the change of reservoir water level, and it is the transient result of the continuous change of current and previous reservoir water levels. Statistical analysis shows that the influence of reservoir water level on seepage changes basically follows a normal distribution. Rainfall also has an obvious hysteresis effect on piezometric pipe water level, which is different from that of reservoir water level. The results show that the Rayleigh distribution function can effectively describe the lag effect of rainfall well. The seepage monitoring model of an earth-rock dam considering the hysteresis effect can be expressed as [32]
where is the upstream reservoir water level, is the water level of reservoir at time , is the downstream water level, is the lag days of reservoir water level, is the distribution parameters of reservoir water level effect, is the adjustment factor, is the rainfall, is the rainfall at time , is the infiltration transformation index (0.4 is used according to experience), is the lag days of rainfall, ~ are regression coefficients and is the accumulated days from the observation date to the first observation date of the model divided by 100.
2.2. Separation Method of Main and Foreign Water for the Measuring Weirs
In order to avoid the multicollinearity interference among the factors in the seepage monitoring model, the partial least square method is used to separate the variables of the statistical regression model for the seepage monitoring of earth-rock dams. The partial least squares method [33,34] uses the idea of principal component analysis and canonical correlation analysis to extract components. The specific steps are as follows: (1) Extract the most representative components of the data set from the independent variable data set and the dependent variable data set, and eliminate the multicollinearity among the independent variables. (2) Establish the regression between the extracted components and the original independent and dependent variables. (3) According to the accuracy of the regression equation, judge whether it is necessary to use the residual information interpreted by the regression equation to continue to extract components. (4) Repeat the above steps until it is no longer necessary to extract the components, and derive the regression expression of the dependent variable with respect to the independent variable.
The partial least square regression method is used to solve the regression coefficient of the model so that the statistical model of seepage monitoring can be established and the main and foreign water parts of the measuring weir can be separated.
2.3. Solution Method of Model Parameters
In this study, the grey wolf optimization algorithm (GWO) [35] is used to obtain the optimal lag effect parameters of reservoir water level and rainfall shown in Equation (1), and the objective function is the complex correlation coefficient of the model. In the following, the theory of GWO is briefly introduced.
The GWO is an intelligent optimization algorithm proposed by Miralili in 2014, which simulates the leadership level and hunting mechanism of grey wolves in nature. From high to low, the leadership of grey wolves can be divided into wolf (directing the whole hunting activity), wolf (assisting the wolf to make decisions or carry out other wolf group activities), wolf (obeying the orders of and wolves) and wolf (searching, surrounding and attacking prey under the guidance of wolf). In the GWO, , and are the optimal solution, the suboptimal solution and the third optimal solution, respectively, and the other candidate solutions are . During each iteration, , and judge the position of the prey and direct to approach the prey. The hunting process of grey wolves is as follows [36]:
- (1)
- Encircle prey
Set as the current number of iterations, and as the positions of prey and grey wolf, respectively. During the hunting process, the position between the individual and the prey and the position of the grey wolf is updated to [22]
where and are parameters ( and are random vectors between 0 and 1).
Search prey by adjusting the values of and , and search prey in different directions by selecting the values of random vectors and . For , the wolves are scattered outwards and search the whole area. For , the wolves are concentrated and carry out a local search in some regions and gradually approach the optimal solution.
- (2)
- Hunt
After identifying the location of the prey, the wolves are guided to surround the prey under the leadership of the wolf and the wolf. Set , , and as the current position of the , , and current wolves, respectively, and , and are the distances between the , , wolves and other individuals. Then, the mathematical expression of the grey wolf tracking prey position is
where , and are random vectors.
The final position of the wolf is
with
The GWO solves the optimal lag effect parameters by the following steps: (1) initialize the grey wolf population, , and ; (2) Calculate the fitness of the objective function of grey wolf individuals, and save the best fitness of , and ; (3) Update the current locations of grey wolves, , and ; (4) Calculate the fitnesses of all grey wolves; (5) Update the fitnesses and locations of , and ; (6) Repeat steps (2) to (5) until the end conditions are met.
3. Results and Discussion
3.1. Project Overview
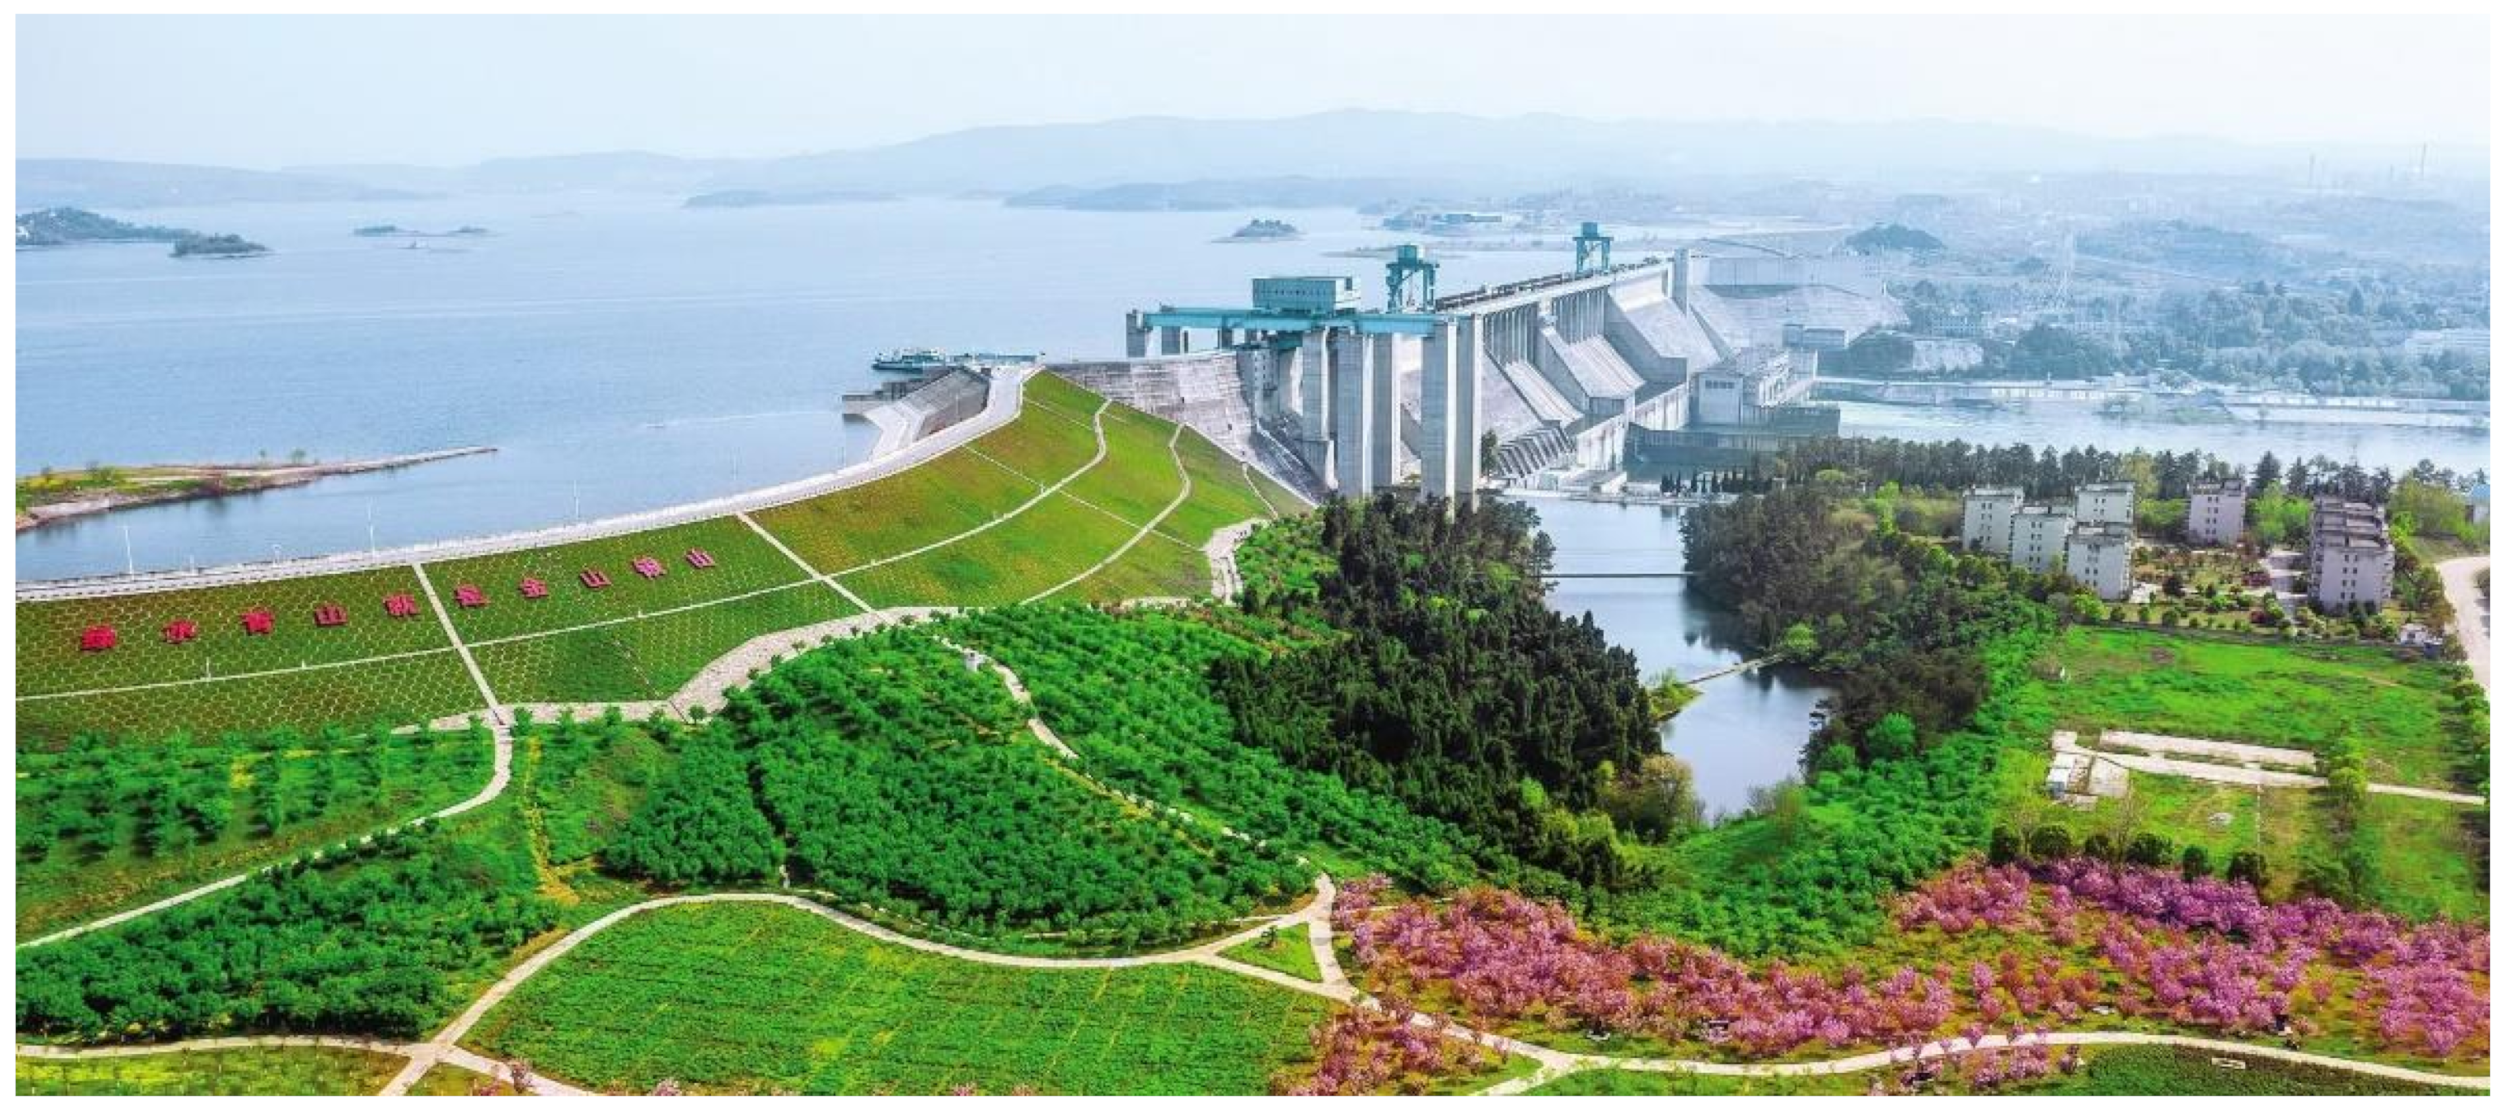
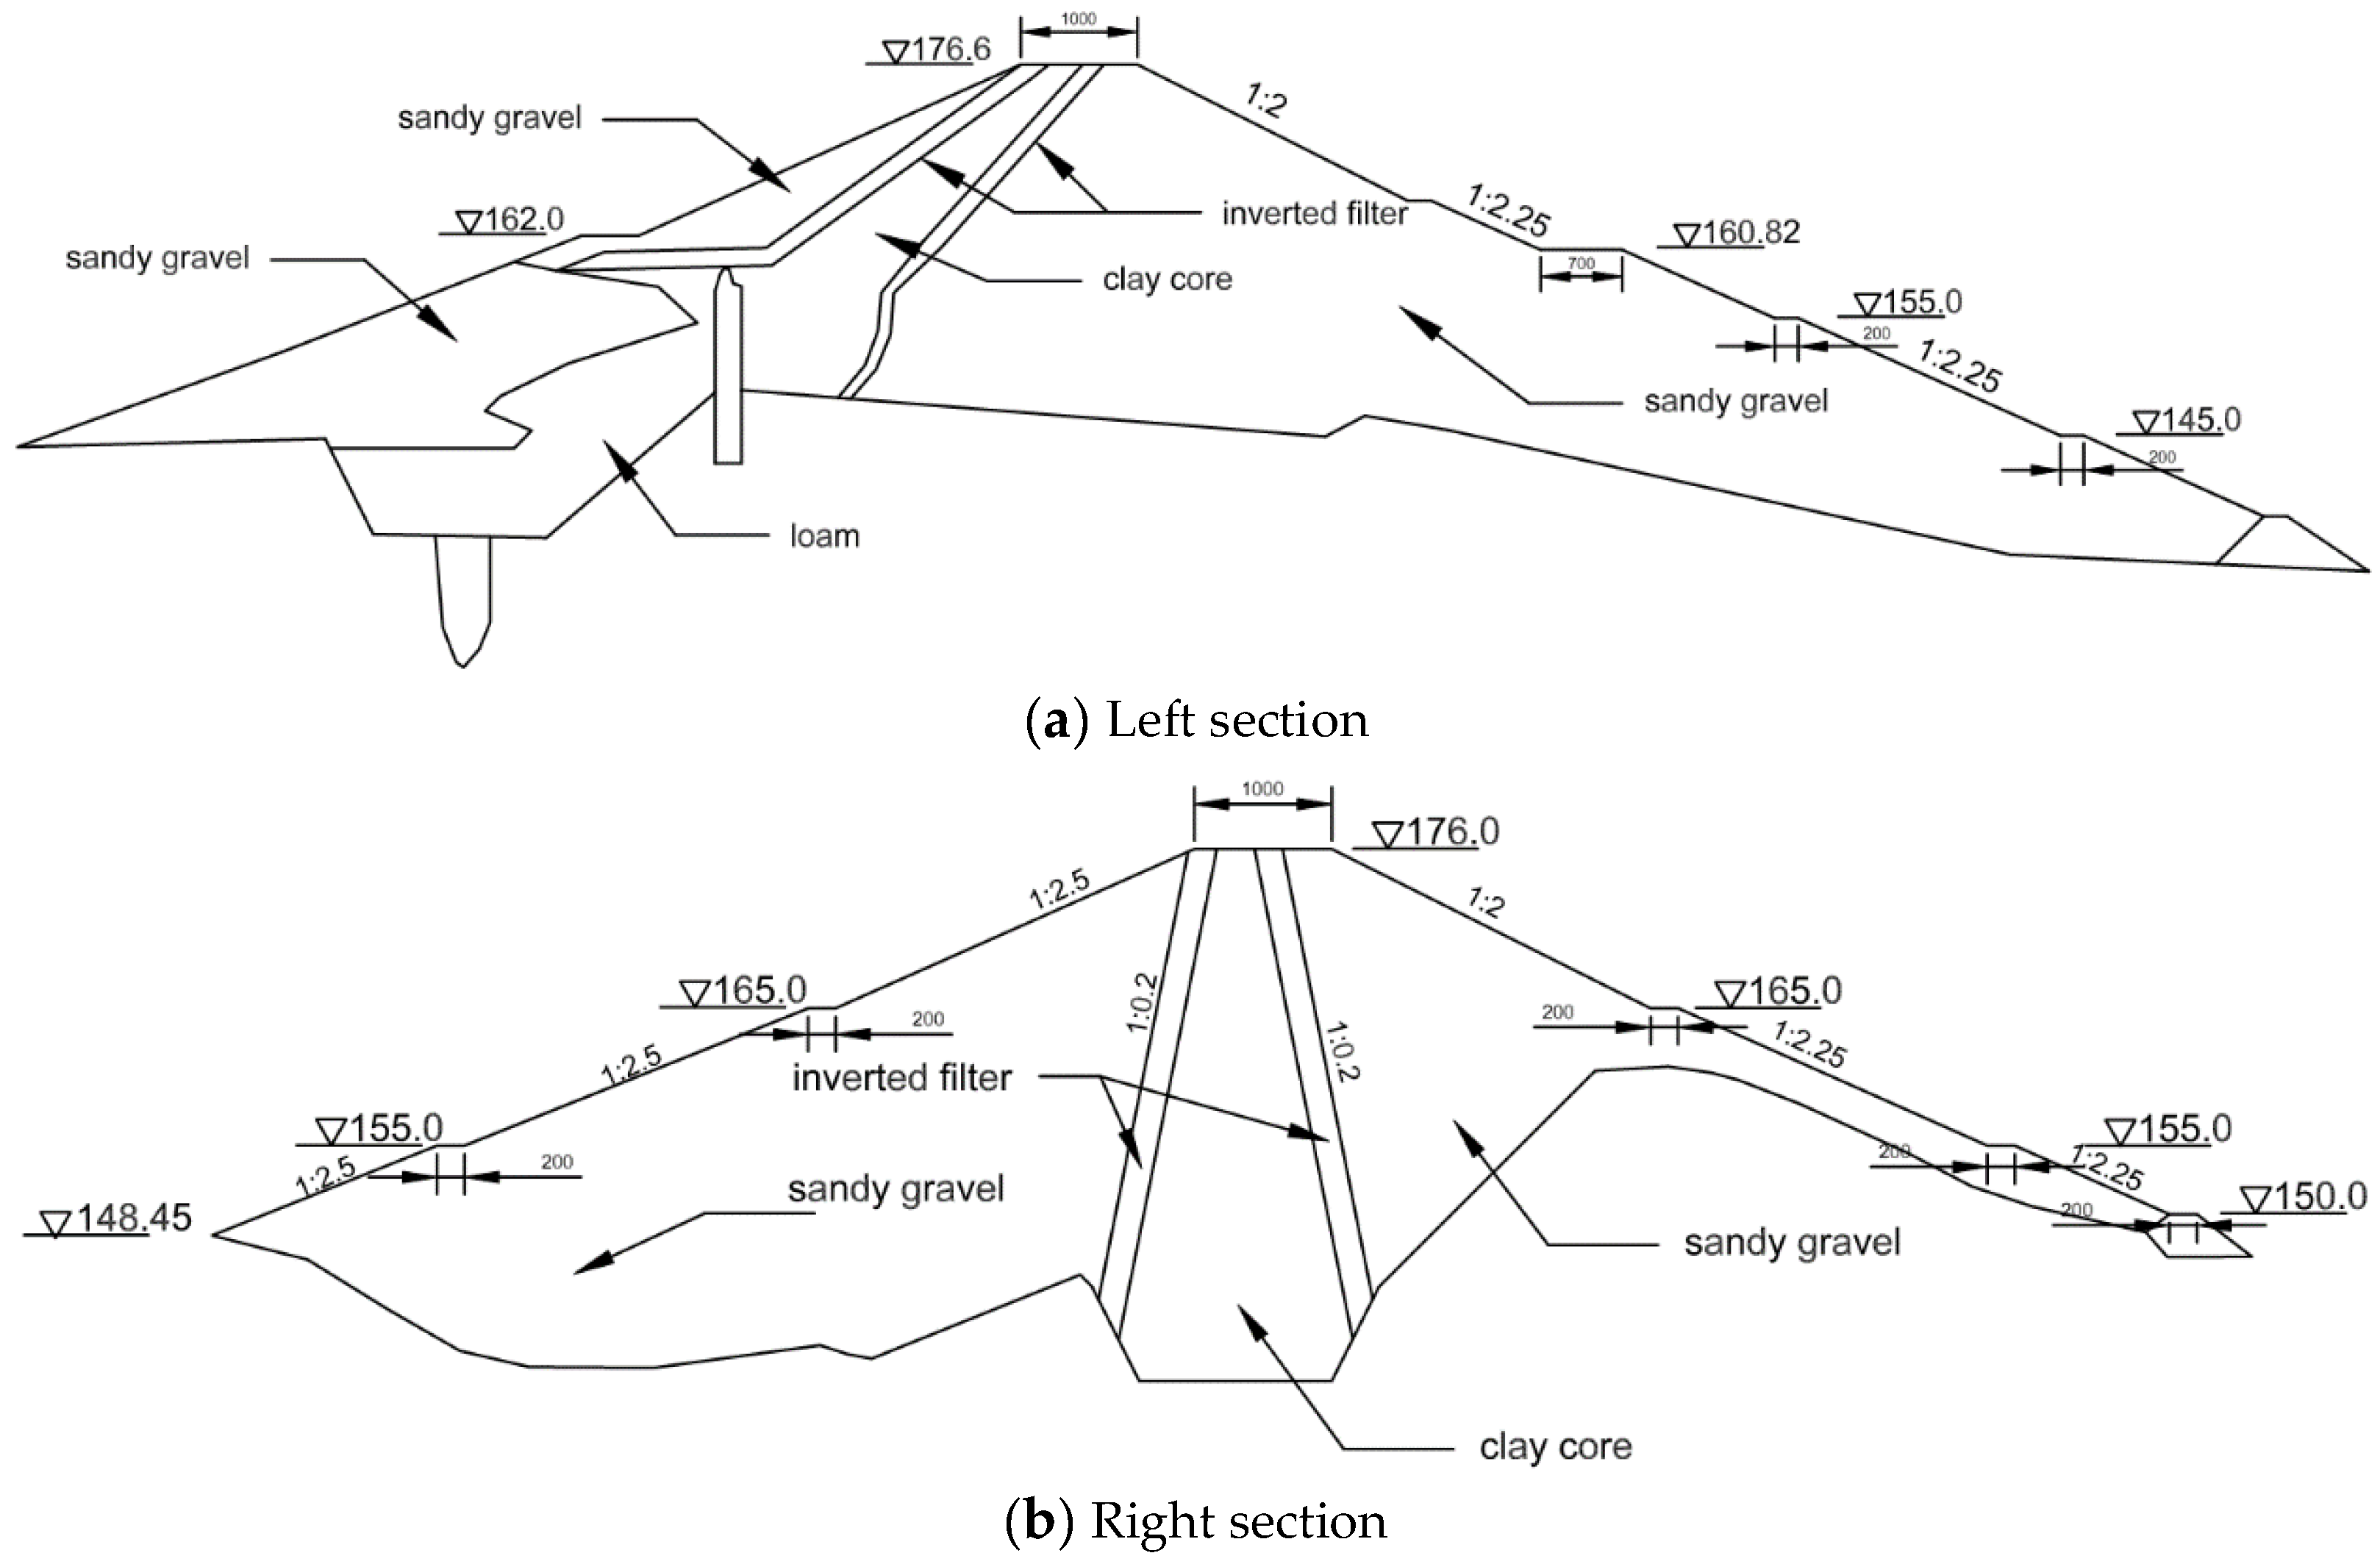
Danjiangkou Water Control Project shown in Figure 1 is located 800 m downstream of the confluence of the Han River and Danjiang River. It has the functions of flood control, water supply, power generation, shipping, etc. The hydroproject is composed of Danjiangkou Dam, a power plant, a ship lift and diversion works. The dam is composed of a concrete dam on the river bed and an earth-rock dam on both banks, with a total length of 3442 m. The length of the concrete dam is 1141 m, the dam crest elevation is 176.6 m and the maximum dam height of the concrete dam is 117 m. The earth-rock dam crest elevation is 176.6 m, the length of the earth-rock dam on the right bank is 877 m and the maximum dam height is 60 m; the length of the earth-rock dam on the left bank is 1424 m, and the maximum dam height is 70.6 m. The earth-rock dam on the left bank is a clay-inclined wall dam and a clay core dam, as shown in Figure 2a. The earth-rock dam on the right bank is a clay core dam, as shown in Figure 2b.
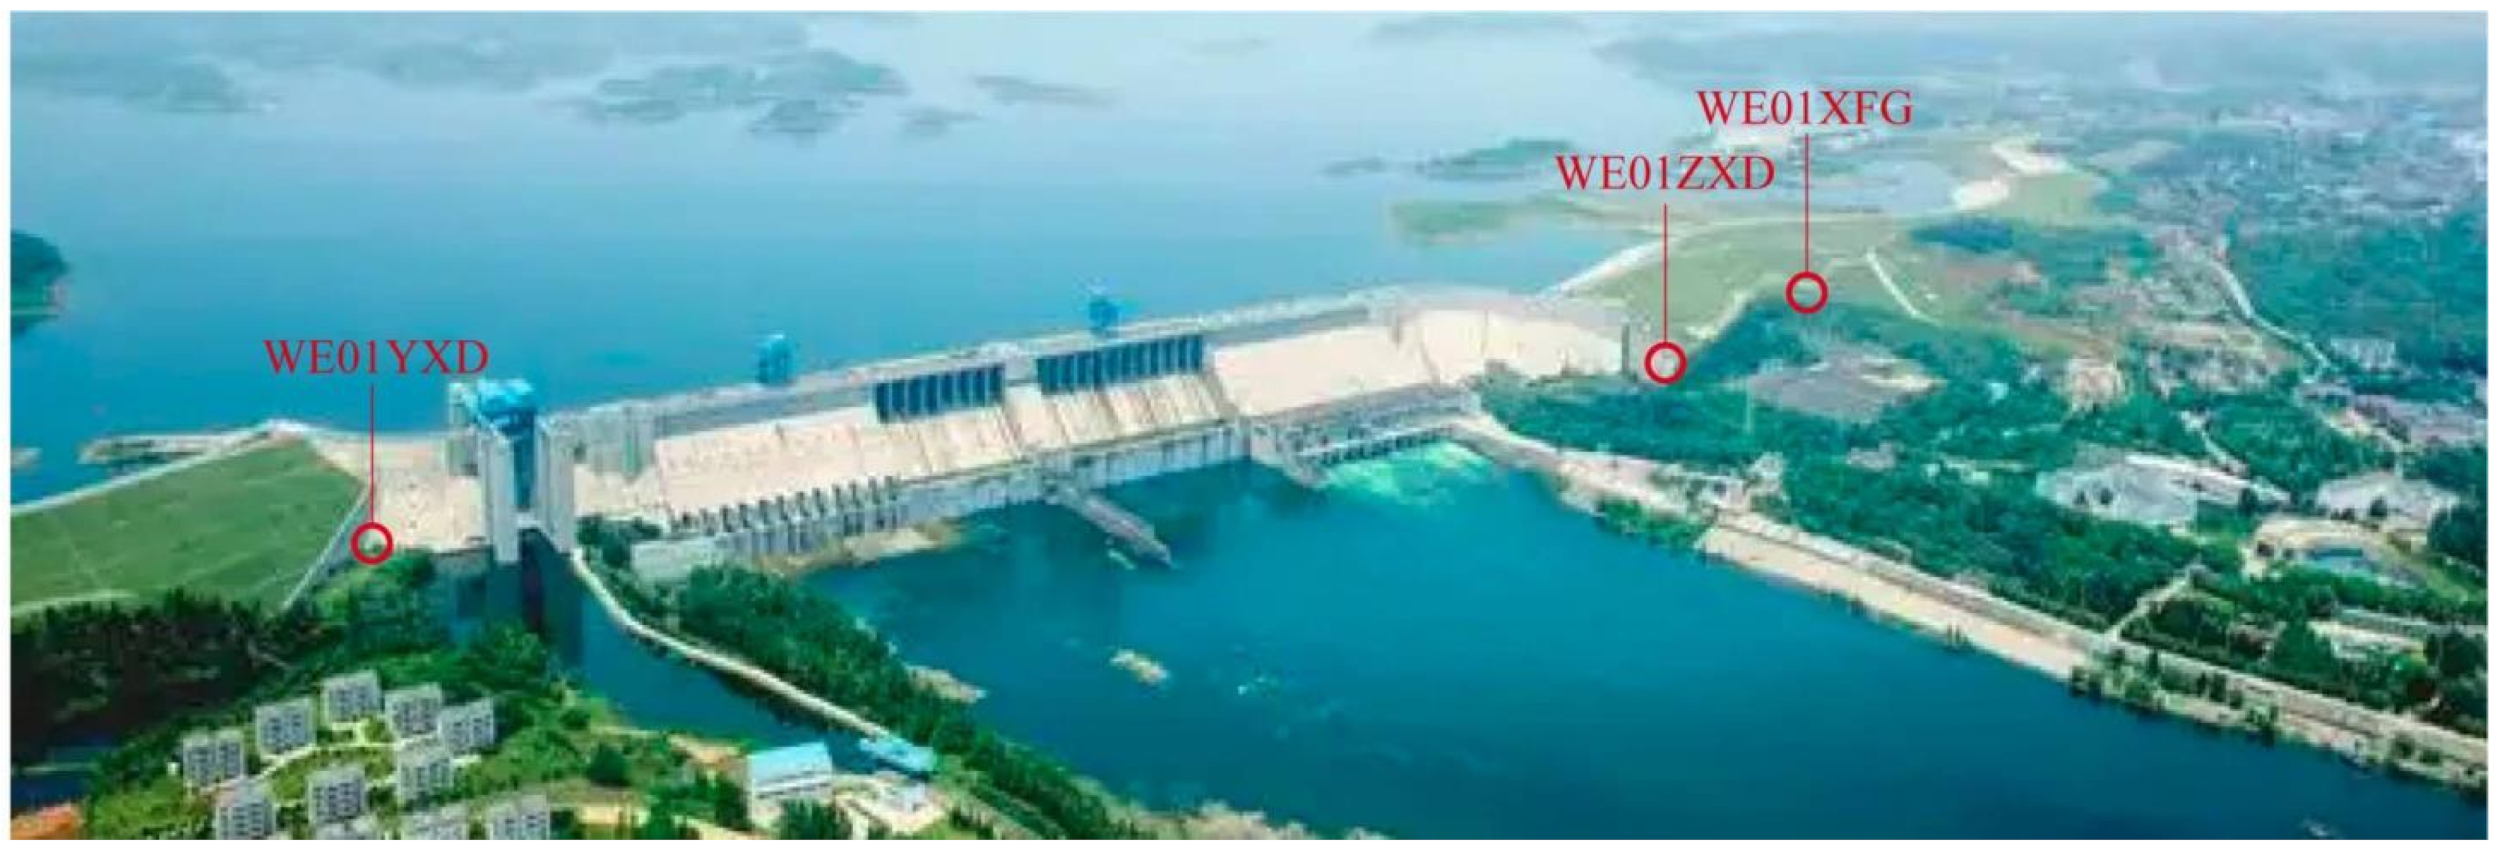
Danjiangkou Water Control Project is a key project to develop and harness the Hanjiang River and a water source project in the middle route of the South to North Water Transfer Project, China. The safety of the dam is very important. However, the measured value of leakage cannot be divided into the main water and the foreign water, which leads to difficulties in analyzing the measured value. Hence, it is necessary to investigate the separation method of main and foreign water for the measuring weirs of Danjiangkou earth-rock dam. In the following, the developed method is used to separate the main and foreign water for the three measuring weirs (i.e., Xianfenggou (WE01XFG), left bank junction (WE01ZXD) and right bank junction (WE01YXD) weirs, as shown in Figure 3) of Danjiangkou earth-rock dam.
3.2. Statistical Model
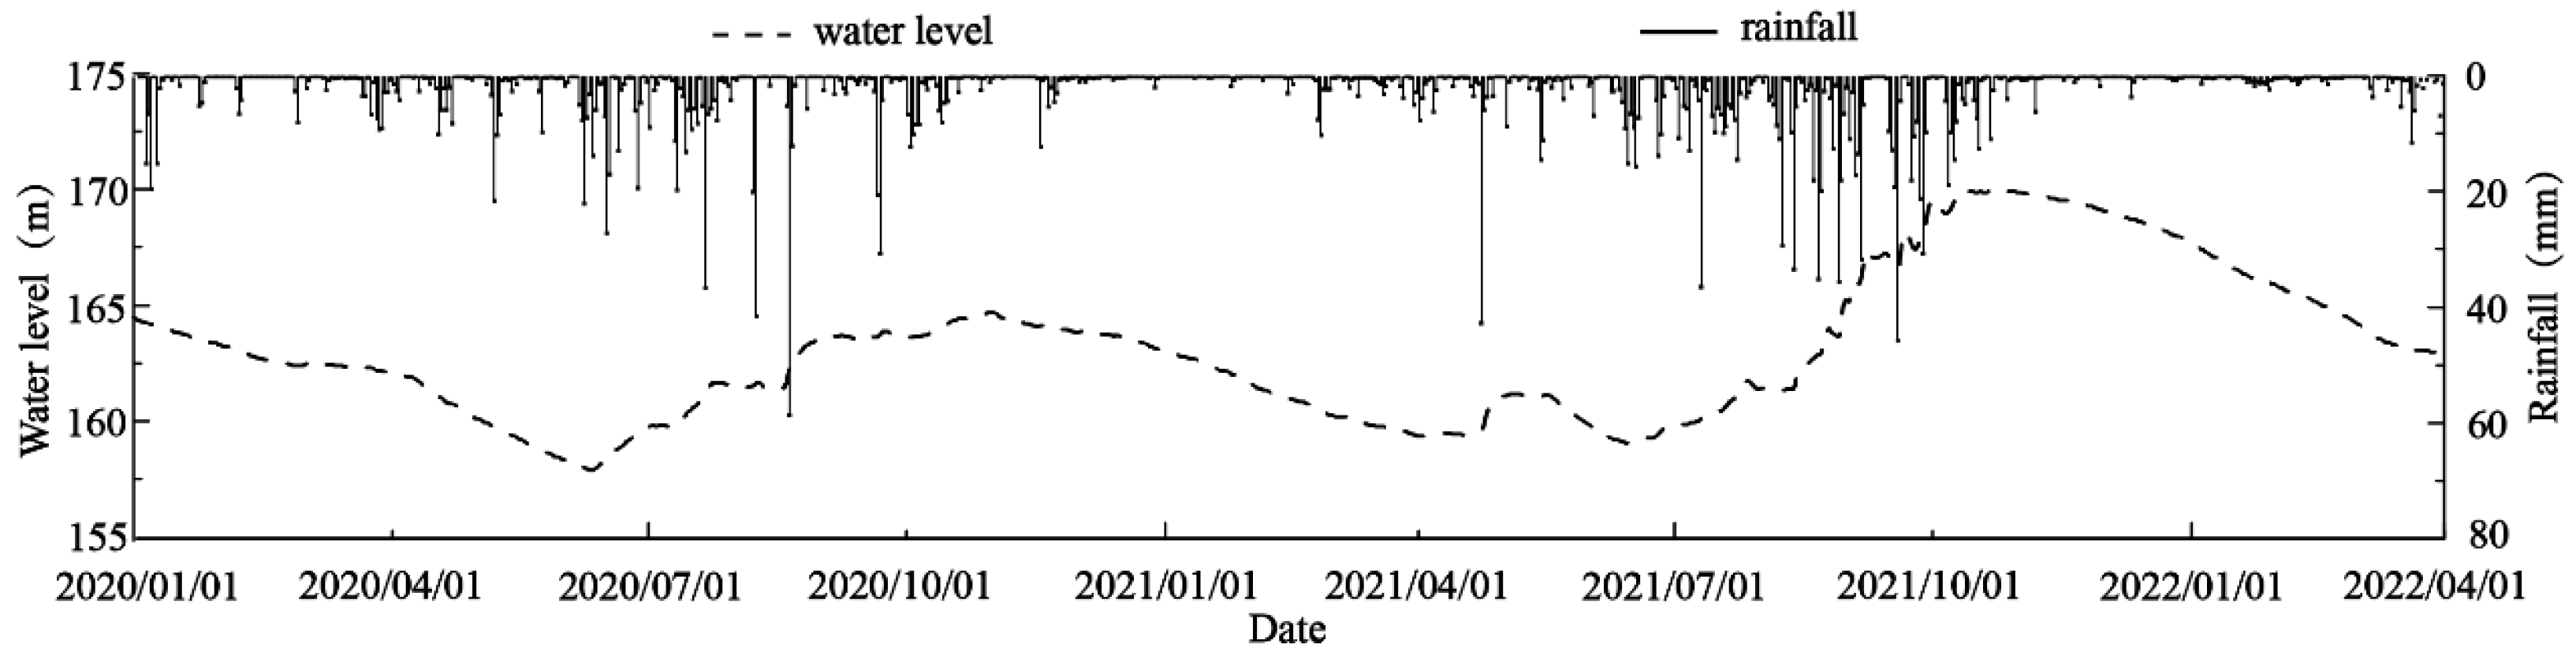
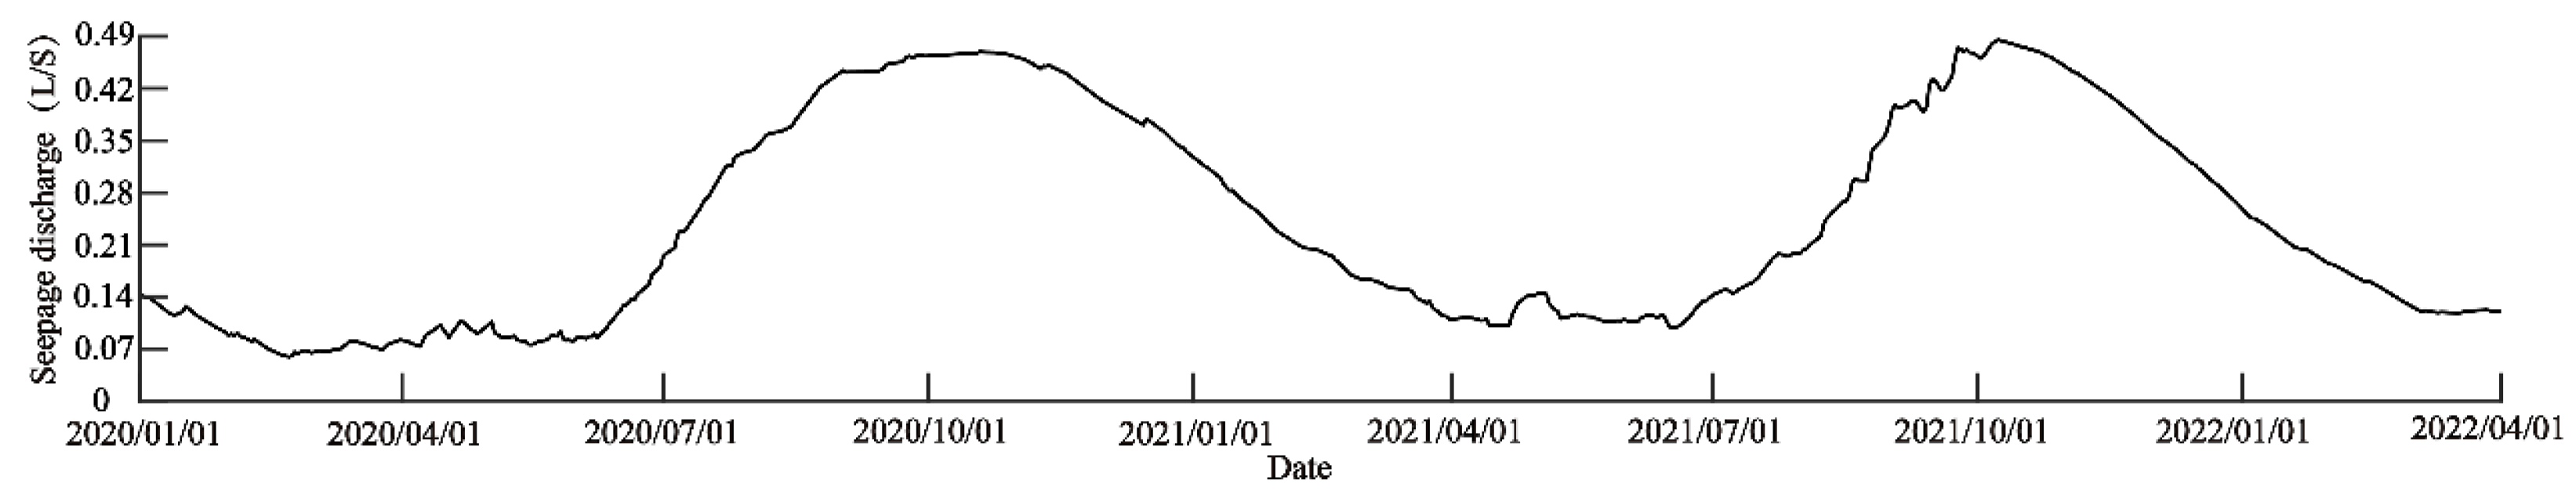
The data of three measuring weirs (i.e., WE01XFG, WE01ZXD and WE01YXD) of the Danjiangkou earth-rock dam are selected as the dependent variable data of the statistical model. One group of data is sampled every day to model the data from January 2020 to April 2022. The reservoir water level and rainfall of the Danjiangkou earth-rock dam are shown in Figure 4.
Taking WE01XFG as an example, the cross effectiveness of components extracted by the partial least squares method is , so four components are extracted, and the model accuracy can meet the requirements. Each component is as follows:
where * denotes that the variable is standardized.
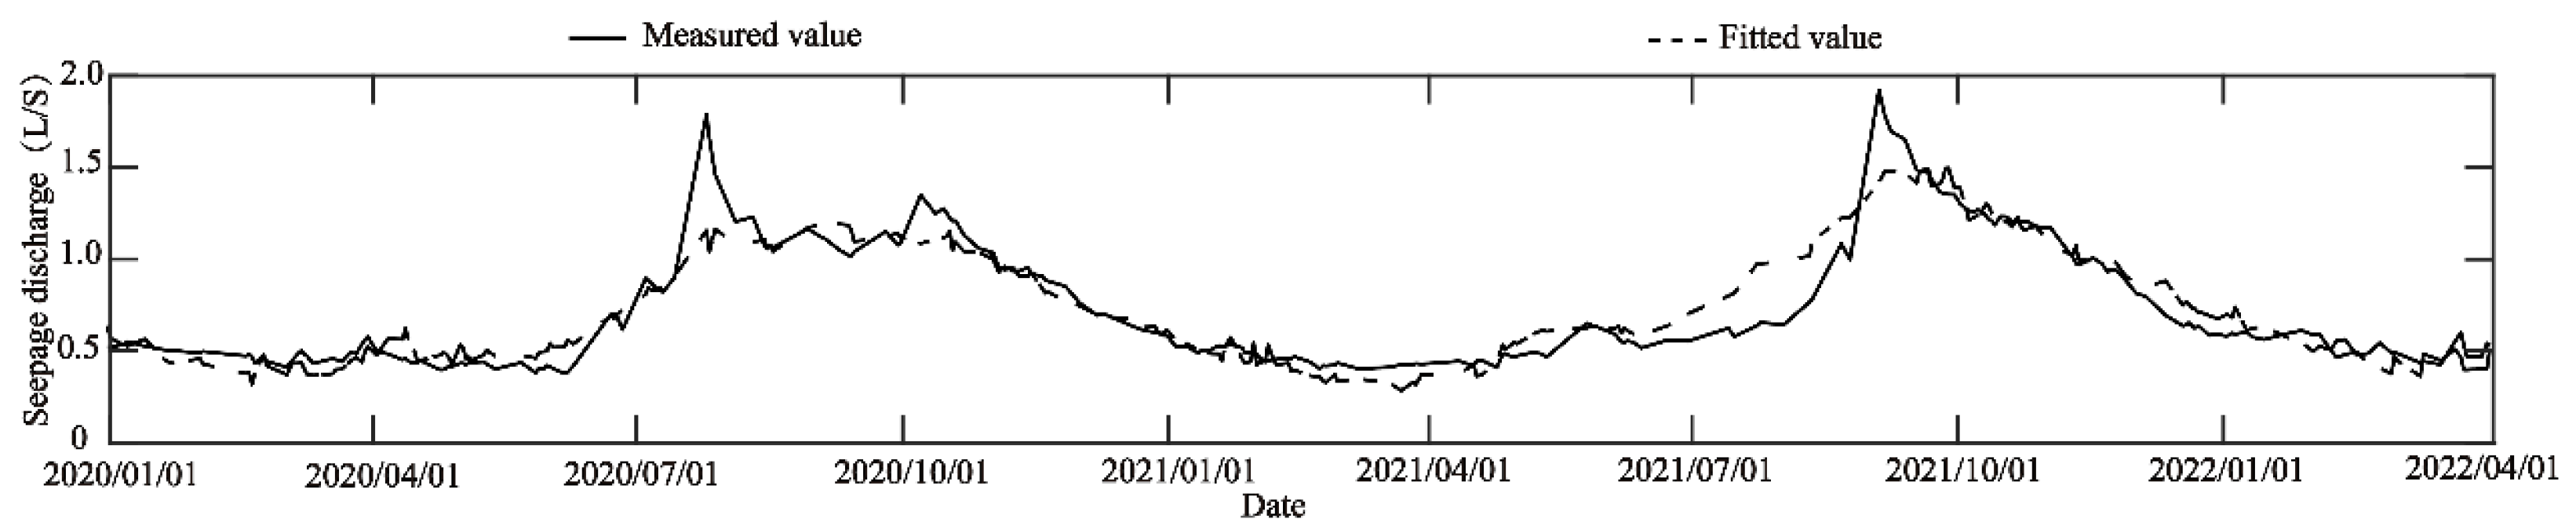
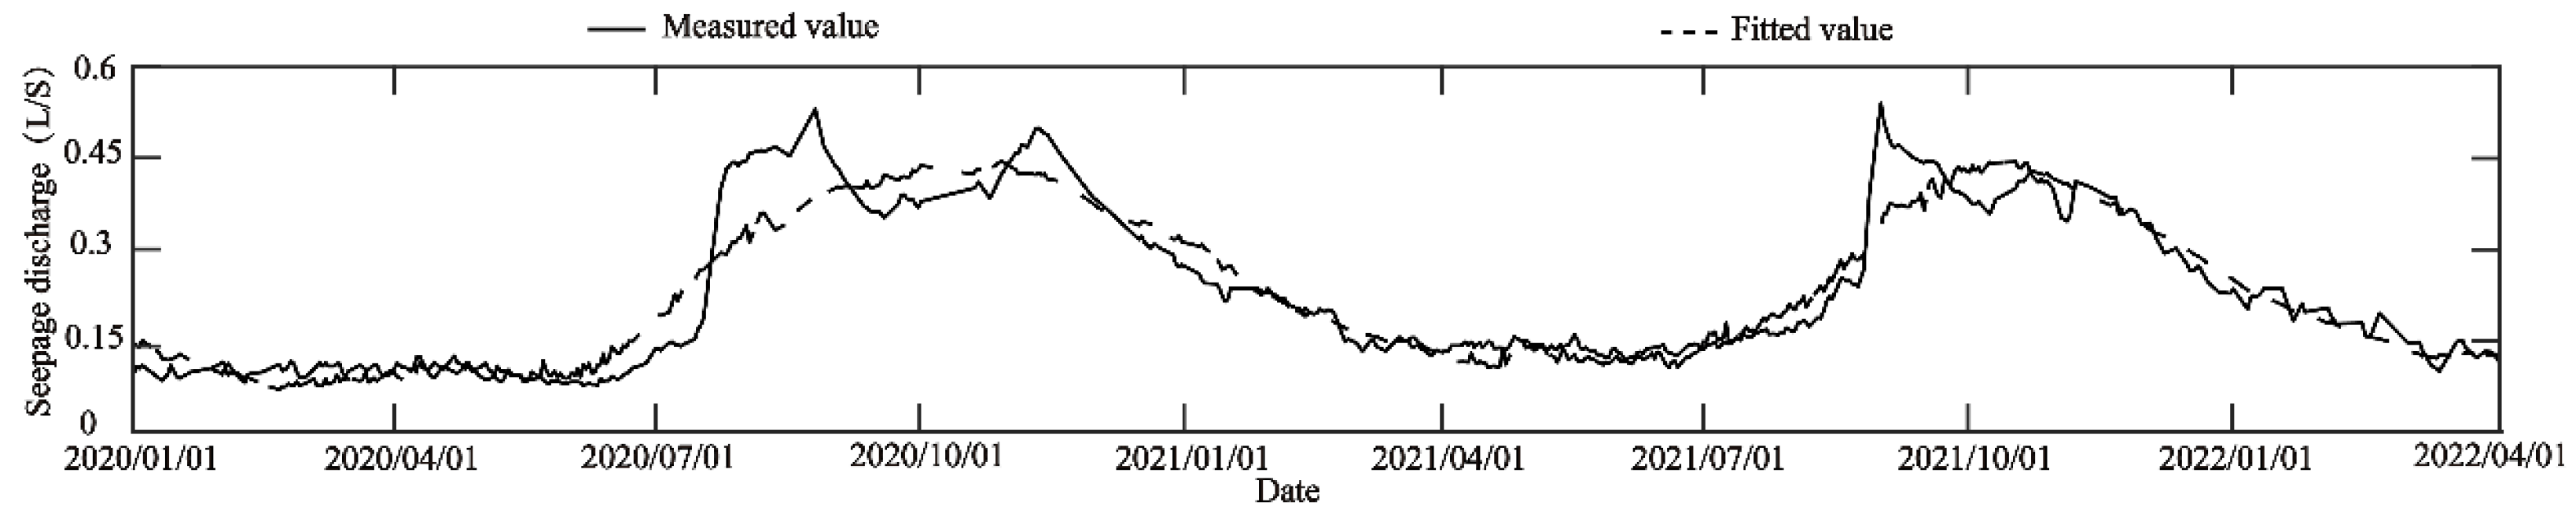
On this basis, statistical models of seepage discharge at three measuring points WE01XFG, WE01ZXD and WE01YXD are established. The regression coefficients, multiple correlation coefficients and residual standard deviations of the statistical models are given in Table 1, and Figure 5, Figure 6 and Figure 7 present the fitting process lines.
From the data in Table 1 and the fitting process lines, the complex correlation coefficients of the statistical models are about 0.95, and the models can better reflect the seepage situation of the measuring weirs of the earth-rock dam. In some cases, the fitting effect is slightly poor. For example, in August each year, the rainfall suddenly increases, leading to a sharp increase in seepage discharge.
3.3. Separation of Main and Foreign Water for the Measuring Weirs
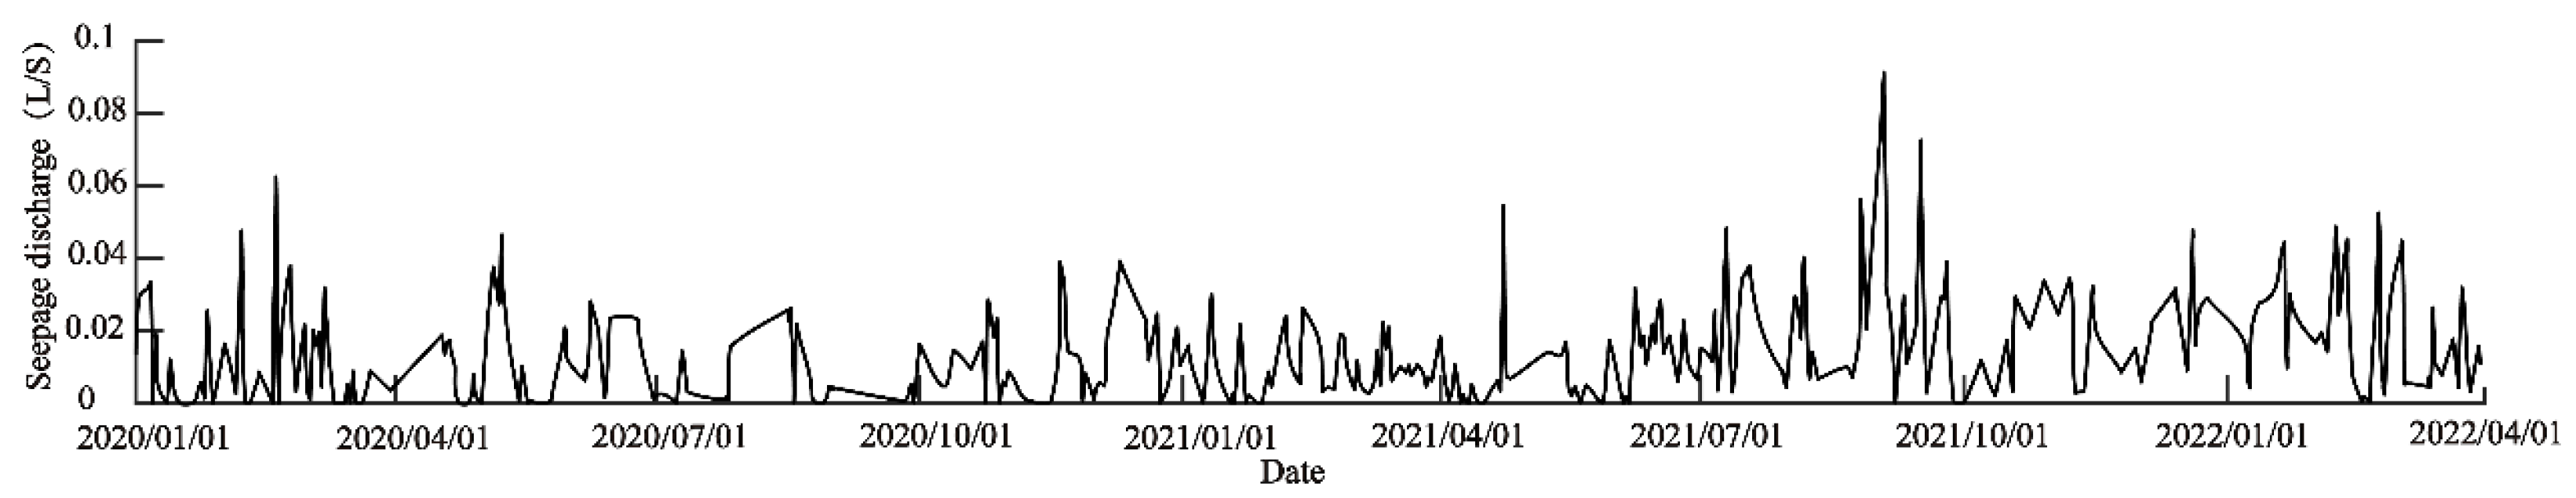
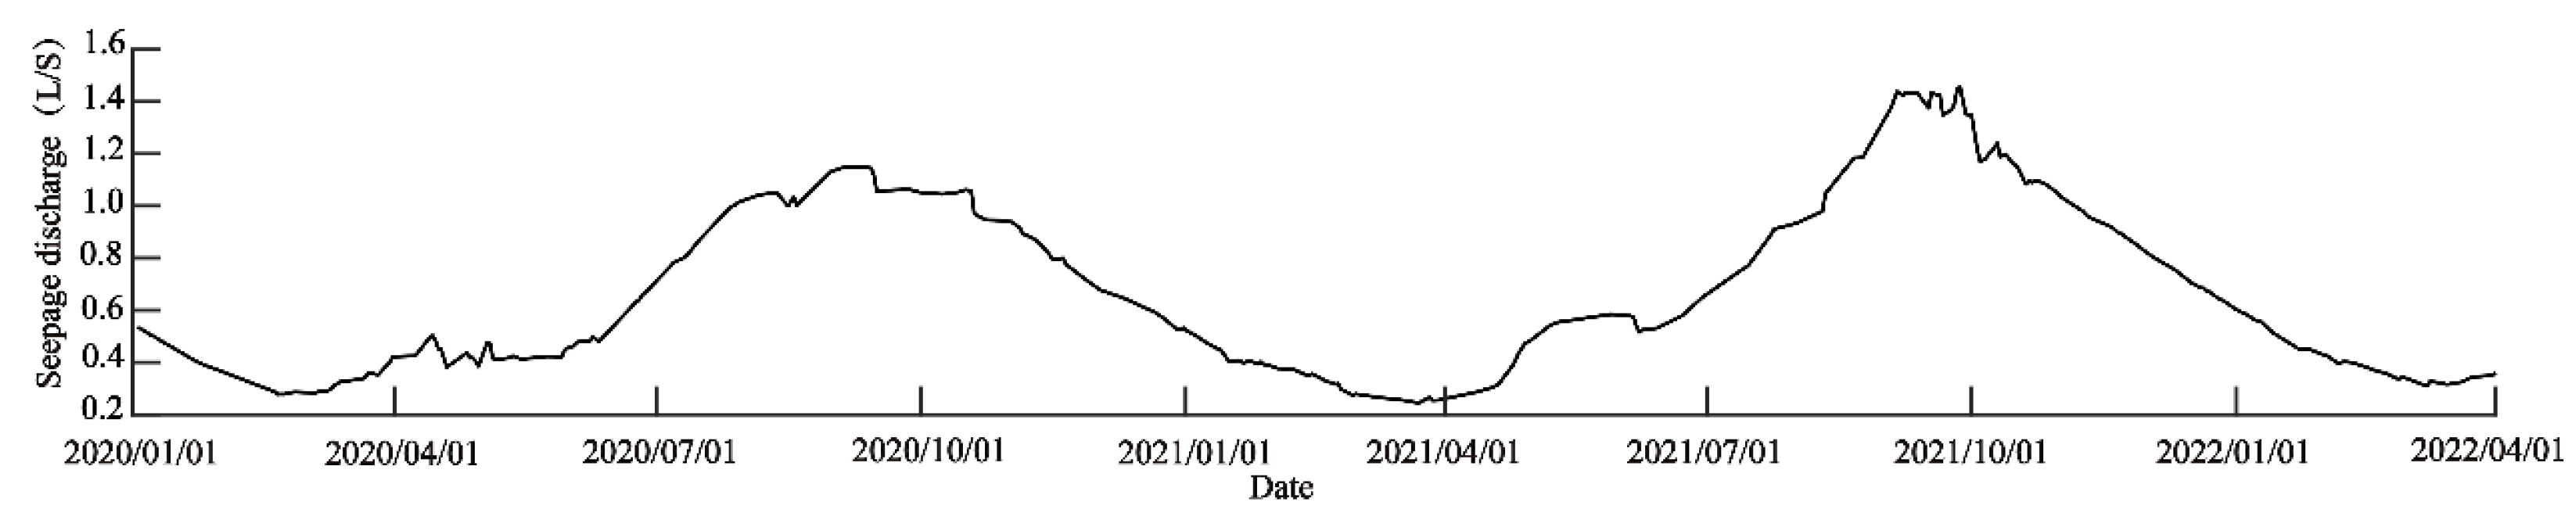
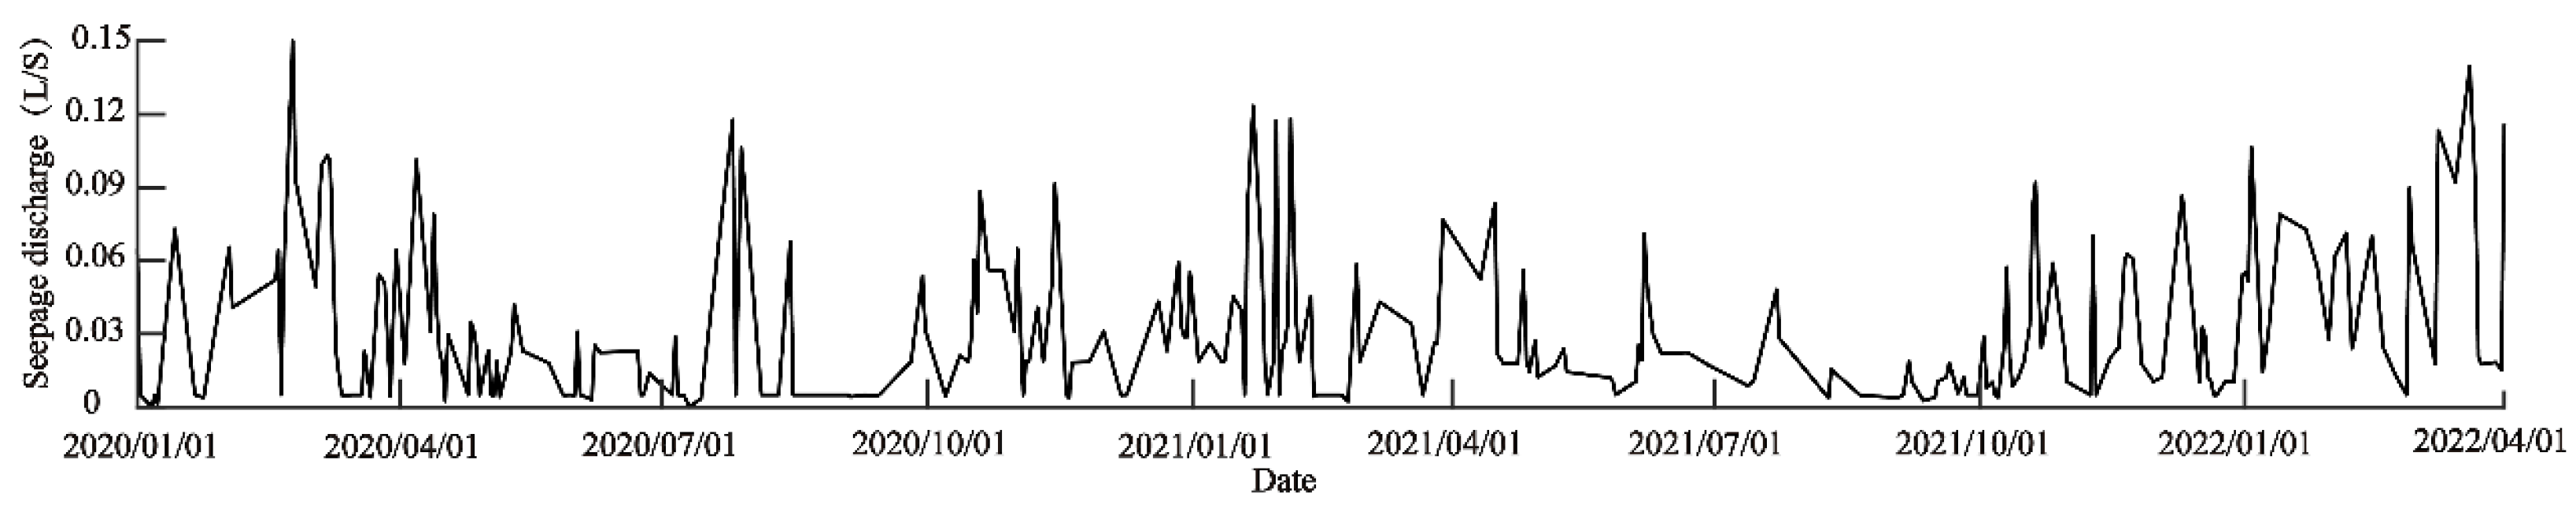
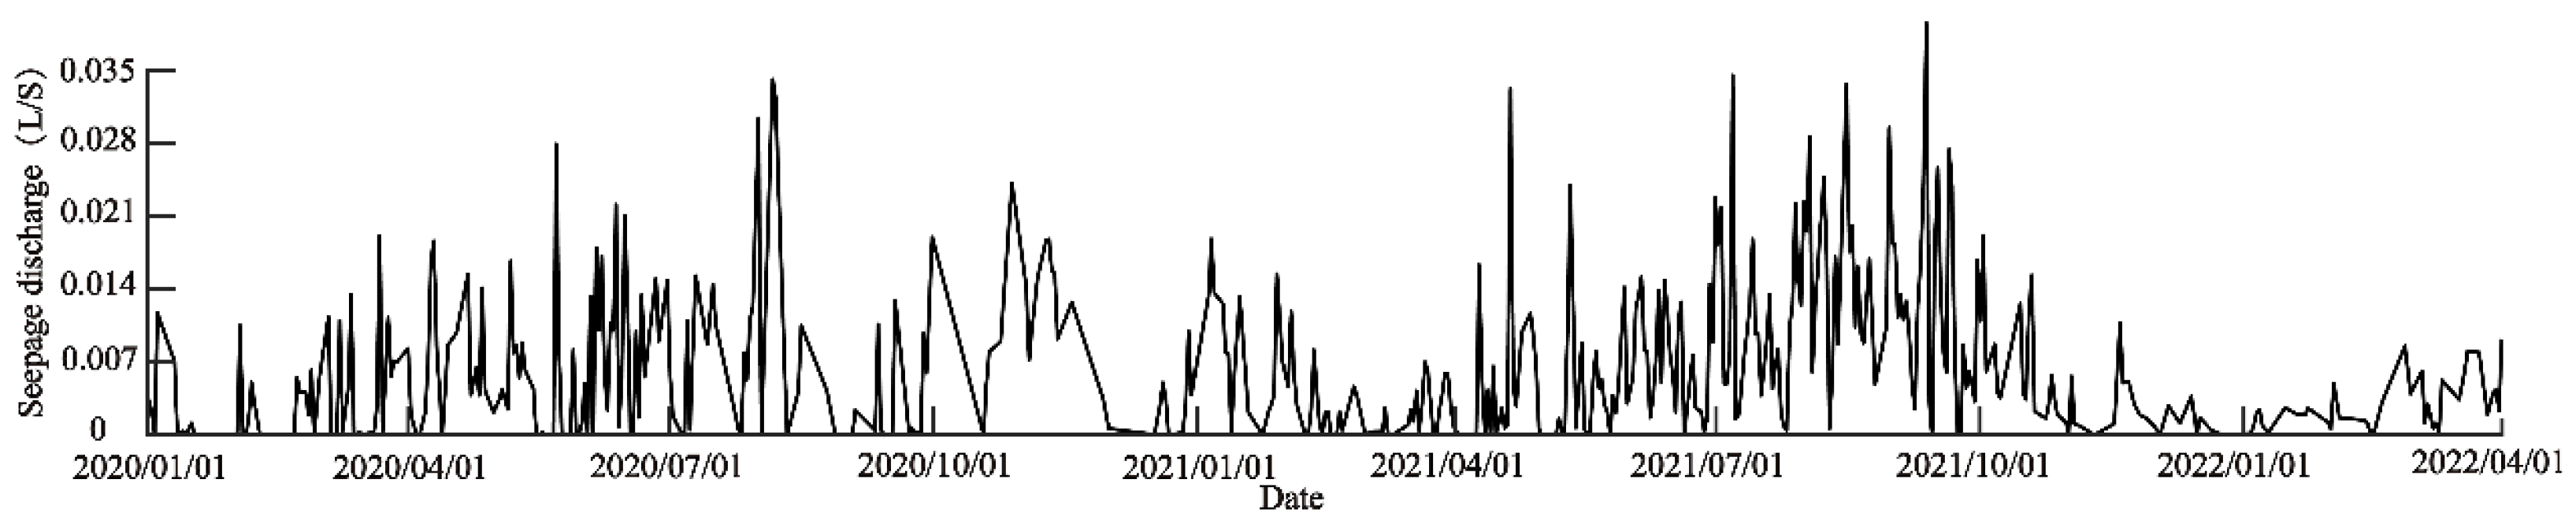
The partial least squares method eliminates the correlation between factors, and the variables in the final statistical model equation have been standardized to eliminate the impact of dimensions; that is, the respective variable coefficients in Table 1 can represent the impact value of the independent variable on the effect quantity. Figure 8, Figure 9, Figure 10, Figure 11, Figure 12 and Figure 13 present the main and foreign water of the seepage discharge separated by the partial least square method.
From the separated seepage discharge, it can be found that the reservoir water level and seepage discharge show a positive correlation and a certain time lag. The process line of the main water seepage discharge not only keeps consistent with the change of the measured value in trend but also coincides well with the peak time. The total amount of foreign water seepage discharge is not large, and the foreign water seepage discharge will increase after excessive rainfall. The rainfall lag time of measuring weir points at different locations is also different, which generally conforms to the seepage law of earth-rock dam.
One of the main causes of the failure of earth dams is uncontrolled seepage from the core and foundation of the dam [3]. After separating the seepage discharge caused by the reservoir water from the whole seepage discharge in the measuring weir, we can evaluate the seepage safety state and carry out dam risk management.
4. Conclusions
Based on the regression method, a method of main and foreign water separation of water measuring weir is constructed, and it is applied to Danjiangkou earth-rock dam. The following conclusions are obtained:
- (1)
- Normal distribution function and Rayleigh distribution function can effectively describe the lag effect of reservoir water level and rainfall on earth-rock dam seepage. The grey wolf algorithm can efficiently solve the optimal lag effect parameters of reservoir water level and rainfall.
- (2)
- The overall fitting accuracy of the statistical model is very high, the multi-correlation coefficients are about 0.95 and the residual standard deviations are smaller than 0.09. However, the fitting effect will be reduced and needs to be improved in the case of excessive rainfall leading to a seepage surge.
- (3)
- The correlation between the factors can be significantly reduced by extracting the influence factor components through the partial least square method, and then the main and foreign water of the seepage discharge of the measuring weir can be separated with higher accuracy.
- (4)
- The separated main and foreign water seepage discharge conform to the general law of earth-rock dam seepage, which verifies the effectiveness of this method.
Author Contributions
Conceptualization, W.F. and T.Y.; methodology, W.Z.; software, C.Z.; validation, W.F., W.Z. and C.Z.; formal analysis, Z.X.; investigation, W.F.; resources, W.Z.; data curation, Z.X.; writing—original draft preparation, W.F.; writing—review and editing, T.Y.; visualization, Z.X.; supervision, T.Y.; project administration, T.Y.; funding acquisition, W.F. All authors have read and agreed to the published version of the manuscript.
Funding
This work is supported by the Jiangsu Province Water Conservancy Science and Technology Project (Grant No. 2021073). The financial support is gratefully acknowledged.
Data Availability Statement
Not applicable.
Conflicts of Interest
The authors declare no conflict of interest.
References
- Su, H.Z.; Wen, Z.P.; Qian, C. Cellular automata-based analysis for seepage failure process of earth-rock dam. Struct. Control Health Monit. 2020, 27, e2553. [Google Scholar] [CrossRef]
- Jiang, S.H.; Fan, Z.W. Earth-rockfill dam safety classification and risk rate assessment on flood control. J. Hydraul. Eng. 2008, 39, 35–40. [Google Scholar]
- Beiranvand, B.; Rajaee, T. Application of artificial intelligence-based single and hybrid models in predicting seepage and pore water pressure of dams: A state-of-the-art review. Adv. Eng. Softw. 2022, 173, 103268. [Google Scholar] [CrossRef]
- Xiang, Y.; Fu, S.; Zhu, K.; Yuan, H.; Fang, Z. Seepage safety monitoring model for an earth rock dam under influence of high-impact typhoons based on particle swarm optimization algorithm. Water Sci. Eng. 2017, 10, 70–77. [Google Scholar] [CrossRef]
- Johari, A.; Talebi, A. Stochastic analysis of rainfall-induced slope instability and steady-state seepage flow using random finite-element method. Int. J. Geomech. 2019, 19, 04019085. [Google Scholar] [CrossRef]
- Cheng, X.S.; Zhang, W.L.; Fan, J.; Zhang, X.Y.; Liu, H.B.; Zhou, X.H. Seismic stability of Loess tunnel with rainfall seepage. Adv. Civ. Eng. 2020, 2020, 8147950. [Google Scholar] [CrossRef]
- Tian, D.F.; Zheng, H.; Liu, D.F. A 2D integrated FEM model for surface water-groundwater flow of slopes under rainfall condition. Landslides 2017, 14, 577–593. [Google Scholar] [CrossRef]
- Leshchinsky, B.; Vahedifard, F.; Koo, H.B.; Kim, S.H. Yumokjeong Landslide: An investigation of progressive failure of a hillslope using the finite element method. Landslides 2015, 12, 997–1005. [Google Scholar] [CrossRef]
- Liu, D.W.; Zheng, F.G.; Hu, S.W. Soil slope stability analysis under rainfall infiltration. J. Food Agric. Environ. 2013, 11, 713–717. [Google Scholar]
- Moayedi, H.; Huat, B.B.K.; Ali, T.A.M.; Asadi, A.; Moayedi, F.; Mokhberi, M. Preventing landslides in times of rainfall: Case study and FEM analyses. Disaster Prev. Manag. 2011, 20, 115–124. [Google Scholar] [CrossRef] [Green Version]
- Konishi, S.; Kitagawa, G. Information Criteria and Statistical Modeling; Springer: Berlin/Heidelberg, Germany, 2008. [Google Scholar]
- Hu, J.; Ma, F. Statistical modelling for high arch dam deformation during the initial impoundment period. Struct. Control Health Monit. 2020, 27, e2638. [Google Scholar] [CrossRef]
- Yuan, D.; Wei, B.; Xie, B.; Zhong, Z. Modified dam deformation monitoring model considering periodic component contained in residual sequence. Struct. Control Health Monit. 2020, 27, e2633. [Google Scholar] [CrossRef]
- Yang, S.L.; Han, X.J.; Kuang, C.F.; Fang, W.H.; Zhang, J.F.; Yu, T.T. Comparative study on deformation prediction models of Wuqiangxi concrete gravity dam based on monitoring data. Comput. Model. Eng. Sci. 2022, 131, 49–72. [Google Scholar] [CrossRef]
- Wei, B.W.; Gu, M.H.; Li, H.K.; Xiong, W.; Xu, Z.K. Modeling method for predicting seepage of RCC dams considering time-varying and lag effect. Struct. Control Health Monit. 2018, 25, e2081. [Google Scholar] [CrossRef]
- Bao, T.F.; Wu, Z.R. Analysis of observed uplift pressure for xin an jiang dam. Hydropower Autom. Dam Monit. 2003, 27, 63–67. [Google Scholar]
- Nie, X.J.; Gu, C.S. Seepage behavior and its abnormality analysis for xiang hong dian dam. Hydropower Autom. Dam Monit. 2004, 28, 49–51, 55. [Google Scholar]
- Hu, J.; Ma, F.H. Comprehensive investigation method for sudden increases of uplift pressures beneath gravity dams: Case study. J. Perform. Constr. Facil. 2016, 30, 04016023. [Google Scholar] [CrossRef]
- Huo, J.X.; Song, H.Z.; Wu, Z.W.; Cheng, J. Seepage statistical model based on lag effect for pumped storage power stations. Hydropower Autom. Dam Monit. 2011, 35, 59–63. [Google Scholar]
- Zhang, Q.F.; Gu, C.S.; Wu, Z.R. Seepage flow monitoring model for rockfill-earth dams based on lag effect. J. Hydraul. Eng. 2001, 32, 85–90. [Google Scholar]
- Zhang, K.; Gu, C.; Zhu, Y.; Chen, S.; Dai, B.; Li, Y.; Shu, X. A novel seepage behavior prediction and lag process identification method for concrete dams using HGWO-XGBoost model. IEEE Access 2021, 9, 23311–23325. [Google Scholar] [CrossRef]
- Huang, H.; Chen, B. Dam seepage monitoring model based on dynamic effect weight of reservoir water level. Energy Procedia 2012, 16, 159–165. [Google Scholar] [CrossRef] [Green Version]
- Shi, Z.; Gu, C.; Zhao, E.; Xu, B. A novel seepage safety monitoring model of CFRD with slab cracks using monitoring data. Math. Probl. Eng. 2020, 2020, 1641747. [Google Scholar] [CrossRef]
- Zhao, M.; Jiang, H.; Chen, S.; Bie, Y. Prediction of seepage pressure based on memory cells and significance analysis of influencing factors. Complexity 2021, 2021, 5576148. [Google Scholar] [CrossRef]
- Wang, S.W.; Xu, Y.L.; Gu, C.S.; Bao, T.F. Monitoring models for base flow effect and daily variation of dam seepage elements considering time lag effect. Water Sci. Eng. 2018, 11, 344–354. [Google Scholar] [CrossRef]
- Wang, S.W.; Bao, T.F. Monitoring model for dam seepage based on lag effect. Appl. Mech. Mater. 2013, 353–356, 2456–2462. [Google Scholar] [CrossRef]
- Shi, Y.Q.; Zhao, C.; Peng, Z.Q.; Yang, H.Y.; He, J.P. Analysis of the lag effect of embankment dam seepage based on delayed mutual information. Eng. Geol. 2018, 234, 132–137. [Google Scholar] [CrossRef]
- Sharghi, E.; Nourani, V.; Behfar, N. Earthfill dam seepage analysis using ensemble artificial intelligence based modeling. J. Hydroinformatics 2018, 20, 1071–1084. [Google Scholar] [CrossRef]
- Wang, A.; Yang, X.; Guo, D. The application of seepage flow prediction in Nuer dam based on the grey self-memory model. Geofluids 2022, 2022, 6211685. [Google Scholar] [CrossRef]
- Chen, S.; Gu, C.; Lin, C.; Wang, Y.; Hariri-Ardebili, M.A. Prediction, monitoring, and interpretation of dam leakage flow via adaptative kernel extreme learning machine. Measurement 2020, 166, 108161. [Google Scholar] [CrossRef]
- Salazar, F.; Toledo, M.A.; Oñate, E.; Suárez, B. Interpretation of dam deformation and leakage with boosted regression trees. Eng. Struct. 2016, 119, 230–251. [Google Scholar] [CrossRef] [Green Version]
- Song, J.; Yuan, S.; Duan, M.; Yang, J.; Zeng, Z.; Huag, Y. Earth-rock dams seepage pressure monitoring model based on the sparrow search algorithm and the hysteresis effect. Adv. Sci. Technol. Water Resour. 2022, 42, 52–57+120. [Google Scholar]
- Cheng, X.; Li, Q.; Zhou, W.; Zhou, Z. External deformation monitoring and improved partial least squares data analysis methods of high core rock-fill Dam (HCRFD). Sensors 2020, 20, 444. [Google Scholar] [CrossRef] [Green Version]
- Huang, H.; Chen, B.; Liu, C. Safety monitoring of a super-high dam using optimal kernel partial least squares. Math. Probl. Eng. 2015, 2015, 571594. [Google Scholar] [CrossRef] [Green Version]
- Mirjalili, S.; Mirjalili, S.M.; Lewis, A. Grey wolf optimizer. Adv. Eng. Softw. 2014, 69, 46–61. [Google Scholar] [CrossRef] [Green Version]
- He, Z.H.; Jin, G.; Wang, Y.J. A novel grey wolf optimizer and its applications in 5G frequency selection surface design. Front. Inf. Technol. Electron. Eng. 2022, 23, 1338–1353. [Google Scholar] [CrossRef]
Figure 1.
The schematic diagram of the layout of the Danjiangkou water control project.

Figure 2.
The diagrams of the earth-rock structure (Unit: cm for the structure and m for the elevation).
Figure 2.
The diagrams of the earth-rock structure (Unit: cm for the structure and m for the elevation).

Figure 3.
The locations of three measuring weirs.

Figure 4.
Reservoir water level and rainfall distribution.

Figure 5.
Fitting process line of seepage discharge at measuring point WE01XFG.

Figure 6.
Fitting process line of seepage discharge at measuring point WE01YXD.

Figure 7.
Fitting process line of seepage discharge at measuring point WE01ZXD.

Figure 8.
Process line of main water of seepage discharge at measuring point WE01XFG.

Figure 9.
Process line of foreign water of seepage discharge at measuring point WE01XFG.

Figure 10.
Process line of main water of seepage discharge at measuring point WE01YXD.

Figure 11.
Process line of foreign water of seepage discharge at measuring point WE01YXD.

Figure 12.
Process line of main water of seepage discharge at measuring point WE01ZXD.

Figure 13.
Process line of foreign water of seepage discharge at measuring point WE01ZXD.


Table 1.
Regression coefficients and characteristic values of seepage statistical models.
| WE01XFG | WE01ZXD | WE01YXD | |
|---|---|---|---|
| −6.12475 | −0.37834 | −1.62599 | |
| 0.02762 | 0.01090 | 0.03447 | |
| 0.00012 | 0.00005 | 0.00015 | |
| 196.15377 | −86.40445 | −284.75328 | |
| 0.02236 | 0.00752 | 0.03731 | |
| 0.00079 | 0.00074 | −0.00027 | |
| 28.02389 | 13.83270 | 26.42021 | |
| −0.26945 | 0.11529 | 0.27446 | |
| −0.22962 | 0.03136 | 0.10285 | |
| −0.00463 | −0.00170 | 0.00011 | |
| −0.15639 | −0.01281 | 0.03411 | |
| (Multi-correlation coefficient) | 0.95610 | 0.94490 | 0.94600 |
| (Residual standard deviation) | 0.06880 | 0.08870 | 0.07190 |
Publisher’s Note: MDPI stays neutral with regard to jurisdictional claims in published maps and institutional affiliations. |
© 2022 by the authors. Licensee MDPI, Basel, Switzerland. This article is an open access article distributed under the terms and conditions of the Creative Commons Attribution (CC BY) license (https://creativecommons.org/licenses/by/4.0/).
Share and Cite
MDPI and ACS Style
Fang, W.; Zhang, W.; Zhang, C.; Xie, Z.; Yu, T. Separation Method of Main and Foreign Water for the Measuring Weirs of Danjiangkou Earth-Rock Dam. Water 2022, 14, 3620. https://doi.org/10.3390/w14223620
AMA Style
Fang W, Zhang W, Zhang C, Xie Z, Yu T. Separation Method of Main and Foreign Water for the Measuring Weirs of Danjiangkou Earth-Rock Dam. Water. 2022; 14(22):3620. https://doi.org/10.3390/w14223620
Chicago/Turabian StyleFang, Weihua, Weiping Zhang, Chenghan Zhang, Zhiwen Xie, and Tiantang Yu. 2022. "Separation Method of Main and Foreign Water for the Measuring Weirs of Danjiangkou Earth-Rock Dam" Water 14, no. 22: 3620. https://doi.org/10.3390/w14223620
Note that from the first issue of 2016, this journal uses article numbers instead of page numbers. See further details here.