
COVID-19 Lockdowns Promoted Recovery of the Yangtze River’s Aquatic Ecosystem

1
Wuxi Fisheries College, Nanjing Agricultural University, Wuxi 214081, China
2
Key Laboratory of Freshwater Biodiversity Conservation, Ministry of Agriculture and Rural Affairs, Yangtze River Fisheries Research Institute, Chinese Academy of Fishery Sciences, Wuhan 430223, China
*
Author to whom correspondence should be addressed.
Water 2022, 14(22), 3622; https://doi.org/10.3390/w14223622
Submission received: 18 October 2022
/
Revised: 3 November 2022
/
Accepted: 5 November 2022
/
Published: 10 November 2022
(This article belongs to the Special Issue Biodiversity and Conservation of Freshwater Ecosystems)
Abstract
:The impacts of COVID-19 lockdowns on human life, air quality, and river water quality around the world have received significant attention. In comparison, assessments of the implications for freshwater ecosystems are relatively rare. This study explored the impact of COVID-19 lockdowns on aquatic ecosystems in the Yangtze River by comparing river water quality, phytoplankton, zooplankton, and fish data collected at the site in the middle reach of the Yangtze River in 2018 and 2020. The results show that during COVID-19 lockdowns, the reduction in industrial and domestic effluent discharge led to a reduction in organic pollution and industrial plant nutrient pollution in rivers. Among them, PO43−−P, CODMn, and TP were significantly decreased (p < 0.05). During lockdowns, nutrient supplies such as TN and TP were reduced, which led to inhibition of algae growth and decreased phytoplankton abundance. Phytoplankton affects the abundance of zooplankton through a bottom-up effect, and a decrease in phytoplankton density leads to a decrease in zooplankton density. The decrease in plankton density led to lower primary productivity in rivers, reduced fish feed supplies, intensified competition among fish populations, with increases in population dominated by high trophic level carnivorous fish. In addition, the decrease in fishing intensity has contributed to an increase in the number of rivers–sea migratory fish; the fish community was earlier mainly dominated by small-sized species with a short life cycle, and the number of supplementary populations has now increased. As a consequence, the fish community structure shows a tendency toward high complexity and high fish diversity. Overall, these observations demonstrate that the rapid revival of the retrogressive Yangtze River ecosystem is possible through limitation of anthropic interferences.
1. Introduction
Freshwater ecosystems are among the most threatened in the world [1], and the loss of biodiversity in freshwater systems exceeds that of terrestrial and marine environments [2]. Freshwater biodiversity is widely acknowledged as being in crisis [3]; according to the International Union for the Conservation of Nature (IUCN) Red List of Threatened Species, one in three freshwater species is under threat. The rate of decline of vertebrate populations is much higher in freshwater (81%) than in terrestrial (38%) and marine (36%) environments [4]. After amphibians, freshwater fish species are the most threatened group of vertebrates. Freshwaters—lakes, rivers, wetlands, including floodplains—have always played a major role in the history of humankind and the goods and services they provide are of key importance to our survival and well-being. For example, food supply, water purification, flood regulation, carbon sequestration, transportation, etc. [5] However, freshwater biodiversity is experiencing unprecedented and growing pressure from human activities [6]. At the same time, more than 60% of freshwater habitats are moderately or highly threatened due to human overexploitation [7]. Threats to freshwater ecosystems by human activities are many and varied, spanning long-standing [8] as well as emerging [9] threats. Therefore, assessing the impact of human activities on freshwater ecosystems is of great significance for the conservation and restoration of freshwater ecosystems.
The coronavirus pandemic, also known as the COVID-19 pandemic, took over the world almost instantaneously and has impacted ~220 countries or territories around the world. It is one of the deadliest pandemics in history [10]. According to the WHO COVID-19 Dashboard (https://covid19.who.int/) (accessed on 3 November 2022), as of 2 November 2022, 628 million people have been infected with the coronavirus leading to over 6.57 million deaths worldwide. COVID-19 is principally spread via respiratory tract with high infectivity. Droplet transmission is the predominant route of contagion from person to person [11]. However, there are other routes besides respiratory transmission. Studies reported SARS-CoV-2 shedding in human stool [12], and therefore in wastewater. Such as suspended particles in wastewater not only can serve as reservoirs for SARS-CoV-2, but also maintain its activity by defending it from the oxidizing agents prevailing in wastewater [13]. Currently, the fate of SARS-CoV-2 in WWTP and its ultimate removal at different stages of treatment remains unexplored and requires urgent attention, especially where treated wastewater is utilized as reclaimed water [14]. To slow down diffusion of the virus, more than 170 countries imposed different modalities of nationwide lockdowns [15]. During lockdown periods, industries and businesses were shut down, and large portions of society were isolated, reducing the regional and global movements of people [16]. The implementation of worldwide lockdowns offers an unprecedented opportunity to study the impact of anthropogenic activities on the natural ecosystem [17]. Some studies, which examined restricted human activities during lockdowns, also concluded that lockdowns positively impacted riverine water and other aquatic ecosystems. For example, studies have reported that China’s COVID-19 lockdowns significantly reduced industrial pollution and improved the quality of the water environment [18]. In India, a reduction in pollution and shipping traffic improved the habitat quality in the Ganges River, facilitating spawning migrations of the anadromous hilsa (Tenualosa ilisha) (Hamilton, 1822) [19]. In that study, it was found that artificial noise associated with shipping was significantly reduced during the lockdown, thereby increasing the communication ranges of fish and dolphins by 65% [20]. Many studies across the world have suggested that COVID-19 lockdowns improved air quality by reducing levels of nitrogen dioxide (NO2), carbon dioxide (CO2), and particulate matter (PM2.5 or PM10) [21,22,23]. Freshwater ecosystems are closely linked with and therefore more vulnerable to human activity [24]. However, there has been less research on how to quantify the impact of COVID-19 lockdowns on freshwater ecosystems.
The Yangtze River is the third longest and third most water-rich river system in addition to being one of the most human-impacted of the large rivers in the world [25] due to overfishing, water pollution, species invasion, noise pollution, navigation, urbanization, lake reclamation, etc. [26]. As the first country impacted by COVID-19, China implemented local lockdowns that shut down industries and required people to stay at home between January and May 2020. COVID-19 lockdowns reduced the high intensity of human activity, and we predicted that less shipping traffic, lower fishing intensity, and fewer pollution emissions would have contributed to restoration of the Yangtze River aquatic ecosystem. In this study, we sought to quantify the impact of human activities on the aquatic ecosystem of the Yangtze River based on river water quality, phytoplankton, zooplankton, and fish data collected at the site in the middle reaches of the Yangtze River in 2018 and 2020. The findings provide a basis for the sustainable development of fish resources and a scientific foundation for the protection and management of Yangtze River aquatic ecosystems.
2. Materials and Methods
2.1. Study Area
The middle reaches of the Yangtze River, from Yichang in Hubei Province to the Hukou of Jiangxi Province, are 955 km in length and cover an area of 68 km2 [27]. The middle reaches of the Yangtze River are one of the regions of high population density in China. The basin is home to more than 0.13 billion people and generates approximately 46.9% of China’s gross domestic product (GDP). Moreover, the Yangtze River is the busiest river in the world in terms of inland vessel navigation, with numerous diverse watercrafts ranging from bamboo rafts to large cruise ships. In recent decades, the aquatic biodiversity of the middle reaches of the Yangtze River has been seriously threatened due to the rapid development and modernization of China’s economy [28] through damming, reclamation of lakes for farmland, waterway channel construction, and vessel navigation [29]. In this study, the Shishou (SS) and Jiayu (JY) reaches, which are middle reaches of the Yangtze River, were selected as the research areas (Figure 1). On the one hand, the SS and JY river reaches are important survey points for fishery resources and the environment in the middle reaches of the Yangtze River. The Yangtze River Fisheries Research Institute, Chinese Academy of Fishery Sciences, has been conducting year-round surveys at these locations since 2017 [30]. On the other hand, SS and JY, as important cities in the “Yangtze River Economic Belt”, have made significant contributions to the rapid development of China’s economy [31]. They are also one of the most heavily polluted urban-based river systems [32].
2.2. Data Collection
Samples were collected in July 2018 and July 2020. Water temperature (WT), dissolved oxygen (DO), pH, and oxidation–reduction potential (ORP) were determined in situ at each sampling site using a portable multiparameter water quality instrument (YSI Pro-Plus, YSI Inc., Yellow Springs, OH, USA). Three parallel water samples (1 L each) were collected at various points and stored in an incubator at a low temperature (4 °C). The samples were brought back to the laboratory for water quality index measurement within 48 h [33] to assess total nitrogen (TN), total phosphorus (TP), phosphate (PO43−-P), nitrate (NO3-N), potassium permanganate index (CODMn), and ammonia nitrogen (NH4+-N) based on Standard Methods for the Examination of Water and Wastewater [34].
Qualitative samples of phytoplankton were collected using a 25# plankton net; quantitative samples were collected using 1 L water collectors, and Lugol’s reagent was added to fix the sample after collection, which was then concentrated to 50 mL for 48 h in the dark for identification and counting. Qualitative samples of zooplankton were collected using 13# plankton nets, fixed with 4% formalin after collection, and identified under the microscope after precipitation concentration [35].
Fish were captured using the same fishing gear and methods; the fishing net included a fixed gill net (mesh size: 4~6 cm; mesh height: 0.6~1.5 cm; mesh length: 100~300 m), gill net (mesh sizes: 2.5, 3, 7, and 8 cm; mesh height: 2 m; mesh length: 100~300), and shrimp cage. Sampling started at dusk (approximately 18:00 h) and lasted 12 h through the night. All individuals were identified to species level based on Fishes of Sichuan [36]. Fish samples that could not be identified on the spot were fixed with 5~10% formalin solution, the fishing time and place were marked, and species identification was performed after being brought back to the laboratory. In the biological measurement of all catches, body length was accurately measured to 1 mm and body weight to 0.1 g.
2.3. Data Analysis
2.3.1. Statistical Analyses
Using Statistical Package for the Social Sciences (IBM SPSS Statistics version 26.0), linear regressions were conducted to investigate relationships among different variables. Student’s t-test was applied to determine whether changes in water quality indicators in 2018 and 2020 were significant. Correlation analyses with a significance level of p < 0.05 were reported as significant [37].
2.3.2. Ecological Types
The fish were then divided according to their lifestyle habits into river–lake migration, resident, and river–sea migration. River–lake migration fish are those that spawn in the flowing waters of rivers and are mainly fattened in lakes. Resident fish live in the same area of river their entire lives to breed and feed, with no obvious migratory behavior. River–sea fish are those that spawn in the flowing waters of rivers and are mainly fattened in the ocean. They can be divided into three types based on feeding habits: herbivorous fish, which feed on higher aquatic plants and lower algae; carnivorous fish, which feed on other fish, benthos, and zooplankton; omnivorous fish, which feed on aquatic plants, aquatic insects, small fish, shrimp, and mollusks [38].
2.3.3. Community Diversity
2.3.4. Community Stability
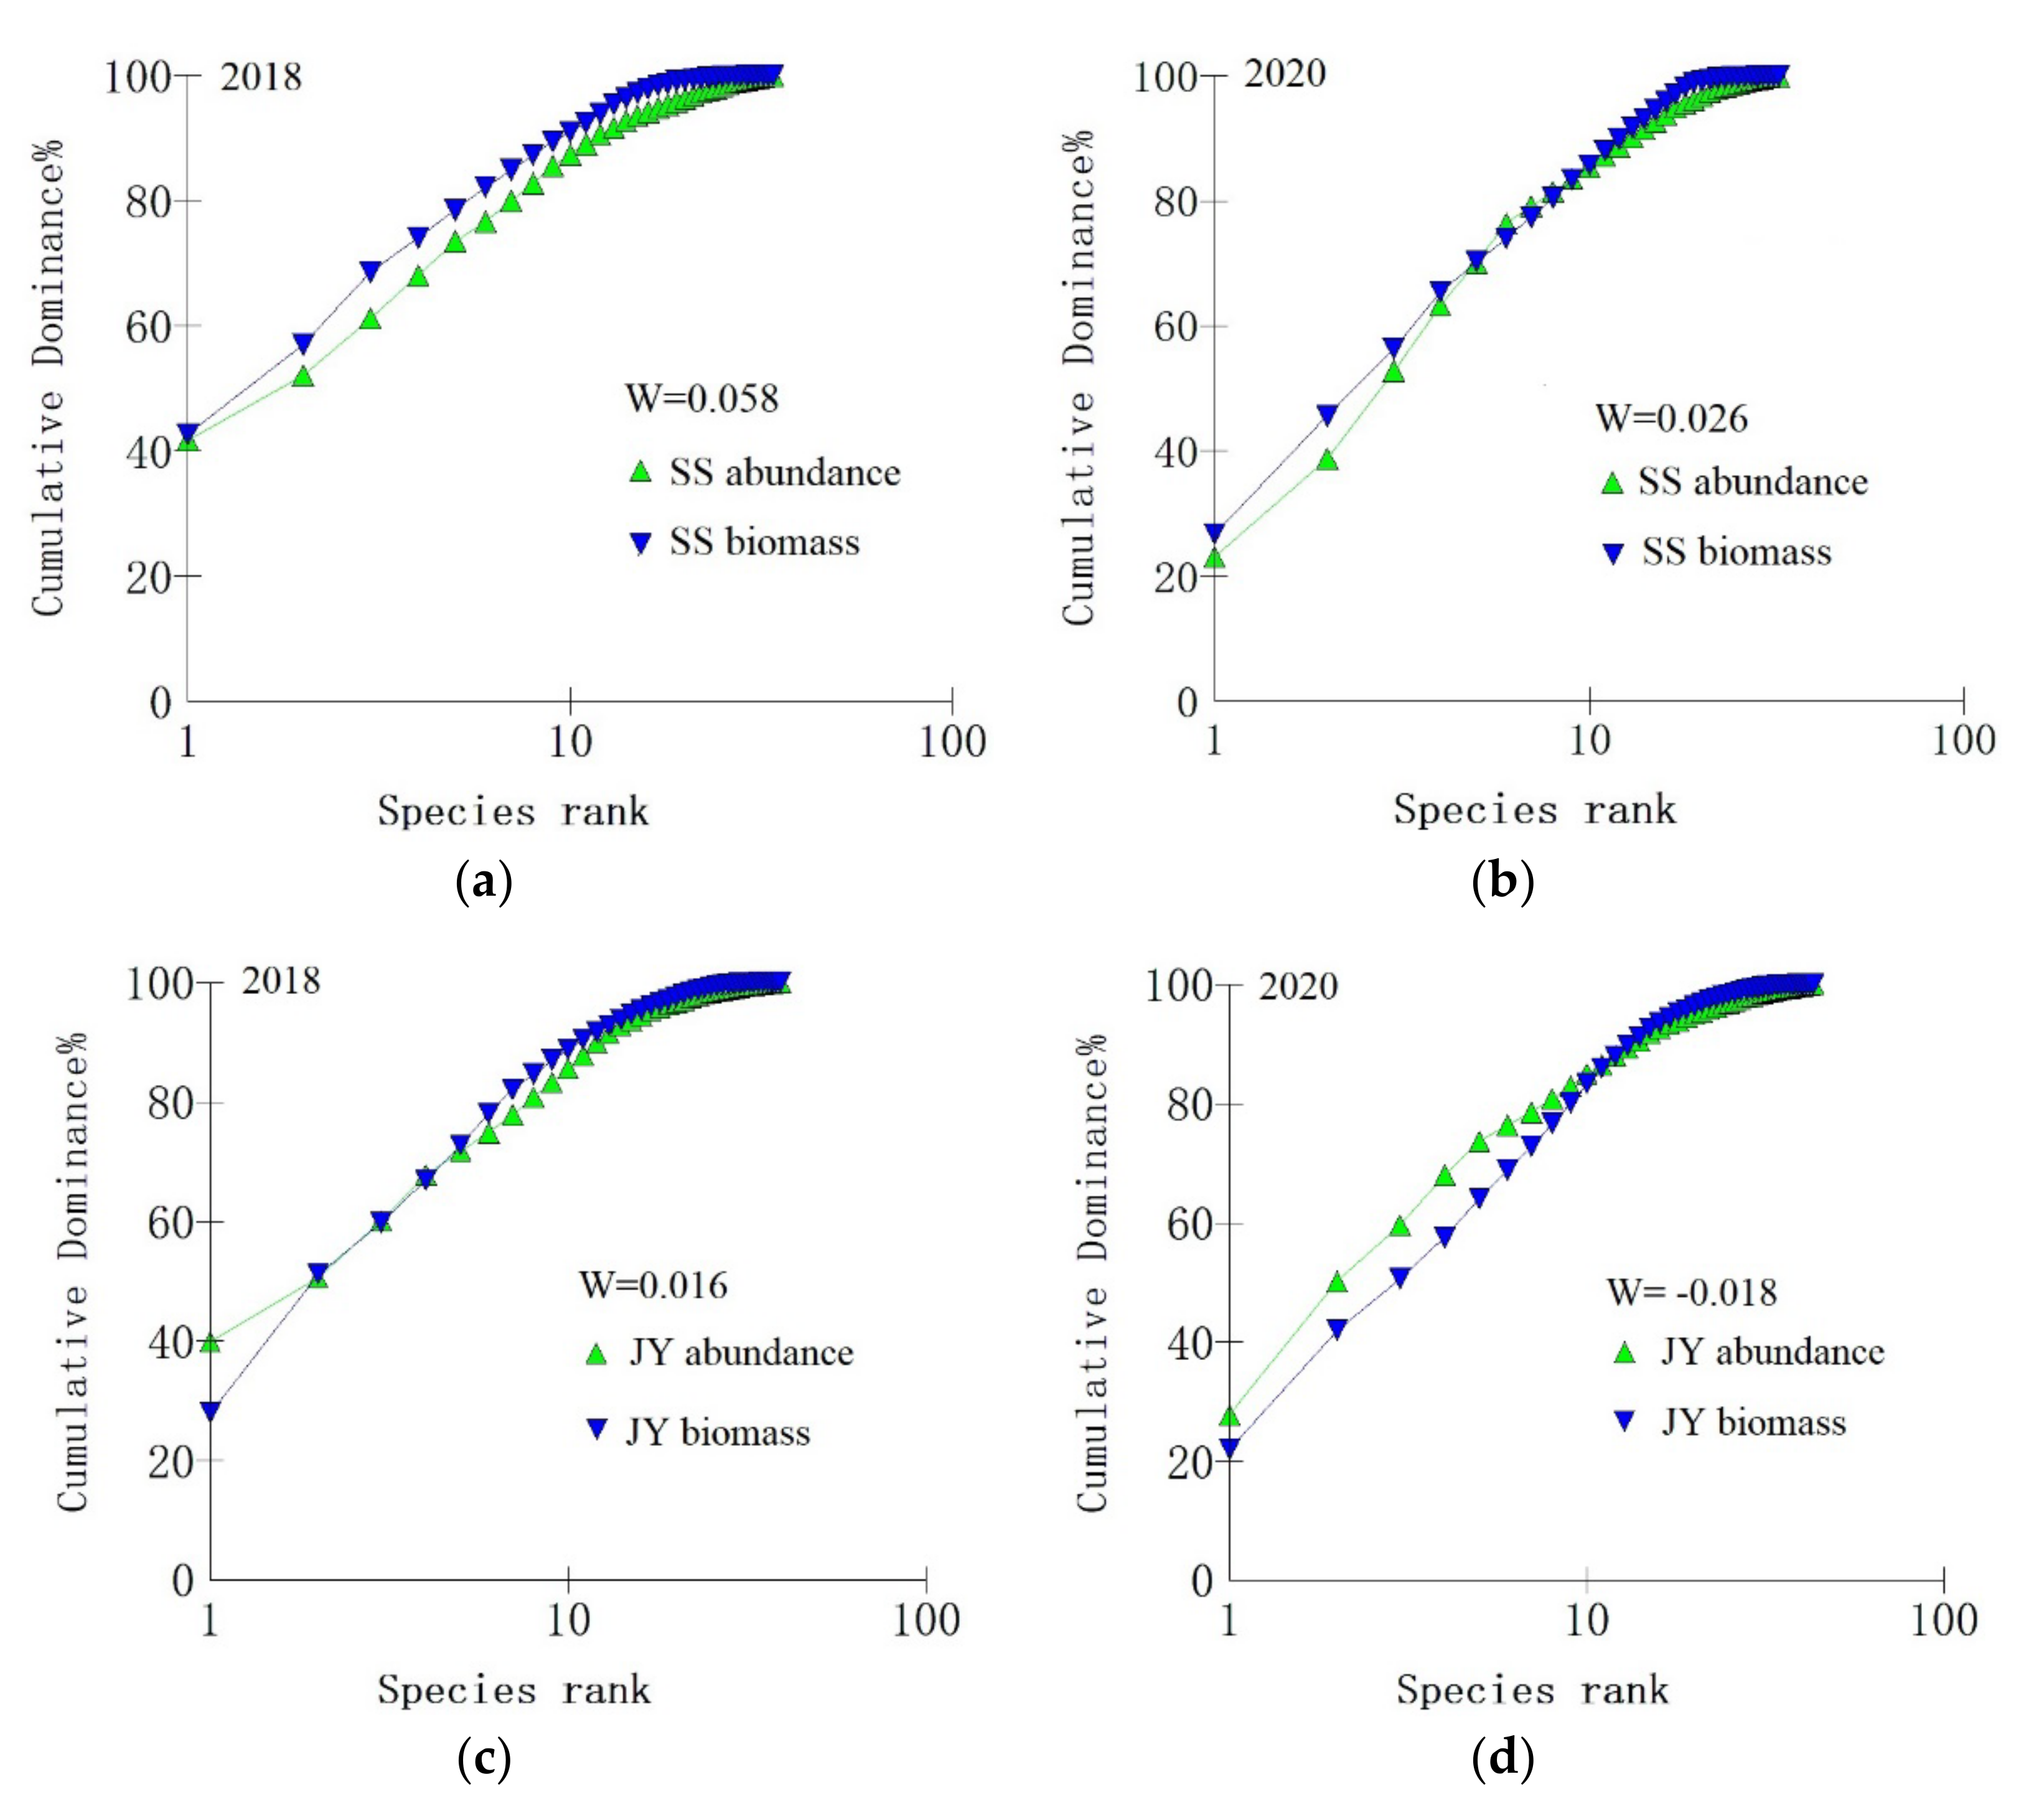
Abundance–biomass comparison curves (ABC curves) were used to measure the stability of community structure and the intensity of interference by environmental factors [40]. In a stable or undisturbed state, the biomass dominance curve always lies above the abundance dominance curve. The two curves intersect as the degree of interference increases and the population becomes moderately disturbed or unstable. When the biomass dominance curve remains below the abundance dominance curve, the community is considered severely disturbed or unstable [41].
Statistical analysis of fish, phytoplankton, and zooplankton data was performed in Excel 2010, OriginPro 8 software (OriginLad, Upton, MA, USA) was used for drawing, and calculations of the diversity index and community structure analysis were carried out using Primer 5.0 software (Plymouth Marine Laboratory, Plymouth, UK).
3. Results
3.1. Spatiotemporal Variations of Water Quality
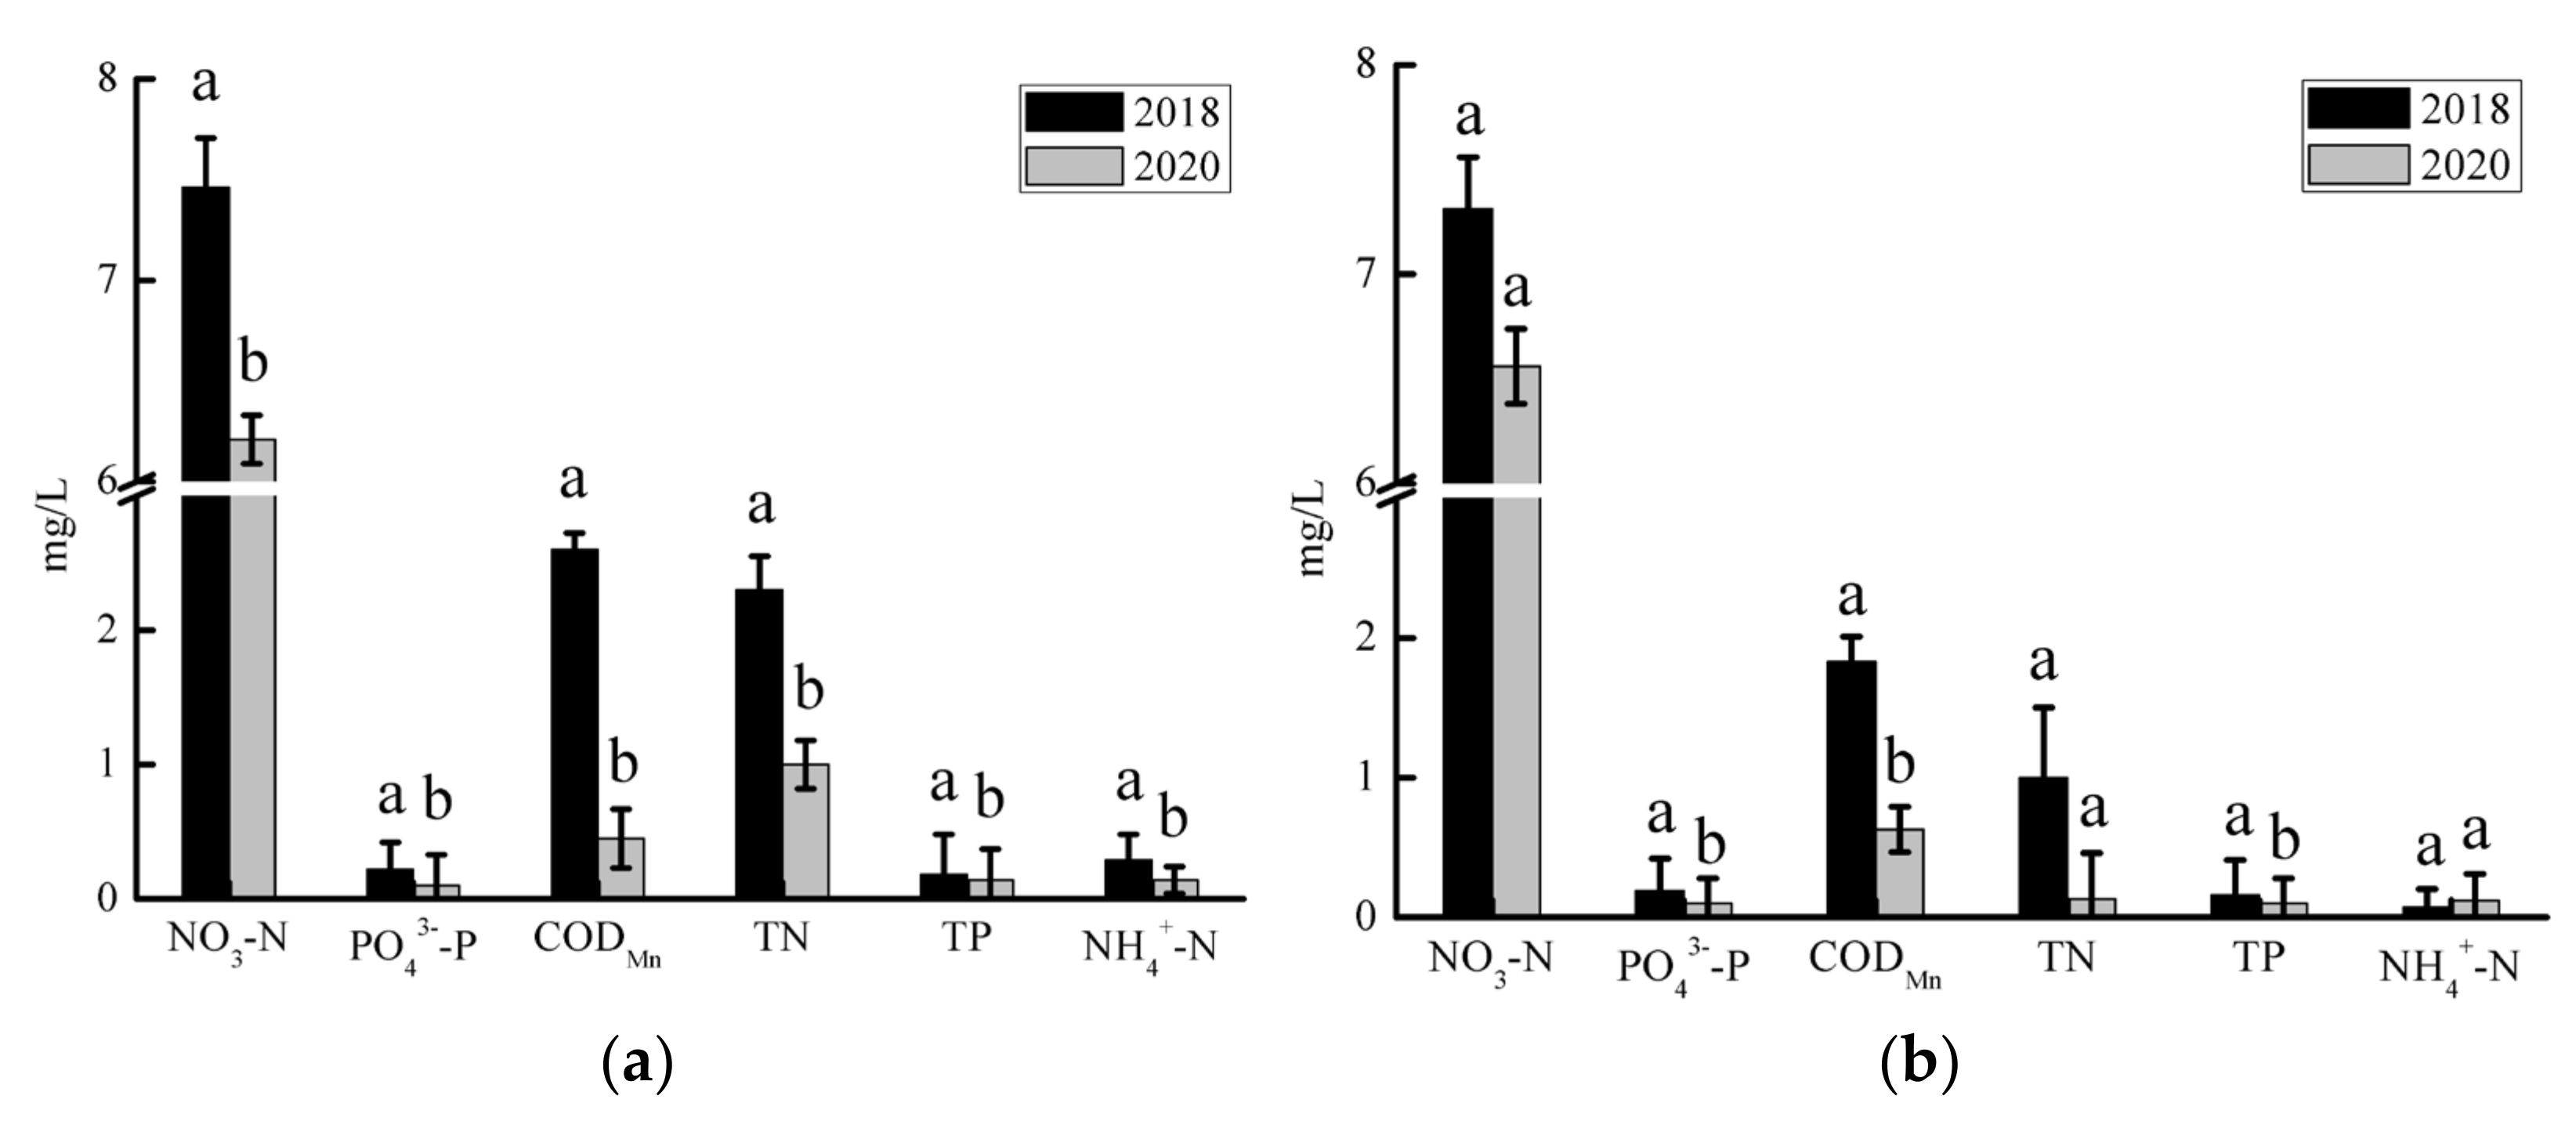
Water quality monitoring shows the main elements of plant nutrient pollutants, measured as TN and TP, in the SS and JY reaches. In 2018, the TN content of the SS river reach was 2.2 mg/L, which exceeds the Environmental Quality Standard for Surface Water Class V water standard (2.0 mg/L), and it decreased to 1.1 mg/L in 2020, which is between the Environmental Quality Standard for Surface Water Class III water standard (1.0 mg/L) and Class IV water standard (1.5 mg/L). The TP contents in 2018 and 2020 were 0.18 and 0.12 mg/L, respectively, which is lower than the Environmental Quality Standard for Surface Water Class III water standard (0.2 mg/L). The content of organic pollutants (NO3−N, PO43-−P, and CODMn) and plant nutrient element pollutants (TN, TP, and NH4+−N) in the SS river reach significantly decreased in 2020 (p < 0.05) (Figure 2a). In 2018, the content of TN in the JY river reach was 1.6 mg/L, which is between the Environmental Quality Standard for Surface Water Class IV water standard (1.5 mg/L) and the Class V water standard (2.0 mg/L) and lower than the Environmental Quality Standard for Surface Water Class III water standard (1.0 mg/L). The TP contents in 2018 and 2020 were 0.16 and 0.14 mg/L, respectively, which is lower than the Environmental Quality Standard for Surface Water Class III water standard (0.2 mg/L). The contents of organic pollutants and plant nutrient element pollutants in the JY river reach decreased in 2020. Among them, PO43−−P and TP were significantly lower in 2020 (p < 0.05) (Figure 2b).
3.2. Spatiotemporal Variations of Phytoplankton and Zooplankton Density
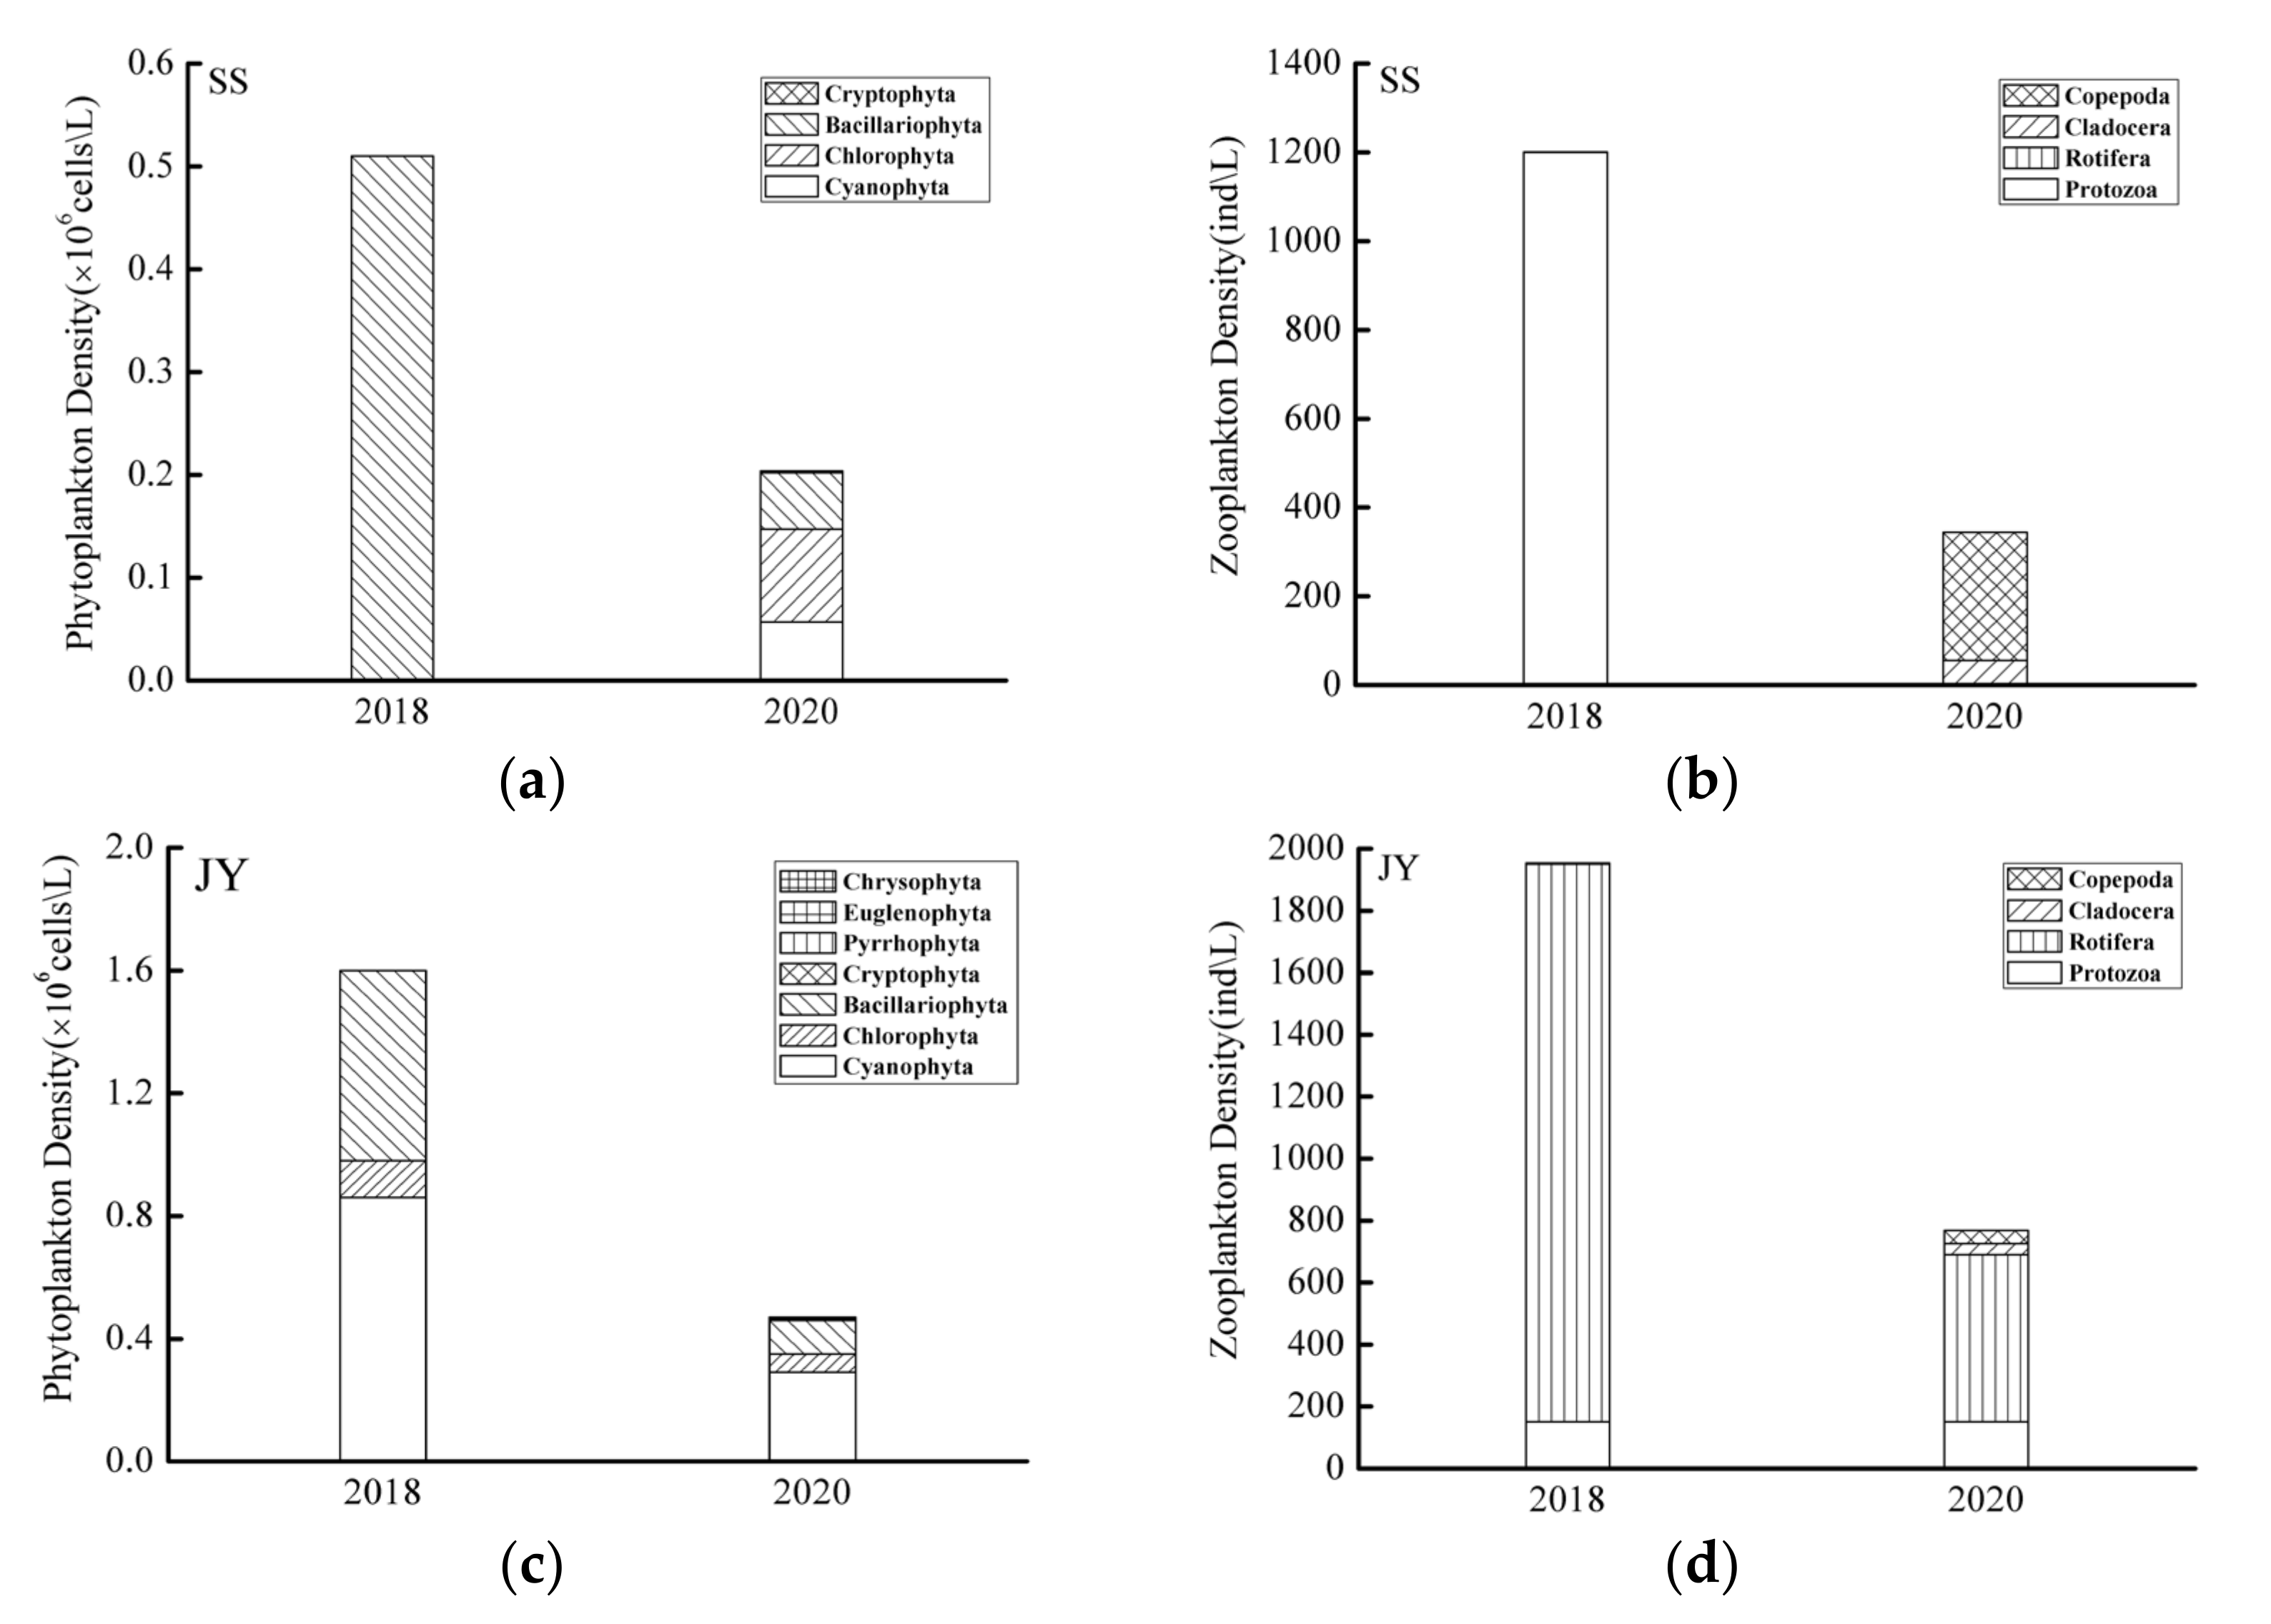
The quantitative results show that the phytoplankton density in the SS river reach was 0.51 × 10⁶ cells/L in 2018, and the community structure assessment showed mainly species of Bacillariophyta. The phytoplankton density was 0.2 × 10⁶ cells/L in 2020, a decrease compared with 2018 (Figure 3a), and the community mainly comprised Cyanophyta, Chlorophyta, and Bacillariophyta. The density of zooplankton was 1200 ind/L in 2018, and the community structure was mainly based on Protozoa. The zooplankton density in 2020 was 344 ind/L; thus decreased in 2020 compared with 2018, and the community was mainly dominated by Cladocera and Copepod (Figure 3b). The phytoplankton density in the JY river reach in 2018 and 2020 was 1.6 × 10⁶ and 0.47 × 10⁶ cells/L, respectively, showing a decrease with time. The JY rivers reach phytoplankton community structure was mainly based on Cyanophyta, Chlorophyta, and Bacillariophyta (Figure 3c). Here in 2018, the zooplankton density was 1988 ind/L and the community structure was mainly based on Protozoa. The zooplankton density in 2020 was 844 ind/L, showing a decrease with time, and the community then became mainly dominated by Protozoa and Rotifera (Figure 3d).
3.3. Spatiotemporal Variations of the Fish Community Structure and Diversity
3.3.1. Ecological Type
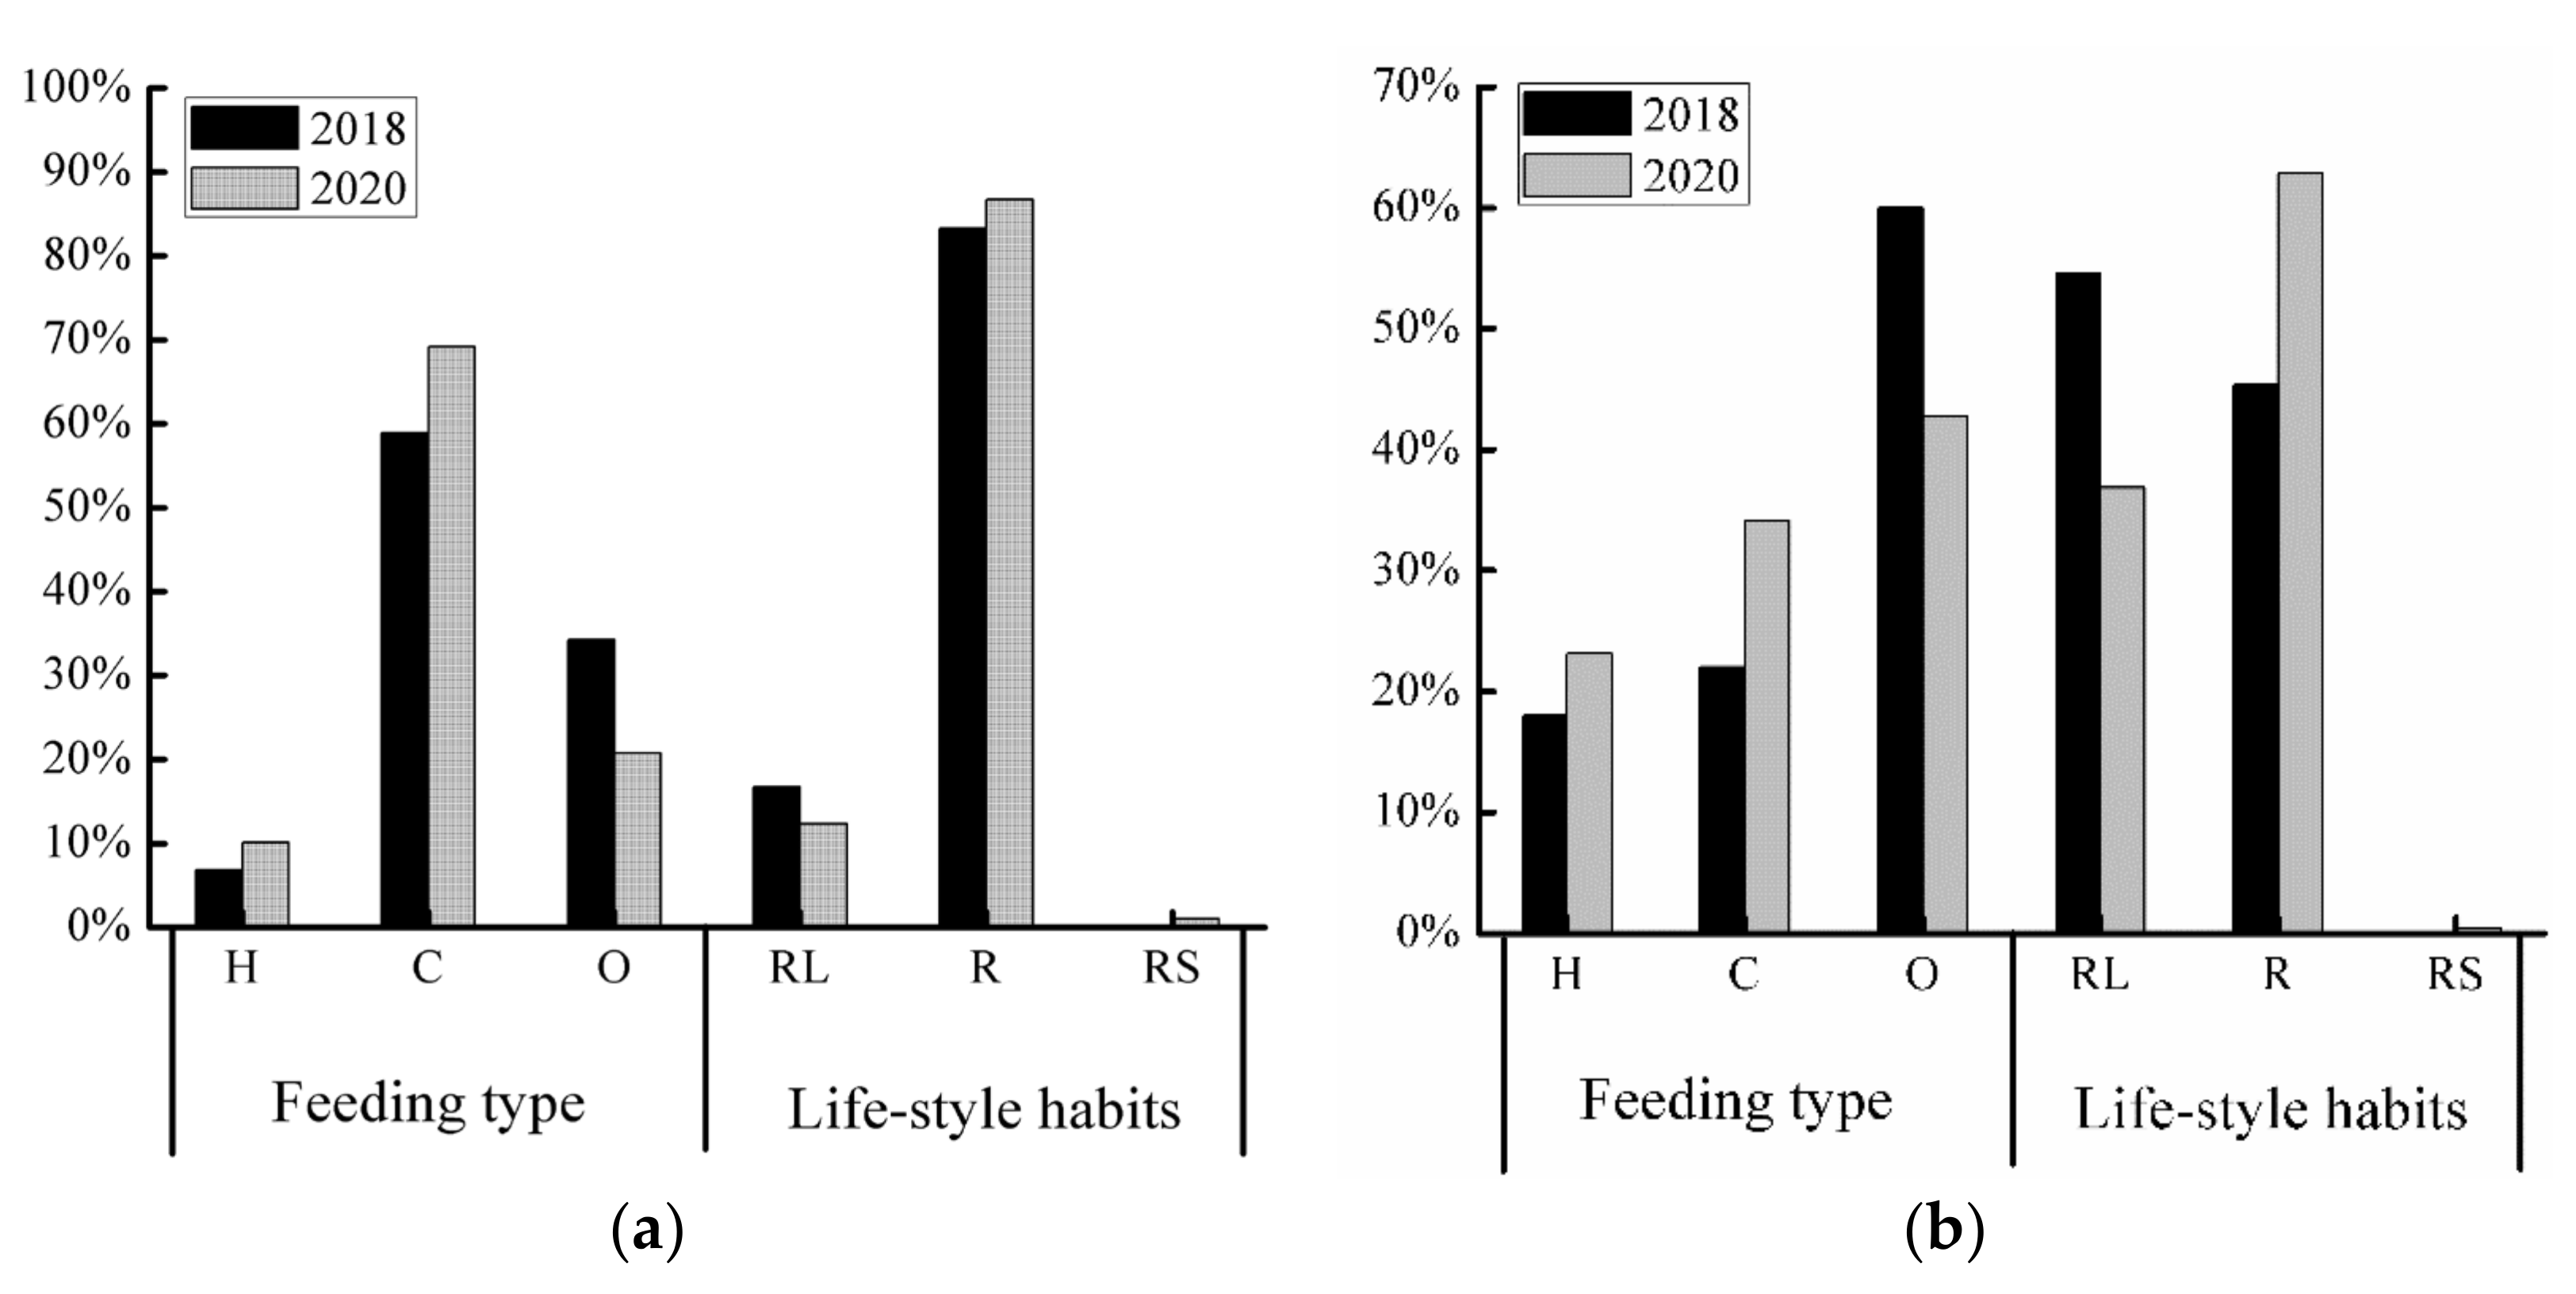
Based on feeding habits, as indicated in the Supplementary Materials Tables S1 and S2. SS river reach herbivorous fish and carnivorous fish accounted for 34.09% and 23.14%, respectively, of the total in 2020 (Table S2), with an increasing compared with 2018 (Table S1). Omnivorous fish accounted for 42.77% of the total in 2020 (Table S2), which was lower than that in 2018 (Figure 4a) (Table S1). As indicated in the Supplementary Materials Tables S3 and S4. JY river reaches herbivorous fish and carnivorous fish accounted for 10.09% and 69.16%, respectively, of the total in 2020, and the number of omnivorous fish accounted for 20.76% of the total (Table S4). The number of herbivorous fish and carnivorous fish increased compared with 2018 (Table S3), while the number of omnivorous fish decreased (Figure 4b).
In terms of lifestyle habits, as indicated in the Supplementary Materials Tables S1 and S2. River–lake migration fish in the SS river reach accounted for 36.83% of the total in 2020 (Table S2), with a decrease in the number of rivers–lake migration fish compared with 2018 (Table S1); river–sea migration fish accounted for 0.4% of the total (Figure 4a) (Table S2). The number of migratory fish species increased from 5 to 8 (Table S2). As indicated in the Supplementary Materials Tables S3 and S4. JY reach river–lake migration fish accounted for 12.29% of the total in 2020 (Table S4), with a decrease in the number of rivers–lake migration fish compared with 2018 (Table S3); river–sea migration fish accounted for 1% of the total (Figure 4b) The number of migratory fish species increased from 6 to 9 (Table S4).
3.3.2. Community Stability
Statistical analysis revealed that the biomass dominance curve of fish communities in the SS river reach in 2018 was above the quantitative dominance curve, with a W−statistic of 0.058 (Figure 5a). These curves intersected in 2020, with a W-statistic of 0.026 (Figure 5b). The biomass dominance curves and population dominance curves of fish communities in the JY river reach in 2018 and 2020 all intersected to different degrees, with a W-statistic of 0.016 and −0.018, respectively (Figure 5c,d).
3.3.3. Diversity Characteristics
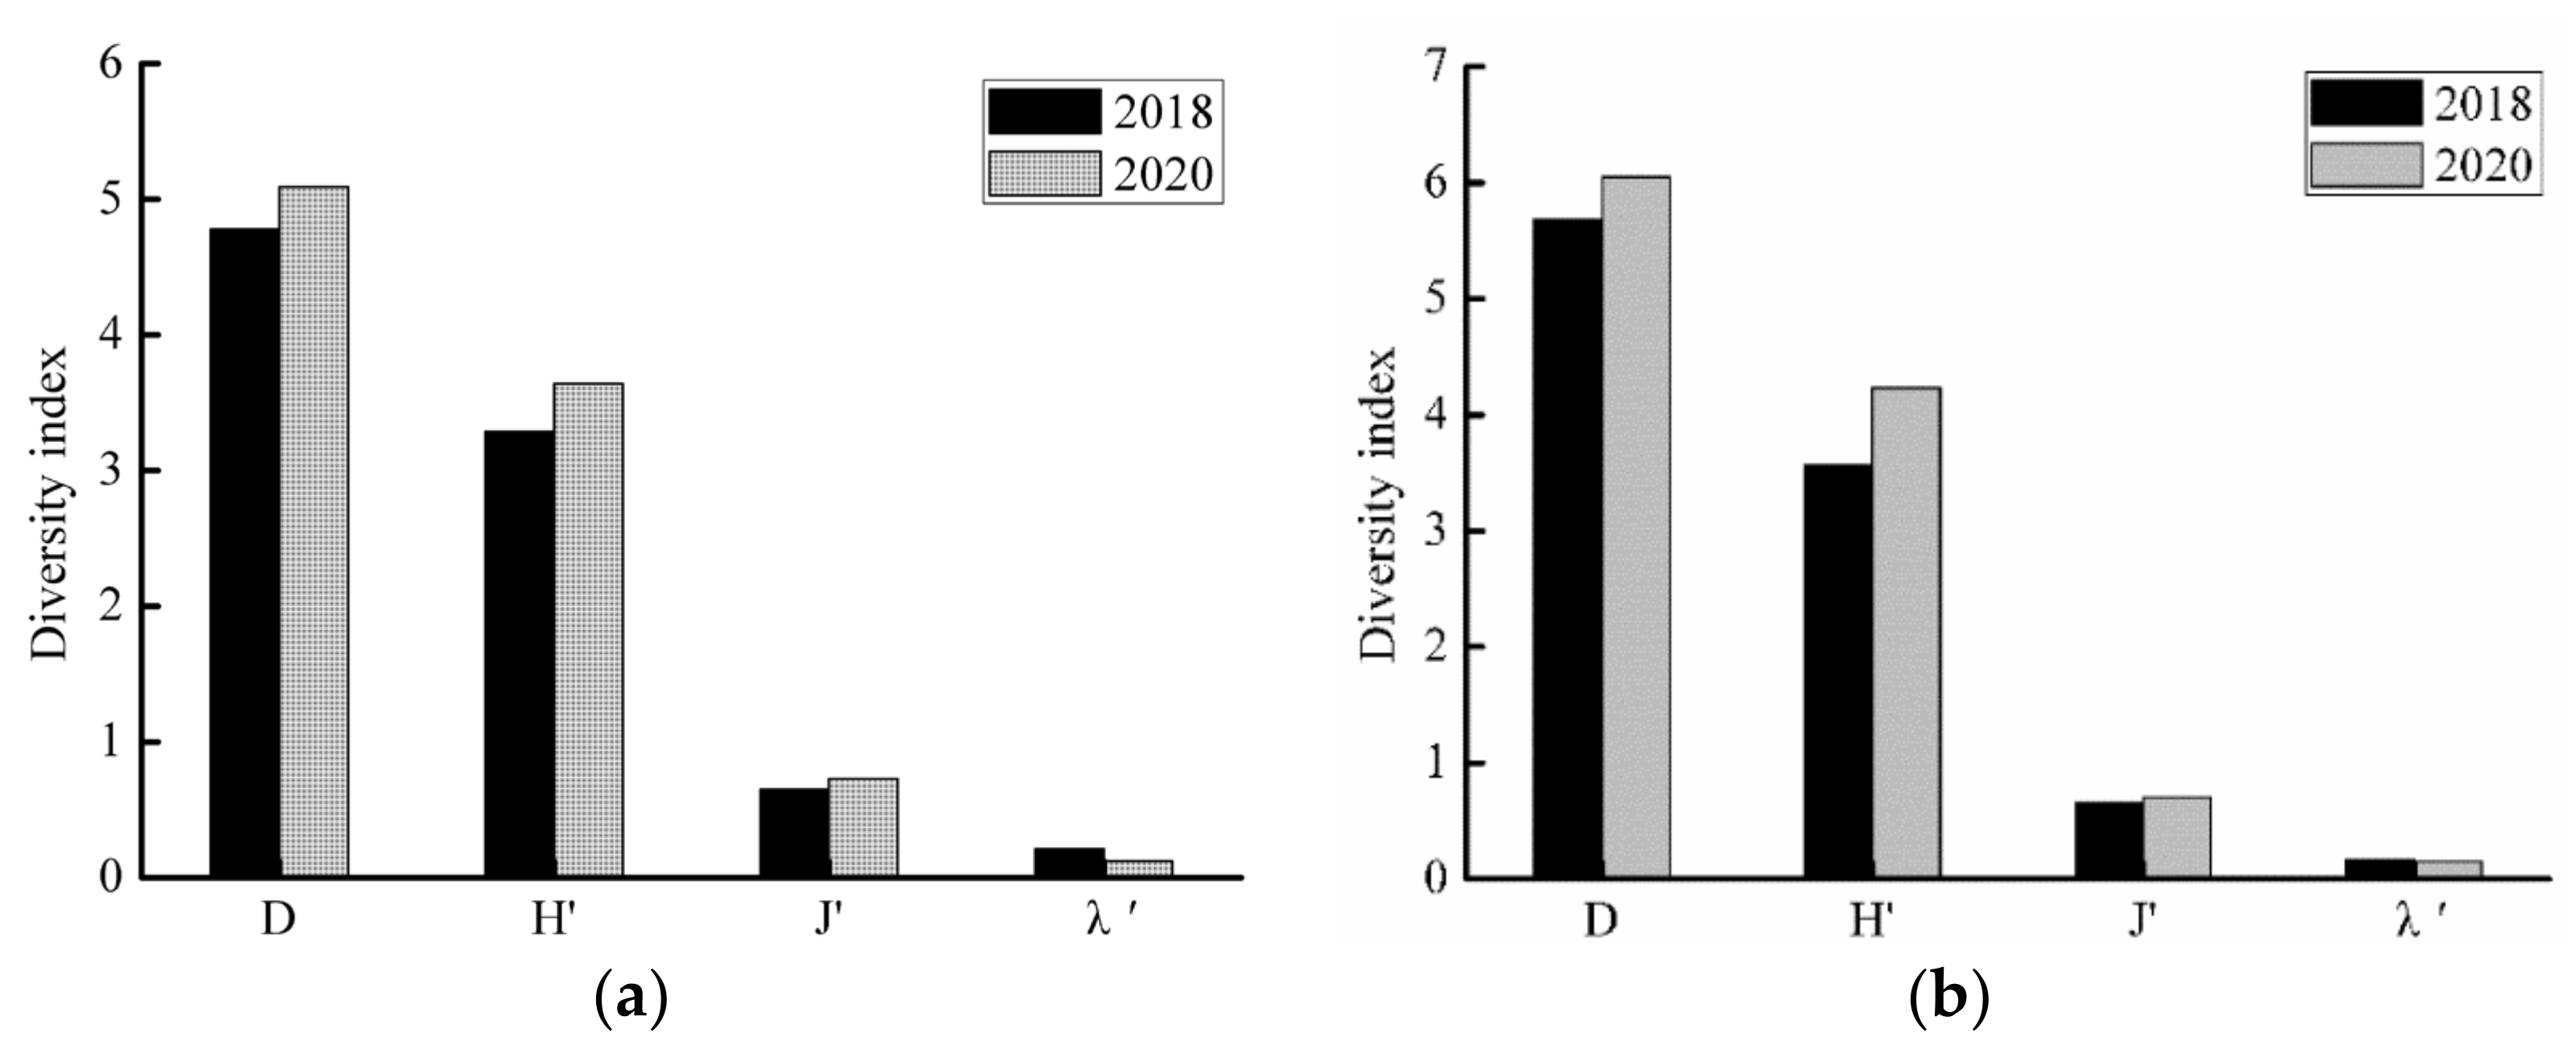
Species diversity indexes were as follows: In the SS river reach, D = 5.09, H′ = 3.64, J′ = 0.73, and λ′ = 0.12 in 2020. Comparison with the values in 2018 shows that D, H′, and J′ have increased while λ′ has decreased (Figure 6a). In the JY river reach, D = 6.05, H′ = 3.89, J′ = 0.67, and λ′ = 0.15 in 2020. Comparison with the values in 2018 shows that D, H′, and J′ have increased while λ′ has decreased (Figure 6b). The D and H of the SS and JY river reaches were higher in 2020 than in 2018, indicating that species richness and diversity were high in 2020.
4. Discussion
4.1. Possible Reasons for Water Quality Improvements
Human activities impact the surrounding ecological environment, altering the nitrogen cycle in aquatic systems, changing hydrological circulation, deteriorating river water quality, and determining the carrying capacity of the water environment to a certain extent [42]. China’s rapid economic development has placed considerable pressure on aquatic environments, resulting in the widespread deterioration of water quality [43]. COVID-19 lockdowns dampened the high intensity of human activity, which had beneficial implications for water quality.
The results of this study show that levels of both organic contaminants and plant nutrient contaminants in the river decreased during COVID-19 lockdown periods in 2020. Among them, PO43−−P, CODMn, and TP were significantly decreased after lockdown (p < 0.05). Studies have shown that discharge from industries and domestic effluents are the major contributors to the increased pollution load in river systems [44]. Industrial pollution is an important source of NO3−N, PO43−P, and CODMn in Chinese rivers [45]. TN and TP are the main causes of water eutrophication, and their presence in sewage is mainly derived from domestic effluent, garbage, feces, etc. [46]. The COVID-19 lockdowns resulted in the shutdown of many industries, and people were asked to stay at home, resulting in reduced discharge of industrial and domestic effluents and improved river water quality. Some studies have reported the positive impacts of COVID-19 lockdowns on water quality. For example, reductions in industrial effluent discharges and vessel traffic led to improved water transparency in the Venetian Lagoon, Italy [47]. Recent research reported that less domestic wastewater discharge due to COVID-19 lockdowns led to lower nitrate (NO3−N) concentrations, and the Ganges water has been revived to the extent that it is now potable [48]. Studies have shown that improvements in air quality might also have beneficial impacts resulting in improved water quality. COVID-19 lockdowns reduced atmospheric pollution, and atmospheric deposition is an important source of water nutrients, which can further increase COD by enhancing primary production [49].
The results of our study show a reduction in industrial and domestic effluent discharge, substantial decreases in the production of air pollutants, decreased atmospheric nutrient deposition, and a decrease in organic contaminants and plant nutrient contaminants in the examined river areas due to COVID-19 lockdowns; among them, PO43−−P, CODMn, and TP have significantly decreased, improving the quality of river water.
4.2. Plankton Response to Water Quality Changes
Plankton act as primary producers in aquatic ecosystems, providing bait and the necessary energy for other organisms [50]. In an aquatic ecosystem, the growth of plankton is closely related to water environment factors. The seasonal succession of the plankton community structure can represent the state of the water environment, and the spatiotemporal change in the water environment can cause changes in plankton density, biomass, and diversity [51]. Among the various environmental water factors, WT, TN, TP, and pH are the main abiotic factors affecting the plankton community structure [52].
The results of this study show that the phytoplankton and zooplankton density of the SS and JY river reaches in 2020 were decreased compared with in 2018. We speculate that this may be related to reductions in organic pollutants and plant nutrient pollutants in the water body. Studies have shown that NO3−N, PO43−−P, and WT are the most obvious environmental factors affecting phytoplankton growth in spring and summer [53]. CODMn is an important indicator for monitoring the organic matter content in the water environment; organic matter in water can promote the growth and reproduction of algae, which is positively correlated with phytoplankton growth [54]. TN and TP are the material basis of algae growth [55]. One study found that an increase in TN and TP contents in the lower Rhine River promoted an increase in phytoplankton species and density [56]. NH4+−N is the form of elemental nitrogen that can be directly absorbed phytoplankton [57]. During COVID-19 lockdowns, reductions in industrial and domestic effluent discharge led to a reduction in the nutrient supply, which inhibited algae growth and caused a decrease in the phytoplankton density. As primary consumers in the food chain, zooplankton mainly feed on phytoplankton, bacteria, and detritus, and the abundance of zooplankton can be influenced by phytoplankton via a bottom-up effect.
4.3. Possible Reasons for Changes in Fish Diversity and Community Structure
Biodiversity, especially its decline due to human activities, is a global concern [58]. Water pollution is one of the main threats to the survival and reproduction of all fish [59]. Overfishing is another of the main threats to fish, which has affect their community structure, reduces the number of supplementary populations, and has led to more species becoming increasingly threatened with extinction [60]. Sand dredging ships, which increases water turbidity and leave silt suspended in the water, may block fish gills or breathing holes and thus affect the normal breathing of fish, which is particularly harmful to hatching fry [61].
The results of this study show that in the SS and JY river reaches in 2020, H’ = 3.64 and 3.89, respectively, which is an increase compared with 2018. Changes in environmental factors are an important factor causing changes in fish diversity. One study found that high concentrations of NH4+−N, TN, and TP in water lead to a decrease in fish diversity, and water pollution adversely affects the species composition and diversity of fish in rivers [62]. During COVID-19 lockdowns, industrial and domestic effluent discharge was reduced, river water quality improved, and fish diversity increased. Overfishing is an important threat to fish diversity, and studies have shown that community diversity is closely related to disturbance intensity, where diversity is highest when the disturbance is at a moderate intensity and lowest when the disturbance is at two different levels [63]. COVID-19 lockdowns required people to stay at home, limiting anthropic activities and therefore reducing stress due to fishing. The external disturbance to fish resources was weakened and fishing intensity was effectively reduced, resulting in higher fish diversity. On the other hand, fishing intensity decreased, which had a protective effect on a large number of reproductive parents, thus increasing the output of fry and therefore species diversity and richness [64].
The results show that carnivorous fish in the SS and JY river reaches accounted for 23.14% and 69.16% of the total in 2020, respectively, which were increased in numbers compared to 2018. The fish community structure is closely related to the environment of the aquatic ecosystem in which it lives [65]. One study found that under conditions of declining environmental water quality, omnivorous fish have a greater survival advantage due to more diverse food sources, a wider range of ecological niches, and stronger adaptability to the environment [66]. During COVID-19 lockdowns, the reduced nutrient supply, as measured by TN and TP, led to lower primary productivity in rivers, a reduced supply of fish feed, intensified competition among fish communities, and increased populations with the dominance of high trophic level carnivorous fish. In addition, river–sea migratory fish accounted for 3.4% and 4.2% of the total in SS and JY river reaches in 2020, respectively, increasing compared to 2018. This suggests that COVID-19 lockdowns reduced fishing intensity and thus the risk of river–sea migration fish being caught, effectively allowing them to complete long-distance spawning migration, which results in increased populations. The results of the ABC curve—both the abundance dominance curve and the biomass dominance curve—show that the SS and JY river reaches had different degrees of intersection in 2020, indicating that the fish community was mainly dominated by small-sized species with a short life cycle. This suggests that COVID-19 lockdowns, through limitation of anthropic activities and reduced fishing efforts and harvest, resulted in increases in the number of supplementary populations. In a similar vein, one study found that the summer close season can effectively increase the amount of juvenile fish supplementary population resources [67].
The results of this study suggest that COVID-19 lockdowns have reduced the interference of human activities on fishery resources, wherein the fish community became mainly dominated by small-sized species with a short life cycle, and the number of supplementary populations increased. The reduction in fishing pressure has contributed to an increase in the number of rivers–sea migratory fish. At the same time, improvements in river water quality have contributed to an increase in the number of carnivorous fish. The fish community structure showed a tendency toward higher complexity and fish diversity.
5. Conclusions
The results of this study indicate that COVID-19 lockdowns had positive impacts on the Yangtze River ecosystem. During the entire course of lockdowns, industrial and domestic effluent discharges decreased, and levels of organic contaminants and plant nutrient contaminants in the river also decreased; among them, PO43−−P, CODMn, and TP were significantly decreased (p < 0.05), and river water quality improved. The decrease in nutrient supply as indicated by TN and TP inhibited the algae growth and caused the density of phytoplankton to decrease. Zooplankton mainly feed on phytoplankton, bacteria, and detritus, and phytoplankton can thus affect the abundance of zooplankton through a bottom-up effect, wherein decreases in phytoplankton density lead to decreased zooplankton density. The decrease in plankton density has led to lower primary productivity in rivers, reduced fish feed supplies, intensified competition among fish populations, and increased populations dominated by high trophic level carnivorous fish. In addition, fishing intensity was effectively reduced by COVID-19 lockdowns, which limited anthropic activities, and the fish community became mainly dominated by small-sized species with a short life cycle, with the number of supplementary fish populations also increasing. The reduction in fishing pressure has contributed to an increase in the number of rivers–sea migratory fish. The fish community structure showed a tendency toward higher complexity and fish diversity. Ecological protection issues in the Yangtze River have recently received considerable attention. COVID-19 lockdowns have provided respite for the retrogressive Yangtze River ecosystem.
Supplementary Materials
The following supporting information can be downloaded at: https://www.mdpi.com/article/10.3390/w14223622/s1, Table S1: Species composition and ecological types of fish in Shishou river reach in 2018; Table S2: Species composition and ecological types of fish in Shishou river reach in 2020; Table S3: Species composition and ecological types of fish in Jiayu river reach in 2018; Table S4: Species composition and ecological types of fish in Jiayu river reach in 2020.
Author Contributions
Conceptualization, H.Y. and H.Z.; Data curation, D.F. and H.Y.; Formal analysis, D.F. and H.Y.; Funding acquisition, H.D. and H.Y.; Investigation, J.Y. and D.F.; Methodology, D.F. and H.Y.; Project administration, Q.W., H.Z. and H.Y.; Software, D.F.; Visualization, D.F.; Writing-original draft, D.F.; Writing-review & editing, D.F., H.Y. and H.Z. All authors have read and agreed to the published version of the manuscript.
Funding
This work was supported by the Central Public-Interest Scientific Institution Basal Research Fund, Chinese Academy of Fishery Sciences (Grant numbers YFI202201, 2020TD08); Project of Yangtze Fisheries Resources and Environment Investigation from the Ministry of Agriculture and Rural Affairs, China (Grant Numbers CJDC-2017-14).
Institutional Review Board Statement
Not applicable.
Informed Consent Statement
Not applicable.
Data Availability Statement
Not applicable.
Conflicts of Interest
The authors declare no conflict of interest.
References
- Costanza, R.; De Groot, R.; Sutton, P.; Van der Ploeg, S.; Anderson, S.J.; Kubiszewski, I.; Turner, R.K. Changes in the global value of ecosystem services. Glob. Environ. Chang. 2014, 26, 152–158. [Google Scholar] [CrossRef]
- Tickner, D.; Opperman, J.J.; Abell, R.; Acreman, M.; Arthington, A.H.; Bunn, S.E.; Cooke, S.J.; Dalton, J.; Darwall, W.; Edwards, G.; et al. Bending the curve of global freshwater biodiversity loss: An emergency recovery plan. Bioscience 2020, 70, 330–342. [Google Scholar] [CrossRef] [Green Version]
- Collen, B.; Whitton, F.; Dyer, E.E.; Baillie, J.E.; Cumberlidge, N.; Darwall, W.R.; Böhm, M. Global patterns of freshwater species diversity, threat and endemism. Glob. Ecol. Biogeogr. 2014, 23, 40–51. [Google Scholar] [CrossRef] [PubMed] [Green Version]
- He, F.; Bremerich, V.; Zarfl, C.; Geldmann, J.; Langhans, S.D.; David, J.N.; Jähnig, S.C. Freshwater megafauna diversity: Patterns, status and threats. Divers. Distrib. 2018, 24, 1395–1404. [Google Scholar] [CrossRef] [Green Version]
- Báldi, A.; Vári, Á. Freshwater ecosystems: Research, policy and applications. Biol. Futura 2020, 71, 333–336. [Google Scholar] [CrossRef]
- Vörösmarty, C.J.; McIntyre, P.B.; Gessner, M.O.; Dudgeon, D.; Prusevich, A.; Green, P.; Davies, P.M. Global threats to human water security and river biodiversity. Nature 2010, 467, 555–561. [Google Scholar] [CrossRef] [Green Version]
- Grill, G.; Lehner, B.; Thieme, M.; Geenen, B.; Tickner, D.; Antonelli, F.; Babu, S.; Borrelli, P.; Cheng, L.; Crochetiere, H.; et al. Mapping the world’s free-flowing rivers. Nature 2019, 569, 215–221. [Google Scholar] [CrossRef]
- Dudgeon, D.; Arthington, A.H.; Gessner, M.O.; Kawabata, Z.I.; Knowler, D.J.; Lévêque, C. Freshwater biodiversity: Importance, threats, status and conservation challenges. Biol. Rev. 2006, 8, 163–182. [Google Scholar] [CrossRef]
- Reid, A.J.; Carlson, A.K.; Creed, I.F.; Eliason, E.J.; Gell, P.A.; Johnson, P.T.J.; Co-Oke, S.J. Emerging threats and persistent conservation challenges for freshwater biodiversity. Biol. Rev. 2019, 94, 849–873. [Google Scholar] [CrossRef] [Green Version]
- Lai, C.C.; Shih, T.P.; Ko, W.C.; Tang, H.J.; Hsueh, P.R. Severe acute respiratory syndrome coronavirus 2 (SARS-CoV-2) and coronavirus disease-2019 (COVID-19): The epidemic and the challenges. Int. J. Antimicrob. Agents 2020, 55, 105924. [Google Scholar] [CrossRef]
- Acter, T.; Uddin, N.; Das, J.; Akhter, A.; Choudhury, T.R.; Kim, S. Evolution of severe acute respiratory syndrome coronavirus 2 (SARS-CoV-2) as coronavirus disease 2019 (COVID-19) pandemic: A global health emergency. Sci. Total Environ. 2020, 730, 138996. [Google Scholar] [CrossRef]
- Tang, A.N.; Tong, Z.D.; Wang, H.L.; Dai, Y.X.; Li, K.F.; Liu, J.N.; Wu, W.J.; Yuan, C.; Yu, M.L.; Li, P.; et al. Detection of Novel Coronavirus by RT-PCR in Stool Specimen from Asymptomatic Child, China. Emerg. Infect. Dis. 2020, 26, 1337. [Google Scholar] [CrossRef]
- Gundy, P.M.; Gerba, C.P.; Pepper, I.L. Survival of Coronaviruses in Water and Wastewater. Food Environ. Virol. 2009, 1, 10–14. [Google Scholar] [CrossRef] [Green Version]
- Mancuso, G.; Perulli, G.D.; Lavrnić, S.; Morandi, B.; Toscano, A. Sars-cov-2 from urban to rural water environment: Occurrence, persistence, fate, and influence on agriculture irrigation. A review. Water 2021, 13, 764. [Google Scholar] [CrossRef]
- Pant, R.R.; Bishwakarma, K.; Ur, F.; Qaiser, F.U.R.; Pathak, L.; Jayaswal, G.; Sapkota, B.; Maskey, R. Imprints of COVID-19 lockdown on the surface water quality of Bagmati river basin, Nepal. J. Environ. Manag. 2021, 289, 112522. [Google Scholar] [CrossRef]
- Askitas, N.; Tatsiramos, K.; Verheyden, B. Lockdown strategies, mobility patterns, and COVID-19. J. Sustain. Tour. 2020, 2006, 00531. [Google Scholar] [CrossRef]
- Bates, A.E.; Primack, R.B.; Moraga, P.; Duarte, C.M. COVID-19 pandemic and associated lockdown as a “Global Human Confinement Experiment” to investigate biodiversity conservation. Biol. Conserv. 2020, 248, 108665. [Google Scholar] [CrossRef]
- Liu, D.; Yang, H.; Thompson, J.R.; Li, J.; Loiselle, S.; Duan, H. COVID-19 lockdown improved river water quality in China. Sci. Total. Environ. 2022, 802, 149585. [Google Scholar] [CrossRef]
- Cooke, S.J.; Twardek, W.M.; Lynch, A.J.; Cowx, I.G.; Olden, J.D.; Funge-Smith, S. A global perspective on the influence of the COVID-19 pandemic on freshwater fish biodiversity. Biol. Conserv. 2021, 253, 108932. [Google Scholar] [CrossRef]
- Pinder, A.C.; Raghavan, R.; Britton, J.R.; Cooke, S. COVID-19 and biodiversity: The paradox of cleaner rivers and elevated extinction risk to iconic fish species. Aquat. Conserv. 2020, 30, 1061–1062. [Google Scholar] [CrossRef]
- Bar, H. COVID-19 lockdown: Animal life, ecosystem, and atmospheric environment. Environ. Dev. Sustain. 2021, 23, 8161–8178. [Google Scholar] [CrossRef]
- Saadat, S.; Rawtani, D.; Hussain, C.M. Environmental perspective of COVID-19. Sci. Total. Environ. 2020, 728, 138870. [Google Scholar] [CrossRef] [PubMed]
- Tadano, Y.S.; Potgieter-Vermaak, S.; Kachba, Y.R.; Chiroli, D.M.; Casacio, L.; Santos Silva, J.C.; Godoi, R.H. Dynamic model to predict the association between air quality, COVID-19 cases, and level of lockdown. Environ. Pollut. 2021, 268, 115920. [Google Scholar] [CrossRef] [PubMed]
- Polazzo, F.; Dos Anjos, T.B.O.; Arenas-Sánchez, A.; Romo, S.; Vighi, M.; Rico, A. Effect of multiple agricultural stressors on freshwater ecosystems: The role of community structure, trophic status, and biodiversity-functioning relationships on ecosystem responses. Sci. Total. Environ. 2022, 807, 151052. [Google Scholar] [CrossRef] [PubMed]
- Liu, J.; Diamond, J. China’s environment in a globalizing world. Nature 2005, 435, 1179–1186. [Google Scholar] [CrossRef]
- Zhang, H.; Jarić, I.; Roberts, D.L.; He, Y.; Du, H.; Wu, J.; Wei, Q. Extinction of one of the world’s largest freshwater fishes: Lessons for conserving the endangered Yangtze fauna. Sci. Total Environ. 2020, 710, 136242. [Google Scholar] [CrossRef]
- Xiong, F.; Olden, J.D.; Lu, Y.; Liu, H.; Qu, X.; Xia, W.; Chen, Y. Riparian land use and in-channel stressors drive fish community structure in the Yangtze River. Landsc. Ecol. 2021, 36, 3079–3095. [Google Scholar] [CrossRef]
- Zhang, M.; Tan, S.; Zhang, Y.; He, J.; Ni, Q. Does land transfer promote the development of new-type urbanization? New evidence from urban agglomerations in the middle reaches of the Yangtze River. Ecol. Indic. 2022, 36, 108705. [Google Scholar] [CrossRef]
- Yang, H.L.; Wu, J.M.; Du, H.; Zhang, H.; Li, J.Y.; Wei, Q.W. Quantifying the Colonization of Environmental Microbes in the Fish Gut: A Case Study of Wild Fish Populations in the Yangtze River. Front. Microbiol. 2021, 12, 828409. [Google Scholar] [CrossRef]
- Dong, C.Y.; Li, J.Y.; Zhang, H.; Yang, H.L.; Xiang, H.; Wu, J.M.; Jiang, H.B. Estimation of Fish Resources in Middle Reaches of Yangtze River. Chin. J. Zool. 2021, 56, 73–79. [Google Scholar] [CrossRef]
- Yang, G.S.; Zhu, C.Q.; Jiang, Z.G. Yangtze Conservation and Development Report 2011; Changjiang Press: Wuhan, China, 2011. [Google Scholar]
- Yang, Y.T.; Yu, D.; Gao, X.; Liu, H.Z. Mechanism of fish community assembly in middle reaches of the Yangtze River. Acta Hydrobiol. Sin. 2020, 44, 1–10. [Google Scholar]
- Wu, T.H.; Liu, J.S.; Deng, J.M. Community structure of phytoplankton and bioassessment of water quality in a large water-carrying lake, Lake Hongze. J. Lake Sci. 2019, 31, 440–448. [Google Scholar] [CrossRef] [Green Version]
- Zhang, W.R. Determination of organic pollutants in water and wastewater monitoring. J. Environ. Res. Dev. 2020, 32, 191. [Google Scholar]
- Yang, X.; Ma, J.S.; Zhang, H.; Zhou, Q. Community structure and the water quality during different hydrological periods in Poyang Lake. Acta. Hydrobiol. Sin. 2021, 45, 1093–1103. [Google Scholar] [CrossRef]
- Ding, R.H. The Fishes of Sichuan; Sichuan Publishing House of Science and Technology: Chengdu, China, 1994. [Google Scholar]
- Tong, Y.; Zhang, W.; Wang, X.; Couture, R.M.; Larssen, T.; Zhao, Y.; Lin, Y. Decline in Chinese lake phosphorus concentration accompanied by shift in sources since 2006. Nat. Geosci. 2017, 10, 507–511. [Google Scholar] [CrossRef]
- Yang, J.; Yan, D.; Yang, Q.; Gong, S.; Shi, Z.; Qiu, Q.; Hu, M. Fish species composition, distribution and community structure in the Fuhe River Basin, Jiangxi Province, China. Glob. Ecol. Conserv. 2021, 27, e01559. [Google Scholar] [CrossRef]
- Gao, S.B.; Chi, S.Y.; Li, S.X.; Zheng, J.X.; Dong, F.Y. Fish resource investigation and species diversity analysis of Nanxi River in Zhejiang Province. J. Hydroecol. 2017, 38, 72–81. [Google Scholar]
- Warwick, R.M. A new method for detecting pollution effects on marine macrobenthic communities. Mar. Biol. 1986, 92, 557–562. [Google Scholar] [CrossRef]
- Piperac, M.S.; Miloevi, D.; Simi, V. The application of the abundance/biomass comparison method on riverine fish assemblages: Limits of use in lotic systems. Biol. Nyssana 2015, 6, 25–32. [Google Scholar]
- Bu, H.; Liu, W.; Song, X.; Zhang, Q. Quantitative impacts of population on river water quality in the Jinshui River basin of the South Qinling Mts. China. Environ. Earth Sci. 2016, 75, 292. [Google Scholar] [CrossRef]
- Huang, J.; Zhang, Y.; Arhonditsis, G.B.; Gao, J.; Chen, Q.; Wu, N.; Shi, W. How successful are the restoration efforts of China’s lakes and reservoirs? Environ. Int. 2019, 123, 96–103. [Google Scholar] [CrossRef] [PubMed]
- Sada, R. Hanumante River: Emerging uses, competition and implications. Arab. J. Sci. Eng. 2012, 1, 17–24. [Google Scholar] [CrossRef]
- Gomes-Silva, G.; Cyubahiro, E.; Wronski, T.; Riesch, R.; Apio, A.; Plath, M. Water pollution affects fish community structure and alters evolutionary trajectories of invasive guppies (Poecilia reticulata). Sci. Total Environ. 2020, 730, 138912. [Google Scholar] [CrossRef] [PubMed]
- Kahlon, S.K.; Sharma, G.; Julka, J.M.; Kumar, A.; Sharma, S.; Stadler, F.J. Impact of heavy metals and nanoparticles on aquatic biota. Environ. Chem. Lett. 2018, 16, 919–946. [Google Scholar] [CrossRef]
- Braga, F.; Scarpa, G.M.; Brando, V.E.; Manfe, G.; Zaggia, L. COVID-19 lockdown measures reveal human impact on water transparency in the Venice Lagoon. Sci. Total Environ. 2020, 736, 139612. [Google Scholar] [CrossRef]
- Muduli, P.R.; Kumar, A.; Kanuri, V.V.; Mishra, D.R.; Mishra, D.R.; Sudhakar, A. Water quality assessment of the Ganges River during COVID-19 lockdown. Int. J. Environ. Sci. Technol. 2021, 18, 1645–1652. [Google Scholar] [CrossRef]
- Cooper, M.J.; Martin, R.V.; Hammer, M.S.; Levelt, P.F.; Veefkind, P.; Lamsal, L.N. Global fine-scale changes in ambient NO2 during COVID-19 lockdowns. Nature 2022, 601, 380–387. [Google Scholar] [CrossRef]
- Xiong, W.; Huang, X.; Chen, Y.; Fu, R.; Du, X.; Chen, X.; Zhan, A. Zooplankton biodiversity monitoring in polluted freshwater ecosystems: A technical review. Environ. Sci. Ecotechnol. 2020, 1, 100008. [Google Scholar] [CrossRef]
- Sommer, U.; Adrian, R.; De, L.; Domis, S.; Elser, J.J.; Gaedke, U.; Winder, M. Beyond the Plankton Ecology Group (PEG) Model: Mechanisms Driving Plankton Succession. Annu. Rev. Ecol. Evol. Sci. 2012, 43, 429–448. [Google Scholar] [CrossRef]
- Pan, J.Z.; Xiong, F.; Li, W.C.; Li, Y.X. Spatial-temporal dynamic changes of the water transparency and their influencing factors in Lake Fuxian, Yunnan Province. J. Lake Sci. 2008, 20, 681–686. [Google Scholar] [CrossRef] [Green Version]
- Zhou, R.; Peng, S.T.; Qin, X.B.; Shi, H.H.; Ding, D.W. Phytoplankton assemblages and their relation to environmental factors by Multivariate Statistic Analysis in Bohai Bay. Chin. J. Environ. Sci. 2013, 34, 864–873. [Google Scholar] [CrossRef]
- Liu, Y.; Lv, J.P.; Liu, Q.; Xie, S.L.; Feng, J. Relationship between the growth of phytoplankton and the distribution of nutrients in the fenhe water storage area of taiyuan. Acta Ecol. Sin. 2018, 38, 991–1002. [Google Scholar] [CrossRef]
- Xu, H.; Chen, J.; Zhu, G.W.; Qin, B.Q.; Zhang, Y.L. Effect of concentrations of phosphorus and nitrogen on the dominance of cyanobacteria. J. Lake Sci. 2019, 31, 1239–1247. [Google Scholar] [CrossRef] [Green Version]
- Friedrich, G.; Viehweg, M. Recent developments of the phytoplankton and its activity in the Lower Rhine. SIL Proc. 2017, 22, 1992–2010. [Google Scholar] [CrossRef]
- Hu, J.; Chi, S.Y.; Hu, J.X. Partial Canonical Correspondence Analysis of Phytoplankton Community and Environmental Factors in Nansihu Lake. Environ. Sci. Technol. 2020, 43, 33–39. [Google Scholar]
- Cardinale, B.J.; Duffy, J.E.; Gonzalez, A.; Hooper, D.U.; Perrings, C.; Venail, P. Biodiversity loss and its impact on humanity. Nature 2012, 486, 59–67. [Google Scholar] [CrossRef] [Green Version]
- Huang, L.L.; Wu, Z.Q.; Li, J.H. Fish fauna, biogeography and conservation of freshwater fish in Poyang Lake Basin, China. Environ. Biol. Fish. 2013, 96, 1229–1243. [Google Scholar] [CrossRef]
- Fulton, E.A.; Smith, A.D.; Smith, D.C.; van Putten, I.E. Human behaviour: The key source of uncertainty in fisheries management. Fish. Fish. 2011, 12, 2–17. [Google Scholar] [CrossRef]
- Willby, N.J.; Eaton, J.W. Backwater habitats and their role in nature conservation on navigable waterways. Hydrobiologia 1996, 340, 333–338. [Google Scholar] [CrossRef]
- Chen, K.; Olden, J.D. Threshold responses of riverine fish communities to land use conversion across regions of the world. Glob. Chang. Biol. 2020, 26, 4952–4965. [Google Scholar] [CrossRef]
- Connell, J.H. Diversity in coral reefs and tropical rainforests. Science 1978, 199, 1302–1310. [Google Scholar] [CrossRef] [PubMed] [Green Version]
- Li, Y.F.; Li, X.H.; Yang, J.P.; Lek, S.; Shuai, F.M.; Li, J. Effect of Pearl River closed fishing on Megalobrama hoffmanni recruitment stock. J. Fish. 2014, 38, 503–509. [Google Scholar]
- Heino, J.; Soininen, J.; Alahuhta, J.; Lappalainen, J.; Virtanen, R. A comparative analysis of metacommunity types in the freshwater realm. Ecol. Evol. 2015, 5, 1525–1537. [Google Scholar] [CrossRef] [PubMed]
- Karr, J.R. Seasonality, Resource Availability, and Community Diversity in Tropical Bird Communities. Am. Nat. 1976, 110, 973–994. [Google Scholar] [CrossRef]
- Cheng, J.H.; Yan, L.P.; Lin, L.S.; Yu, L.F.; Liu, Z.F.; Zhou, Y.D. Analyses on the fishery ecological effect of summer close season in the East China Sea region. J. Fish. Sci. 1999, 6, 81–85. [Google Scholar]
Figure 1.
Sampling sites in the middle reaches of the Yangtze River.

Figure 2.
Mean values of different water quality parameters in Shishou (a) and Jiayu (b) river reaches in different years; the associated bars represent standard deviations. The letters above the error bar represent statistically significant differences in the variables (p < 0.05).
Figure 2.
Mean values of different water quality parameters in Shishou (a) and Jiayu (b) river reaches in different years; the associated bars represent standard deviations. The letters above the error bar represent statistically significant differences in the variables (p < 0.05).

Figure 3.
Variation characteristics of phytoplankton and zooplankton density in Shishou (a,b) and Jiayu (c,d) river reaches, respectively, in different years.
Figure 3.
Variation characteristics of phytoplankton and zooplankton density in Shishou (a,b) and Jiayu (c,d) river reaches, respectively, in different years.

Figure 4.
Percentage of fish species by ecological types in Shishou (a) and Jiayu (b) river reaches in different years. #Ecotypes: H, herbivorous; C, carnivorous; O, omnivorous; RL, river–lake migration; R, resident; RS, river–sea migration.
Figure 4.
Percentage of fish species by ecological types in Shishou (a) and Jiayu (b) river reaches in different years. #Ecotypes: H, herbivorous; C, carnivorous; O, omnivorous; RL, river–lake migration; R, resident; RS, river–sea migration.

Figure 5.
Abundance−biomass comparison curves (ABC) and W−statistics of fish communities in the Shishou (a,b) and Jiayu (c,d) river reaches in different years.
Figure 5.
Abundance−biomass comparison curves (ABC) and W−statistics of fish communities in the Shishou (a,b) and Jiayu (c,d) river reaches in different years.

Figure 6.
Variation in values of the fish community diversity index in Shishou (a) and Jiayu (b) river reaches in different years. D: Margalef species richness index; H′: Shannon−Wiener diversity index; J′: Pielou’s evenness index; λ′: Simpson dominance index.
Figure 6.
Variation in values of the fish community diversity index in Shishou (a) and Jiayu (b) river reaches in different years. D: Margalef species richness index; H′: Shannon−Wiener diversity index; J′: Pielou’s evenness index; λ′: Simpson dominance index.

Publisher’s Note: MDPI stays neutral with regard to jurisdictional claims in published maps and institutional affiliations. |
© 2022 by the authors. Licensee MDPI, Basel, Switzerland. This article is an open access article distributed under the terms and conditions of the Creative Commons Attribution (CC BY) license (https://creativecommons.org/licenses/by/4.0/).
Share and Cite
MDPI and ACS Style
Fang, D.; Yang, H.; Zhang, H.; Du, H.; Yang, J.; Wei, Q. COVID-19 Lockdowns Promoted Recovery of the Yangtze River’s Aquatic Ecosystem. Water 2022, 14, 3622. https://doi.org/10.3390/w14223622
AMA Style
Fang D, Yang H, Zhang H, Du H, Yang J, Wei Q. COVID-19 Lockdowns Promoted Recovery of the Yangtze River’s Aquatic Ecosystem. Water. 2022; 14(22):3622. https://doi.org/10.3390/w14223622
Chicago/Turabian StyleFang, Dongdong, Haile Yang, Hui Zhang, Hao Du, Junlin Yang, and Qiwei Wei. 2022. "COVID-19 Lockdowns Promoted Recovery of the Yangtze River’s Aquatic Ecosystem" Water 14, no. 22: 3622. https://doi.org/10.3390/w14223622
Note that from the first issue of 2016, this journal uses article numbers instead of page numbers. See further details here.