Article

A Location Selection Method for Wastewater Treatment Plants Integrating Dynamic Change of Water Ecosystem and Socio-Cultural Indicators: A Case Study of Phnom Penh

1
School of Geography and Information Engineering, China University of Geosciences, Wuhan 430074, China
2
School of Public Administration, China University of Geosciences, Wuhan 430074, China
3
Key Laboratory of Geological Exploration and Evaluation, Ministry of Education, China University of Geosciences, Wuhan 430074, China
4
National Engineering Research Center for Geographic Information System, China University of Geosciences, Wuhan 430074, China
*
Authors to whom correspondence should be addressed.
Water 2022, 14(22), 3637; https://doi.org/10.3390/w14223637
Submission received: 17 October 2022 / Revised: 6 November 2022 / Accepted: 9 November 2022 / Published: 11 November 2022
(This article belongs to the Section Water Resources Management, Policy and Governance)

Abstract

:
The selection of reasonable locations for urban wastewater treatment plants (WWTPs) is significant in controlling water pollution. However, most current WWTP location selection models focus only on population density, industrial zone scale and geographic elements, while ignoring water pollution and local socio-cultural indicators. We propose a novel indicator system from RS/GIS data to select reasonable locations for WWTPs in Phnom Penh to avoid water environmental deterioration and harm to human health. The frequency of occurrence of water eutrophication is derived from time series RS data and reveals the degree of pollution of local water ecosystems, and is included as a demand indicator for the first time. In order to respect local socio-cultural customs, buffer zones for religious sites are included in the indicator system for the first time to fully determine the zones where construction of WWTPs is forbidden. Subsequently, WWTP locations are selected with the fusion of the minimized facilities number and maximum coverage models. The results demonstrate that the selected locations are all highly suitable and outside zones where construction is forbidden. The method proposed in the article provides a more comprehensive and scientific perspective for WWTP location selection.

1. Introduction

With population growth and expanding economies, wastewater treatment is becoming increasingly important in many countries. It has been estimated that 90% of wastewater in undeveloped countries is dumped directly into streams, ponds, or seas [1]. This may cause human health problems, damage to water ecosystems, and ultimately lead to a shortage of clean water [2]. At present, the construction of wastewater treatment plants (WWTPs) is an important method to solve problems of water pollution, and many treatments are shifting toward resource recovery [3,4] to address the water pollution crisis. In developed countries, such as Spain, there is an increasing number of WWTPs oriented towards chemical recovery or sludge thickening [5]. However, resource recovery is very uncommon in Cambodia [
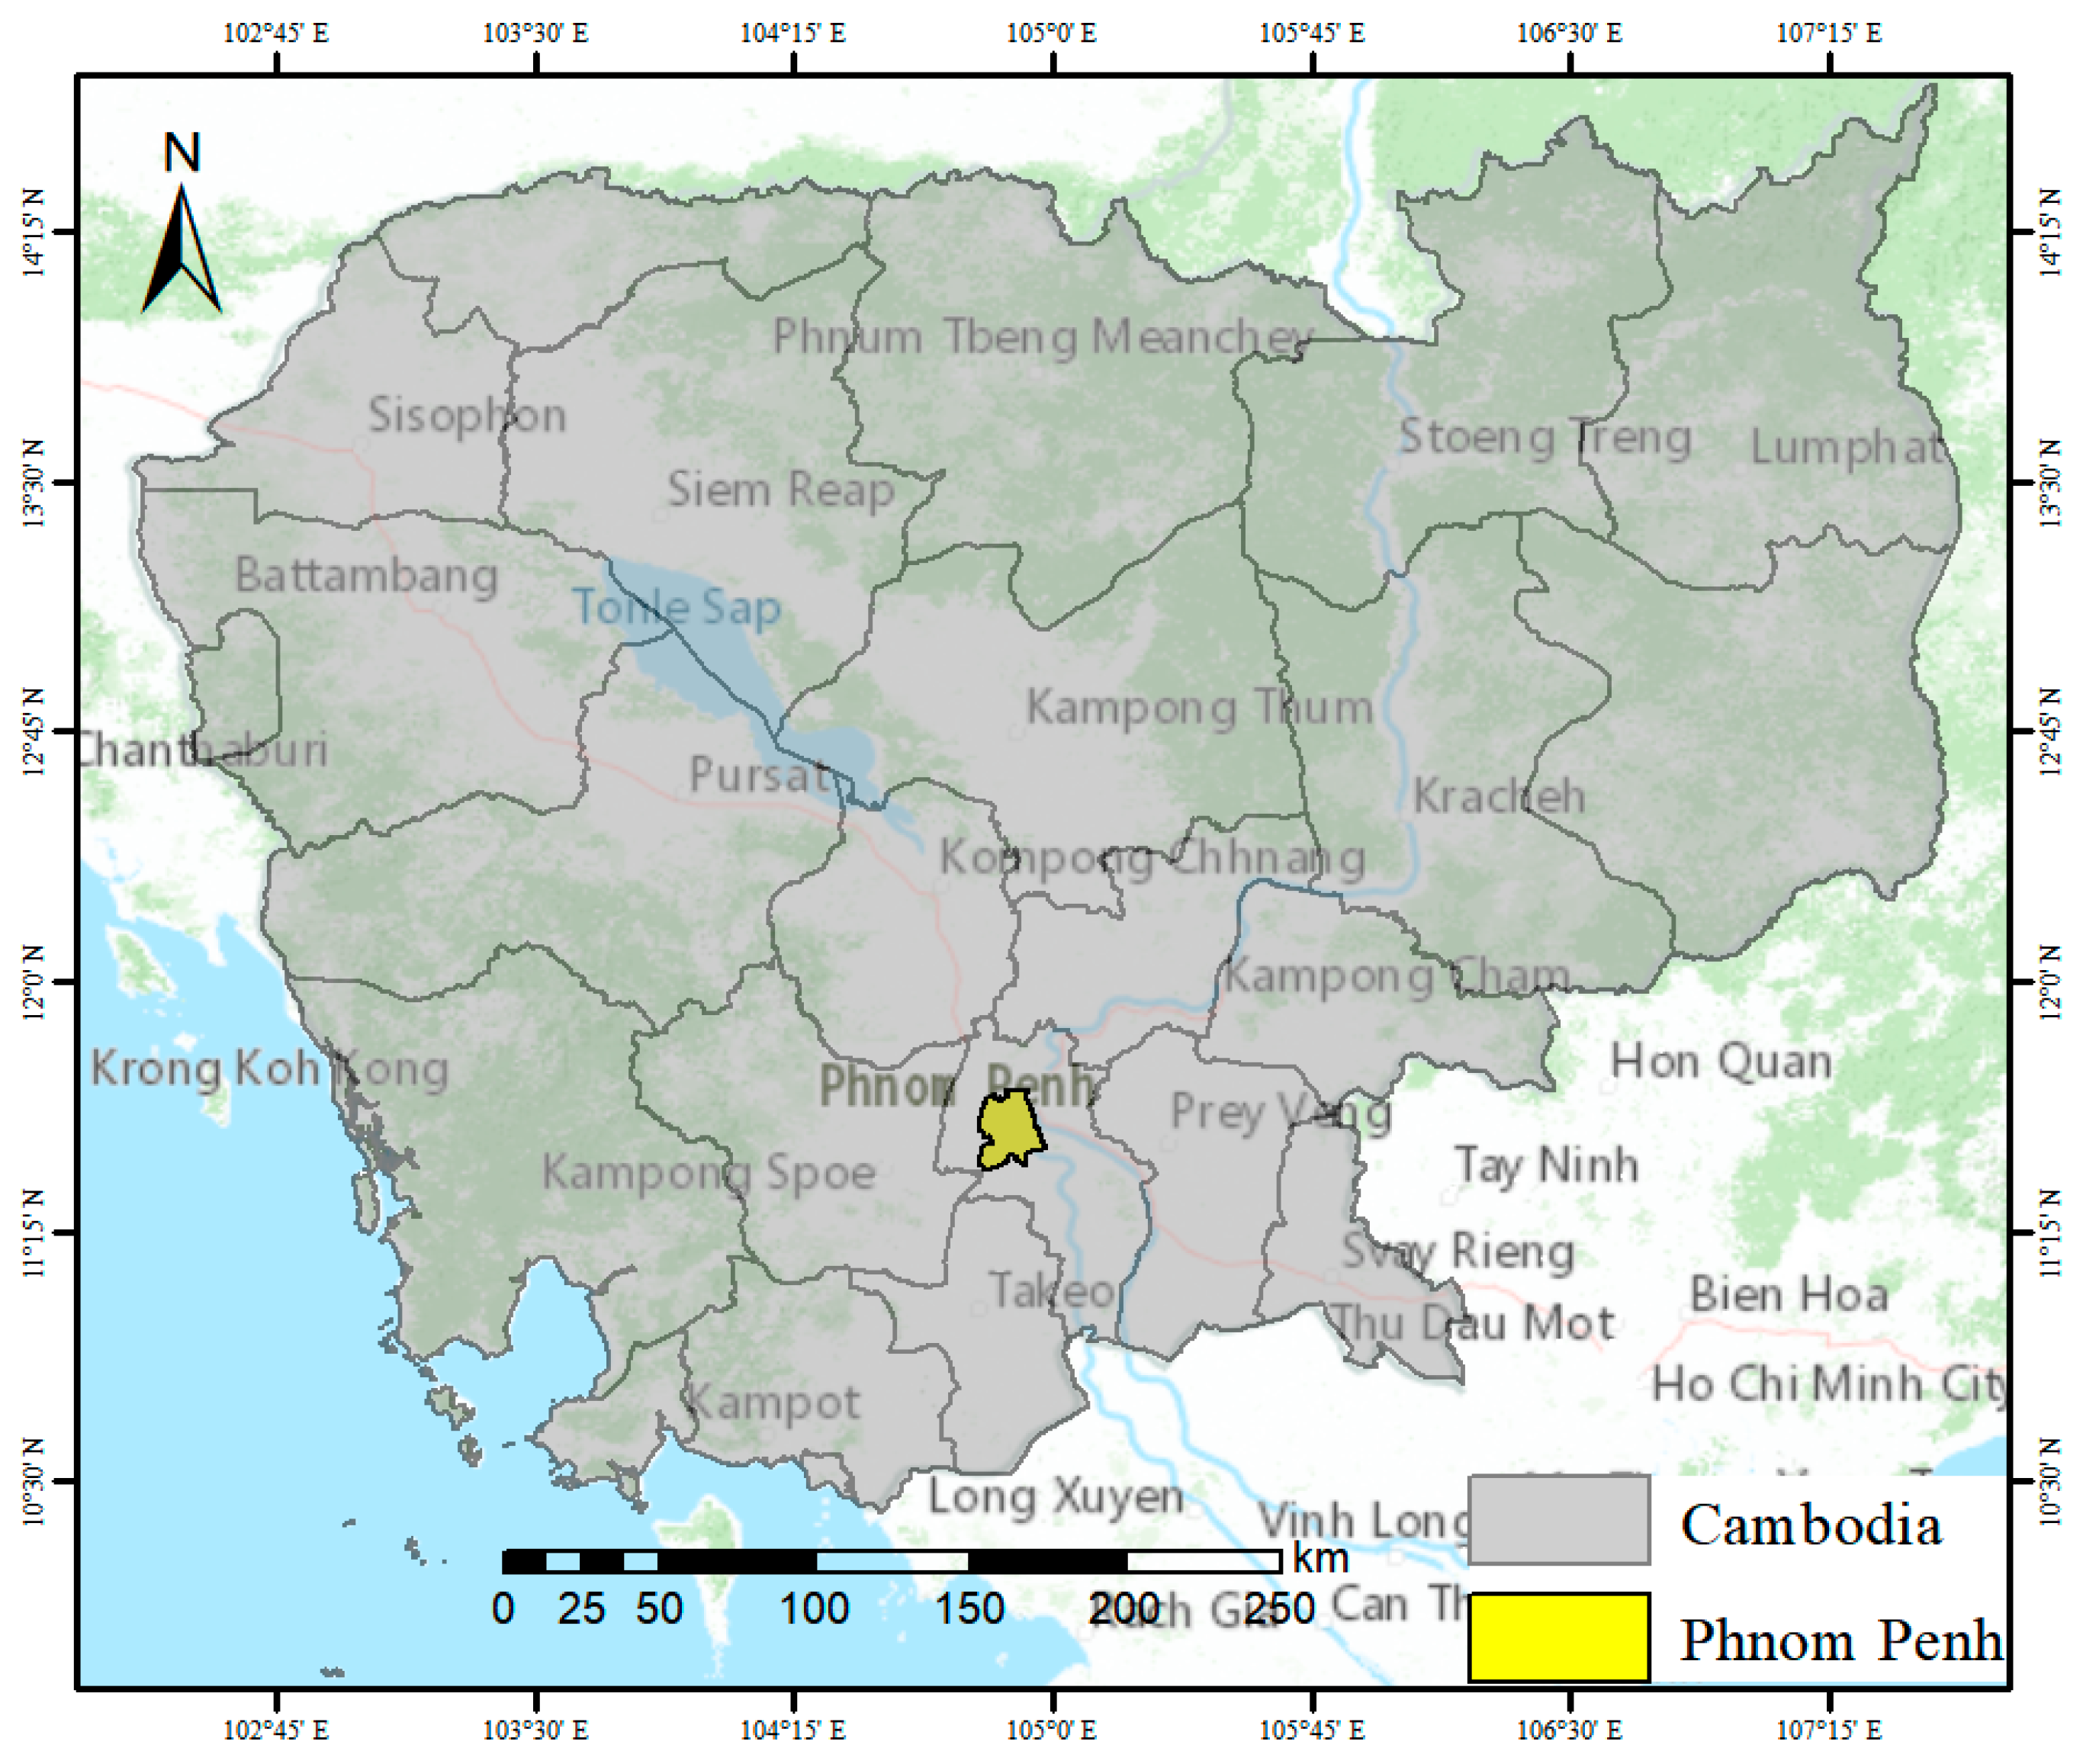
6]. Infrastructure for wastewater collection and treatment is lacking in Phnom Penh. There are lots of polluted rivers and lakes in the southern and northern regions of Phnom Penh due to the direct discharge of wastewater. Additionally, the discharges may pollute nearby surface and underground water bodies through seepage, which will exacerbate environmental difficulties and the health of the surrounding water resources [7,8,9,10]. In order to reduce these negative effects, the construction of WWTPs should be improved. Therefore, the reasonable location selection of WWTPs is especially important [11].
Numerous studies have investigated the location selection of urban infrastructure [12,13,14,15], hospital sites [16,17,18], emergency shelters [19,20,21], landfill sites [22,23,24] and power plants [25,26,27]. However, the theoretical model for WWTP location selection is different from that of other types of urban infrastructure. Due to the special characteristics of the WWTPs, the location selection should consider not only the demand for WWTPs and the suitability of the construction site, but also forbidden construction zones according to laws and regulations. Since geographic information system (GIS) can manage multiple sources and large amounts of spatial data [28], the location of WWTPs can be determined using GIS by analyzing various indicators, including topography, prevailing wind direction, hydrology, land use type, and spatial distribution of surface water [29,30,31]. Various location selection models have been investigated thoroughly for WWTPs, such as a model combining artificial neural networks [32] with the genetic algorithm, a model based on fuzzy logic and multi-criteria decision creation [33], a multi-objective optimization model for two-fold optimization of price and energy consumption [34], models combining GIS and the analytic hierarchy process (AHP) with remote sensing (RS) techniques [35,36,37], and models using GIS integrated with the AHP [38,39,40].
However, the majority of current WWTPs location selection models only focus on geographic elements, while ignoring dynamic changes to the water ecosystem caused by WWTPs and local socio-cultural indicators. In the current work, for water ecosystems, time series RS data are used to derive the spatial and temporal distribution of the eutrophication level of water bodies, which reveals patterns of surface water ecological change, and is included in the demand indicators. Additionally, in terms of social-cultural indicators, WWTPs should be located far away from religious sites. Hence, the buffer zones determined from religious point of interest (POI) data should be integrated into the exclusion indicators. Finally, the model of minimized facilities number and the model of maximum coverage are combined to determine the locations of WWTPs. An empirical study is conducted in Phnom Penh, Cambodia, in order to enhance the facility service coverage of WWTPs effectively while respecting local socio-cultural customs fully and considering dynamic changes in water ecology.

2. Methods

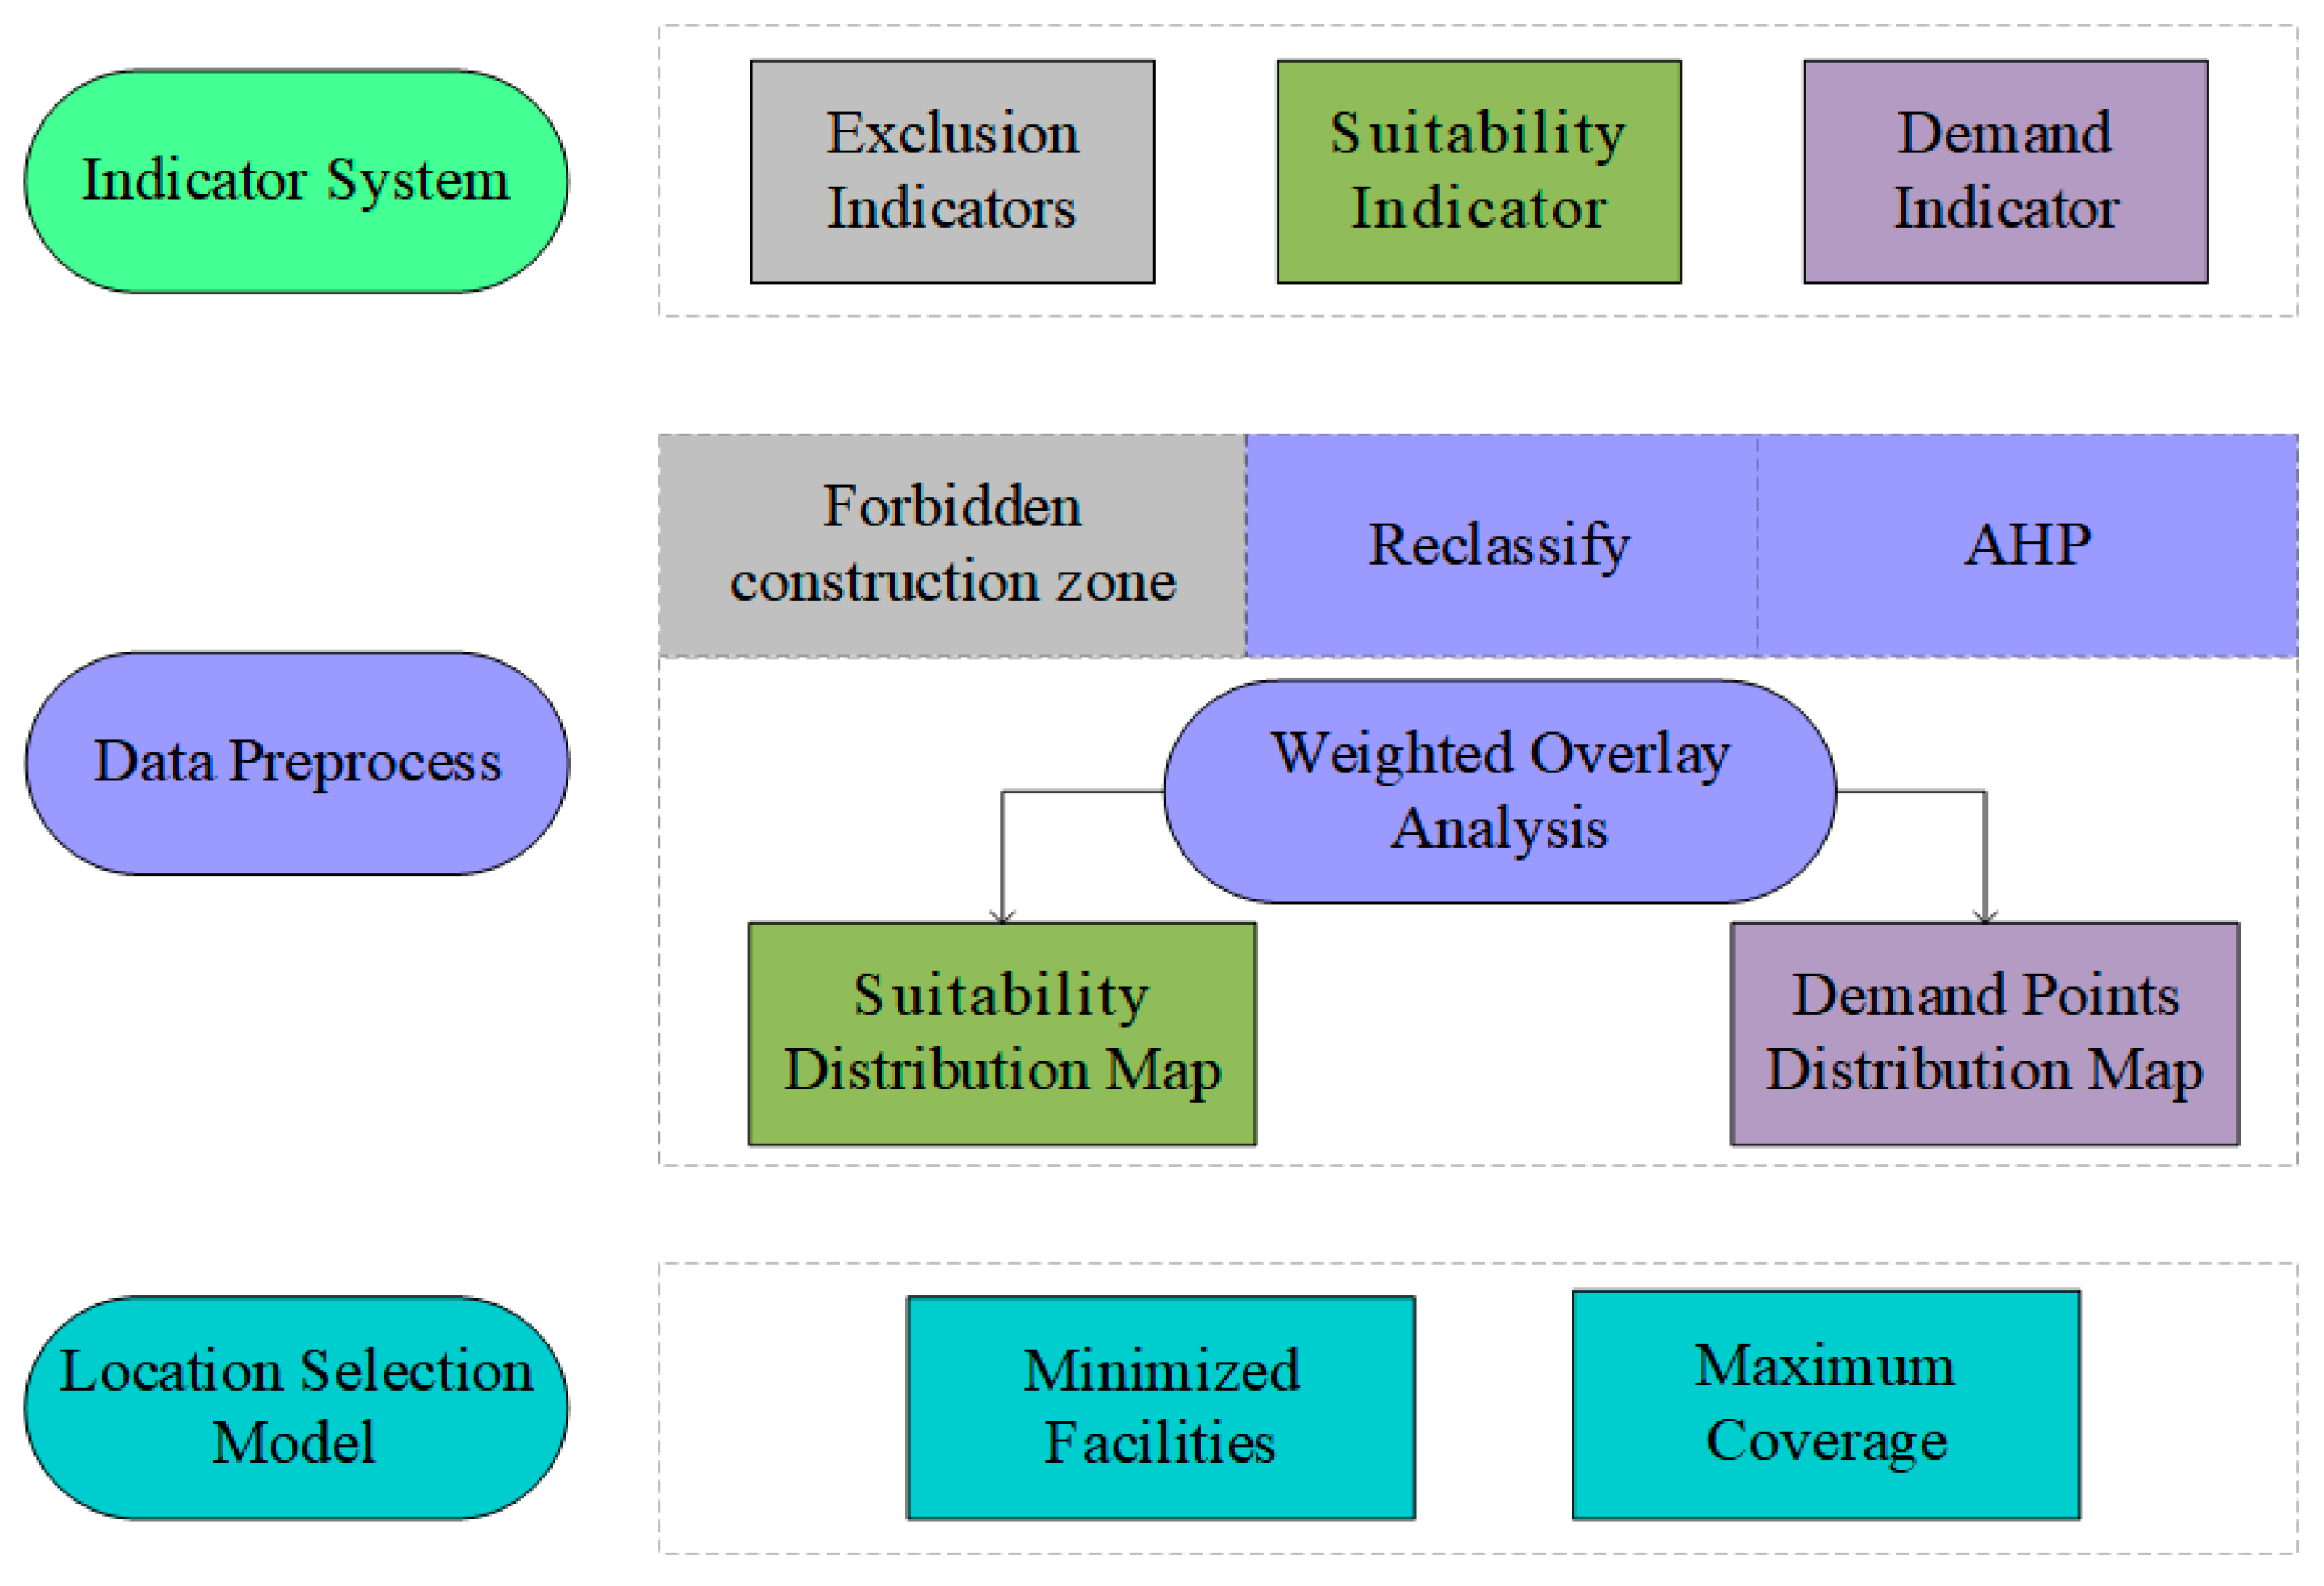
The proposed WWTPs location selection method consists of three steps: Firstly, a novel indicator system is established. Due to the varying degrees of influence among indicators, the AHP is used to determine each indicator’s weight. Secondly, a weighted overlay analysis is applied to obtain the demand points map and the suitability map of WWTPs by the established indicator system. Finally, the locations for WWTPs are chosen by minimized facilitates and maximum coverage models. The main steps are depicted in Figure 1.

2.1. The Indicator System

The indicator system adopted by this study consists of exclusion indicators, suitability indicators and demand indicators. The exclusion indicators are utilized to determine forbidden construction zones based on laws, regulations, experience, etc., which are determined by residence (f1), social-culture (f2), transportation (f3) and water body (f4). The suitability indicators are determined by slope (s1), hydrology (s2), river (s3), transportation (s4) and wind direction (s5), which evaluate suitable locations for the construction of WWTPs. The demand indicators represent the demand for WWTPs, which are determined by population density (q1), industrial zone (q2) and water ecological condition(q3).

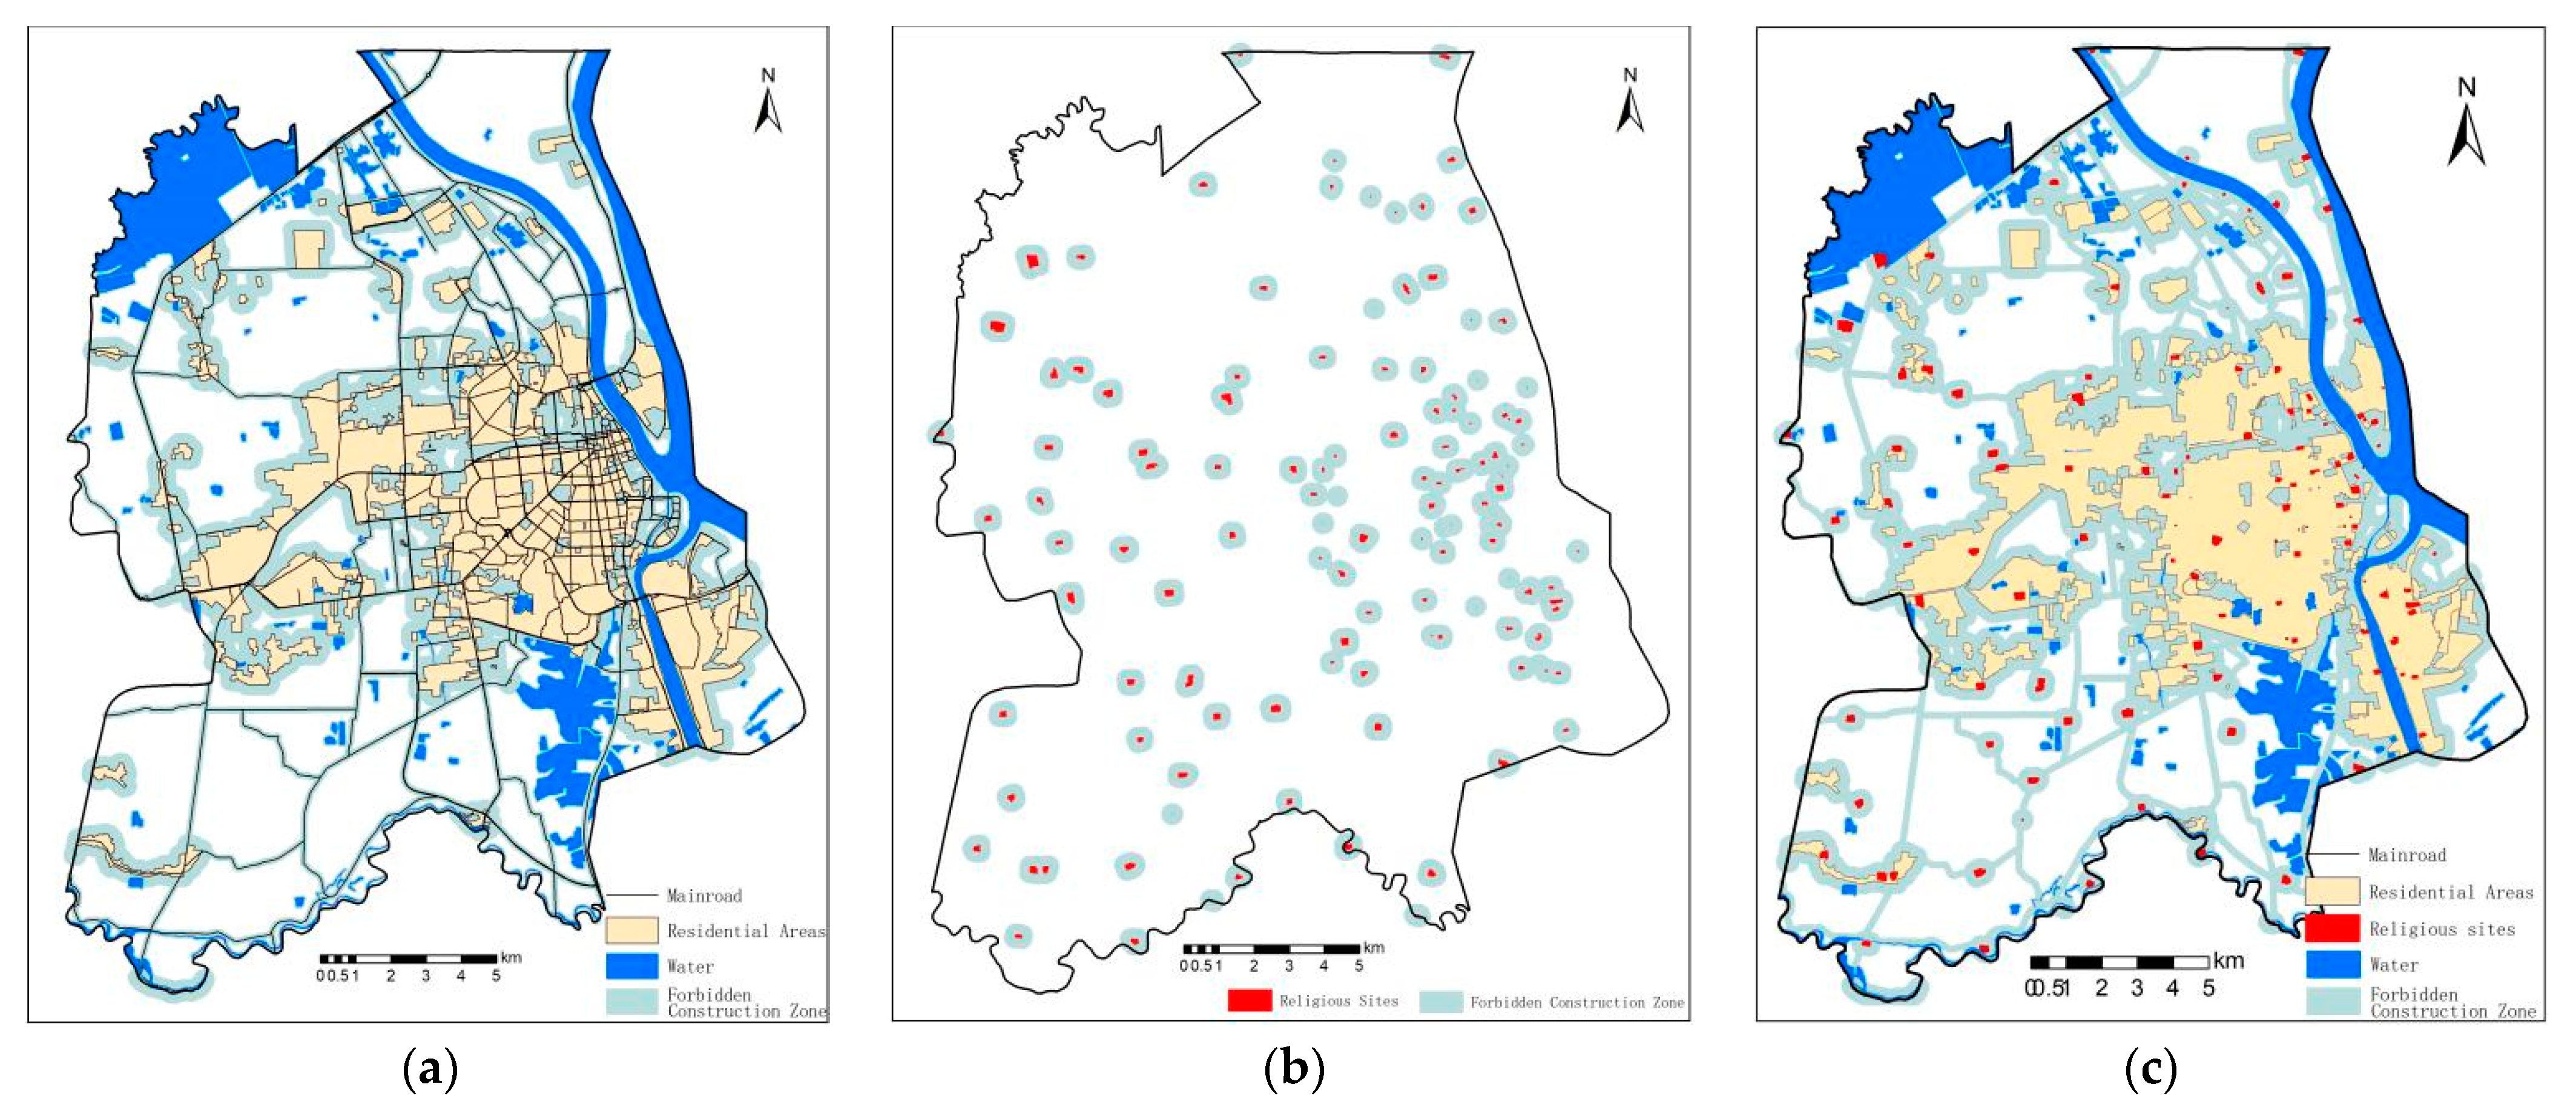
2.1.1. Exclusion Indicators

In Phnom Penh, religion plays an important role in society. In consideration of local socio-cultural factors, WWTPs should not be constructed close to religious sites (f1) in order to respect socio-cultural customs and prevent sludge and exhaust gas from polluting these areas. WWTPs affect public health, so a specified distance should be set to separate WWTPs and residential areas (f2). Additionally, WWTPs close to roads (f3) affect the landscape, and those close to water bodies (f4) contaminate water and fish. In conclusion, the buffer zones for neighborhoods, religious sites, main roads, and water bodies are established as forbidden construction zones, within which WWTPS cannot be constructed. The buffer distance of 300 m [41] is set for residential areas and religious sites, the buffer distance of 50 m is set for roads and water bodies; and the reclassification level of these regions is set to zero in Table 1, indicating WWTPs mustn’t be constructed in these areas.

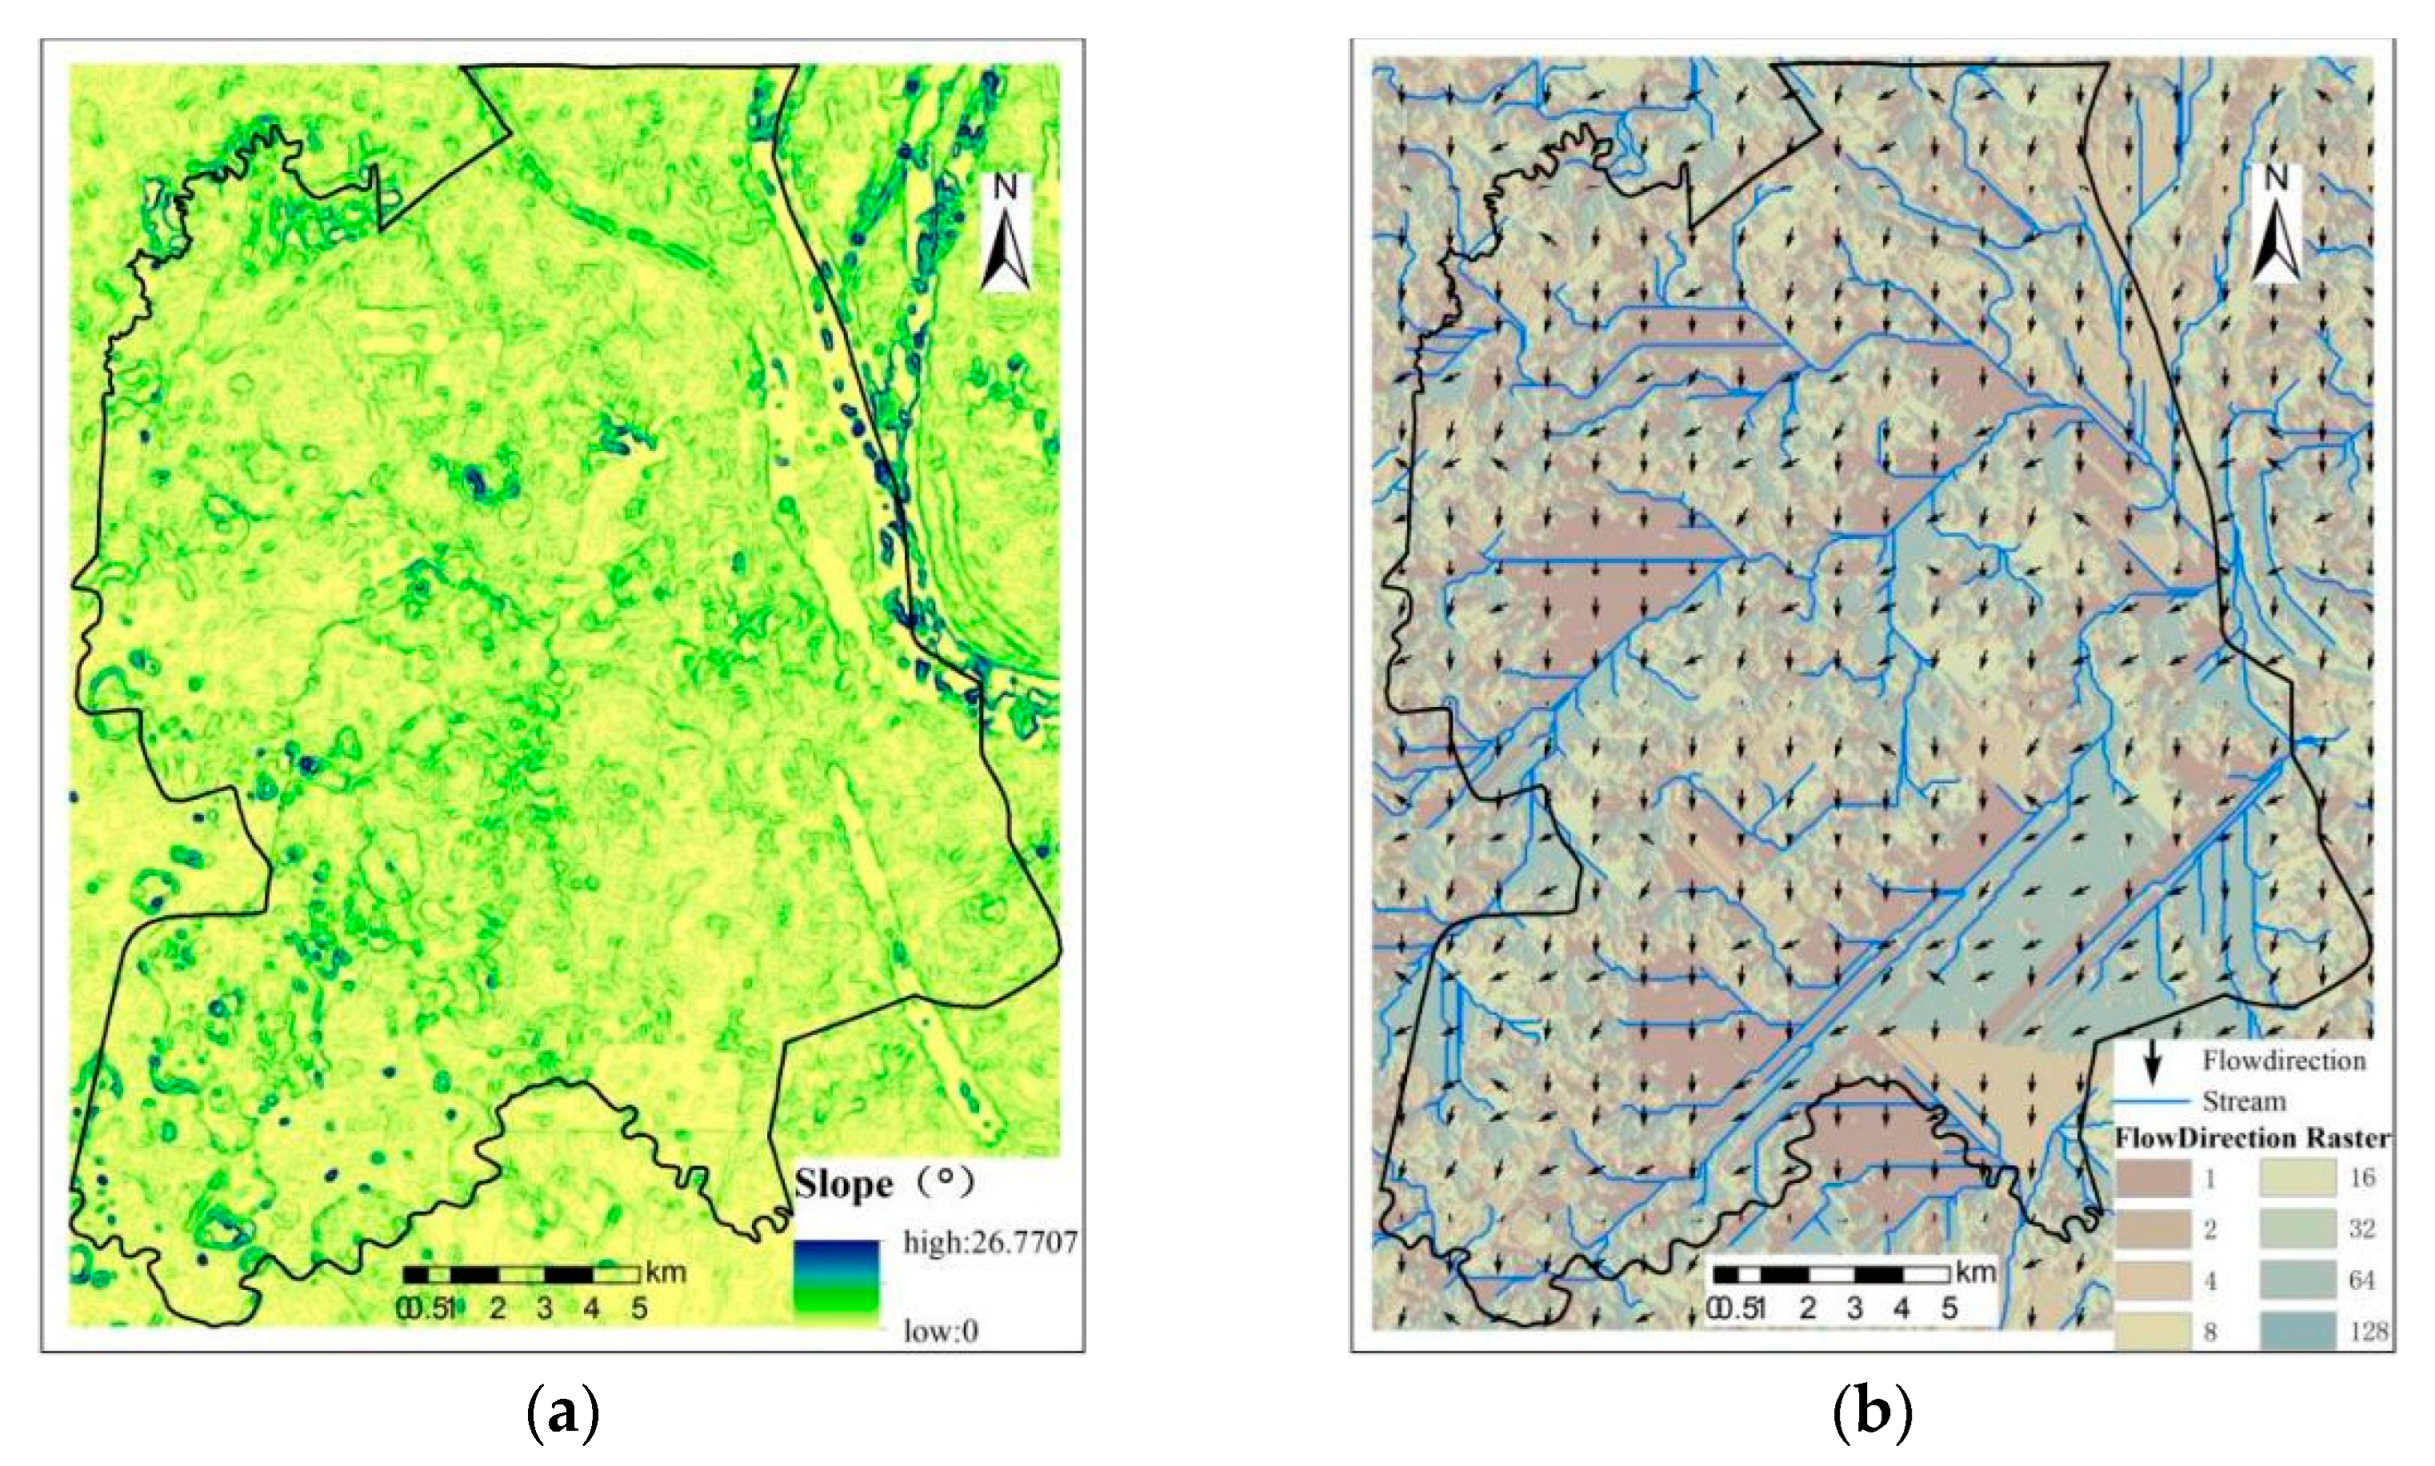
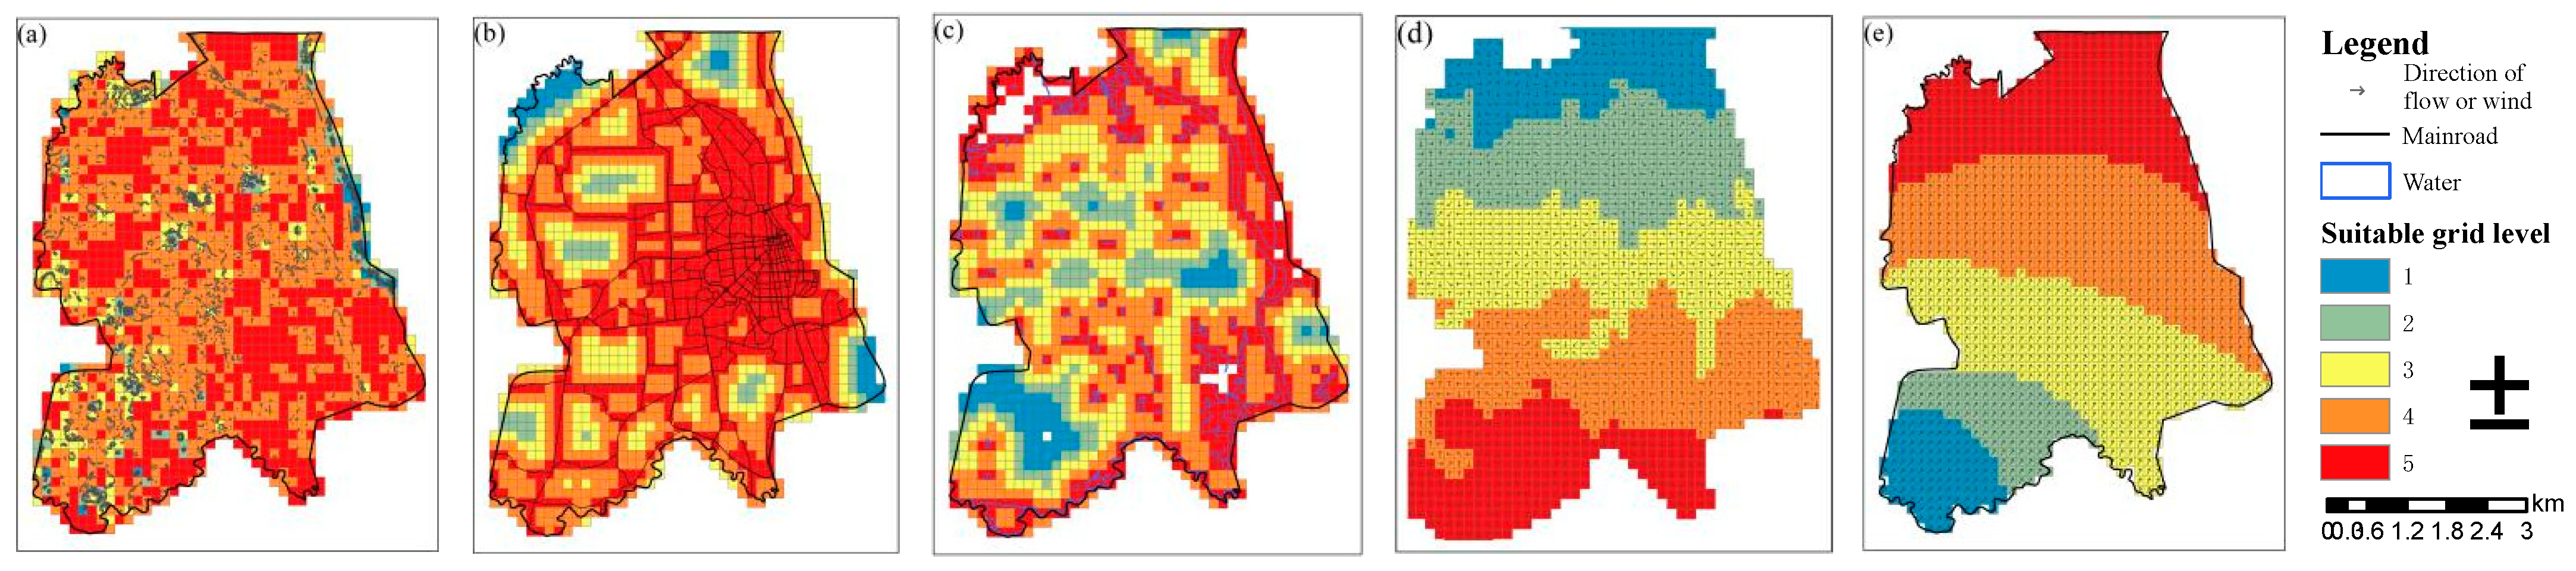
2.1.2. Suitability Indicators

WWTPs should be built on mild-to-moderate slope (s1) to make use of the natural flow of wastewater. Additionally, taking into account the direction of water flow, WWTPs should be built downstream of rivers (s2). WWTPs locations should be selected not too far from rivers (s3) and roads (s4), in order to reduce the expense of transporting extra sludge and building additional pipeline networks [42]. Given that WWTPs emit hazardous gases, their locations should be in downwind (s5) areas in order to promote the diffusion of harmful gases during wastewater processing and reduce contamination of the environment.
The suitability indicators are listed in Table 2, which are reclassified into five levels, with the higher the level, the more suitable for WWTP construction.

2.1.3. Demand Indicators

Residential domestic wastewater, industrial wastewater, and a small amount of wastewater released from other sources make up the majority of sources of urban wastewater [43]. In this study, population density is used to assess the demand for WWTPs in residential regions, and the demand for WWTPs is higher in more densely populated areas. The demand from industrial zones for WWTPs should receive more attention since wastewater is discharged at higher rates from industrial zones than from residential domestic areas. The demand from industrial zones for WWTPs is assessed based on the scale of industrial activity, which depends on the category, quantity, layout, construction and local environment conditions [44]. For the same scale of industrial activity, the demand from industrial zones is conducted by distance analysis, from proximity to distance, with a higher demand level for closer areas.
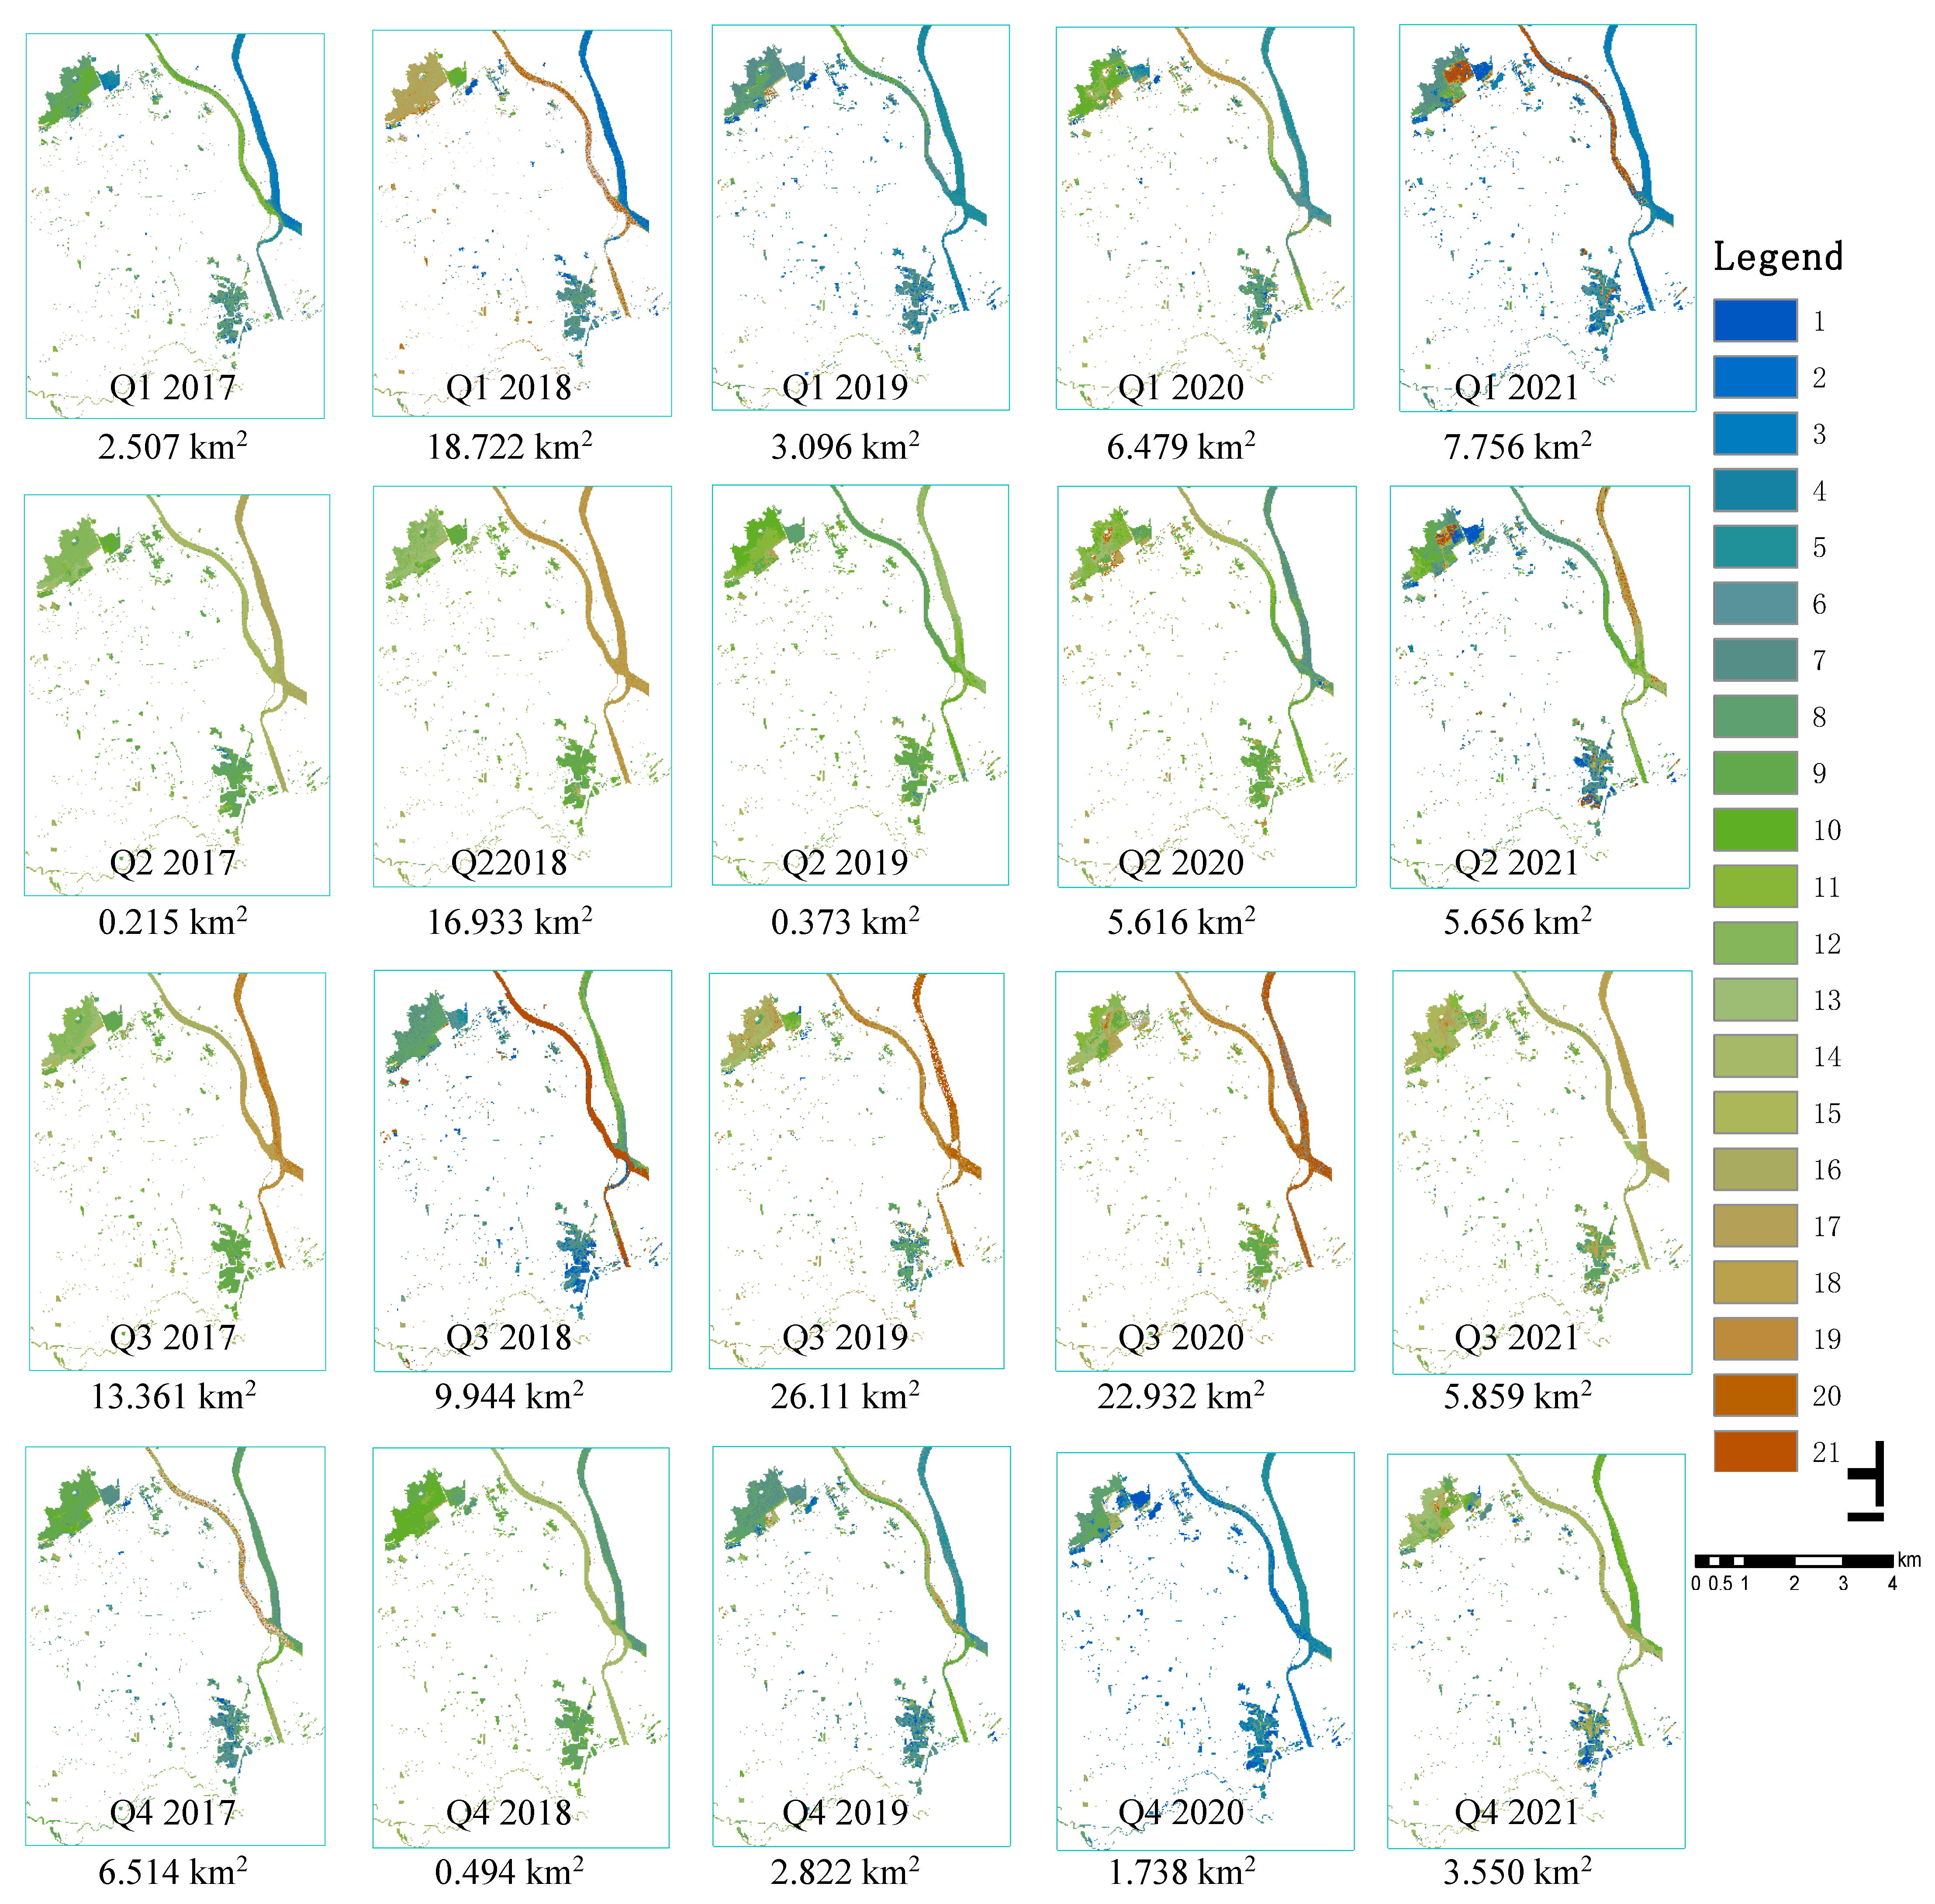
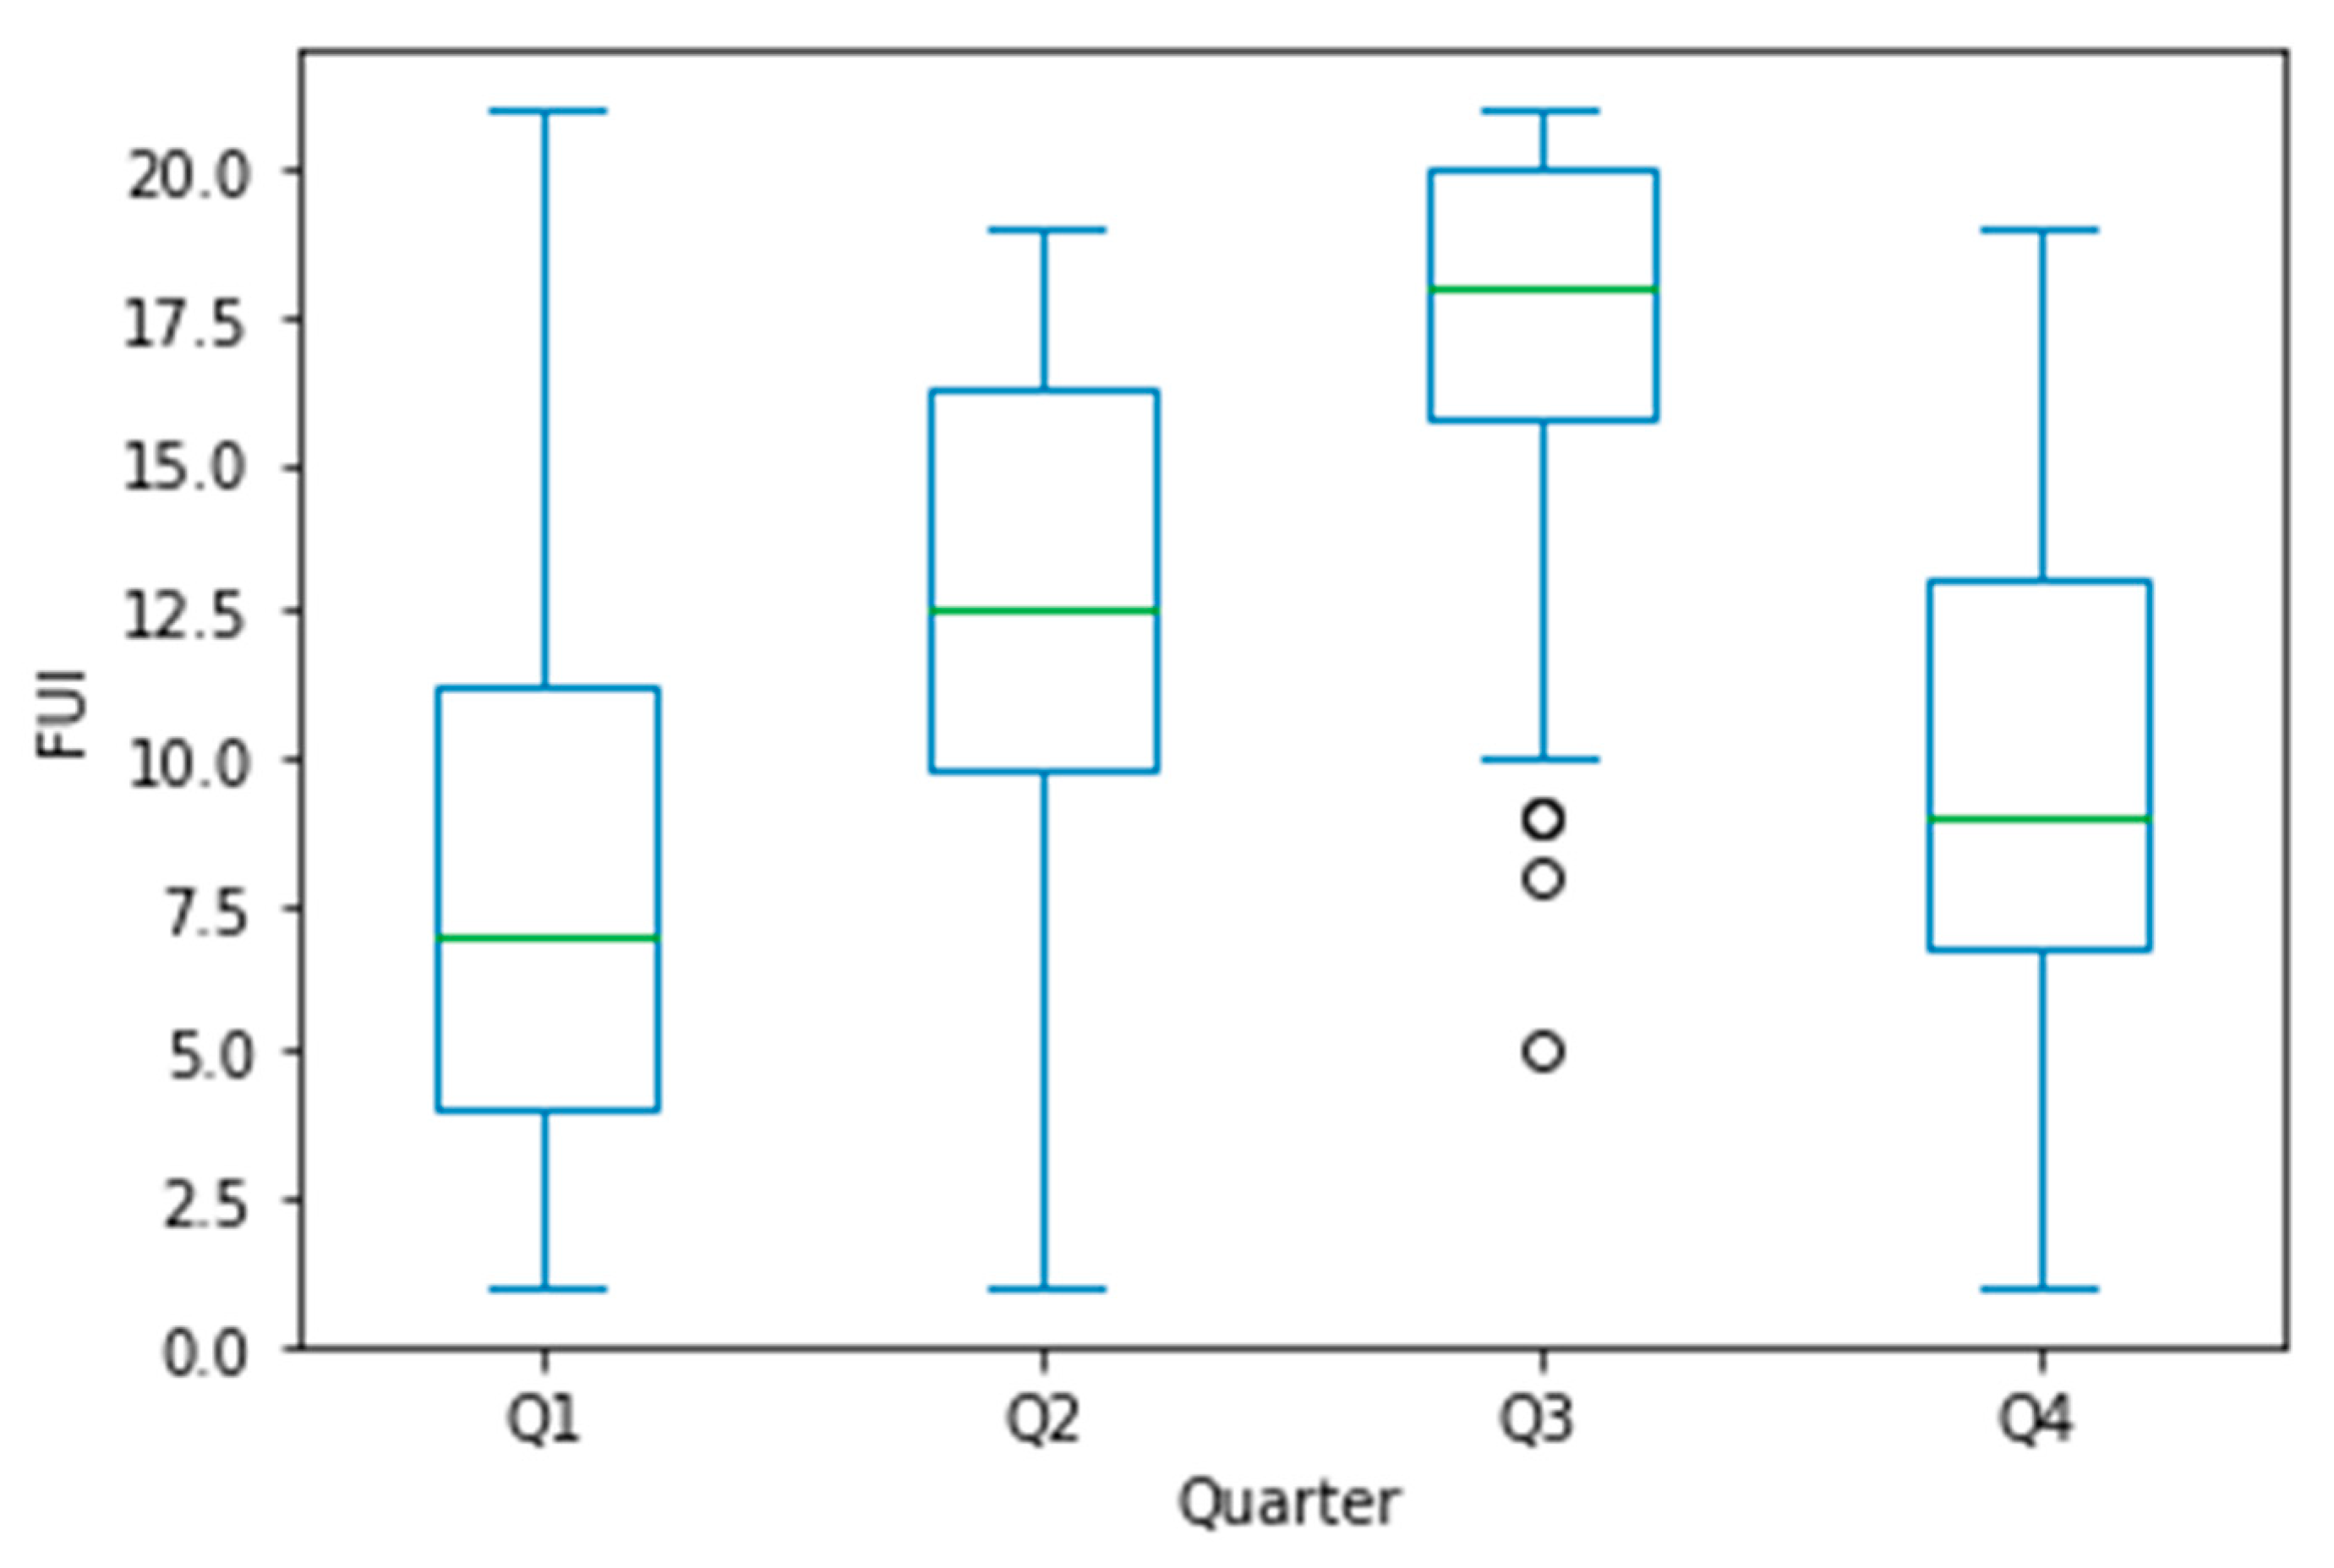
Due to the impact of human activity and climate change, the water ecosystem is constantly changing. Water-color RS is a trustworthy method for evaluating the degree of eutrophication of water bodies, and it is beneficial in monitoring the dynamics of water ecosystems with a strong correlation to chlorophyll concentration and other water quality parameters. In water-color RS, the Forel–Ule Index (FUI) can reflect the water quality state [45]. By analyzing the degree of eutrophication of a water body derived from FUI acquired over a number of years, the demand for WWTPs can be obtained from the ecological state of a surface water body. Specifically, the FUI can be used to determine five states [46]: ① “poor eutrophic” state (0 < FUI < 5,) ② “relatively poor eutrophic” state (5 ≤ FUI < 9); ③ “medium eutrophic” state (9 ≤ FUI < 13); ④ “relatively eutrophic” state (13 ≤ FUI < 17,); ⑤ “eutrophic” state (17 ≤FUI ≤ 21). The higher the eutrophication state, the large the FUI value, and the greater the demand for WWTPs. Additionally, the frequency of occurrence of eutrophication is defined as the frequency of occurrence of the “eutrophic” state (17 ≤ FUI ≤ 21) in the monitoring period by RS data; while eutrophication proportion is calculated according to Equation (1), which reflects the water ecosystem condition.
E ( n ) = G T
where E denotes the eutrophication proportion, G is the number of annual quarters with FUI greater than 16 in each grid, T is the total number of quarters, and n is the n-th grid.
In Table 3, the demand indicators are reclassified into five levels, and the higher the reclassification level, the higher the demand for WWTPs.

2.2. Indicator Layer Processing

Outside the forbidden construction zones, we resample five suitability indicators (slope s1, flow direction s2, distance from roads s3, distance from rivers s4 and wind direction s5) into 500 m × 500 m grids, respectively. Then, these are combined into an overall suitability level S according to Equation (2). The higher the value of the indicator S, the more suitable these areas are for constructing WWTPs. The APH is applied to determine the five indicators’ weight.
S = v = 1 5 ω v · s v
where v denotes the v-th suitability indicator, ω is the weight of the v-th indicator, and s
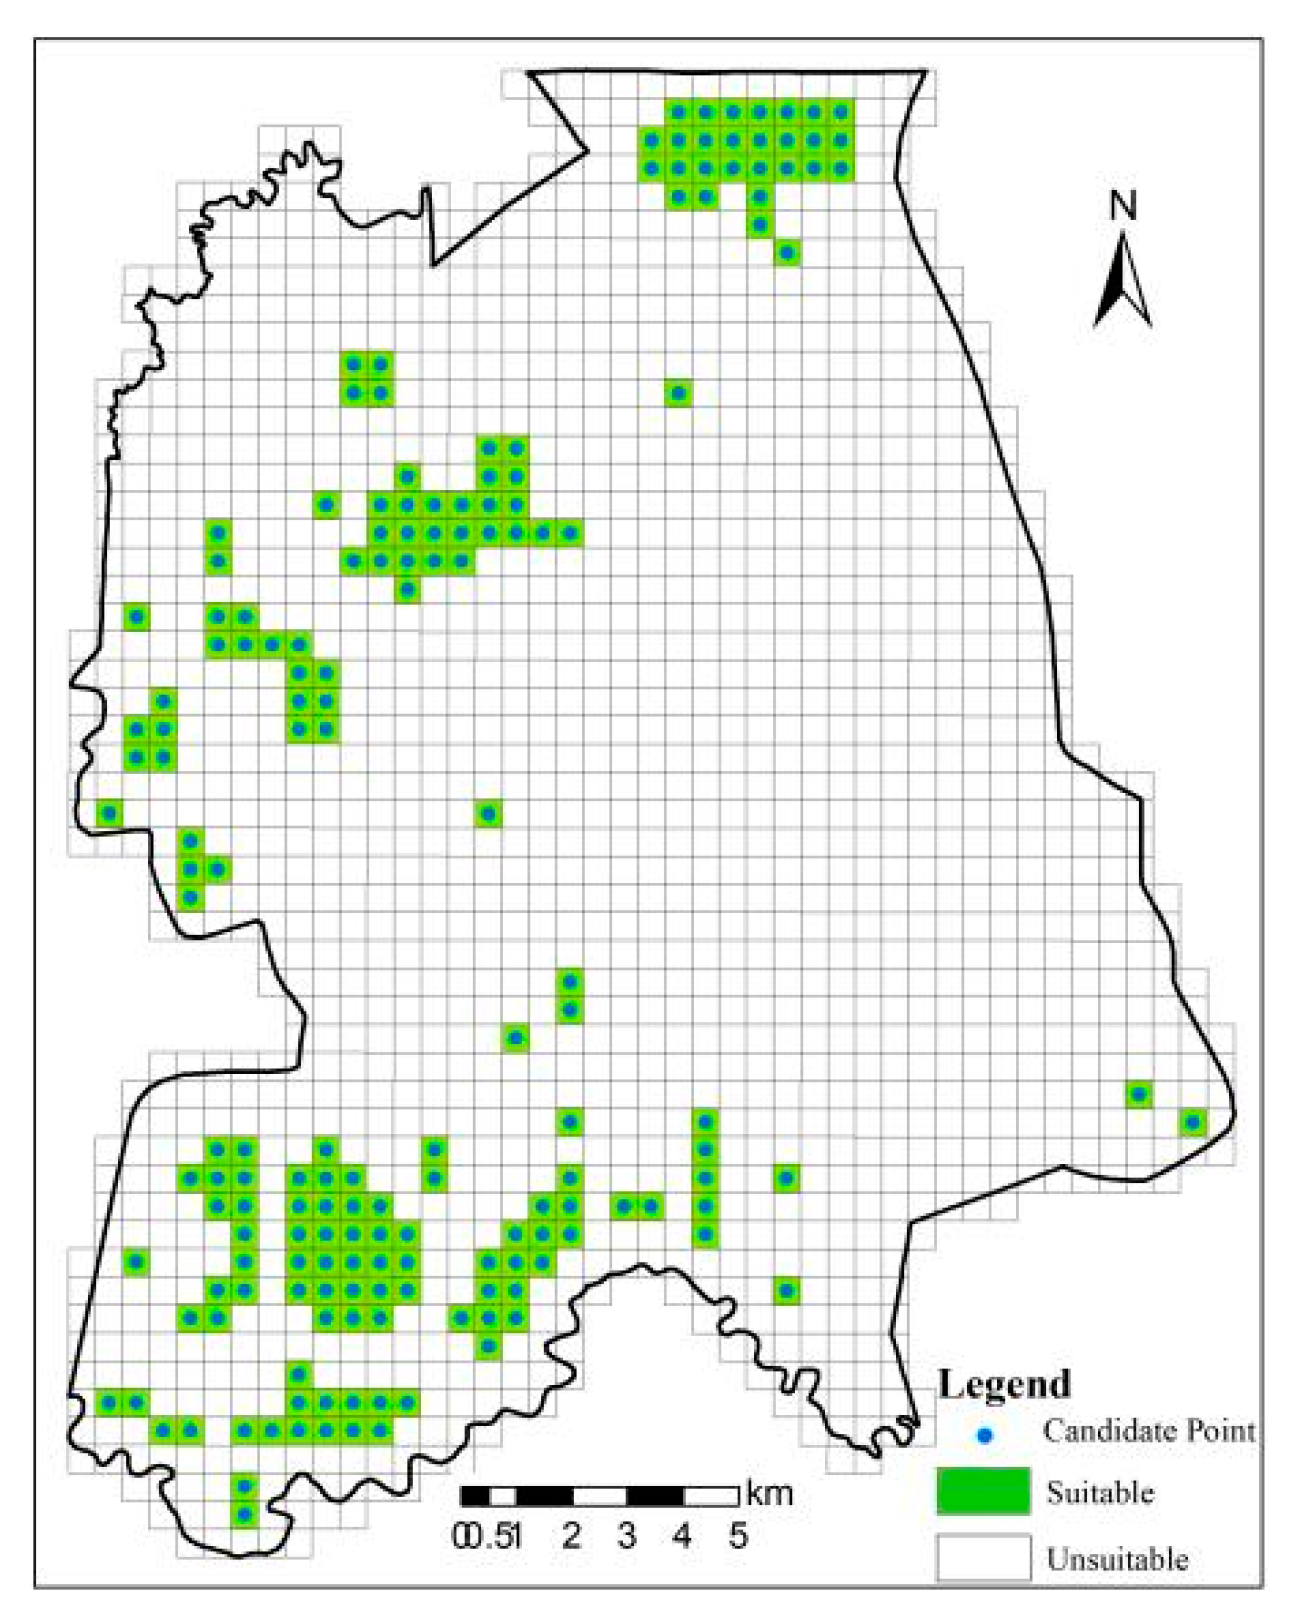
v is the suitability of the v-th indicator. The grid center points in the suitability map are regarded as candidate points.
We use town geometric center points with high population density, the center points of industrial zones and high eutrophication proportion points to form total demand points, and the density of demand points reflects the level of demand for WWTPs in the region.

2.3. Location Selection Model

The GIS spatial location selection model for WWTPs is introduced in this section. To select WWTP locations reasonably, a model combining the minimized facilities number method and the maximum coverage method is applied. When the effective service radius of the WWTPs covers all demand points, the model of minimized facilities number is used to choose the smallest number of WWTPs needed. In order to enable the effective service radius of the given number of WWTPs to be the largest, the locations of WWTPs are solved using the maximum coverage model. The mathematical model is as follows:
Decision variables xij should be binary value variables:
x i j = { 1 ,   t h e   i t h   d e m a n d   p o i n t   i s   s e r v e d   b y   t h e   j t h   W W T P 0 ,   n o   s e r v i c e
y j = { 1 ,   t h e   j t h   c a n d i d a t e   p o i n t   i s   s e l e c t e d 0 ,   n o t   s e l e c t e d
Min j M ( I ) y j ,   Max i I ,   j J x ij
Subject to:
s . t   j = M ( I ) x ij 1
x i j j = 1 n y j = P
where i represents the i-th demand point, m is the total number of demand points, and the point i I = { 1 ,   2 ,   3 , , m } j represents the j-th WWTP candidate point, n represents the total number of candidate points, and candidate point j J = { 1 ,   2 ,   3 , ,   n } . Equation (3) is the objective function—to select as few points P as possible among candidate points and maximize the total demand covered by WWTPs; r represents the service radius of the WWTP, assuming that the service radius of each WWTP is the same; P is the number of WWTPs to be built. The dij is the distance from i(ai, bi) to j(aj, bj), d i j = ( a i a j ) 2 + ( b i b j ) 2 . Equation (4) indicates that each WWTP serves at least one demand point. Equation (5) determines whether the demand point is covered by the WWTP.

3. Data and Analysis

3.1. Study Area

Cambodia is situated in southwest Indochina. Cambodia plays a very significant role because of its unique geographic advantages. The largest city in Cambodia is Phnom Penh, which serves as the national capital and is also an economic, cultural, transportation, trade, and religious center (Figure 2). There are 2.1 million people living in Phnom Penh, which covers a 678.46 km2 area [47]. Buddhism (Hinayana sect) is the state religion, with more than 85% of the country’s population practicing it, along with Catholicism and Islam. From ancient times to the present, monasteries have been centers not only for religious activities but also for local education and libraries, and religion has played an important role in social life [48]. The tropical climate of Phnom Penh has two distinct seasons: the “rainy season”, which lasts from March to October, is hot and humid; while the “dry season”, which lasts from November to April, has low temperatures of around 22 °C. The typical annual average temperature ranges from 28 to 34 °C [49].

3.2. Data Sources

In this study, we utilize multi-source data, including (1) OpenStreetMap data: OSM: http://www.openstreetmap.org (accessed on 28 September 2021); (2) Land use cover data: 2020 FROM- GLC10 global 10 m land cover map: http://data.ess.tsinghua.edu.cn (accessed on 22 October 2021); (3) RS image data: 2017–2021 the Sentinel-2A data: http://scihub.copernicus.eu/ (accessed on 11 April 2022); (4) Population density data: the WorldPop Population density datasets 2020: http://www.worldpop.org (accessed on 25 November 2021); (5) Elevation data: ASTER GDEM 30 m resolution data in the study area: http://www.gdem.aster.ersdac.or.jp (accessed on 15 September 2021); (6) POI data for religious sites: The POI data is extracted by web crawler technology from Google Maps: https://www.google.com/maps (accessed on 8 May 2022); (7) QGIS (formerly known as Quantum GIS) [50] is an open GIS software, which can create, edit, visualize, analyze and publish geospatial information on different devices. QGIS is utilized to conduct location selection for WWTPs. (8) The processing was conducted on an HP ZHAN 99 Pro G4 Microtower PC with Windows 10 OS and an 11th Gen Intel(R) Core(TM) i7-11700@ 2.50 GHz CPU.

3.3. Forbidden Construction Zone

In Phnom Penh, we derive zones where construction is forbidden by buffer analysis of residential areas, roads and water bodies. Incorporating religious POI data expands the forbidden construction zones by a further 20.45 km2 (Figure 3b). All areas in forbidden construction zones are dismissed as WWTPs construction locations.

3.4. Suitability Analysis

A DEM slope analysis in Phnom Penh is conducted (Figure 4a), which demonstrates that the slope of the entire of Phnom Penh city is mild and the terrain is almost flat in the majority of the city. Furthermore, the hydrological analysis of the DEM is conducted to obtain flow direction results (Figure 4b).
The wind field in Phnom Penh is mapped based on the average wind direction from March to October 2020. Southwest is the dominant wind direction in Phnom Penh in the rainy season; hence, the WWTPs should be built as far as possible northeast of the city center.
The reclassification level results include the reclassified slope map (Figure 5a), reclassified main roads buffer zones map (Figure 5b), reclassified river buffer zone map (Figure 5c), reclassified river flow map (Figure 5d), and reclassified wind direction map (Figure 5e).
An AHP analysis is conducted for evaluating the relative weights of the suitability indicators. The results of the AHP analysis are shown in Table 4, which demonstrates that the weights of the five suitability indicators are consistent [51,52].
According to the weights, the reclassified suitability indicator maps are overlaid, and the whole study area is divided into suitable construction areas and unsuitable construction areas. The distribution and number of suitable construction locations for WWTPs are shown in Figure 6 and Table 5. The suitable construction locations occupy 10.74% of the whole study area, and a total of 175 candidate grid locations for WWTPs are determined.

3.5. Demand Analysis

3.5.1. Water Ecosystem Condition

The surface water of Phnom Penh is mainly located in the northwestern and eastern areas with a total area of 45.64 km2. Cloud-free Sentinel-2 RS images have been selected from quarterly data for 2017–2021 to calculate the FUI in order to assess the degree of eutrophication of any water body during each quarter. The following table shows the spatial distribution of water quality and the degree of eutrophication of the water bodies (Figure 7).
In Figure 7, Q1, Q2, Q3 and Q4 refer to the 1st, 2nd, 3rd and 4th quarters of each year, respectively; and the area values below each sub-figure indicate the area of water in the “eutrophic” state (FUI > 16) in the sub-figure. The eutrophication state in the central part of the Oksa River was found to be relatively high, while the FUI of the Tonle SAP River and Mekong River decreased little in the past five years. In the downstream area after the confluence of the Mekong River and the Tonle Sap River, the FUI increased significantly and the water quality became significantly worse. The statistics of FUI are in Figure 8. The seasonal variation of water quality in the study area appeared to follow the same tendency, with the best water quality in the 1st quarter, and the worst water quality in the 3rd quarter of each year.
In this study, the frequency of occurrence map of surface water body eutrophication is obtained by overlaying the 20 pairs of FUI distribution maps in Figure 9 and reclassifying the data into five levels. Based on the eutrophication occurrence frequency map, the higher frequency (level 5) points of grid centers are taken as the demand point to respond to the water ecosystem condition.

3.5.2. Total Demand Analysis

In Phnom Penh, the residential areas are mainly distributed in the dense urban areas in the central-eastern part, while the population density in the urban fringe and rural areas is relatively small. Thus, the natural break method [53] is used to reclassify the population density into 5 levels, as shown in Figure 10a.
As depicted in Figure 10b, the industrial zones are all under 100 hectares and are mainly distributed at the edge of the city and in the suburban areas. So, the industrial WWTPs demand is divided into five levels from high to low according to the distance to an industrial zone: (0–300) m, (300–600) m, (600–900) m, (900–1200) m and (1200–1500) m.
A total of 450 demand locations are identified by town geometric center points with high population density, industrial zone center points, and high eutrophication proportion points.

4. Results and Discussion

4.1. Existing WWTP Status

The service scale of WWTPs is mainly related to the treatment capacity of the WWTP, the water quality and quantity within the service scope, and the level of wastewater containment. The three main scales of WWTPs and corresponding service radii are listed in Table 6.
A medium-scale WWTP has been built in Phnom Penh City, which serves about 1.63 million people [54] and has a service radius of about 10 km (Figure 11). Of the 450 demand points, the existing WWTP serves 292 of them, with an effective service rate of 64.89%. However, the demand points in the northeast and west of the study area are not served, indicating there are still regions that need new WWTPs.

4.2. WWTP Location Selection

We calculate the minimum number of plants of the three different scales using the minimized facilities number model to satisfy the demands. Next, the maximum coverage model is used to calculate the locations according to the known number of WWTPs and the location of the existing WWTP. The results are shown in Figure 12.
Based on the existing WWTP, there are still 158 non-served demand points in Phnom Penh. More experiments are needed to analyze how many and what scale WWTPs should be built. Table 7 summarizes various results, reflecting the optimized WWTP layout.
As the results show, constructing one additional large-, two medium-, or three small-scale WWTPs can satisfy all demand locations fully.

4.3. Discussion

The final results provide the selected locations of the WWTP, which satisfy the presented indicator system (Table 8).
In this paper, we proposed a novel WWTP location selection indicator system that includes not only traditional indicators but also water ecosystem and socio-cultural factors. With the indicator system, the selected locations all have suitability above level three and are outside of forbidden construction zones, which can fully satisfy the demands of the study area WWTPs. In addition, we conducted an experiment for Phnom Penh using only traditional indicators such as topography, hydrology, residential/water body buffer zone, population density, and industrial zone scale, excluding religious POI sites and water ecological condition indicators. The results are shown in Table 9. In the traditional indicator system results, two WWTPs are within the buffer zone of religious POI sites (Figure 13a,b), which may bring opposition from local residents. A reduction of 25% in demand points is also observed. The results show that some demand points with a high frequency of eutrophication won’t be treated under this location selection model, resulting in a progressive deterioration in water quality over time.

5. Conclusions

In order to scientifically plan the location of new WWTPs, this study proposes a novel indicator system based on a GIS spatial analysis location selection model. The indicator system selects 12 criteria to compose exclusion indicators, suitability indicators and demand indicators. Considering socio-cultural factors, the buffer zones of religious POI are included in the exclusion indicators. In addition, the spatial distribution changes in the eutrophication state of water bodies are extracted by RS time series data as demand indicators. Finally, we utilize the proposed novel indicator system of WWTP location selection to determine the location of new WWTPs using the minimized facilities number and maximum coverage models. The results show that this multi-factor indicator system enriches the siting model by considering the water ecosystem and socio-cultural indicators, and can effectively delineate the optimal locations for WWTPs. The location selection results can provide a scientific reference for the construction of WWTPs in the field.
Finally, it is highly recommended that further location surveys of selected locations should be carried out in the presence of professional engineers to determine the optimal location of sewerage facilities.

Author Contributions

Conceptualization, Y.Z. and Y.S.; methodology, Y.S.; software, Y.Z.; validation, Y.Z. and W.Q.; formal analysis, Y.S.; investigation, W.Q.; resources, J.S.; data curation, W.Q. and J.S.; writing—original draft Y.Z. and Y.S.; writing—review and editing, J.S.; visualization, Y.Z.; supervision, J.S. and S.L.; project administration, Y.S.; funding acquisition, Y.S. All authors have read and agreed to the published version of the manuscript.

Funding

This research was funded in part by the undergraduate teaching project in 2020, UAV photogrammetry 3D modeling practice innovation teaching research, grant number ZL202053, in part by the Integration and Application Demonstration in the Marine Field, grant number 2020010004, and in part by the Automated Identifying of Environment Changes Using Satellite Time-Series, Dragon 5 Cooperation 2020–2024, grant number 57971.

Data Availability Statement

Not applicable.

Acknowledgments

We thank students supervised by Yan Song who contributed to data entry and validation, including Beibei Li, Yuhong Tu, Sijia Wang and Teya Li.

Conflicts of Interest

The authors declare no conflict of interest.

References

  1. Corcoran, E.; Nellemann, C.; Baker, E.; Bos, R.; Osborn, D.; Savelli, H. Sick Water? The Central Role of Wastewater Management in Sustainable Development: A Rapid Response Assessment; United Nations Environmental Programme, Unhabitat, Grid-Arendal: Arendal, Norway, 2010; ISBN 978-82-7701-075-5. [Google Scholar]
  2. Hodgson, I. Performance of The Akosombo Waste Stabilization Ponds In Ghana. Ghana J. Sci. 2008, 47, 35–44. [Google Scholar] [CrossRef]
  3. Han, G.; Wen, S.; Wang, H.; Feng, Q. Sulfidization regulation of cuprite by pre-oxidation using sodium hypochlorite as an oxidant. Int. J. Min. Sci. Technol. 2021, 31, 1117–1128. [Google Scholar] [CrossRef]
  4. Zhao, W.; Wang, M.; Yang, B.; Feng, Q.; Liu, D. Enhanced sulfidization flotation mechanism of smithsonite in the synergistic activation system of copper–ammonium species. Miner. Eng. 2022, 187, 107796. [Google Scholar] [CrossRef]
  5. Romero-Güiza, M.; Flotats, X.; Asiain-Mira, R.; Palatsi, J. Enhancement of sewage sludge thickening and energy self-sufficiency with advanced process control tools in a full-scale wastewater treatment plant. Water Res. 2022, 222, 118924. [Google Scholar] [CrossRef] [PubMed]
  6. Grafakos, S.; Kang, J.; Senshaw, D. Unlocking Potential for Large-Scale Waste Treatment Plants with a Focus on Energy Recovery and Modular Project Design; GGGI: Seoul, Korea, 2022. [Google Scholar]
  7. Singh, R.K.; Gamaralalage, P.J.D.; Yagasa, R.; Onogawa, K. State of Waste Management in Phnom Penh, Cambodia. 2018. Available online: https://www.iges.or.jp/en/pub/state-waste-management-phnom-penh-cambodia/en (accessed on 11 September 2021).
  8. Tang, Y.Y.; Tang, K.H.D.; Maharjan, A.K.; Aziz, A.A.; Bunrith, S. Malaysia Moving Towards a Sustainability Municipal Waste Management. Ind. Domest. Waste Manag. 2021, 1, 26–40. [Google Scholar] [CrossRef]
  9. Nagashima, T.; Kinouchi, T. Quantification and Projection of Short-Term Rainfall Characteristics in Phnom Penh City. J. Jpn. Soc. Civ. Eng. Ser. B1 (Hydraul. Eng.) 2018, 74, I_193–I_198. [Google Scholar] [CrossRef]
  10. Xu, Z.; Li, C.; Li, A.; You, Z.; Yao, W.; Chen, Y.; Huang, L. Morphological Characteristics of Cambodia Mekong Delta and Tonle Sap Lake and Its Response to River-Lake Water Exchange Pattern. J. Water Resour. Prot. 2020, 12, 275–302. [Google Scholar] [CrossRef]
  11. Zhao, Y.; Qin, Y.; Chen, B.; Zhao, X.; Li, Y.; Yin, X.; Chen, G. GIS-based optimization for the locations of sewage treatment plants and sewage outfalls—A case study of Nansha District in Guangzhou City, China. Commun. Nonlinear Sci. Numer. Simul. 2009, 14, 1746–1757. [Google Scholar] [CrossRef]
  12. Feizhou, H.U.O.; Geli, D.O.N.G.; Moxiao, L.I.; Yiyun, M.E.I. Study on location selection of linkage fire stations based on demand level and distance loss. China Saf. Sci. J. 2022, 32, 183. [Google Scholar]
  13. Ailani, R.S.; Bhatt, J.D. Analysis of Fire Station Infrastructure using GIS and Planning Proposal: A Case of Surat City. Int. J. Mod. Dev. Eng. Sci. 2022, 1, 28–29. [Google Scholar]
  14. Mehrizi, A.A.; Karimabadi, T.K. Location of fire station in Bam city using Fuzzy Analytic Hierarchy Process. In Proceedings of the 2022 9th Iranian Joint Congress on Fuzzy and Intelligent Systems (CFIS), Bam, Iran, 2–4 March 2022; IEEE: Piscataway, NJ, USA, 2022; pp. 1–6. [Google Scholar]
  15. Renkas, A.; Popovych, V.; Rudenko, D. Optimization of Fire Station Locations to Increase the Efficiency of Firefighting in Natural Ecosystems. Environ. Res. Eng. Manag. 2022, 78. [Google Scholar] [CrossRef]
  16. Alkan, N.; Kahraman, C. Circular intuitionistic fuzzy TOPSIS method: Pandemic hospital location selection. J. Intell. Fuzzy Syst. 2021, 42, 295–316. [Google Scholar] [CrossRef]
  17. Boyacı, A.; Şişman, A. Pandemic hospital site selection: A GIS-based MCDM approach employing Pythagorean fuzzy sets. Environ. Sci. Pollut. Res. 2021, 29, 1985–1997. [Google Scholar] [CrossRef] [PubMed]
  18. Almansi, K.Y.; Shariff, A.R.M.; Kalantar, B.; Abdullah, A.F.; Ismail, S.N.S.; Ueda, N. Performance Evaluation of Hospital Site Suitability Using Multilayer Perceptron (MLP) and Analytical Hierarchy Process (AHP) Models in Malacca, Malaysia. Sustainability 2022, 14, 3731. [Google Scholar] [CrossRef]
  19. Ma, Y.; Liu, B.; Zhang, K.; Yang, Y. Incorporating multi-criteria suitability evaluation into multi-objective location–allocation optimization comparison for earthquake emergency shelters. Geomat. Nat. Hazards Risk 2022, 13, 2333–2355. [Google Scholar] [CrossRef]
  20. He, L.; Xie, Z. Optimization of Urban Shelter Locations Using Bi-Level Multi-Objective Location-Allocation Model. Int. J. Environ. Res. Public Heal. 2022, 19, 4401. [Google Scholar] [CrossRef]
  21. Ommi, S.; Janalipour, M. Selection of shelters after earthquake using probabilistic seismic aftershock hazard analysis and remote sensing. Nat. Hazards 2022, 113, 345–363. [Google Scholar] [CrossRef]
  22. Senkiio, C.S.; Ramos, A.P.M.; Simões, S.J.C.; Mendes, T.S.G. Multicriteria analysis and logistical grouping method for selecting areas to consortium landfills in Paraiba do Sul river basin, Brazil. Environ. Earth Sci. 2022, 81, 239. [Google Scholar] [CrossRef]
  23. Tirkolaee, E.B.; Torkayesh, A.E. A Cluster-based Stratified Hybrid Decision Support Model under Uncertainty: Sustainable Healthcare Landfill Location Selection. Appl. Intell. 2022, 52, 13614–13633. [Google Scholar] [CrossRef]
  24. Helal, A.H. Multicriteria Evaluation-GIS Integration Framework for Landfill Site Selection in Limited Space Regions: A Case Study in the West Bank. Adv. Civ. Eng. 2022, 2022, 9367256. [Google Scholar] [CrossRef]
  25. Zahedi, R.; Ahmadi, A.; Eskandarpanah, R.; Akbari, M. Evaluation of Resources and Potential Measurement of Wind Energy to Determine the Spatial Priorities for the Construction of Wind-Driven Power Plants in Damghan City. Int. J. Sustain. Energy Environ. Res. 2022, 11, 1–22. [Google Scholar] [CrossRef]
  26. Wang, C.-N.; Dang, T.-T.; Nguyen, N.-A.; Wang, J.-W. A combined Data Envelopment Analysis (DEA) and Grey Based Multiple Criteria Decision Making (G-MCDM) for solar PV power plants site selection: A case study in Vietnam. Energy Rep. 2022, 8, 1124–1142. [Google Scholar] [CrossRef]
  27. Mallick, J.; Ibnatiq, A.A.; Ben Kahla, N.; Alqadhi, S.; Singh, V.P.; Hoa, P.V.; Hang, H.T.; Van Hong, N.; Le, H.A. GIS-Based Decision Support System for Safe and Sustainable Building Construction Site in a Mountainous Region. Sustainability 2022, 14, 888. [Google Scholar] [CrossRef]
  28. Kao, J.-J.; Lin, H.-Y. Multifactor Spatial Analysis for Landfill Siting. J. Environ. Eng. 1996, 122, 902–908. [Google Scholar] [CrossRef] [Green Version]
  29. Abdalla, O.O.; El Khidir, S.O. Site Selection of Wastewater Treatment Plant using RS/GIS data and Multi-Criteria Analysis (MCA): Case Study Omdurman City, Khartoum State, Sudan. J. Geosci. 2017, 1, 94–107. [Google Scholar]
  30. Hongbo, W.U. Site selection analysis of the urban wastewater treatment plant based on multi-objective optimization model. Geospat. Inf. 2019. [Google Scholar] [CrossRef]
  31. Nigusse, A.G.; Adhaneom, U.G.; Kahsay, G.H.; Abrha, A.M.; Gebre, D.N.; Weldearegay, A.G. GIS application for urban domestic wastewater treatment site selection in the Northern Ethiopia, Tigray Regional State: A case study in Mekelle City. Arab. J. Geosci. 2020, 13, 311. [Google Scholar] [CrossRef]
  32. Wang, C.G.; Jamieson, D.G. An objective approach to regional wastewater treatment planning. Water Resour. Res. 2002, 38, 4. [Google Scholar] [CrossRef] [Green Version]
  33. Makropoulos, C.K.; Argyrou, E.; Memon, F.A.; Butler, D. A suitability evaluation tool for siting wastewater treatment facilities in new urban developments. Urban Water J. 2007, 4, 61–78. [Google Scholar] [CrossRef]
  34. Rezaei, N.; Sierra-Altamiranda, A.; Diaz-Elsayed, N.; Charkhgard, H.; Zhang, Q. A multi-objective optimization model for decision support in water reclamation system planning. J. Clean. Prod. 2019, 240, 118227. [Google Scholar] [CrossRef]
  35. Liu, B.; Tang, J.; Qu, Y.; Yang, Y.; Lyu, H.; Dai, Y.; Li, Z. A GIS-Based Method for Identification of Blindness in Former Site Selection of Sewage Treatment Plants and Exploration of Optimal Siting Areas: A Case Study in Liao River Basin. Water 2022, 14, 1092. [Google Scholar] [CrossRef]
  36. Dutta, D.; Kumar, T.; Jayaram, C.; Chakraborty, D.; Paul, A.; Priyadarshi, N.; Akram, W.; Jha, C.S. Site Suitability for Sewage Treatment Plant and Routing Using Geospatial Technology—A Case Study for Two Indian Towns. In Geospatial Technologies for Resources Planning and Management; Springer: Cham, Switzerland, 2022; pp. 579–609. [Google Scholar] [CrossRef]
  37. Munasinghe, D.S. AHP and GIS Based Multi Criteria Analysis for Sustainable Sewage Disposal: A Case Study in Badulla Urban Area. J. Geospat. Surv. 2022, 2, 11. [Google Scholar] [CrossRef]
  38. Alfaisal, F. Model for Optimal Regional Wastewater Systems Planning with Uncertain Wastewater Treatment. EasyChair 2022, preprint. [Google Scholar]
  39. Hama, A.R.; Al-Suhili, R.H.; Ghafour, Z.J. A multi-criteria GIS model for suitability analysis of locations of decentralized wastewater treatment units: Case study in Sulaimania, Iraq. Heliyon 2019, 5, e01355. [Google Scholar] [CrossRef] [PubMed] [Green Version]
  40. Olivarez-Areyan, J.J.; Cerda-Flores, S.C.; Nápoles-Rivera, F.; El-Halwagi, M.M. Optimal Management of Multistakeholder Macroscopic Water Networks with Social, Economic, and Environmental Considerations. Ind. Eng. Chem. Res. 2022, 61, 3342–3349. [Google Scholar] [CrossRef]
  41. Beijing Municipal Engineering Design and Research Institute. Water supply and Drainage Design Manual: Urban Drainage; China Architecture and Building Press: Beijing, China, 2004. [Google Scholar]
  42. Voronin, K.S.; Grigorieva, P.V.; Cherentsov, D.A. Estimating the cost of constructing and operating a section of a pipeline in the search for its optimal route. IOP Conf. Series Mater. Sci. Eng. 2018, 445, 012002. [Google Scholar] [CrossRef]
  43. Yao, T.; Wei, Y.; Zhang, J.; Wang, Y.; Yu, Y.; Huang, W. What influences the urban sewage discharge in China? The effect of diversified factors on the urban sewage discharge in different regions of China. Environ. Dev. Sustain. 2021, 24, 6099–6135. [Google Scholar] [CrossRef]
  44. Zhao, J.; Gao, X. Regional Distribution and Reconstruction Strategies of New Industrial Spaces at Multiple Spatial Scales in Shandong Province China. Am. J. Ind. Bus. Manag. 2022, 12, 309–330. [Google Scholar] [CrossRef]
  45. Ye, M.; Sun, Y. Review of the Forel–Ule Index based on in situ and remote sensing methods and application in water quality assessment. Environ. Sci. Pollut. Res. 2022, 29, 13024–13041. [Google Scholar] [CrossRef]
  46. Chen, Q.; Huang, M.; Tang, X. Eutrophication assessment of seasonal urban lakes in China Yangtze River Basin using Landsat 8-derived Forel-Ule index: A six-year (2013–2018) observation. Sci. Total Environ. 2019, 745, 135392. [Google Scholar] [CrossRef]
  47. Heuveline, P.; Poch, B. The Phoenix population: Demographic crisis and rebound in Cambodia. Demography 2007, 44, 405–426. [Google Scholar] [CrossRef] [PubMed] [Green Version]
  48. Keyes, C. Theravada Buddhism and Buddhist Nationalism: Sri Lanka, Myanmar, Cambodia, and Thailand. Rev. Faith Int. Aff. 2016, 14, 41–52. [Google Scholar] [CrossRef]
  49. Kakuya, S. Cambodia. JARN Jpn. Air Cond. Heat. Refrig. News 2021, 53 (Suppl. S1), TN.624. [Google Scholar]
  50. Denis, A. Initiation à QGIS avec QGIS 3.10.0-Travaux pratiques sur les Systèmes d’Information Géographique-SIG. Université de Liège (ULIEGE) Belgique—Département des Sciences et Gestion de l’Environnement—Unité Eau Environnement Développement (EED). 2022. Available online: https://www.orbi.uliege.be/handle/2268/190559 (accessed on 28 September 2022).
  51. Snyder, R.L.; Bish, D.L. Quantitative analysis. Mod. Powder Diffr. 1989, 20, 101–144. [Google Scholar]
  52. The SPSSAU Project. SPSSAU. (Version 22.0) [Online Application Software]. 2022. Available online: https://www.spssau.com (accessed on 10 May 2022).
  53. Jenks, G.F. The data model concept in statistical mapping. Int. Yearb. Cartogr. 1967, 7, 186–190. [Google Scholar]
  54. Macedo, H.E.; Lehner, B.; Nicell, J.; Grill, G.; Li, J.; Limtong, A.; Shakya, R. Distribution and characteristics of wastewater treatment plants within the global river network. Earth Syst. Sci. Data 2022, 14, 559–577. [Google Scholar] [CrossRef]
Figure 1. The process flow of the current study.
Water 14 03637 g001
Figure 2. Study area.
Water 14 03637 g002
Figure 3. Buffer zone: (a) Buffer zone without religious POI; (b) Religious POI buffer zone; (c) Total forbidden construction zone.
Water 14 03637 g003
Figure 4. DEM: (a) Slope analysis; (b) Flow grid.
Water 14 03637 g004
Figure 5. Reclassified results: (a) reclassified slope map; (b) reclassified roads buffer zone map; (c) reclassified river buffer zone map; (d) reclassified flow direction map; (e) reclassified wind direction map.
Water 14 03637 g005
Figure 6. Suitability map.
Water 14 03637 g006
Figure 7. Quarterly FUI distribution map.
Water 14 03637 g007
Figure 8. Quarterly FUI variations across five years.
Water 14 03637 g008
Figure 9. (a) Reclassified eutrophication occurrence frequency map; (b) High eutrophication frequency grids.
Water 14 03637 g009
Figure 10. Demands distribution: (a) Population density map; (b) Industrial zone buffer map; (c) Total demand points.
Water 14 03637 g010
Figure 11. Current service status.
Water 14 03637 g011
Figure 12. Distribution of WWTPs of different scales: (a) One large factory; (b) Two medium factories; (c) Three small factories.
Water 14 03637 g012
Figure 13. Distribution of WWTPs without considering the indicator system proposed in this paper: (a) One large WWTP; (b) Two medium WWTP; (c) Three small WWTP.
Water 14 03637 g013
Table 1. The standards of exclusion indicators.
Exclusion IndicatorsFactorsStandardsReclassification Level
Socio-culture (f1)Religious sites protected buffer zone (m)≤3000
Residence (f2)Residential protected buffer zone (m)≤3000
Transportation (f3)Road protected buffer zone (m)≤500
Water body (f4)River protected buffer zone (m)≤500
Table 2. The standards of suitability indicators.
Suitability IndicatorsFactorsStandardsReclassification Level
Slope (s1)Slope (°)>121
9–122
6–93
3–64
0–35
Hydrology (s2)Flow directionReferring to Figure 5dFrom 1 to 5
River (s3)Distance from river (m)2000–25001
1500–20002
1000–15003
500–10004
50–5005
Transportation (s4)Distance from road (m)2000–25001
1500–20002
1000–15003
500–10004
50–5005
Wind direction (s5)Wind directionReferring to Figure 5eFrom 1 to 5
Table 3. The standards of demand indicators.
Demand IndicatorsFactorsStandardsReclassification Level
Residential domestic wastewater (q1)Town population density (people/km2)0–33001
3300–10,2002
10,200–21,2003
21,200–39,4004
39,400–120,8005
Industrial wastewater (q2)The distance to an industrial zone (m)0-3001
300-6002
600-9003
900-12004
1200-15005
Water ecosystem condition (q3)Eutrophication proportion (%)0–0.21
0.2–0.42
0.4–0.63
0.6–0.84
0.8–15
Table 4. AHP hierarchy analysis results.
IndicatorsEigenvectorWeight
Slope (s1)0.86717.33%
Horological (s2)1.36227.23%
Road (s3)1.05021.01%
River (s4)1.35027.01%
Wind direction (s5)0.3717.42%
Table 5. Number and proportion of suitable grids.
Evaluation of SuitabilityGrid NumberRatio/%
Suitable17510.74%
Unsuitable145589.26%
Table 6. Scale of wastewater treatment plants.
TypeProcessing Scale (m3/d)The Radius of Service (km)
Large>200,00016
Medium50,000–200,00010
Small<50,0007
Table 7. New WWTPs results.
WWTP Service ScaleNumberCode NameNumber of Service PointsService Ratio (%)Number of No Service PointsTotal Service Ratio (%)
Large1L11581000100
Medium1M112277.223677.22
2M29560.130100
M36339.87
Small1S19258.236658.23
2S29056.961292.41
S35635.44
3S47346.200100
S54729.75
S63824.05
Table 8. Results Comparison between the different characteristics.
Indicator
WWTP Code
L1M2M3S4S5S6
Exclusion indicators: Outside the Forbidden construction zone (0 or 1)
Social-culture (f1)111111
Residence (f2)111111
Transportation (f3)111111
Water body (f4)111111
Suitability indicators: Five suitability levels (1–5)
Slope (s1)445444
Hydrology (s2)325135
River (s3)231423
Transportation (s4)444344
Table 9. Results without considering the indicator system.
Proposed Indicator
WWTP Code
L1′M2′M3′S4′S5′S6′
Exclusion indicators: Outside the Forbidden construction zone (0 or 1)
Socio-culture (f1)001111
Demand indicators: Number of demand points missing served by WWTP
Water ecosystem condition (q3)361719121014
Missing service percentage in water ecosystem demand points51.43%40.48%67.86%33.3%71.43%70%
Missing service percentage in total demand points25%17%23.75%14.12%23.81%26.92%
Publisher’s Note: MDPI stays neutral with regard to jurisdictional claims in published maps and institutional affiliations.

