Article

Application of RSM for Bioremoval of Methylene Blue Dye from Industrial Wastewater onto Sustainable Walnut Shell (Juglans regia) Biomass

1
Amity Institute of Environmental Science (AIES), Amity University Uttar Pradesh, Sector-125, Noida 201313, India
2
Academy of Biology and Biotechnology, Southern Federal University, 344090 Rostov-on-Don, Russia
3
Department of Hydrology, Indian Institute of Technology Roorkee, Roorkee 247667, India
4
School of Energy and Environment, Thapar Institute of Engineering and Technology, Patiala 147005, India
5
Department of Electronics and Communication Engineering, Motilal Nehru National Institute of Technology Allahabad, Prayagraj 211004, India
*
Author to whom correspondence should be addressed.
Water 2022, 14(22), 3651; https://doi.org/10.3390/w14223651
Submission received: 18 October 2022 / Revised: 8 November 2022 / Accepted: 10 November 2022 / Published: 12 November 2022
(This article belongs to the Section Wastewater Treatment and Reuse)

Abstract

:
Dyes are a significant group of organic contaminants known to negatively affect both humans and aquatic environments. In the textile industry, interest in agricultural-based adsorbents has increased, particularly around adsorption. In this study, methylene blue was eliminated from an aqueous solution using a walnut (Juglans regia) shell. These materials are widely available and inexpensive, and its cost can be a major factor in wastewater treatment batch experiments. Response surface methodology (RSM) is based on a face-centred central composite design, used to identify the independent variable. With the use of RSM, the biomass of J. regia shells was assessed for its capacity to absorb dyes from aqueous solutions, including methylene blue. Maximum methylene blue dye removal percentages (97.70%) were obtained with a 30 mg/L concentration of methylene blue dye, 1.5 gm of biomass, an initial pH of 6, and a contact duration of 60 min at 25 °C. Additionally, particles were absorbed onto the J. regia shell’s surface throughout the biosorption process, according to scan electron microscopy. Functional groups were discovered in the Fourier Transform Infrared Spectroscopy spectra, which are crucial for binding during the biosorption of methylene blue. It has been demonstrated that J. regia shell biomass performs well as a biosorbent in the removal of methylene blue from wastewater effluents. It is also a promising, biodegradable, environmentally friendly, economical, and cost-effective biosorbent.

1. Introduction

Dye discharge from the textile industry is a serious issue that has surfaced recently and has an effect on both humans and the environment [1]. Life depends on water, yet freshwater resources are scarce on Earth. According to estimates, half of the world’s population will reside in water-stressed regions by 2025 [2,3]. Production from the textile and dye industries, of which around 5% ends up in effluents, making up roughly 637.3 million cubic meters per year, is a significant contributor to the contamination of aquatic systems [4]. Numerous sectors utilize artificial dyes to provide colour to their products, which requires large amounts of water. These colours are used in cosmetics, paper, textiles, foods, leather, rubber, and plastics [5]. Methylene blue (MB) is an azo dye (Table 1). Azo dyes are characterized by having an N = N-6,7 bond. Typically, throughout the dying process, 10–15% of the textile dye content is released as colour into the environment, posing a major bioaccumulation risk and toxicological problem for the environment [6,7]. Dye-containing effluents are regarded as hazardous wastewater because they contain poisonous substances, suspended particles, and other pollutants [8]. Azo dyes can cause a range of health problems, including irreversible blindness, skin rashes, contact dermatitis, allergy, bladder cancer, and more [9,10].
RSM is essentially a combination of statistical and mathematical techniques that can be used for process optimization, constructing models that take parameter interactions into account, and conducting tests. The primary goal of RSM is to acquire the system’s ideal operational conditions or an area that meets the operating requirements [11,12]. RSM involves six sequential steps for the simulation and optimization of physicochemical processes: (1) screening independent variables and selecting desired responses, (2) selecting an experimental design strategy, (3) conducting the experiments and obtaining the results, (4) fitting the mathematical model obtained to experimental data, (5) validating the model using graphs and analysis of variance, and (6) determining the optimal conditions. Increased dye concentrations in aquatic habitats have the potential to significantly harm the environment’s essential elements, restrict light’s ability to reach the water’s depths, and decrease the concentration of dissolved oxygen. Textile azo dyes thrown indiscriminately into aquatic habitats by textile manufacturers and their lack of biodegradability have negative effects on aquatic life, the food chain, and humans [13].
Heavy metals (HMs) are naturally occurring components of the environment, and to a lesser extent, they enter the body system through food, air, and water and are bioaccumulated [14]. The most prevalent inorganic environmental pollutants are HMs [15]. Traditional biological, chemical, and physical techniques such as flocculation, sedimentation, aerobic, and aerobic treatments have been employed to remove dyes with greater upfront costs. Numerous different traditional adsorption techniques have been devised to eliminate HM and dye contamination from water effluents and to reduce the toxicity of HMs [16]. Reverse osmosis, ion exchange, precipitation reverse osmosis, and biosorption are the most widely used techniques for decolorizing effluents.
Biosorption, an environmental technique, is crucial in decreasing the amount of HM contamination in the aqueous phase [17]. Due to its technical originality and possible industrial application, biosorption-based bioremediation has emerged as a viable alternative to the current methods for removing metals. Wheat husk, maize cob, sugarcane bagasse, groundnut shells, and walnut (Juglans regia) shells have been used as less expensive biosorbent alternatives for removing HMs [18]. Due to their low energy consumption, effectiveness, and environmental friendliness, biosorption techniques have generated significant interest and shown promising outcomes. As a result of their abundance and ability to reduce waste, biosorbents are more advantageous and help to enhance the environment. Different cost-effective biosorbents have been utilized in the biosorption process to treat contaminated wastewater [19,20].
For statistical analyses, the response surface methodology (RSM) is an effective way of optimizing techniques because it involves less time and fewer tests. It is suitable for trials involving multiple variables and provides a better understanding of the potential interactions between the ideal conditions and factors for maximum response.
Face-centred central composite design (FCCCD), which offers a quick, affordable, and highly accurate response compared to conventional techniques, was utilized to calculate the importance of the various parameters in the biosorption of MB from a solution using J. regia shell biomass as the biosorbent.
According to a prior study, the effects of a plant-based biosorbent on various water-quality dye wastewater are diverse. Therefore, it is necessary to determine how the coexistence of these variable parameters would affect the adsorption. However, more systematic data are still needed to fully comprehend the adsorption behaviour of cationic MB dyes. Therefore, the two objectives of the current study were as follows:
  • To use a locally available J. regia shell as a precursor to creating a nano-biomass product with a high biosorption capacity and a cheap cost;
  • To use experimental design methodologies to optimize the selected parameters to thus explore the possible removal of biomass adsorption for MB.
Despite the fact that industrial effluents contain high levels of metals and dyes, there have been numerous investigations into single-pollutant adsorption. Because of this, the simultaneous removal of MB dye using dry J. regia shell biomass as a practical biosorbent attracted a lot of attention in this work. Statistical optimization has also been applied to simultaneous MB dye biosorption.

2. Materials and Methods

2.1. Chemicals

The aqueous dye solution was created using methylene blue (C16H18ClN3S). To change the acidity–basicity of the solution, nitric acid and sodium hydroxide were utilized. Each solution was made with distilled water. All chemicals were purchased from Central Drug House Pvt. Ltd., New Delhi, India. All the reagents were of analytical grade and were used properly.

2.2. Collection and Preparation of Adsorbent

Juglans regia shells were collected as a by-product from a local store in New Delhi, India, which was used as a biosorbent in this study. Their shells were properly peeled and cleaned with demineralized water to effectively remove dirt. The peel was then cut into small pieces and dried for 24 h at 70 °C in a laboratory hot oven.
The biomass of dried walnut shells was ground into a powder and sieved through a pore size sieve shaker in a standard lab test sieve shaker. The resultant powder was saved for the MB dye biosorption method. The mean chemical composition revealed that J. regia shells contain a large quantity of holocellulose and lignin (35%) (Table 2), which comprises just over half of the chemical substances, 24.9% from hemicellulose and 30.4% from cellulose. Water extractives (4.6%) and ethanol (2.7%) account for many of the extractives (10.2%) [21].

2.3. Preparation of the Adsorbate (MB Dye)

In this work, analytical grade MB (methylene Blue)(C16H18ClN3S xH2O) was used for experimental biosorption. The necessary quantity of MB dye powder was dissolved in demineralized water to create a stock solution of MB (500 mg/L). Various concentration levels were prepared using the MB stock solution.

2.4. Characterization

Fourier transform infrared spectroscopy was used to assess the functional groups on the biosorbents’ surfaces. The PerkinElmer FTIR device acquired a wavelength between 400 and 4000 cm−1. SEM-coupled spectroscopy was used to examine the materials’ shape and structure after and before MB adsorption, as well as to gather data on the samples’ elemental composition.

2.5. Optimization of Biosorption Experiments for MB Removal by Face-Centred Central Composite Design (FCCCD)

This study used Design Expert Software (version 13.0) to construct four variables for the face-centred central composite design (FCCCD) with thirty runs. The experiments were carried out in batches to examine the adsorption capabilities of J. regia shells towards MB dye. FCCCD was used to find the ideal amount of each variable for the bioremoval of MB from an aqueous solution. It also aided in the evaluation of the quadratic, linear, and interaction impacts of the chosen process variables that have a significant impact on MB removal. Biosorbent dose, initial dye solution pH, temperature, and concentration were the four variables used. Each experiment was carried out in an incubator shaker at 120 rpm for 60 min with 100 mL Erlenmeyer flasks containing MB dye solutions. A pH meter was used to modify the pH of the solution using either 1 mole NaOH or 1 mole HCL solutions. Using 0.45 µ filter paper, the biosorbent was removed from the solution after samples were taken at various points during stirring. The residual dye concentrations before and after treatment were calculated using a double-beam UV/Vis spectrophotometer by measuring the absorbance of the filtered solution at the maximum wavelength (max) of 664 nm. The biosorption study was carried out at varying temperatures, and the amounts of biosorption (qt) at time t (mg/g) were calculated utilizing
qt = (C0 − Ct) V/(W)
where V is the solution volume (L), Ct (mg/L) is the dye concentration at any time, C0 (mg/L) is the dye concentration at the initial time, and W is the dry biosorbent mass (g). The equilibrium amount of biosorption, qe (mg/g), was calculated using
qe = (C0 − Ce) V/(W)
where Ce is the dye concentration at equilibrium (mg/L) and C0 is the dye concentration initially (mg/L). The percentage of MB was determined as follows:
Removal efficiency (%) = (C0 − Ce)/(C0) × 100

2.6. RSM-Based Experimental Design

Optimization is a research area in operational analysis that has observed a rise in the number of methods available [23]. Because a single factor can be varied while the other components are constant, a researcher avoids the synergistic effect between the variables by performing experiments with one variable at a time [24]. When several operational variables and their interactions have an impact on the removal efficiency, RSM is a key tool for enhancing the adsorption process [25]. The quadrilateral model is present because CCD produces schemes with acceptable statistical features and only includes a portion of the experiments required for the five-step factorial [26]. The variables for the CCD of biosorption designed using RSM in this work include biosorbent dose (0.5–2.5 g/L); specified pH (4–8); temperature (15–35 °C); and initial dye concentration (10–50 mg/L) (Table 3). Each variable was coded at five levels: −α, −1, 0, +1, and +α, where α = ±2 was chosen as the axial level. The number of experiments required in a CCD design can be calculated by
N = 2n + 2n + NC
N is the total number of experiments, Nc is the number of replicates at the centre, and n is the total number of numerical components. Using the CCD feature of the Design Expert Software, an experimental adsorption design, regression, and graphical analysis was created [27]. According to Equation (4), a total of 30 trials were proposed, including 6 replicates of the centre point, 8 axial points, and 16 cubical points. Regression equations were used to determine the variable’s ideal conditions. The F-value, adjusted R2, correlation coefficient R2, and p-value (probability) of the regression parameters were calculated using ANOVA, and these results were then used to evaluate the applicability and relevance of the anticipated model. The proposed model’s 95% confidence level was used as the foundation for evaluating the significance of independent factors on the MB adsorption process.

3. Result and Discussion

Various types of studies have been conducted on the adsorption of a single pollutant, even though dyes are present in significant amounts of industrial wastewater [29,30,31]. Therefore, significant importance is given to the removal of dyes in wastewater treatment processes [32]. The biosorption of dyes is a challenging process that depends on numerous variables, including the biosorbent, initial dye concentrations, initial pH value, temperature, and incubation periods [33,34,35].

3.1. Statistical Optimization of MB Using RSM

Optimizing the operational process factors is especially important for the biosorption process. The process has been optimized using the traditional single-variable optimization method; however, this approach not only is time-consuming, labour-intensive, and expensive but also does not account for the effects of interactions between the independent process factors [36]. A statistical and mathematical method called “response surface methodology” (RSM) has been used for years to improve different processing variables [14,35,37,38]. RSM is an important tool for determining the ideal quantity of each variable and for investigating the interactions between numerous factors for the best possible response [39]. The FCCCD had six centre points, eight axial points, and sixteen cubical points, resulting in thirty experimental trials used to optimize the selected variables. These experiments were completed in 60 min with various ratios for the initial pH, biosorbent dose, MB dye concentration, and temperature. The different coded and real amounts of the four independent parameters and the percentage of each run’s MB dye elimination are shown in Table 4.
In addition to determining the evaluated independent components and optimal levels to raise the bioremoval percentages, a response surface approach employing a face-centred central composite design was used to clarify the relationships between them. The maximum removal percentage for MB was 97.80%, with a pH level of 6, biosorbent dose of 1.5 gm, MB concentration of 30 mg/L, and temperature of 25 °C (Table 4). The minimum MB (92.88%) removal percentage was achieved with pH level 7, algal biomass concentration 1 gm, MB concentration 40 mg/L, and temperature 30 °C.
However, a statistical analysis of the experimental data is required to determine the best circumstances of dye biosorption within the range of the analysed parameters. RSM is used to express the regression equations that describe the link between the biosorption of the MB dye and independent factors. For this experiment, the regression equation in terms of the coded values is represented as
Dye removal (%) = 97.30 + 0.7190 × A − 0.0096 × B + 0.2102 × C − 0.5232 × D + 0.4567 × AB − 0.1390 × AC + 0.1763 × AD + 0.0163 × BC + 0.0972 × BD − 0.4649 × CD − 0.4841 × A^2 − 0.6708 × B^2 − 0.5268 × C^2 − 0.4475 × D^2
Equation (5) can be applied to coded factors to predict reactions for different amounts of each factor. The default coding for the components’ high levels is +1, whereas the default representation for their low levels is -1. By comparing their factor coefficients, the element’ relative importance can be determined using the coded equation. The majority of equation terms with a positive sign have a synergistic effect, indicating that the factors’ combined influence on the outcome was significant. The RSM-optimized condition for MB biosorption on walnut shells is listed in Table 5. The optimal predicted MB removal (97.3%) was close to the actual MB removal (97.74%), and it was obtained with a 31.71 mg/L concentration of methylene blue dye, 1.824 gm of biomass, an initial pH of 6.4, and a contact duration of 60 min at 21.7 °C.

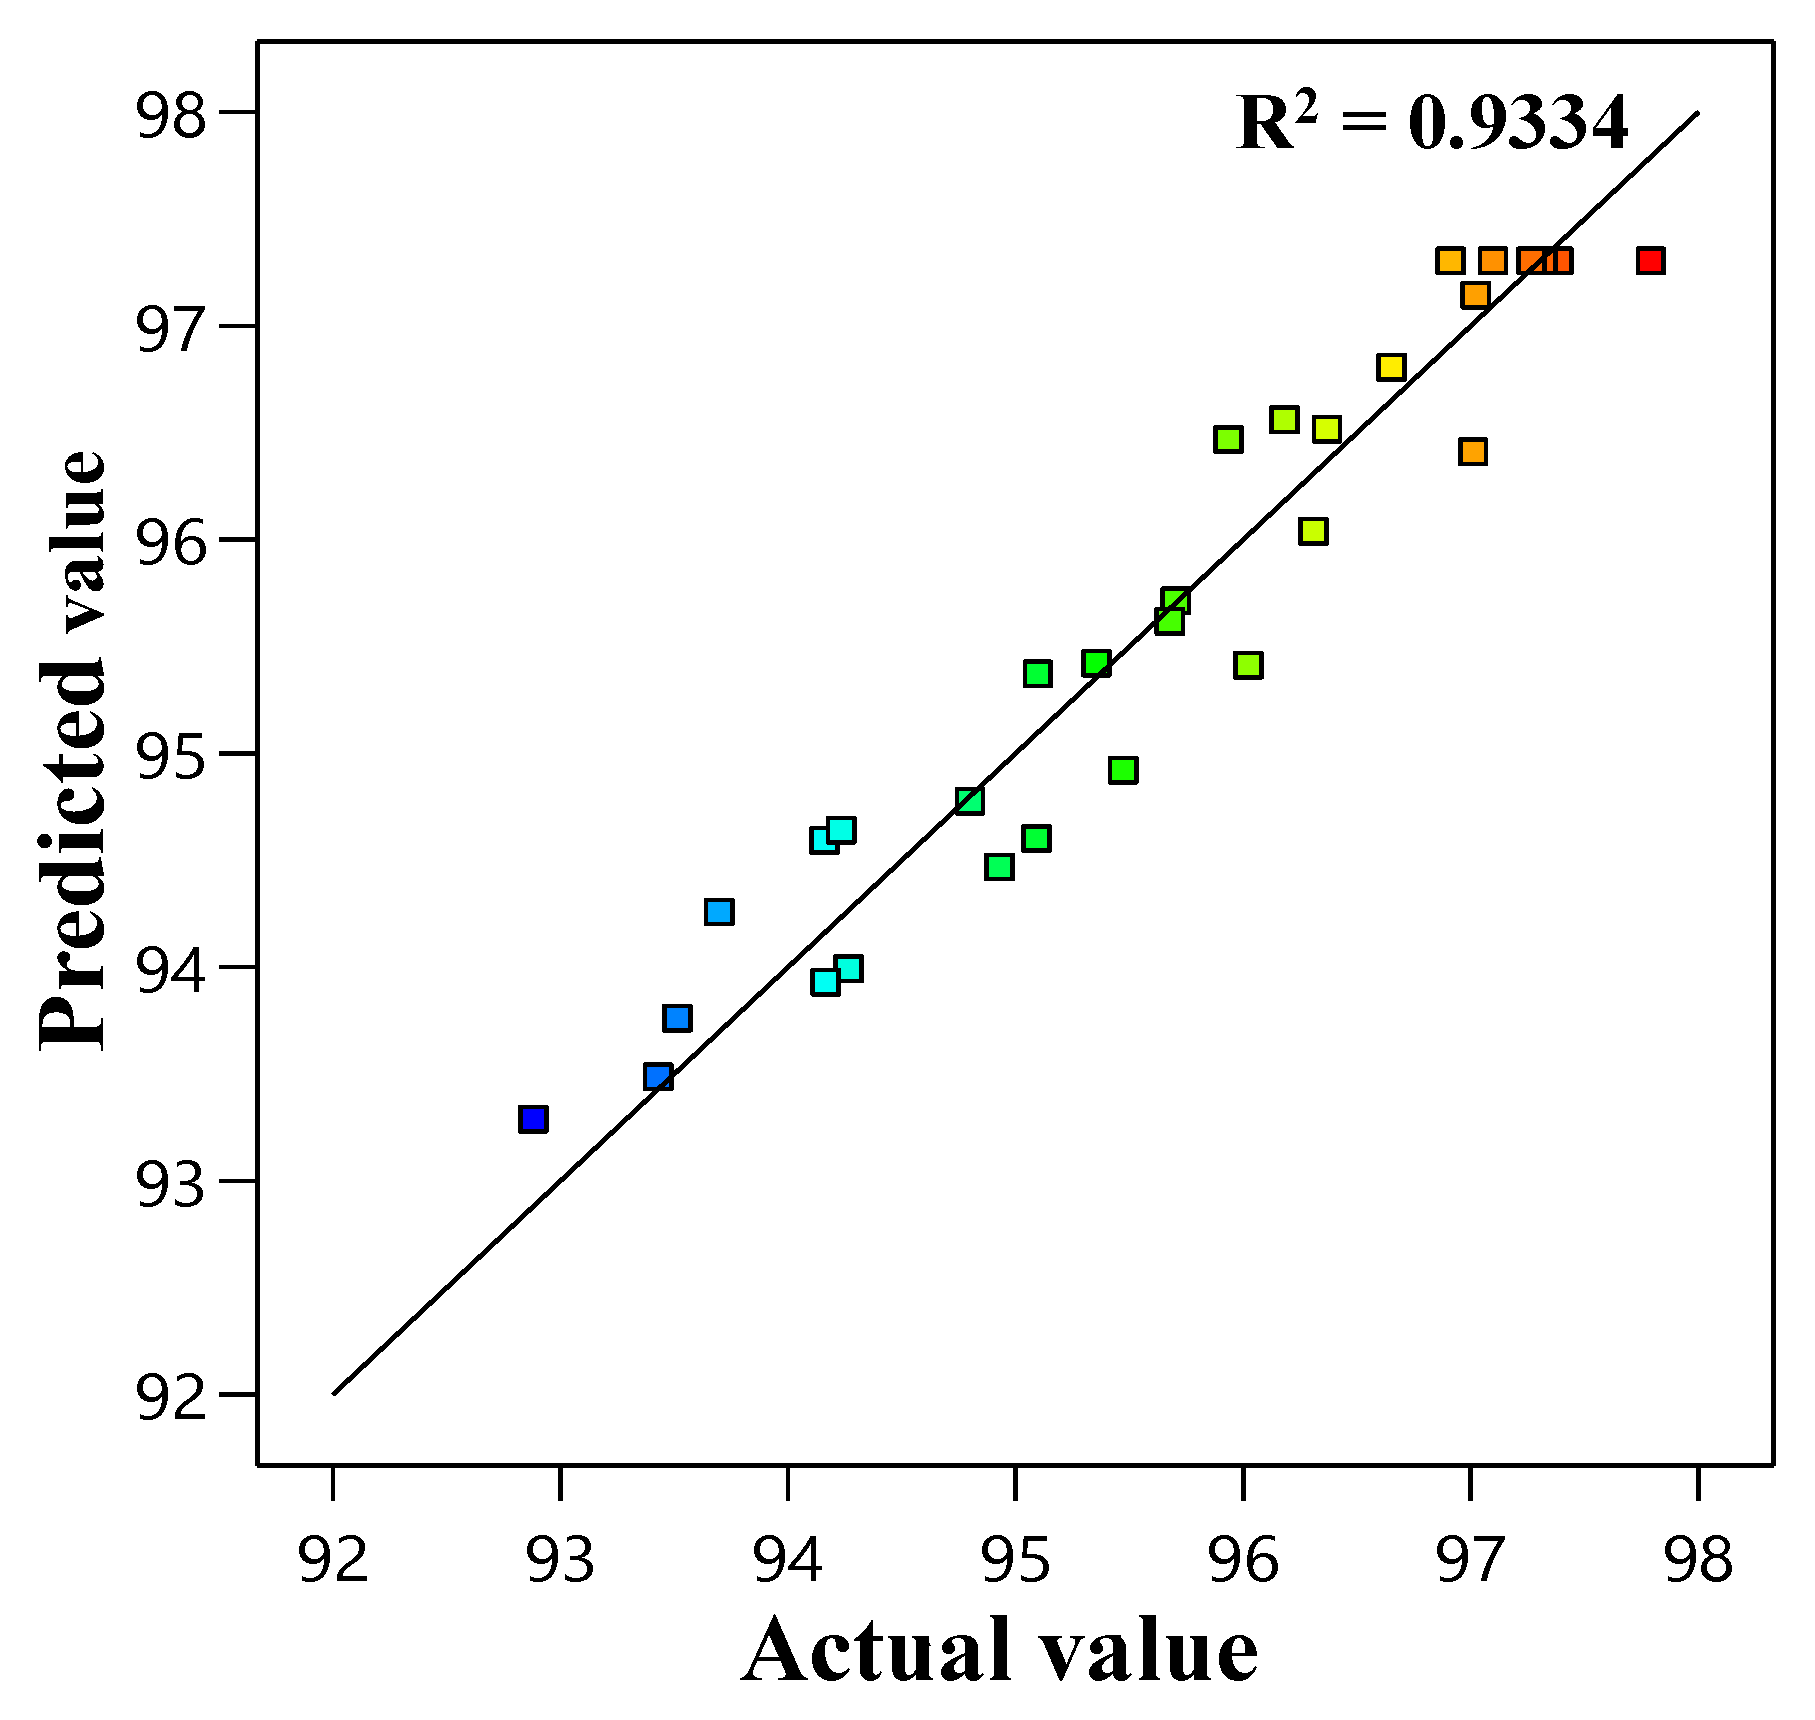
Adequacy of the Model

In Table 4, the percentage of actual and predicted values of MB removal are presented. The fundamental purpose of using regression models is to determine the model’s ability to predict the response variable. Figure 1 illustrates that the predicted value of MB adsorption is plotted against the actual value from data, yielding an R2 value of 0.9334 (Table 7), which validates the models’ accuracy and can be used in the experiment.

3.2. ANOVA and Regression Analysis

The quadratic model’s applicability and importance are demonstrated by the useful technique known as an analysis of variance (ANOVA). The ANOVA analysis is shown in Table 6. The F and p-values define the significance of the coefficient terms. A p-value of 0.05 is regarded as statistically important [40]. Prior research has also shown that a p-value of 0.00 is equally important [41]. In addition, a lack-of-fit test is used to assess how well the model fits the data [42]. The model’s lack of fit was not statistically significant (p-value = 0.08, >0.05), suggesting that noise could be the cause of an 8% lack of fit [43,44]. As per the ANOVA result, the terms A (biosorbent dose), B (initial dye concentration), C (initial pH level), D (temperature), A2, B2, C2, D2, AB, AC, AD, BC, BD, and CD are designated as significant. The summarized model data also identify the model with the highest adjusted and predicted R2 and the smallest standard deviation. For the MB-removal quadratic, the maximum R2 and adjusted R2 were 0.9334 and 0.8713, respectively, with a standard deviation of 0.48. The MB dye regression model has an R2 value of 0.9334 (Table 7), which shows that the independent variables account for 93.34% of the variation in the MB dye removal. The difference between observed values and anticipated values can be explained by a regression model with a significant R2 value of greater than 0.9, which is seen to have the strongest, positive association [45].

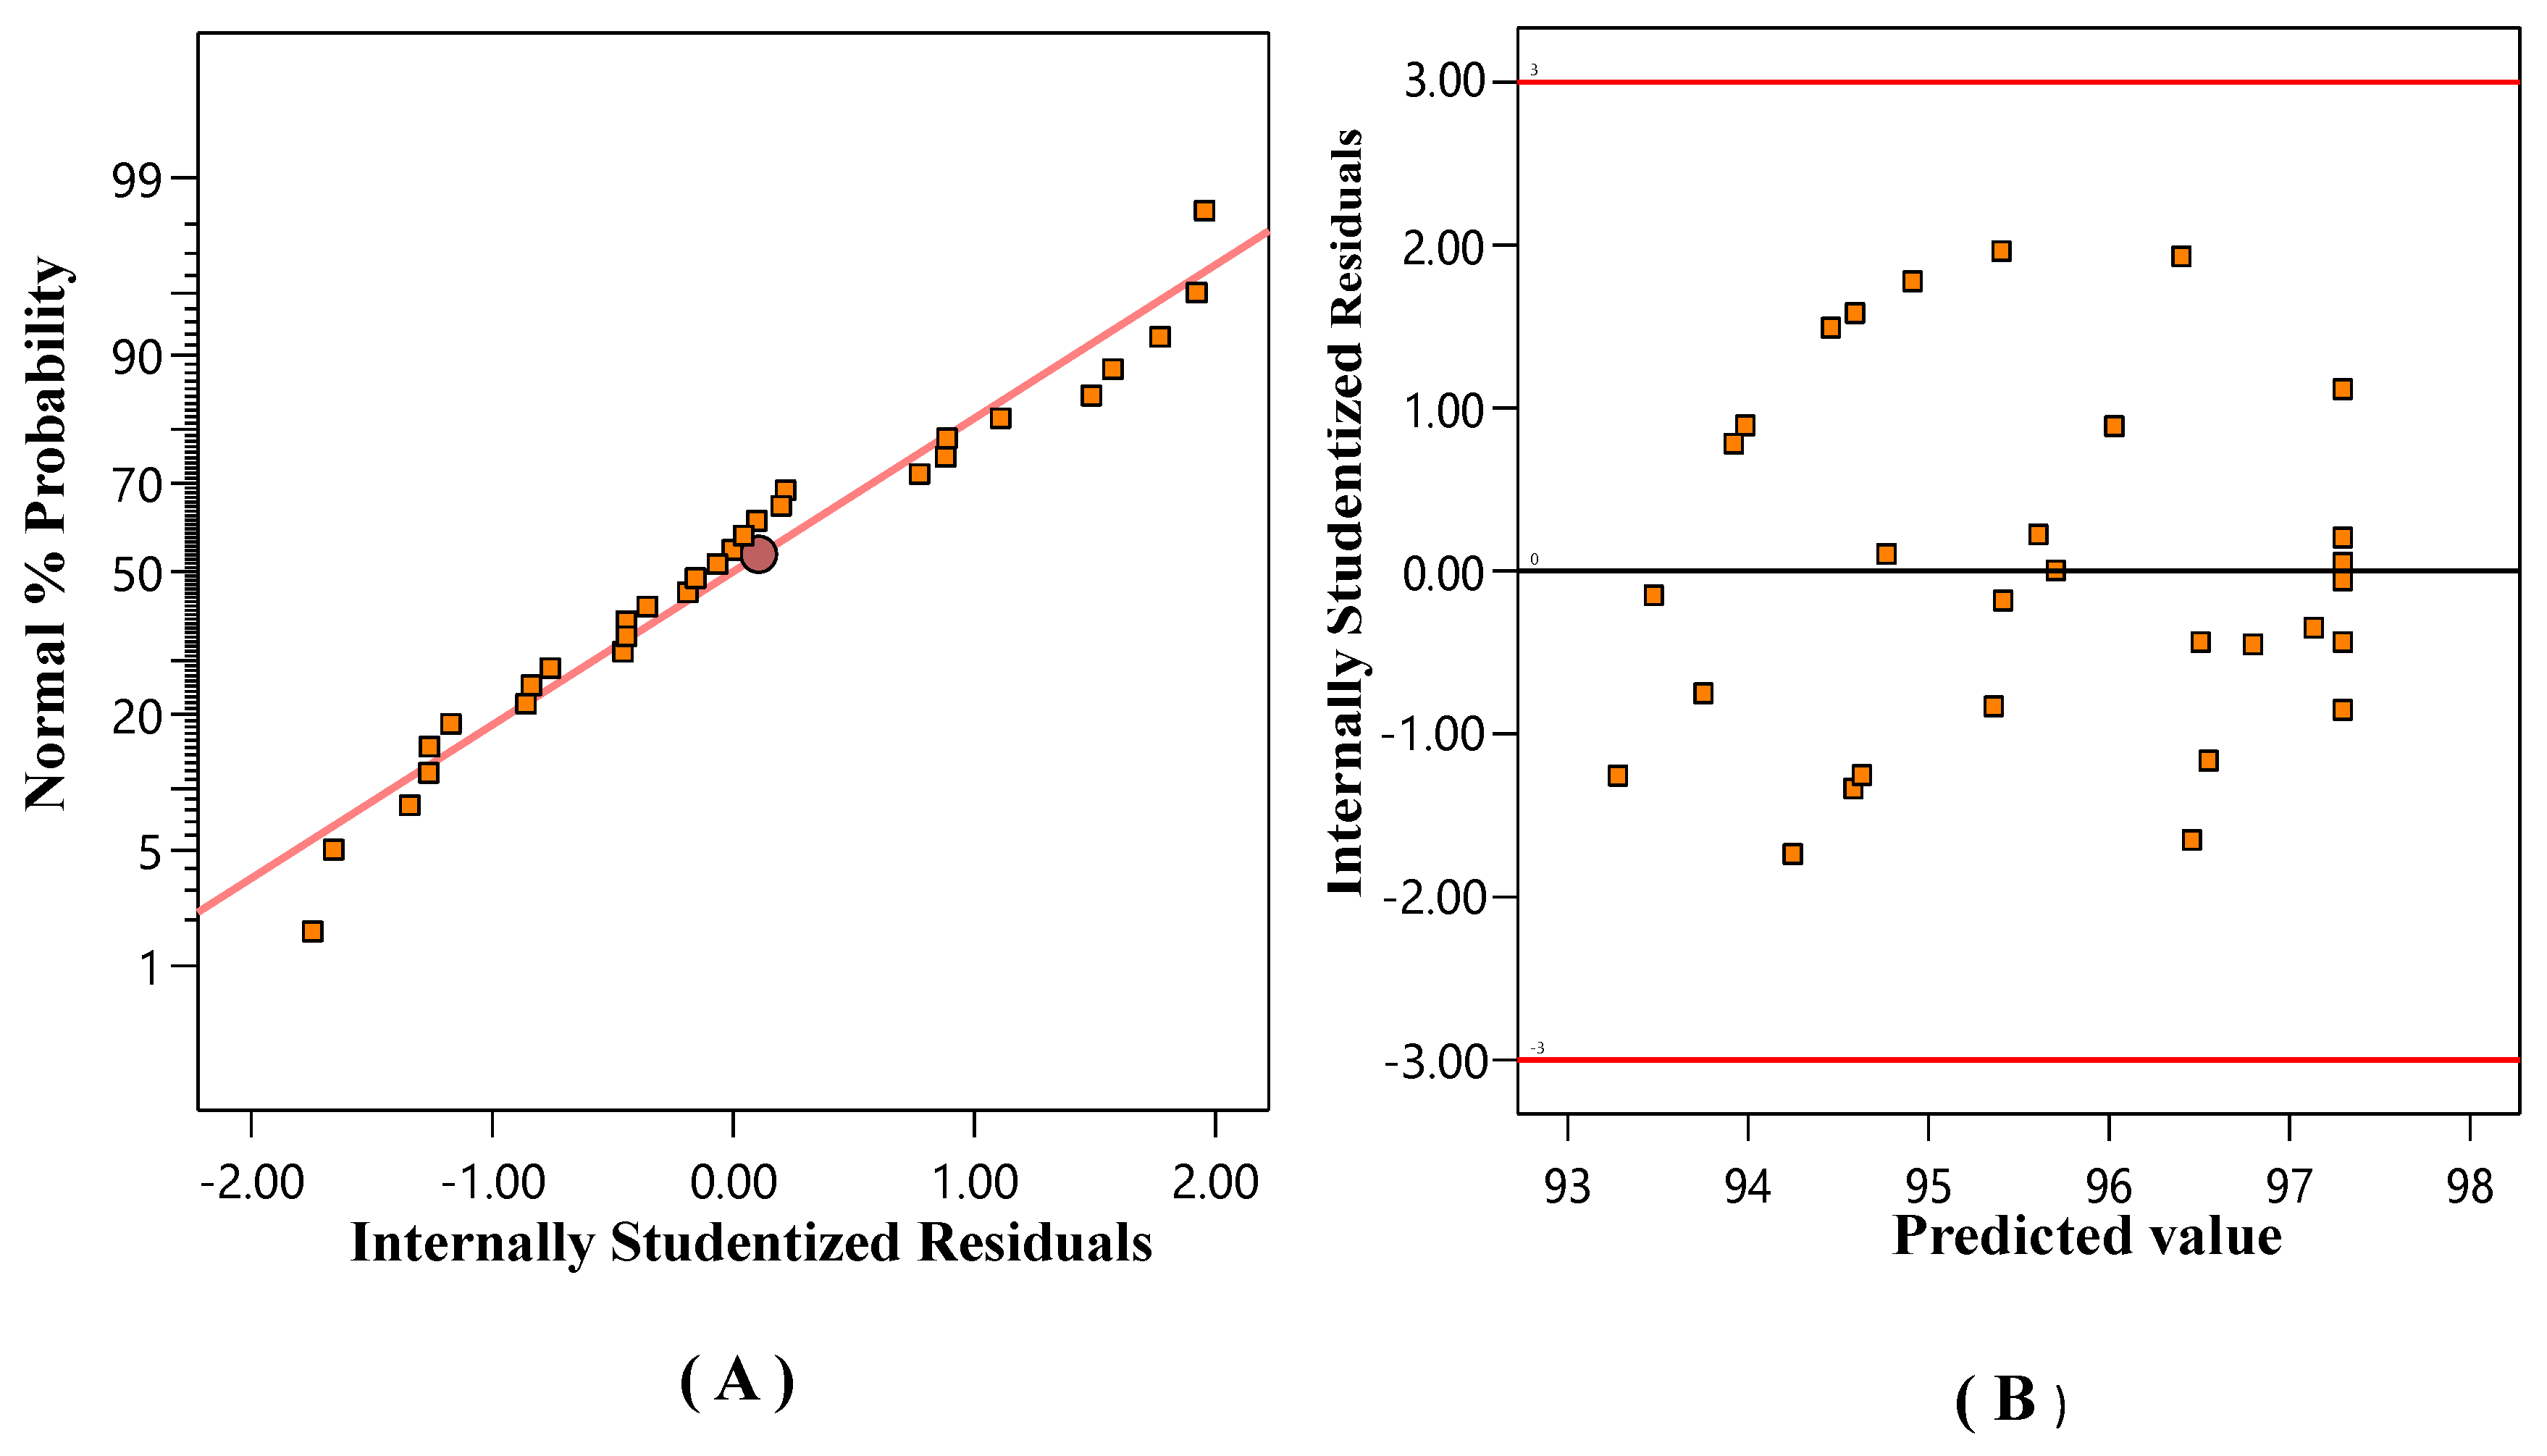
Residuals’ Normal Probability Plot (NPP)

The NPP of the residuals is a crucial statistical metric for assessing the appropriateness of the model [46]. Figure 2A illustrates the NPP of the residuals for the elimination of MB%, and a data analysis shows that the residuals are scattered around the diagonal line of the normal distribution. This implies that the model is acceptable. Figure 2B depicts a graph of residual vs. predicted MB removal percentage data. This graph demonstrates that the point clustered around the diagonal line represents a good fit for the model.

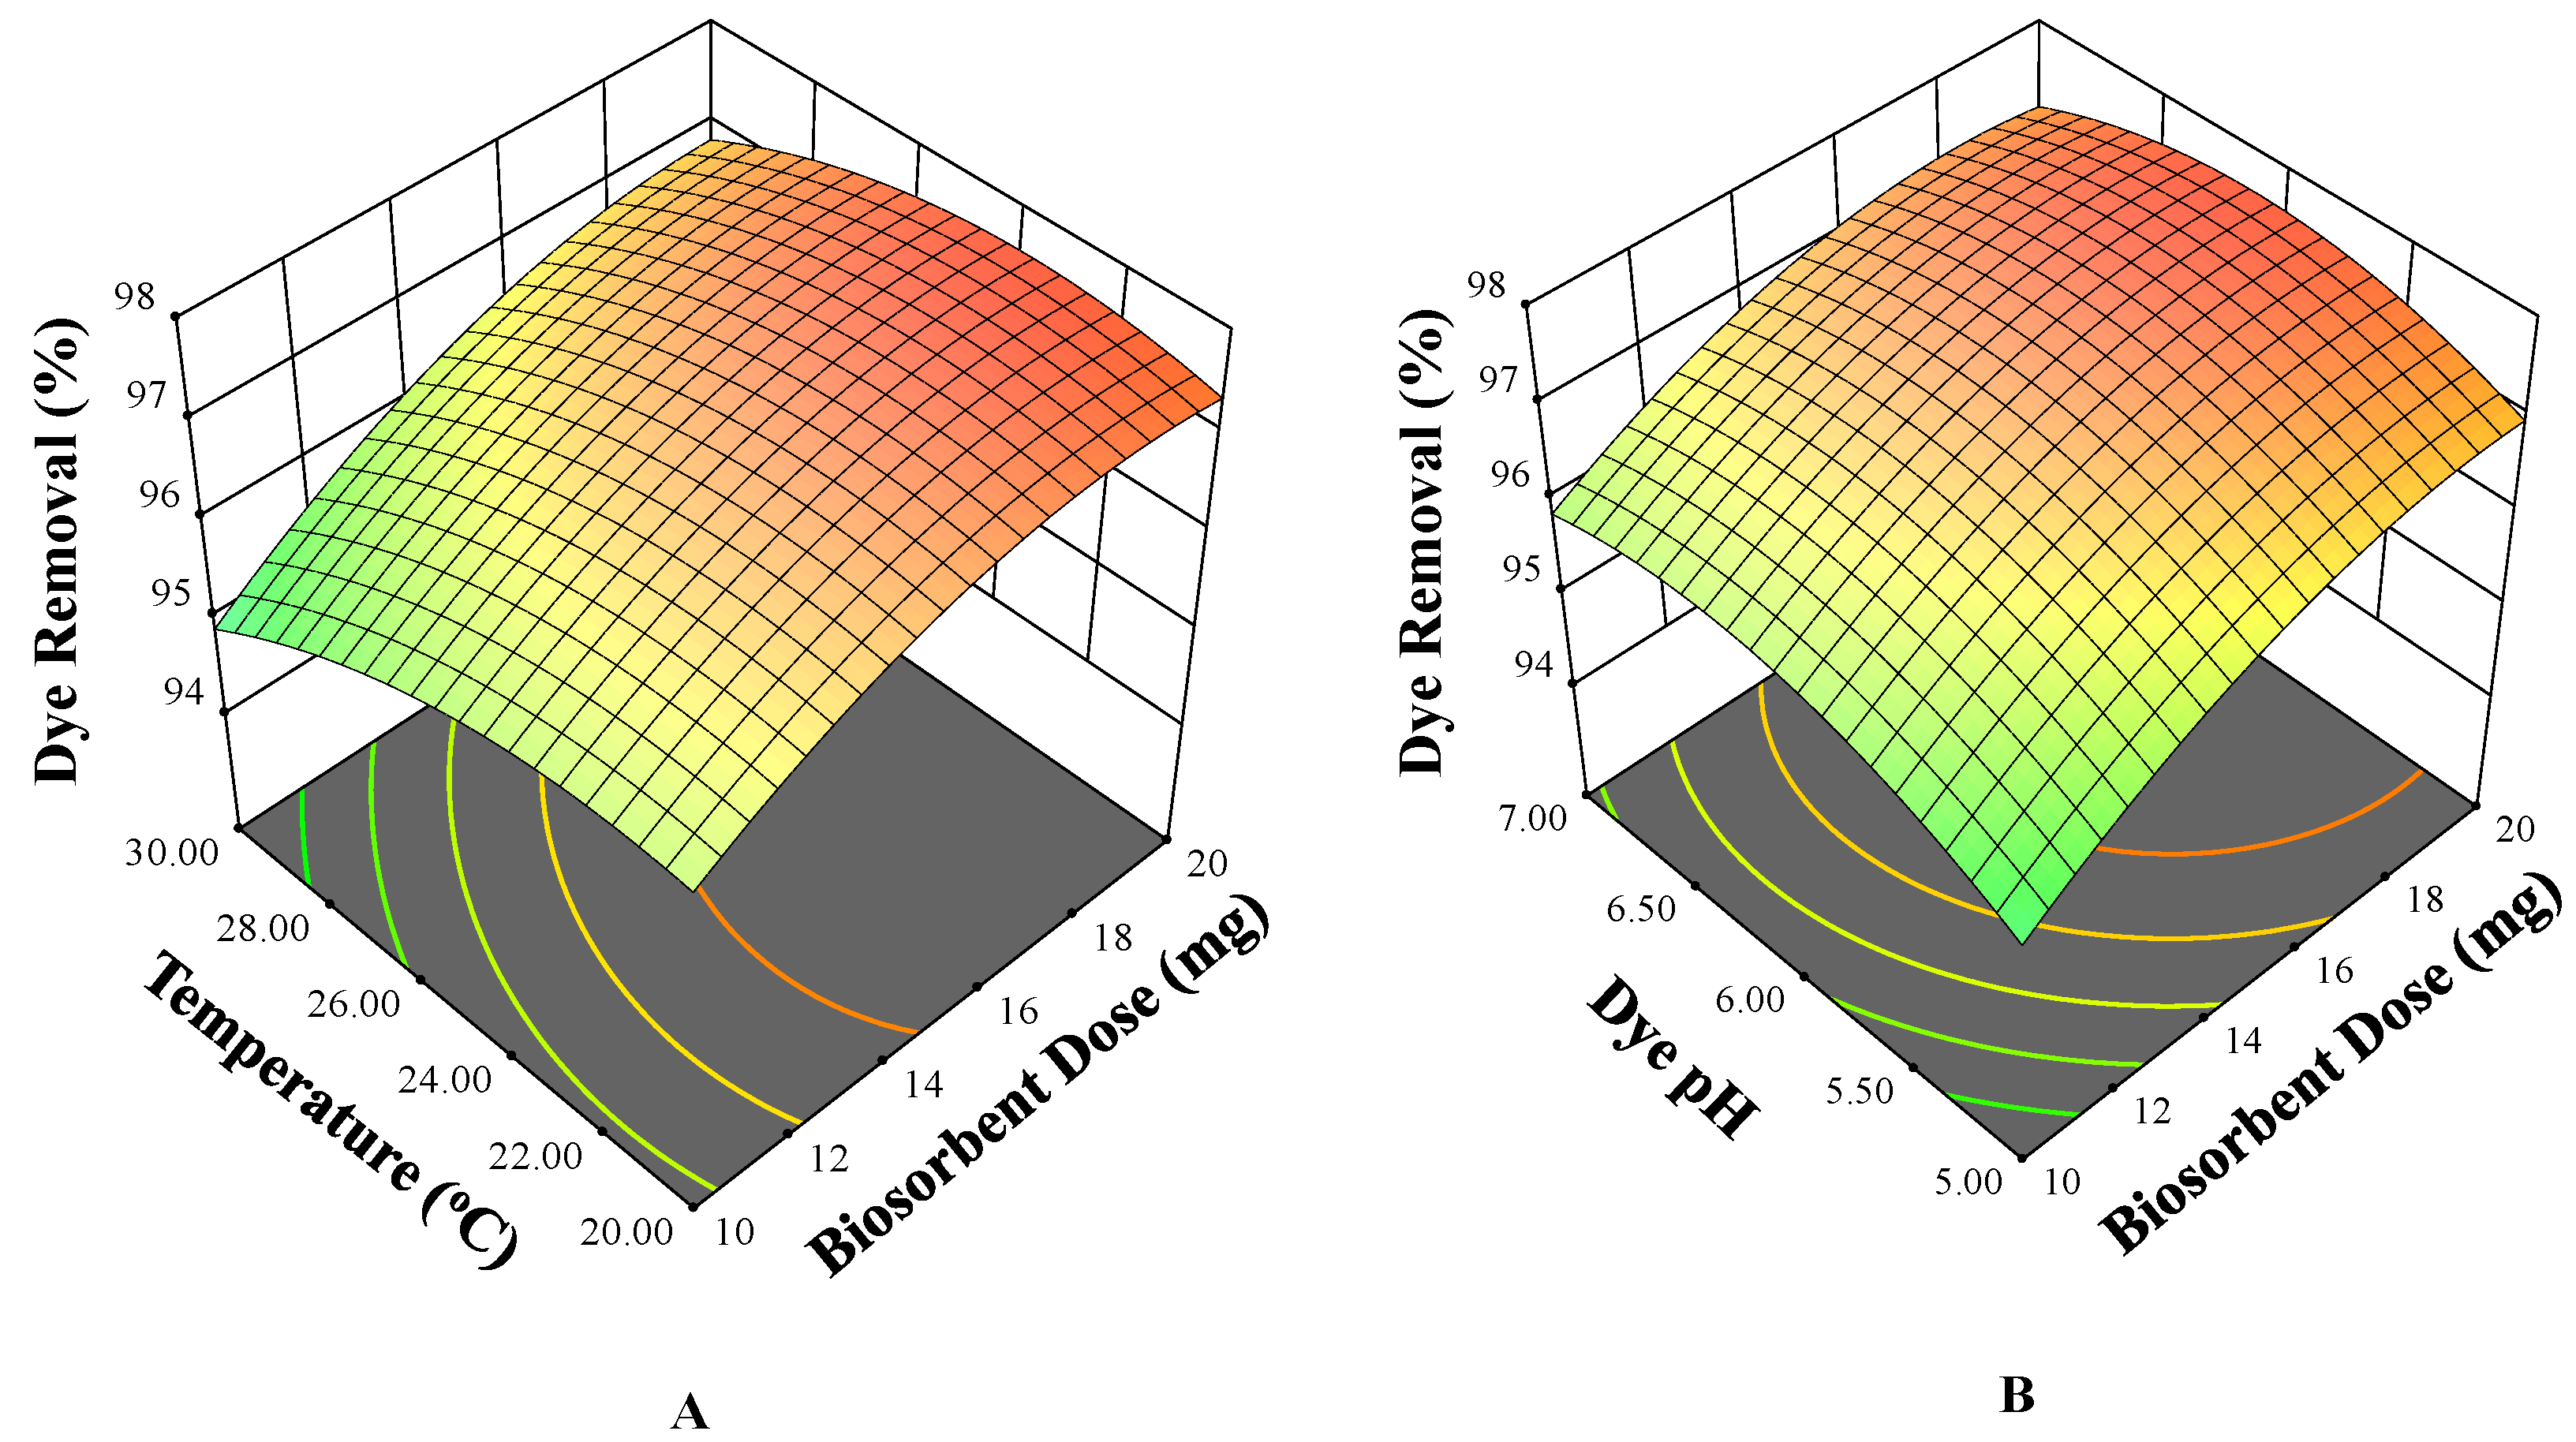
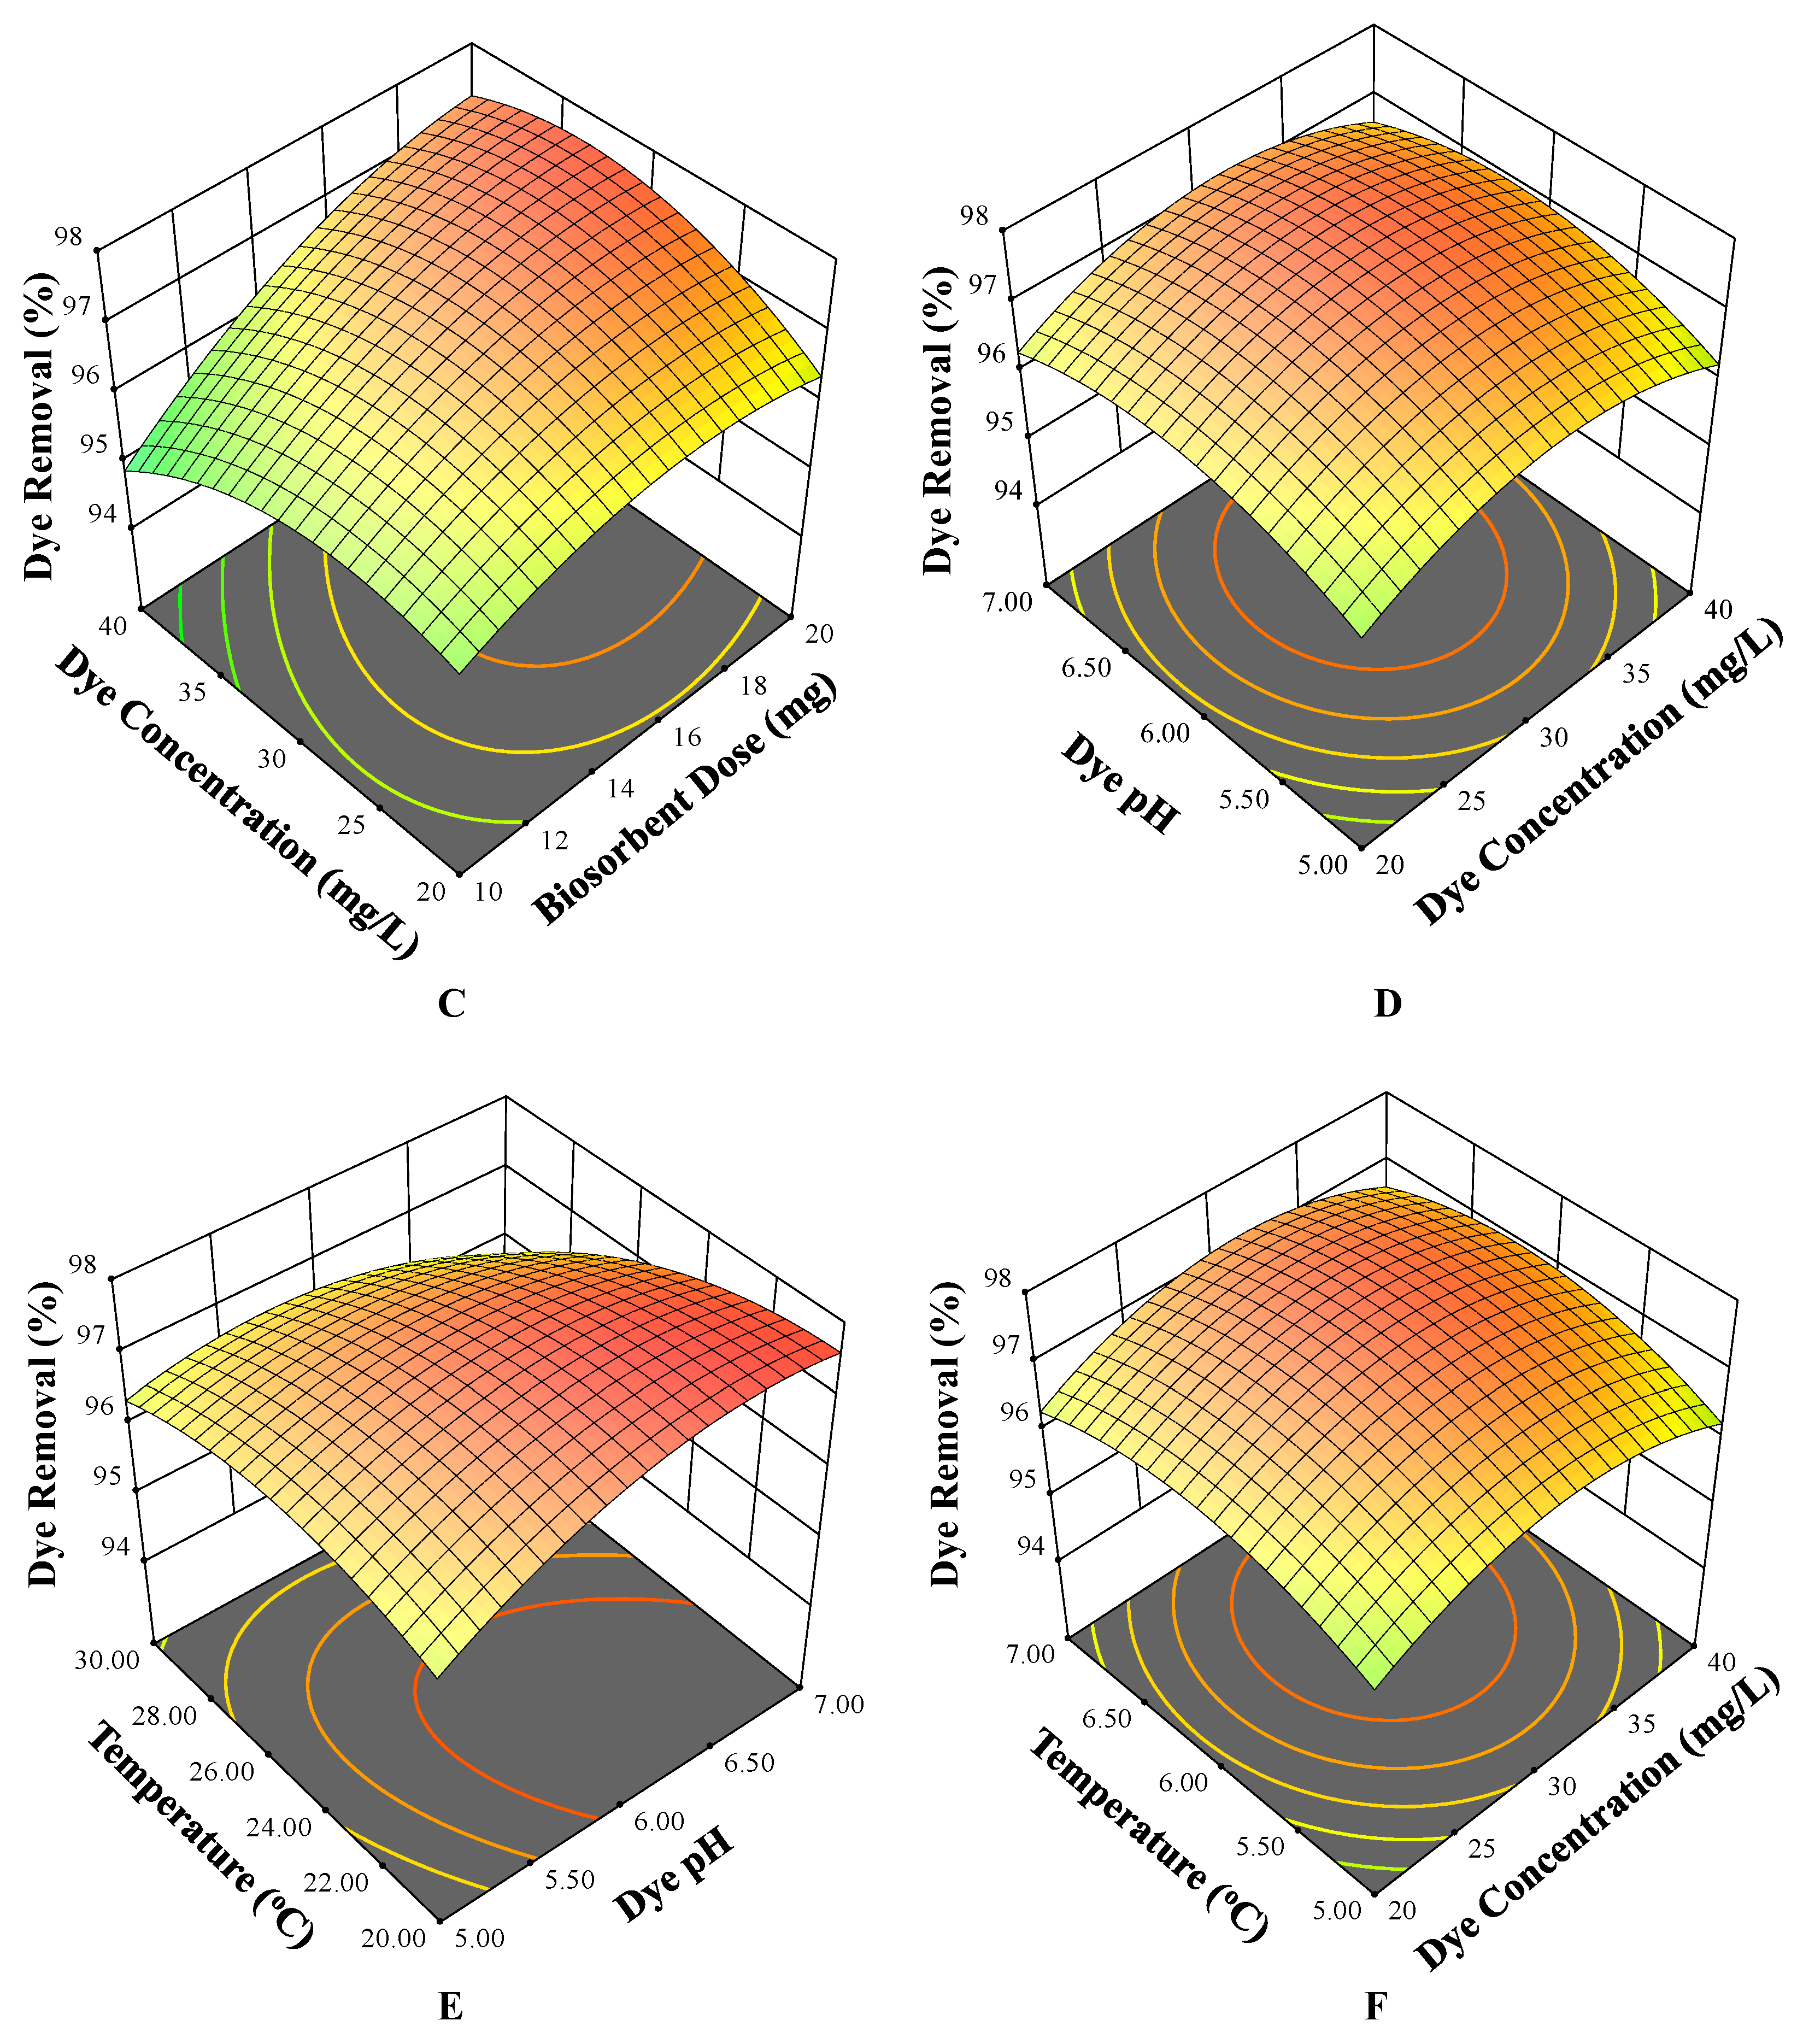
3.3. Three-Dimensional Surface Plots

The associations between the dependent variables (MB dye removal) and the interaction between the four selected independent variables were represented using three-dimensional surface plots to assess the variation in the response values and to select the ideal level of process parameters for the most effective MB dye removal from aqueous solutions. The effect of dye solution temperature with three other independent variables is illustrated in Figure 3A,E,F. Dye removal remained unaffected by temperature, as shown in Figure 3A,F. However, at a higher value of pH, a slight decrease in dye removal was seen with increasing temperature from 20 to 30 °C (Figure 3E).

3.3.1. Effects on pH

The primary factor influencing the pollutant biosorption process has been found to be the initial pH level. The activity of the functional groups of biomasses, the chemistry of the dye solution, and the net charge on the biosorbent cell surface are all affected by pH level [47]. Figure 3B,D,E show how the initial dye pH affects three other independent variables. According to Figure 3B, dye removal increases as pH rises from 5 to 7 at a lower range of biosorbent doses. However, pH had no impact on dye removal at lower biosorbent doses (Figure 3B) or at every range of initial dye concentration (Figure 3D). Additionally, it has been noted that dye removal was reduced when pH was raised at a higher range of temperature values but unaffected at a lower range of temperature values (Figure 3E). According to the results of this study, increasing the pH improves the biosorption of MB dye by J. regia shell biomass, with the highest biosorption occurring at around pH 7 (Figure 4). The protonation and deprotonation of the MB dye as well as the surface of the J. regia shell working as a biosorbent may have contributed to the observed outcome. Dye adsorption on the surface of biomass is regulated by ionic attraction [48]. The electrostatic forces between the MB dyes and the surface charge of J. regia shell particles can adequately explain the differences in adsorption behaviour under different pH values.

3.3.2. Effect of Biosorbent Dose

The primary justification for using biomass in industrial applications is its availability and low cost [49]. Agricultural waste is frequently recognized as a promising biosorbent. To get rid of MB, dried J. regia shell biomass was employed as a biosorbent. Figure 3A–C show how the effect of the biosorbent dose interacts with three other independent factors. It has been noted that as the amount of biosorbent is increased from 10 to 20 mg, dye removal increases at every range of temperature, pH, and concentration values (Figure 3A–C, respectively). The biosorption of MB dye was limited at the lowest biomass content. The concentration of J. regia shell biomass increases the biosorption of MB dye from an aqueous solution [50]. The biosorption of MB dye by J. regia shell was reduced after obtaining the optimal biomass content. More biosorption sites are available due to the J. regia shell biomass’s increased surface area, which leads to effective biosorption [51]. When the biomass levels are low, the active regions are more effectively utilized. El Hassouni et al. assume that the decrease in biosorption process efficiency with increased biomass concentration is caused by an increase in the number of unsaturated active adsorption sites on the biosorbent surface as well as a lack of readily available metal ions in the solution to bind with all the available binding sites [52].

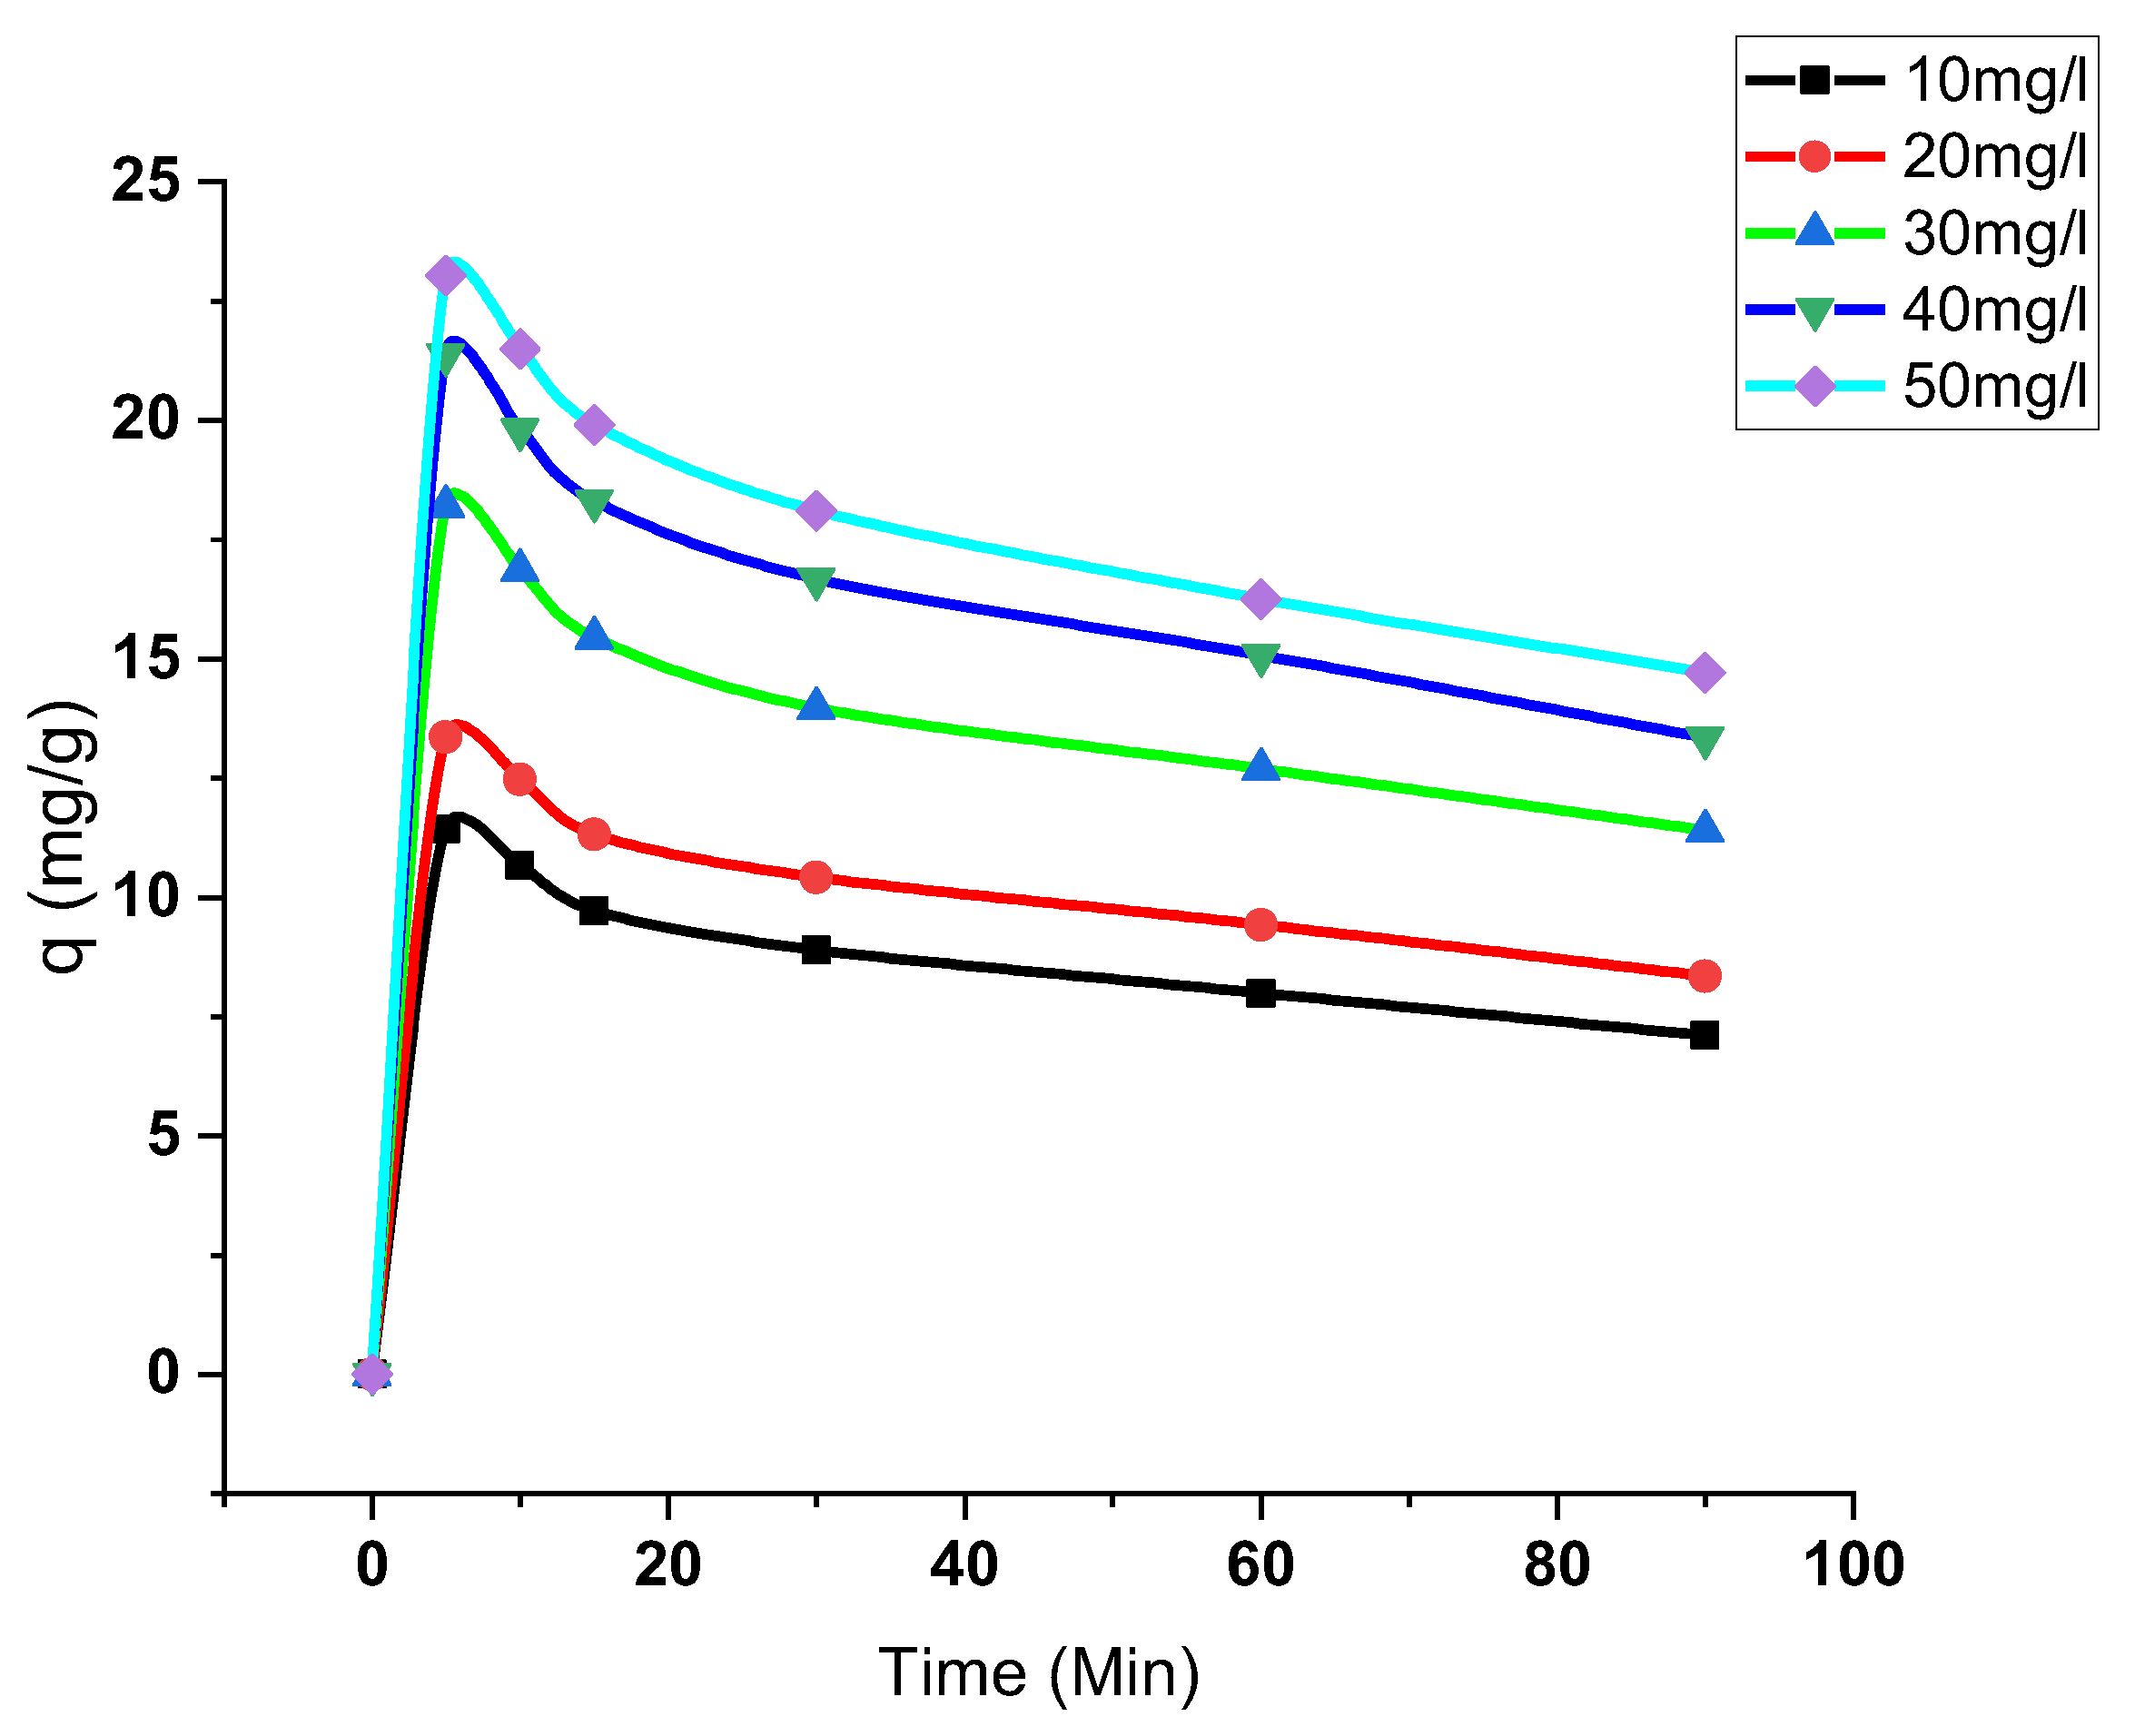
3.3.3. Effect of Initial Concentration and Contact Time

The effect of initial dye concentration with three other independent variables is demonstrated in Figure 3C,D,F. As can be seen in Figure 3C, at a higher biosorbent dose, dye removal marginally rises when the initial dye concentration is increased from 20 to 40 mg/L, but it remains unaltered at a lower biosorbent dose. Additionally, with increasing dye concentration, a modest increase in dye removal was seen at all pH and temperature values (Figure 3D,F). Furthermore, Figure 5 illustrates the effect of concentration and contact time on the biosorption capacity of J. regia shell for the removal of MB. Each dye concentration showed a rapid rise in biosorption capability during the initial stage. The increasing availability of J. regia shell active sites contributed to the initial high biosorption rate.
Due to the increased possibility of MB molecules interacting with active sites on the J. regia shell surface and subsequently occupying all remaining unoccupied sites, the equilibrium biosorption capacity increased as the concentration increased. The biosorption process’ effectiveness is influenced by the length of contact. The elimination percentage rises as contact duration increases. The rise in removal rate could be explained by the existence of unoccupied functional groups on the surface of the biosorbent. A state of equilibrium is reached, and no more adsorption occurs because of the increased contact length, which causes the occupation of active sites and cell surface saturation.

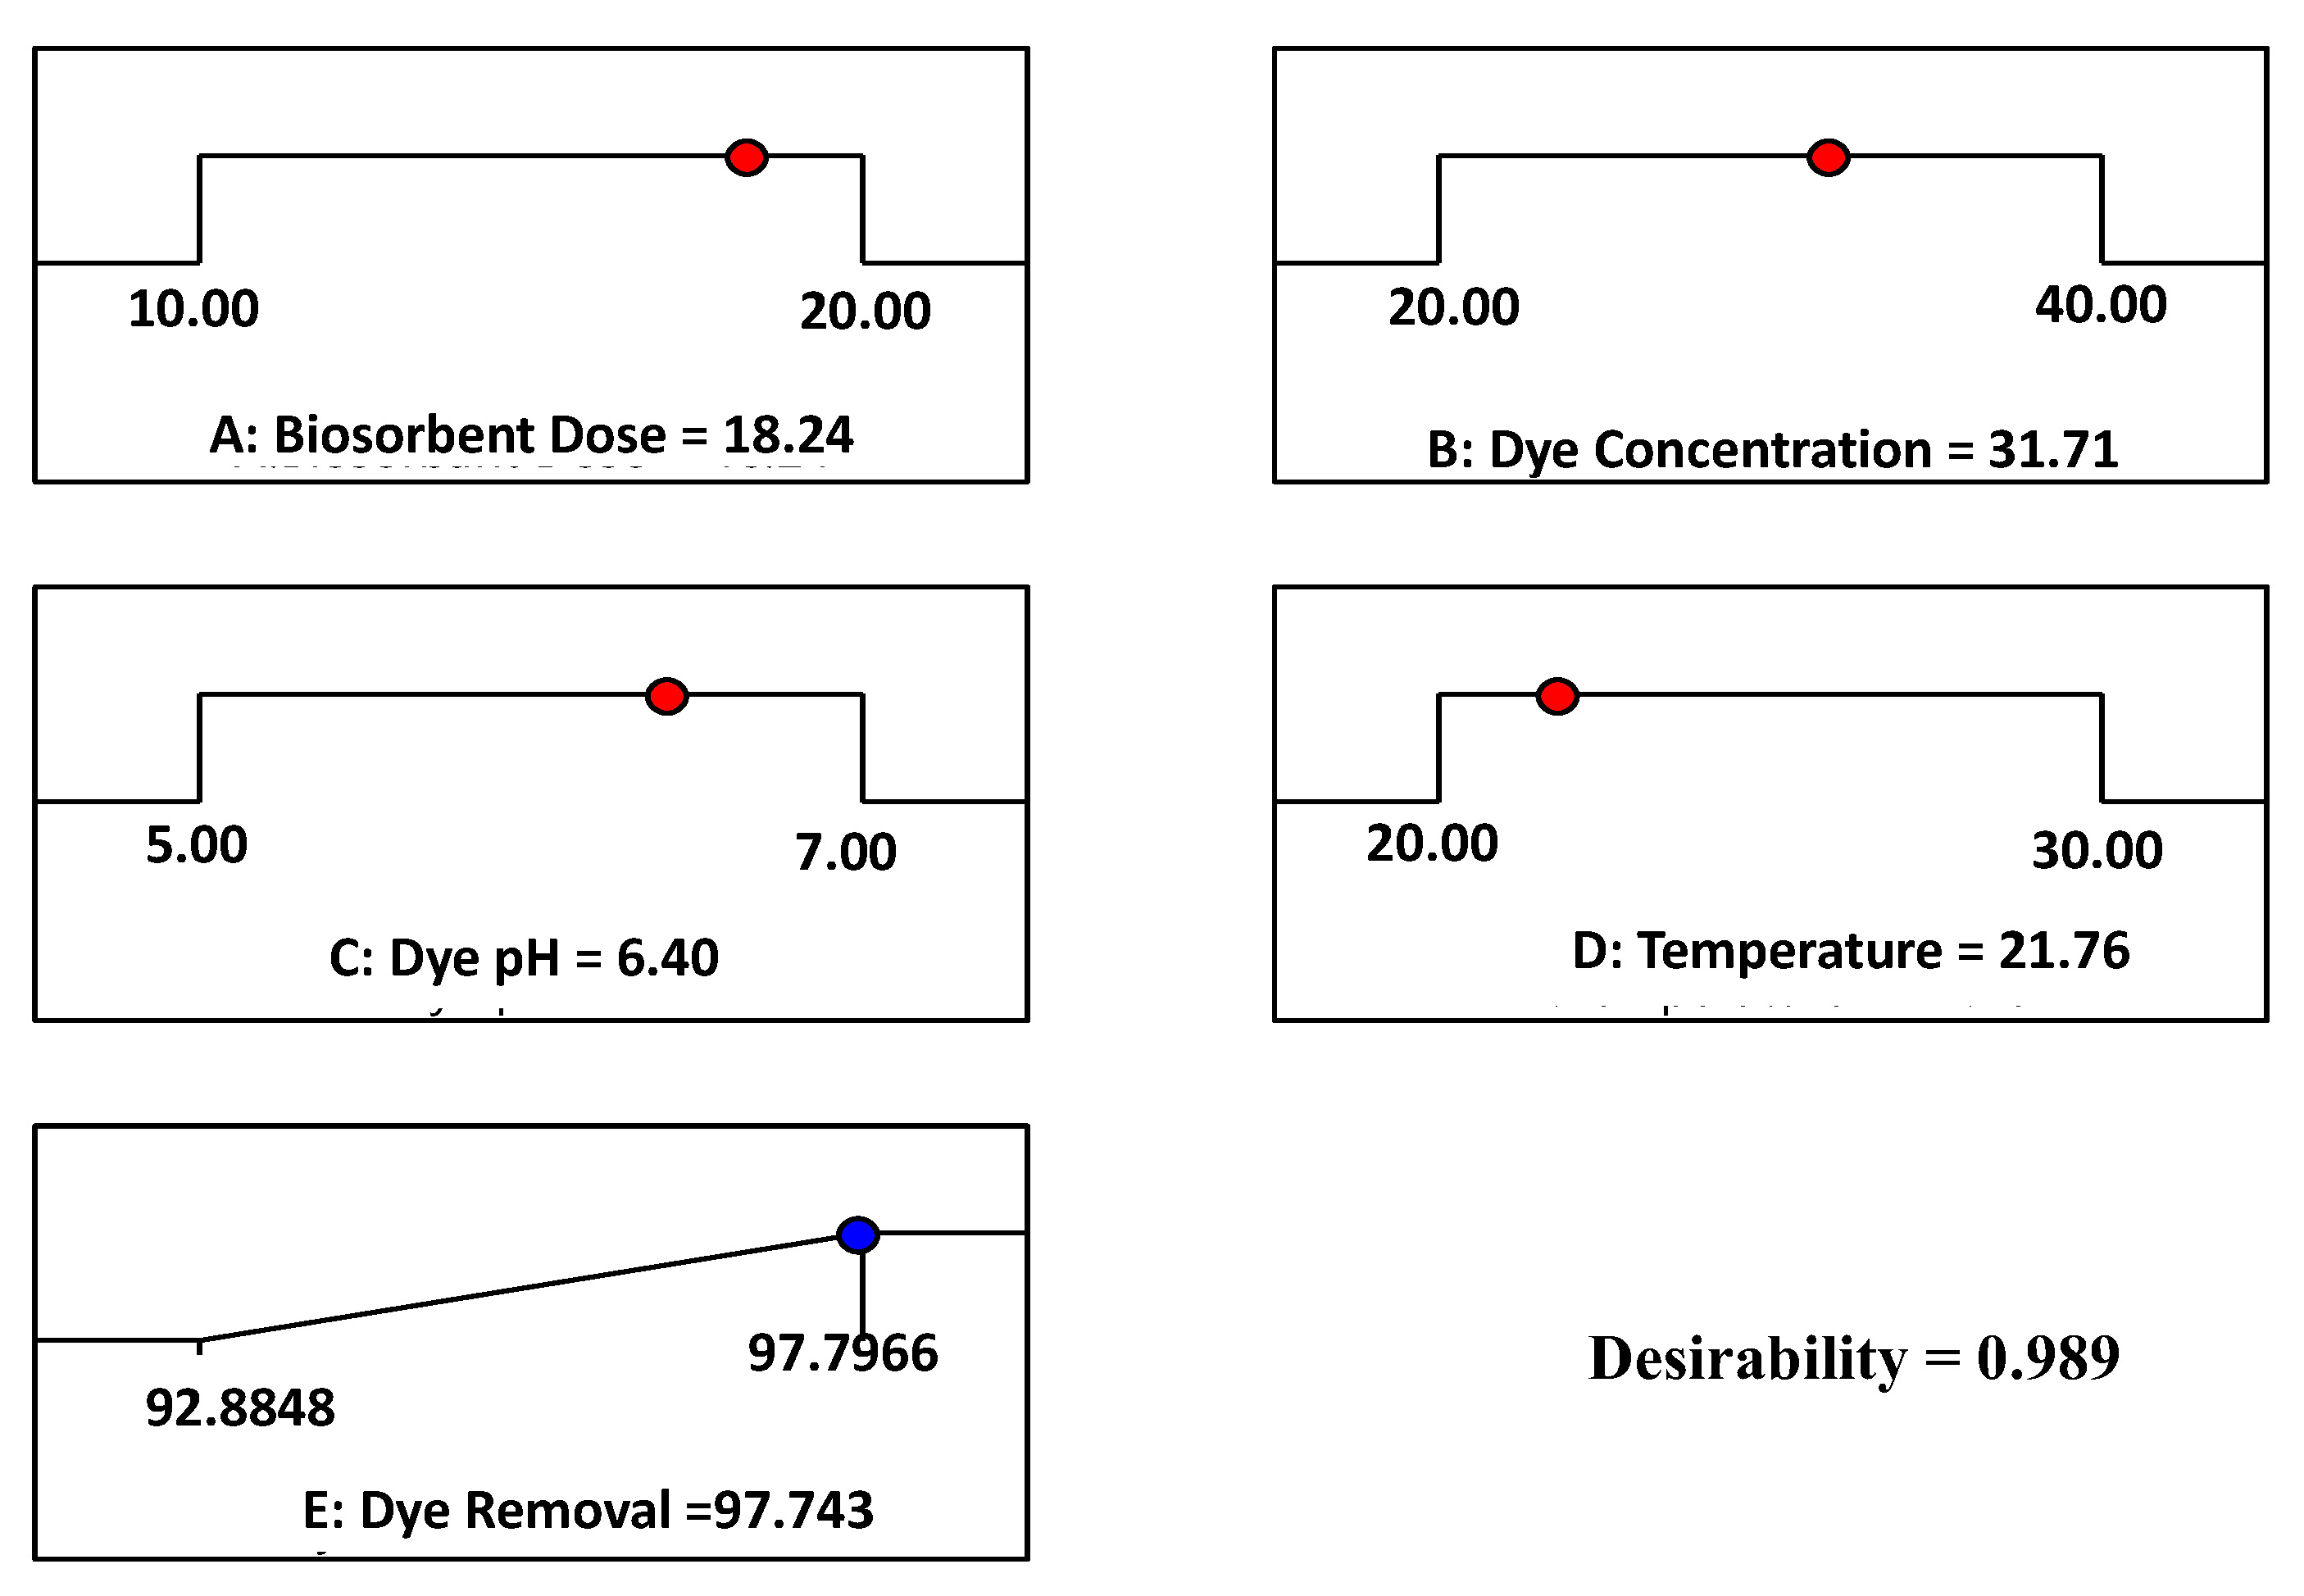
3.4. Desirability Function (DF)

The best-predicted possibility for the highest response was estimated using the desirability function [53]. For the optimization procedure, the desirability function was used. The desirability function values varied from 0 (undesirable) to 1 (desirable). The numerical optimization method finds the points that maximize the desired function. The best-predicted values for the maximum removal percentage of MB and the desirability function are shown in the optimization plot in Figure 6. The optimal projected condition for the optimal removal percentage of MB using the desirability function was a biosorbent dose of 18.2 gm, a dye pH of 6.4, a dye concentration of 31.7 mg/L, a temperature of 21.7 °C, and a dye removal of 97.74%.

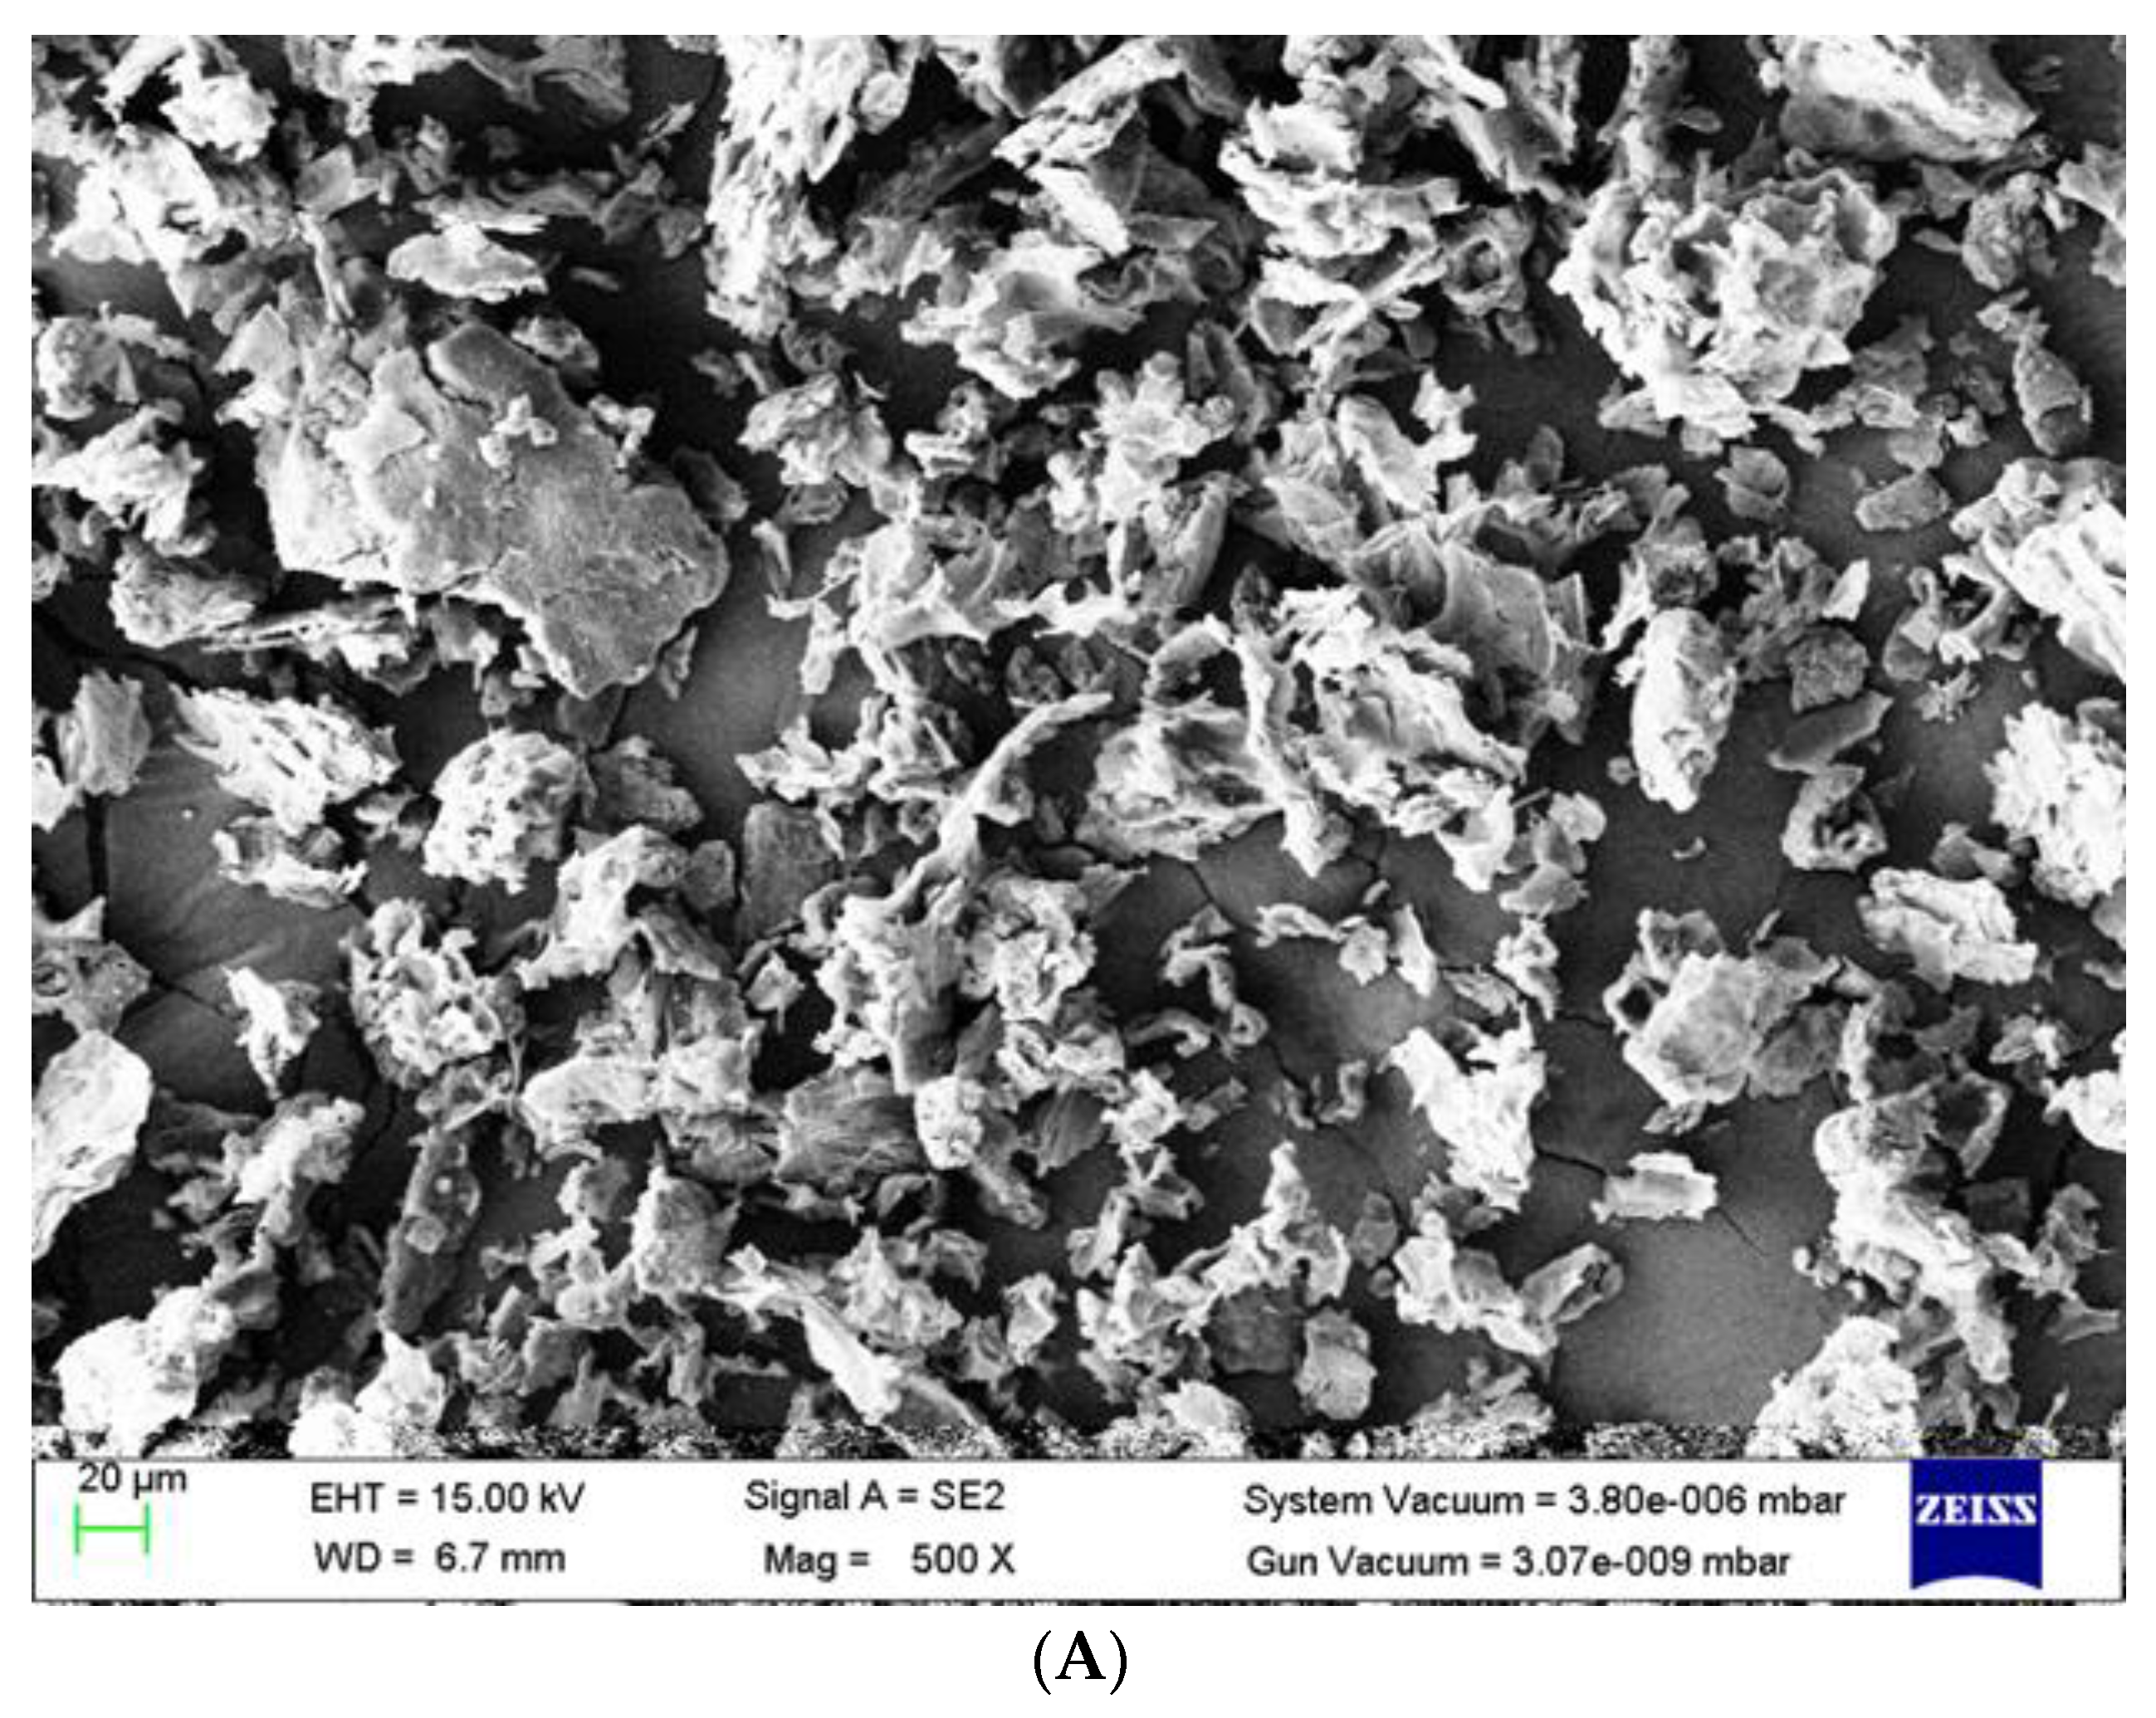
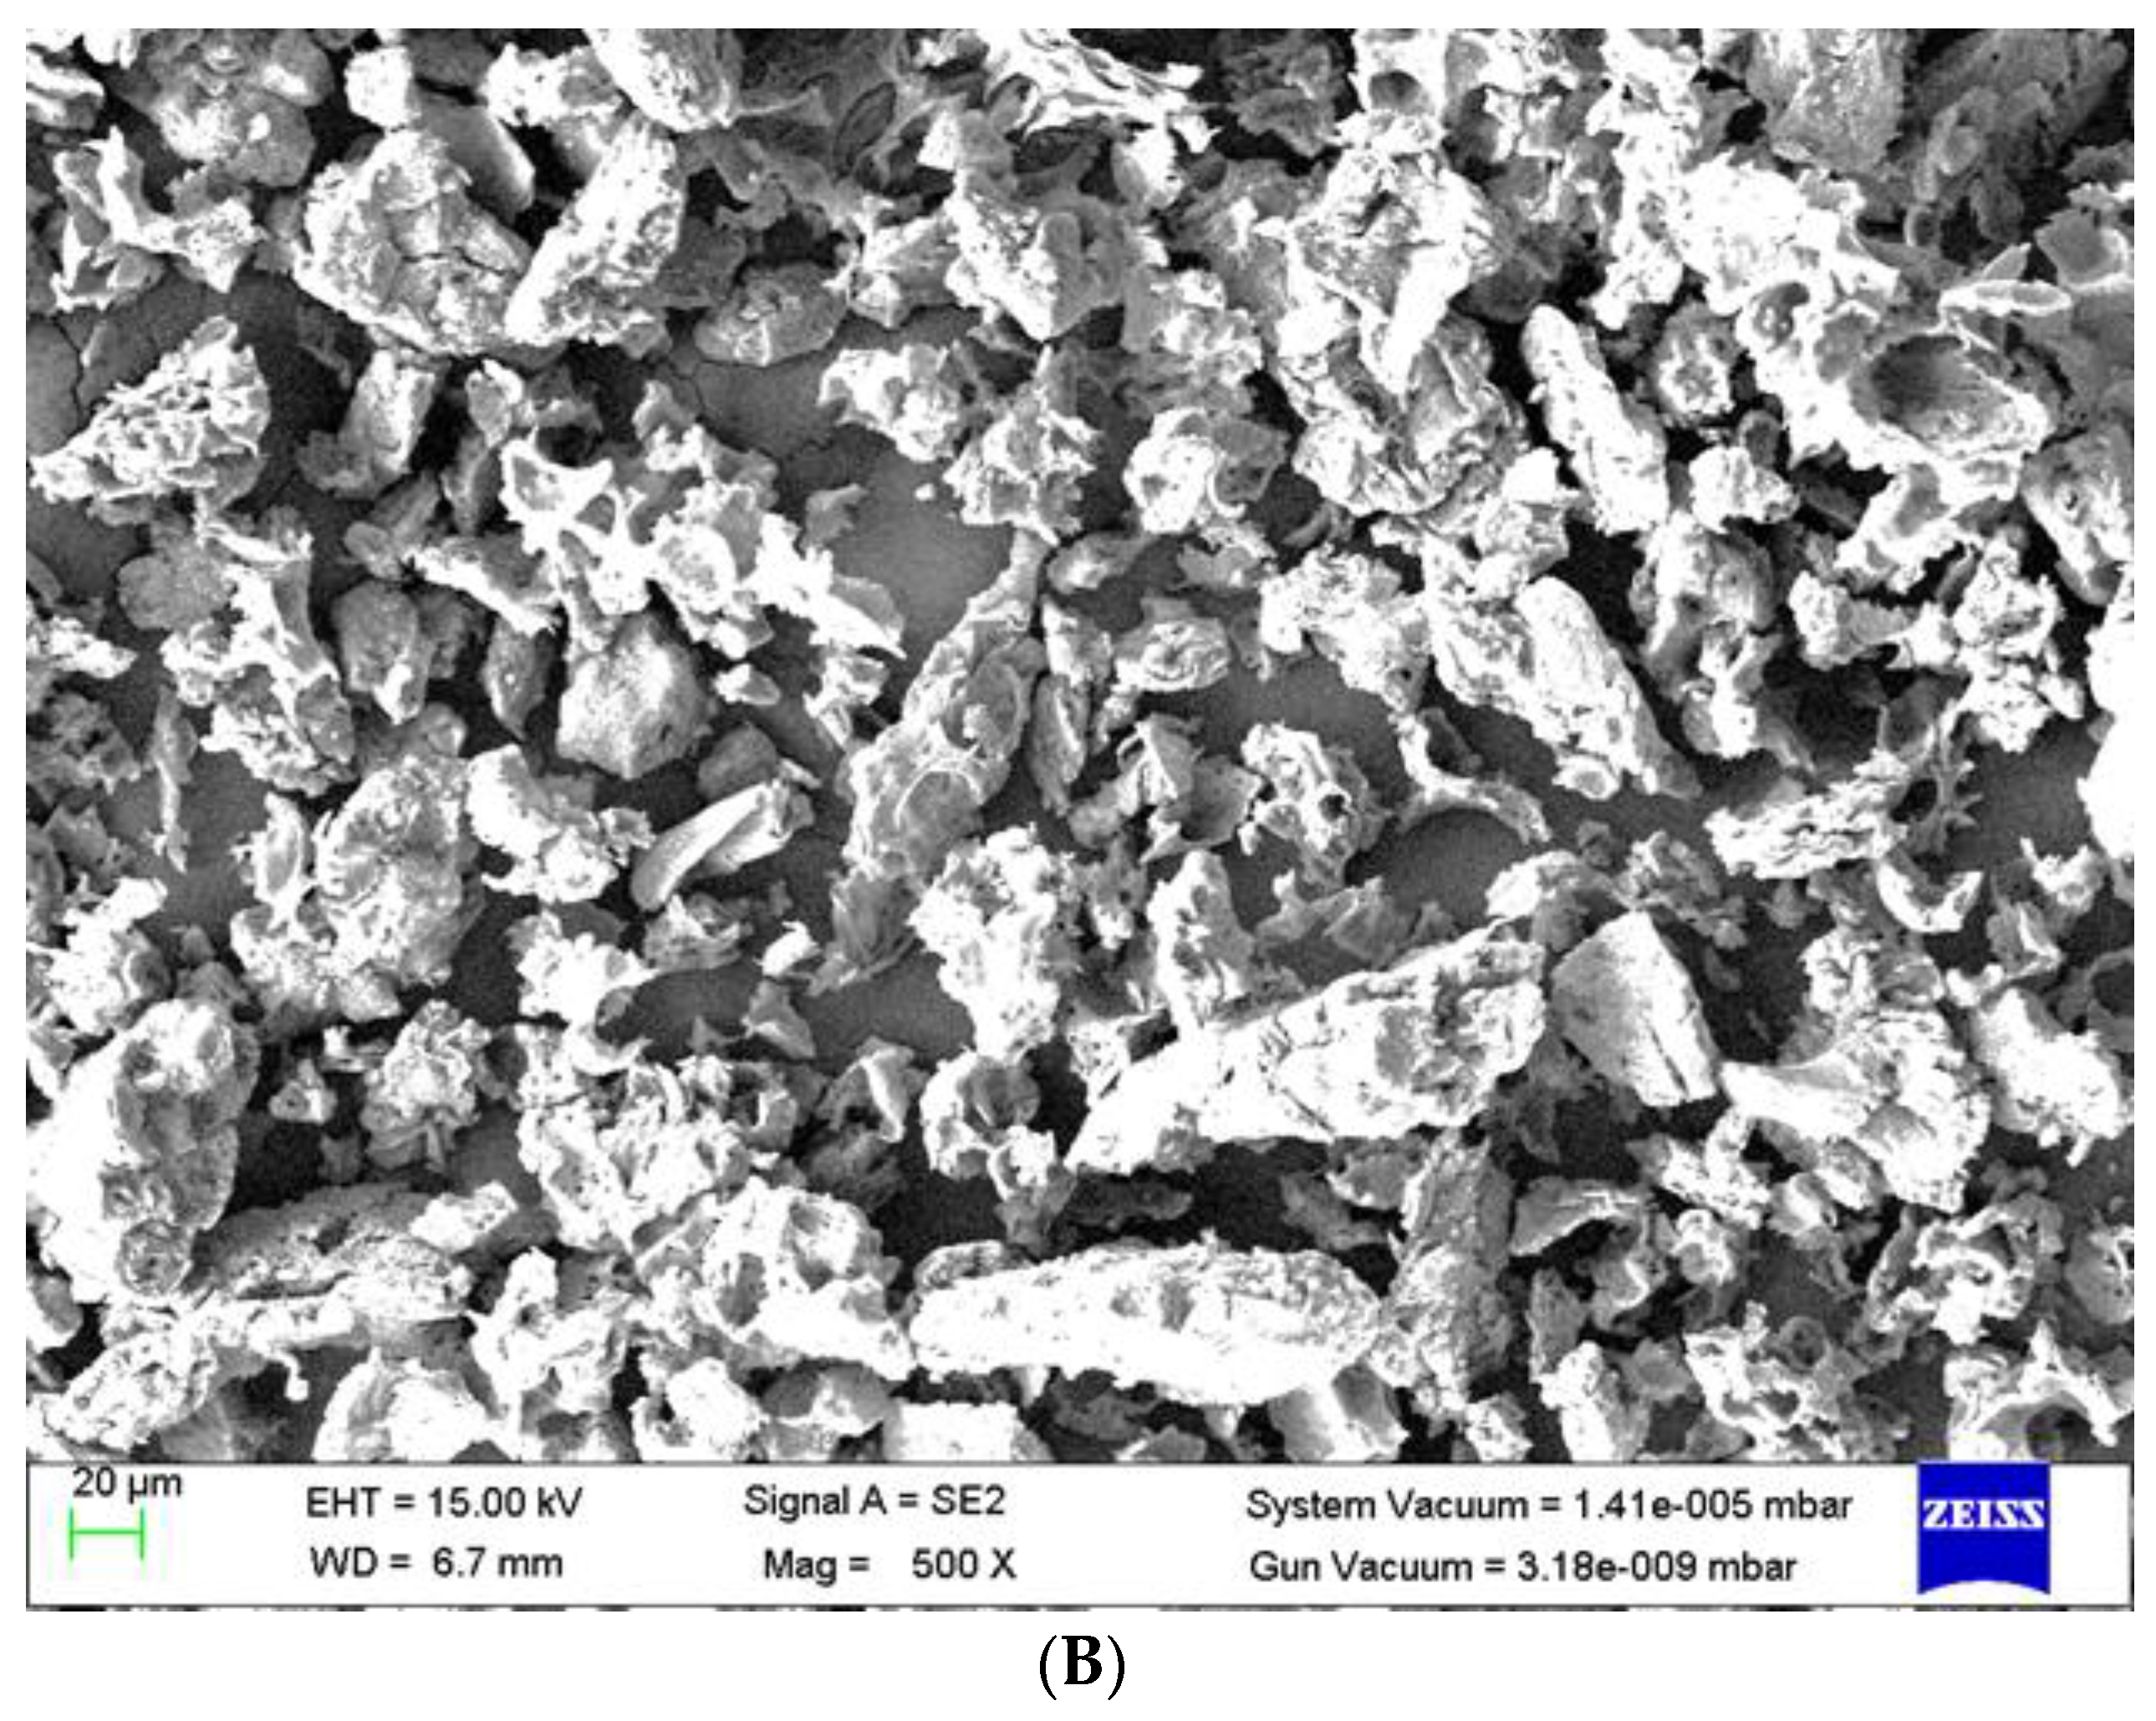
3.5. Surface Morphology of Adsorbent

The surface properties and morphological aspects of J. regia shell biomass both before and after the biosorption processes were examined using a scanning electron microscope (SEM).
The surface morphology of raw J. regia shells reveals an entirely circular layer of pores in a uniform arrangement. Figure 7A exhibits a graph of the surface of J. regia shell biomass prior to biosorption, showing a J. regia shell surface that is highly porous and hard. Figure 7B depicts the morphology of the WNS post-MB adsorption. Figure 7B depicts the accumulation of MB molecules in the J. regia shell porosity structure as well as the formation of a thick-built MB attachment to the J. regia shell surface. This demonstrates that MB can be effectively adsorbed by J. regia shells.

3.6. Fourier Transform Infrared (FTIR) Scan Analysis

The J. regia shell surface was examined before and after MB dye biosorption to detect any changes in the surface features using FTIR spectroscopy, which was also used to improve the chemical’s properties and to determine the presence of functional groups. The frequency of vibration in a J. regia shell was monitored using FTIR spectroscopy often [54]. Each spectrum was collected between wavenumbers 4000 and 400 cm−1. The significant peaks of raw J. regia shells in the functional group area, as seen in Figure 8A, occurred at 3353, 2900, and 1606 cm−1. The band at 1729 cm−1 is created by the carbonyl group being stretched in the C = O direction, whilst the band at 1633 cm−1 may be generated by either the C = C stretching of an alkene or the N-H bending of an amine.
A large peak at 3353 cm−1 is attributable to an O-H stretching vibration, whereas one at 2900 cm−1 is attributed to an alkane [55]. Figure 8B clearly shows that the position of these bands shifts during MB adsorption, showing that the allocated functional groups are actively involved. A high peak at 1630 cm−1 in dye-loaded J. regia shell indicates that MB has been absorbed. This peak is related to the vibrational band of the functional group =N+(CH3)2, which is essential for the formation of H-bonds [56]. Numerous aliphatic, aromatic, and nitro chemicals are present, as indicated by the presence of the major peaks associated with raw J. regia shells at 1227 and 1025 cm-1. The peaks are caused by ring C-C stretching, N-O stretching of nitro compounds, and C-N stretching of aliphatic/aromatic amines [57]. The carbohydrate content in J. regia shell is responsible for the steep and broad peak at 1034 cm−1 [58]. The minor displacement of the usual peaks in the FTIR spectra of MB-adsorbed J. regia shell indicates that MB was successfully absorbed by J. regia shells. FTIR measurements reveal chemical adsorption between MB and the WNS functional groups.

4. Conclusions

One large class of organic pollutants called dyes is recognized to have harmful effects on both people and aquatic habitats. Agriculture-based adsorbents have gained popularity in the textile sector, especially in the area of adsorption. In this work, J. regia shell biomass was employed as a biosorbent to remove methylene blue (MB) dye from an aqueous solution. The biosorbent effectively eliminated the MB from the solution. MB biosorption was investigated as a function of temperature, biomass dosage, initial pH, and dye concentration. The ideal condition for maximal MB removal percentage was a found at a biomass concentration of 18.24 gm, an initial pH level of 6.40, a dye concentration of 31.71 mg/L, and a temperature of 21.7 °C with maximum 97.74% MB dye removal. To maximize the effectiveness of the experiments, the face-centred central composite design matrix was successfully applied. The statistical model’s actual and anticipated response values yielded satisfactory results that showed that the elements under study had a positive impact on the biosorption of MB by the J. regia shell. The adsorbent removed a specific dye well, and its application to other dyes was possible. The current study investigated a sustainable approach to using potential waste biomass for dye industry wastewater treatments. Further advances in the present biosorption phenomena serve as the foundation for a new technology intended to remove various pollutants from aqueous environments.

Author Contributions

Conceptualization, S.K. and M.C.G.; methodology, S.K. and V.D.R.; software, M.C.G., S.K., and S.A.; validation, S.K., S.A., and P.R.; formal analysis, P.S., S.K., and V.D.R.; investigation, S.K.; resources, P.S. and V.D.R.; data curation, P.S. and S.K.; writing—original draft preparation, S.K.; writing—review and editing, M.C.G., A.K.V., and T.M.; visualization, T.M.; supervision, M.C.G. and A.K.V.; project administration, S.A.; funding acquisition, V.D.R., T.M., and P.R. All authors have read and agreed to the published version of the manuscript.

Funding

This research received no external funding.

Data Availability Statement

Not applicable.

Acknowledgments

The authors thank Amity University Uttar Pradesh, Noida, India, for providing the laboratory, and administrative and technical support.

Conflicts of Interest

The authors declare no conflict of interest.

References

  1. Mousavi, S.A.; Mehralian, M.; Khashij, M.; Parvaneh, S. Methylene Blue Removal from Aqueous Solutions by Activated Carbon Prepared from N. Microphyllum (AC-NM): RSM Analysis, Isotherms and Kinetic Studies. Glob. Nest J. 2017, 19, 697–705. [Google Scholar]
  2. World Health Organization. Preventing Disease through Healthy Environments: Exposure to Highly Hazardous Pesticides: A Major Public Health Concern; World Health Organization: Genève, Switzerland, 2019. [Google Scholar]
  3. Dotto, G.L.; McKay, G. Current Scenario and Challenges in Adsorption for Water Treatment. J. Environ. Chem. Eng. 2020, 8, 103988. [Google Scholar] [CrossRef]
  4. Aggarwal, S.C.; Kumar, S. Industrial Water Demand in India: Challenges and Implications for Water Pricing. India Infrastruct. Rep. 2011, 274–284. [Google Scholar]
  5. Kumar, P.; Rehab, H.; Hegde, K.; Brar, S.K.; Cledon, M.; Kermanshahi-Pour, A.; Duy, S.V.; Sauvé, S.; Surampalli, R.Y. Physical and biological removal of Microcystin-LR and other water contaminants in a biofilter using Manganese Dioxide coated sand and Graphene sand composites. Sci. Total Environ. 2020, 703, 135052. [Google Scholar] [CrossRef]
  6. Prasad, A.S.; Rao, K.V. Aerobic Biodegradation of Azo Dye by Bacillus Cohnii MTCC 3616; an Obligately Alkaliphilic Bacterium and Toxicity Evaluation of Metabolites by Different Bioassay Systems. Appl. Microbiol. Biotechnol. 2013, 97, 7469–7481. [Google Scholar] [CrossRef]
  7. Gedam, V.V.; Raut, P.; Chahande, A.; Pathak, P. Kinetic, thermodynamics and equilibrium studies on the removal of Congo red dye using activated teak leaf powder. Appl. Water Sci. 2019, 9, 55. [Google Scholar] [CrossRef] [Green Version]
  8. Wang, C.; Gao, B.; Zhao, P.; Li, R.; Yue, Q.; Shon, H.K. Exploration of Polyepoxysuccinic Acid as a Novel Draw Solution in the Forward Osmosis Process. RSC Adv. 2017, 7, 30687–30698. [Google Scholar] [CrossRef] [Green Version]
  9. Lade, H.; Govindwar, S.; Paul, D. Mineralization and Detoxification of the Carcinogenic Azo Dye Congo Red and Real Textile Effluent by a Polyurethane Foam Immobilized Microbial Consortium in an Upflow Column Bioreactor. Int. J. Environ. Res. Public Health. 2015, 12, 6894–6918. [Google Scholar] [CrossRef] [Green Version]
  10. Jain, H.; Yadav, V.; Rajput, V.D.; Minkina, T.; Agarwal, S.; Garg, M.C. An Eco-Sustainable Green Approach for Biosorption of Methylene Blue Dye from Textile Industry Wastewater by Sugarcane Bagasse, Peanut Hull, and Orange Peel: A Comparative Study Through Response Surface Methodology, Isotherms, Kinetic, and Thermodynamics. Water Air Soil Pollut. 2022, 233, 187. [Google Scholar] [CrossRef]
  11. Khedmati, M.; Khodaii, A.; Haghshenas, H.F. A Study on Moisture Susceptibility of Stone Matrix Warm Mix Asphalt. Constr. Build. Mater. 2017, 144, 42–49. [Google Scholar] [CrossRef]
  12. Behbahani, M.; Moghaddam, M.R.A.; Arami, M. Techno-Economical Evaluation of Fluoride Removal by Electrocoagulation Process: Optimization through Response Surface Methodology. Desalination 2011, 271, 209–218. [Google Scholar] [CrossRef]
  13. Khan, A.; Khan, S.; Khan, M.A.; Qamar, Z.; Waqas, M. The Uptake and Bioaccumulation of Heavy Metals by Food Plants, Their Effects on Plants Nutrients, and Associated Health Risk: A Review. Environ. Sci. Pollut. Res. 2015, 22, 13772–13799. [Google Scholar] [CrossRef] [PubMed]
  14. El-Ahmady El-Naggar, N.; Rabei, N.H.; El-Malkey, S.E. Eco-Friendly Approach for Biosorption of Pb2+ and Carcinogenic Congo Red Dye from Binary Solution onto Sustainable Ulva Lactuca Biomass. Sci. Rep. 2020, 10, 16021. [Google Scholar] [CrossRef] [PubMed]
  15. Ayele, A.; Getachew, D.; Kamaraj, M.; Suresh, A. Phycoremediation of Synthetic Dyes: An Effective and Eco-Friendly Algal Technology for the Dye Abatement. J. Chem. 2021, 2021, 9923643. [Google Scholar] [CrossRef]
  16. Almasi, A.; Omidi, M.; Khodadadian, M.; Khamutian, S.; Gholivand, M.B. Lead(II) and cadmium(II) removal from aqueous solution using processed walnut shell: Kinetic and equilibrium study. Toxicol. Environ. Chem. 2012, 94, 660–671. [Google Scholar] [CrossRef]
  17. Pollard, S.; Fowler, G.; Sollars, C.; Perry, R. Low-cost adsorbents for waste and wastewater treatment: A review. Sci. Total Environ. 1992, 116, 31–52. [Google Scholar] [CrossRef]
  18. Jawad, A.H.; Abdulhameed, A.S. Mesoporous Iraqi Red Kaolin Clay as an Efficient Adsorbent for Methylene Blue Dye: Adsorption Kinetic, Isotherm and Mechanism Study. Surf. Interfaces 2020, 18, 100422. [Google Scholar] [CrossRef]
  19. Beni, A.A.; Esmaeili, A. Biosorption, an Efficient Method for Removing Heavy Metals from Industrial Effluents: A Review. Environ. Technol. Innov. 2020, 17, 100503. [Google Scholar] [CrossRef]
  20. Maksoud, M.I.A.A.; Elgarahy, A.M.; Farrell, C.; Al-Muhtaseb, A.H.; Rooney, D.W.; Osman, A.I. Insight on water remediation application using magnetic nanomaterials and biosorbents. Coord. Chem. Rev. 2020, 403, 213096. [Google Scholar] [CrossRef]
  21. Idalina, D.; José, F.; Bruno, E. Liquefaction and Chemical Composition of Walnut Shells. Open Agric. 2022, 7, 249–256. [Google Scholar]
  22. El-Naggar, N.E.-A.; Hamouda, R.A.; Saddiq, A.A.; Alkinani, M.H. Simultaneous Bioremediation of Cationic Copper Ions and Anionic Methyl Orange Azo Dye by Brown Marine Alga Fucus Vesiculosus. Sci. Rep. 2021, 11, 3555. [Google Scholar] [CrossRef] [PubMed]
  23. Pulicharla, R.; Brar, S.K.; Rouissi, T.; Auger, S.; Drogui, P.; Verma, M.; Surampalli, R.Y. Degradation of Chlortetracycline in Wastewater Sludge by Ultrasonication, Fenton Oxidation, and Ferro-Sonication. Ultrason. Sonochem. 2017, 34, 332–342. [Google Scholar] [CrossRef] [PubMed]
  24. Igwegbe, C.A.; Mohmmadi, L.; Ahmadi, S.; Rahdar, A.; Khadkhodaiy, D.; Dehghani, R.; Rahdar, S. Modeling of Adsorption of Methylene Blue Dye on Ho-CaWO4 Nanoparticles Using Response Surface Methodology (RSM) and Artificial Neural Network (ANN) Techniques. MethodsX 2019, 6, 1779–1797. [Google Scholar] [CrossRef] [PubMed]
  25. Pashaei, H.; Ghaemi, A.; Nasiri, M.; Karami, B. Experimental Modeling and Optimization of CO2 Absorption into Piperazine Solutions Using RSM-CCD Methodology. ACS Omega 2020, 5, 8432–8448. [Google Scholar] [CrossRef] [Green Version]
  26. Bagheri, R.; Ghaedi, M.; Asfaram, A.; Dil, E.A.; Javadian, H. RSM-CCD Design of Malachite Green Adsorption onto Activated Carbon with Multimodal Pore Size Distribution Prepared from Amygdalus Scoparia: Kinetic and Isotherm Studies. Polyhedron 2019, 171, 464–472. [Google Scholar] [CrossRef]
  27. Sen, S.; Nandi, S.; Dutta, S. Application of RSM and ANN for Optimization and Modeling of Biosorption of Chromium (VI) Using Cyanobacterial Biomass. Appl. Water Sci. 2018, 8, 148. [Google Scholar] [CrossRef] [Green Version]
  28. Yadav, V.; Ali, J.; Garg, M.C. Biosorption of Methylene Blue Dye from Textile-Industry Wastewater onto Sugarcane Bagasse: Response Surface Modeling, Isotherms, Kinetic and Thermodynamic Modeling. J. Hazard. Toxic Radioact. Waste 2021, 25, 04020067. [Google Scholar] [CrossRef]
  29. Dbik, A.; El Messaoudi, N.; Bentahar, S.; el Khomri, M.; Lacherai, A.; Faska, N. Optimization of Methylene Blue Adsorption on Agricultural Solid Waste Using Box–Behnken Design (BBD) Combined with Response Surface Methodology (RSM) Modeling. Biointerface Res. Appl. Chem. 2022, 12, 4567–4583. [Google Scholar]
  30. Gupta, A.; Balomajumder, C. Simultaneous Adsorption of Cr (VI) and Phenol onto Tea Waste Biomass from Binary Mixture: Multicomponent Adsorption, Thermodynamic and Kinetic Study. J. Environ. Chem. Eng. 2015, 3, 785–796. [Google Scholar] [CrossRef]
  31. Repo, E.; Malinen, L.; Koivula, R.; Harjula, R.; Sillanpää, M. Capture of Co (II) from Its Aqueous EDTA-Chelate by DTPA-Modified Silica Gel and Chitosan. J. Hazard. Mater. 2011, 187, 122–132. [Google Scholar] [CrossRef]
  32. Kyzas, G.Z.; Siafaka, P.I.; Pavlidou, E.G.; Chrissafis, K.J.; Bikiaris, D.N. Synthesis and Adsorption Application of Succinyl-Grafted Chitosan for the Simultaneous Removal of Zinc and Cationic Dye from Binary Hazardous Mixtures. Chem. Eng. J. 2015, 259, 438–448. [Google Scholar] [CrossRef]
  33. Esmaeili, A.; Beirami, P.; Ghasemi, S. Evaluation of the Marine Algae Gracilaria and Its Activated Carbon for the Adsorption of Ni (II) from Wastewater. E-J. Chem. 2011, 8, 1512–1521. [Google Scholar] [CrossRef] [Green Version]
  34. Ahmad, A.; Bhat, A.H.; Buang, A. Biosorption of Transition Metals by Freely Suspended and Ca-Alginate Immobilised with Chlorella Vulgaris: Kinetic and Equilibrium Modeling. J. Clean. Prod. 2018, 171, 1361–1375. [Google Scholar] [CrossRef]
  35. El-Naggar, N.E.-A.; Rabei, N.H. Bioprocessing Optimization for Efficient Simultaneous Removal of Methylene Blue and Nickel by Gracilaria Seaweed Biomass. Sci. Rep. 2020, 10, 17439. [Google Scholar] [CrossRef] [PubMed]
  36. El-Naggar, N.E.-A.A.; Hamouda, R.A. Antimicrobial Potentialities of Streptomyces Lienomycini NEAE-31 against Human Pathogen Multidrug-Resistant Pseudomonas Aeruginosa. Int. J. Pharmacol. 2016, 12, 769–788. [Google Scholar]
  37. El-Naggar, N.E.-A.; El-Shweihy, N.M.; El-Ewasy, S.M. Identification and Statistical Optimization of Fermentation Conditions for a Newly Isolated Extracellular Cholesterol Oxidase-Producing Streptomyces Cavourensis Strain NEAE-42. BMC Microbiol. 2016, 16, 217. [Google Scholar] [CrossRef] [Green Version]
  38. El-Naggar, N.E.-A.; Hussein, M.H.; Shaaban-Dessuuki, S.A.; Dalal, S.R. Production, Extraction and Characterization of Chlorella Vulgaris Soluble Polysaccharides and Their Applications in AgNPs Biosynthesis and Biostimulation of Plant Growth. Sci. Rep. 2020, 10, 3011. [Google Scholar] [CrossRef] [Green Version]
  39. Sun, L.-X.; Reddy, A.M.; Matsuda, N.; Takatsu, A.; Kato, K.; Okada, T. Simultaneous Determination of Methylene Blue and New Methylene Blue by Slab Optical Waveguide Spectroscopy and Artificial Neural Networks. Anal. Chim. Acta 2003, 487, 109–116. [Google Scholar] [CrossRef]
  40. Singh, R.; Bhateria, R. Optimization and Experimental Design of the Pb2+ Adsorption Process on a Nano-Fe3O4-Based Adsorbent Using the Response Surface Methodology. ACS Omega 2020, 5, 28305–28318. [Google Scholar] [CrossRef]
  41. Ekpenyong, M.; Antai, S.; Asitok, A.; Ekpo, B. Response Surface Modeling and Optimization of Major Medium Variables for Glycolipopeptide Production. Biocatal. Agric. Biotechnol. 2017, 10, 113–121. [Google Scholar] [CrossRef]
  42. Aliyu, A. Synthesis, Electron Microscopy Properties and Adsorption Studies of Zinc (II) Ions (Zn2+) onto as-Prepared Carbon Nanotubes (CNTs) Using Box-Behnken Design (BBD). Sci. Afr. 2019, 3, e00069. [Google Scholar] [CrossRef]
  43. Rai, P.; Pandey, A.; Pandey, A. Optimization of Sugar Release from Banana Peel Powder Waste (BPPW) Using Box-Behnken Design (BBD): BPPW to Biohydrogen Conversion. Int. J. Hydrog. Energy 2019, 44, 25505–25513. [Google Scholar] [CrossRef]
  44. Sharma, S.; Malik, A.; Satya, S. Application of Response Surface Methodology (RSM) for Optimization of Nutrient Supplementation for Cr (VI) Removal by Aspergillus Lentulus AML05. J. Hazard. Mater. 2009, 164, 1198–1204. [Google Scholar] [CrossRef] [PubMed]
  45. El-Naggar, N.E.-A.; Haroun, S.A.; Oweis, E.A.; Sherief, A.A. Identification of Newly Isolated Talaromyces Pinophilus and Statistical Optimization of β-Glucosidase Production under Solid-State Fermentation. Prep. Biochem. Biotechnol. 2015, 45, 712–729. [Google Scholar] [CrossRef] [PubMed]
  46. El-Naggar, N.E.-A.; El-Bindary, A.A.; Nour, N.S. Statistical Optimization of Process Variables for Antimicrobial Metabolites Production by Streptomyces Anulatus NEAE-94 against Some Multidrug-Resistant Strains. Int. J. Pharmacol. 2013, 9, 322–334. [Google Scholar] [CrossRef]
  47. Pahlavanzadeh, H.; Keshtkar, A.R.; Safdari, J.; Abadi, Z. Biosorption of Nickel (II) from Aqueous Solution by Brown Algae: Equilibrium, Dynamic and Thermodynamic Studies. J. Hazard. Mater. 2010, 175, 304–310. [Google Scholar] [CrossRef]
  48. El Maghraby, D.M. Evaluation of Non-Viable Biomass of Laurencia Papillosa for Decolorization of Dye Waste Water. Afr. J. Biotechnol. 2013, 12, 2215–2223. [Google Scholar]
  49. Singh, B.; Bauddh, K.; Bux, F. Algae and Environmental Sustainability; Springer: Ranchi, India, 2015; Volume 7. [Google Scholar]
  50. Vijayaraghavan, J.; Pushpa, T.B.; Basha, S.S.; Jegan, J. Isotherm, kinetics and mechanistic studies of methylene blue biosorption onto red seaweed Gracilaria corticata. Desalination Water Treat. 2016, 57, 13540–13548. [Google Scholar] [CrossRef]
  51. Phugare, S.S.; Kalyani, D.C.; Surwase, S.N.; Jadhav, J.P. Ecofriendly Degradation, Decolorization and Detoxification of Textile Effluent by a Developed Bacterial Consortium. Ecotoxicol. Environ. Saf. 2011, 74, 1288–1296. [Google Scholar] [CrossRef]
  52. El Hassouni, H.; Abdellaoui, D.; El Hani, S.; Bengueddour, R. Biosorption of Cadmium (II) and Copper (II) from Aqueous Solution Using Red Alga (Osmundea Pinnatifida) Biomass. J. Mater. Environ. Sci. 2014, 5, 967–974. [Google Scholar]
  53. Derringer, G.; Suich, R. Simultaneous Optimization of Several Response Variables. J. Qual. Technol. 1980, 12, 214–219. [Google Scholar] [CrossRef]
  54. Kleinübing, S.J.; Vieira, R.S.; Beppu, M.M.; Guibal, E.; da Silva, M.G.C. Characterization and Evaluation of Copper and Nickel Biosorption on Acidic Algae Sargassum Filipendula. Mater. Res. 2010, 13, 541–550. [Google Scholar] [CrossRef] [Green Version]
  55. Mashkoor, F.; Nasar, A.; Asiri, A.M. Exploring the Reusability of Synthetically Contaminated Wastewater Containing Crystal Violet Dye Using Tectona Grandis Sawdust as a Very Low-Cost Adsorbent. Sci. Rep. 2018, 8, 8314. [Google Scholar] [CrossRef] [PubMed] [Green Version]
  56. Ovchinnikov, O.V.; Evtukhova, A.V.; Kondratenko, T.S.; Smirnov, M.S.; Khokhlov, V.Y.; Erina, O.V. Manifestation of Intermolecular Interactions in FTIR Spectra of Methylene Blue Molecules. Vib. Spectrosc. 2016, 86, 181–189. [Google Scholar] [CrossRef]
  57. Coates, J. Interpretation of Infrared Spectra, a Practical Approach; John Wiley & Sons Ltd.: Chichester, UK, 2000. [Google Scholar]
  58. Suresh, S.; Karthikeyan, S.; Jayamoorthy, K. FTIR and Multivariate Analysis to Study the Effect of Bulk and Nano Copper Oxide on Peanut Plant Leaves. J. Sci. Adv. Mater. Devices 2016, 1, 343–350. [Google Scholar] [CrossRef]
Figure 1. Fitting qualities between the predicted and actual values.
Water 14 03651 g001
Figure 2. (A) Plot of the internally studentized residual with normal probability, (B) plot of the predicted value against the internally studentized residuals of the MB biosorption by the biomass of J. regia shells.
Water 14 03651 g002
Figure 3. 3D surface plots illustrating the impact of four factors on the biosorption of MB by Juglans regia shell biomass (AF).
Water 14 03651 g003aWater 14 03651 g003b
Figure 4. The effect of pH and biosorbent dose on the percentage of MB biosorption onto J. regia shell.
Water 14 03651 g004
Figure 5. MB biosorption is impacted by the initial concentration and contact time.
Water 14 03651 g005
Figure 6. The graph of optimization displays the best-predicted values for the maximum elimination of MB (%) and desirability function.
Water 14 03651 g006
Figure 7. SEM graph of Juglans regia shell biomass: (A) before and (B) after MB biosorption.
Water 14 03651 g007aWater 14 03651 g007b
Figure 8. FTIR analysis of Juglans regia shell biomass: (A) before (raw) and (B) after (MB absorbed) biosorption of MB dye.
Water 14 03651 g008
Table 1. Properties of methylene blue dye.
ParticularsMethylene Blue (MB)
Molecular StructureWater 14 03651 i001
Chemical FormulaC16H18ClN3S
Molecular Weight319.85 (g/mol)
ClassCationic thiazine dye
λ max (nm)664
Colour index nameBasic Blue 9 (BG9)
CAS number61-73-4
Table 2. Chemical composition of Juglans regia shells [22].
ParametersContent (%)
Ashes 1.32 ± 0.06
ExtractiveDichloromethane2.94 ± 0.41
Ethanol2.71 ± 0.08
Water4.56 ± 0.50
α -Cellulose 30.36 ± 0.68
Klason Lignin 34.98 ± 0.14
Hemicelluloses 24.85 ± 0.53
Table 3. The independent parameters ranges and levels used in the RSM model [28].
CodeFactorsRanges and Levels
−α−10+1
ABiosorbent dose (gm)0.511.522.5
BDye concentration (mg/L)1020304050
CDye solution pH45678
DTemperature (°C)1520253035
Table 4. CCD matrix with the actual and predicted responses of biosorption of MB.
RunA
Biosorbent Dose (gm)
B
Initial Dye Conc. (mg/L)
C
Initial pH
D
Temperature (°C)
Dye Removal (%)
ActualPredicted
11.55062595.194.6
222073094.1694.59
31.53063594.9394.46
414052093.5293.76
51.53062597.897.3
61.53062597.2797.3
712053093.794.25
853062594.1793.92
91.53082595.6895.61
1014073092.8893.28
1122053096.0395.41
1224072097.0397.14
131.53061596.1996.56
1412073094.2793.99
1512052095.4894.92
1624052096.3196.03
171.53062597.3297.3
181.53062597.197.3
191.53062596.9297.3
2022072097.0196.41
2114072095.3695.42
2214053093.4393.48
2312072096.3796.51
241.53062597.3997.3
2524053095.9496.46
2622052095.195.37
271.53042594.894.77
282.53062596.6696.8
2924073095.7195.71
301.51062594.2494.64
Table 5. RSM-optimized condition of MB biosorption on Juglans regia shell.
A (gm)B (mg/L)CD (°C)Dye Removal (%)
ActualPredicted
18.2431.716.421.797.7497.3
Table 6. ANOVA for MB biosorption by FCCCD-obtained Juglans regia shell biomass.
SourceDegree of FreedomMean SquareSum of SquaresF-Valuep-Value
Model143.6150.4815.03<0.0001
A112.4112.4151.71
B10.00220.00220.0093
C11.061.064.42
D16.576.5727.38
AB13.343.3413.91
AC10.30930.30931.29
AD10.49730.49732.07
BC10.00420.00420.0177
BD10.15120.15120.6299
CD13.463.4614.41
16.436.4326.79
112.3412.3451.44
17.617.6131.73
15.495.4922.89
Residual150.23993.6
Lack of Fit100.31573.163.570.0863
Pure error50.08840.4421
Total29 54.08
Table 7. Summary of model statistics for FCCCD for adsorption of MB dye.
SourceStd. Dev.Adjusted R²Predicted R²PRESS
Linear1.170.37060.26990.17944.39
2FI1.180.5140.2582−0.004954.34
Quadratic0.48980.93340.87130.651918.82
Cubic0.53030.96360.8492−3.0769220.46
Publisher’s Note: MDPI stays neutral with regard to jurisdictional claims in published maps and institutional affiliations.

