
Lake Changes during the Past Five Decades in Central East Asia: Links with Climate Change and Climate Future Forecasting
by
Yongheng Yang
1,2,*,
Jie Wu
2,3,
Yunfa Miao
1,*,
Xuelian Wang
1,
Xiaoyu Lan
4 and
Ziyue Zhang
1,2 1
Northwest Institute of Eco-Environment and Resources, Chinese Academy of Sciences, Lanzhou 730000, China
2
University of Chinese Academy of Sciences, Beijing 100049, China
3
State Key Laboratory of Loess and Quaternary Geology, Institute of Earth Environment, Chinese Academy of Sciences, Xi’an 710061, China
4
College of Geography and Environmental Science, Northwest Normal University, Lanzhou 730071, China
*
Authors to whom correspondence should be addressed.
Water 2022, 14(22), 3661; https://doi.org/10.3390/w14223661
Submission received: 13 September 2022
/
Revised: 6 November 2022
/
Accepted: 10 November 2022
/
Published: 13 November 2022
(This article belongs to the Section Hydrology)
Abstract
:As one of the most important reservoirs of water in arid regions, lakes experience a series of complicated changes. However, the natural driving mechanisms behind such changes remain unclear. In this study, we collected data from 1333 lakes in the arid region of Central East Asia (CEA) to investigate the underlying natural causes of lake changes over the past five decades. The lakes were located within three different geomorphological zones: (I) Tibetan Plateau zone; (II) high mountain—basin zone; and (III) low mountain zone. Our results show that lakes as a whole in CEA exhibit a unique change trend, with an overall lake area increase of 7099 km2 (41%) and with heterogeneous spatial variations over the past five decades. The lake area increase was 6236 km2 (47%), 935 km2 (31%) and decrease was 72 km2 (~1%) in zones I, II, and III, respectively. The different geomorphological zones have influencing factors. In zones I and II, increased precipitation (including cloud water) and temperature rise (causing glacier, frozen soil, and snow melt) contributed to approximately 66% of the change in lake area; in zone III, changes in precipitation contributed to approximately 87% of the lake changes. Increased atmospheric circulation of water vapor caused by warming of the ocean surface appears to be the main driving factor of these changes; this is supported by future projection scenarios. From 2006 to 2098, temperature and precipitation will increase by 4.0–7.8 °C and 1.07 to 1.29 mm per day, respectively, under both the RCP4.5 and RCP8.5 scenarios. Notably, although the climate appears to have become more optimum for lakes in CEA at the interdecadal timescale, short timescale climatic events such as lake expansion will bring more extreme climate events, such as extreme high-temperature heat waves, which should be considered as a potential threat to lake ecology in the future.
1. Introduction
The ecosystem of an arid region is very fragile owing to infertile soil and sparse vegetation cover [1,2]. Over the past few decades, under a global temperature increase of approximately 1 °C [3], arid regions have expanded by 1.16% globally; however, dryland in Central East Asia (CEA) has shrunk [4]. Similarly, two-thirds of global endorheic water loss stems from central Eurasia [5], but lakes have expanded markedly on the Tibetan Plateau and in Xinjiang [6,7]. Previous studies have largely focused on the global scale, ignoring the specificity of local regions; hence, the specific changes that have occurred within CEA have not been well represented.
Central East Asia is inherently endorheic, with surface flow unable to break through topographic barriers; hence, water is retained in landlocked storage, whose levels change depending on regional water sources and expenditure. Climate change strongly controls this balance by affecting precipitation, evaporation, and other key parameters [5]. As a unique underlying surface, variations in lake area can reflect climate change. Prior lake studies in arid regions mainly separated out research areas according to administrative boundaries [8], which ignores differences related to different geomorphological terrains. For example, the amount of annual precipitation in the mountainous regions of southern Gansu Province can exceed 1500 mm, but annual precipitation is <100 mm in the western desert region. Such large regional differences make it difficult to uniformly attribute the drivers of lake change.
Human settlements of CEA were mainly distributed near oasis lakes, and future lake expansion/shrinkage would strongly affect agricultural and economic development in arid areas [9]. The future expansion of lakes may make heatwaves more intense and longer in duration [10]. Observation and climatic modelling show climate change-induced increases in extreme high temperature, extreme precipitation floods, and soil erosion events [11,12,13,14,15,16], which will make the ecology in arid areas subject to more severe climate pressure and reduce the carrying capacity of oases. Therefore, it is vital to estimate the future of regional climate in order to effectively assess the lake changes caused by climate change, which is currently insufficient in CEA.
At present, the lakes in CEA suffer from a lack of coherent research, including the inconsistent division of study areas, disregard of the differences in lake changes in different geomorphological terrains, and failure to consider the impacts of future climate projections on lake changes. Therefore, based on a detailed division of the arid region of CEA, we evaluate here the lake changes in CEA over the past 50 years; we also discuss the mechanisms behind the lake changes at regional and global scales. Furthermore, general circulation model (GCM) multi-model ensemble averaging is used to forecast future climate change in CEA under different model scenarios. Finally, we combine reliable geological evidence to effectively assess potential future lake changes in arid regions and discuss the ecological implications of such changes.
2. Study Region, Data, and Method
2.1. Study Region Division and Features
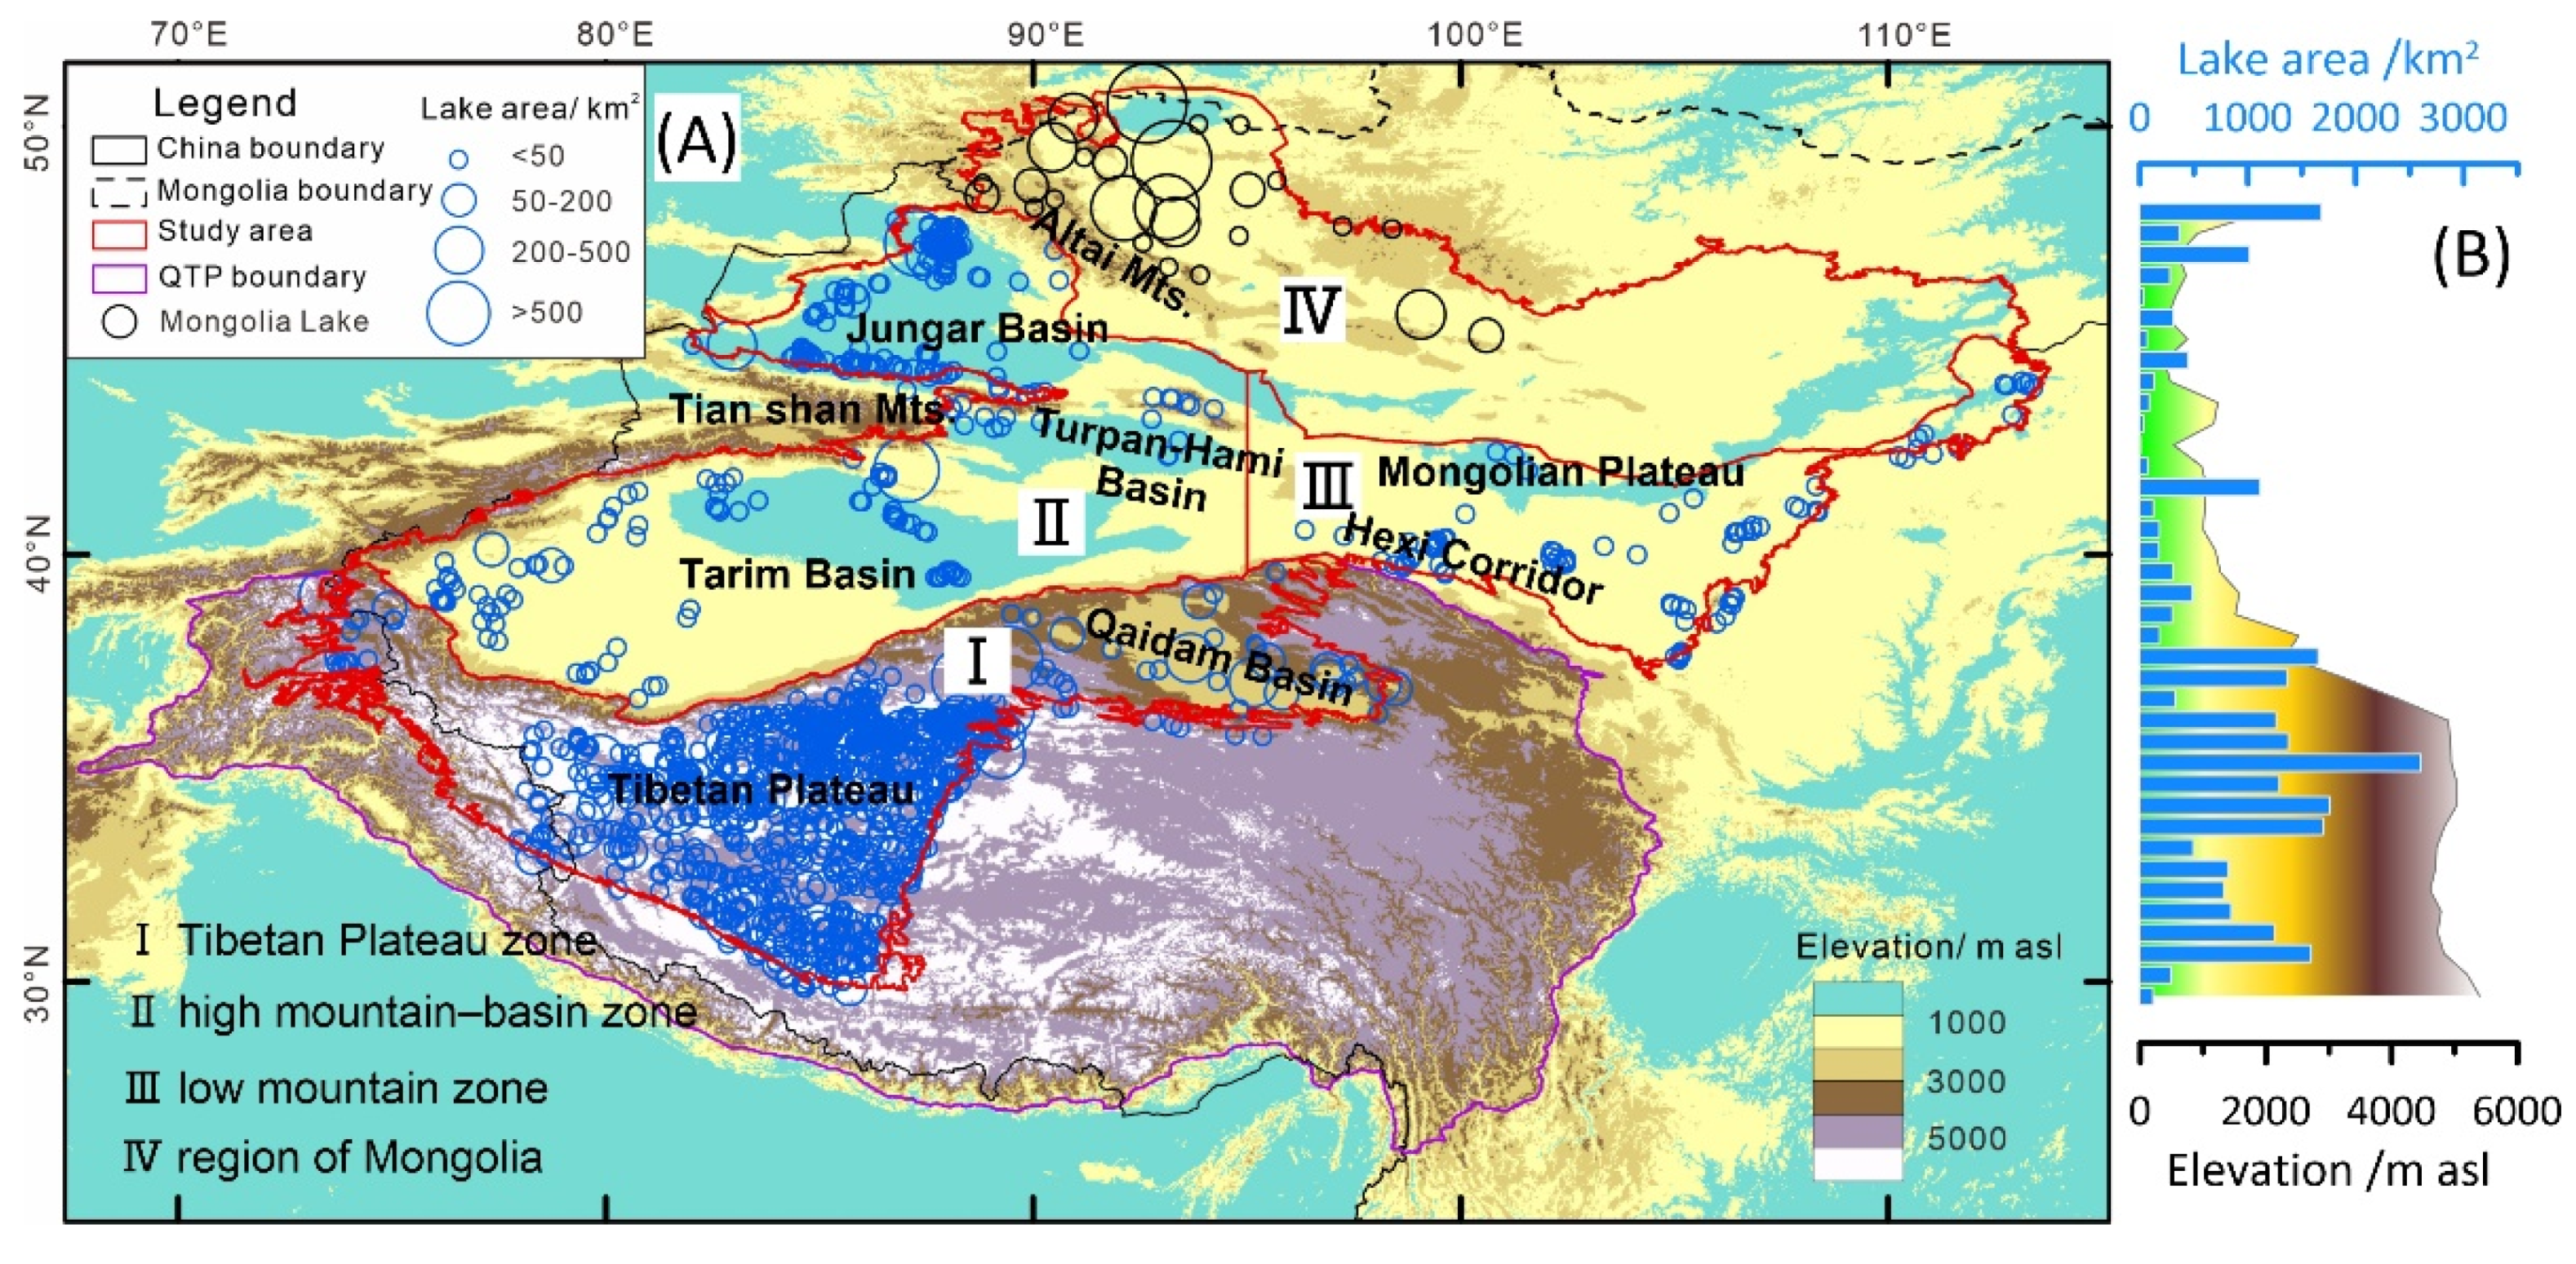
In CEA, the average annual precipitation is <200 mm [17,18]. We utilized WorldClim version 2.1 climate data at 30 s spatial resolution [19], which is a very effective meteorological database for modern climate change research [20]. We stringently restricted the 200 mm precipitation boundary in ArcGIS 10.2 (Figure 1A).
Because the remote sensing data of lakes in Mongolia over the past 50 years are not consistent with other regions in East Asia (i.e., China) in terms of temporal resolution, CEA as defined in this paper does not include Mongolia, and the northern boundary is defined as the Chinese border.
The total area of CEA is 2.68 × 10⁶ km2; it includes the western Mongolian Plateau, northern Loess Plateau, western Tibetan Plateau, Junggar Basin, Tarim Basin, and Turpan—Hami Basin. This area includes the second highest peak in the world (Chogori, 8611 m) and the lowest altitude in East Asia (Lake Aydin, −161 m), with huge changes in terrain. According to differences in geomorphology, we divided the study region into three zones: (I) Tibetan Plateau zone 0.97 × 10⁶ km2, >4500 m, located in the western part of the Tibetan Plateau, mainly FT, tundra climate, BS, semi-arid climate and BW, desert climate; (II) high mountain—basin zone, 1.22 × 10⁶ km2, including the Junggar, Tarim, and Turpan—Hami basins, including Taklimakan desert, Gurbantunggut desert and oasis, mainly FT, tundra climate, and BW, desert climate, BS, semi-arid climate and Dc, temperate continental climate; and (III) low mountain zone 0.49 × 10⁶ km2, ~1800 m, including the Hexi Corridor, western Mongolian Plateau, and northern Loess Plateau, including Badain Jaran Desert, Tengger Desert and oasis, mainly BS, semi-arid climate [21], of which the high mountain—basin and low mountain zones have a boundary at 95° E (Figure 1A).
2.2. Data and Method
2.2.1. Lake Data and Method
Lake data were derived from the National Tibetan Plateau Data Center (http://data.tpdc.ac.cn, accessed on 1 May 2022). Through remote sensing Landsat images, topographic maps, semi-automatic water body extraction, and manual visual inspection [23], eight periods (1970a, 1990a, 1995a, 2000a, 2005a, 2010a, 2015a, 2020a) area lakes (>1 km2) in the past 50 years were effectively obtained [24]. Due to the lack of some lake data in the plateau, we selected the lake datasets of the Tibetan Plateau (1970a, 1990a, 1995a, 2000a, 2005a, 2010a, 2013–2020a) as a data supplement [25,26,27]. Then, we extracted the elevation and area of lakes in different zones in different periods using ArcGIS 10.2.
2.2.2. Meteorological Data and Method
Meteorological station data from 1969 to 2020 were provided by the National Meteorological Information Center, China Meteorological Administration (http://www.nmic.cn/, accessed on 1 May 2022). Owing to the scarcity of meteorological stations, these datapoints cannot adequately reflect spatial changes; hence, spatial interpolation was used to better consider differences in spatial variation. Therefore, we selected the latest Climatic Research Unit gridded Time Series (CRU TS) version 4.05 released by the Centre for Climate Research at the University of East Anglia, which is a 0.5° × 0.5° grid of monthly meteorological data (https://crudata.uea.ac.uk/cru/data/hrg/cru_ts_4.05/, accessed on 1 May 2022), including temperature (TMP), precipitation (PRE), vapor pressure (VAP), cloud cover (CLD), and potential evapotranspiration (PET). The CRU 4.05 dataset has small errors in regions with a high density of observations, such as Europe and China [28].
2.2.3. Climate Model Simulations
Future climate projection changes were obtained using five GCMs from the Coupled Model Intercomparison Project Phase 5 (http://cmip-pcmdi.llnl.gov/cmip5/data_portal.html, accessed on 1 May 2022) [29], which included the HadGEM2-ES, IPSL-CM5A-LR, GFDL-ESM2M, MIROC-ESMCHEM, and NorESM1-M GCMs. Our climate change prediction test was carried out under two different anthropogenic greenhouse gas emission scenarios (representative concentration pathways (RCPs)): RCP4.5 (medium-emission scenario) and RCP8.5 (high-emission scenario) with radiative forcings of 4.5 and 8.5 Wm−2, and atmospheric CO2 concentrations of 650 and >1370 ppm in 2100, respectively [30].
3. Results
3.1. Lake Data Results
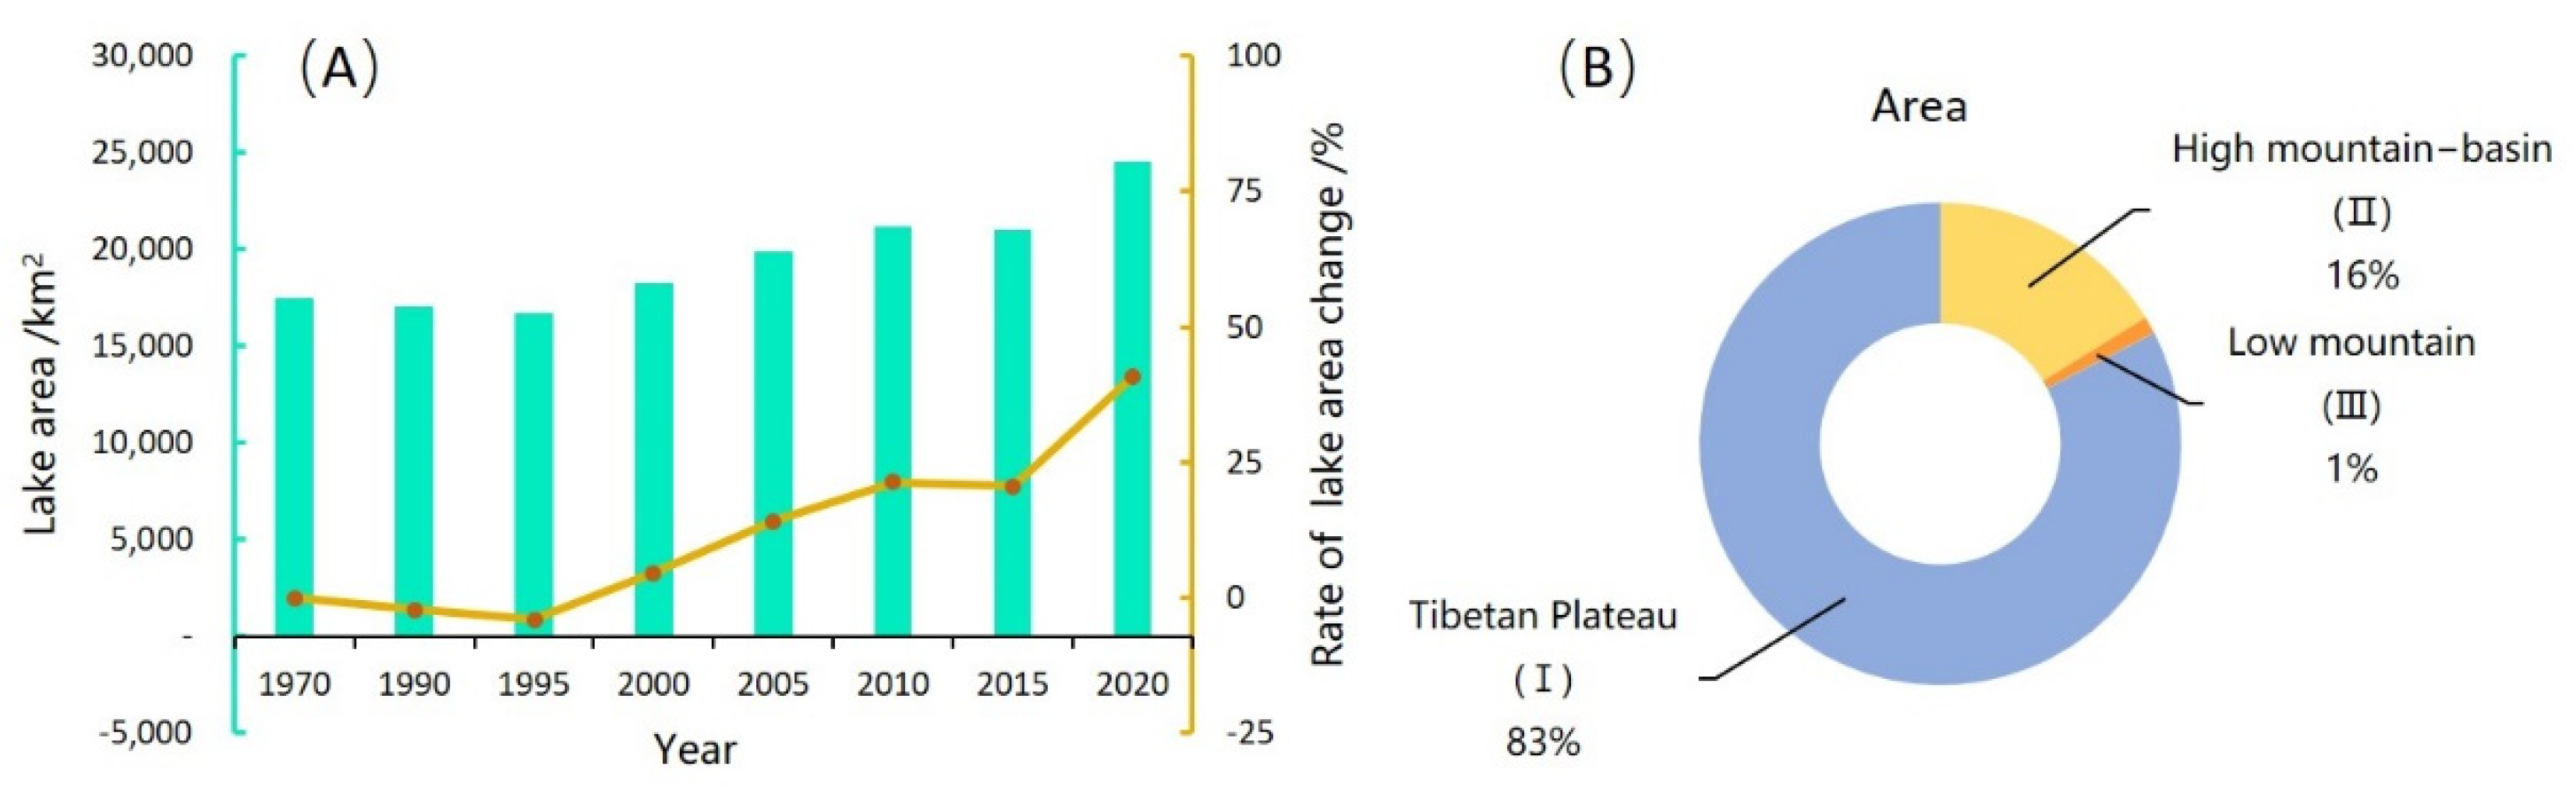
The area of lakes in CEA has changed dramatically over the past 50 years, increasing from 17,442 to 24,541 km2, an increase of 41% (Figure 2A). There are obvious differences in the distribution of lakes in different geomorphological zones of CEA. Lakes in the Tibetan Plateau zone, high mountain—basin zone, and low mountain zone account for 83%, 16%, and 1% of the total lake area, respectively (Figure 2B); similarly, the respective lake areas are 20,910 × 106, 3275 × 106, and 585 × 106 km2. Lakes are mainly located in high-altitude areas (Figure 1B).
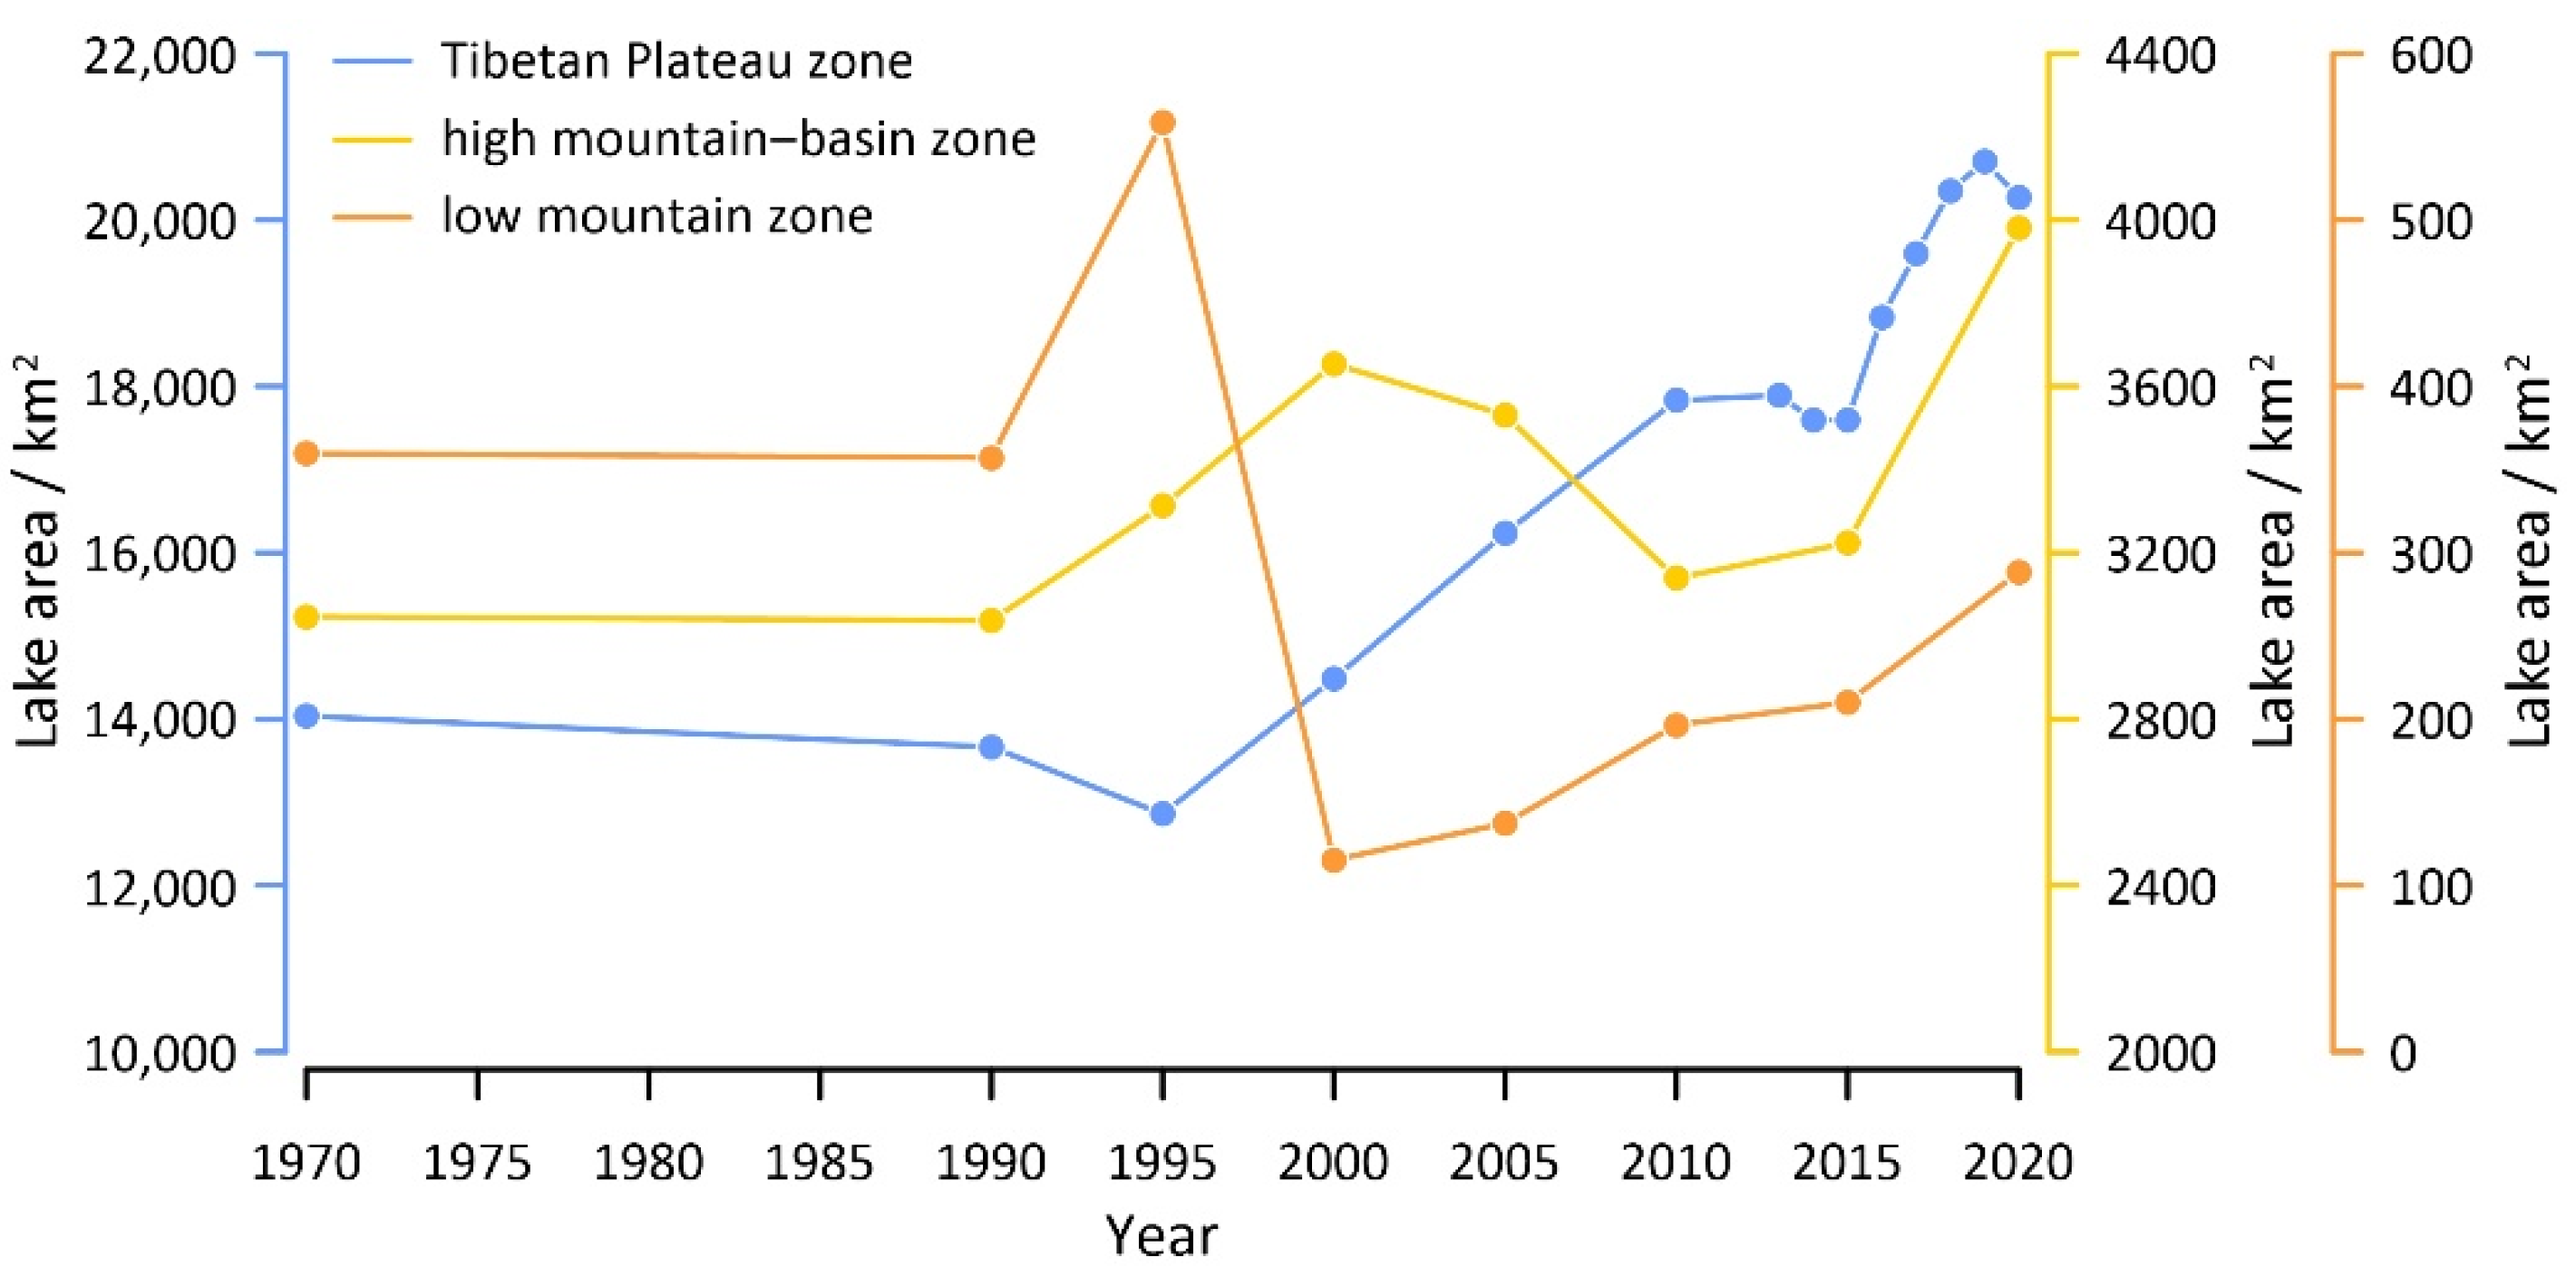
Over the past 50 years, the areas of lakes in the three geomorphological zones of CEA have shown different trends. For the Tibetan Plateau zone, the area of lakes has increased from 14,036 km2 in 1970 to 20,272 km2 in 2020, an increase of 47% (Figure 3), and the area of lakes in the arid region of the plateau has increased as a proportion of the overall Tibetan Plateau (Figure S1 (Supplementary Materials)). In the high mountain—basin zone, after an increasing trend from 1970 to 2000, the area of lakes decreased from 2000 to 2015, and then increased steadily. Overall, the lake area has increased by 31% over the past 50 years (Figure 3). In contrast to the Tibetan Plateau and high mountain—basin zones, the area of lakes in the low mountain zone decreased from 1970 to 1990, then increased rapidly, reaching the highest value of the last 50 years in 1995. Subsequently, the lowest value of the last 50 years was seen in 2000 (compared with 1995, the area decreased by nearly 80%), and lake area has increased steadily post-2000; however, in 2020 the lake area was still only half that seen in 1995. Note that owing to lack of continuously recorded data, these described turning points of change may have occurred between two identifiable chronologies (Figure 3).
Over the past 50 years, the area of lakes in CEA has shown a steady growth trend. The variation trend of arid region-plateau and non-arid region-plateau is the same. However, the change in lakes in non-arid region-east, which is closer to the water vapor source area, is completely different to that in the arid region (Figure S2), indicating the particularity of lake evolution in the arid region of CEA, which is different to that in the humid region.
3.2. Meteorological Data Results
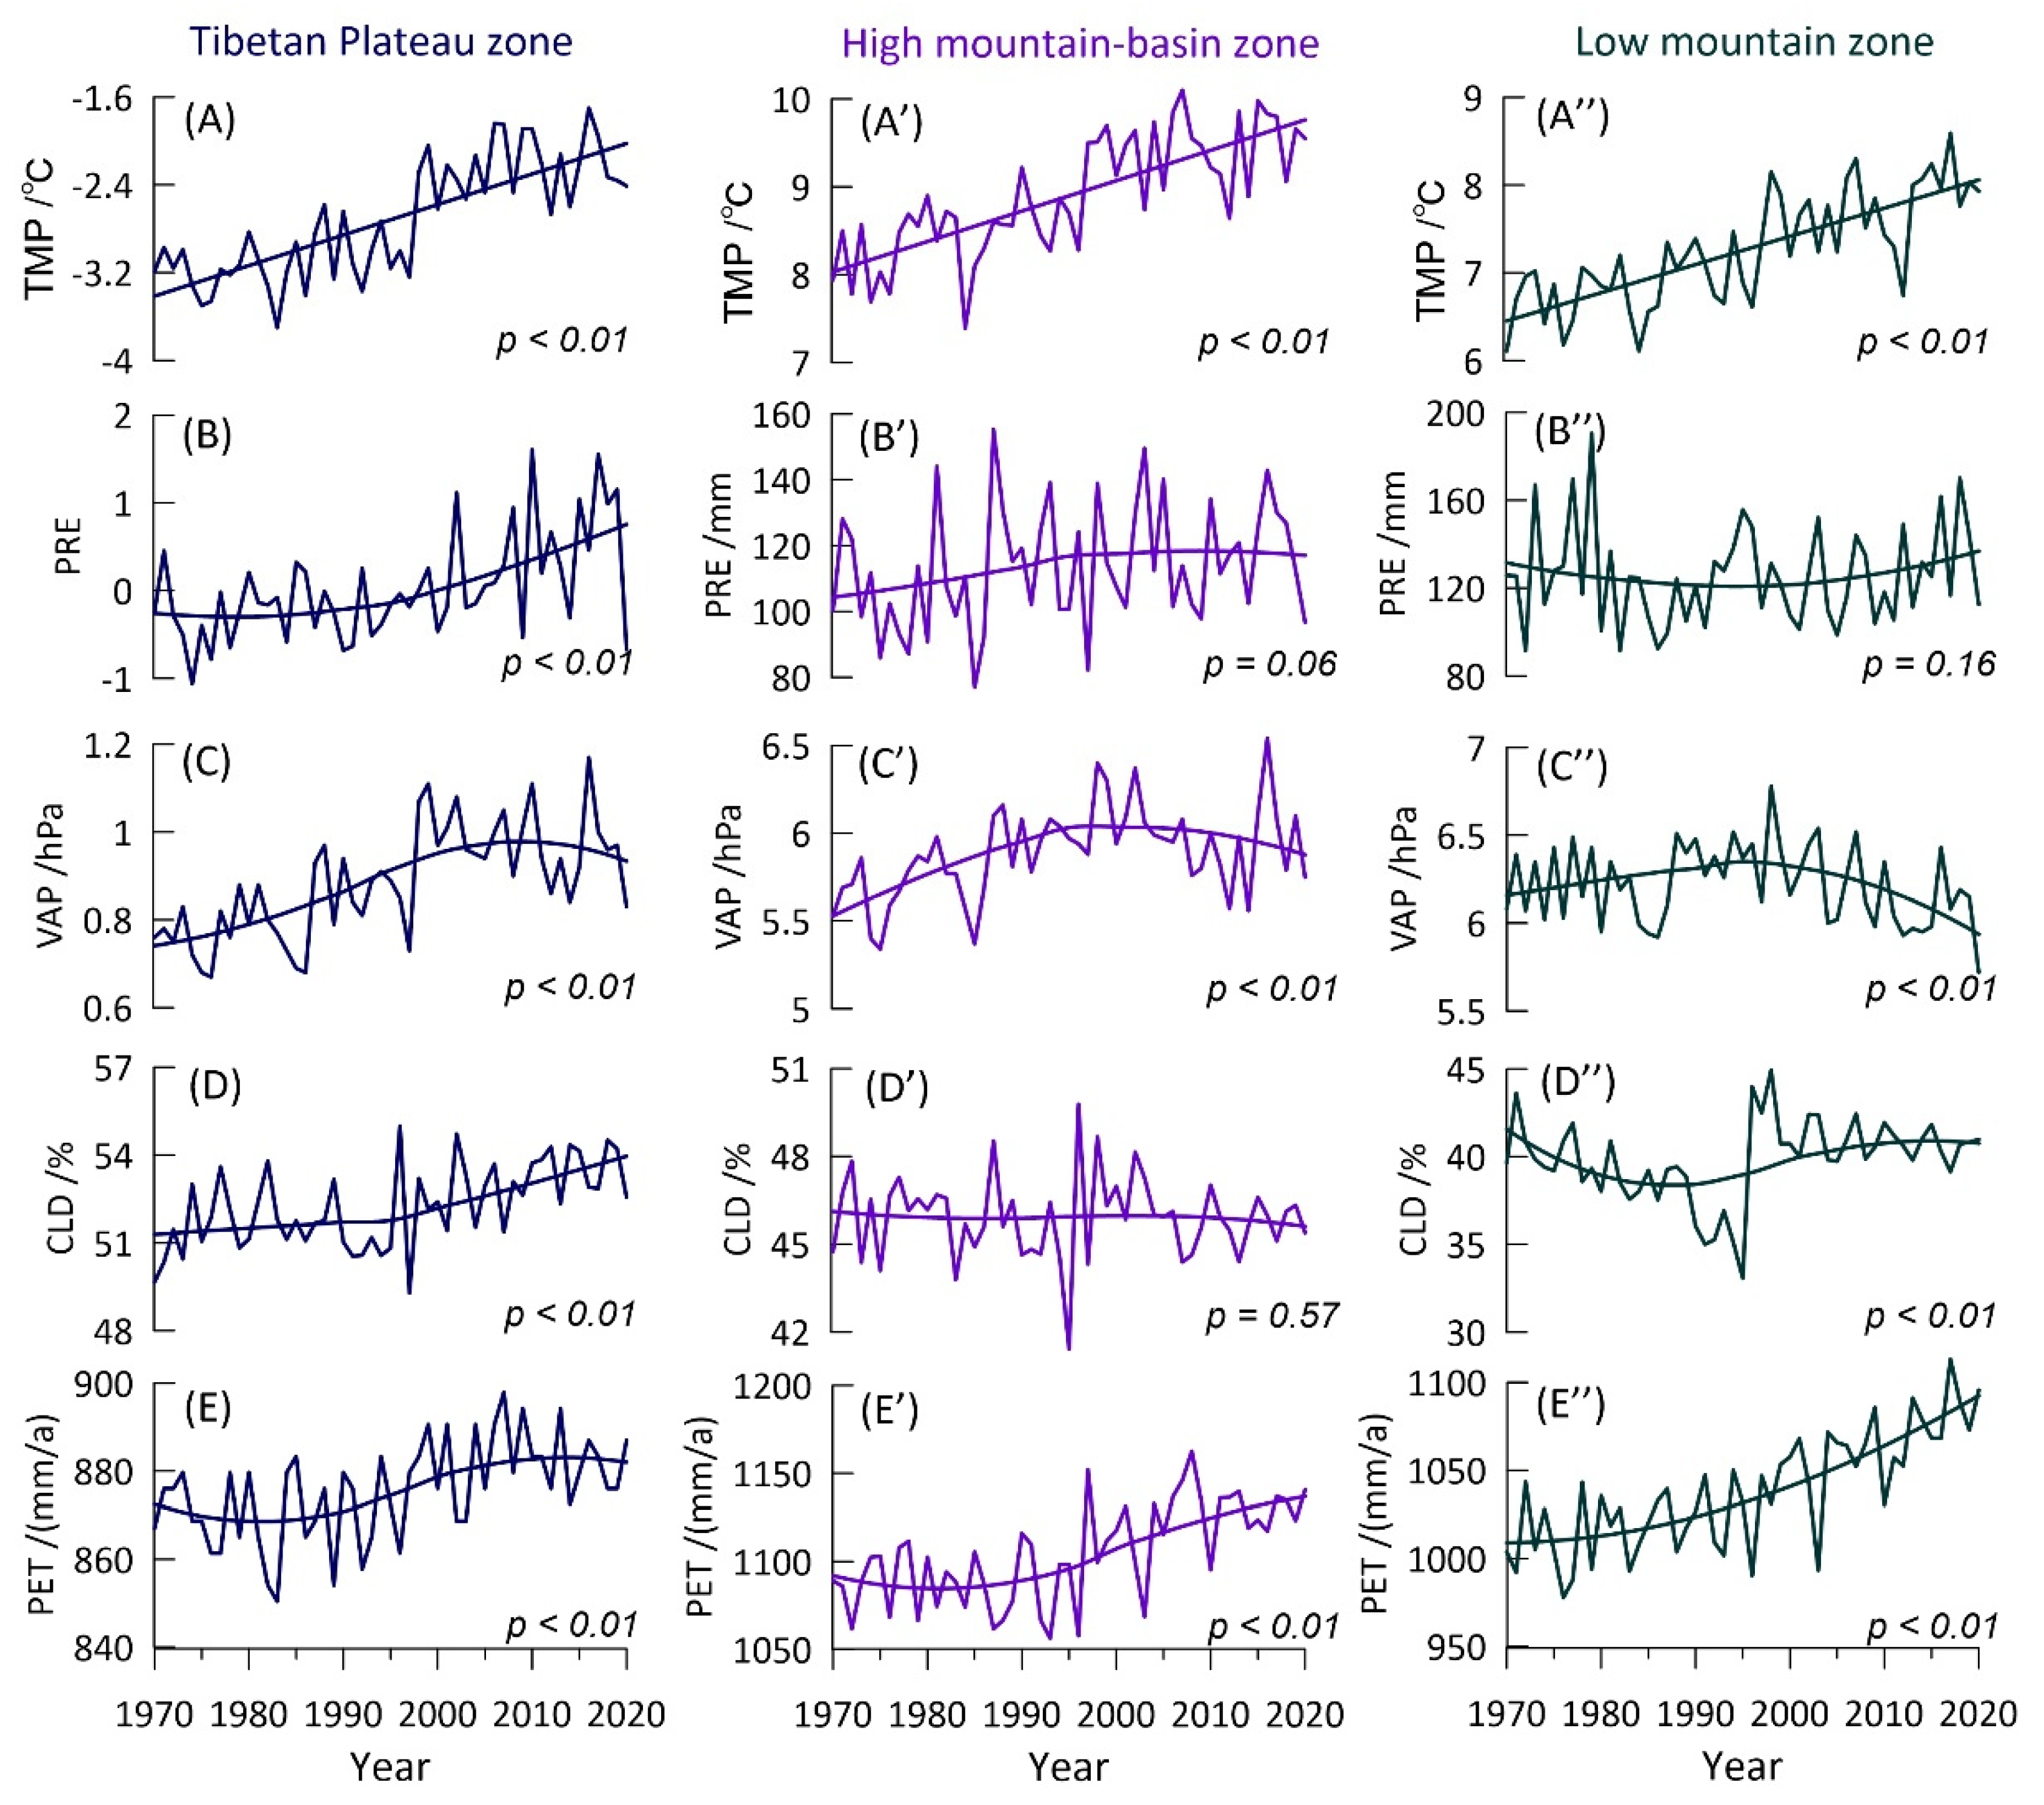
Over the past 50 years, there has been a continuous warming trend in CEA (Figure 4A,A’,A’’), and the degree of warming has been enhanced with increasing elevation [8]. The warming rate in some parts of the plateau regions has been as high as 0.6 °C 10a (Figure S3). Such warming has caused the melting of glaciers/permafrost and a reduction in snow cover [31]. Therefore, TMP is a good proxy for meltwater from glaciers, snow, and permafrost [32].
Precipitation can directly affect changes in the water volume of rivers and lakes [23,33,34]. Precipitation is often regarded as the most uncertain meteorological variable owing to its high spatiotemporal variance, which may hinder its model forcing value in regions with sparse measurements and/or complex terrain [35,36,37]. Therefore, we took the precipitation at meteorological stations (PREMS) normalized mean as the reference value of the variation trend of regional precipitation. A comparison between PREMS and PRECRU (precipitation in CRU) showed that PRECRU can better reflect precipitation changes in the high mountain—basin and low mountain zones (Figure 4B’,B’’, Figures S4 and S5A,B). However, in the Tibetan Plateau zone, PRECRU is higher than 200 mm, which deviates markedly from the meteorological station records (Figure S3). PRECRU is thus inappropriate for use in the Tibetan Plateau zone [23]. Therefore, PREMS were used for the plateau zone, and PRECRU was used for regional precipitation in the high mountain—basin and low mountain zones. Overall, precipitation showed an increasing trend in the Tibetan Plateau zone. In the high mountain—basin zone, precipitation increased from 1970 to 1995, and then tended to be stable, but the overall fluctuation was large. In the low mountain zone, precipitation decreased from 1970 to 2000, and then gradually increased (Figure 4B,B’,B’’).
An abundance of water vapor is the necessary condition for the formation of hydrometeors and precipitation; following the Clausius–Clapeyron scale, a warmer environment is more favorable for water vapor storage [38]. Thus, we used VAP to represent the ability of the atmosphere to store water. With an increase in VAP, the atmospheric water content increases. VAP was only used as an auxiliary reference factor. VAP in all three zones showed a gentle increase from 1970 to 2000, and a decreasing trend from 2000 to 2020 (Figure 4C,C’,C’’).
The variation in cloud cover indicates the amount of water vapor input to the region. In response to global warming, the cloud water resource has rapidly increased in some water-stressed regions [39]. As shown in Figure 4, CLD showed different trends in the three different zones. The CLD has increased steadily in the Tibetan Plateau zone over the past 50 years, showing an overall increase of ~3%, but this increase accelerated from 2000 to 2020 (Figure 4D). The CLD trend in the high mountain—basin zone was stable overall, but there was a clear fluctuation range (Figure 4D’). In the low mountain zone, CLD decreased continuously from 1970 to 1995, then increased rapidly (by ~11%), before stabilizing (Figure 4D’’).
Evaporation is a key element of the hydrological cycle and energy balance [8]. Changes in PET in arid regions can record changes in lake water expenditure. In the Tibetan Plateau zone between 1970 and 2000, PET first decreased, then increased; post-2000 it tended to be stable (Figure 4E). In the high mountain—basin and low mountain zones, PET has shown a synchronous and continuous increasing trend (Figure 4E’,E’’).
3.3. Climate Model Results
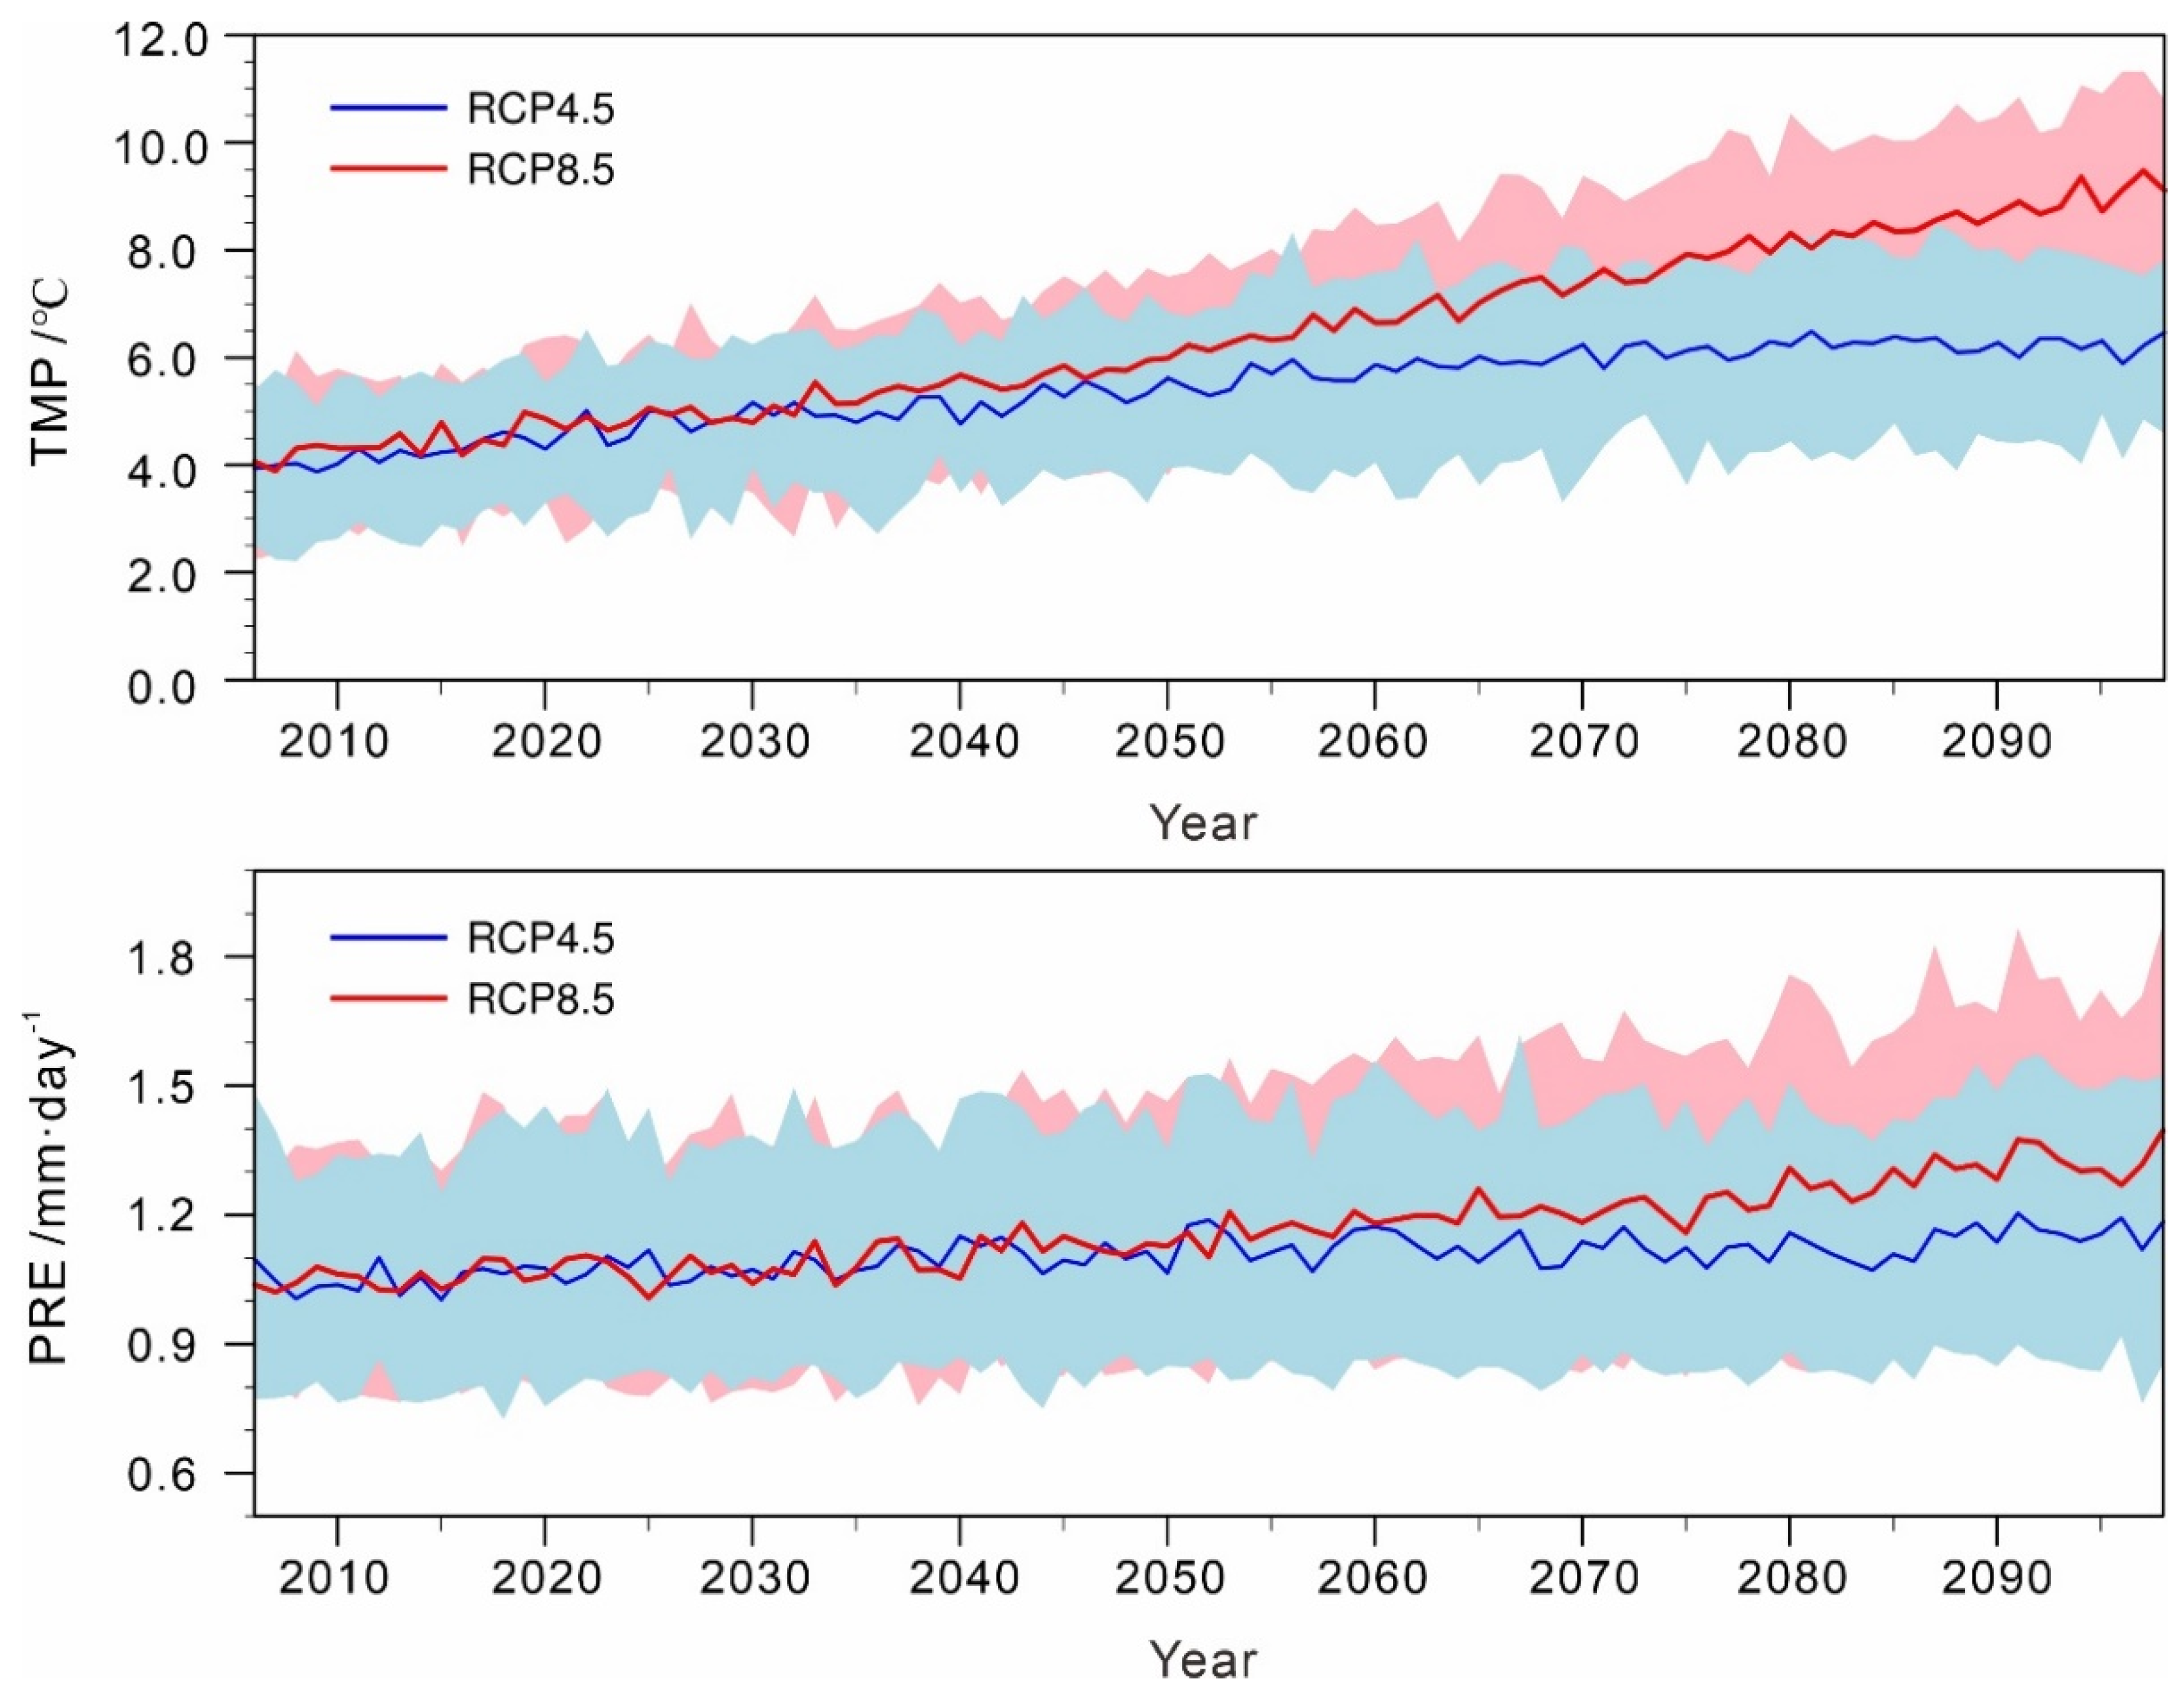
Figure 5 shows the evolution of TMP and PRE in two scenarios (RCP 4.5 and RCP 8.5) during the period from 2006 to 2098 in the CEA arid region. A significant increasing trend in TMP can be observed under both the RCP4.5 and RCP8.5 scenarios, in which warming could reach approximately 4.0–7.8 °C. More drastic warming occurred under RCP8.5 (0.58 °C per decade; R = 0.99, p < 0.01)) compared with RCP4.5 (0.27 °C per decade; R = 0.61, p < 0.01). In addition, there is little difference in temperature increase between the two scenarios before 2045, after which the temperature under RCP8.5 increases significantly faster than that under RCP4.5. Similarly, both scenarios lead to an increase in PRE, with increases of 1.07 to 1.29 mm per day from 2006 to 2098; the PRE increases at a rate of at least 0.01 mm per decade (R = 0.68, p < 0.01) under RCP4.5, and 0.03 mm per decade (R = 0.93, p < 0.01) under RCP8.5. Precipitation increases at the same amplitude under both scenarios before 2060, after which it increases slightly faster under RCP8.5 compared with RCP4.5.
4. Discussion
4.1. Regional Climate Change
The lake changes in different topographic zones have different driving mechanisms. We investigated the climatic drivers behind changes in lake area in different topographic zones over the past 50 years.
We used different meteorological variables as independent factors to explore their influence on lake area change. Pearson correlation was used to analyze the correlations between meteorological variables and lake area change. To better predict the relative im-portance of different factors on lake area change, we used the ‘relative importance indices’ proposed by Johnson and LeBreton [40] to mathematically evaluate the meteorological factors controlling lake area change. Relative importance refers to the quantification of the contribution of an individual regressor to a multiple regression model, which weights averages with data-dependent weights, we used the method proposed by Groemping [41] named ‘pmvd’ in the R package ‘relaimpo’.
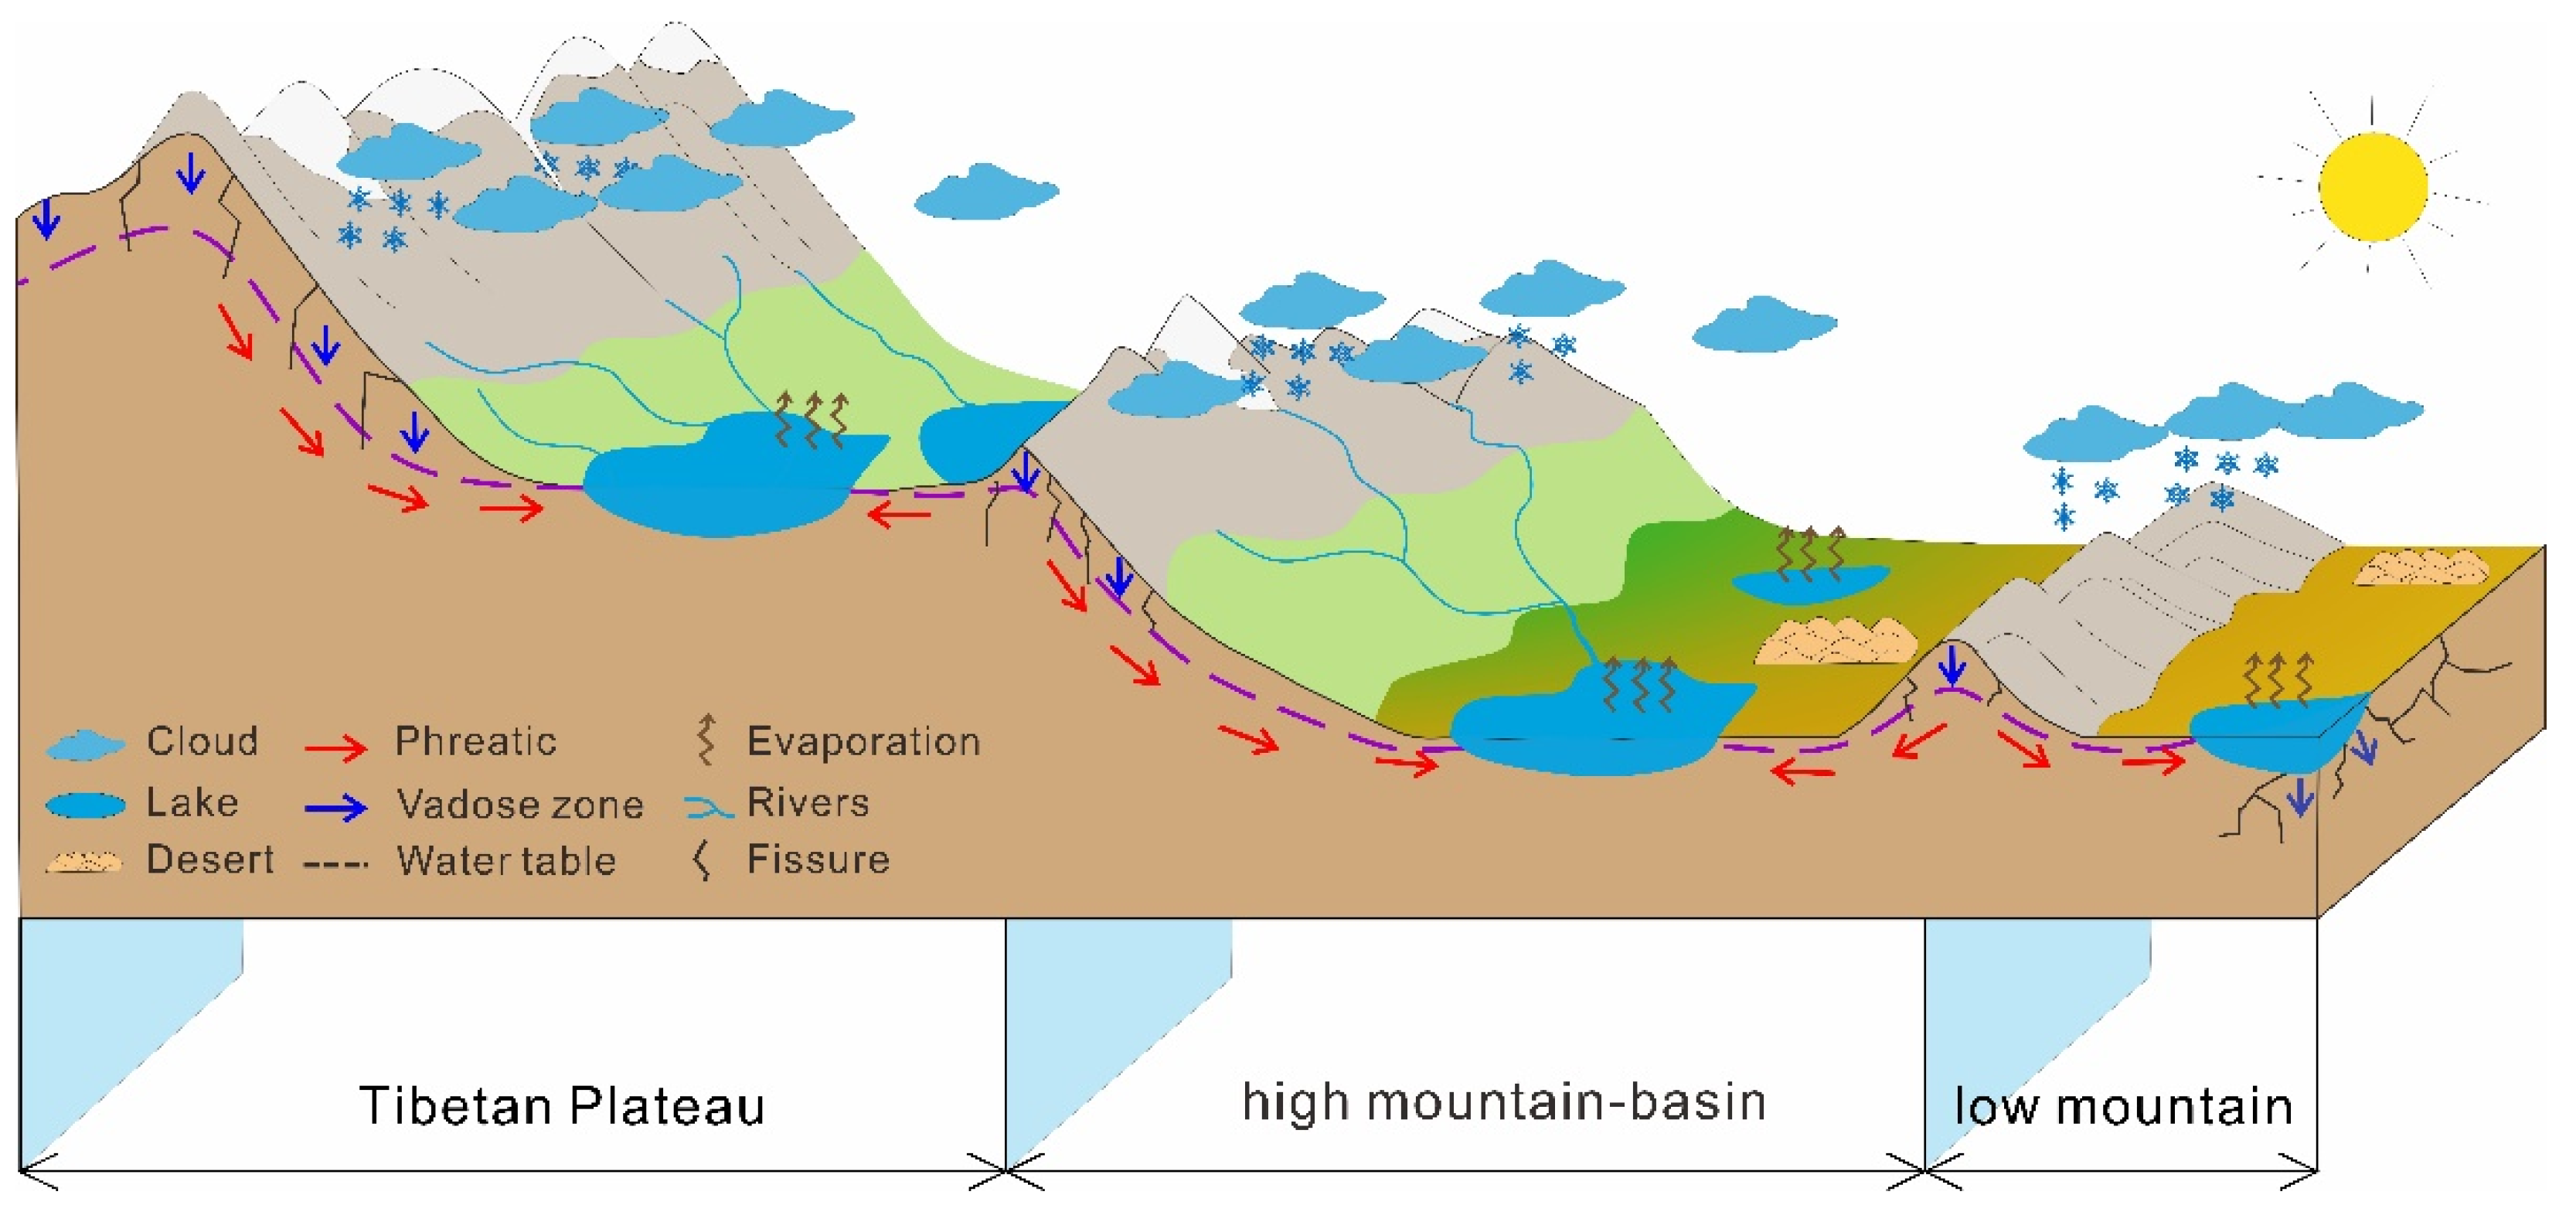
In the Tibetan Plateau zone, TMP, CLD, and PRE are strongly correlated with changes in the lake area. Glacial water, snow melt water, and water released by the melting of permafrost caused by temperature changes on the plateau, mountain precipitation changes caused by cloud cover changes, and direct precipitation on the lake surface are the meteorological factors that mainly affect changes in lake area. These main meteorological factors explained 66% and ~80% of the variation in lake area in the current year and the previous year, respectively (Table S1). Cloud water is an important water resource often neglected in previous studies of lake variation. Compared with basins and low-elevation regions, when clouds (including overcast, cloudy, and even isolated clouds) are in contact with mountains in plateau and alpine regions, the terrain effect will more easily form precipitation that is not captured by meteorological instruments. At the same time, the lower specific heat capacity of mountains at night induces atmospheric water vapor to condense on mountain surfaces, entering the mountain ecosystem to replenish groundwater. Moreover, the extensive active faulting, pores, fissures, and caves in the mountainous terrain of the Tibetan Plateau zone provide sufficient channels for meltwater, cloud water, and precipitation to penetrate the mountain to recharge groundwater [42]; the groundwater circulation depth in mountains can reach several kilometers [43,44]. Hence, mountains can collect and store more water. Groundwater flow in the Tibetan Plateau is driven and sustained by the topographic gradient and recharge at high elevations [44], and the Tibetan Plateau zone has a large relative relief fluctuation, large hydraulic gradient of groundwater, and has volcanic classics, shallow marine carbonates, and sedimentary clastic rock which are favorable aquifer lithologies [44,45]. The rock and stratum in mountains have high water permeability, and lakes can be replenished by groundwater more rapidly. The groundwater in the outflow water in the mountain accounts for 75–80% of the total flow [43], groundwater inflow is estimated to be about 59–66% of total inflow into lakes in the Tibetan Plateau [45,46], and higher mountains and more sloping basins result in a higher proportion of groundwater in outflow runoff. Groundwater in this terrain is the main storage form of the water resource of the plateau, and this groundwater is the main recharge method for lakes in the Tibetan Plateau zone (Figure 6). Abundant precipitation (including cloud water resources) recharges the groundwater, causing the water level to rise, which in turn causes changes in the regional water balance.
In the high mountain—basin zone, climate change factors explained 65% of the change in lake area, mainly due to reduced evaporation in the current year which slowed the expenditure on lake water (Table S1). However, the change in evaporation does not make a lake larger. The lakes in the high mountain—basin zone are all alluvial terminal lakes sited in the Kunlun, Tianshan, and Altai mountain ranges surrounding the Tarim, Turpan—Hami, and Junggar basins. The influence of high mountains is predominant, supplying lakes with a source of water in the high mountain—basin zone, similar to that in the Tibetan Plateau zone [6]. An increase in meltwater, cloud water, and direct precipitation in the alpine area recharged the lakes through groundwater and surface runoff, resulting in a gradual expansion of lake area (Figure 6). A strong correlation between TMP and lake area in the previous year also supports the above explanation (Table S1). These alluvial terminal lakes are surrounded by oases for human life, and human activities cause changes in the lakes [32]. However, in recent decades, ecological restoration and management, together with an increase in mountain water storage owing to climatic reasons, have led to a steady increase in the area of these lakes, which are good sources of water for agriculture in arid areas.
In the low mountain zone, lakes are mainly distributed in the western part of the Hexi Corridor and in the Badain Jaran, Tengger, and Ulan Buhe deserts. Except for the Hexi Corridor, most of the areas containing lakes lack large mountains to induce large-scale groundwater circulation (Figure 6) [47]. Therefore, we infer that only the climate variables of the current year directly affect changes in lake area, and these climate change factors explain 95% of the lake area change. Among the climatic factors in the current year, PRE was significantly positively correlated with lake variation (0.886, p < 0.01), and explained 56.8% of the variation in lake area, while CLD was negatively correlated (−0.829, p < 0.05) and explained ~30%. Other climate variables had a very low impact (Table S1). In contrast to the Tibetan Plateau and high mountain—basin zones, the correlation between PRE and CLD changes in the low mountain zone was not significant (Table S1), and CLD changes did not significantly increase low mountain PRE. Although CLD has decreased, effective PRE has increased, and PRE directly affects lake water volume changes and regional groundwater level changes [48,49]. The area of lakes in the low mountain zone dropped by 80% from 1995 to 2000 (Figure 3), and the PRE also decreased by ~30% (Figure 4B’’), but there was no significant change in the amount of river water entering the lakes [50], indicating that the change in PRE was the dominant cause of the change in lake area. Hence, changes in the lake area in the low mountain zone are extremely sensitive to climate.
4.2. Global Climate Change
Lakes in the Tibetan Plateau zone have the lowest degree of direct anthropogenic interference and can directly feedback the impact of global climate change [27]. Below, we discuss the changes in lake area in the Tibetan Plateau zone from a global perspective using our high temporal resolution data.
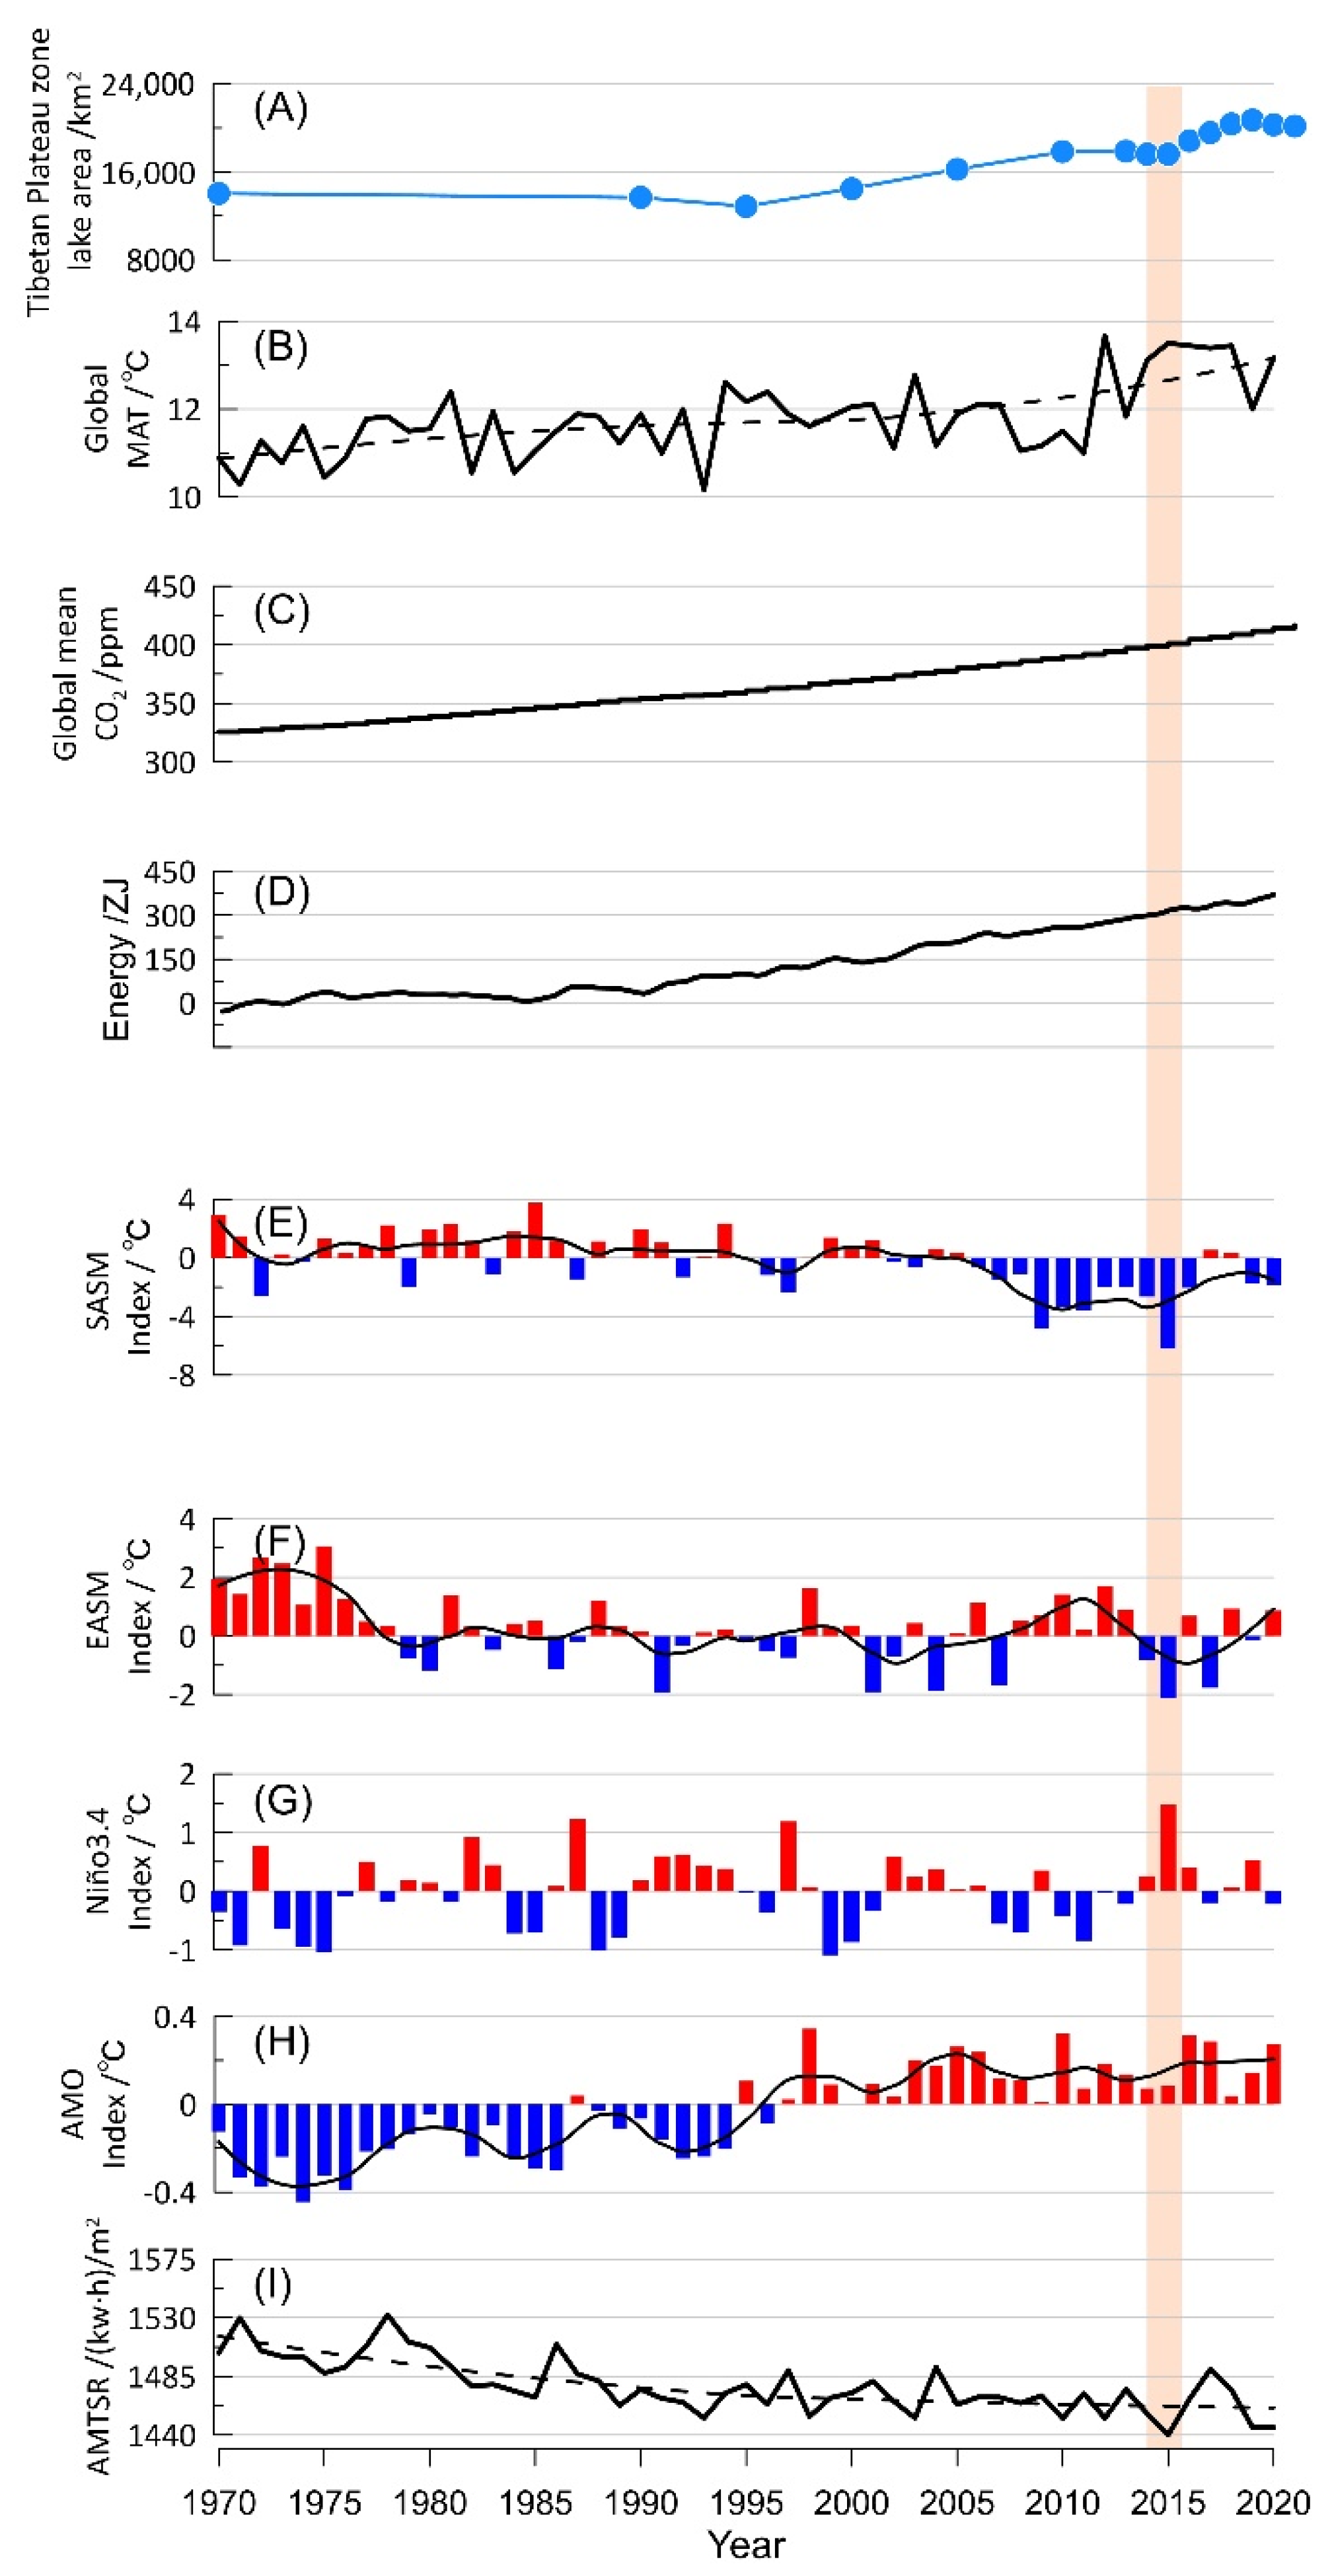
Over the past 50 years, the global climate has changed drastically. In 2020, the global average temperature was 1.2 °C higher than that before the Industrial Revolution, and the atmospheric content of greenhouse gases, such as CO2, has continued to increase [3]. The increase in the energy of the climate system caused by global warming is mainly stored in the oceans [51], and the increase in oceanic temperature allows more water vapor to enter the atmospheric circulation system [52]. The majority of water vapor in the arid area of the Tibetan Plateau comes from southerly transport [53]; hence, the strength of the South Asia Summer Monsoon (SASM) and East Asian Summer Monsoon (EASM) will have a great influence on the precipitation over the plateau, with El Niño also having a strong influence [54]. Therefore, we here use the SASM, EASM, and Niño3.4 indices as proxies for the degree of influence of SASM, EASM, and El Niño, respectively (Figure 7). In addition, precipitation carried by the westerly wind can affect the western edge of the plateau [53], hence we take the Atlantic Multidecadal Oscillation (AMO) index as an index of precipitation intensity change in the westerlies [55]. The variation in lake evaporation is mainly controlled by the incident surface solar radiation [56]. Thus, we use Pearson correlation to examine the correlation between global change and lake area change on the arid plateau, while PMVD is used to evaluate the impact of various factors on lake area change (Table S2).
Over the past 50 years, the global mean CO2, ocean-heat budget energy, AMO index, and annual mean total solar-radiation (AMTSR) of the current and previous years have significantly affected changes in the lake area within the plateau arid region (Table S2). Whether in the current or previous year, the ocean heat budget energy had the greatest contribution to lake changes (>74%) in the Tibetan Plateau zone, followed by global mean CO2 (<10%). An increase in greenhouse gases, such as CO2, is reflected by an increase in temperature, which increases the temperature of the ocean surface. Water vapor from evaporation forms clouds first through phase transformation (condensation and deposition), rather than directly forming precipitation. As a greater volume of evaporated water vapor has entered the atmosphere, the total amount of atmospheric water vapor has increased rapidly at a rate of 1–2% per decade [3]. Atmospheric circulation transports higher quantities of water vapor to the inland areas of the plateau; part of this increased precipitation is stored in the form of frozen soil and ice, but most serves as recharge into circulating groundwater. Full recharge of pore water then allows more water to be released into lake basins, causing lake water levels to increase. Continued global warming causes water to be released from solid water resources, such as glaciers, snow cover, and shallow permafrost layers. While some of this excess water evaporates, and some is lost as surface runoff, the remainder participates in the groundwater cycle, which is recharged into surface runoff in the downstream direction. Multiphase water transformation enhances moisture recycling [8]. In addition, declining solar radiation has caused reduced evaporation, allowing more water to remain on the plateau.
Because changes in the lake area act as a stable change in the time series, while El Niño, SASM, and EASM act as fluctuating changes, the significance of their respective impacts is not obvious (Table S2). During the strong El Niño year of 2015–2016, the SASM and EASM were abnormally weak, and the AMO was also at a low level, which further interfered with the Asian monsoon [57] (Figure 7), resulting in a decrease in water vapor supply to the plateau. The total lake area decreased, and this climatic event had a very important impact on the ecology of the Tibetan Plateau zone. Notably, changes in the lake area are not only the result of regional climate change, but are also influenced by global climate [7,27].
4.3. Future Forecast
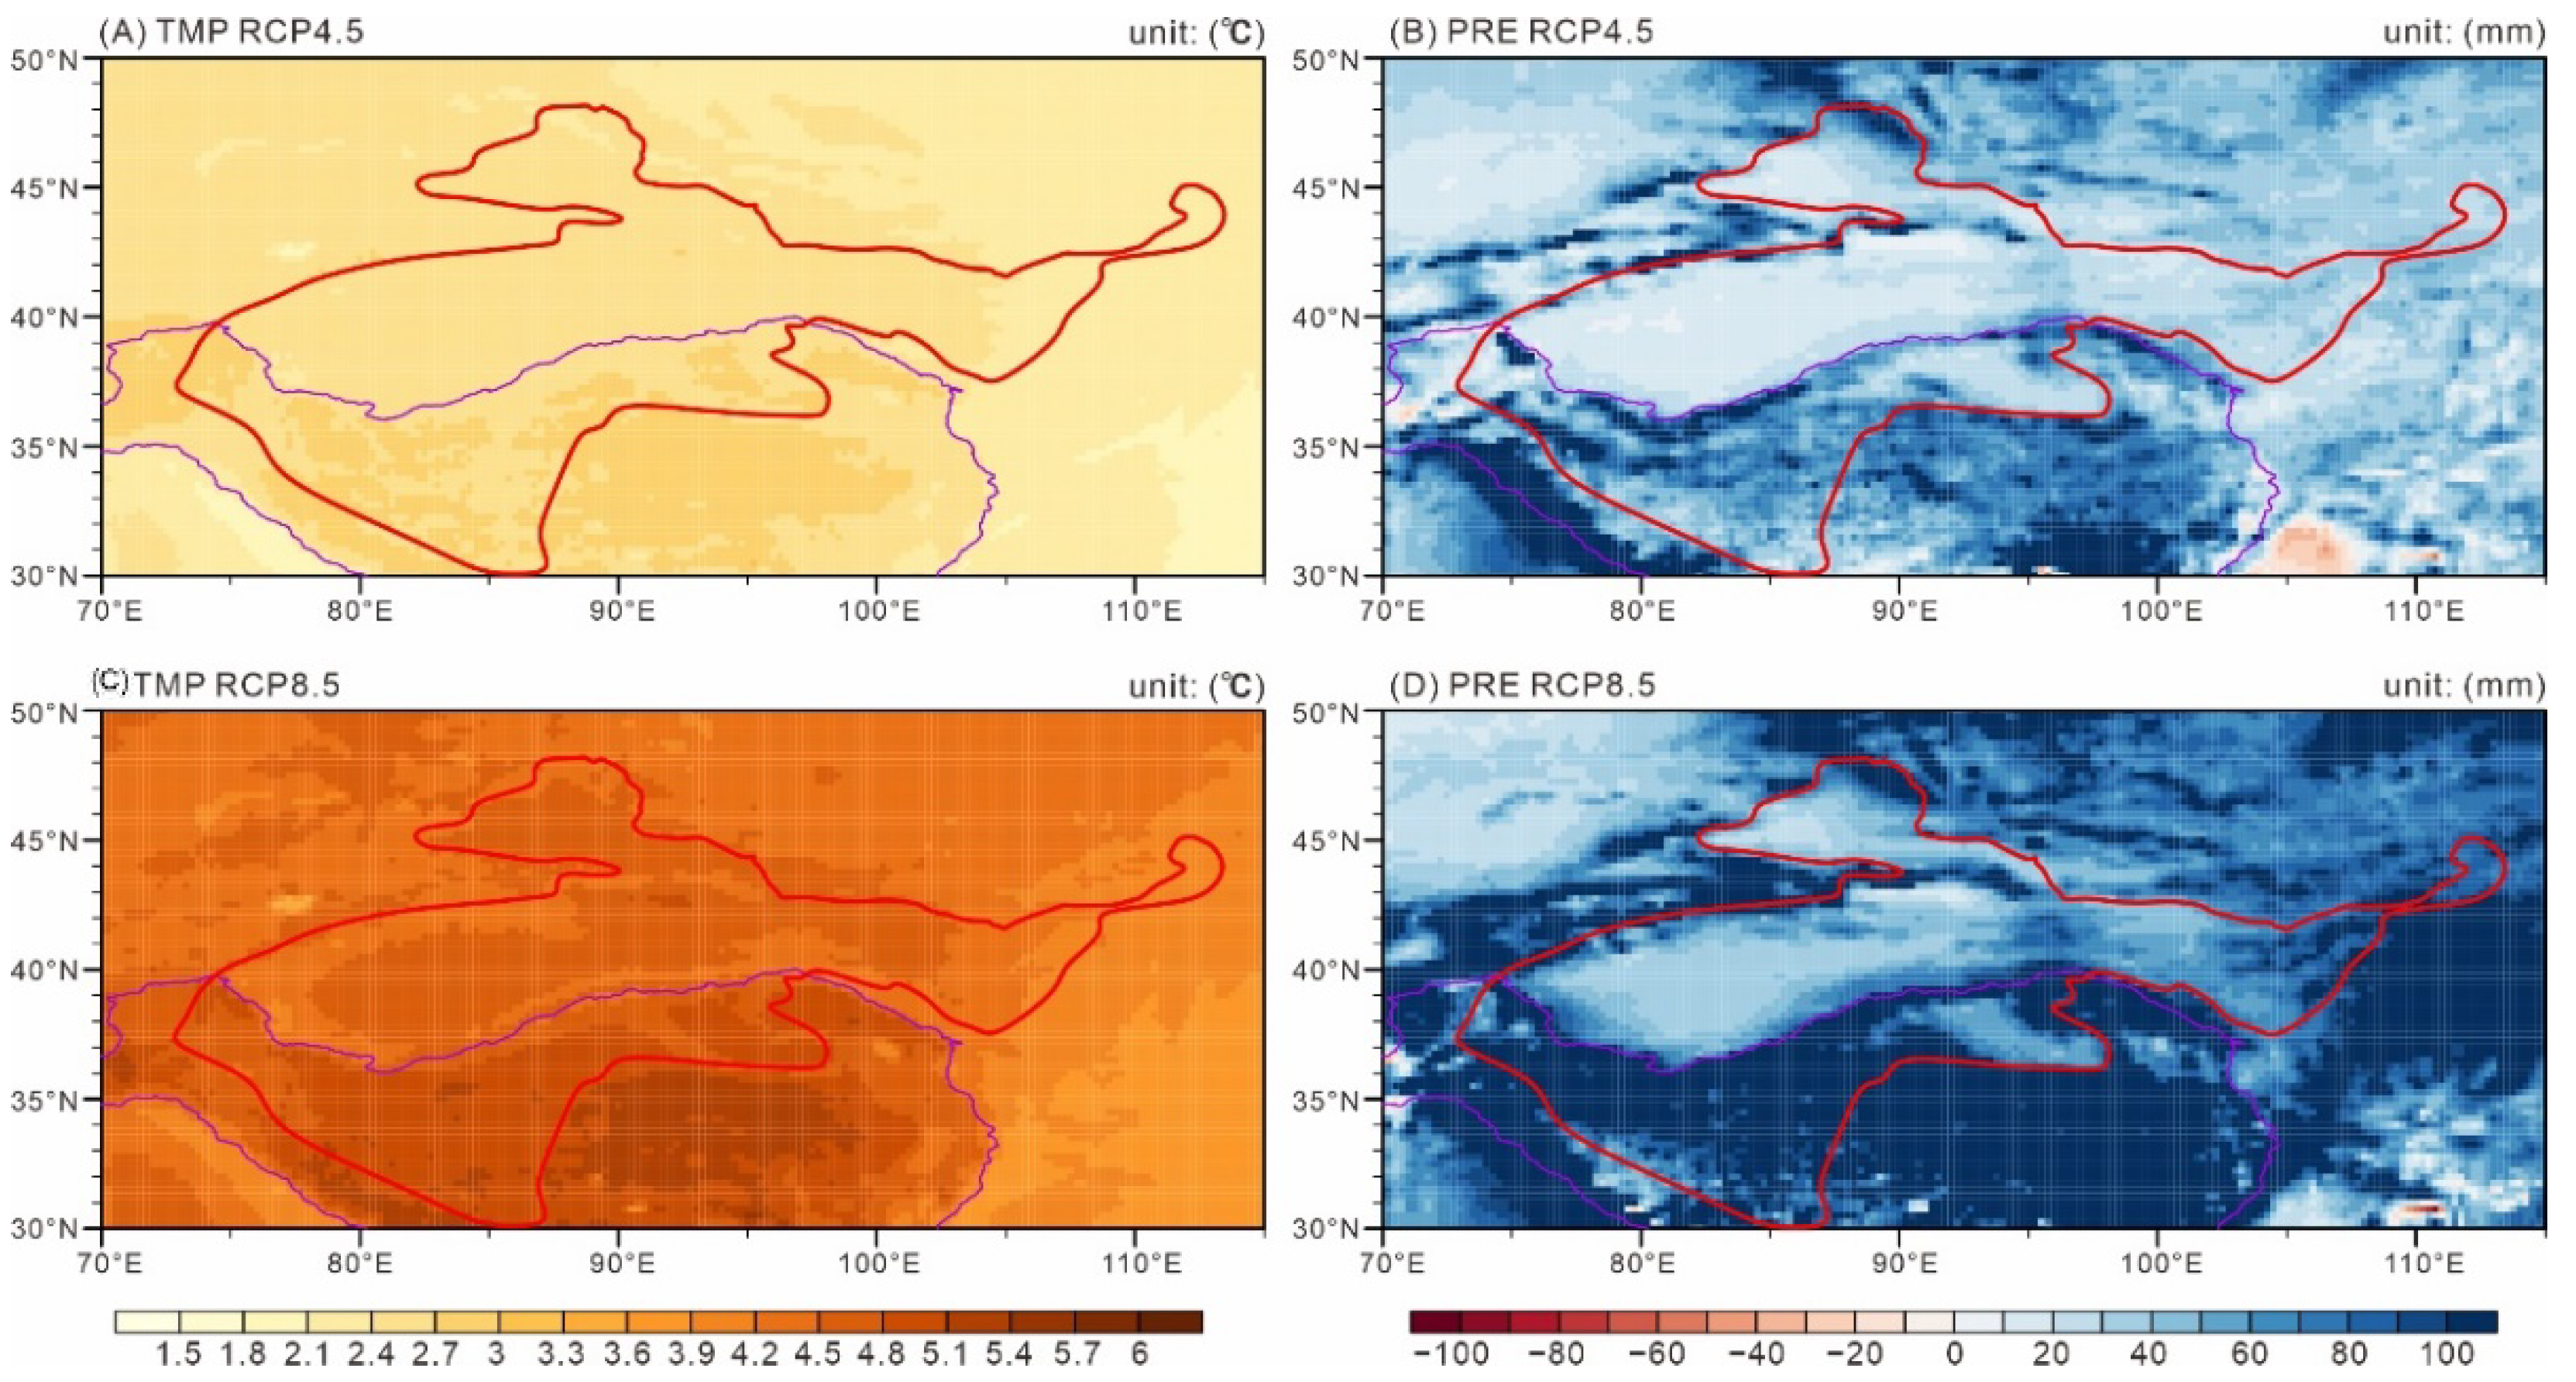
Multi-model ensemble forecasting and climate change scenario analysis are effective means to predict future lake changes in arid areas under global change. Precipitation (atmospheric water) and warming are the main climatic factors driving lake change in CEA. According to the GCM future climate projections under the RCP4.5 and RCP8.5 scenarios, it will become warmer in the CEA arid region (Figure 8A,C), which confirms the global warming trend identified by the IPCC AR5. Precipitation also showed an increasing trend under the two modeled scenarios (Figure 5 and Figure 8B,D), which is consistent with a future shrinking trend of dryland in CEA; together, this indicates that the arid regions of CEA will become warmer and more humid in the future.
Some studies have suggested that the loss of most alpine glaciers by the end of this century may reduce the area of lakes in plateau or alpine—basin regions [60,61], but evidence from geological history does not support such a conclusion. During the Pliocene epoch, atmospheric CO2 was approximately 350–450 ppm and temperature was approximately 2–4 °C higher than the pre-industrial level [62]. Great lakes developed and even formed organic-rich source rocks in the Qaidam Basin, where an extremely arid region exists at the present day, and the precipitation of the Qaidam Basin reconstructed with different indicators has reached ~400 mm in the Pliocene [63], and the sedimentological evidence also supports this conclusion [64]. In addition, there was a large relative relief fluctuation between Qaidam Basin and Qilian Mountains [65]. It appears that additional precipitation and abundant groundwater reserves in the mountains kept lakes from drying up [66]. Although the development of glaciers since the Quaternary in mountainous areas such as the Qilian Mountains has formed some lakes fed by glacial meltwater, the loss of water vapor input and precipitation eventually led to the disappearance of large lakes. This indicates that in the future, additional water stored and released by mountains will offset the decrease in meltwater caused by the retreat of glaciers. Hence, glaciers are not necessary for the existence of lakes in modern arid regions and high terrain can provide a stable environmental foundation for the continuous expansion of lakes in the future.
However, the warm and humid climate in CEA does not mean that the future climate will be more suitable for humans. Low soil moisture and low vegetation cover in CEA are more sensitive to temperature increases caused by rising levels of greenhouse gases [67]. By the end of the century, the medium-emission scenario indicates that precipitation will increase by 40–50 mm per year and temperature will increase by 2 °C; in the high-emission scenario, precipitation will increase by over 80 mm per year and temperature will rapidly increase by ~5 °C in CEA (Figure 8). Under future climate warming, the degree and frequency of extreme high temperature and extreme precipitation events will increase [11,12], while continuous warming will cause a decrease in the area and duration of seasonal lake ice cover [56,68], and the future expansion of lakes may make heatwaves more intense and longer in duration [10]. More frequent extreme climatic events in the future will strongly affect the temperature tolerance of oasis agriculture and other vegetation [9], which will result in the ecology of CEA having to endure more severe climatic pressure, resulting in a decrease in the carrying capacity of oases. Coping with more and stronger extreme climatic events is an important challenge for the ecological environment of arid areas in the future.
5. Conclusions
This study investigates the lake changes in different geomorphological zones of CEA in the past 50 years, effectively assesses the drivers of lake change in the context of climate change, and forecasts the trend of lake change under the climate background in the future. This provides a good basis to understand the response of the climate and ecological environment in arid areas to global warming.
Over the past five decades, the area of lakes in CEA has expanded rapidly from 17,442 to 24,541 km2, an increase of 41%. There are significant differences in lake changes and their influencing factors in the different geomorphological zones of CEA. In the Tibetan Plateau and high mountain—basin zones, the area of lakes has expanded owing to increased precipitation (including cloud water), and increased glacier, permafrost, and snow melt water caused by warming (which contributed to ~66%), which led to the water content of mountains increasing. The main driver for changes in the low mountain zone lakes was changes in precipitation (which contributed to ~87%).
The enhancement of the global greenhouse effect has led to an increase in the thermal energy of the surface ocean, resulting in enhanced evaporation and an increase in atmospheric water content. This enabled atmospheric circulation to carry more water vapor into arid regions, causing an increase in cloud water resources and precipitation, and resulting in an increase in mountain water storage and an enhanced regional water cycle. These are the drivers that triggered lake expansion in CEA.
Future climate projections using the RCP4.5 and RCP8.5 scenarios, together with historical geological evidence, suggest that continued future warming (increase of 4.0–7.8 °C) and increased precipitation (increase of 1.07 to 1.29 mm per day) will lead to further expansion of lakes in CEA. However, the higher temperature and increased precipitation may cause the more frequent occurrence of extreme climatic events that will seriously threaten the ecological stability of arid areas; these are issues that require further attention in the future.
Supplementary Materials
The following supporting information can be downloaded at: https://www.mdpi.com/article/10.3390/w14223661/s1, Figure S1: The proportion of lake area in the Tibetan Plateau zone relative to the whole Tibetan Plateau; Figure S2: Characteristics of lakes in different regions of East Asia; Figure S3: Arid Central East Asia meteorological station TMP from 1970 to 2020; Figure S4: Arid Central East Asia meteorological station PRE from 1970 to 2020; Figure S5: Comparison of PREMS and PRECRU in (a) high mountain—basin zone, (b) low mountain zone and (c) Tibetan Plateau zone, respectively; Table S1: The relationship between the lake area and the meteorological factors of the current year and the previous year in the three zones; Table S2. Relationship between Tibetan Plateau zone lake area change and global change factors.
Author Contributions
Conceptualization, Y.Y. and Y.M.; methodology, Y.M.; software, J.W.; validation, J.W., X.W. and X.L.; formal analysis, Y.Y. and Y.M.; investigation, Y.Y. and Y.M.; resources, Y.Y. and Z.Z.; data curation, Y.Y., J.W. and X.L.; writing—original draft preparation, Y.Y.; writing—review and editing, Y.Y., Y.M. and J.W.; visualization, Y.Y.; supervision, Y.M.; project administration, Y.M.; funding acquisition, Y.M. and X.W. All authors have read and agreed to the published version of the manuscript.
Funding
This research was funded by National Key Research and Development Program of China (2020YFA0608401), and NSFC Grant (42161144012, 42202029).
Data Availability Statement
All individuals included in this section have consented to the acknowledgement. Publicly available datasets were analyzed in this study. This data can be found here: http://data.tpdc.ac.cn. Zhang, G. China Lake Dataset (1960s–2020); National Tibetan Plateau Data Center: Beijing, China, 2019. https://doi.org/10.11888/Hydro.tpdc.270302. Zhang, G. The Lakes Larger than 1 km2 in Tibetan Plateau (V3.0) (1970s–2021); National Tibetan Plateau Data Center: Beijing, China, 2019. https://doi.org/10.11888/Hydro.tpdc.270303.
Acknowledgments
All individuals included in this section have consented to the acknowledgement.
Conflicts of Interest
The authors declare no conflict of interest.
References
- Zhou, S.; Huang, Y.; Yu, B.; Wang, G. Effects of human activities on the eco-environment in the middle Heihe River Basin based on an extended environmental Kuznets curve model. Ecol. Eng. 2015, 76, 14–26. [Google Scholar] [CrossRef]
- Nilsson, C.; Grelsson, G. The fragility of ecosystems: A review. J. Appl. Ecol. 1995, 32, 677–692. [Google Scholar] [CrossRef]
- IPCC. AR6 Climate Change 2021: The Physical Science Basis; Cambridge University Press: Cambridge, UK, 2021. [Google Scholar]
- Huang, J.; Yu, H.; Guan, X.; Wang, G.; Guo, R. Accelerated dryland expansion under climate change. Nat. Clim. Chang. 2016, 6, 166–171. [Google Scholar] [CrossRef]
- Wang, J.; Song, C.; Reager, J.T.; Yao, F.; Famiglietti, J.S.; Sheng, Y.; MacDonald, G.M.; Brun, F.; Schmied, H.M.; Marston, R.A.; et al. Recent global decline in endorheic basin water storages. Nat. Geosci. 2018, 11, 926–932. [Google Scholar] [CrossRef] [Green Version]
- Yao, J.; Chen, Y.; Guan, X.; Zhao, Y.; Chen, J.; Mao, W. Recent climate and hydrological changes in a mountain–basin system in Xinjiang, China. Earth-Sci. Rev. 2022, 226, 103957. [Google Scholar] [CrossRef]
- Zhang, G.; Yao, T.; Xie, H.; Yang, K.; Zhu, L.; Shum, C.K.; Bolch, T.; Yi, S.; Allen, S.; Jiang, L.; et al. Response of Tibetan Plateau lakes to climate change: Trends, patterns, and mechanisms. Earth-Sci. Rev. 2020, 208, 103269. [Google Scholar] [CrossRef]
- Li, Z.X.; Feng, Q.; Li, Z.J.; Yuan, R.F.; Gui, J.; Lv, Y.M. Climate background, fact and hydrological effect of multiphase water transformation in cold regions of the Western China: A review. Earth-Sci. Rev. 2019, 190, 33–57. [Google Scholar] [CrossRef]
- Piao, S.; Ciais, P.; Huang, Y.; Shen, Z.; Peng, S.; Li, J.; Zhou, L.; Liu, H.; Ma, Y.; Ding, Y.; et al. The impacts of climate change on water resources and agriculture in China. Nature 2010, 467, 43–51. [Google Scholar] [CrossRef]
- Woolway, R.I.; Jennings, E.; Shatwell, T.; Golub, M.; Pierson, D.C.; Maberly, S.C. Lake heatwaves under climate change. Nature 2021, 589, 402–407. [Google Scholar] [CrossRef]
- Thackeray, C.W.; Hall, A.; Norris, J.; Chen, D. Constraining the increased frequency of global precipitation extremes under warming. Nat. Clim. Chang. 2022, 12, 441–448. [Google Scholar] [CrossRef]
- Zhao, Z.; Huang, A.; Ma, W.; Wu, Y.; Wen, L.; Lazhu; Gu, C. Effects of Lake Nam Co and Surrounding Terrain on Extreme Precipitation Over Nam Co Basin, Tibetan Plateau: A Case Study. J. Geophys. Res. Atmos. 2022, 127, e2021JD036190. [Google Scholar] [CrossRef]
- Malik, S.; Pal, S.C.; Sattar, A.; Singh, S.K.; Das, B.; Chakrabortty, R.; Mohammad, P. Trend of extreme rainfall events using suitable Global Circulation Model to combat the water logging condition in Kolkata Metropolitan Area. Urban Clim. 2020, 32, 100599. [Google Scholar] [CrossRef]
- Chakrabortty, R.; Pal, S.C.; Janizadeh, S.; Santosh, M.; Roy, P.; Chowdhuri, I.; Saha, A. Impact of Climate Change on Future Flood Susceptibility: An Evaluation Based on Deep Learning Algorithms and GCM Model. Water Resour. Manag. 2021, 35, 4251–4274. [Google Scholar] [CrossRef]
- Chakrabortty, R.; Pradhan, B.; Mondal, P.; Pal, S.C. The use of RUSLE and GCMs to predict potential soil erosion associated with climate change in a monsoon-dominated region of eastern India. Arab. J. Geosci. 2020, 13, 1073. [Google Scholar] [CrossRef]
- Pal, S.C.; Chakrabortty, R. Simulating the impact of climate change on soil erosion in sub-tropical monsoon dominated watershed based on RUSLE, SCS runoff and MIROC5 climatic model. Adv. Space Res. 2019, 64, 352–377. [Google Scholar] [CrossRef]
- Huang, J.P.; Wang, T.H.; Wang, W.C.; Li, Z.Q.; Yan, H.R. Climate effects of dust aerosols over East Asian arid and semiarid regions. J. Geophys. Res.-Atmos. 2014, 119, 11398–11416. [Google Scholar] [CrossRef]
- Xu, L.; Zheng, C.L.; Ma, Y. Variations in precipitation extremes in the arid and semi-arid regions of China. Int. J. Climatol. 2021, 41, 1542–1554. [Google Scholar] [CrossRef]
- Fick, S.E.; Hijmans, R.J. WorldClim 2: New 1-km spatial resolution climate surfaces for global land areas. Int. J. Climatol. 2017, 37, 4302–4315. [Google Scholar] [CrossRef]
- Khelifa, R.; Mahdjoub, H.; Samways, M.J. Combined climatic and anthropogenic stress threaten resilience of important wetland sites in an arid region. Sci. Total Environ. 2022, 806, 150806. [Google Scholar] [CrossRef]
- Beck, H.E.; Zimmermann, N.E.; McVicar, T.R.; Vergopolan, N.; Berg, A.; Wood, E.F. Present and future Köppen-Geiger climate classification maps at 1-km resolution. Sci. Data 2018, 5, 180214. [Google Scholar] [CrossRef]
- Zhang, Y.; Ren, H.; Pan, X. Integration Dataset of Tibet Plateau Boundary; National Tibetan Plateau Data Center: Beijing, China, 2019. [Google Scholar] [CrossRef]
- Zhang, G.; Yao, T.; Chen, W.; Zheng, G.; Shum, C.K.; Yang, K.; Piao, S.; Sheng, Y.; Yi, S.; Li, J.; et al. Regional differences of lake evolution across China during 1960s-2015 and its natural and anthropogenic causes. Remote Sens. Environ. 2019, 221, 386–404. [Google Scholar] [CrossRef]
- Zhang, G. China Lake Dataset (1960s–2020); National Tibetan Plateau Data Center: Beijing, China, 2019. [Google Scholar] [CrossRef]
- Zhang, G. The Lakes Larger than 1 km2 in Tibetan Plateau (V3.0) (1970s-2021); National Tibetan Plateau Data Center: Beijing, China, 2019. [Google Scholar] [CrossRef]
- Zhang, G.; Yao, T.; Xie, H.; Zhang, K.; Zhu, F. Lakes’ state and abundance across the Tibetan Plateau. Chin. Sci. Bull. 2014, 59, 3010–3021. [Google Scholar] [CrossRef]
- Zhang, G.; Luo, W.; Chen, W.; Zheng, G. A robust but variable lake expansion on the Tibetan Plateau. Sci. Bull. 2019, 64, 1306–1309. [Google Scholar] [CrossRef] [Green Version]
- Harris, I.; Osborn, T.J.; Jones, P.; Lister, D. Version 4 of the CRU TS monthly high-resolution gridded multivariate climate dataset. Sci. Data 2020, 7, 109. [Google Scholar] [CrossRef] [Green Version]
- Warszawski, L.; Frieler, K.; Huber, V.; Piontek, F.; Serdeczny, O.; Schewe, J. The Inter-Sectoral Impact Model Intercomparison Project (ISI-MIP): Project framework. Proc. Natl. Acad. Sci. USA 2014, 111, 3228–3232. [Google Scholar] [CrossRef] [PubMed] [Green Version]
- Moss, R.H.; Edmonds, J.A.; Hibbard, K.A.; Manning, M.R.; Rose, S.K.; van Vuuren, D.P.; Carter, T.R.; Emori, S.; Kainuma, M.; Kram, T.; et al. The next generation of scenarios for climate change research and assessment. Nature 2010, 463, 747–756. [Google Scholar] [CrossRef]
- Wang, X.; Ran, Y.; Pang, G.; Chen, D.; Su, B.; Chen, R.; Li, X.; Chen, H.W.; Yang, M.; Gou, X.; et al. Contrasting characteristics, changes, and linkages of permafrost between the Arctic and the Third Pole. Earth-Sci. Rev. 2022, 230, 104042. [Google Scholar] [CrossRef]
- Tao, S.L.; Fang, J.Y.; Ma, S.H.; Cai, Q.; Xiong, X.Y.; Tian, D.; Zhao, X.; Fang, L.Q.; Zhang, H.; Zhu, J.L.; et al. Changes in China’s lakes: Climate and human impacts. Natl. Sci. Rev. 2020, 7, 132–140. [Google Scholar] [CrossRef] [Green Version]
- Wang, L.; Liu, H.; Zhong, X.; Zhou, J.; Zhu, L.; Yao, T.; Xie, C.; Ju, J.; Chen, D.; Yang, K.; et al. Domino effect of a natural cascade alpine lake system on the Third Pole. PNAS Nexus 2022, 1, pgac053. [Google Scholar] [CrossRef]
- Lutz, A.F.; Immerzeel, W.W.; Shrestha, A.B.; Bierkens, M.F.P. Consistent increase in High Asia’s runoff due to increasing glacier melt and precipitation. Nat. Clim. Chang. 2014, 4, 587–592. [Google Scholar] [CrossRef] [Green Version]
- Sun, Q.; Miao, C.; Duan, Q.; Ashouri, H.; Sorooshian, S.; Hsu, K.-L. A Review of Global Precipitation Data Sets: Data Sources, Estimation, and Intercomparisons. Rev. Geophys. 2018, 56, 79–107. [Google Scholar] [CrossRef] [Green Version]
- Clark, M.P.; Slater, A.G. Probabilistic quantitative precipitation estimation in complex terrain. J. Hydrometeorol. 2006, 7, 3–22. [Google Scholar] [CrossRef]
- Chen, D.; Ou, T.; Gong, L.; Xu, C.-Y.; Li, W.; Ho, C.-H.; Qian, W. Spatial Interpolation of Daily Precipitation in China: 1951-2005. Adv. Atmos. Sci. 2010, 27, 1221–1232. [Google Scholar] [CrossRef]
- Held, I.M.; Soden, B.J. Robust responses of the hydrological cycle to global warming. J. Clim. 2006, 19, 5686–5699. [Google Scholar] [CrossRef]
- Cheng, J.; You, Q.; Zhou, Y.; Cai, M.; Pepin, N.; Chen, D.; AghaKouchak, A.; Kang, S.; Li, M. Increasing cloud water resource in a warming world. Environ. Res. Lett. 2021, 16, 124067. [Google Scholar] [CrossRef]
- Johnson, J.W.; LeBreton, J.M. History and use of relative importance indices in organizational research. Organ. Res. Methods 2004, 7, 238–257. [Google Scholar] [CrossRef]
- Groemping, U. Relative importance for linear regression in R: The package relaimpo. J. Stat. Softw. 2006, 17, 1–27. [Google Scholar] [CrossRef]
- Wu, Z.; Barosh, P.J.; Hu, D.; Wu, Z.; Zhao, X.; Ye, P.; Jiang, W. Hazards posed by active major faults along the Golmud–Lhasa railway route, Tibetan Plateau, China. Eng. Geol. 2004, 74, 163–182. [Google Scholar] [CrossRef]
- Frisbee, M.D.; Tolley, D.G.; Wilson, J.L. Field estimates of groundwater circulation depths in two mountainous watersheds in the western US and the effect of deep circulation on solute concentrations in streamflow. Water Resour. Res. 2017, 53, 2693–2715. [Google Scholar] [CrossRef]
- Ge, S.; Wu, Q.B.; Lu, N.; Jiang, G.L.; Ball, L. Groundwater in the Tibet Plateau, western China. Geophys. Res. Lett. 2008, 35. [Google Scholar] [CrossRef]
- Lei, Y.; Yang, K.; Immerzeel, W.W.; Song, P.; Bird, B.W.; He, J.; Zhao, H.; Li, Z. Critical Role of Groundwater Inflow in Sustaining Lake Water Balance on the Western Tibetan Plateau. Geophys. Res. Lett. 2022, 49, e2022GL099268. [Google Scholar] [CrossRef]
- Zhang, G.; Yao, T.; Shum, C.K.; Yi, S.; Yang, K.; Xie, H.; Feng, W.; Bolch, T.; Wang, L.; Behrangi, A.; et al. Lake volume and groundwater storage variations in Tibetan Plateau’s endorheic basin. Geophys. Res. Lett. 2017, 44, 5550–5560. [Google Scholar] [CrossRef]
- Wang, X.-S.; Jin, X.; Hou, L.; Qian, R.; Wang, L. Interactions between groundwater and lakes in Badain Jaran Desert. Earth Sci. Front. 2014, 21, 91–99. [Google Scholar] [CrossRef]
- Yang, H.; Zhao, H.; Wang, X.; Wang, K.; Niu, Q.; Zhang, J.; Liu, B. Optical dating of Yardang sediments and its implications for past flood events on the border of the Badain Jaran Desert, Northern China. CATENA 2021, 207, 105614. [Google Scholar] [CrossRef]
- Su, X.; Lu, C.; Li, M.; Wang, Y.; Wang, N. Using 222Rn temporal and spatial distributions to estimate the groundwater discharge rate and associated nutrient fluxes into high salinity lakes in Badain Jaran Desert, Northwest China. Sci. Total Environ. 2022, 857, 159359. [Google Scholar] [CrossRef]
- Wang, Z. Long-Term Runoff Observation with Ten-Days Interval of Yingluoxia and Zhengyixia Gorges in Heihe River Basin (1994–2010); National Tibetan Plateau Data Center: Beijing, China, 2015. [Google Scholar]
- Cheng, L.; Abraham, J.; Trenberth, K.E.; Fasullo, J.; Boyer, T.; Locarnini, R.; Zhang, B.; Yu, F.; Wan, L.; Chen, X.; et al. Upper Ocean Temperatures Hit Record High in 2020. Adv. Atmos. Sci. 2021, 38, 523–530. [Google Scholar] [CrossRef]
- Jiang, D.; Wang, X. A brief interpretation of drought change from IPCC Sixth Assessment Report. Trans. Atmos. Sci. 2021, 44, 650–653. [Google Scholar]
- Zhong, L.; Hua, L.; Gong, Z.; Yao, Y.; Mu, L. Quantifying the Spatial Characteristics of the Moisture Transport Affecting Precipitation Seasonality and Recycling Variability in Central Asia. Adv. Atmos. Sci. 2022, 39, 967–984. [Google Scholar] [CrossRef]
- Lei, Y.; Zhu, Y.; Wang, B.; Yao, T.; Yang, K.; Zhang, X.; Zhai, J.; Ma, N. Extreme Lake Level Changes on the Tibetan Plateau Associated With the 2015/2016 El Nino. Geophys. Res. Lett. 2019, 46, 5889–5898. [Google Scholar] [CrossRef]
- Hong, X.W.; Lu, R.Y.; Li, S.L. Amplified summer warming in Europe-West Asia and Northeast Asia after the mid-1990s. Environ. Res. Lett. 2017, 12, 094007. [Google Scholar] [CrossRef] [Green Version]
- Wang, W.; Lee, X.; Xiao, W.; Liu, S.; Schultz, N.; Wang, Y.; Zhang, M.; Zhao, L. Global lake evaporation accelerated by changes in surface energy allocation in a warmer climate. Nat. Geosci. 2018, 11, 410–414. [Google Scholar] [CrossRef]
- Borah, P.J.; Venugopal, V.; Sukhatme, J.; Muddebihal, P.; Goswami, B.N. Indian monsoon derailed by a North Atlantic wavetrain. Science 2020, 370, 1335–1338. [Google Scholar] [CrossRef] [PubMed]
- Cheng, L.J.; Trenberth, K.E.; Fasullo, J.; Boyer, T.; Abraham, J.; Zhu, J. Improved estimates of ocean heat content from 1960 to 2015. Sci. Adv. 2017, 3, e1601545. [Google Scholar] [CrossRef] [PubMed] [Green Version]
- Enfield, D.B.; Mestas-Nunez, A.M.; Trimble, P.J. The Atlantic multidecadal oscillation and its relation to rainfall and river flows in the continental US. Geophys. Res. Lett. 2001, 28, 2077–2080. [Google Scholar] [CrossRef] [Green Version]
- Sun, Z.; Wang, R. Effect of glaciers change to water balance of Lake Bosten under climatic backgrounds. Sci. Limnol. Sin. 2006, 18, 484–489. [Google Scholar]
- Somers, L.D.; McKenzie, J.M.; Mark, B.G.; Lagos, P.; Ng, G.-H.C.; Wickert, A.D.; Yarleque, C.; Baraer, M.; Silva, Y. Groundwater Buffers Decreasing Glacier Melt in an Andean Watershed-But Not Forever. Geophys. Res. Lett. 2019, 46, 13016–13026. [Google Scholar] [CrossRef] [Green Version]
- Westerhold, T.; Marwan, N.; Drury, A.J.; Liebrand, D.; Agnini, C.; Anagnostou, E.; Barnet, J.S.K.; Bohaty, S.M.; De Vleeschouwer, D.; Florindo, F.; et al. An astronomically dated record of Earth’s climate and its predictability over the last 66 million years. Science 2020, 369, 1383–1387. [Google Scholar] [CrossRef]
- Miao, Y.; Xiang, M.; Zhang, T.; Warny, S. Comment on “An equable subtropical climate throughout China in the Miocene based on palaeofloral evidence” by Qing Wang, Yan Li David K. Ferguson, Wen-Bo Mo, and Nan Yang, Earth-Science Reviews, [Earth-Science Reviews 218 (2021) 103649]. Earth-Sci. Rev. 2022, 233, 104020. [Google Scholar] [CrossRef]
- Cai, M.; Fang, X.; Wu, F.; Miao, Y.; Appel, E. Pliocene–Pleistocene stepwise drying of Central Asia: Evidence from paleomagnetism and sporopollen record of the deep borehole SG-3 in the western Qaidam Basin, NE Tibetan Plateau. Glob. Planet. Chang. 2012, 94–95, 72–81. [Google Scholar] [CrossRef]
- Wang, W.; Zhang, P.; Garzione, C.N.; Liu, C.; Zhang, Z.; Pang, J.; Wang, Y.; Zheng, D.; Zheng, W.; Zhang, H. Pulsed rise and growth of the Tibetan Plateau to its northern margin since ca. 30 Ma. Proc. Natl. Acad. Sci. USA 2022, 119, e2120364119. [Google Scholar] [CrossRef]
- Wang, X.; Schmidt, B.; Otto, M.; Ehlers, T.A.; Mutz, S.G.; Botsyun, S.; Scherer, D. Sensitivity of Water Balance in the Qaidam Basin to the Mid-Pliocene Climate. J. Geophys. Res.-Atmos. 2021, 126, e2020JD033965. [Google Scholar] [CrossRef]
- Huang, J.; Yu, H.; Dai, A.; Wei, Y.; Kang, L. Drylands face potential threat under 2 degrees C global warming target. Nat. Clim. Chang. 2017, 7, 417–422. [Google Scholar] [CrossRef]
- Grant, L.; Vanderkelen, I.; Gudmundsson, L.; Tan, Z.; Perroud, M.; Stepanenko, V.M.; Debolskiy, A.V.; Droppers, B.; Janssen, A.B.G.; Woolway, R.I.; et al. Attribution of global lake systems change to anthropogenic forcing. Nat. Geosci. 2021, 14, 849–854. [Google Scholar] [CrossRef]
Figure 1.
Lake distributions across CEA. (A) Spatial distribution of CEA lakes. Boundary of the Tibetan Plateau is from Zhang, et al. [22]; (B) Latitudinal distribution of lake area (0.5° latitude intervals); elevation background is the average elevation of lakes at 0.5° latitude spatial resolution.

Figure 2.
Characteristics of lakes in CEA over the past 50 years. (A) Change characteristics of total lake area in CEA over the past 50 years; (B) Area proportions of lakes in the Tibetan Plateau, high mountain—basin, and low mountain zones, respectively.
Figure 2.
Characteristics of lakes in CEA over the past 50 years. (A) Change characteristics of total lake area in CEA over the past 50 years; (B) Area proportions of lakes in the Tibetan Plateau, high mountain—basin, and low mountain zones, respectively.

Figure 3.
Variation trends of lake area in three geomorphic zones in CEA over the past 50 years.

Figure 4.
Evolution of different climate variables during the period 1970–2020 in CEA. (A–E) represent changes in TMP, PRE, VAP, CLD, and PET, respectively, in the Tibetan Plateau zone; (A’–E’) and (A’’–E’’) are similar but for the high mountain–basin and low mountain zones, respectively. The time series (line) of TMP is a linear fit, while the other variables are smoothed by LOWESS (locally weighted scatterplot smoothing) with a span width of one year. The p-values are statistically significant trends at the 95% confidence level.

Figure 5.
Time series of ensemble mean TMP and PRE simulations in CEA during the period 2006–2098 under two different scenarios (RCP4.5 and RCP8.5). Lines indicate the CMIP5 multimodal mean, and shades show the ranges of minimum and maximum values of TMP and PRE for the multimodal simulation, respectively.

Figure 6.
Schematic diagram of the lake basins of the Tibetan Plateau, high mountain—basin, and low mountain zones.
Figure 6.
Schematic diagram of the lake basins of the Tibetan Plateau, high mountain—basin, and low mountain zones.

Figure 7.
Comparison of lake area changes in the Tibetan Plateau zone and global climatic factors over the past 50 years. (A) Changes in lake area in the arid zone of the Tibetan Plateau over the past 50 years (http://data.tpdc.ac.cn, accessed on 1 May 2022); (B) Global mean annual temperature; (C) Global mean CO2 content; (D) Global ocean heat budget at 0–300 m [51,58]; (E) SASM index; (F) EASM index; (G) Niño3.4 index; (H) AMO index [59]; (I) AMTSR averaged in China from http://www.nmic.cn/, accessed on 1 May 2022. Data presented in (B,C,E–H) are from https://www.noaa.gov/, accessed on 1 May 2022. The orange band shows the comparison of various elements in a very strong El Niño year in ~2015.

Figure 8.
Future changes in ensemble mean temperature (A,C) and precipitation (B,D) for the period 2069–2098 in CEA under different scenarios (RCP4.5 and RCP8.5), measured relative to the period 1986–2005. The red line outlines the CEA region.
Figure 8.
Future changes in ensemble mean temperature (A,C) and precipitation (B,D) for the period 2069–2098 in CEA under different scenarios (RCP4.5 and RCP8.5), measured relative to the period 1986–2005. The red line outlines the CEA region.

Publisher’s Note: MDPI stays neutral with regard to jurisdictional claims in published maps and institutional affiliations. |
© 2022 by the authors. Licensee MDPI, Basel, Switzerland. This article is an open access article distributed under the terms and conditions of the Creative Commons Attribution (CC BY) license (https://creativecommons.org/licenses/by/4.0/).
Share and Cite
MDPI and ACS Style
Yang, Y.; Wu, J.; Miao, Y.; Wang, X.; Lan, X.; Zhang, Z. Lake Changes during the Past Five Decades in Central East Asia: Links with Climate Change and Climate Future Forecasting. Water 2022, 14, 3661. https://doi.org/10.3390/w14223661
AMA Style
Yang Y, Wu J, Miao Y, Wang X, Lan X, Zhang Z. Lake Changes during the Past Five Decades in Central East Asia: Links with Climate Change and Climate Future Forecasting. Water. 2022; 14(22):3661. https://doi.org/10.3390/w14223661
Chicago/Turabian StyleYang, Yongheng, Jie Wu, Yunfa Miao, Xuelian Wang, Xiaoyu Lan, and Ziyue Zhang. 2022. "Lake Changes during the Past Five Decades in Central East Asia: Links with Climate Change and Climate Future Forecasting" Water 14, no. 22: 3661. https://doi.org/10.3390/w14223661
Note that from the first issue of 2016, this journal uses article numbers instead of page numbers. See further details here.