Article

Spatial and Temporal Distribution Characteristics of Nutrient Elements and Heavy Metals in Surface Water of Tibet, China and Their Pollution Assessment

1
Beijing Laboratory of Water Resources Security, Beijing 100048, China
2
Key Laboratory of 3D Information Acquisition and Application of Ministry of Education, Capital Normal University, Beijing 100048, China
*
Author to whom correspondence should be addressed.
Water 2022, 14(22), 3664; https://doi.org/10.3390/w14223664
Submission received: 21 October 2022 / Revised: 9 November 2022 / Accepted: 11 November 2022 / Published: 14 November 2022
(This article belongs to the Special Issue Plateau Lake Water Quality and Eutrophication: Status and Challenges)

Abstract

:
In the context of global climate change, the ecological environment of Tibet has been gaining attention given its unique geographical and fragile nature. In this study, to understand the pollution status of the surface water of Tibet, China, we collected monthly data of 12 indicators from 41 cross-sectional monitoring sites in 2021 and analyzed the spatial and temporal variations of nutrients and heavy metal elements, water quality conditions, and pollutant sources in surface water. All 12 polluting elements, except lead (Pb), had significant seasonal variations, but the magnitude of the differences was very small. Spatially, nutrient elements were relatively concentrated in the agricultural and pastoral development areas in central and northern Tibet. In general, the water quality in most parts of Tibet was found to be good, and the water quality of 41 monitoring sections belonged to Class I water standard as per the entropy method–fuzzy evaluation method. The study used a multivariate statistical method to analyze the sources of pollution factors. The principal component analysis method identified four principal components. The results of this study can provide a scientific basis for pollution prevention and control in the Tibet Autonomous Region, and contribute to further research on water ecology.

1. Introduction

Tibet is the main part of the Qinghai–Tibet Plateau in China with the highest and largest mountain systems in the world, such as the Himalayas, Nyingchi Tanggula, and Karakoram. It is also the main snow distribution area in China, and its glacial meltwater is the source of river runoff recharge for more than 10 countries in Asia [1]. With the global climate change and rapid development of the Tibetan society and economy, the exploitation of natural resources and development of secondary and tertiary industries have gradually accelerated, considerably impacting the management and utilization of local water resources. Therefore, research on the security of water resources in Tibet is of great scientific research value and practical significance for the harmonious coexistence of man and nature, and the maintenance of ecological security is a prerequisite for development.
The deterioration of aquatic environments owing to urbanization and economic development is becoming a serious problem [2]. In recent years, domestic studies on heavy metal pollution in surface water have mainly focused on areas with developed water systems or industrial bases. He et al. collected exposure concentration data of ten typical heavy metals from eight watersheds in China; they assessed and compared the ecological risks in the water bodies of each watershed, and mining was identified to be the main cause of heavy metal pollution [3]. Zhu et al. [4] conducted a study on the distribution characteristics of heavy metals in the sediments of major water systems and concluded that heavy metal pollution gradually developed into complex pollution of multiple elements due to the development of recent industries. For the western region, especially the Qinghai–Tibet Plateau, which is a unique geographical unit in the world, there are few studies on its surface water pollution and the concentration of nutrients and heavy metals in the local surface water. Based on the analysis of surface water samples collected from the Gongga mountain area, He et al. [5] found that the mass concentrations of heavy metal elements and nutrients in surface water generally show an increase from west to east under the influence of topography and monsoon. Chen et al. [6] investigated the enrichment and migration characteristics of heavy metal elements in polyunsaturated copper ores and found that the distribution of heavy metal elements was remarkable influenced by the minerals. Yang et al. [7] analyzed the enrichment characteristics of organochlorine pesticides and heavy metals in fish from remote mountain lakes and the Lhasa River on the Tibetan Plateau and concluded the plateau to be a regional pollutant convergence area due to long-range atmospheric transport and topographic cold traps. To date, the relationship among water quality, organic matter pollution, and heavy metal pollution in Tibet has not been studied thoroughly. Moreover, information on the distribution of surface water pollution and water quality evaluation lacks the scope of large watersheds, and most studies were mainly conducted in small watersheds.
While connecting and allocating rivers, lakes and other water resources for human use, there are more and more studies on water quality security and ecological impact [8]. Polluted and low-quality water resources will damage natural ecosystems and endanger human and animal health [9]. At present, arsenic (As) is a ubiquitous toxic substance in Tibetan rivers, and its compounds have teratogenic and carcinogenic effects [10,11]. Zhang et al. [12]. observed a very high concentration of dissolved As (1130–9760 μg/L) in the hot springs in the upper reaches of the Yarlung Zangbo River. Wang et al. [13] conducted a health risk assessment in the Yamdrok-tso basin, southern Tibetan Plateau, and found that when residents were exposed to As in the lake water through oral and skin channels for a long time, there was a potential danger in this area, and the contribution rate of cancer risk was 97.31%. Zhang et al. [14] found that changes in the nutrient structure and biodiversity of the Lhasa River forced the number of maladapted fish to decline. Based on the fully covered water quality data of Tibet, the non-parametric Kruskal-Wallis test is used to show the seasonal and regional changes in nutrient elements and heavy metals in 2021. According to the pollution situation in different regions and the health threat caused by local pollution, researchers can propose some adaptive treatment measures to alleviate the pollution.
Human activities are slowly affecting Tibet. So far, there has been no comprehensive understanding of water quality in Tibet. It is very necessary to carry out water quality assessment for its surface water. Analytical hierarchy process (AHP) and fuzzy AHP are usually used, but it is difficult and uncertain to determine model parameters (such as variable weights) under actual conditions, which leads to inaccurate water quality risk assessment [15]. Entropy method-fuzzy evaluation method combines the objectivity of entropy method with the fuzziness of fuzzy evaluation method [16,17,18]. This method can not only use the inherent information of the original data, but also takes into account the judgment of the practical experience of the evaluators to obtain the importance coefficient of each pollution element. It makes up for the shortcomings of the two methods, provides a more accurate and objective water quality assessment and determines river pollution risk indicators [18]. However, this method has never been used in the water quality assessment of Tibetan rivers, and its applicability is unknown.
In the context of global climate change, due to the unique geographical features and fragile ecological environment of Tibet, ecological and environmental problems are gaining attention, and it is important to study the local water resource situation. With the acceleration of urbanization and industrialization, the pollution of water resources in Tibet has become more serious and the seasonal spatial-temporal distribution of pollutant elements has changed. The impact on water resources, hydrological processes, social development and economy of downstream China will become more complex. Reviewing the literature, it was easy to realize that previous studies mostly focused on small watersheds or cities in Tibet, and until now there has been no comprehensive exploration in whole Tibet yet. Therefore, this study analyzed the spatial and temporal distribution of surface water pollution, for the first time, using data from 41 monitoring sites in Tibet from a large watershed perspective to better protect the water resources in Tibet. The study objectives were (1) select the non-parametric Kruskal–Wallis test combined with box line and spatial distribution maps to analyze the seasonal and inter-basin variability of elements, (2) combine the entropy value and fuzzy evaluation methods to develop a more objective evaluation of water quality at the cross-sectional monitoring sites, and (3) use Pearson correlation and principal component analyses to determine the source of the polluting elements.

2. Materials and Methods

2.1. Study Area Overview

The Tibet Autonomous Region is located in the southwest of the Qinghai–Tibet Plateau at 26°50′–36°53′ N and 78°25′–99°06′ E, with an average altitude >4000 m. It covers an area of 1,228,400 km2, accounting for approximately 1/8 of the total area of China, and is known as the roof of the world [1]. The region’s local annual average temperature is low, the temperature difference between day and night is high, solar radiation is strong, average sunshine time is long, and natural resources are extremely rich. Tibet is one of the provinces with the largest number of rivers and most concentrated swampy lakes in China, with more than 20 rivers with watershed areas >10,000 km2 and 819 lakes with areas >1 km2.
The natural ecosystem types (grasslands, forests, and wetlands) of Tibet account for more than 90% of the total area of the region and are the main ecosystems of the region. The arable land in Tibet is mainly concentrated in the middle valley of the Yarlung Zangbo River, the valley of “three rivers” in eastern Tibet, and in the lower valley of the Niyang River in the Linzhi region of southeastern Tibet. With the growth of population and the improvement of urbanization, the construction lands have increased slightly.
Major tectonic blocks of Tibet are bound by the Yarlung Zangbo river fault, which divides the northern Tibetan Plateau and southern Tibetan Mountains. The geological structure of Tibet can be divided into five units: the Himalayan, Lhasa–Bomi, Tanggula, northern Tibet and Xinjiang adjacent area, and Chengdu area linear fold systems. The mountain range, river course, and rock stability in Tibet are varyingly affected by the fracture zone activities. Tibet is located in the Mediterranean–Tethyan metallogenic belt, which makes the local mineral resources extremely rich, and the development of mineral resource research has become an important industrial project in Tibet.
As an important ecological barrier in East Asia, Tibet is of national macro-strategic significance for studying the local ecological environment. In this study, data from 41 cross-sectional monitoring points in seven municipal administrative units—Lhasa, Shigatse, Chengdu, Shannan, Linzhi, Nagqu, and Ali––in the Tibet Autonomous Region were collected. The specific locations of monitoring points are shown in Figure 1.

2.2. Data Collection

The water quality data were obtained from the surface water quality data released by the Ministry of Ecology and Environment [19]. Monthly water quality monitoring data from 2021.01 to 2021.12 were collected by using python 3.8 crawler. Every 4 h, the automatic detection station of surface water quality will conduct the whole process of automatic collection, processing, analysis and data transmission. We used Dissolved Oxygen (DO), Permanganate Value (PV), Chemical Oxygen Demand (COD), Ammonia Nitrogen (NH3-N), Total Phosphorous (TP), and Total Nitrogen (TN) as nutrient monitoring indicators and copper (Cu), zinc (Zn), As, cadmium (Cd), chromium (Cr), and Pb as heavy metal monitoring indexes. The study collected data from 41 cross-sectional monitoring points from seven cities, namely Shannan, Lhasa, Shigatse, Chengdu, Linzhi, Nagqu, and Ali and divided them into 15 groups in terms of the watershed to facilitate inter-regional significance analysis (Table 1).

2.3. Analytical Method of Chemical Indicators

In the monitoring work of the National Surface Water Environmental Quality Monitoring Network, the dissolved oxygen in the basic items of the surface water environmental quality standards is measured on site, and the other 11 monitoring items are analyzed in a laboratory.
Precision control: at least 10% of the parallel double samples shall be measured for each batch of samples (≤20). When the number of samples is less than 10, one parallel double sample shall be measured. According to the sample content, the relative deviation of the parallel double sample determination results should be controlled.
Accuracy control: for each batch of samples (≤20), at least one certified standard sample or matrix spiked recovery sample shall be measured, and the measured value of certified standard sample shall be within the allowable range. Then the spiking recovery rate can be determined according to the sample content.
Elemental concentrations were quantified using external calibration standards. The Table 2 is for specific monitoring and analysis method standards and quality control standards.

2.4. Method

2.4.1. Entropy Value Method-Water Quality Fuzzy Evaluation

The concept of entropy originates from thermodynamics and is a measure of the uncertainty of system state. The entropy method is a relatively objective evaluation method. The higher the entropy value of the information, the more balanced the structure of the system, and the smaller the error [20,21]. Therefore, the weights can be derived from the calculated entropy values. With m monitoring sections and n monitoring indicators, the original data matrix X = (xij)m×n is formed. Given the differences in the scale, order of magnitude, and positive and negative indicators in the matrix, it is necessary to normalize the original data matrix X [22]. The greater the value of the indicator, the better the water quality, i.e., the positive indicator calculation method. On the other hand, the smaller the value of the indicator, the lower the water quality, i.e., a negative indicator calculation method.
In the entropy value method, the calculation steps are as follows [23]:
{ Y i j = X i j i = 1 m X i j 2   Positive   index Y i j = X i j i = 1 m X i j 2   Negative   index
e j = 1 ln m i = 1 m Y i j × ln Y i j
d j = 1 e j
w i = d i j = 1 n d j
where e j denotes the information entropy of the indicator, d j denotes the information entropy redundancy, and w i denotes the indicator weights.
Fuzzy evaluation is based on the fuzzy mathematical affiliation theory. The above two methods are combined to develop a comprehensive evaluation method where the qualitative evaluation changes into quantitative evaluation, with the advantages of clear results and systematic evaluation. This method can better quantify water quality ratings. The steps are as follows: (1) determine the evaluation object factor set and evaluation set and (2) establish the affiliation degree function and fuzzy matrix R.
In the fuzzy evaluation method, the calculation steps are as follows [24]:
When   j = 1 ,   r i j = { 0 , T i S i ( j + 1 ) S i ( j + 1 ) T i S i ( j + 1 ) S i j S i j < T i < S i ( j + 1 ) 1 , T i S i j
When   1 < j < n ,   r i j = { 0 , T i S i ( j + 1 ) T i S i ( j 1 ) S i j S i ( j 1 ) S i ( j 1 ) < T i < S i j S i ( j + 1 ) T i S i ( j + 1 ) S i j S i j < T i < S i ( j + 1 )
When   j = n ,   r i j = { 0 , T i S i ( j 1 ) T i S i ( j 1 ) S i j S i ( j 1 ) S i ( j 1 ) < T i < S i j 1 , T i S i j
R = [ r 11 r 1 n r m 1 r m n ]
where T i denotes the actual measured value of element I, S i j denotes the corresponding standard value of level j for element I, and r i j denotes the affiliation degree of element i to level j.
(3) derive the weights of the entropy value method W (w1, w2, ⋯, wi), and (4) construct the fuzzy evaluation results matrix B. Water quality evaluation results were analyzed according to the principle of maximum affiliation.
B = W × R = ( b 1 , b 2 , , b n )

2.4.2. Principal Component Analysis Method

The Pearson product-moment correlation matrix was used to analyze the correlation between the elements. Principal component analysis (PCA) was performed through varimax rotation, which used small independent variables to explain the variance of interrelated large datasets, conducive to the analysis of PCA results [25].
The original data matrix X = (xij)m×n was standardized to obtain the standardized data matrix R = (zij)m×n, followed by the Kaiser–Meyer–Olkin (KMO) measure of sampling adequacy and Bartlett’s test of sphericity. Subsequently, the eigenvalue λi of R was calculated as the variance. The eigenvalues were ranked from the largest to the smallest, and the variance and cumulative variance contribution rates were derived. The eigenvectors corresponding to the eigenvalues were used to transform the normalized data into the principal component F.
The number of principal components was determined by the cumulative contribution of the variance or the magnitude of the eigenvalues.
Z i j = x i j x j ¯ σ j
where x i j is the measured value of the indicator, x j ¯ is the mean value of the indicator, σ j is the standard deviation of the jth indicator term, and Z i j is the standardized value.

2.4.3. Non-Parametric Kruskal-Wallis Test

Kruskal-Wallis test was a test method for non-parametric multi-sample comparison in statistics. It was used for the comparison of multiple continuous independent samples. It did not require the normality of the overall probability distribution [26].
Suppose there were m mutually independent simple random samples (X1, …, Xni) (i = 1, …, m). We arranged all of the observations of each sample into a column in increasing order, and Ri (i = 1, …, m) represented the sum of the ranks of ni observations X1, …, Xni of the ith sample in this arrangement. The calculation statistics were as follows:
K = 12 N ( N + 1 ) i = 1 m R i 2 n i 3 ( N + 1 )
If each sample had r identical data, let t1 (i = 1, …, r) be the number of occurrences of the ith public observation of each sample in all N observations, then calculated the following correction statistics
K = N ( N 2 1 ) i = 1 r ( t i 3 t i ) K
When N was sufficiently large, H and H’ approximately obey the distribution, and the degree of freedom v = m − 1.

3. Results

3.1. Time Distribution

By testing the normal distribution of the elements, it was found that the data did not conform to a normal distribution. Therefore, the non-parametric Kruskal–Wallis test was chosen to analyze the inter-seasonal and inter-basin variabilities and to produce box plots to observe the degree of dispersion of the data (shown in Table 3). The results showed that only the test for Pb had a p-value > 0.05 (0.2774). This indicates that there were no significant inter-seasonal fluctuations and Pb concentration may be influenced by natural biogeochemical processes [27]. The p-values of all the remaining elements were less than 0.05, implying that they were significantly different from one season to another.
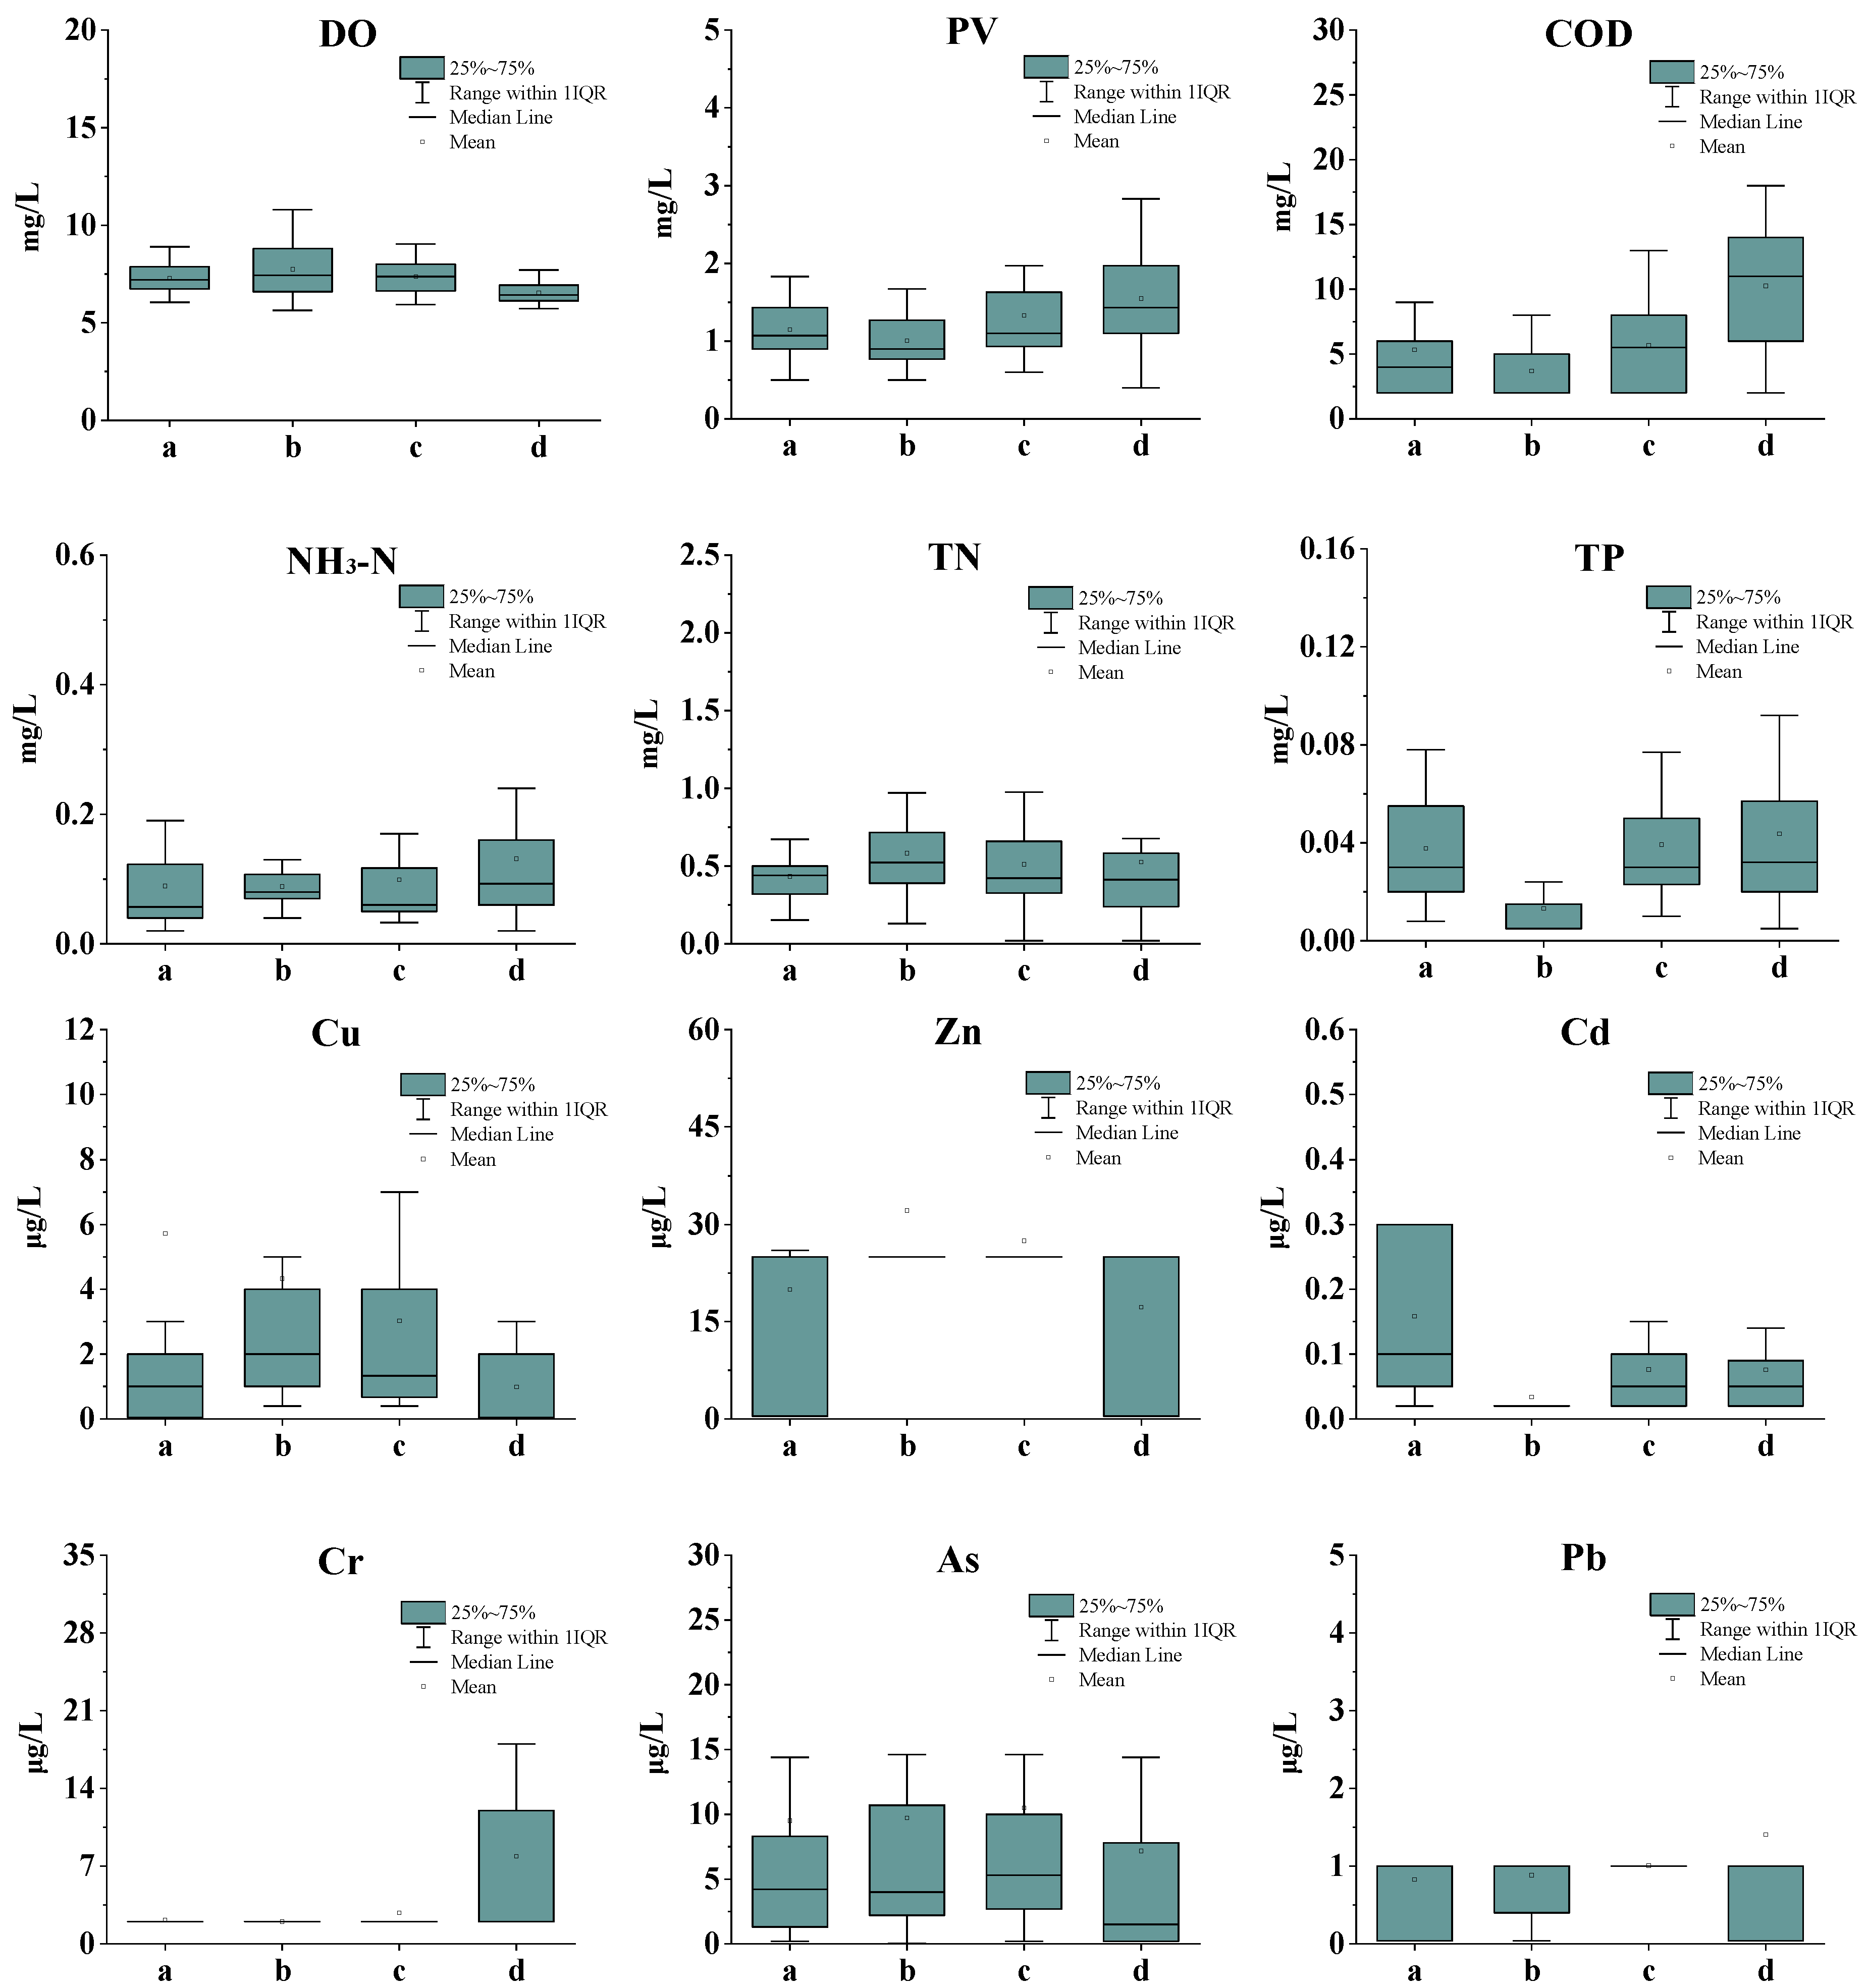
According to Figure 2, the COD, PV, TP, NH3-N, and Cr contents in the surface water during different seasons were in the following order: winter > autumn > spring > summer. Combined with the monthly average precipitation in Figure 3, it is speculated that an increase in summer precipitation may lead to an increase in runoff, resulting in dilution [28]. The DO, TN, and As contents in the surface water during the different seasons were in the following order: winter < autumn < spring < summer. In winter, the rivers in Tibet are icebound, which hinders the gaseous exchange between the atmosphere and rivers, resulting in low DO content. The temperature changes in all four seasons also affect the chemical activity of the elements. In spring, snowmelt starts, and an increase in heavy metal concentrations in the surface water may be influenced by atmospheric deposition [29]. The Zn content in summer and autumn was significantly higher than in winter and spring. This is because, due to the high temperature in summer, Zn is more easily released from sediments [28,30]. In addition, as Cohen’s f values of all elements are <0.1, it can be inferred that the magnitude of the difference between the four seasons is very small.

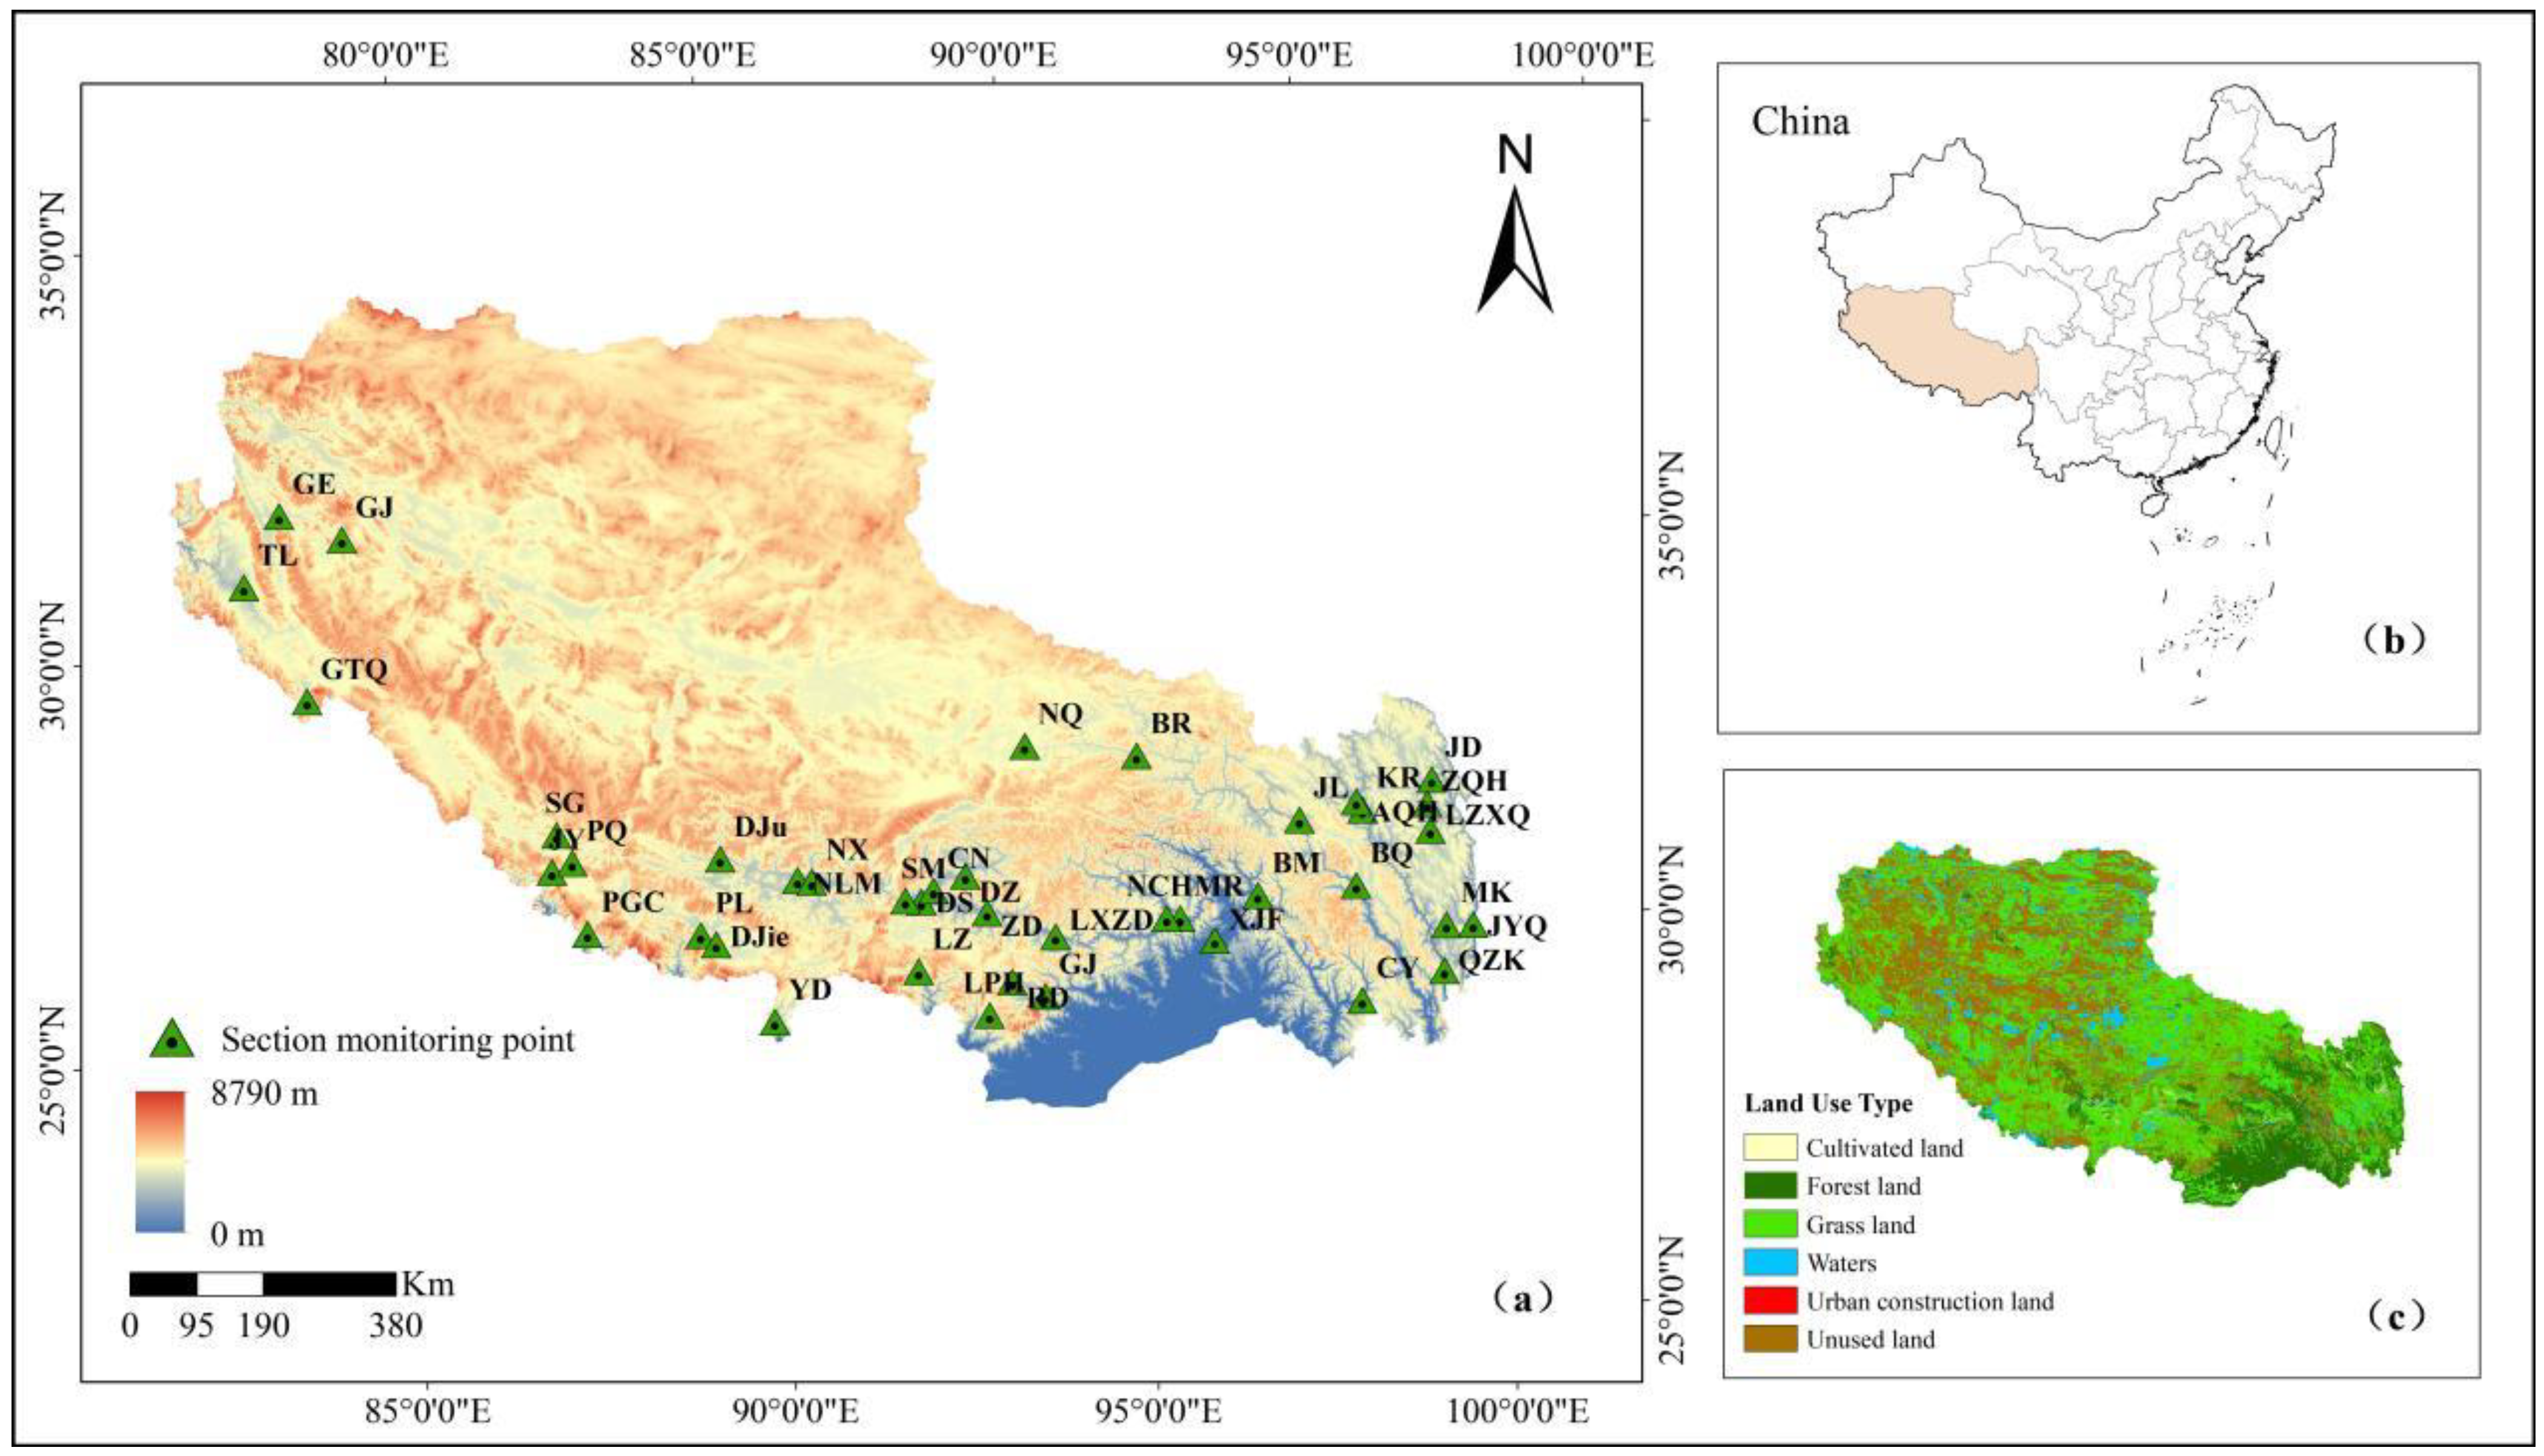
3.2. Spatial Distribution

According to the non-parametric Kruskal–Wallis test, the variables DO, COD, NH3-N, TP, Cd, and Cr with p-values > 0.05 were statistically insignificant. This indicates that there are no significant differences between watersheds, and the magnitude of differences is small. The p-values for PV, TN, Cu, As, Zn, and Pb were <0.05, indicating that there are significant differences between watersheds. This implies that the sources of these elements are relatively complex. Cohen’s f values of the elements were used to infer the magnitude of inter-basin variation, and the inverse distance weighted (IDW) interpolation method of ArcMap 10.2 (Environment System Research Institute, ESRI, Redlands, CA, USA) was used to investigate the internal similarity between the basins and analyze the spatial distribution of the basins.
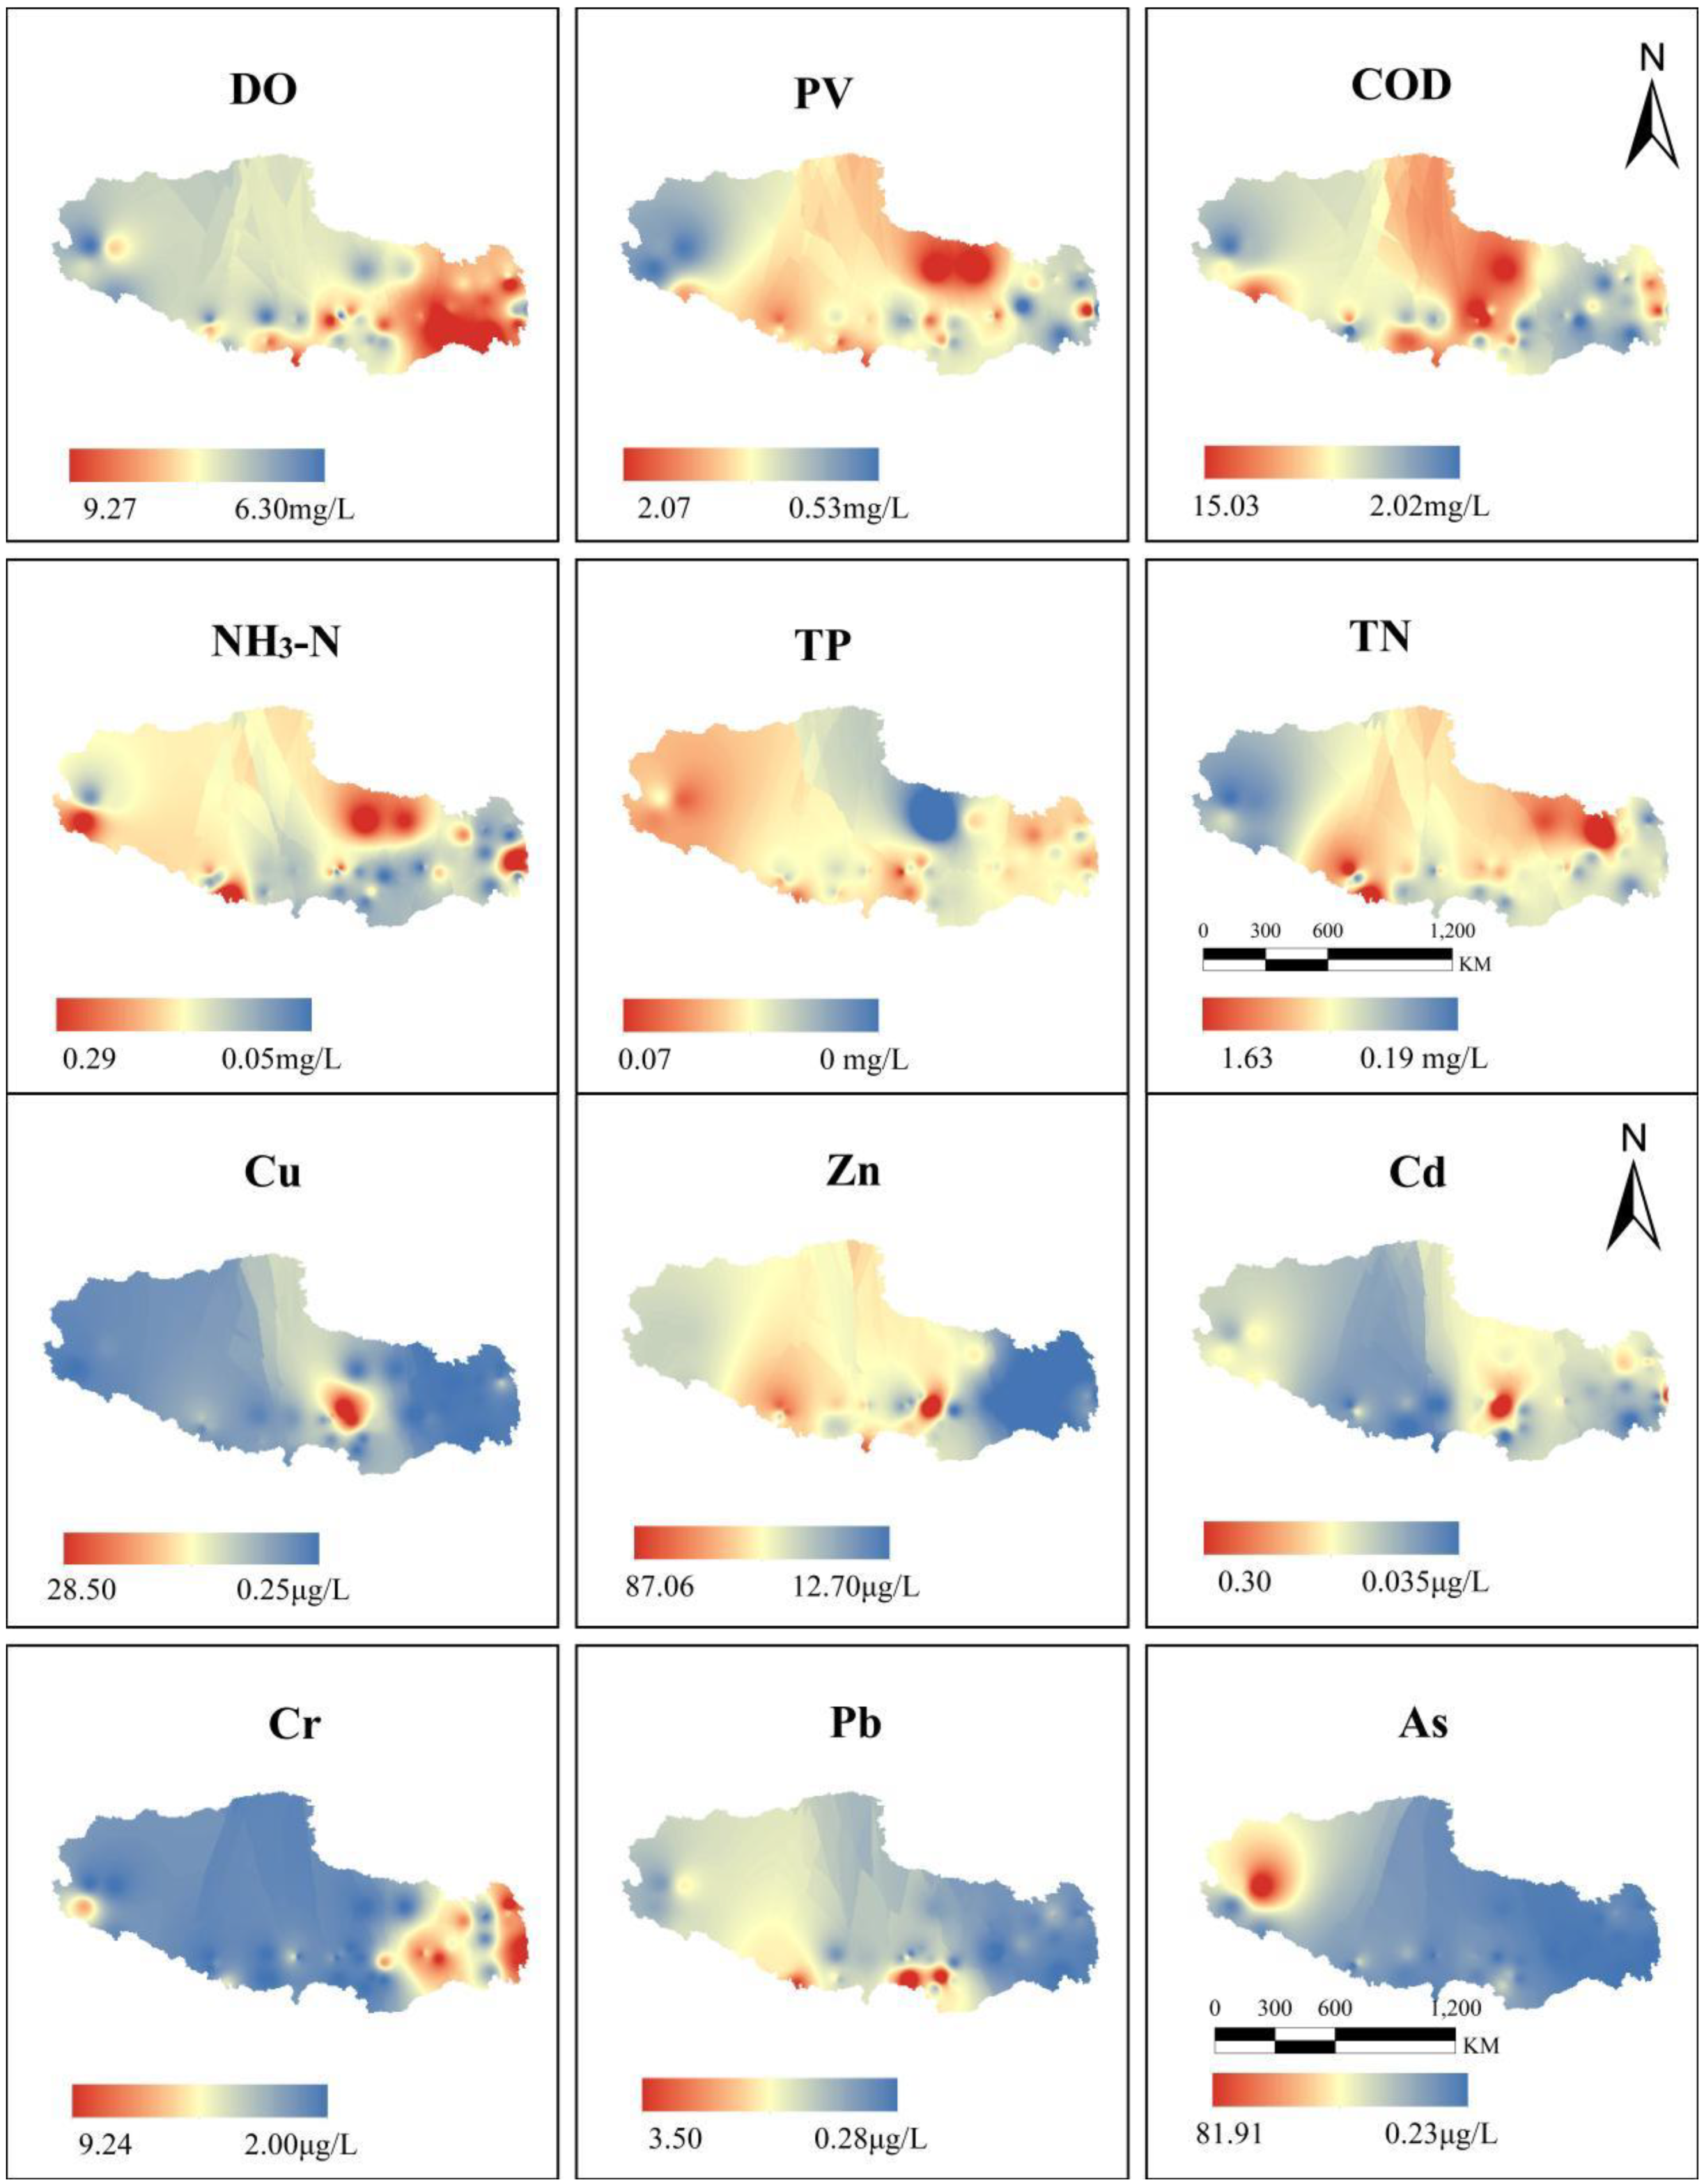
The spatial distribution patterns of NH3-N, PV, COD, and TN were relatively similar (Figure 3) with almost overlapping high-content areas and poor water quality in the central and northern parts due to agricultural fertilizers and pesticides in the central Tibetan valley and biological emissions from livestock farming in northern Tibet. Conversely, TP distribution was lower in the central and northern parts and highest in the western and eastern parts. High TP content in the west may be related to the phosphorus content of the soil-forming parent material, mainly from soil erosion and rock weathering [31]. The eastern part is more urbanized; therefore, the phosphorus present in water bodies may originate from urban wastewater [32]. The DO content increases from west to east. The eutrophication of water bodies depletes DO, affecting the metabolism of aquatic organisms and resulting in the deterioration of the water environment [33]. Cohen’s f value of As was 0.309, indicating the largest variation between watersheds, with content in the range of 0.23–81.91 μg/L. The high-content area is in the western Bangongcuo-Nujiang collision zone. The spatial distribution trend of As is consistent with the analysis result of Zhang et al.’s field sampling in the Yarlung Zangbo River in 2017–2018. Their conclusion is that the upper reaches of Yarlung Zangbo River have comparatively high levels of dissolved As (4.7–81.6 μg/L), while the tributaries of the lower reaches have relatively low levels (0.11–1.3 μg/L) [12]. The Pb content was high in the south of the study area, and the spatial pattern demonstrated a decreasing trend from south to north. The highest content of Zn appears in the south-central direction close to the Tibetan Gondian mineralization zone [34]. The spatial distributions of Cu and Cd were relatively similar. High contents were found in areas with more developed non-ferrous metals. The development of large cities with high population density is relatively fast in the central part. Mineral development and human activities are the main causes of heavy metal enrichment [34].
Further, the significant changes between regions are diluted by water [35], and the complex compounds combined with heavy metals and organics result in the reduction in contents downstream [36].
Collectively, the high contents of nutrient elements, under the influence of chemical fertilizers and pesticides and biological emissions, are mainly concentrated in the agricultural and animal husbandry development areas in central and northern Tibet. Areas with high heavy metal content are mainly those with rich mineral resources, more developed cities, or frequent geological activities.

3.3. Entropy Value Method-Ater Quality Fuzzy Evaluation

The application of the entropy method to determine the weights can weaken the association between samples, eliminate human interference, and make the evaluation results more scientific and accurate [37,38]. From the weight information matrix in Table 4, Cu has the largest index weight, accounting for 19.3%, and TP has the smallest index weight, accounting for only 0.8%. The set of weights can be represented as W {0.0036, 0.056, 0.121, 0.008, 0.051, 0.17, 0.013, 0.17, 0.081, 0.193, 0.082, 0.019}.
The water quality fuzzy evaluation was performed according to the water quality standard of the Environmental Quality Standards in Surface Water (GB3838-2002) [39]. Forty-one monitoring sections were selected as water quality evaluation sets. DO, PV, COD, NH3-N, TP, TN, Cu, Zn, As, Cd, Cr, and Pb were selected as evaluation factors, and the evaluation categories were I, II, III, IV, and V. Subsequently, the water quality category of the monitoring section was determined according to the maximum affiliation [40].
According to Table 5, the nutrient and heavy metal contents in the surface water in Tibet are low, and most areas have a higher content than at the level of surface water category III. The water quality of 41 cross-sections in the Tibet Autonomous Region was evaluated as category I. Monitoring point JYQ comes under categories IV and V, and the percentage of water quality IV at monitoring point GJ reaches 10.9%, which indicates that both sections are slightly affected by pollutants [41]. The Exceedance factor of the GJ monitoring point is As, and according to the previous analysis, there are significant seasonal and regional differences in As contents. The As content in water is mainly controlled by lithology, and the shale that is rich in As is widely distributed in Qinghai-Tibet Plateau [42,43,44].
In general, the water quality in most areas of Tibet is relatively good as per the national sanitary standards for drinking water; some indicators even exceed the standards for drinking mineral water in China. Local exceedance factors are mainly affected by agricultural production and geological and geothermal activities.

3.4. Analysis of Pollution Sources

The correlation between the concentrations of water quality indicators can help to analyze the interactions among indicators in the water body, as well as the possibility of homology among indicators or the relationship between migration and transformation processes. Table 6 shows the correlation between the physicochemical parameters of water and water quality elements. DO, TN, Zn, As, and Pb showed significant negative correlations with water temperature (WT). With an increase in WT, the increase in biological activity reduces the nutrient element index, and the adsorption of metal elements by sediment significantly reduces their content. Similar correlations have been observed in the source area of the Yellow River and the Yarlung Zangbo River on the Qinghai Tibet Plateau [45]. Additionally, DO, TN, Zn, Pb, and NH3-N also showed significant negative correlations with precipitation. The increase in runoff due to the increase in summer precipitation, results in a dilution effect [25]. The water with low concentration of these elements diluted the river water. This conclusion is consistent with that of the previous studies. On the contrary, Cd has a significant positive correlation with WT and precipitation. Due to the high content of Cd pollutants in aerosols and surface soil of the watershed, affected by the increase in precipitation, Cd was transported to the river channel. In the case of Cd and Cu, pH had significant negative correlations, indicating that Cd and Cu are more easily dissolved in weakly acidic conditions [46]. Alkaline river water may facilitate the uptake and oxidation of dissolved heavy metals [47]. DO, NH3-N, TN showed significant positive correlation with pH, indicating that the local water quality was good. The coupling effect of pH and dissolved oxygen in the water column of Erhai Lake on nitrogen release shows that when the water quality starts to deteriorate, the pH value shows an upward trend (8.48–8.87), while the DO concentration shows a downward trend (7.42–6.61 mg/L), and the TN concentration increases significantly [48]. COD and Zn had a significant positive correlation with turbidity. Conductivity was significantly correlated only with NH3-N. The relatively weak correlation between Cr in heavy metals and the physicochemical parameters of water implies that it is more influenced by human activities. The results of the correlation analysis can provide information regarding the sources of nutrients and metal elements, which is helpful in the subsequent determination of the sources of major pollutants.
As shown in Table 7, PV–NH3-N–TP, Zn–Cu–Cd, and Zn–Pb were significantly positively correlated (p < 0.01). Table 7 shows a significant negative correlation between Cr and Zn. However, there were significant correlations between Cr and PV, COD, NH3-N, TP, and TN, implying that the source of Cr is relatively similar to that of the nutrient elements. The correlations between As and all the other elements were weak, indicating that their sources might be specific.
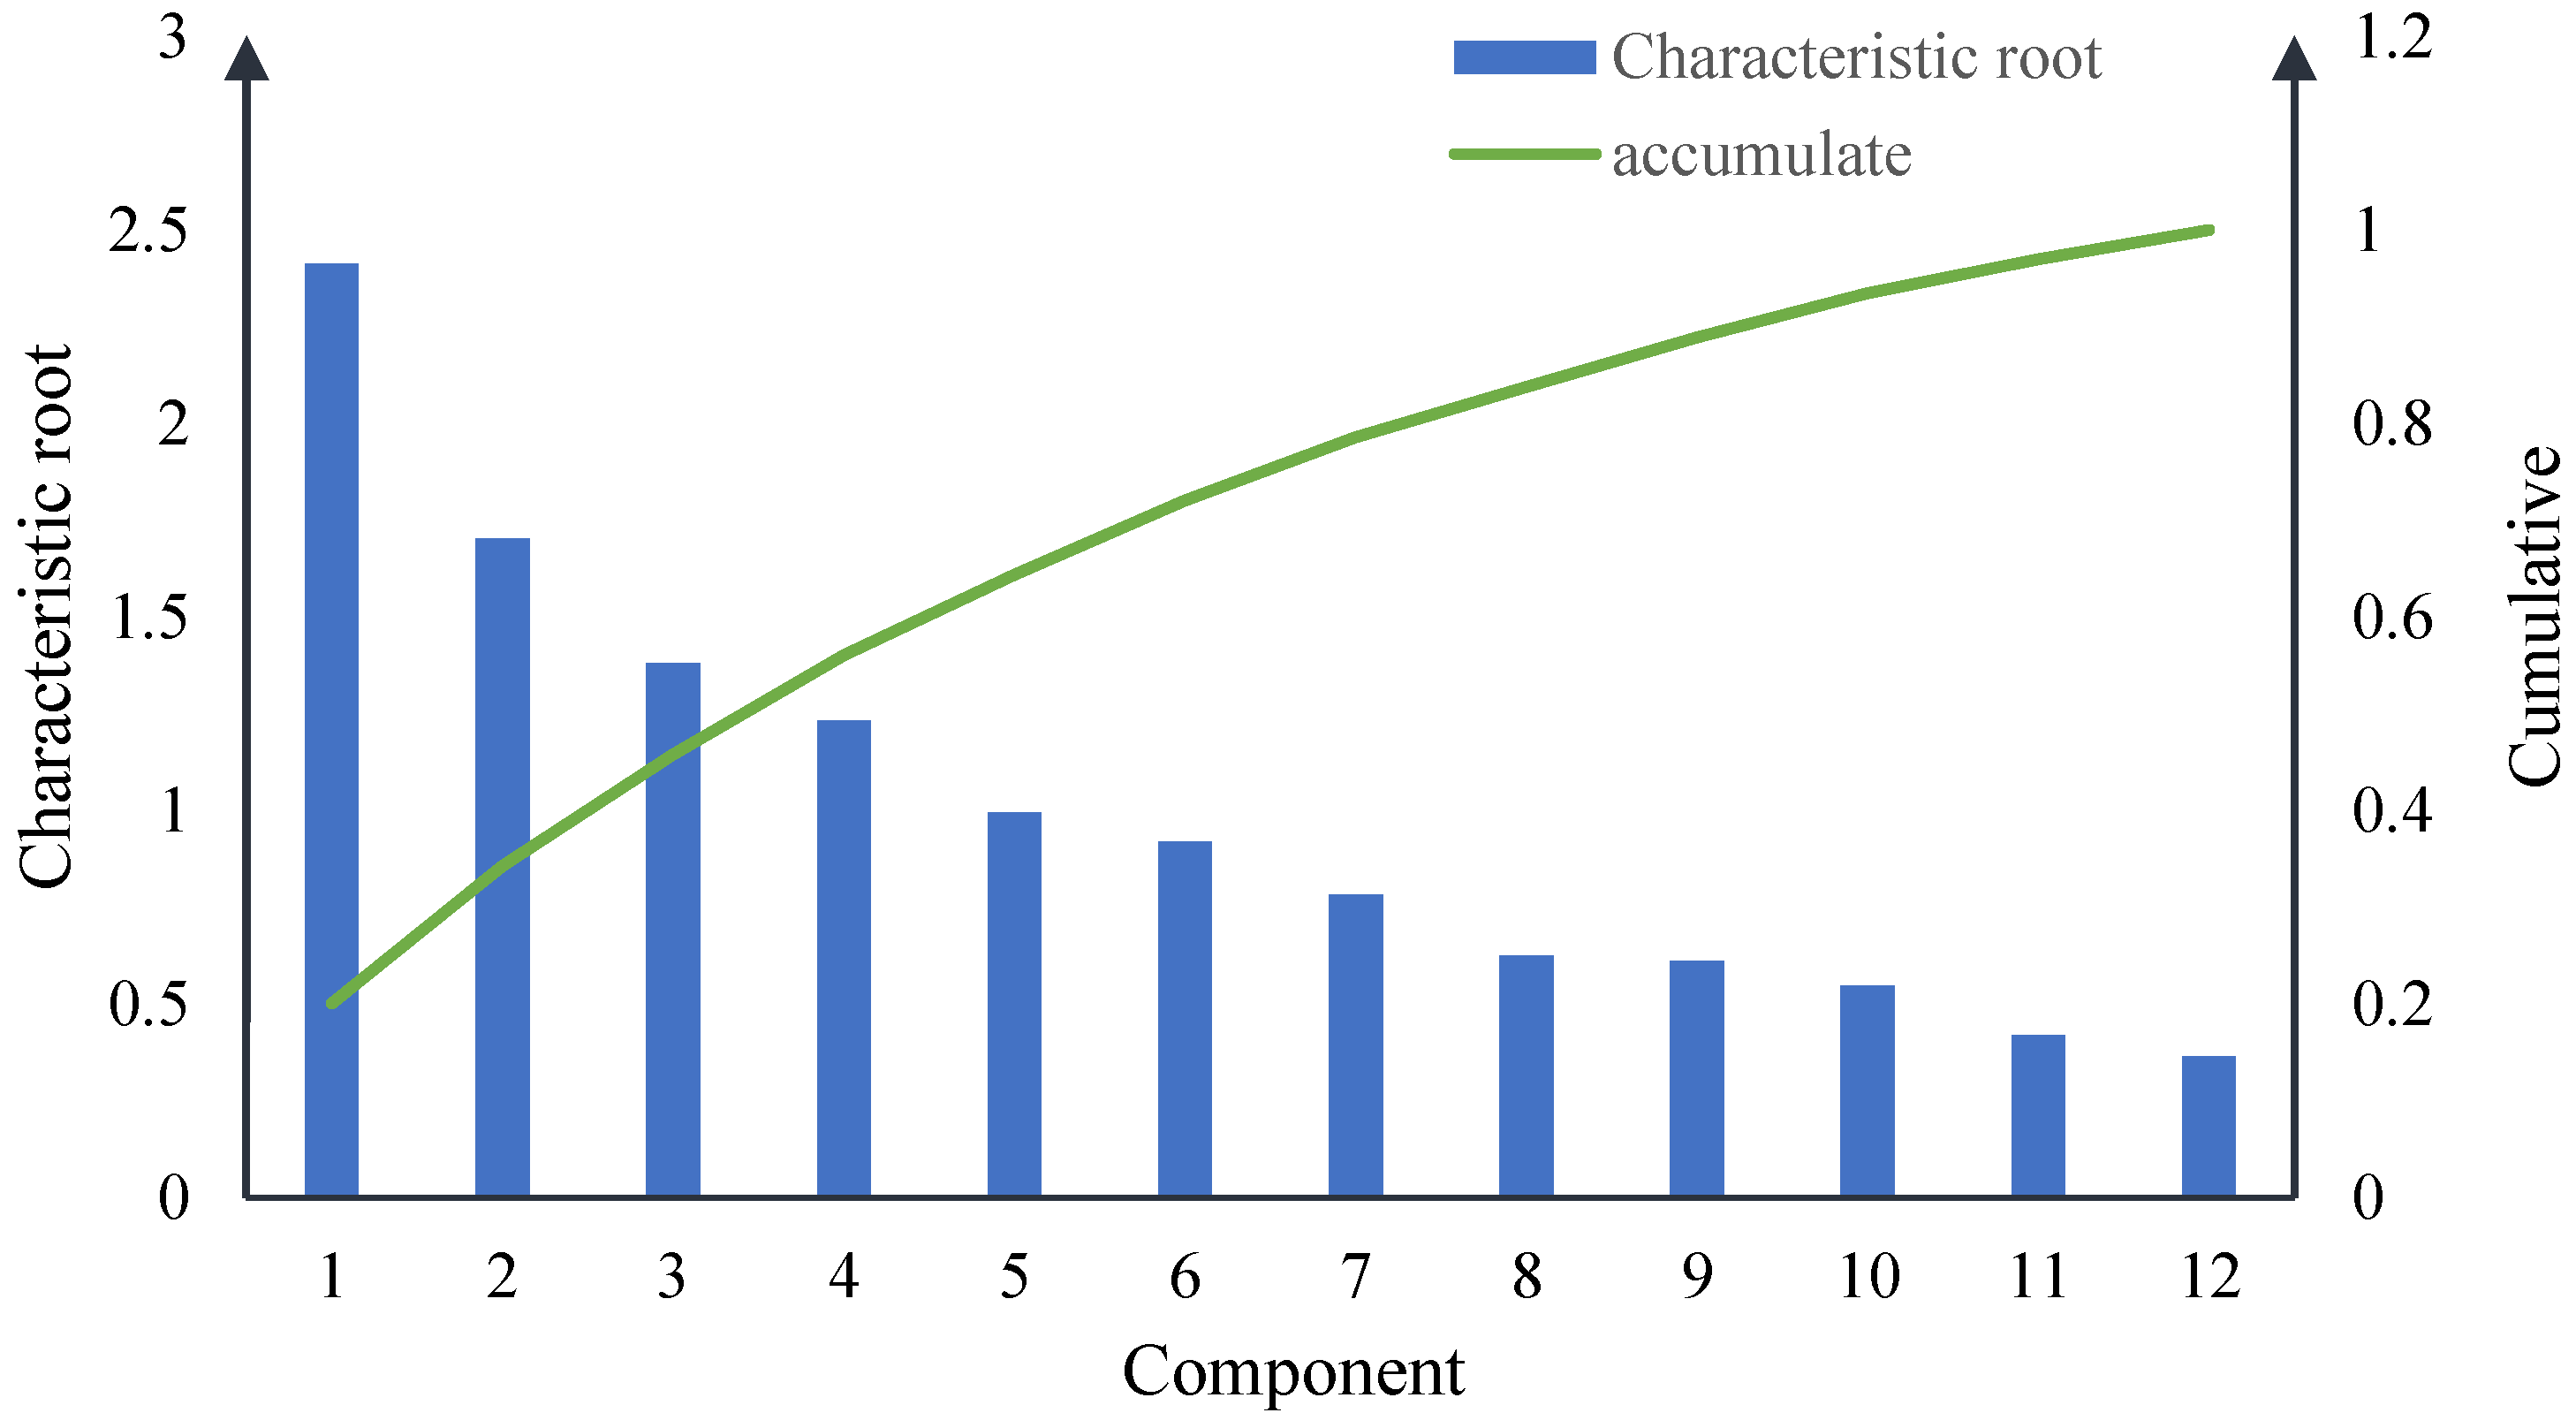
PCA was conducted to determine the sources of nutrients and heavy metals, and the results are shown in Table 8. The data were first subjected to the KMO and Bartlett’s tests to analyze the feasibility of PCA. KMO was calculated as 0.603. The p-value of Bartlett’s spherical test was <0.01, showing significance at the level. The variables were correlated, indicating that the PCA was valid. Figure 4 shows the explanation of variance by the normalized rotation obtained using the maximum variance method for nutrients and heavy metals elements [49]. Four effective principal components were identified according to the Kaiser criterion, with eigenvalues > 1 [50], which accounted for up to 56.08% of the contribution.
The first principal component (PC1) pollutants were mainly Cr, TP, PV, COD, and NH3-N, which accounted for 20.1% of the total variance. Table 7 shows that there were significant correlations between Cr and TP, PV, COD, and NH3-N, all of which showed positive loadings indicating that the nutrient elements had the same source as Cr. Figure 4 shows that none of the five elements had significant spatial differences, indicating that these elements were mainly influenced by natural processes. Additionally, the increase in Cr content may be related to industrial activities and domestic waste emissions [51,52]. The pollutants in the second principal component (PC2) were mainly Zn, Cu, Pb, and Cd. The correlation coefficient between Zn and PC2 was high at 0.656, and there was also a significant correlation between Zn and Cu, Pb, and Cd, indicating that these heavy metals may have the same source and similar diffusion processes. The spatial distribution map of metal elements shows that, under the influence of the Gondwana mineralization belt, the mineral resources of Cu, Pb, and Zn are abundant [34]. The high Zn, Cu, and Pb contents can be attributed to geothermal activities and mineral extractions [53]. The pollutants in the third principal component (PC3) were mainly TN and NH3-N, with a component variance contribution of 11.5%. The N and P in surface water are mainly from farmland water and municipal wastewater [54]. The NH3-N and TN were highly correlated, reflecting the nutrient status of water bodies. The increase in NH3-N and TN may be due to the rapid development of urbanization and agriculture, human production and life, and the application of pesticides and fertilizers [55]. PC3 represents the source of the agricultural activities. The fourth principal component (PC4) pollutant was mainly Cd, which is likely to be influenced by transportation or industrial activities. Fossil fuels and metallurgical industries release volatile Cd, which is then dissolved in surface water [56]. Table 3 shows no significant spatial difference for Cd, which is known to be relatively weakly influenced by anthropogenic activities.
According to the results of multivariate statistical analysis, PC1 pollutants (Cr, TP, PV, COD, and NH3-N) are mainly influenced by natural processes, PC2 pollutants mainly arise from mineral extractions, PC3 (TN and NH3-N) mainly arise from production activities and pesticides and fertilizers, and PC4 (Cd) is mainly influenced by transportation or industry. Therefore, the elemental indicators in Tibetan surface water are influenced by natural factors, and human activities aggravate the spread of pollution.

4. Discussion

In this study, the non-parametric Kruskal–Wallis test, production of box line plots, and IDW method to map the spatial distribution of pollution elements were used to explore the spatial and temporal distribution characteristics of pollution elements. Temporally, the results showed that only the test for Pb had a p-value > 0.05 (0.2774), this indicates that there were no significant inter-seasonal fluctuations. Moreover, the rest polluting elements had significant seasonal differences under the influence of temperature and runoff, but the magnitude of the differences was very small. Spatially, the p-values of PV, TN, Cu, Zn, As, and Pb were <0.05, with significant results, indicating significant differences among the watersheds. Nutrient elements are mainly influenced by natural processes, partly under the influence of fertilizers and pesticides, and are mainly concentrated in the agricultural and animal husbandry development areas in Tibet. High heavy metal contents are mainly found in areas rich in mineral resources and in areas of frequent geological activities. Subsequently, the weights determined by the combination of entropy value and fuzzy evaluation methods were used to evaluate the water quality, and the results were compared with the water quality standards according to the Surface Water Environmental Quality Standard (GB3838-2002). We found that the contents of nutrient and heavy metal elements in the surface water of the Tibet Autonomous Region were low, and the water quality evaluation of 41 cross-section monitoring points in the study area were all Class I. At GJ monitoring point, As exceeded the standard more remarkably from lithology and geological activities. Finally, the potential sources of pollutants were analyzed based on correlation analysis and PCA, which explained 56.08% of the total variance of the five pollution principal components and identified four pollution principal components. PC1 is mainly influenced by natural processes, PC2 can be attributed to geothermal activities and mineral extractions, PC3 arises from human production activities and the application pesticides and fertilizers, and PC4 is influenced by industrialization or transportation.
In summary, the NH3-N, PV, COD, and TN contents are mainly influenced by natural processes, partly under the influence of fertilizers, pesticides, and biological emissions. High contents are mainly concentrated in the agricultural and animal husbandry development areas in central and northern Tibet. However, TP may be related to the phosphorus content of the soil-forming parent material and urban wastewater discharge and has the greatest magnitude of inter-basin variation under the influence of the Bangongcuo-Nujiang collision zone. The area with high Zn and Pb contents was located close to the Gangdise metallogenic belt in Tibet, which is mainly affected by mineral development and geological activities. Cu and Cd are mainly attributed to the development of non-ferrous metal minerals and human activities.
Currently, the surface water bodies in the Tibet Autonomous Region are less affected by human activities, and the degree of organic matter and heavy metal pollution is weak and at a low-risk level. The spatial heterogeneity of heavy metals increased and was significantly affected by human activities, and the potential risks might exceed our expectations. This is evidenced by the increasing influence of human activities on water quality deterioration. In the future, considering Tibet’s fragile ecological environment and unique geographical location, the security of water resources in Tibet will face an increasingly complex situation. At the same time, the pollution sources of nutrients and heavy metals will shift from being influenced by single factors to being influenced by multiple factors and from natural causes to human causes. This study analyzed the spatial and temporal distribution characteristics of six nutrient elements and six heavy metal elements in the Tibet Autonomous Region in 2021, and further health risk evaluation can be performed subsequently. At present, it is urgent to improve the local water resource management level, and focusing on water resource security is of great strategic importance.

5. Conclusions

Based on the water quality data of Tibetan rivers in China, this study analyzed the temporal and spatial changes in surface water nutrients and heavy metals, water quality status and pollutant sources, and drew the following four conclusions:
  • Temporally, all 12 polluting elements, except Pb, had significant seasonal variations, but the magnitude of the differences was very small;
  • Spatially, nutrient elements were relatively concentrated in the agricultural and pastoral development areas in central and northern Tibet. High heavy metal content was mainly found in areas with rich mineral resources, more developed cities, or areas undergoing frequent geological activities;
  • The water quality of 41 monitoring sections belonged to Class I water standard as per the entropy method–fuzzy evaluation method, and the local exceedance factors were mainly affected by agricultural production activities and geological and geothermal activities;
  • Determine the main sources of four pollutants: the first principal component was mainly influenced by natural processes, the second principal component was mainly influenced by mineral extraction, the third principal component was mainly influenced by production activities and pesticides and fertilizers, and the fourth principal component was mainly influenced by transportation or industrial activities.
The results of this study can provide a scientific basis for pollution prevention and control in the Tibet Autonomous Region, and contribute to further research on water ecology and the environment.

Author Contributions

Conceptualization, J.H.; Data curation, J.H.; Methodology, J.H.; Supervision, J.Z., Y.S. and X.C.; Visualization, J.H.; Writing—Original draft, J.H.; Writing—Review & editing, J.Z. and Y.S. All authors have read and agreed to the published version of the manuscript.

Funding

This research was funded by the National Key R&D Program of China (2017YFC0406004) and the NSFC (41271004).

Informed Consent Statement

Not applicable.

Data Availability Statement

Data inquiries can be directed to the author.

Acknowledgments

We are grateful to the teachers and students who participated in the field collection of data.

Conflicts of Interest

The authors declare no conflict of interest.

References

  1. Chen, W. Hydrologic Characteristics and Mathematical Simulation of the Qinghai-Tibet Plateau; Science Press: Beijing, China, 2016. [Google Scholar]
  2. Wang, J.; Liu, G.; Liu, H.; Lam, P.K.S. Multivariate Statistical Evaluation of Dissolved Trace Elements and a Water Quality Assessment in the Middle Reaches of Huaihe River, Anhui, China. Sci. Total Environ. 2017, 583, 421–443. [Google Scholar] [CrossRef] [PubMed]
  3. He, J.; Shi, D.; Wang, B.B.; Feng, C.L.; Su, H.L.; Wang, Y.; Qing, N. Ecological risk and water quality standard evaluation of 10 typical heavy metals in eight river basins. China Environ. Sci. 2019, 39, 2970–2982. [Google Scholar]
  4. Zhu, Q.Q.; Wang, Z.L. Distribution characteristics and sources of heavy metals in sediments of major river systems in china. Earth Environ. 2012, 40, 305–313. [Google Scholar]
  5. He, X.L.; Wu, Y.H.; Zhou, J.; Bing, H.J. Chemical Characteristics of Surface Water and Assessment of Water Environment Quality in Gongga Mountain Area. Environ. Sci. 2016, 37, 3798–3805. [Google Scholar]
  6. Chen, Z.Y.; Wang, S.; Zhao, Y.Y. Characteristics of Heavy Metals in Soils and River Sediments of the Dobuza Copper Deposit in Tibet and Their Environmental Significance. J. Earth Sci. Environ. 2020, 42, 376–393. [Google Scholar]
  7. Yang, R.Q.; Yao, T.D.; Xu, B.Q.; Jiang, G.B.; Xin, X.D. Accumulation Features of Organochlorine Pesticides and Heavy Metals in Fish from High Mountain Lakes and Lhasa River in the Tibetan Plateau. Environ. Int. 2007, 33, 151–156. [Google Scholar] [CrossRef]
  8. Bayram, A.; Önsoy, H.; Kömürcü, M.İ.; Tüfekçi, M. Reciprocal Influence of Kürtün Dam and Wastewaters from the Settlements on Water Quality in the Stream Harşit, NE Turkey. Environ. Earth Sci. 2014, 72, 2849–2860. [Google Scholar] [CrossRef]
  9. Vörösmarty, C.J.; McIntyre, P.B.; Gessner, M.O.; Dudgeon, D.; Prusevich, A.; Green, P.; Glidden, S.; Bunn, S.E.; Sullivan, C.A.; Liermann, C.R.; et al. Global Threats to Human Water Security and River Biodiversity. Nature 2010, 467, 555–561. [Google Scholar] [CrossRef] [Green Version]
  10. Yu, C.; Hua, K.; Huang, C.-S.; Jin, H.; Sun, Y.; Yu, Z. Spatiotemporal Characteristics of Arsenic and Lead with Seasonal Freeze-Thaw Cycles in the Source Area of the Yellow River Tibet Plateau, China. J. Hydrol. Reg. Stud. 2022, 44, 101210. [Google Scholar] [CrossRef]
  11. Radfard, M.; Yunesian, M.; Nabizadeh, R.; Biglari, H.; Nazmara, S.; Hadi, M.; Yousefi, N.; Yousefi, M.; Abbasnia, A.; Mahvi, A.H. Drinking Water Quality and Arsenic Health Risk Assessment in Sistan and Baluchestan, Southeastern Province, Iran. Hum. Ecol. Risk Assess. Int. J. 2019, 25, 949–965. [Google Scholar] [CrossRef]
  12. Zhang, J.W.; Yan, Y.N.; Zhao, Z.Q.; Li, X.D.; Guo, J.Y.; Hu, D.; Cui, L.F.; Meng, J.L.; Liu, C.Q. Spatial and Seasonal Variations of Dissolved Arsenic in the Yarlung Tsangpo River, Southern Tibetan Plateau. Sci. Total Environ. 2021, 760, 143416. [Google Scholar] [CrossRef] [PubMed]
  13. Wang, C.; Zhou, H.; Kuang, X.; Hao, Y.; Shan, J.; Chen, J.; Li, L.; Feng, Y.; Zou, Y.; Zheng, Y. Water Quality and Health Risk Assessment of the Water Bodies in the Yamdrok-Tso Basin, Southern Tibetan Plateau. J. Environ. Manag. 2021, 300, 113740. [Google Scholar] [CrossRef] [PubMed]
  14. Zhang, Z.; Li, Y.; Wang, X.; Li, H.; Zheng, F.; Liao, Y.; Tang, N.; Chen, G.; Yang, C. Assessment of River Health Based on a Novel Multidimensional Similarity Cloud Model in the Lhasa River, Qinghai-Tibet Plateau. J. Hydrol. 2021, 603, 127100. [Google Scholar] [CrossRef]
  15. Wang, X.P.; Liu, X.J.; Wang, L.Q.; Yang, J.; Wan, X.M.; Liang, T. A Holistic Assessment of Spatiotemporal Variation, Driving Factors, and Risks Influencing River Water Quality in the Northeastern Qinghai-Tibet Plateau. Sci. Total Environ. 2022, 851, 157942. [Google Scholar] [CrossRef] [PubMed]
  16. Mahammad, S.; Islam, A.; Shit, P.K. Geospatial Assessment of Groundwater Quality Using Entropy-Based Irrigation Water Quality Index and Heavy Metal Pollution Indices. Environ. Sci. Pollut. Res. 2022, 1, 1–24. [Google Scholar] [CrossRef] [PubMed]
  17. Zou, Z.H.; Yun, Y.; Sun, J.N. Entropy Method for Determination of Weight of Evaluating Indicators in Fuzzy Synthetic Evaluation for Water Quality Assessment. J. Environ. Sci. 2006, 18, 1020–1023. [Google Scholar] [CrossRef]
  18. Zhong, C.; Yang, Q.; Liang, J.; Ma, H. Fuzzy Comprehensive Evaluation with AHP and Entropy Methods and Health Risk Assessment of Groundwater in Yinchuan Basin, Northwest China. Environ. Res. 2022, 204, 111956. [Google Scholar] [CrossRef]
  19. Environmental Monitoring of China. Available online: http://www.cnemc.cn/sssj/ (accessed on 12 November 2022).
  20. Han, B.; Liu, H.; Wang, R. Urban Ecological Security Assessment for Cities in the Beijing–Tianjin–Hebei Metropolitan Region Based on Fuzzy and Entropy Methods. Ecol. Model. 2015, 318, 217–225. [Google Scholar] [CrossRef]
  21. Chen, S.Z.; Wang, X.J.; Zhao, X.J. An Attribute Recognition Model Based on Entropy Weight for Evaluating the Quality of Groundwater Sources. J. China Univ. Min. Technol. 2008, 18, 72–75. [Google Scholar] [CrossRef]
  22. Chen, M.X.; Lu, D.D.; Zhang, H. Comprehensive Measurement of China’s Urbanization Level and Its Dynamic Factor Analysis. J. Geogr. 2009, 64, 387–398. [Google Scholar]
  23. Zhang, X.; Wang, C.; Li, E.; Xu, C. Assessment Model of Ecoenvironmental Vulnerability Based on Improved Entropy Weight Method. Sci. World J. 2014, 2014, 797–814. [Google Scholar] [CrossRef] [PubMed] [Green Version]
  24. Icaga, Y. Fuzzy Evaluation of Water Quality Classification. Ecol. Indic. 2007, 7, 710–718. [Google Scholar] [CrossRef]
  25. Mohiuddin, K.M.; Otomo, K.; Ogawa, Y.; Shikazono, N. Seasonal and Spatial Distribution of Trace Elements in the Water and Sediments of the Tsurumi River in Japan. Environ. Monit. Assess. 2012, 184, 265–279. [Google Scholar] [CrossRef] [PubMed]
  26. Zhou, G.R. Dictionary of Applied Statistical Methods; China Statistics Press: Beijing, China, 1993. [Google Scholar]
  27. Mao, G.; Zhao, Y.; Zhang, F.; Liu, J.; Huang, X. Spatiotemporal Variability of Heavy Metals and Identification of Potential Source Tracers in the Surface Water of the Lhasa River Basin. Environ. Sci. Pollut. Res. 2019, 26, 7442–7452. [Google Scholar] [CrossRef]
  28. Huang, X.; Sillanpää, M.; Duo, B.; Gjessing, E.T. Water Quality in the Tibetan Plateau: Metal Contents of Four Selected Rivers. Environ. Pollut. 2008, 156, 270–277. [Google Scholar] [CrossRef]
  29. Warnken, K.W.; Santschi, P.H. Delivery of Trace Metals (Al, Fe, Mn, V, Co, Ni, Cu, Cd, Ag, Pb) from the Trinity River Watershed Towards the Ocean. Estuaries Coasts 2009, 32, 158–172. [Google Scholar] [CrossRef]
  30. Tian, Y.; Zha, X.; Gao, X.; Yu, C. Geochemical Characteristics and Source Apportionment of Toxic Elements in the Tethys–Himalaya Tectonic Domain, Tibet, China. Sci. Total Environ. 2022, 831, 154863. [Google Scholar] [CrossRef]
  31. Chu, X.; Wu, D.; Wang, H.; Zheng, F.; Huang, C.; Hu, L. Spatial Distribution Characteristics and Risk Assessment of Nutrient Elements and Heavy Metals in the Ganjiang River Basin. Water 2021, 13, 3367. [Google Scholar] [CrossRef]
  32. Zhang, W.; Jin, X.; Liu, D.; Lang, C.; Shan, B. Temporal and Spatial Variation of Nitrogen and Phosphorus and Eutrophication Assessment for a Typical Arid River—Fuyang River in Northern China. J. Environ. Sci. 2017, 55, 41–48. [Google Scholar] [CrossRef]
  33. Zhang, Y. Overview of Mineral Resources in Tibet. Tibet. Sci. Technol. 2005, 6, 33–34. [Google Scholar]
  34. Du, H.L.; Wang, Y.; Wang, J.S.; Yao, Y.B.; Zhou, Y.; Liu, X.Y.; Lu, Y.L. Distribution characteristics and ecological risk assessment of heavy metals in soils of typical watershed of Qinghai-Tibet Plateau. Environ. Sci. 2021, 42, 4422–4431. [Google Scholar]
  35. Decena, S.C.P.; Arguilles, M.S.; Robel, L.L. Assessing Heavy Metal Contamination in Surface Sediments in an Urban River in the Philippines. Pol. J. Environ. Stud. 2018, 27, 1983–1995. [Google Scholar] [CrossRef]
  36. Akele, M.L.; Kelderman, P.; Koning, C.W.; Irvine, K. Trace Metal Distributions in the Sediments of the Little Akaki River, Addis Ababa, Ethiopia. Environ. Monit. Assess. 2016, 188, 389. [Google Scholar] [CrossRef] [PubMed]
  37. Zhang, J.; Shu, L.C.; Zhang, C.; Li, X.; Ji, Y.F.; Ma, C.Q. Application of comprehensive index method based on entropy weight in groundwater quality evaluation. Hydropower Energy Sci. 2010, 28, 30–32. [Google Scholar]
  38. Zou, Z.H.; Sun, J.N.; Ren, G. Entropy Weighting Method for Fuzzy Evaluation Factor and Its Application in Water Quality Assessment. J. Environ. Sci. 2005, 2005, 552–556. [Google Scholar]
  39. GB3838-2002; Environmental Quality Standards For Surface Water. Ministry of Ecology and Environment of the People’s Republic of China: Beijing, China, 2002.
  40. Wang, X.M.; Li, W.Y.; Zhou, Y.; Jing, X.Y.; Chen, S. Evaluation of surface water quality based on Stochastic Forest and fuzzy comprehensive evaluation. Water Supply Drain. 2022, 58, 128–132. [Google Scholar]
  41. Hou, Y.H.; Dawa, Z.M.; Chen, G.H. Current situation and application countermeasure of chemical fertilizer in Tibet. Tibet Agric. Sci. Technol. 2010, 32, 43–46. [Google Scholar]
  42. Yao, Q.-Z.; Zhang, J.; Wu, Y.; Xiong, H. Hydrochemical Processes Controlling Arsenic and Selenium in the Changjiang River (Yangtze River) System. Sci. Total Environ. 2007, 377, 93–104. [Google Scholar] [CrossRef]
  43. Bo, J.K.; Li, C.L.; Kang, S.C.; Wang, J.L.; Chen, P.F. Distribution Characteristics of Dissolved Elements and Water Quality Assessment in Three Typical Rivers of Yarlung Zangbo River Basin. Environ. Chem. 2014, 33, 2206–2207. [Google Scholar]
  44. Li, C.; Kang, S.; Zhang, Q.; Wang, F. Rare Earth Elements in the Surface Sediments of the Yarlung Tsangbo (Upper Brahmaputra River) Sediments, Southern Tibetan Plateau. Quat. Int. 2009, 208, 151–157. [Google Scholar] [CrossRef]
  45. Li, Z.; Liu, J.; Chen, H.; Li, Q.; Yu, C.; Huang, X.; Guo, H. Water Environment in the Tibetan Plateau: Heavy Metal Distribution Analysis of Surface Sediments in the Yarlung Tsangpo River Basin. Environ. Geochem. Health 2020, 42, 2451–2469. [Google Scholar] [CrossRef] [PubMed]
  46. Liang, B.; Han, G.; Zeng, J.; Qu, R.; Liu, M.; Liu, J. Spatial Variation and Source of Dissolved Heavy Metals in the Lancangjiang River, Southwest China. Int. J. Environ. Res. Public Health 2020, 17, 732. [Google Scholar] [CrossRef]
  47. Shiller, A.M.; Boyle, E. Dissolved Zinc in Rivers. Nature 1985, 317, 49–52. [Google Scholar] [CrossRef]
  48. Zhang, L.; Wang, S.; Wu, Z. Coupling Effect of PH and Dissolved Oxygen in Water Column on Nitrogen Release at Water–Sediment Interface of Erhai Lake, China. Estuar. Coast. Shelf Sci. 2014, 149, 178–186. [Google Scholar] [CrossRef]
  49. Vega, M.; Pardo, R.; Barrado, E.; Debán, L. Assessment of Seasonal and Polluting Effects on the Quality of River Water by Exploratory Data Analysis. Water Res. 1998, 32, 3581–3592. [Google Scholar] [CrossRef]
  50. Kaiser, H.F. The Application of Electronic Computers to Factor Analysis. Educ. Psychol. Meas. 1960, 20, 141–151. [Google Scholar] [CrossRef]
  51. Simeonov, V.; Stratis, J.A.; Samara, C.; Zachariadis, G.; Voutsa, D.; Anthemidis, A.; Sofoniou, M.; Kouimtzis, T. Assessment of the Surface Water Quality in Northern Greece. Water Res. 2003, 37, 4119–4124. [Google Scholar] [CrossRef]
  52. Kahn, A.H.; Nolting, R.F.; Van der Gaast, S.J. Trace Element Geochemistry at the Sediment-Water Interface in the North Sea and the Western Wadden Sea; BEON Report, 0924-6576; Netherlands Institute for Sea Research: Den Burg, The Netherlands, 1992. [Google Scholar]
  53. Duan, J.; Tang, J.; Lin, B. Zinc and Lead Isotope Signatures of the Zhaxikang PbZn Deposit, South Tibet: Implications for the Source of the Ore-Forming Metals. Ore Geol. Rev. 2016, 78, 58–68. [Google Scholar] [CrossRef]
  54. Alexander, R.B.; Smith, R.A.; Schwarz, G.E.; Boyer, E.W.; Nolan, J.V.; Brakebill, J.W. Differences in Phosphorus and Nitrogen Delivery to The Gulf of Mexico from the Mississippi River Basin. Environ. Sci. Technol. 2008, 42, 822–830. [Google Scholar] [CrossRef] [Green Version]
  55. Wang, X.; Lu, Y.; Han, J.; He, G.; Wang, T. Identification of Anthropogenic Influences on Water Quality of Rivers in Taihu Watershed. J. Environ. Sci. 2007, 19, 475–481. [Google Scholar] [CrossRef]
  56. Zhang, H.; Wang, Z.; Zhang, Y.; Ding, M.; Li, L. Identification of Traffic-Related Metals and the Effects of Different Environments on Their Enrichment in Roadside Soils along the Qinghai–Tibet Highway. Sci. Total Environ. 2015, 521–522, 160–172. [Google Scholar] [CrossRef] [PubMed]
Figure 1. (a) Specific location map of monitoring sections in Tibet, China; (b) Geographic location map; (c) Land use map of the study area.
Water 14 03664 g001
Figure 2. Heavy metal box diagram (a—spring; b—summer; c—autumn; d—winter).
Water 14 03664 g002
Figure 3. Spatial and temporal distribution of nutrient and heavy metal elements in Tibet, in 2021.
Water 14 03664 g003
Figure 4. Explanation of variance of principal components.
Water 14 03664 g004
Table 1. Basic information of monitoring sections.
BasinRiver Basin AbbreviationName of Section Monitoring PointAbbreviation of Section Monitoring Point
Yarlung Zangbo RiverYLZBJDongsaDS
ZedangZD
BianxiongBX
DajuDJ
NyalamNCH
PengquPKC
SagaSG
Xinjiefang BridgeBB
BomiBM
Lang County ZhongdaLX
Nianchu RiverLZ
MiruMR
CainaCN
DaziDZ
SemaiSM
Xiba XiaquXBXQRidangRD
GongjueJY
Langpo RiverLPHLangpo RiverLP
LuozhaquLZXQLinzhiZM
Peng QuPQPulanPQ
dingjieDJ
Gyirong RiverJLZBJiayuJL
Poqu RiverBQHPeikucuoNLM
Yadong RiverYDHYadongYD
Nujiang RiverNJBiruBR
NaquNQ
baxiuBX
JilongLL
Jinsha RiverJSJMangkangMK
Zaqu River RuyiZQ
Downstream of Loza xiongquGJ
JiangdaJD
Jiayu BridgeGTQ
Lantsang RiverLCJKaruoKR
Oron RiverAQ
QuzikaKM
Lohit RiverCYHChayuCY
Shiquan RiverSGZBGarGE
GejiGJ
Kongque RiverMJZBGangtuo bridge on Jinsha RiverPL
Xiangquan RiverLQZBTuolinTL
Table 2. Analysis method and quality control standard of monitoring indicators.
Monitoring ItemsAnalytical MethodsMethod SourceAccuracyPrecisionRecovery Rate of Spiking
DOElectrode methodGB/T 7489-1987-±0.3-
PVAcid processGB/T 11914-1989±5%±20%-
CODDichromate processHJ 505-2009±10%±10%-
NH3-NNessler’s reagent spectrophotometryHJ 535-2009±10%±15%80–120%
TPAmmonium molybdate spectrophotometryGB/T 11893-1989±10%±10%80–120%
TNAlkaline potassium persulfate digestion ultraviolet spectrophotometryHJ 636-2012±5%±10%90–110%
CuInductively coupled plasma mass spectrometryHJ 700-2014±10%±20%70–130%
ZnInductively coupled plasma mass spectrometryHJ 700-2014±10%±20%70–130%
AsInductively coupled plasma mass spectrometryHJ 700-2014±10%±10%80–120%
CdInductively coupled plasma mass spectrometryHJ 700-2014±10%±20%70–130%
CrDiphenylcarbazide spectrophotometryGB/T 7467-1987±5%±5%90–110%
PbInductively coupled plasma mass spectrometryHJ 700-2014±10%±20%70–130%
Table 3. Results of Kruskal–Wallis test.
SeasonGroup
Statistical Valuep-ValueCohen’s f ValueStatistical Valuep-ValueCohen’s f Value
DO27.1520.000 ***0.06314.0010.450.137
PV18.6580.000 ***0.05839.2240.000 ***0.193
COD42.3510.000 ***0.07812.4790.5680.091
NH3-N9.1960.027 **0.03415.8040.3250.122
TP55.820.000 ***0.07218.8530.1710.122
TN8.4590.037 **0.02137.5950.001 ***0.119
Cu31.2250.000 ***0.03135.3850.001 ***0.071
Zn22.8480.000 ***0.04421.1540.098 *0.108
As9.8030.020 **0.01354.0740.000 ***0.309
Cd56.3130.000 ***0.0687.220.9260.081
Cr34.2440.000 ***0.0759.9530.7660.096
Pb3.8820.2740.03132.4610.003 ***0.201
Note: Correlation coefficient between water quality indicators and physicochemical parameters of water was significant at: *** p < 0.01, ** p < 0.05, * p < 0.1.
Table 4. Results of weight calculation using the entropy method.
TermInformation Entropy, eInformation Utility Value, dWeight
PV0.9650.0350.036
COD0.9450.0550.056
NH3-N0.8810.1190.121
TP0.9920.0080.008
Pb0.950.050.051
As0.8330.1670.17
Cd0.9880.0120.013
Cr0.8340.1660.17
TN0.920.080.081
Cu0.8110.1890.193
Zn0.920.080.082
DO0.9810.0190.019
Table 5. Results of entropy method–fuzzy evaluation for water quality.
SectionIIIIIIIVVEvaluation ResultsExceedance Factor
ZD0.9140.0630.02300I-
YD0.9440.056000I-
TL0.9220.078000I-
SM0.9140.0740.01100I-
SG0.9050.0140.0770.0040ITN
RD0.9010.0900.00100I-
GTQ0.9360.064000I-
PQ0.9610.039000I-
PGC0.9820.018000I-
NLM0.8720.0470.0240.0570ITN
NQ0.8200.0830.01500I-
MR0.9190.0600.02100I-
QZK0.9230.077000I-
MK0.8590.141000I-
LZ0.9330.067000I-
JL0.9260.074000I-
NCH0.9750.025000I-
LPH0.9680.032000I-
LXZD0.9250.075000I-
KR0.9150.0740.01100I-
JYQ0.9130.00600.0600.021ITN
JD0.9880.012000I-
GJ0.9400.060000I-
JY0.9090.0910.00100I-
LZXQ0.9540.046000I-
GJ0.8110.0190.0610.1090IAs
GE0.9840.016000I-
DS0.9180.0670.01500I-
DJie0.9470.053000I-
PL0.9640.036000I-
DZ0.9130.0850.00200I-
DJu0.9040.0810.01500I-
AQH0.9250.075000I-
ZQH0.9340.066000I-
CY0.9800.020000I-
CN0.8470.1270.02600I-
BM0.9610.039000I-
NX0.9060.0790.01500I-
BR0.9100.0430.04800I-
XJF0.9650.035000I-
BQ0.9330.067000I-
Table 6. Correlation between water quality indicators and physicochemical parameters of water.
IndexDOPVCODNH3-NTPTNCuZnAsCdCrPb
WT−0.386 **−0.0690.051−0.1830.06−0.228 *0.023−0.404 **−0.225 *0.297 **0.066−0.226 *
Precipitation−0.441 **−0.0660.012−0.341 **−0.005−0.332 **0.011−0.312 **−0.1260.453 **0.005−0.22 *
pH0.234 *0.0870.060.282 **−0.0530.255 *−0.198 *0.115−0.063−0.332 **0.0180.129
Turbidity0.064−0.0510.411 **0.061−0.154−0.0620.0150.286 **0.0860.128−0.0960.177
Conductivity−0.0770.1270.0210.327 **−0.150.076−0.056−0.098−0.055−0.021−0.02−0.029
Note: Correlation coefficient between water quality indicators and physicochemical parameters of water was significant at: ** p < 0.01, * p < 0.05.
Table 7. Results of correlation analysis between water quality indicators.
IndexDOPVCODNH3-NTPTNCuZnAsCdCrPb
DO1
PV−0.21
COD−0.329 **0.275 **1
NH3-N−0.25 **0.459 **0.291 **1
TP−0.010.258 **0.28 **0.385 **1
TN−0.030.3 **0.0230.364 **0.217 **1
Cu0.0630.012−0.030−0.055−0.0300.0021
Zn−0.017−0.0230.047−0.035−0.189 *0.0630.367 **1
As−0.067−0.211 **−0.049−0.115 *0.025−0.179 *−0.0130.0681
Cd−0.0550.0460.077−0.0620.163 *−0.0610.422 **0.267 **0.0351
Cr−0.14 *0.42 **0.318 **0.443 **0.398 **0.25 **−0.107−0.25 **−0.174 *0.0741
Pb−0.149 *−0.0080.306 **−0.0510.067−0.0450.0350.230 **0.0430.072−0.0931
Note: Correlation coefficient between nutrient elements and heavy metal elements was significant at: ** p < 0.01, * p < 0.05.
Table 8. Results of PCA.
Factor Load Factor
PC1PC2PC3PC4
DO−0.244−0.1490.2310.493
PV0.6440.0170.3150.019
COD0.5940.329−0.151−0.205
NH3-N0.563−0.0520.484−0.277
TP0.6630.234−0.2170.221
TN0.135−0.1530.746−0.009
Cu−0.1530.5720.3690.41
Zn−0.3190.6560.371−0.145
As−0.2170.238−0.14−0.324
Cd0.130.539−0.2150.554
Cr0.787−0.113−0.1410.163
Pb0.0320.612−0.086−0.44
Characteristic root2.4121.7041.3811.233
Percentage variance0.2010.1420.1150.103
accumulate0.2010.3430.4580.561
Publisher’s Note: MDPI stays neutral with regard to jurisdictional claims in published maps and institutional affiliations.

